Article

Biomass Combustion Modeling Using OpenFOAM: Development of a Simple Computational Model and Study of the Combustion Performance of Lippia origanoides Bagasse

by
Gabriel Fernando García Sánchez
1,*,
Jorge Luis Chacón Velasco
1,
David Alfredo Fuentes Díaz
1,
Yesid Javier Rueda-Ordóñez
1,
David Patiño
2,
Juan Jesús Rico
2 and
Jairo René Martínez Morales
3
1
Research Group on Energy and Environment (GIEMA), School of Mechanical Engineering, Universidad Industrial de Santander, Carrera 27 Calle 9, Bucaramanga 680002, Colombia
2
CINTECX, University of Vigo, Lagoas-Marcosende s/n, 36310 Vigo, Spain
3
National Center for Agroindustrialization of Aromatic and Medicinal Tropical Vegetal Species (CENIVAM), School of Chemistry, Universidad Industrial de Santander, Carrera 27 Calle 9, Bucaramanga 680002, Colombia
*
Author to whom correspondence should be addressed.
Energies 2023, 16(6), 2932; https://doi.org/10.3390/en16062932
Submission received: 28 February 2023 / Revised: 10 March 2023 / Accepted: 14 March 2023 / Published: 22 March 2023
(This article belongs to the Section A4: Bio-Energy)

Abstract

:
Combustion is the most commonly used technology to produce energy from biomass; nevertheless, there are still thermal efficiency problems in current biomass combustion furnaces and a lack of knowledge about the properties of residual biomasses that could be used as fuels. Aiming to contribute to knowledge of the potential of residual biomass for energy generation, this work reports on the implementation of a 2D computational model to study the combustion performance of several solid biomass fuels, and its application in the analysis of Lippia origanoides bagasse combustion. The model uses an Eulerian–Lagrangian approach; in the continuous phase, governing equations are solved, and in the dispersed phase, particles are tracked and the mass, momentum, species and energy transfer between the phases are calculated. The model was validated against experimental data from a combustor fueled by three biomasses: wood pellets, olive stone and almond shell. The results show deviations of less than 13%, with few exceptions, which indicates a good degree of agreement with experimental measurements compared with those reported by other studies on the subject. Furthermore, it was found that the stems of Lippia origanoides bagasse show similar performance to that of other biomass used as solid fuel, while the leaves present lower performance.

Graphical Abstract

1. Introduction

Nowadays, the world is experiencing an energy transition motivated by concerns about the harmful effects of fossil fuels, and aligned with Sustainable Development Goals 7, 11, 12 and 13 of the United Nations. Bioenergy is a renewable energy source with great potential worldwide [1], and is one of the main options to mitigate greenhouse gas emissions [2,3]. It is an issue of great importance for Colombia [4], where approximately 178 million tons of biomass are produced annually from livestock activities (59%), agricultural crops (41%) and the residential sector (<1%) [5]. These residues are usually reintegrated into crops in a nontechnical way or, in the best case, they are used for compost production [4]. Combustion is the most widely employed method of producing heat and electrical energy from biomass [6,7]; although it is a very old process, there are still challenges associated with the efficiency of furnaces [8,9,10] and knowledge of the fuel properties of residual biomasses [11]. Lippia origanoides bagasse, from the essential oil extraction process, is an example of residual biomass whose combustion performance has not previously been investigated. Lippia origanoides is an endemic plant of some countries of central and south America, such as Colombia, whose essential oil has significant antioxidant, antimicrobial, antiviral and repellent properties [12,13].
Computational fluid dynamics (CFD) models are useful for investigating and optimizing the process more cheaply, safely and rapidly than experimental studies. As a result, different models have been developed to study the combustion in biomass furnaces, as presented in the work of Rajh et al. [14] in 2022; there, they compared the behavior of two types of models: a detailed 3D porous zone model and a simple 1D empirical model. They observed that both models have a similar overall behavior in full-load tests but not in the half-load tests, where the 1D model reduces accuracy. The 3D model was developed by Gómez et al. [15] in 2019 to study the influence of exhaust gas recirculation (EGR) on the performance and emissions of a boiler; they found that EGR can increase the boiler thermal performance and reduce the NOx emissions for low O2 excess values. Those models studied the combustion of wood pellets. As examples of analyses with other biomasses, we can mention the works of Karim and Naser published in 2018 [2,16], which report the modeling of two combustion systems: a small fixed bed combustor and an industrial moving grate boiler; they used them to study the combustion of the systems fueled by different kinds of lignocellulosic biomasses. A complete review of the subject is given in the works of Dernbecher et al. [11], Karim and Naser [17], Khodaei et al. [8], Bhuiyan et al. [6] and García et al. [18,19]. However, it is still a field in development due to its complexity; several submodels and high computational resources are required for simulations [11,17,20,21,22,23]. OpenFOAM is an advanced and robust open-source CFD package with rising adoption in industry and academia due to its advantages, such as a continuously growing set of features and the absence of license costs [24]. Nowadays, there are relatively few works about solid combustion modeling developed in OpenFOAM, although there has been a growing interest in the subject in recent years [19]. This work reports on the development of a bidimensional CFD model to study the combustion performance of several solid biomass fuels and its application in the analysis of Lippia origanoides bagasse combustion. The model was implemented in OpenFOAM and validated against experimental data of ignition front propagation velocity and the maximum temperature taken from a combustor tube fueled by three biomasses: wood pellets, olive stone and almond shell. The experimental data were taken from the work of Patiño [25]. The model uses an Eulerian–Lagrangian approach to simulate freeboard (continuous phase) and fuel bed (dispersed phase) behavior. In the continuous phase, governing equations are solved, and in the disperse phase, particles are tracked and the mass, momentum, species and energy transfer between those particles and the continuous phase are calculated. It employs the k-epsilon, P1 and partially stirred reactor (PaSR) submodels for turbulence, radiation and gas combustion, respectively. The novelty of this research lies in the development of a simple computational model to simulate solid combustion using OpenFOAM, and in the analysis of the combustion performance of a kind of residual biomass that had not been previously considered as a fuel.

2. Materials and Methods

2.1. Fuel Properties

The properties of the fuels analyzed in this work are presented in Table 1; there, LHV is the lower heating value, ρp is the real density of the particles and ρa is the bulk density of the biomass bed. The properties of the first three fuels which were used for validation were taken from the work of Patiño [25]. The elemental and proximate analyses and the densities of Lippia origanoides bagasse (LO) were determined experimentally in the laboratories of the Industrial University of Santander in Bucaramanga, Colombia, while the lower heating value was determined by Equation (2) [26]:
L H V = 1 X M 100 H H V 9 X H 100 2440 X M 100 2440
where XM is the percentage by mass of moisture, XH is the percentage by mass of hydrogen and HHV is the higher heating value calculated from the proximate composition by Sheng and Azevedo’s [27] Equation (2).
HHV = −3.0368 + 0.2218(VM) + 0.2601(FC)
where FC and VM are the weight percent fixed carbon and volatile matter from the proximate analysis. Three types of samples of LO were analyzed: leaves (L), stems (S), and a mixture of leaves and stems in proportion 47:53 (M). The samples were collected from the facilities of the National Center for Agroindustrialization of Aromatic and Medicinal Tropical Vegetal Species (CENIVAM); coordinates: 7°08′ 24.8 (N latitude), 73°06′ 58.1 (W longitude), and 980 m above sea level. In Table 1, the properties of each one of these samples are presented; as can be seen, the three samples have similar amounts of moisture and volatiles, but the L sample has a higher amount of ash than the S sample, while M is somewhere in between. It is recommended that the ash content be less than 10% [28]; the L samples have a slightly lower content (9.35%), which indicates that their use as a fuel could cause maintenance problems in the combustor due to slag deposits resulting from the fusion of these residues. The S sample also presents higher LHV and density values, indicating a greater energy liberation in the process that can contribute to better performance.

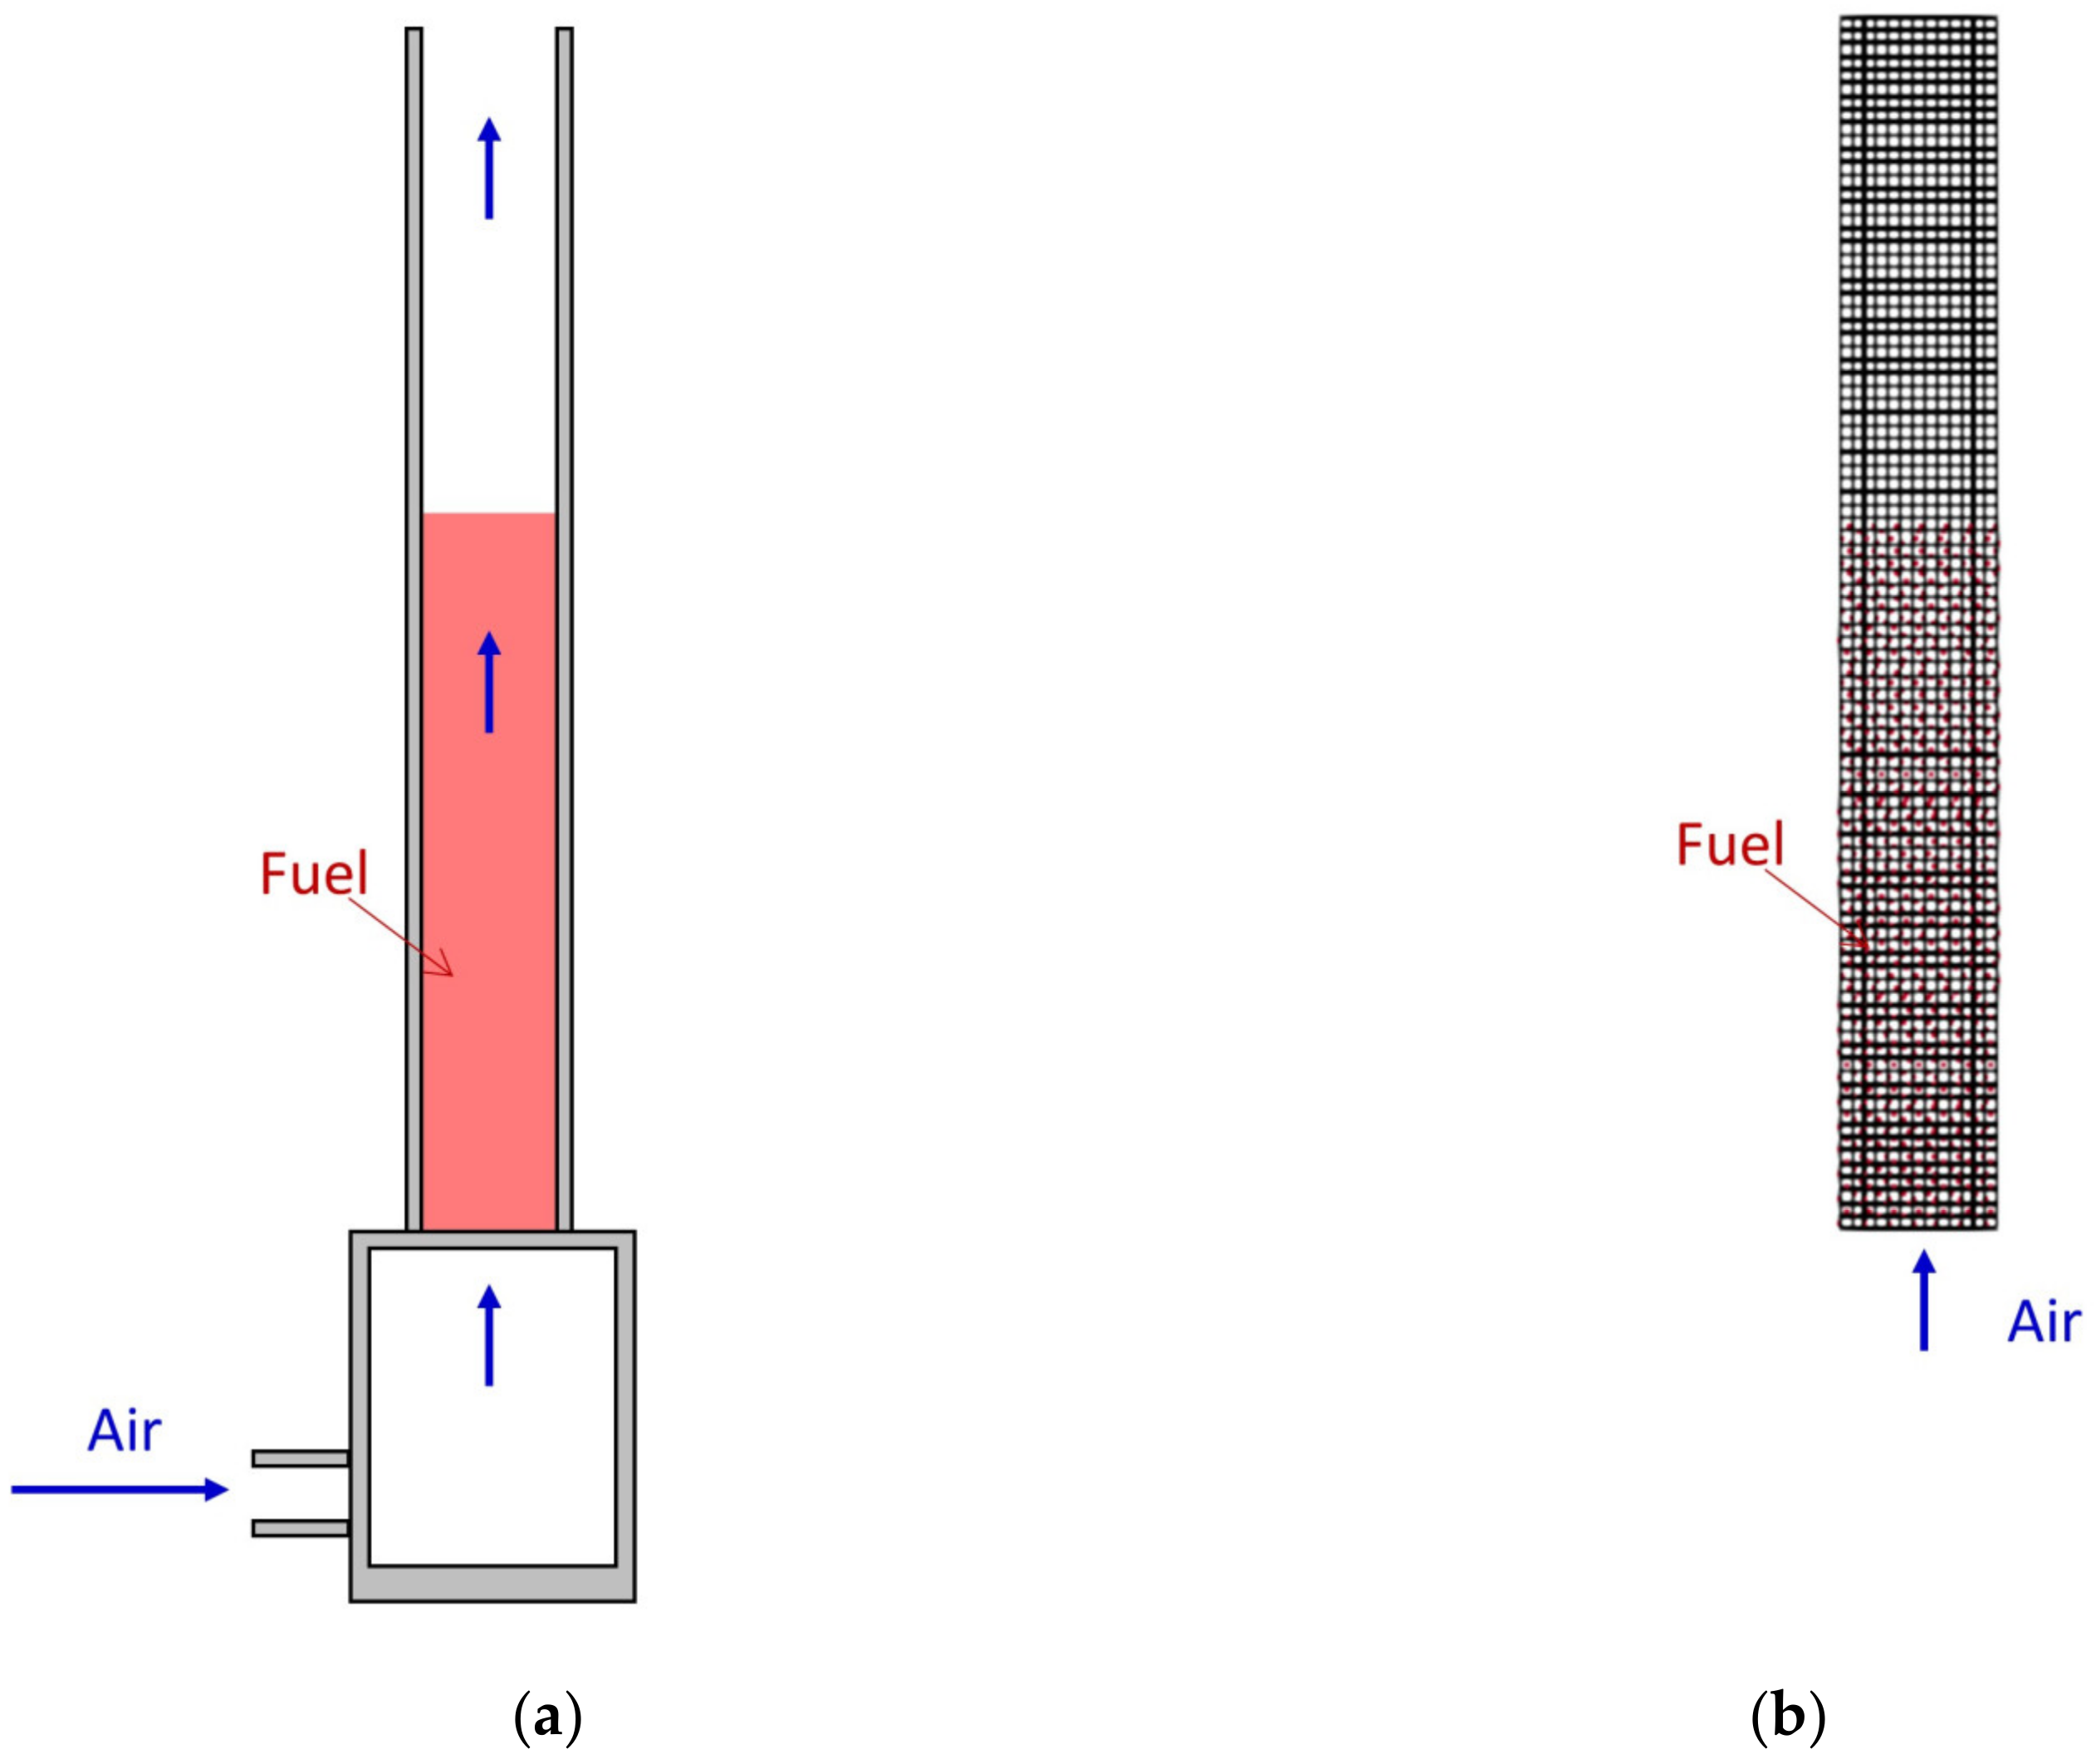
2.2. Experimental Setup and Computational Domain

The experimental data were taken in a noninsulated cylindrical combustor developed at the University of Vigo. It is an installation designed to measure the ignition front velocity, the supplied airflow and the temperatures reached by the biomass during the solid biomass combustion process. The combustor has an internal diameter of 0.13 m and a length of 1.050 m where 1 m is the length from the grate. The temperature was measured by employing type K thermocouples radially placed every 50 mm in the tube. A detailed description of the system can be found in the work of Patiño [25].
The computational domain is a bidimensional representation of the combustion chamber of the combustor. The mesh was generated with the tool blockMesh, included in the OpenFOAM package. Figure 1 presents a scheme of the experimental system and its bidimensional representation for simulations.

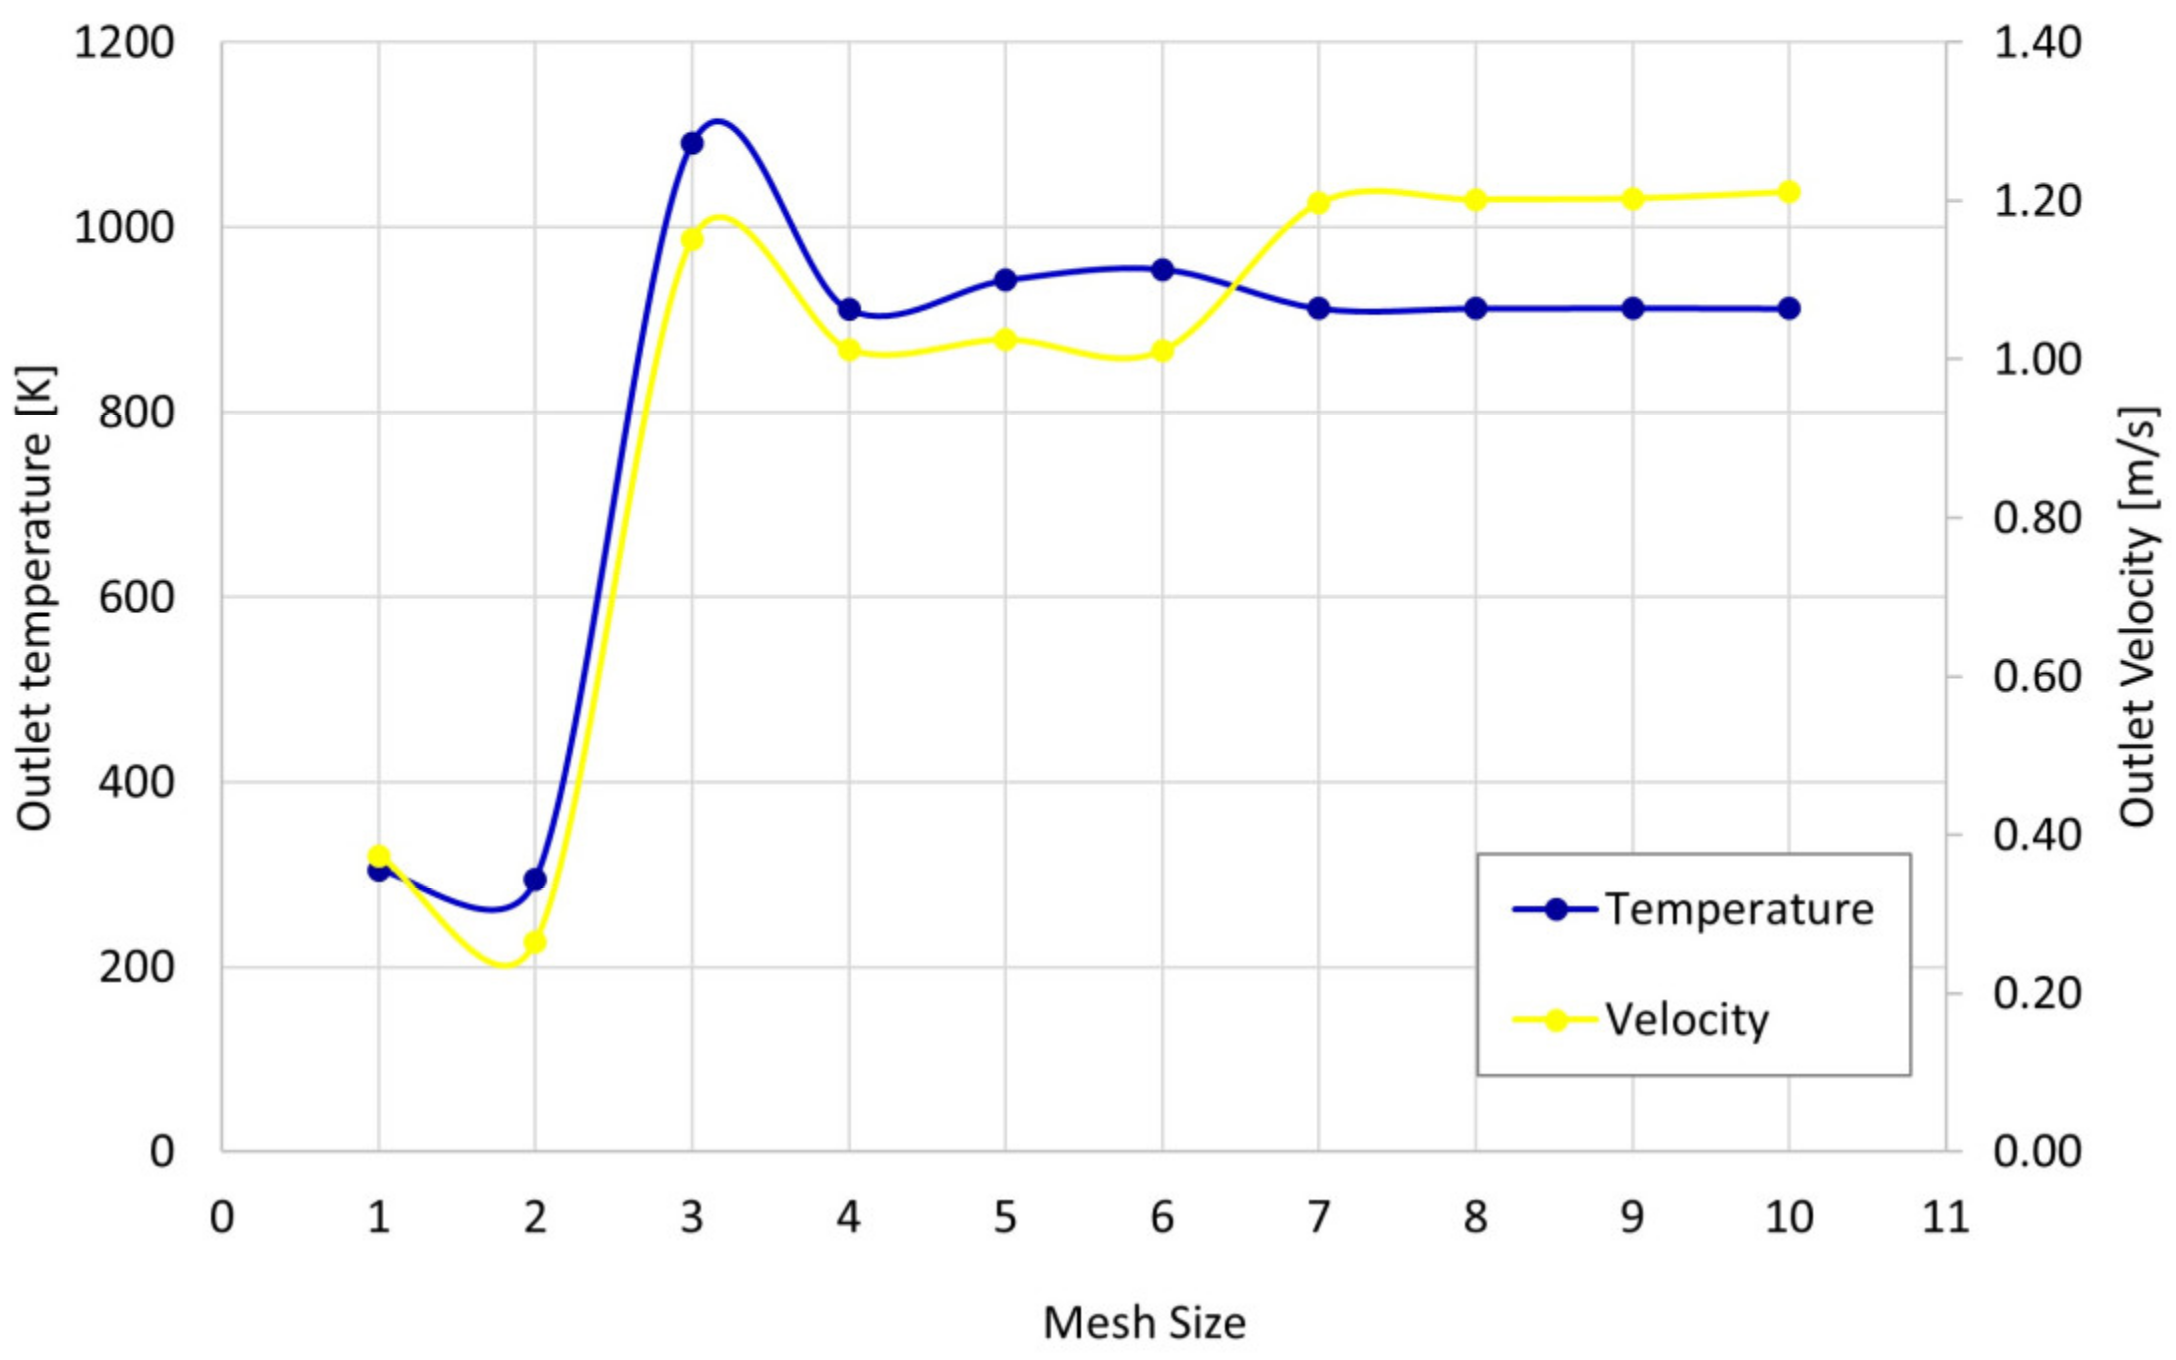
2.3. Mesh Independence Analysis

To ensure mesh independence, different mesh sizes were tested (from 112 to 1989 cells), increasing the number of cells by 15% until there was no significant change in outlet velocity and temperature. Figure 2 shows the values of those magnitudes for the different mesh sizes tested. As can be seen, from mesh number 7 the outlet values do not change significantly; therefore, that mesh was used for simulations. The selected mesh consisted of 948 cells.

2.4. Model Description

This model employs an Eulerian–Lagrangian approach for continuous and dispersed phases, i.e., gas and particles. In the continuous phase, transport equations are solved, and in the disperse phase, particles are tracked and the energy, mass, momentum and species transfer between those particles and the continuous phase are calculated. The equation system and the submodels were solved in OpenFOAM with the solver coalChemistryFoam.
For the continuous phase, the transport equations of mass (Equation (3)), energy (Equation (4)), momentum (Equation (5)) and species (Equation (6)) are shown below:
ρ g t + · ρ g U g = S m
ρ g h t + ρ g K t + · ρ g U g h + · ρ g U g K · α e f f ( h = p + ρ g U g · g + S h
ρ g U g t + · ρ g U g U g · τ g · ρ g R g = p + ρ g g + S U
ρ g Y i t + · ρ g U g Y i · D e f f ( ρ g Y i = S y
where h is the enthalpy, K is the kinetic energy, S is the source term, Yi is the mass fraction of the species, Rg is the Reynolds stress term and αeff and Deff are the effective thermal and mass diffusivities. The source terms can come from the combustion model (c), the Lagrangian particles (p) or the radiation model (r). The ones that come from the interaction with particles may be further decomposed according to the process they represent: drying (ev), devolatilization (dv), heat transfer by convection (cv) or the reaction to the particle drag force (dr). Therefore, the source terms may be decomposed as [29]:
S m = S p , m = S p , m d v + S p , m e v
S u = S p , u = S p , u d v + S p , u e v + S p , u d r
S y = S p , y + S c , y = S p , y d v + S p , y e v + S c , y
S h = S p , h + S c , h + S r , h = S p , h d v + S p , h e v + S p , h c v + S c , h + S r , h
The source terms of Equations (3) and (5) come from the interaction with particles in the bed. The former is during the drying and devolatilization stages (Equation (7)) and the latter is during the whole process (Equation (8)). The source term of Equation (6) comes from the interaction with particles, during drying and devolatilization, and the combustion model (Equation (9)). In addition, the source term of Equation (4) comes from the models of combustion, radiation and the interaction with particles during the three stages of the process (Equation (10)).
Tracking many particles becomes too computationally costly; therefore, a representation of multiple physical particles, named parcels, was used. The fuel bed is assumed to be constituted by thermally thin spherical-equivalent parcels and the walls are set as isothermal at ambient temperature. The equations for parcel velocity (Up), mass (mp) and temperature (Tp) (Equations (11)–(13)) were solved and used to update their properties before each continuous phase time step.
m p · d U p d t = F d r + F g r a v
d m p d t = m ˙ p d v + m ˙ p e v
m p c p , p d T p d t = h ˙ p d v + h ˙ p e v + h ˙ p r + h ˙ p c v
The velocity equation (Equation (11)) comes from Newton’s second law; the parcels are subjected to the drag and gravity forces, Fdr and Fgrav. The parcel’s mass variation (Equation (12)) is expressed as the sum of the variation during evaporation devolatilization, which comes from the respective drying and pyrolysis models. The temperature equation (Equation (13)) comes from the balance of energy; the rate of change in energy in the parcel is equal to the sum of the rate of change in specific enthalpy due to evaporation, devolatilization, radiation and convection.

2.5. Submodels

2.5.1. Drying

Solid combustion can be divided into three stages: drying, devolatilization and char combustion. The importance of the former lies in the influence of moisture on the furnace behavior, pollutant emissions, and combustion temperatures [8]; the equilibrium approach [30] was employed to model the evaporation rate of moisture. The enthalpy of vaporization ( h v a p e v ) does not influence the gas phase directly and is entirely consumed by the particle; therefore, the rate of change in specific enthalpy due to evaporation is expressed by:
h ˙ p e v = d h v a p e v d t
The source term due to drying in Equation 10 is given by the sum of the energy released from the i particles to the gas during the process:
S p , h e v = i d m H 2 o e v h s , H 2 o d t
Here, m H 2 o e v is the mass transferred and h s , H 2 o is the sensible specific enthalpy of water vapor.

2.5.2. Devolatilization

In this stage, the solid fuel is decomposed into volatile gases, tar and carbonaceous components; the volatiles and tar that come out during this stage represent 70% of the mass of the fuel [20]. This process influences the composition and yields of the fraction of volatiles, as well as the reactivity, and char yield, which affects the combustion performance [11]. The one-component single reaction model was employed to simulate this combustion stage; therefore, the Arrhenius equation was used to model the devolatilization mass loss:
d m j d t = k · m j
k = A e E R T p
where mj is the mass of the jth volatile component in biomass, E is the activation energy, A is the pre-exponential factor, R is the universal gas constant and Tp is the parcel temperature. The volatile production rate was used to determine the source terms related to devolatilization in Equations (7)–(10) ( S p , m d v , S p , h d v , S p , u d v and S p , y d v ).

2.5.3. Heat Transfer

Radiation was modeled using the P-1 model, which is the simplest case of the general P-N model. It has given good results in combustion simulations [31] with relatively low computational costs [11]. The radiation transfer equation (RTE) is simplified to an elliptic partial differential equation in this model, which relies on solving for the irradiation (G) [29]:
· 1 3 a + σ e f G a G = 4 a g s σ T 4 4 E p
where a is the overall absorption coefficient, which is equal to the sum of the absorption coefficients of the gas (g), soot (s) and particles (p) ( a = a g s + a p = a g + a s + a p ); Ep is the emission contribution of the particles; σ is the Stefan–Boltzmann coefficient and T is the gas temperature. The source term in the gas phase energy equation can be expressed as:
S r , h = a g s G 4 a g s σ T 4
The particle radiation enthalpy source in Equation (13) can be determined from Equation (20):
h ˙ p r = A s a p G p 4 σ T p 4
Gp is the incident radiation at the particle position and As is the particle surface area. Convection was taken into account, employing the Ranz–Marshall correlation [32,33], with which the particle Nusselt number (Nup) was calculated, and the rate of change in specific enthalpy due to convection ( h ˙ p c v ) and the source term due to convection in the energy equation ( S p , h c v ) were determined:
N u p = 2.0 + 0.6 R e s 1 / 2 P r s 1 / 3
h = k N u p D p
h ˙ p c v = h T T p A s
S p , h c v = i h ˙ p , i c v V c
where Res and Prs are the surface Reynolds and Prandlt numbers, h is the convective heat transfer coefficient, k is the particle thermal conductivity and Vc is the volume of a cell with i particles inside it.

2.5.4. Combustion

As in most works of this kind, turbulence was modeled by the k-ε turbulence model while the turbulence–chemistry interaction in the combustion process was modeled using the partially stirred reactor (PaSR) model. The latter is a model based on the eddy dissipation concept model, which assumes that the computational cells are divided into two zones, a nonreacting zone and a reacting zone, and is chemically treated as a perfectly stirred reactor. The process can be divided into two stages. In the first stage, the concentration changes from an initial value c0 to a value c due to chemical reactions; in the second stage, the reactive mixture c is mixed with the unreactive one c0 due to the turbulence during a mixing time τmix, resulting in the averaged concentration c1. The reaction rate fm is defined as [34]:
f m ( c ) = c 1 c 0 τ = κ f m ( c 1 )
where τ is the residence time in the reactive structure, and κ is a dimensionless parameter defined by:
κ = τ c τ c + τ m i x
where τc is the chemical time and τmix is obtained from the k-ε model:
τ m i x = C m i x k ε
Cmix varies between 0.001 and 0.3 depending on the flow. In this work, it was taken as 0.03, as in other similar studies [35].

2.5.5. Reaction Mechanism
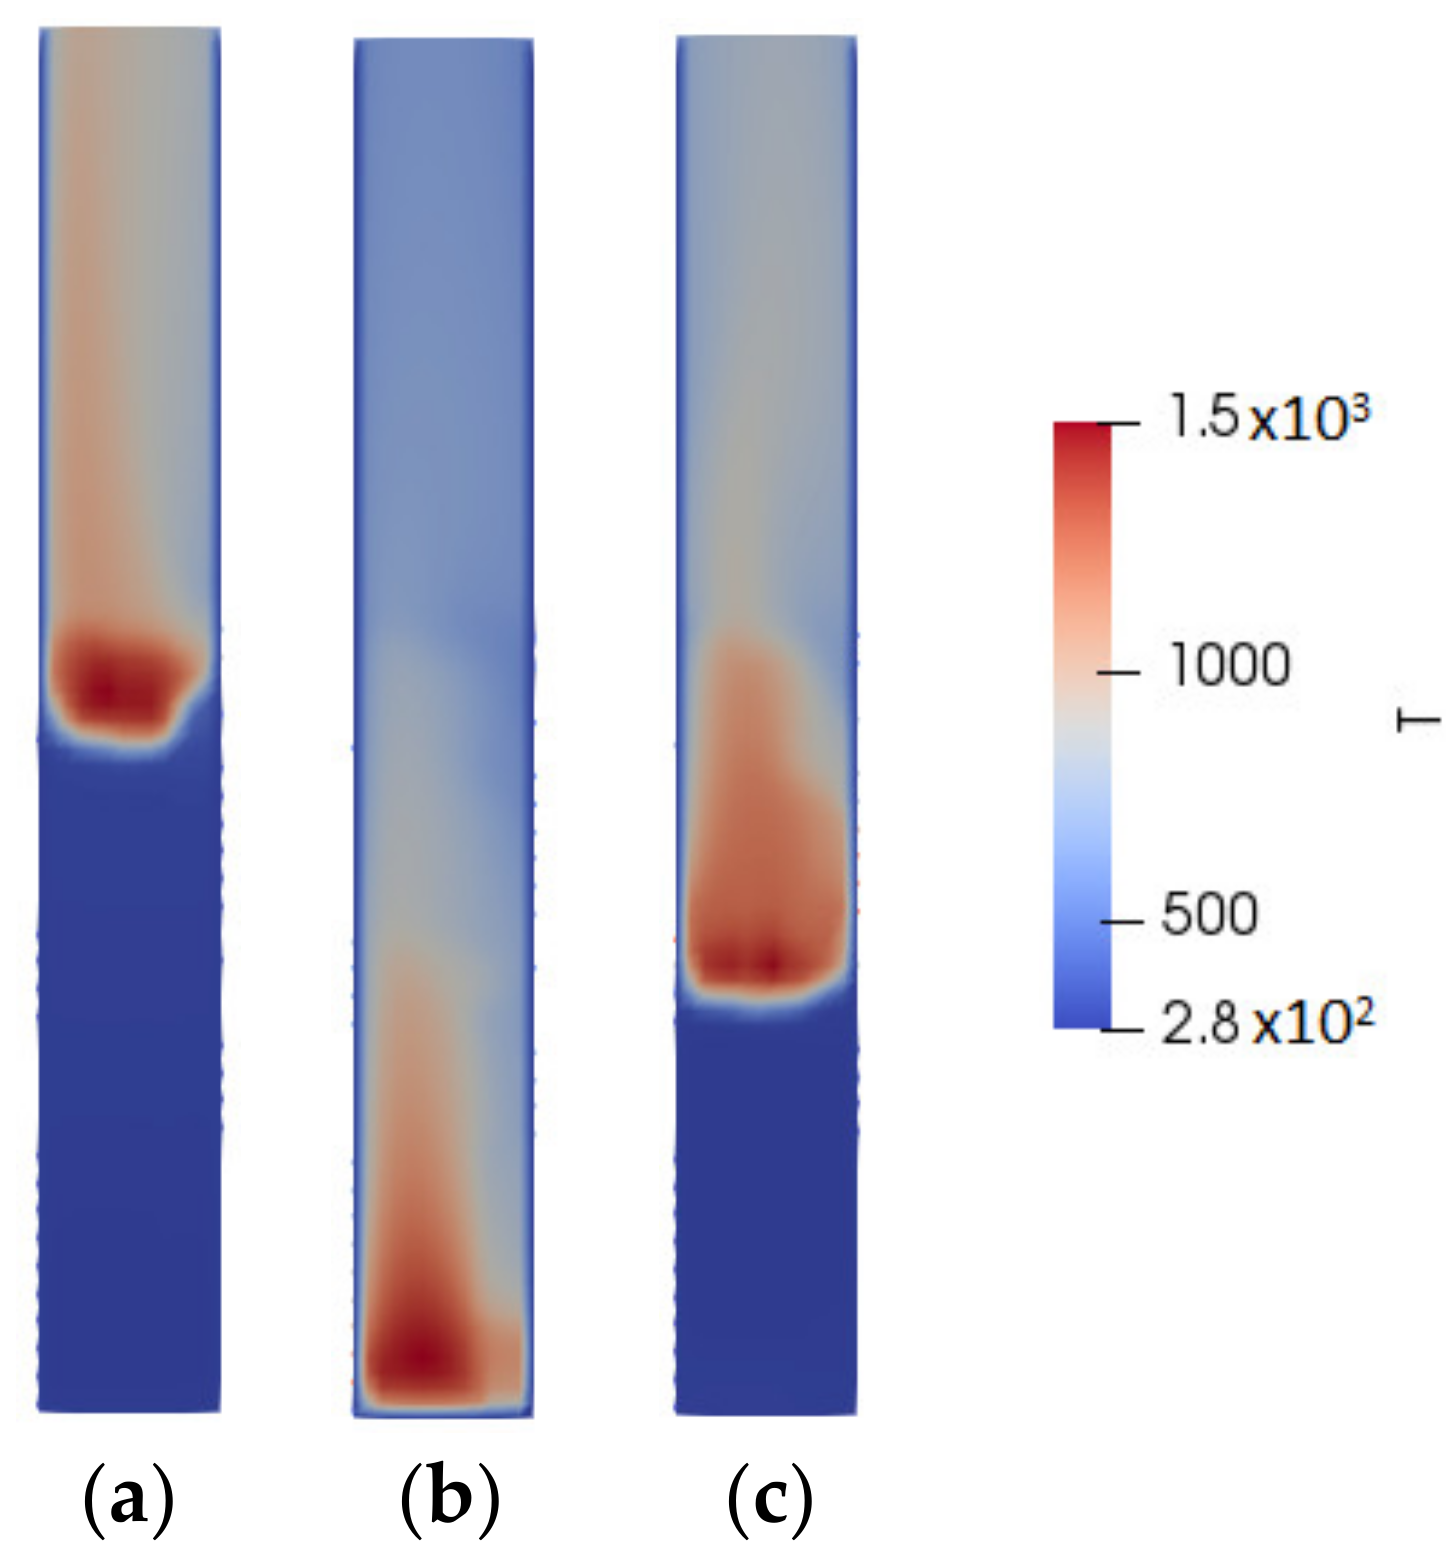
In this study, the reaction mechanism proposed by Gómez et al. [22] was considered for homogeneous gas-phase reactions. It consists of the reactions summarized in Table 2.

3. Results

For validation, wp, as and os combustion processes were simulated with air mass flow rates of 0.1, 0.2, 0.3, 0.4 and 0.45 kg.m−2s−1. As an example, Figure 3 shows the temperature profiles of wp combustion at 1000, 3500 and 7000 s, and an airflow rate of 0.2 kg.m−2s−1. The results of the ignition front velocities and maximum temperatures were compared with experimental data from the combustor fueled by the same fuels, which are presented in Figure 4 and Table 3. Table 3 shows the relative error between the calculated and experimental data (%E =|Experimental Value − Calculated Value|⁄Experimental Value).
The ignition front velocity curves show the three regimes in which the combustion process can be carried out according to the inlet airflow rate: oxygen-limited, reaction-limited and cooling by convection. At low airflow rates, the reaction is incomplete and the process is limited by the amount of oxygen available, observing lower temperatures and an almost linear relationship between air mass flow and burned mass flow. As the air increases, it also increases the cooling, making the ignition front’s speed reach a maximum; the process enters a phase in which it is almost independent of the airflow, called the reaction-limited zone. Finally, with an even greater mass flow, convective cooling becomes more important, slowing down the flame propagation until the reaction no longer occurs.
Once the model was validated, it was used to simulate the combustion of Lippia origanoides bagasse. Figure 5 shows the curves of ignition front velocity and maximum temperature at different airflow rates for stem samples (S), leaves (L) and mixture (M) samples. These curves also show the three combustion regimes according to combustion air: oxygen-limited, reaction-limited and cooling by convection.

4. Discussion

The validation tests show that the simulated ignition front velocity values follow the trend of the experimental results; however, there are some differences with the experimental results and an overestimation of the maximum bed temperatures. These deviations are mainly due to model simplifications, such as the thermally thin assumption, considering the walls as isothermal or approximating the shape of the particles to spheres. When using the thermally thin approach, the particles’ temperature gradients are neglected, affecting the surface temperature and causing a less pronounced cooling effect [16,22]. That effect can be observed mainly in the almond shell, which, having larger particles, moves farther away from the behavior of thermally thin particles. On the other hand, the combustor walls are subjected to convection and radiation with the surroundings; making assumptions at the surrounding temperature can cause an overestimation of heat losses. Finally, assuming that the fuel particles are spherical causes a variation in the heat transfer area, which affects the transfer by radiation and convection within the combustor. In addition to the above, it must be considered that the thermocouples used for experimental tests perform temperature measurements at a given point. Meanwhile, through simulation, average values are obtained in the plane where the thermocouple is located; this can also cause a disparity between the theoretical and experimental values. The use of the simplifications mentioned is justified by the lower complexity of the model, which is one of the challenges of simulating this type of system. The developed model accurately predicts the behavior of solid fixed-bed combustion under different conditions and with different types of biomasses, and can be used to study the performance of several solid fuels practically or be the basis for new works that improve its submodels to achieve greater accuracy. As observed in Table 3, the simulation results present relative error values lower than 13% in most cases and some higher values in the most extreme conditions; these are within the range obtained in the literature, as can be seen in works of Karim and Naser [16], Gómez et al. [22], Karim and Naser [2] and Collazo et al. [36].
The simulation of the LO samples’ combustion showed that the airflow with which combustion starts in the L and M biomasses is lower than in the S biomass. This is due to the lower density of the L and M samples, which means a lower mass of fuel in the chamber and, therefore, a higher air–fuel ratio at the same operating conditions. Fuels S, L and M have stoichiometric air–fuel ratios of 5.18, 4.42 and 4.82, respectively (obtained from stoichiometric balances); the last two biomasses reach these ratios at lower airflow values. The ignition front velocity is an indicator of combustion performance in fixed-bed furnaces [8]. As can be seen, it is higher for fuel S; therefore, only the combustion performance of that biomass can be equated with that of the biomasses as, os and wp, as presented above. This is related to the higher energetic density of fuel S, compared to fuels L and M, evidenced in higher heating values and densities. On the other hand, it is observed that the maximum temperature of the samples of Lippia origanoides bagasse is in the same range as that of the biomasses used for the validation. This temperature increases when the airflow increases, since greater amounts of combustion air can mean a more complete combustion.

5. Conclusions

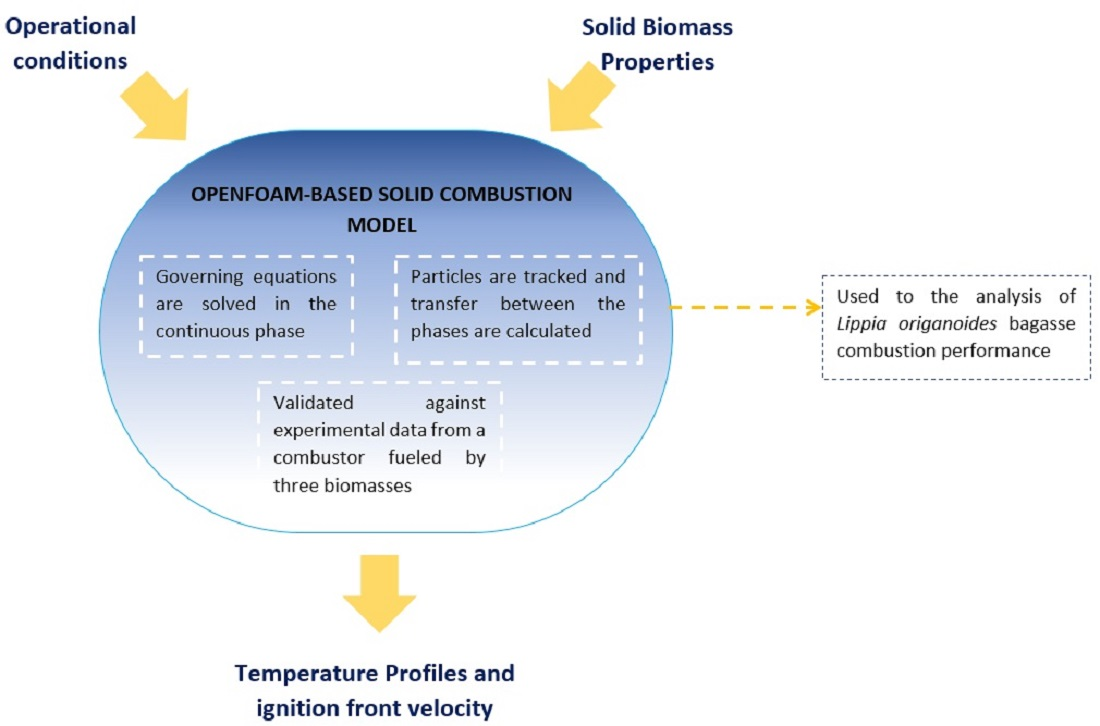
  • This paper presents a two-dimensional model of solid biomass combustion. The model is useful for studying the performance of a combustion system fueled by different kinds of biomass and under different airflow rates. Unlike other similar studies, this is an efficient numerical model implemented in OpenFOAM, which is a popular computational tool rarely used in this type of application.
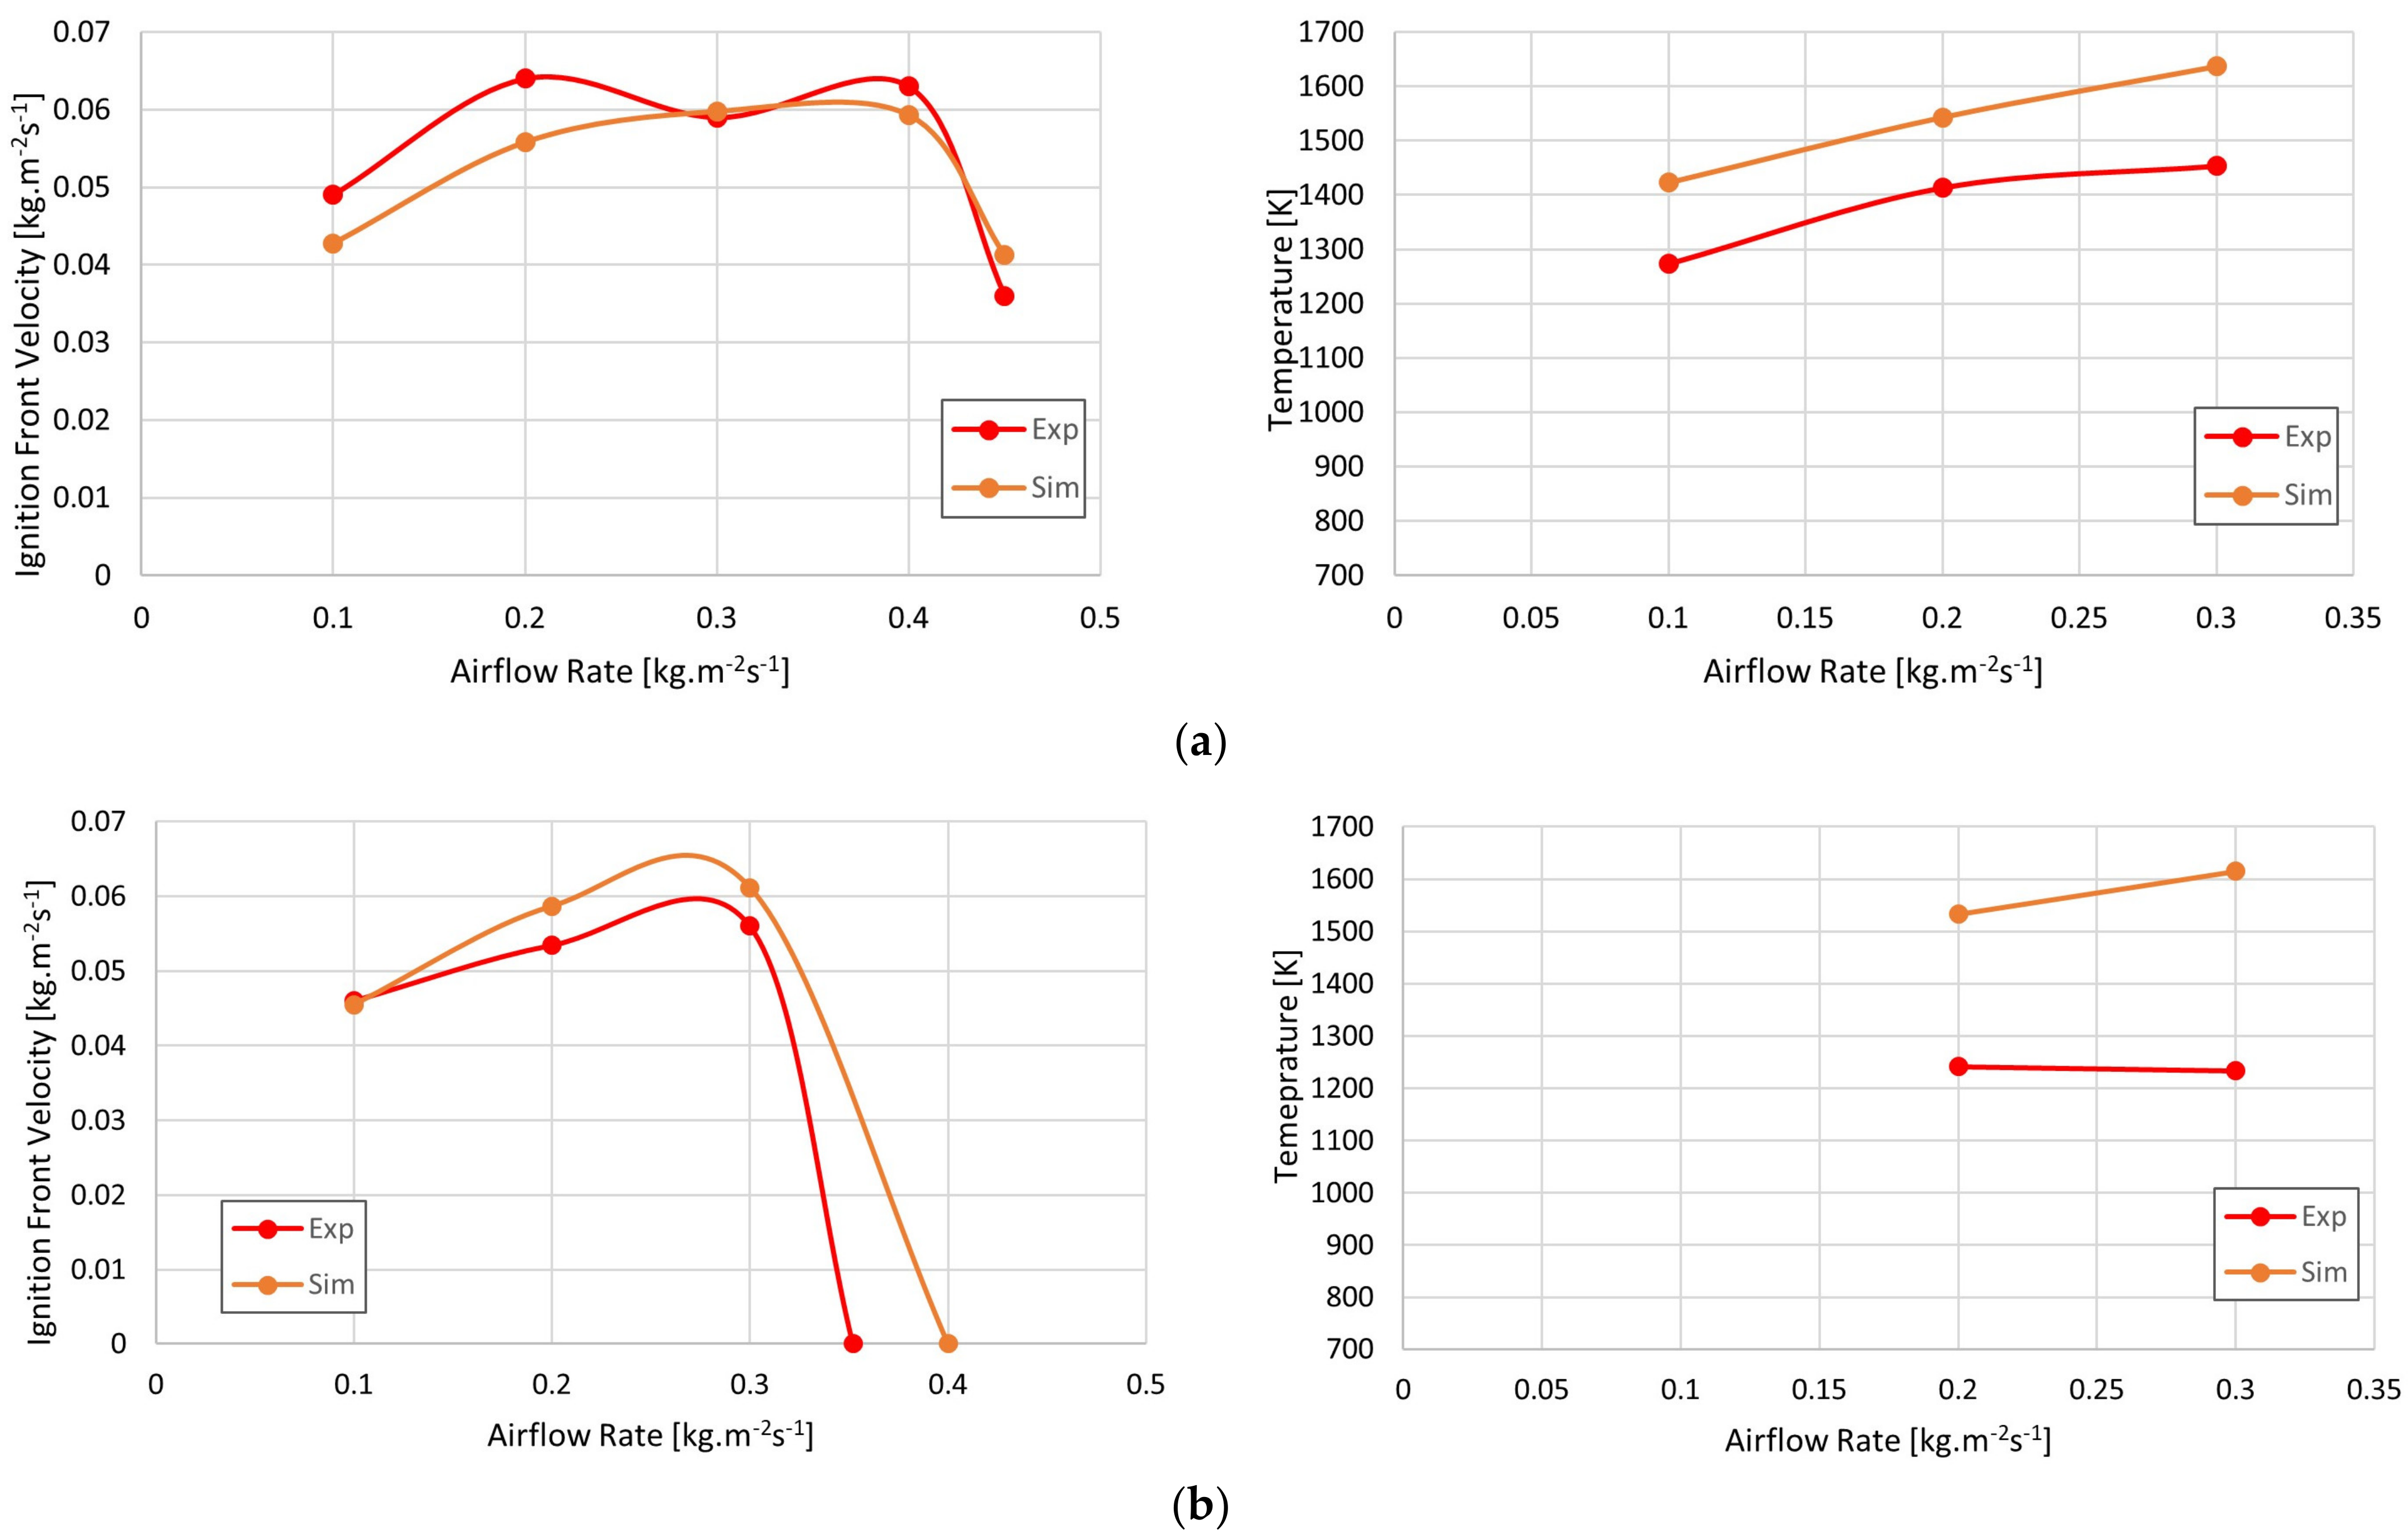
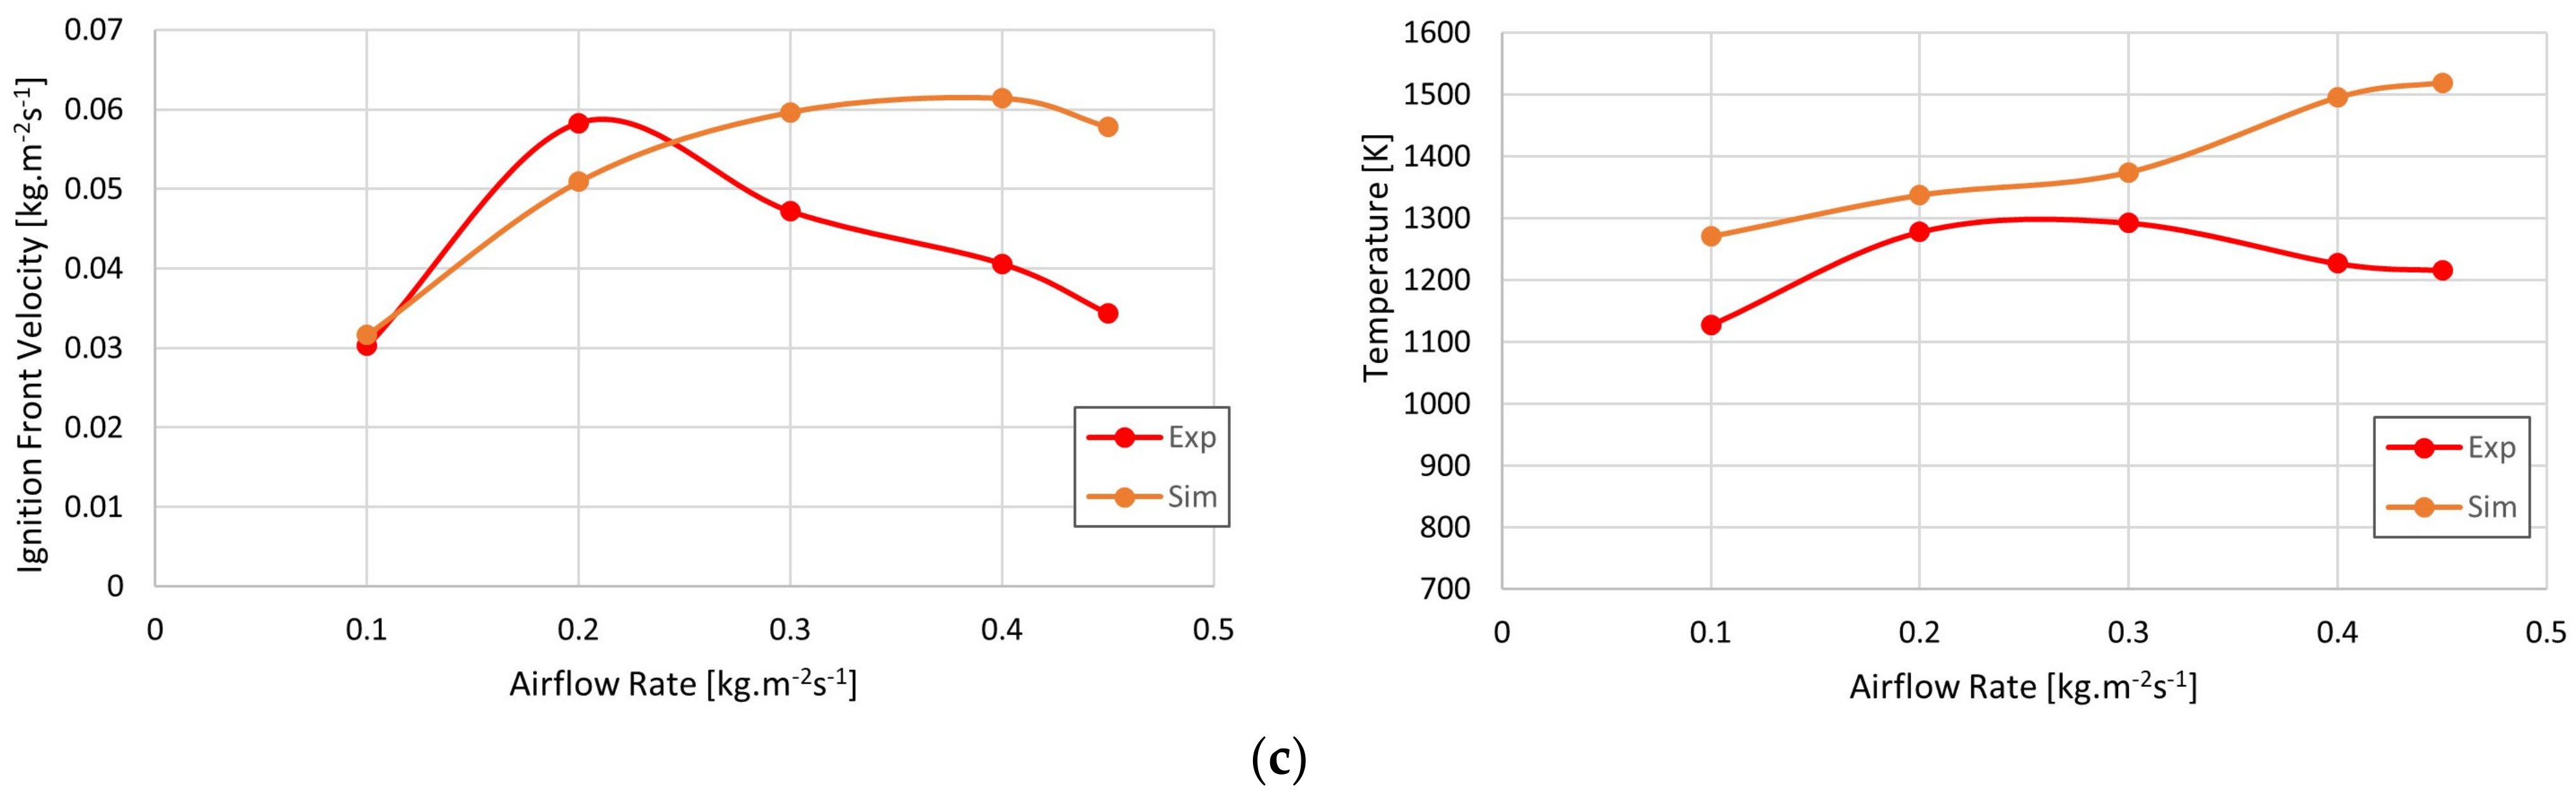
  • The model was validated by comparing its results with those obtained in a cylindrical combustor fueled with three types of biomass, with relative error values lower than 13% in most cases, which is similar to the errors obtained in recent studies on this subject.
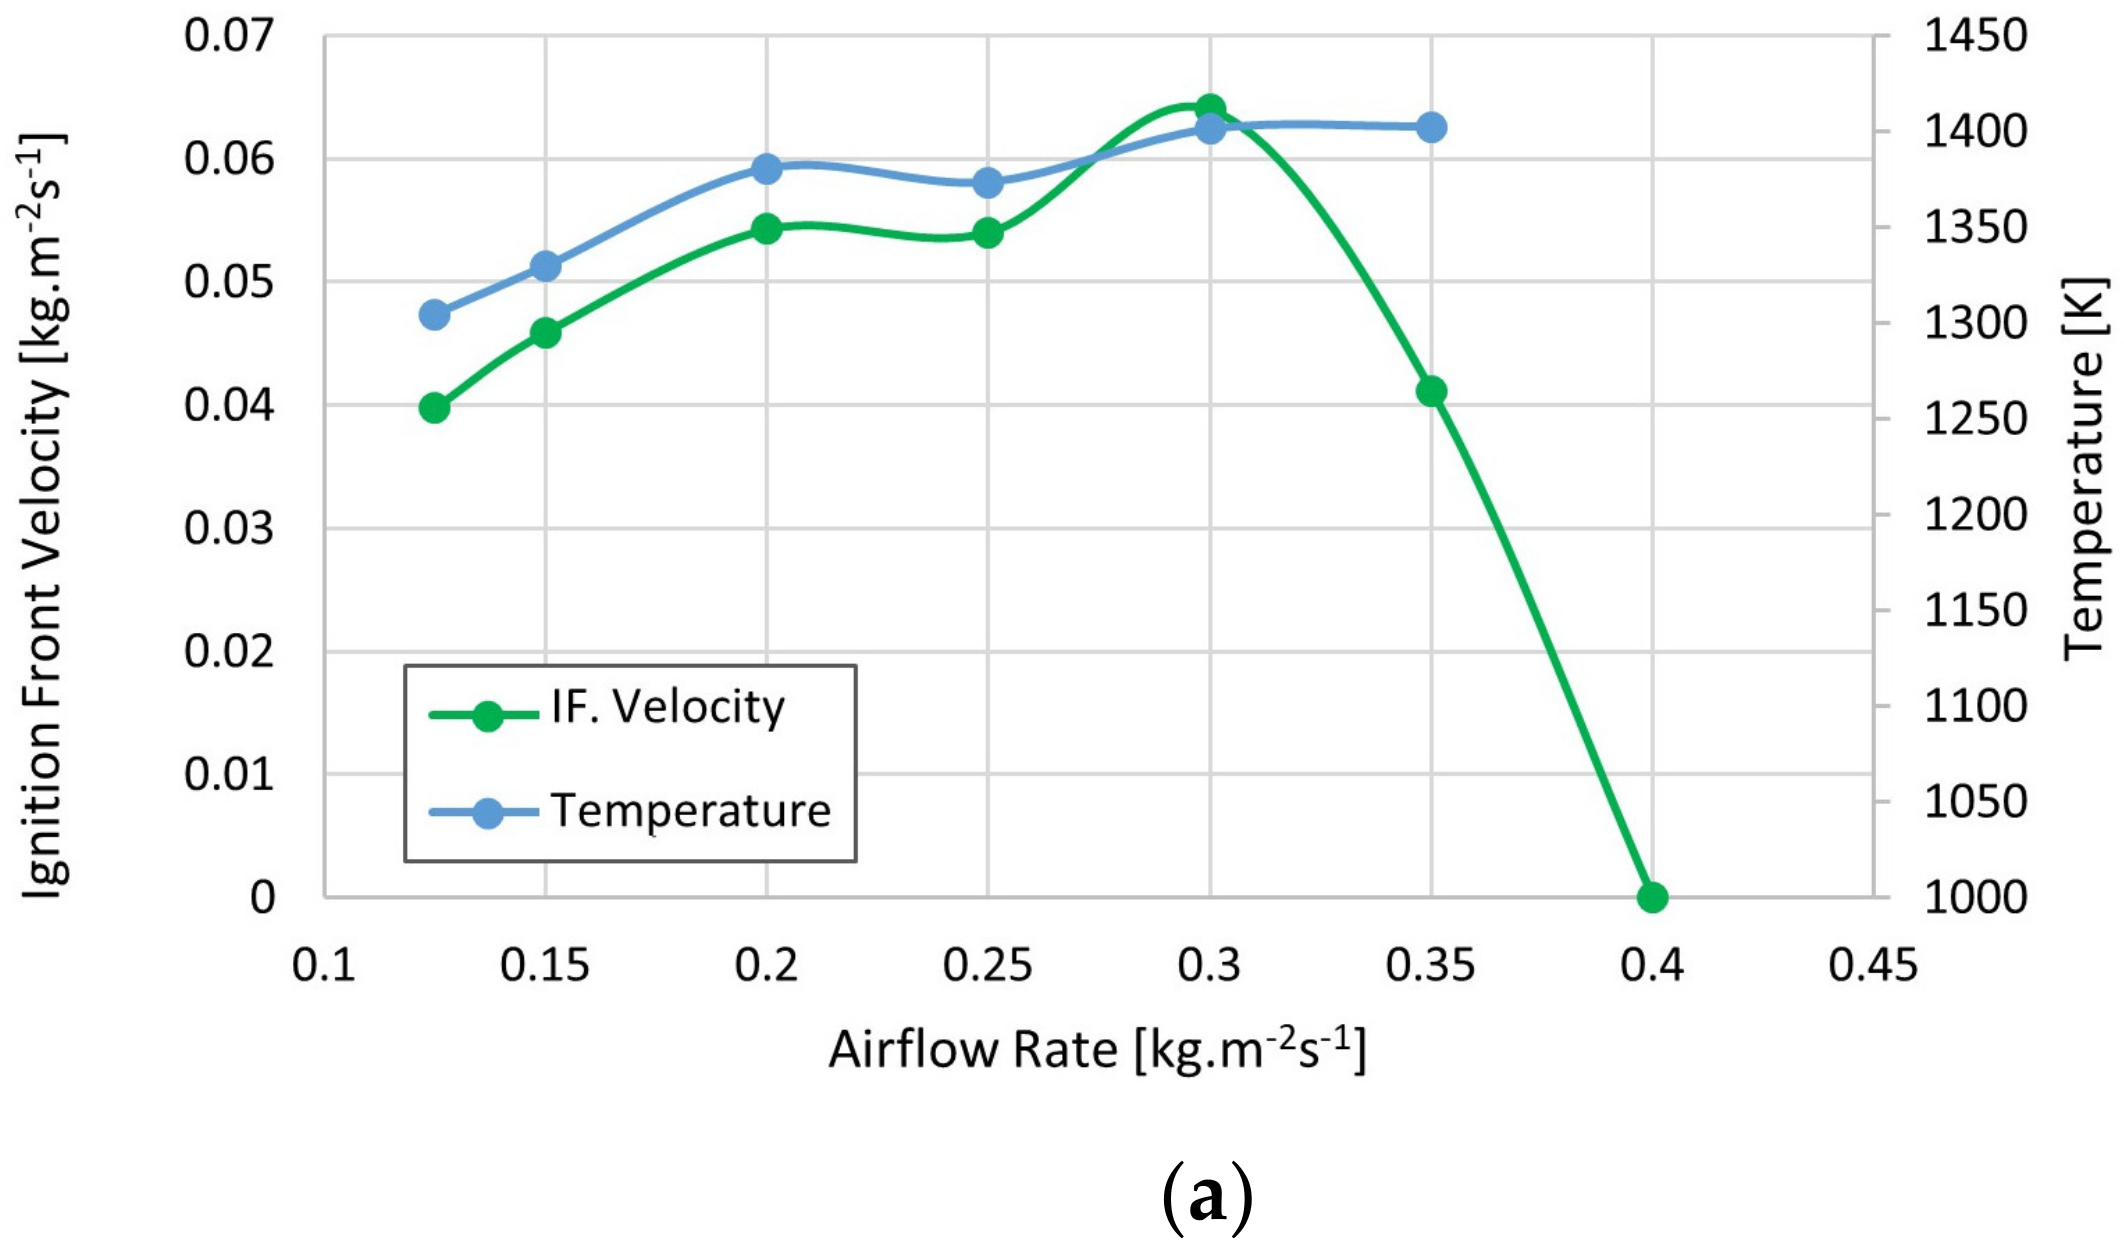
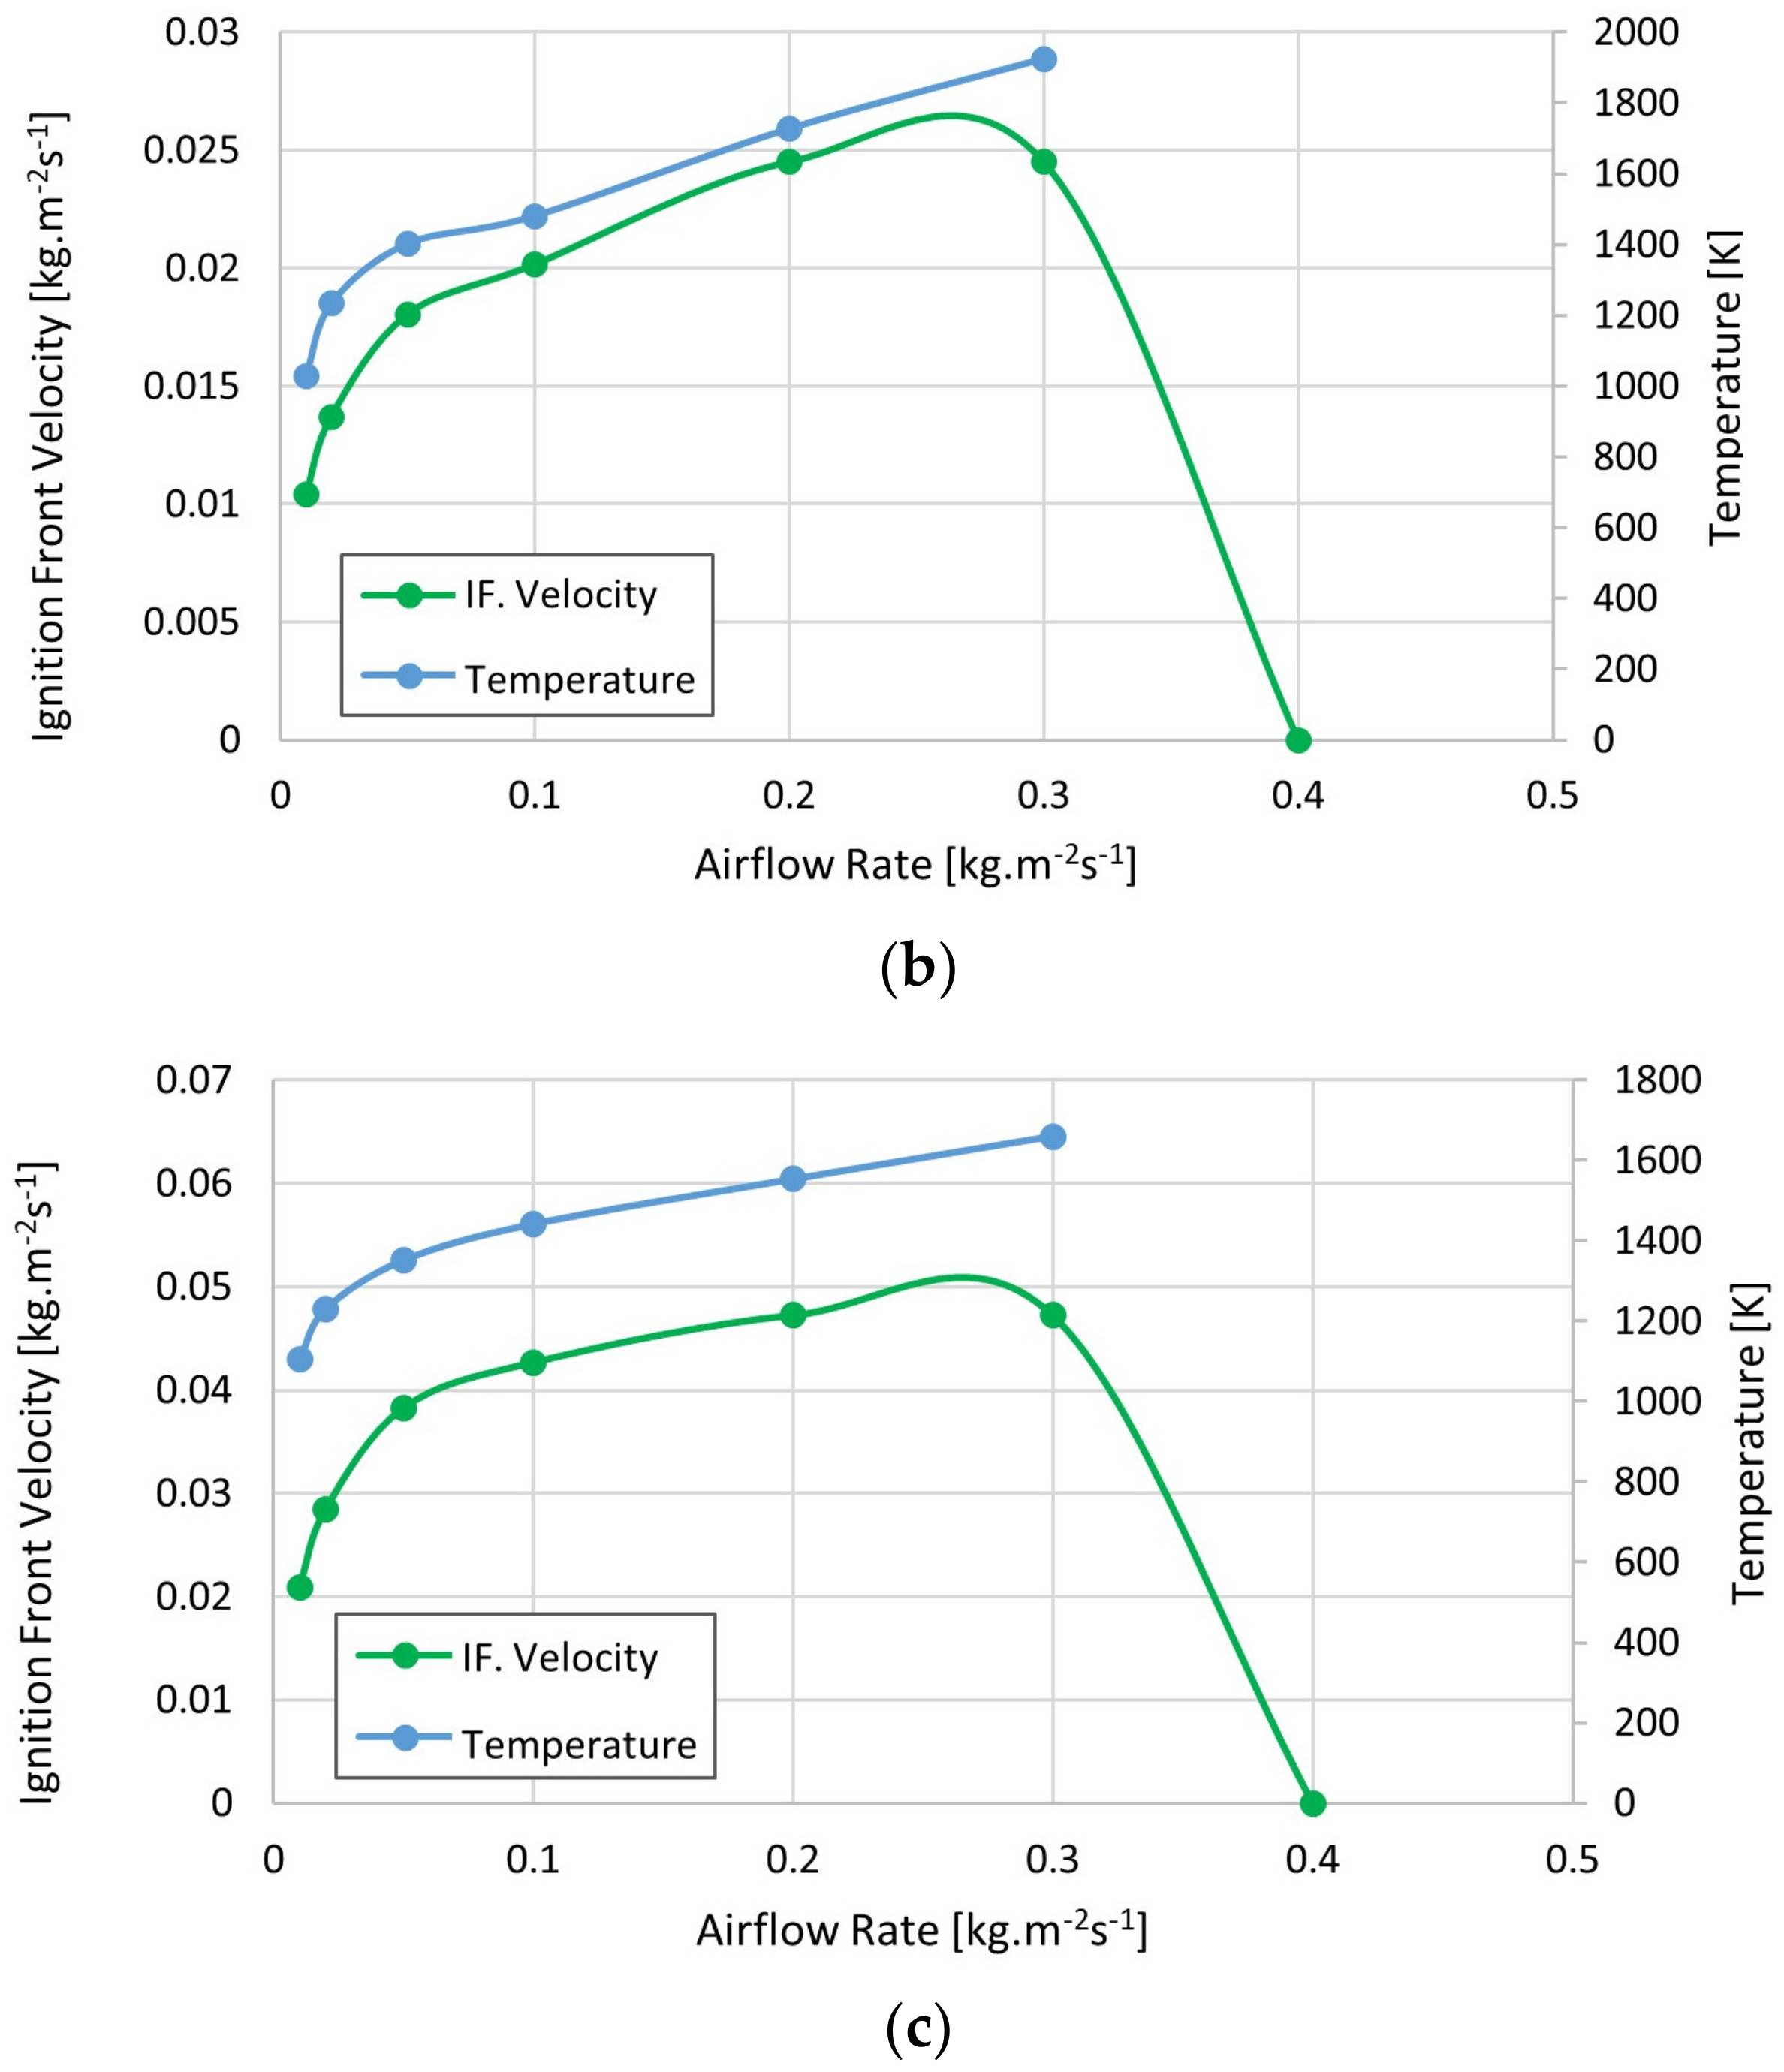
  • The stems of Lippia origanoides bagasse show a similar performance to that of other biomass used as solid fuels, while the leaves and mixtures of the same plant present lower performance.

Author Contributions

Conceptualization, G.F.G.S.; methodology, G.F.G.S.; validation, G.F.G.S., J.J.R. and D.P.; writing—original draft preparation, G.F.G.S.; writing—review and editing, J.L.C.V., D.A.F.D., Y.J.R.-O., J.J.R. and J.R.M.M.; project administration, J.L.C.V. and J.R.M.M.; funding acquisition, J.L.C.V. and J.R.M.M. All authors have read and agreed to the published version of the manuscript.

Funding

This research was funded by Minciencias, Ministry of National Education, Ministry of Industry, Commerce and Tourism and ICETEX, Scientific Ecosystem—Colombia Científica, Fund Francisco José de Caldas, through Contract RC-FP44842-212-2018.

Acknowledgments

Funding from Minciencias, Ministry of National Education, Ministry of Industry, Commerce and Tourism and ICETEX, Scientific Ecosystem—Colombia Científica, Fund Francisco José de Caldas, through Contract RC-FP44842-212-2018, is gratefully acknowledged.

Conflicts of Interest

The authors declare no conflict of interest.

References

  1. Saeed, M.A.; Niedzwiecki, L.; Arshad, M.Y.; Skrinsky, J.; Andrews, G.E.; Phylaktou, H.N. Combustion and Explosion Characteristics of Pulverised Wood, Valorized with Mild Pyrolysis in Pilot Scale Installation, Using the Modified ISO 1 m3 Dust Explosion Vessel. Appl. Sci. 2022, 12, 12928. [Google Scholar] [CrossRef]
  2. Karim, M.R.; Naser, J. CFD modelling of combustion and associated emission of wet woody biomass in a 4 MW moving grate boiler. Fuel 2018, 222, 656–674. [Google Scholar] [CrossRef]
  3. Said, Z.; Nguyen, T.H.; Sharma, P.; Li, C.; Ali, H.M.; Nguyen, V.N.; Pham, V.V.; Ahmed, S.F.; Van, D.N.; Truong, T.H. Multi-attribute optimization of sustainable aviation fuel production-process from microalgae source. Fuel 2022, 324, 124759. [Google Scholar] [CrossRef]
  4. Gobierno de la Republica de Colombia. Estrategia Nacional de Economía Circular. Cierre de Ciclos de Materiales, Innovación Tecnológica, Colaboración y Nuevos Modelos de Negocio; Presidencia de la República; Ministerio de Ambiente y Desarrollo Sostenible; Ministerio de Comercio, Industria y Turismo: Bogotá, Colombia, 2019.
  5. Unidad de Planeación Minero Energética—UPME. Balance Energético Colombiano—BECO. 2018. Available online: http://www1.upme.gov.co/InformacionCifras/Paginas/BalanceEnergetico.aspx (accessed on 27 July 2021).
  6. Bhuiyan, A.A.; Karim, M.R.; Naser, J. Chapter 11—Modeling of Solid and Bio-Fuel Combustion Technologies. In Thermofluid Modeling for Energy Efficiency Applications; Khan, M.M.K., Hassan, N.M.S., Eds.; Academic Press: Cambridge, MA, USA, 2016; pp. 259–309. ISBN 978-0-12-802397-6. [Google Scholar]
  7. Bhuiyan, A.A.; Naser, J. CFD modelling of co-firing of biomass with coal under oxy-fuel combustion in a large scale power plant. Fuel 2015, 159, 150–168. [Google Scholar] [CrossRef]
  8. Khodaei, H.; Al-Abdeli, Y.M.; Guzzomi, F.; Yeoh, G.H. An overview of processes and considerations in the modelling of fixed-bed biomass combustion. Energy 2015, 88, 946–972. [Google Scholar] [CrossRef]
  9. Szemmelveisz, K.; Szűcs, I.; Palotás, Á.B.; Winkler, L.; Eddings, E.G. Examination of the combustion conditions of herbaceous biomass. Fuel Process. Technol. 2009, 90, 839–847. [Google Scholar] [CrossRef]
  10. Yang, Y.B.; Sharifi, V.N.; Swithenbank, J. Effect of air flow rate and fuel moisture on the burning behaviours of biomass and simulated municipal solid wastes in packed beds. Fuel 2004, 83, 1553–1562. [Google Scholar] [CrossRef]
  11. Dernbecher, A.; Dieguez-Alonso, A.; Ortwein, A.; Tabet, F. Review on modelling approaches based on computational fluid dynamics for biomass combustion systems. Biomass Conv. Bioref. 2019, 9, 129–182. [Google Scholar] [CrossRef]
  12. Campo, Y.C. Estudio de La Composición Química y Las Actividades Antioxidante y Fotoprotectora de Los Extractos de Damiana y Orégano de Monte, Cultivadas en Santander. Doctorado, Universidad Industrial de Santander, Bucaramanga, Colombia, 2020. [Google Scholar]
  13. Stashenko, E.E.; Martínez, J.R.; Durán, D.C.; Córdoba, Y.; Caballero, D. Estudio comparativo de la composición química y la actividad antioxidante de los aceites esenciales de algunas plantas del género Lippia (Verbenaceae) cultivadas en Colombia. Rev. Acad. Colomb. Cienc. Exactas Físicas Nat. 2014, 38, 89–105. [Google Scholar] [CrossRef] [Green Version]
  14. Rajh, B.; Gómez, M.A.; Álvarez-Bermúdez, C.; Cid, N.; Míguez, J.L. Assessment of experimental 1D and analytical 3D steady approaches of packed bed thermal conversion through the simulation of a 60-kW biomass boiler operating at half and full load. Energy Convers. Manag. 2022, 268, 116003. [Google Scholar] [CrossRef]
  15. Gómez, M.A.; Martín, R.; Chapela, S.; Porteiro, J. Steady CFD combustion modeling for biomass boilers: An application to the study of the exhaust gas recirculation performance. Energy Convers. Manag. 2019, 179, 91–103. [Google Scholar] [CrossRef]
  16. Karim, M.R.; Naser, J. Numerical study of the ignition front propagation of different pelletised biomass in a packed bed furnace. Appl. Therm. Eng. 2018, 128, 772–784. [Google Scholar] [CrossRef]
  17. Karim, M.R.; Naser, J. Progress in Numerical Modelling of Packed Bed Biomass Combustion. In Proceedings of the 19th Australasian Fluid Mechanics Conference, Melbourne, Australia, 8–11 December 2014. [Google Scholar]
  18. García Sánchez, G.; Chacón Velasco, J.; Fuentes Díaz, D.; Jaramillo Ibarra, J.; Martínez Morales, J. CFD modelling of biomass boilers—A review of the state of the art. Respuestas 2020, 25, 3. [Google Scholar] [CrossRef]
  19. García Sánchez, G.F.; Chacón Velasco, J.L.; Rueda-Ordoñez, Y.J.; Fuentes Díaz, D.A.; Martínez Morales, J.R. Solid biomass combustion modeling: Bibliometric analysis and literature review of the latest developments in OpenFOAM based simulations. Bioresour. Technol. Rep. 2021, 15, 100781. [Google Scholar] [CrossRef]
  20. Rodríguez, M.Á.G. Contribuciones al Desarrollo de un Modelo de Simulación de Combustión de Sólidos. Universidade de Vigo, España. 2014. Available online: https://dialnet.unirioja.es/servlet/tesis?codigo=138954 (accessed on 8 June 2019).
  21. Buchmayr, M.; Gruber, J.; Hargassner, M.; Hochenauer, C. Spatially resolved chemical species concentrations above the fuel bed of a small grate-fired wood-chip boiler. Biomass Bioenergy 2016, 95, 146–156. [Google Scholar] [CrossRef]
  22. Gómez, M.A.; Porteiro, J.; Patiño, D.; Míguez, J.L. CFD modelling of thermal conversion and packed bed compaction in biomass combustion. Fuel 2014, 117, 716–732. [Google Scholar] [CrossRef]
  23. Chaney, J.; Hao, L.; Jinxing, L. An overview of CFD modelling of small-scale fixed-bed biomass pellet boilers with preliminary results from a simplified approach—ScienceDirect. Energy Convers. Manag. 2012, 63, 149–156. [Google Scholar] [CrossRef]
  24. Towara, M.; Schanen, M.; Naumann, U. MPI-Parallel Discrete Adjoint OpenFOAM. Procedia Comput. Sci. 2015, 51, 19–28. [Google Scholar] [CrossRef] [Green Version]
  25. Patiño Vilas, D. Análisis Experimental de Combustión de Biomasa en un Quemador de Lecho Fijo. Universidade de Vigo. 2009. Available online: https://dialnet.unirioja.es/servlet/tesis?codigo=139004 (accessed on 21 February 2022).
  26. Rueda-Ordóñez, Y.J.R.; Tannous, K.K. Análisis cinético de la descomposición térmica de biomasas aplicando un esquema de reacciones paralelas independientes. Rev. UIS Ing. 2017, 16, 119–128. [Google Scholar] [CrossRef] [Green Version]
  27. Sheng, C.; Azevedo, J.L.T. Estimating the higher heating value of biomass fuels from basic analysis data. Biomass Bioenergy 2005, 28, 499–507. [Google Scholar] [CrossRef]
  28. García Fernández, R. Modelización Cinética y Optimización de Parámetros de Combustión en Calderas de Biomasa. Ph.D. Thesis, Universidad de Oviedo, Oviedo, Spain, 2014. Available online: http://digibuo.uniovi.es/dspace/handle/10651/28947 (accessed on 8 June 2019).
  29. Dunn, C. Computational Modeling of Coal Devolatilization and Soot Formation in OpenFoam. Master’s Thesis, University of Wyoming, Laramie, WY, USA, 2018. [Google Scholar]
  30. Van Kuijk, H.A.J.A. Grate Furnace Combustion: A Model for the Solid Fuel Layer. Ph.D. Thesis, Technische Universiteit Eindhoven, Eindhoven, The Netherlands, 2008. [Google Scholar] [CrossRef]
  31. Haller, J.; Hartmann, I.; König, M.; Ortwein, A. Basic Studies on the Development of Micro Combustion Systems for Biomass. In Proceedings of the European Combustion Meeting, Lund, Sweden, 25–28 June 2013; Available online: https://www.researchgate.net/publication/256715286 (accessed on 13 March 2023).
  32. Ranz, W.E.; Marshall, W.R. Evaporation from drops: Part I. Chem. Eng. Prog. 1952, 48, 141–146. [Google Scholar]
  33. Ranz, W.E.; Marshall, W.R. Evaporation from drops: Part II. Chem. Eng. Prog. 1952, 48, 173–180. [Google Scholar]
  34. Nordin, P.A.N. Complex Chemistry Modeling of Diesel Spray Combustion. 2001. Available online: https://research.chalmers.se/en/publication/724 (accessed on 3 December 2019).
  35. Cordiner, S.; Mulone, V.; Manni, A.; Rocco, V. Biomass furnace study via 3D numerical modeling. Int. J. Numer. Methods Heat Fluid Flow 2016, 26, 515–533. [Google Scholar] [CrossRef]
  36. Collazo, J.; Porteiro, J.; Patiño, D.; Granada, E. Numerical modeling of the combustion of densified wood under fixed-bed conditions. Fuel 2012, 93, 149–159. [Google Scholar] [CrossRef]
Figure 1. Cylindrical combustor. (a) Scheme of the experimental system; (b) computational domain.
Energies 16 02932 g001
Figure 2. Results of mesh independence analysis.
Energies 16 02932 g002
Figure 3. Temperature profiles for wood pellets (wp) at an airflow rate of 0.2 kg.m−2s−1, at three different moments: (a) 1000 s; (b) 3500 s and (c) 7000 s. Temperatures are measured on the Kelvin scale.
Energies 16 02932 g003
Figure 4. Experimental and simulated curves of ignition front velocity and maximum temperature at different airflow rates: (a) wood pellets (wp); (b) olive stone (os) and (c) almond shell (as).
Energies 16 02932 g004aEnergies 16 02932 g004b
Figure 5. Ignition front velocity and maximum temperature at different airflow rates for Lippia origanoides bagasse samples: (a) stems (S); (b) leaves (L) and (c) mixture of stems and leaves (M).
Energies 16 02932 g005aEnergies 16 02932 g005b
Table 1. Fuel composition and properties.
FuelEmpirical FormulaProximate Analysis [wt%]LHV
[MJ/kg]
ρp [kg/m3]ρa [kg/m3]
WaterVolat.CharAsh
Wood pellets (wp)CH1.71O0.707.369.023.00.716.61240690
Olive stone (os)CH1.50O0.641361.325.10.615.31070620
Almond shell (as)CH1.40O0.6811.964.123.40.615.6920360
LO leaves (L)CH1.48O0.929.566.414.89.414.5120.923.1
LO stems (S)CH1.32O0.759.368.717.15.015.6594.2308.8
LO mixture (M)CH1.39O0.839.967.416.46.315.1371.8174.5
Table 2. Combustion reactions.
Homogeneous Reactions
R1 C 6 H 6 + 9 2 O 2 6 C O + 3 H 2 O
R2 C H 4 + 3 2 O 2 C O + 2 H 2 O
R3 H 2 + 1 2 O 2 H 2 O
R4 C O + 1 2 O 2 C O 2
R5 H 2 O + C O C O 2 + H 2
R6 C O 2 + H 2 H 2 O + C O
Table 3. Relative error (%E) of values of simulated ignition front velocity (F. Velocity) and maximum temperature (Tmax).
Airflow
[kg/m2s]
wposas
F. VelocityTmax.F. VelocityTmax.F. VelocityTmax.
0.112.6911.771.16-4.4312.71
0.212.809.199.7423.4812.624.64
0.31.2912.629.2130.9726.466.32
0.45.88---51.1921.86
0.4514.54-----
Some values are not presented because no experimental data were available for comparison.
Disclaimer/Publisher’s Note: The statements, opinions and data contained in all publications are solely those of the individual author(s) and contributor(s) and not of MDPI and/or the editor(s). MDPI and/or the editor(s) disclaim responsibility for any injury to people or property resulting from any ideas, methods, instructions or products referred to in the content.

