Article

A Platform for Outdoor Real-Time Characterization of Photovoltaic Technologies

by
Sammy J. Martínez-Deusa
,
Carlos A. Gómez-García
and
Jaime Velasco-Medina
*
School of Electrical and Electronics Engineering, Universidad del Valle, Calle 13 #100-00, Cali 760043, Colombia
*
Author to whom correspondence should be addressed.
Energies 2023, 16(6), 2907; https://doi.org/10.3390/en16062907
Submission received: 25 July 2022 / Revised: 17 August 2022 / Accepted: 20 August 2022 / Published: 22 March 2023
(This article belongs to the Section A2: Solar Energy and Photovoltaic Systems)

Abstract

:
In recent years, thin-film and organic photovoltaic (OPV) technologies have been increasingly used as alternatives to conventional technologies due to their low weight, portability, and ease of installation. Outdoor characterization studies allow knowing the real performances of these photovoltaic (PV) technologies in different environmental conditions. Therefore, to address the above, this article presents the hardware–software design and implementation of an integrated and scalable platform for performing the outdoor real-time characterization of modern PV/OPV technologies located at different altitudes. The platform allows knowing the outdoor performance of PV/OPV technologies in real environmental conditions by acquiring data from different monitoring stations located at different altitudes. The proposed platform allows characterizing solar panels and mini-modules and acquiring relevant information to analyze power generation capacity and efficiency. Furthermore, other devices for new PV technologies characterization can be easily added, achieving a scale-up of the platform. A preliminary study of the outdoor performance of emerging PV/OPV technologies was carried out at three different altitudes in a tropical climate region. From the results, the copper indium gallium selenide (CIGS) technology presents the best outdoor performance with an average PCE of 9.64%; the OPV technology has the best behavior at high temperatures with a voltage loss rate of 0.0206 V/°C; and the cadmium telluride (CdTe) technology is the most affected by temperature, with a voltage loss rate of 0.0803 V/°C.

Graphical Abstract

1. Introduction

The power conversion efficiency (PCE) of the PV technologies operating in real environment conditions is lower than the PCE measured under standard test conditions (STC) or nominal operating cell temperature (NOCT) [1,2]. This difference is due to changes in cloud cover, the electrical resistance of the circuit, levels of solar irradiance, surrounding air velocity, and the ambient temperature; the presence of dust and dirt accumulated on the glass that protects the panel, and obstacles that produce shade; and aging degradation [3].
Currently, the PCE measured under STC of most commercial c-Si panels is from 13% to 21% [4], with more than 25 years of average useful life [5], and PCE from 6% to 22.1% for PV panels of thin-film [6]. However, PCE is reduced in real environment conditions by increasing the cell-surface temperature due to partial solar radiation converted into heat. Thus, the characterization through I-V curves is necessary to evaluate the performance of PV/OPV technologies that work under the variation of real environmental conditions. The I-V curve allows calculating the P-V curve, the maximum power generated (Pmpp), and fill factor (FF) from the following parameters: open-circuit voltage (Voc), short circuit current (Isc), maximum voltage (Vmpp), and maximum current (Impp) [7]. This evaluation is necessary because it allows knowing the outdoor performance of PV/OPV technologies, which are different from those under STCs and NOCT provided by the manufacturers [8].
Therefore, the outdoor characterization of PV/OPV technologies is considered the best test to evaluate their real PCE and degradation ratio. In the case of large-sized rolled PV panels, outdoor characterization is the best option because there are no suitable solar simulators for those sizes. Another point is that the STCs (25 °C, 1000 W/m2, and AM: 1.5) for silicon PV technologies do not consider the PCE reduction when the temperature increases, while the PCE increases with the temperature for the OPV technology [9].
With the rapid development of new photovoltaic technologies based on new materials, concepts, and techniques, it is essential to analyze the performance of each technology for a particular climatic condition. Therefore, outdoor characterization systems of PV technologies have become relevant, and the academic community has shown a great interest in the outdoor characterization of PV technologies in the last five years [10,11,12,13,14]. In [9], the authors present the outdoor characterization of 24 commercial organic photovoltaic panels of different sizes (2.52 × 0.52 m and 1.29 × 0.52 m) to evaluate their efficiency. Their system was implemented using: (1) a curve tracer IV-500 w for I-V curve tracing of PV module or PV array up to 1500 V and 15 A; (2) two pyranometers from EKO Instruments for global radiation and diffuse radiation measurement; (3) one compact weather station for ambient temperature, wind speed, wind direction, precipitation, and relative humidity measurement every 10 s; (4) thermocouples type K for cell-surface temperature measurement of OPV modules, and (5) a Campbell datalogger for acquisition and transmission of meteorological data. Their equipment and sensors have high accuracy; however, the I-V curve tracing is manually carried out, which makes it challenging to register data over a long period to analyze the performance of PV technologies.
Tests for 31 flexible OPV modules by considering simulated temperature, humidity, and irradiation parameters are reported in [15]. The objective is to evaluate or determine the effect of the above parameters on cell efficiency and degradation; however, the evaluation is done under stable environmental conditions, limiting the identification and quantification of the impact on the PV technologies. The authors in [16] present the development of a low-cost solar analyzer and a complete monitoring system for the first-generation PV technologies, whose current and voltage values are very different from those generated by the emerging PV technologies. In [17], the authors present a study on the long-term outdoor operation of two concentrator photovoltaic (CPV) systems that differ in cell structure. For these two systems, the difference in performance, the influence of solar spectrum, and module temperature are evaluated. The cell-surface temperature is measured with Pt100 sensors, and the direct normal irradiance (DNI) and direct solar spectrum are measured every minute with a pyrheliometer and a spectro-radiometer, respectively. However, the authors do not present real-time monitoring or data integration evidence.
In [18], the authors present a study of the outdoor performance of PV technologies for more than two years using a system composed of (1) two pyranometers and three spectroradiometers, which are used to measure different types of irradiance (horizontal, with an inclination of 20° and at different wavelengths); (2) one windmeter that records the speed and direction of the wind; (3) one thermos-hygrometer and hyetometer, which are used to measure temperature, humidity, and rainfall. The sensors used to measure the irradiance allow a better characterization of the irradiance incident on the surface of the solar panels, providing more information and precision for the analysis of performance in PV technologies. However, solar panels are not characterized outdoors since the authors used a solar simulator (indoor test) to track the I-V characteristics of PV panels every year to observe the change in their performance after operation in outdoor conditions; therefore, the study does not define a real-time behavior of the technology with respect to variations in weather conditions.
The works reported in [19,20] present the outdoor characterization for perovskite solar cells and OPV modules. This test was carried out using one Egnitec PVMS250 PV measurement system, one IMT silicon solar reference cell to measure the irradiance, one Davis Pro weather station, and Pt100 sensors to measure the cell-surface temperature. All the relevant parameters for the outdoor characterization of PV technologies were measured; however, the precision of the measured irradiance with a calibrated solar reference cell was lower than the one with a pyranometer sensor. In [21], the authors present an outdoor measurement 24-channel system for monitoring PV technologies. In this case, PV parameters were obtained from an I-V curve tracer and the meteorological parameters from individual sensors. The surface-cell temperature and irradiance were measured using a thermocouple and a pyranometer. However, the authors do not present real-time monitoring or data integration evidence.
A comparative analysis of the outdoor performance of OPV and conventional PV modules (c-Si and CIS) is reported in [22]. The authors used a PC-controlled data acquisition system composed of an I-V tracer, selection circuit, and a temperature acquisition system for PV modules. An automatic system performed similar test conditions by switching the I-V tracer between the PV modules in less than half a second. The PV module temperature was measured with a resistance temperature detector (RTD) placed on the back of each PV module. Additionally, a thermal imaging camera was used to check the temperature uniformity of all the PV modules and to verify the absence of hotspots. This work widely describes the hardware development of its system compared to the other works. However, there is no evidence of how the data integration is carried out or if they have databases and software for data visualization and analysis. Secondly, the system cannot characterize PV mini modules because the current and voltage levels are lower than those measured in the PV panels.
The above relevant works are summarized in Table S1 of the Supplementary Information, where the hardware specifications and features of each outdoor characterization system for PV technologies are listed. In order to address the need to perform outdoor real-time characterization for PV/OPV technologies using sensors and devices, this paper presents the hardware–software development of an integrated and scalable platform that allows knowing the outdoor performance of emerging PV technologies at different altitudes in a tropical climate region. The proposed platform integrates several sensors and electronic devices, a weather station, and several PV analyzers providing real-time and historical information for performing PCE, FF, and Jsc analysis.
To the best of our knowledge in the literature, there is no available platform for performing outdoor real-time characterization of new PV technologies with the above features. Thus, the main contributions of this work are listed as follows:
(1)
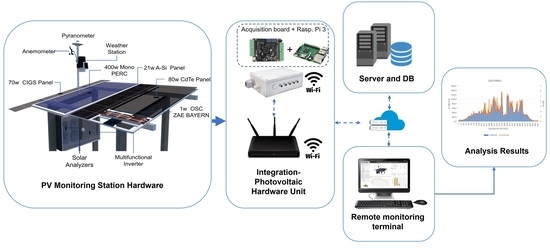
Design of an integrated and scalable platform that accomplishes the technical requirements for performing outdoor real-time characterization of emerging PV technologies.
(2)
Design of a compact, modular, and portable device for acquiring, formatting, and real-time transmission of PV data. This device, here called IPHU (integration-photovoltaic hardware unit), receives and formats the data provided by the pyranometer, cell-surface temperature sensors, weather station, and PV analyzers; IPHU transmits the information to the central server via REST web service.
(3)
Design of a PC software application to visualize the I-V and P-V curves and meteorological and PV parameters for outdoor performance analysis during a time.
(4)
Development of three PV monitoring stations (PVMS) installed at 0, 1000, and 2000 m above sea level (m.a.s.l).

2. Materials and Methods

The designed platform for outdoor real-time characterization of PV/OPV technologies is shown in Figure 1, and their main components (PVMS, IPHU device, PC-based remote monitoring terminal, and central server) are described as follows.
PVMS is implemented using: (1) PV panels and OPV mini modules, which are: semi-flexible CIGS [23,24], rollable amorphous silicon (A-Si) [13,25], and thin-film CdTe [26,27] PV panels, and three OPV mini-modules with different barrier foil [15,28,29]. Their technical characteristics are presented in Table 1. (2) Second-class pyranometer SMP3 for measuring the irradiance (Irr) and Pt100 sensors for measuring the cell-surface temperature (Tc). (3) Davis Vantage Pro 2 weather station for generating a JSON file containing the meteorological parameters, which is sent to IPHU using a local WiFi link. For our characterization purposes, the selected meteorological parameters are relative humidity (RH), wind speed (Ws), ambient temperature (TA), and precipitation. (4) PV solar analyzers for PV panel and OPV mini module. The first works up to 50 V and 5 A, using a capacitive charging technique for I-V curve tracing, and the second works up to 14 V and 250 mA, using a four-quadrant DC supply technique for I-V curve tracing. (5) Photovoltaic Power Backup System, which supplies the electrical power to PVMS, and it is composed of a multi-functional inverter, a 440 W PV panel, two batteries of 150 Ah, DC/AC protections, and an SNMP box for remote monitoring. The three PVMSs implemented at different altitudes in a tropical climate region are shown in Figures S1–S4 of Supplementary Information.
IPHU acquires, integrates, and transmits the data generated by the PV/OPV analyzers, the pyranometer, cell-surface temperature sensors, and the weather station. Its hardware is composed of a raspberry pi 3, a USB to RS-485 converter, a 5 V/3 A DC-DC converter, and a 12 V/5 A switched power supply.
PC-Based Remote Monitoring Terminal allows the visualization of I-V curves and the photovoltaic and meteorological parameters. It runs a user interface application for system logging, performs local or remote monitoring, and accesses measurement records stored in the database server. Moreover, the terminal supports a local database for offline deployments or in case of connection disruption.
Central server performs the storage, administration, recovery, and classification of the measured data of each PV/OPV technology installed in each PVMS. A web service is implemented on REST architecture using Java language for accessing the database server. In this case, data security is achieved between user and server by HTTPS communication protocol based on Transport Layer Security (TLS) encryption protocol.
Using the above components, the designed platform of Figure 1 allows the outdoor real-time characterization of PV technologies performing the following stages: (1) Measurement of irradiance with pyranometer and cell-surface temperature with Pt100 sensors connected with the IPHU device through a Modbus RTU network. (2) Tracing of I-V curves simultaneously for three different PV panels and three different OPV mini modules, using the PV solar analyzers. (3) Transmission of meteorological parameters and I-V curves to IPHU device through Wi-Fi local network. (4) Integration of meteorological parameters, irradiance, cell-surface temperature, and I-V curves in CSV files on the IPHU. (5) Transmission of integrated data to the central database server. (6) Visualization of measured parameters in real-time and historical data through the developed user interface.

2.1. IPHU Design and Implementation

The developed IPHU device is a compact, modular, and portable device composed of a hardware module and a custom software application to acquire, process, and transmit the integrated data through the Internet.
The IPHU hardware was implemented using: (1) a data acquisition unit composed of a sensing stage and an acquisition and adaptation stage. The first one uses a second-class pyranometer to measure the irradiance (W/m2) and Pt100 sensors to measure the cell-surface temperature. The second one uses Pt100 temperature sensors with data transmission through Modbus RTU protocol on an RS-485 network at 19200 baud/sec and an RS-485 to USB converter for connecting the transmitters and the pyranometer to the processing unit. All sensors are connected to the RS-485 network through M12 connectors and splitters used in industrial applications; (2) a processing unit that uses a Raspberry Pi board based on the 64-bit processor ARMv8@1.2GHz supporting Linux OS, with 1 GB RAM, 8 GB of flash memory, Ethernet 10/100 Mbps, and USB 2.0 ports. Raspberry Pi processor executes a custom software developed in Java that allows the integration of the different data types and file formats obtained from the measuring equipment; (3) a data communication unit using a Wi-Fi 802.11 b/g/n adapter to connect IPHU with PV analyzers and a wireless gateway to communicate the weather station with IPHU through Wi-Fi.
The IPHU software was developed by using the procedures shown in Figure 2 and are described as follows:
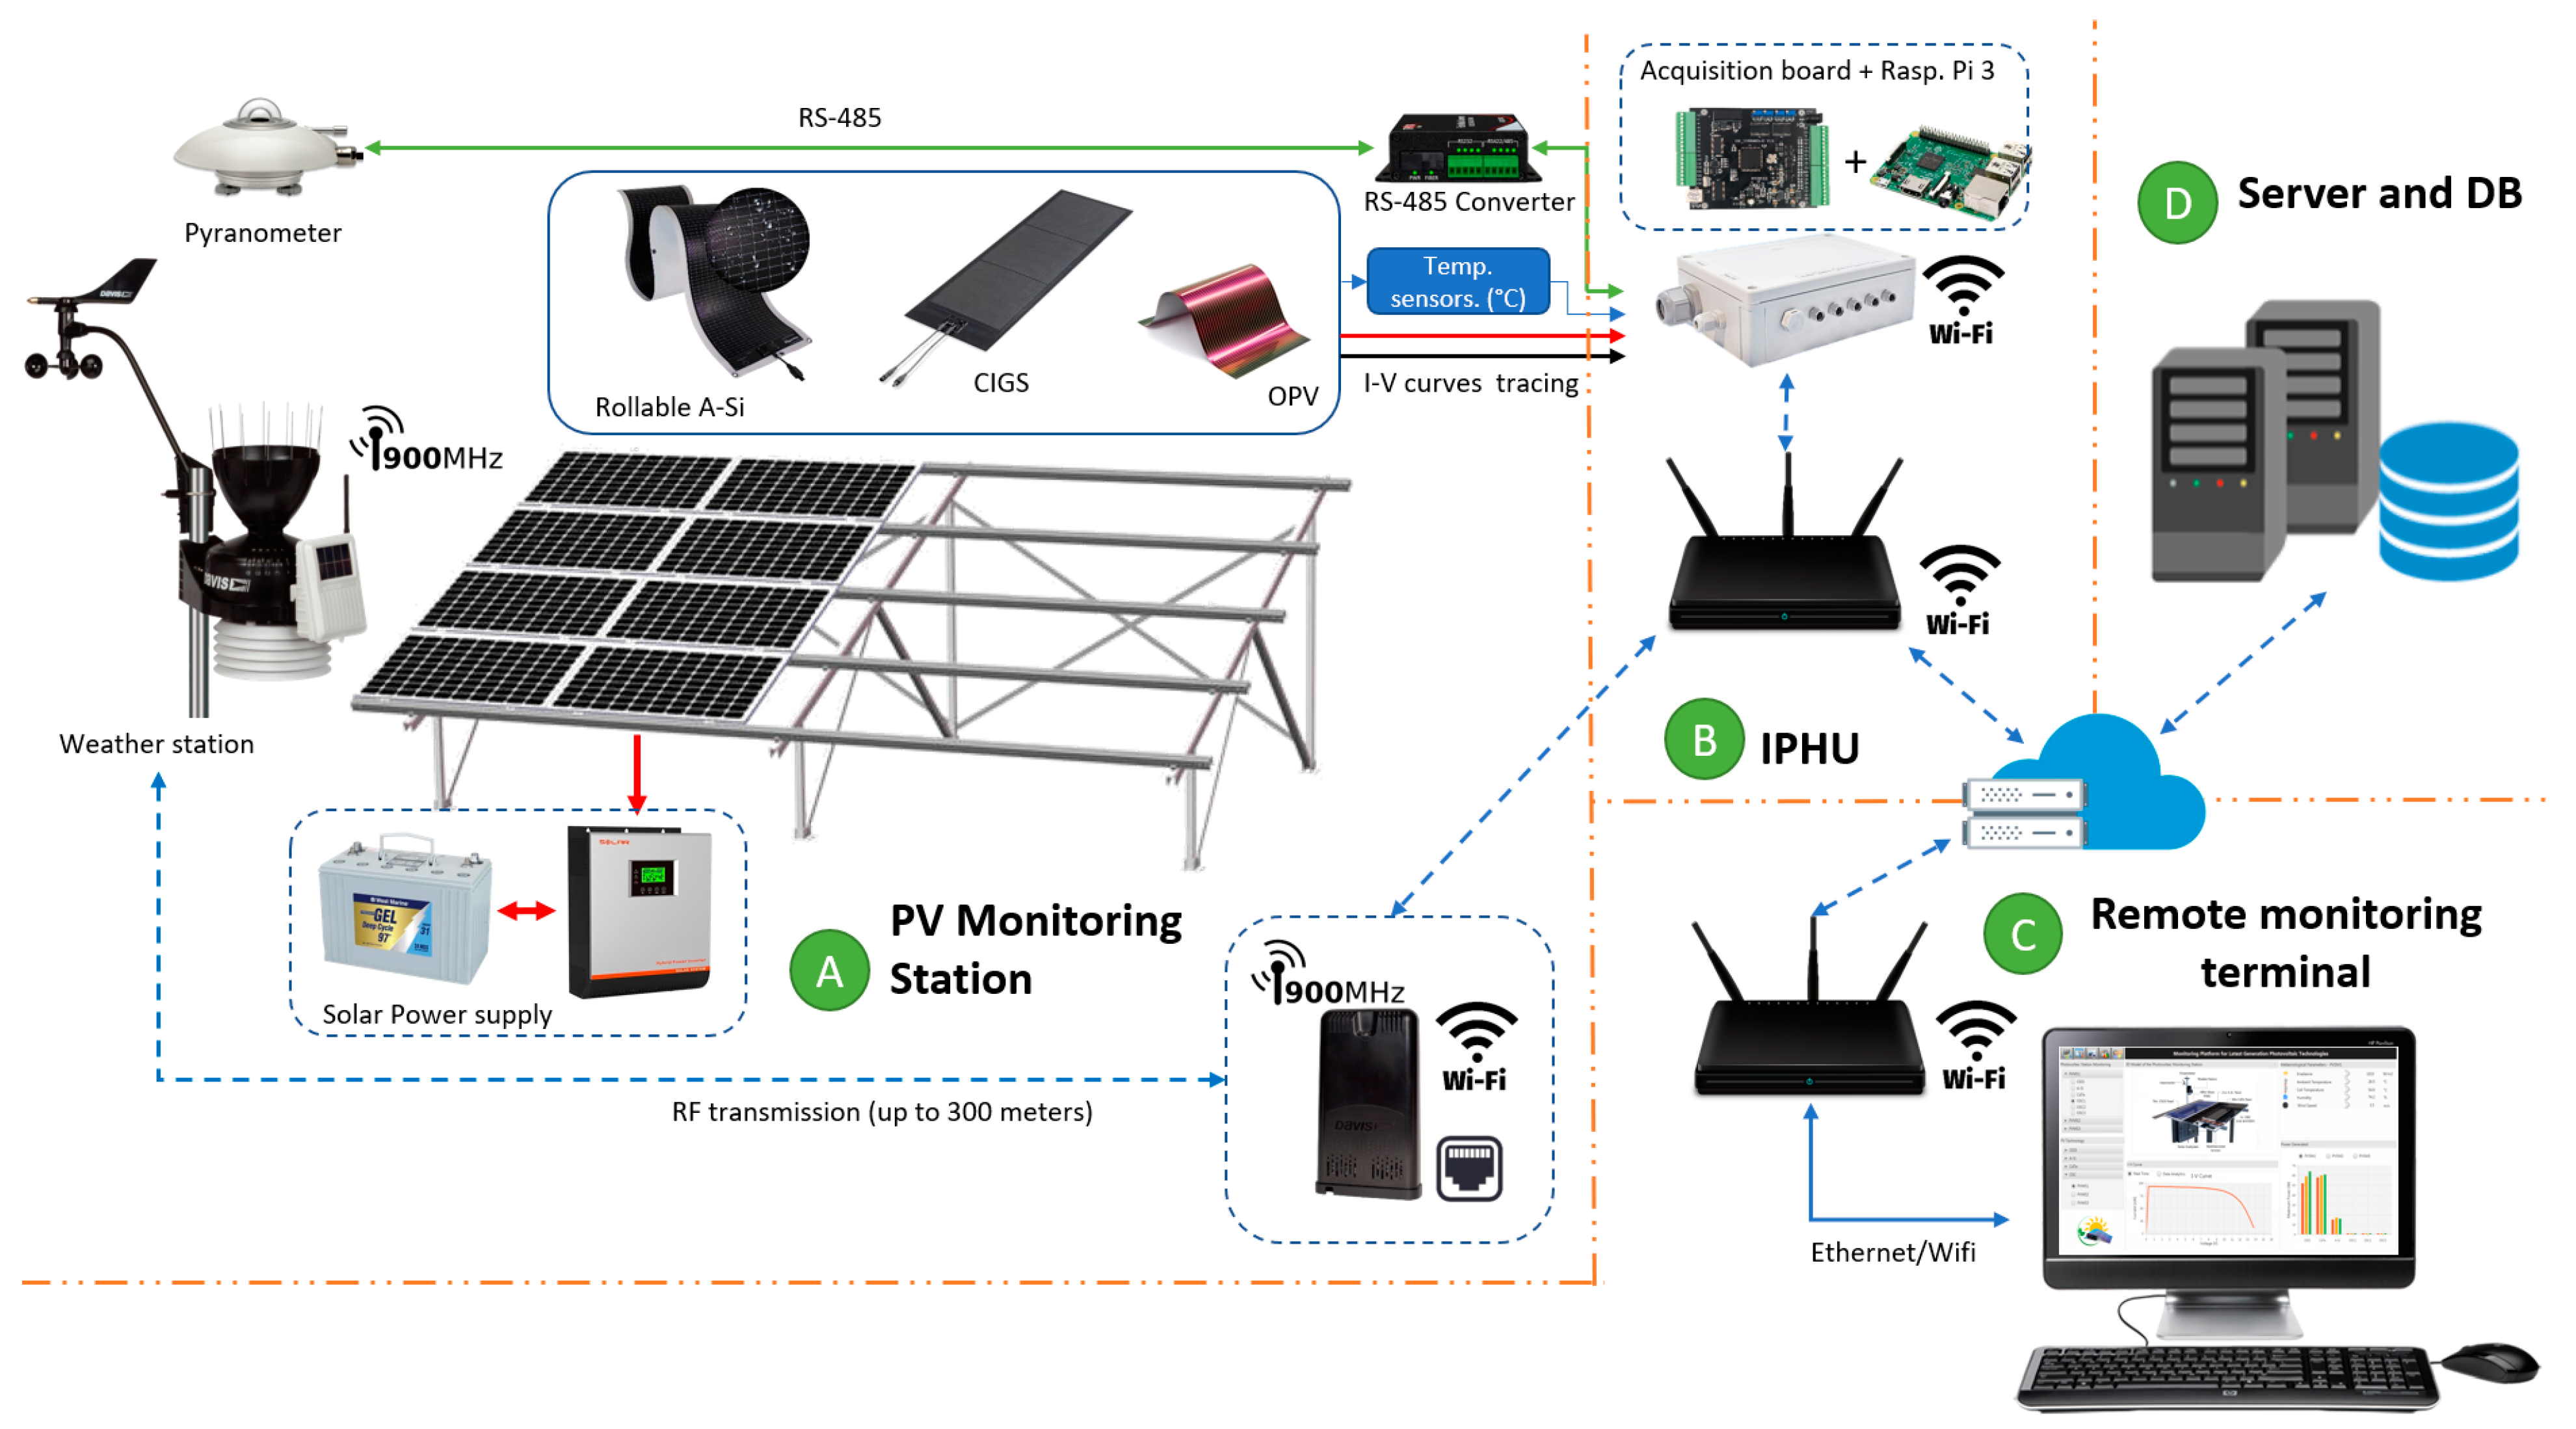
  • Connecting Verification Procedure verifies the connection of IPHU with the sensors, weather station, and PV/OPV analyzers.
  • Data Capture Procedure accesses and captures the data from the sensors, the weather station, and PV/OPV analyzers through the Modbus and Wi-Fi local networks. The data from the analyzers are captured using an SSH communication on a local network, and the data generated by the weather station are captured using an HTTP request to the wireless gateway.
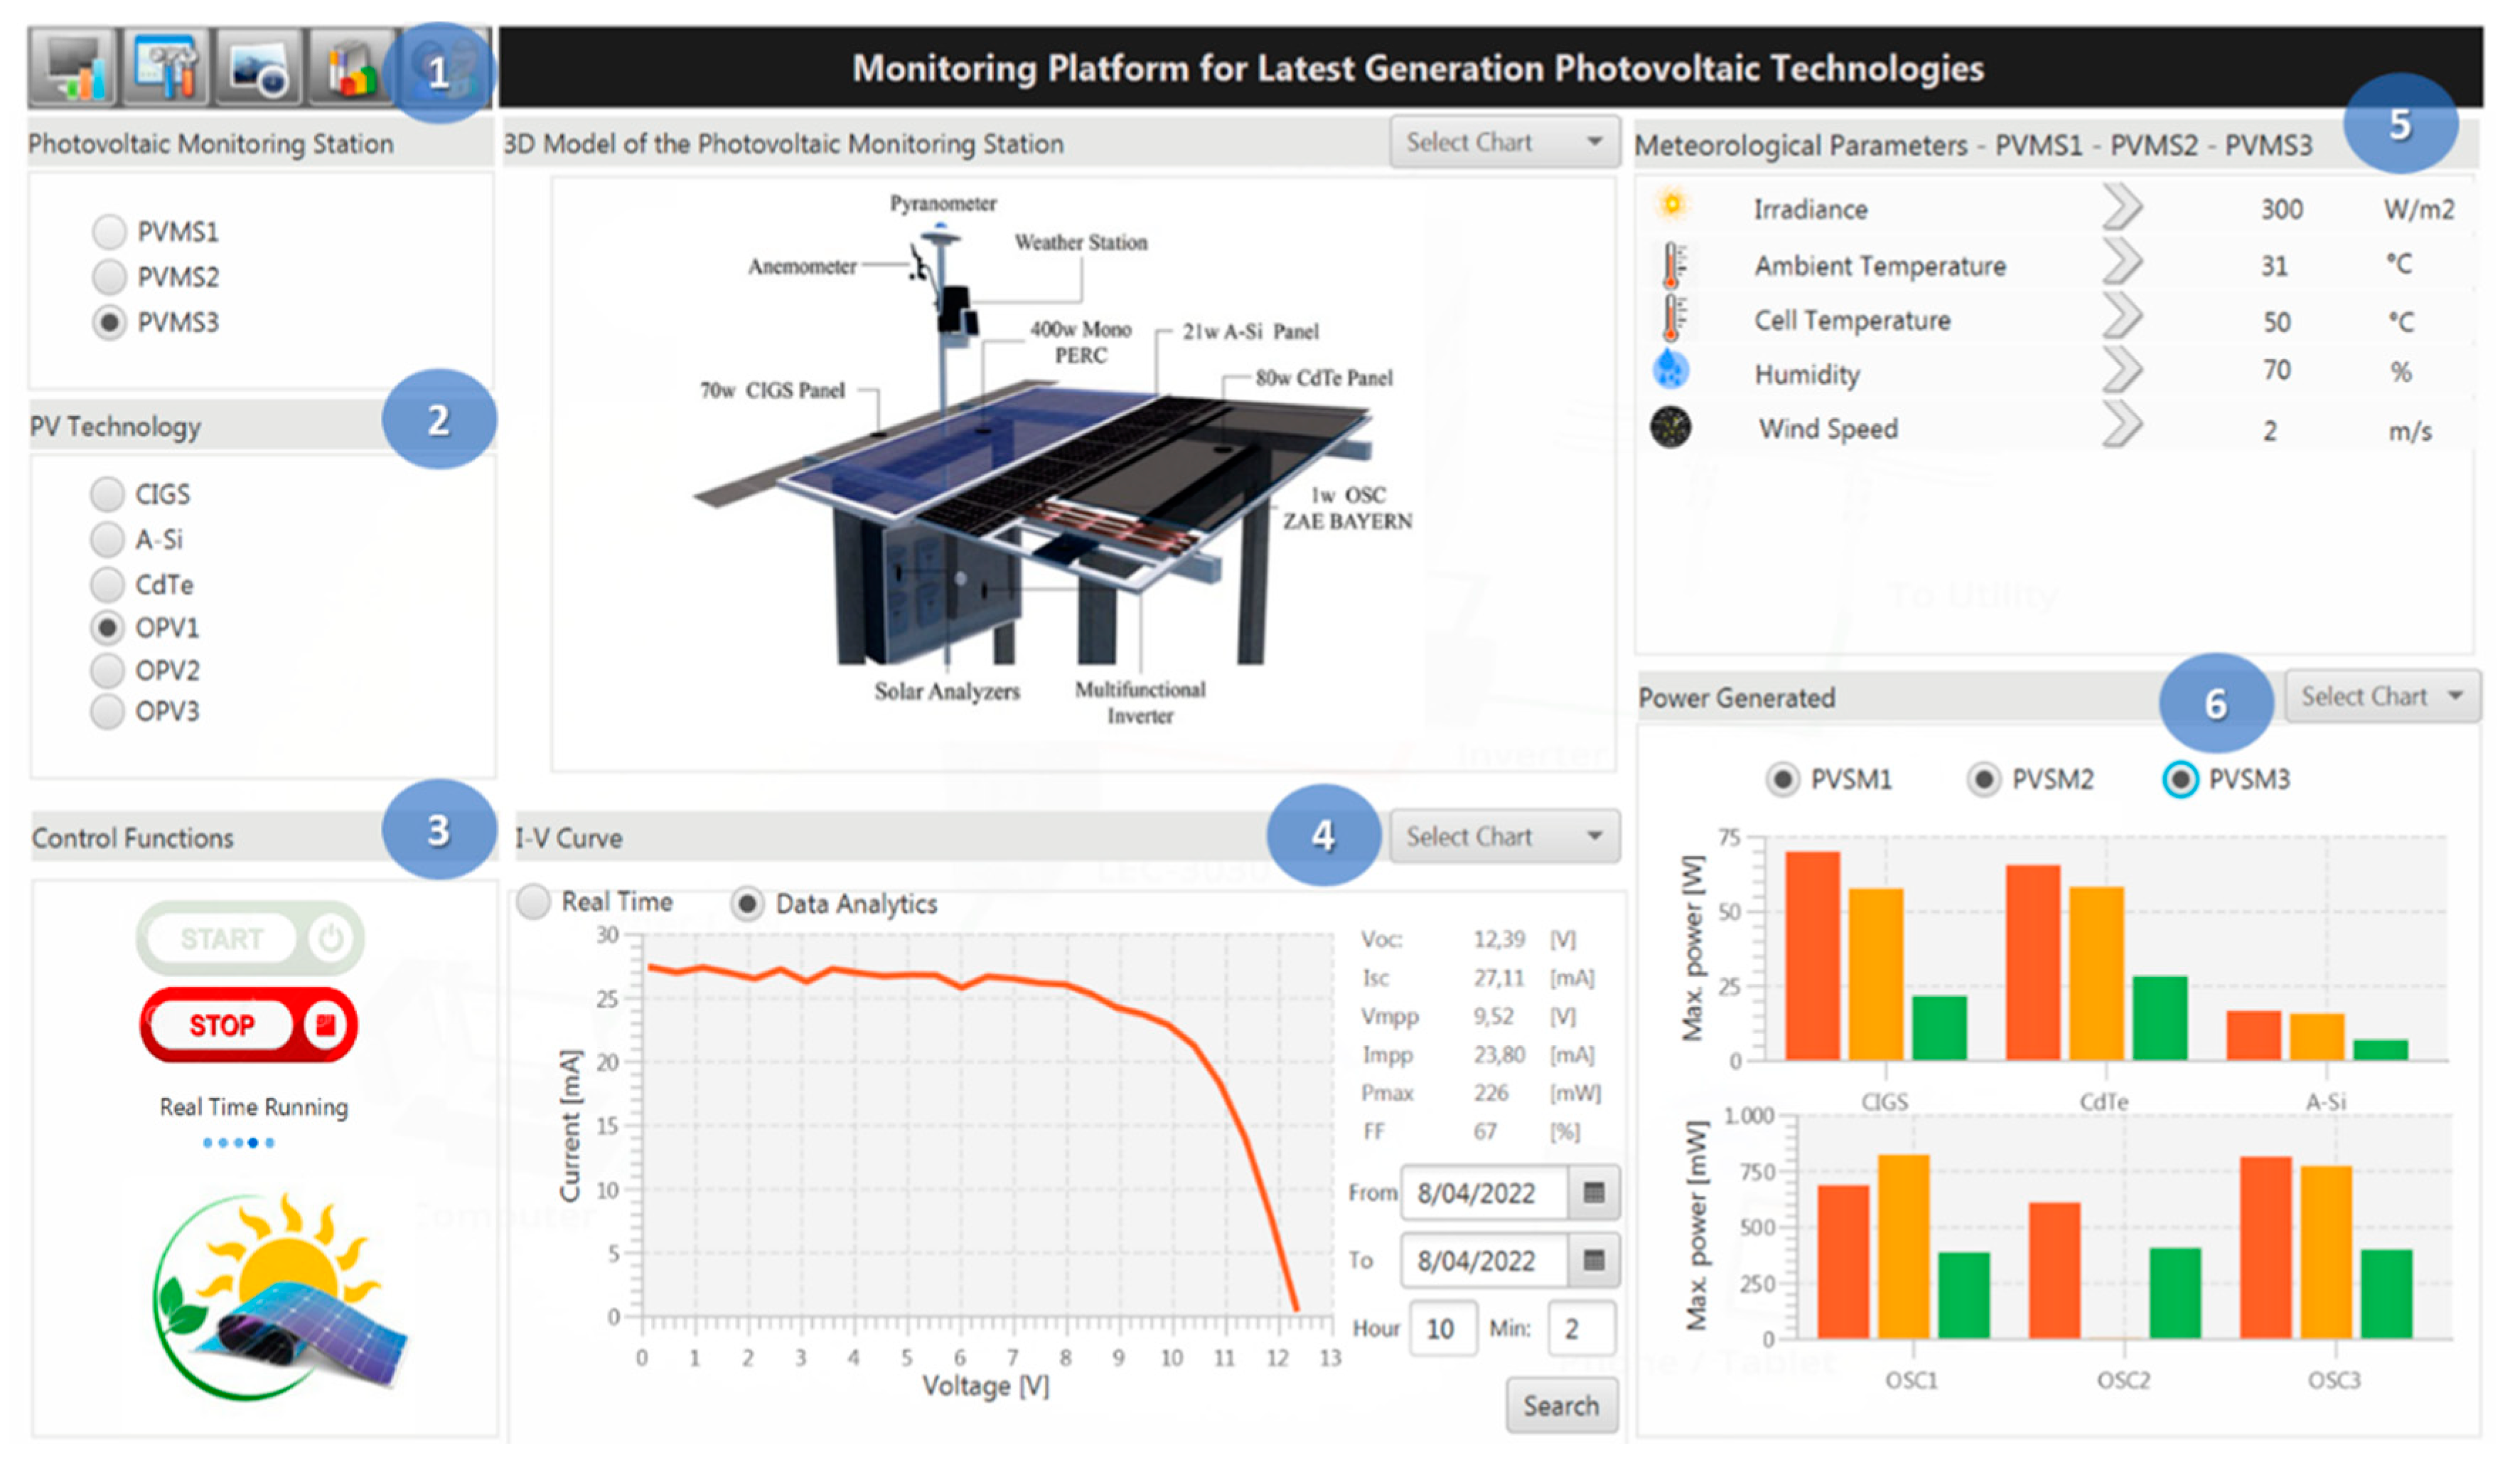
  • Data Integration Procedure performs two functions: (a) capture the temporal data and verify if these are synchronized at the date and time, and (b) integrate the synchronized data over one CSV file. In this case, the weather station, IPHU, and PV analyzers must be synchronized using the NTP server; otherwise, the data are discarded.
  • Data Transmission/Storing Procedure performs two functions: (a) establish the communication between IPHU and the central server, and (b) store the data over internal memory or an external hard disk when there is no internet access for PVMS installed in remote areas.
  • Diagnostic Procedure performs two functions: (a) restart IPHU when there are failures or start it in the morning, that is, reboot IPHU and the PV analyzers, and (b) register the IPHU events for diagnostic and update purposes.

2.2. Development of the Software User Interface

The user interface was designed using four windows to display the PV and meteorological parameters and I-V and P-V curves of the PV technologies. These windows are described as follows:
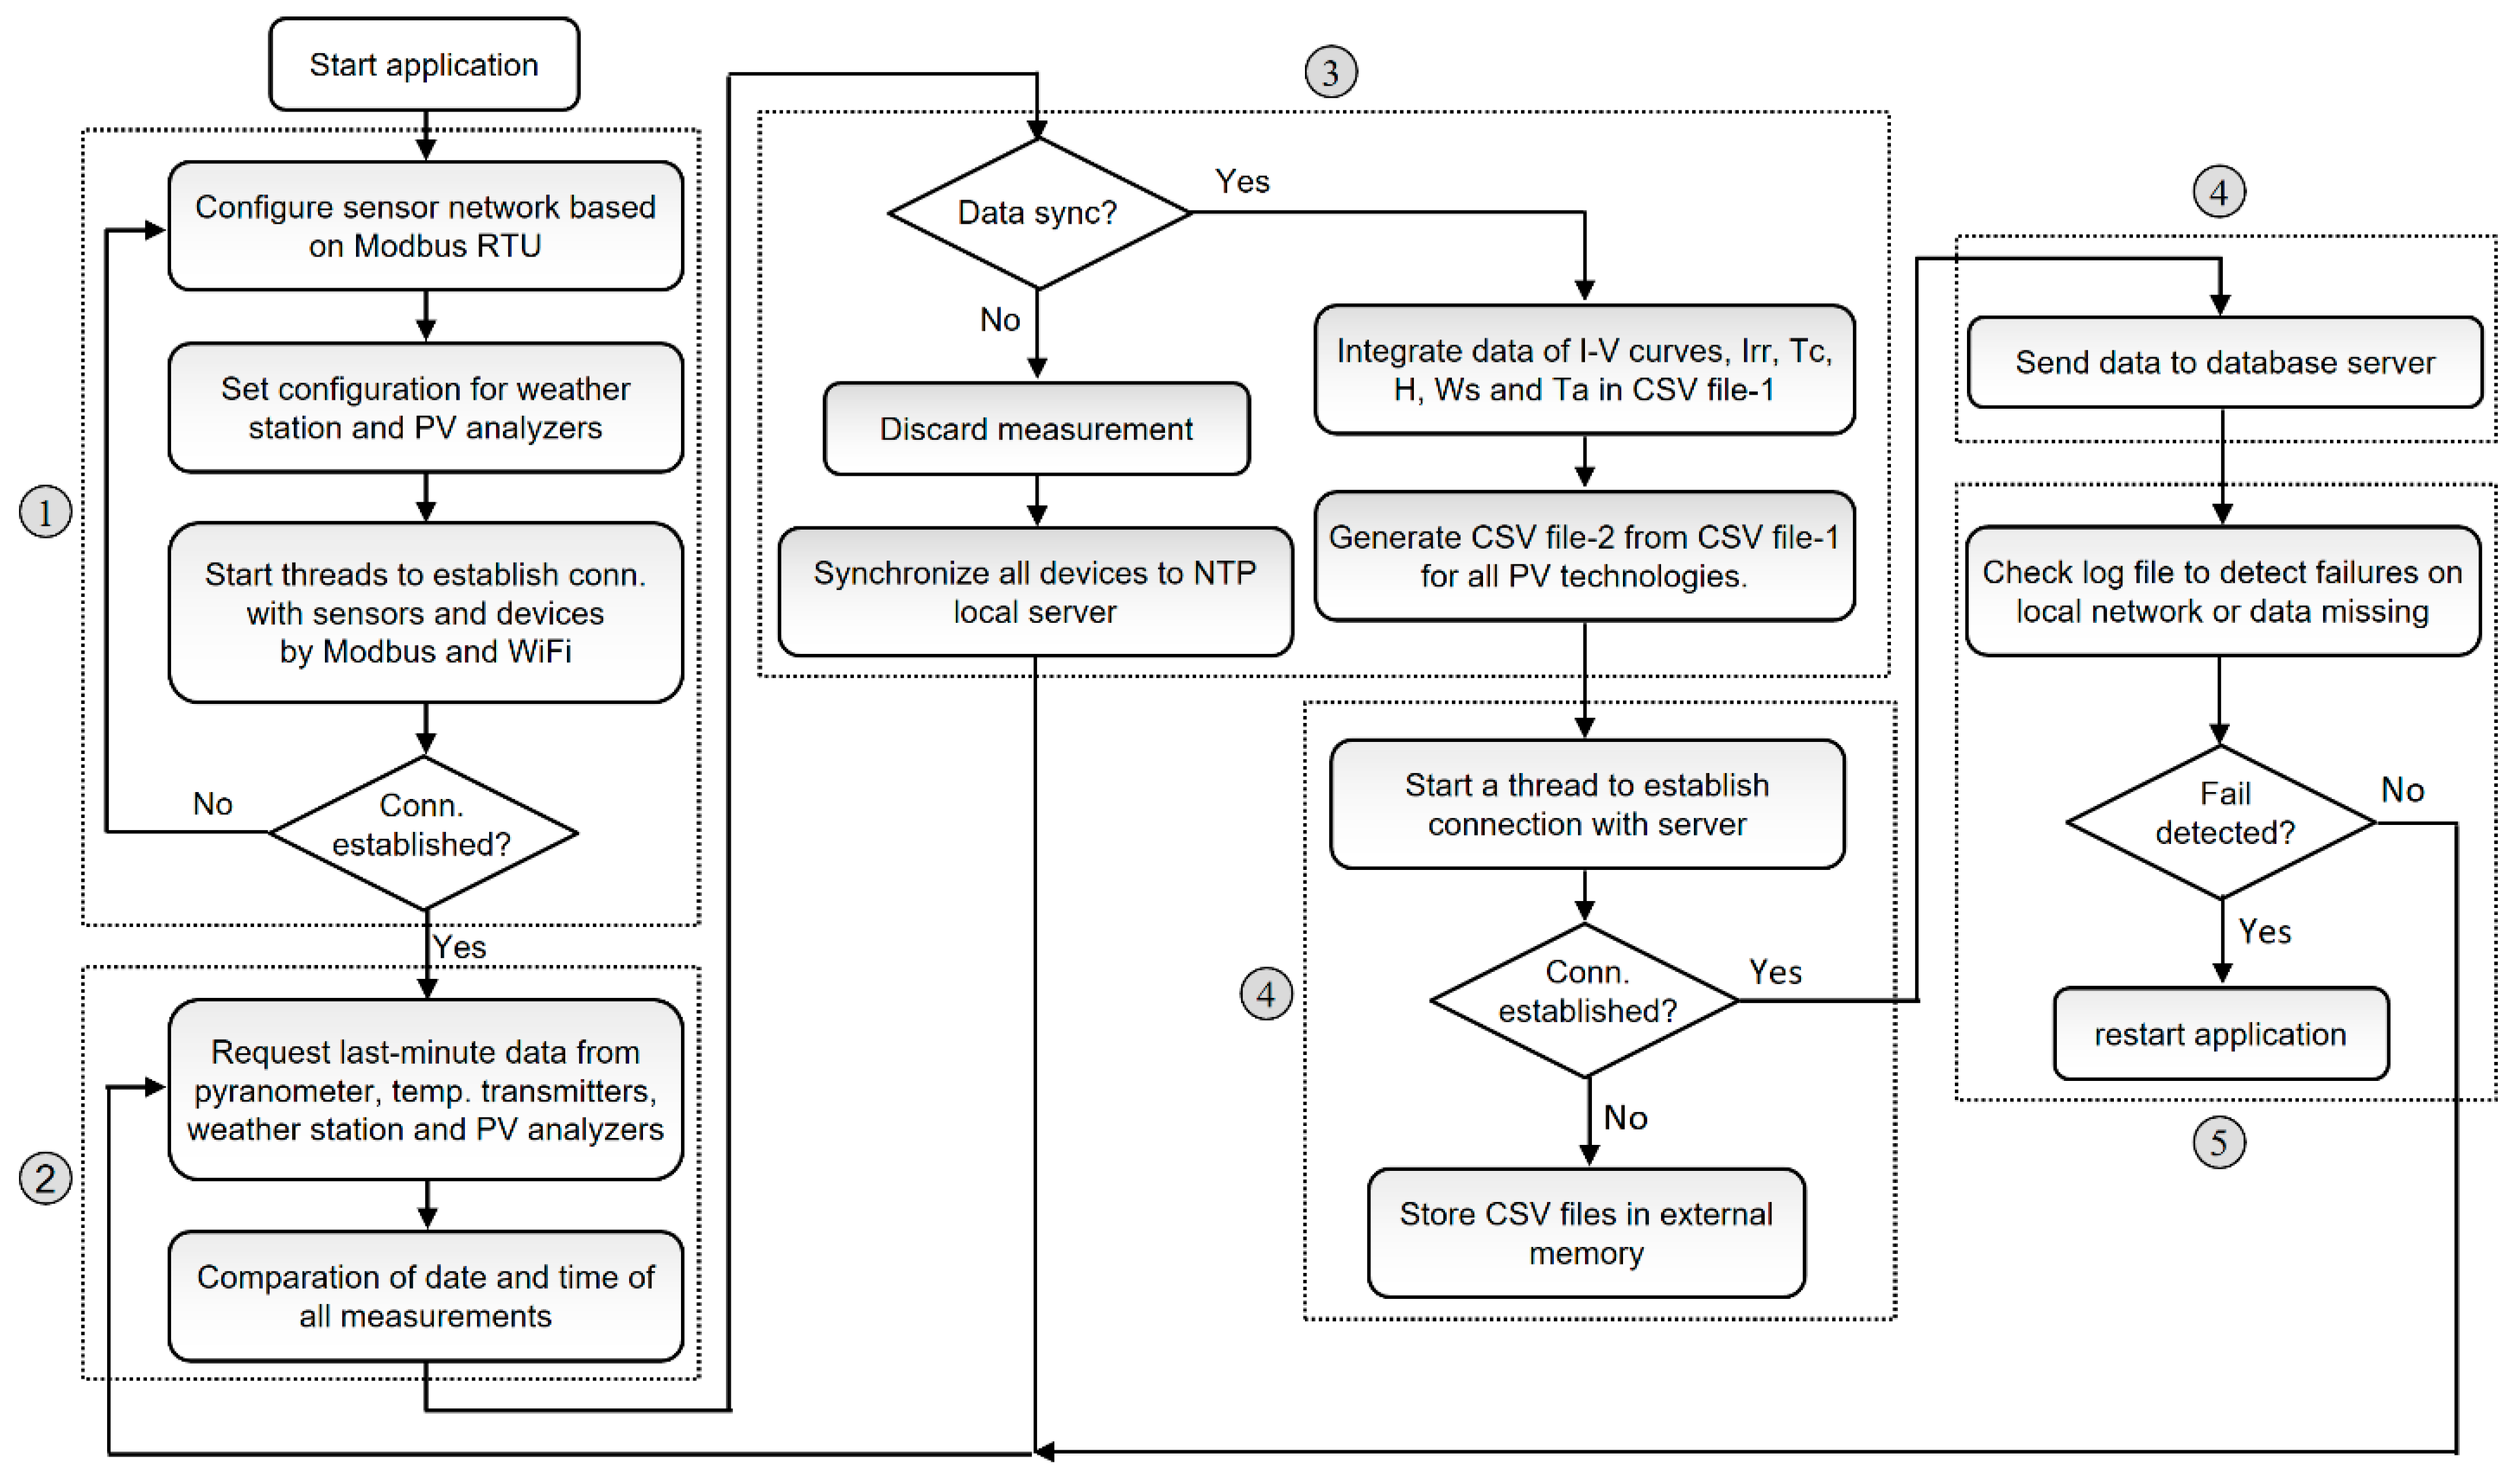
  • Main Window displays historical and real-time data obtained from the database server, and it contains five sections, as shown in Figure 3: (1) Bar menu allows accessing the other windows and sets the user interface. (2) Dropdown menu allows selecting the PVMS and PV technology for display. (3) Control functions (start and stop) for real-time monitoring. (4) Curves display allows selecting the I-V or P-V real-time curves. (5) Meteorological parameters display shows the values of the meteorological parameters in real-time for the selected PVMS, and (6) power-generated display shows the maximum power generated by each PV technology in real-time from the selected PVMS.
  • Log-in Window allows log-in to the platform as a guest or administrator. The administrator mode enables advanced functions such as power system backup configuration, monitoring errors and failures, remote restart, and software updating.
  • PVMS Configuration Window allows setting the IP addresses of the measuring equipment and configuring the SSH communication between IPHU and PV/OPV analyzers.
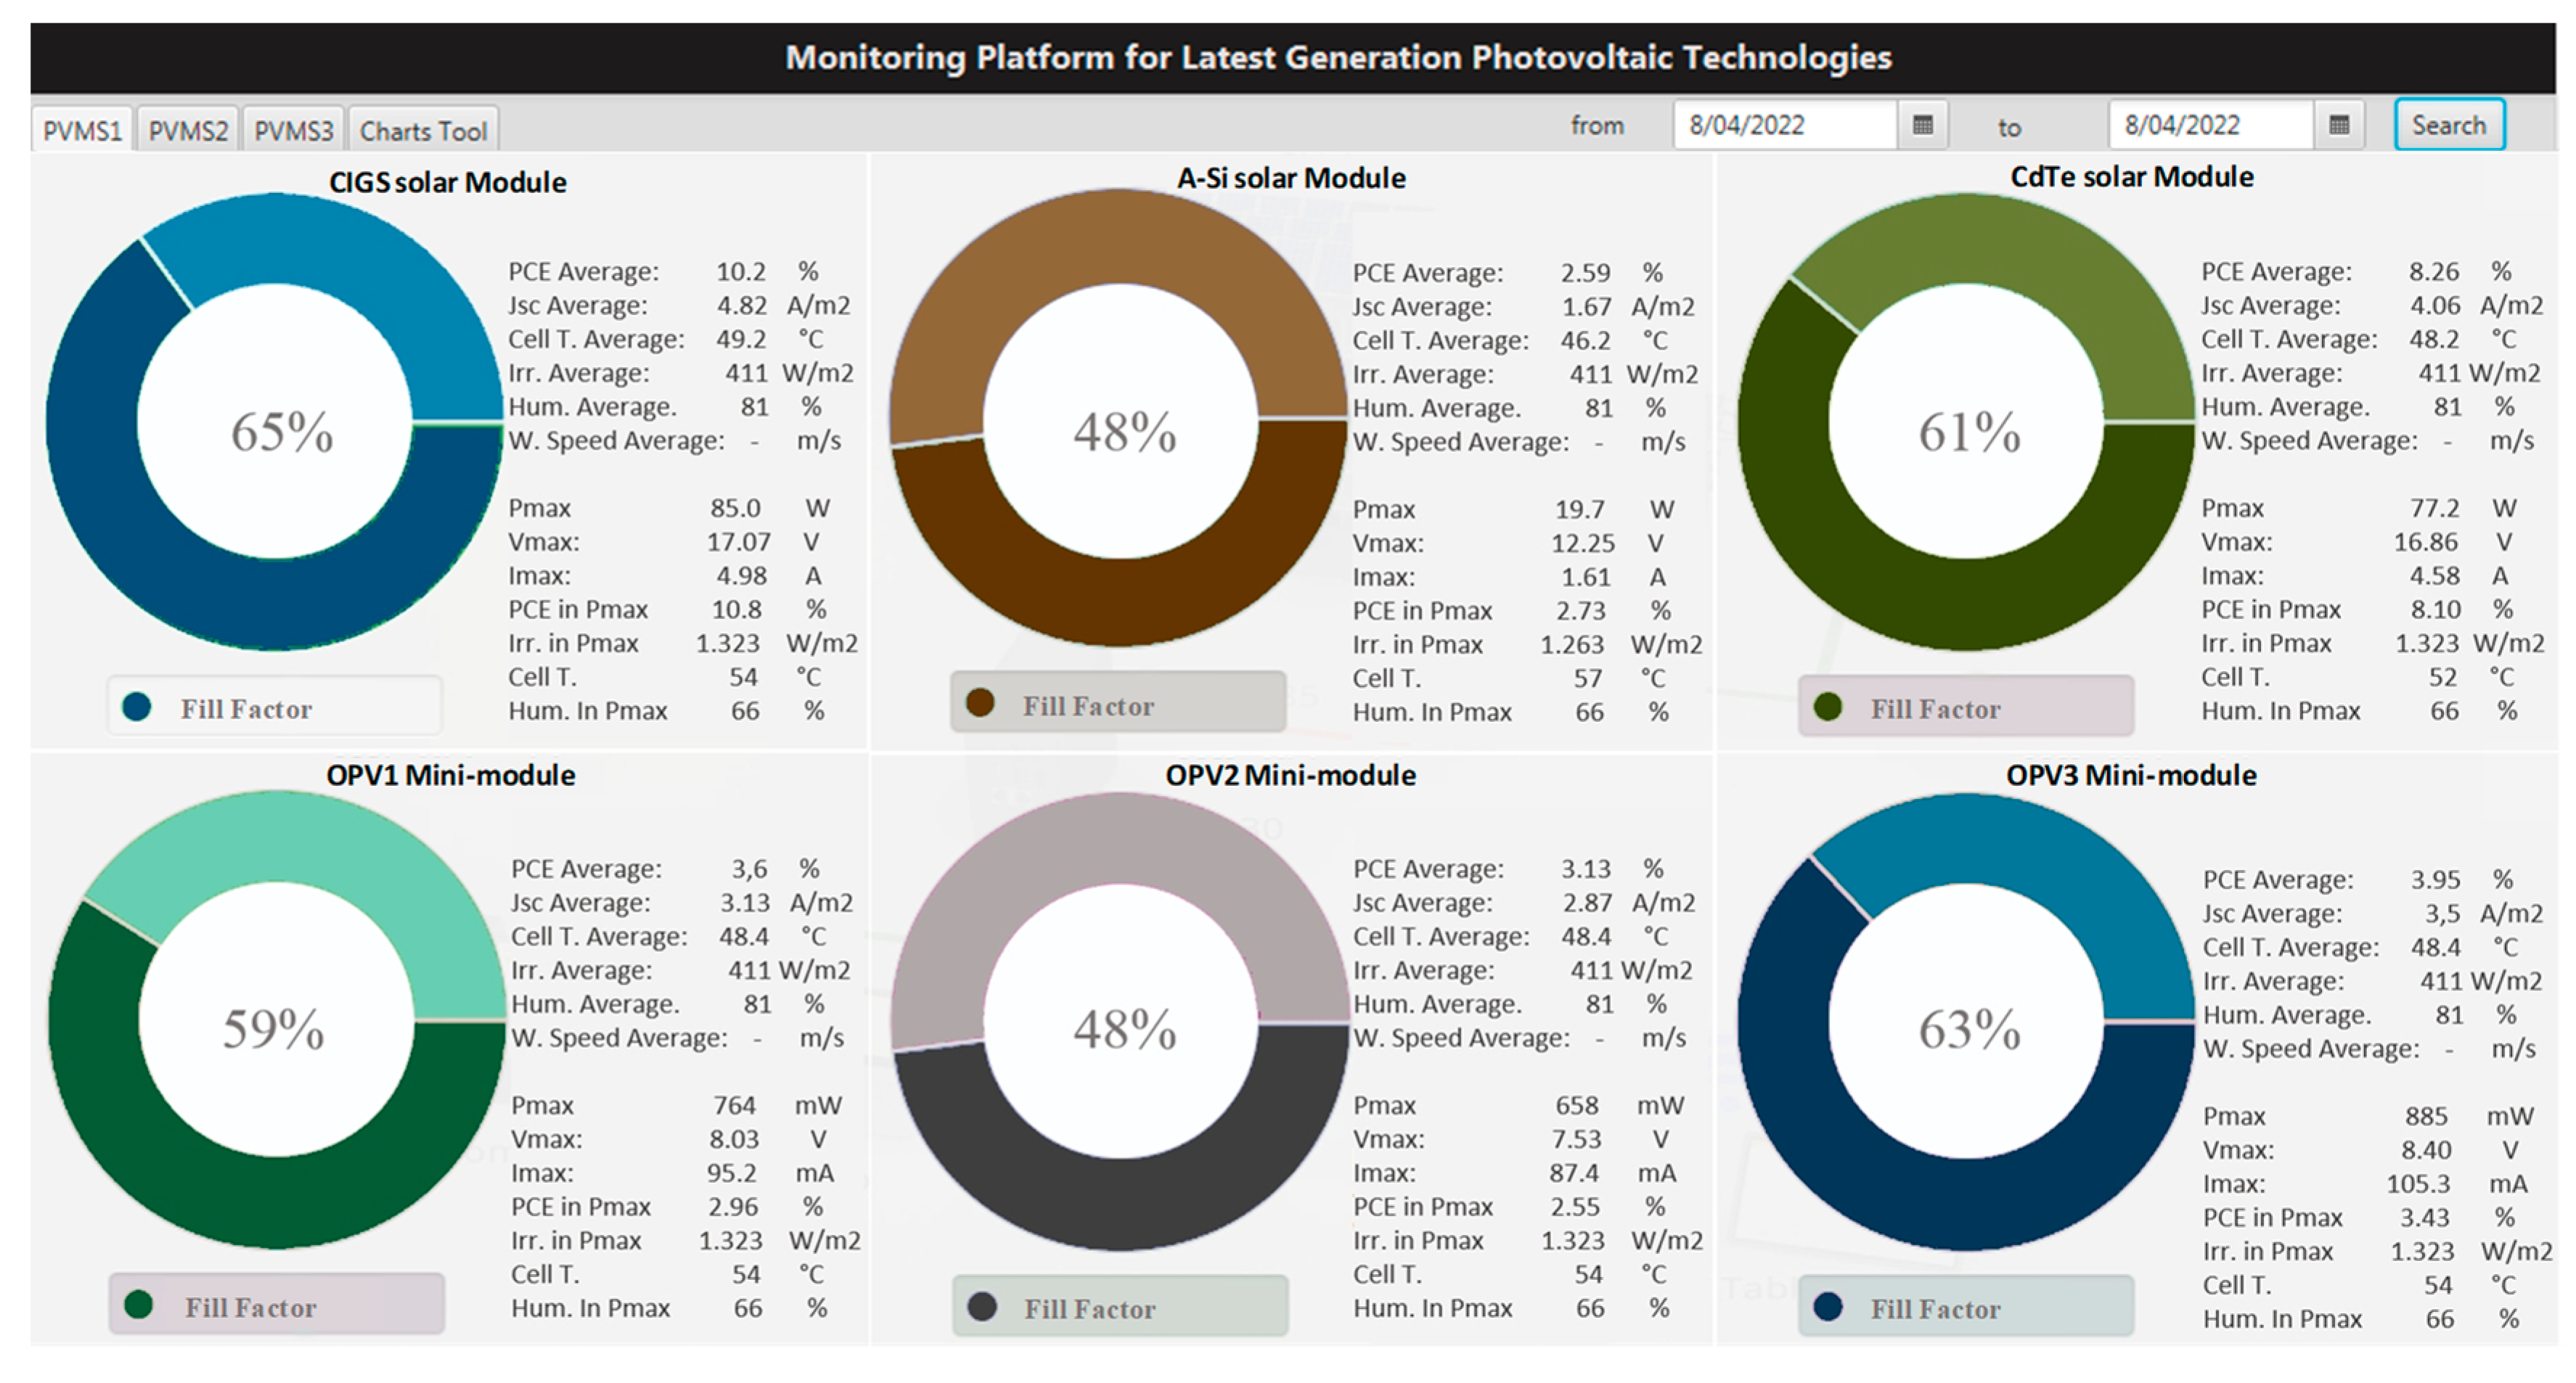
  • Data Report Window allows displaying the report on the performance of PV technologies during a specific time range (days, months, or years), using a date search function. This window presents the average values of all PV and meteorological parameters in the same time range and the average FF calculated using a pie chart, as shown in Figure 4.

2.3. Dataset Recording and Verification Tests

The dataset recording test was carried out to verify the data recorded for two months (1 March 2022 to 30 April 2022). For the case of a sunny day (from 6 am to 6 pm), the IPHU device must record each minute, the I-V curves, and photovoltaic and meteorological parameters, generating the CSV file-1 for each technology, that is, ~760 CSV files during a day and ~4560 CSV files for all technologies. For the case of a full or partially cloudy day, the dataset record is minor because some CVS files are not generated due to lower irradiance.
The verification test is oriented to validate the correct functionality of each PVMS using the CSV file-2 generated from CSV file-1. It contains the most relevant data on the photovoltaic and meteorological parameters for each day, as shown in Table 2. From the CSV file-2, it is possible to detect errors by comparing the measured parameters versus the typical values for a range of irradiancies, that is, the detection indirectly of errors in the I-V curves, damage in the electrical connections, or shadows on the solar panels and mini-modules during the hours of sun. Furthermore, it is possible to evaluate the performance and degradation of PV technologies in the uncontrolled environment of outdoor characterization.

2.4. Outdoor Characterization Tests

The outdoor characterization tests are performed to verify the correct functionality of the PVMSs. This verification is carried out by comparing some measured parameters for PV technologies and the parameters provided by the manufacturers. In this case, the following is done:
  • Record the PV and meteorological parameters at each PVMS for one day.
  • Select PV parameters for an associate irradiance close to 1000 W/m2.
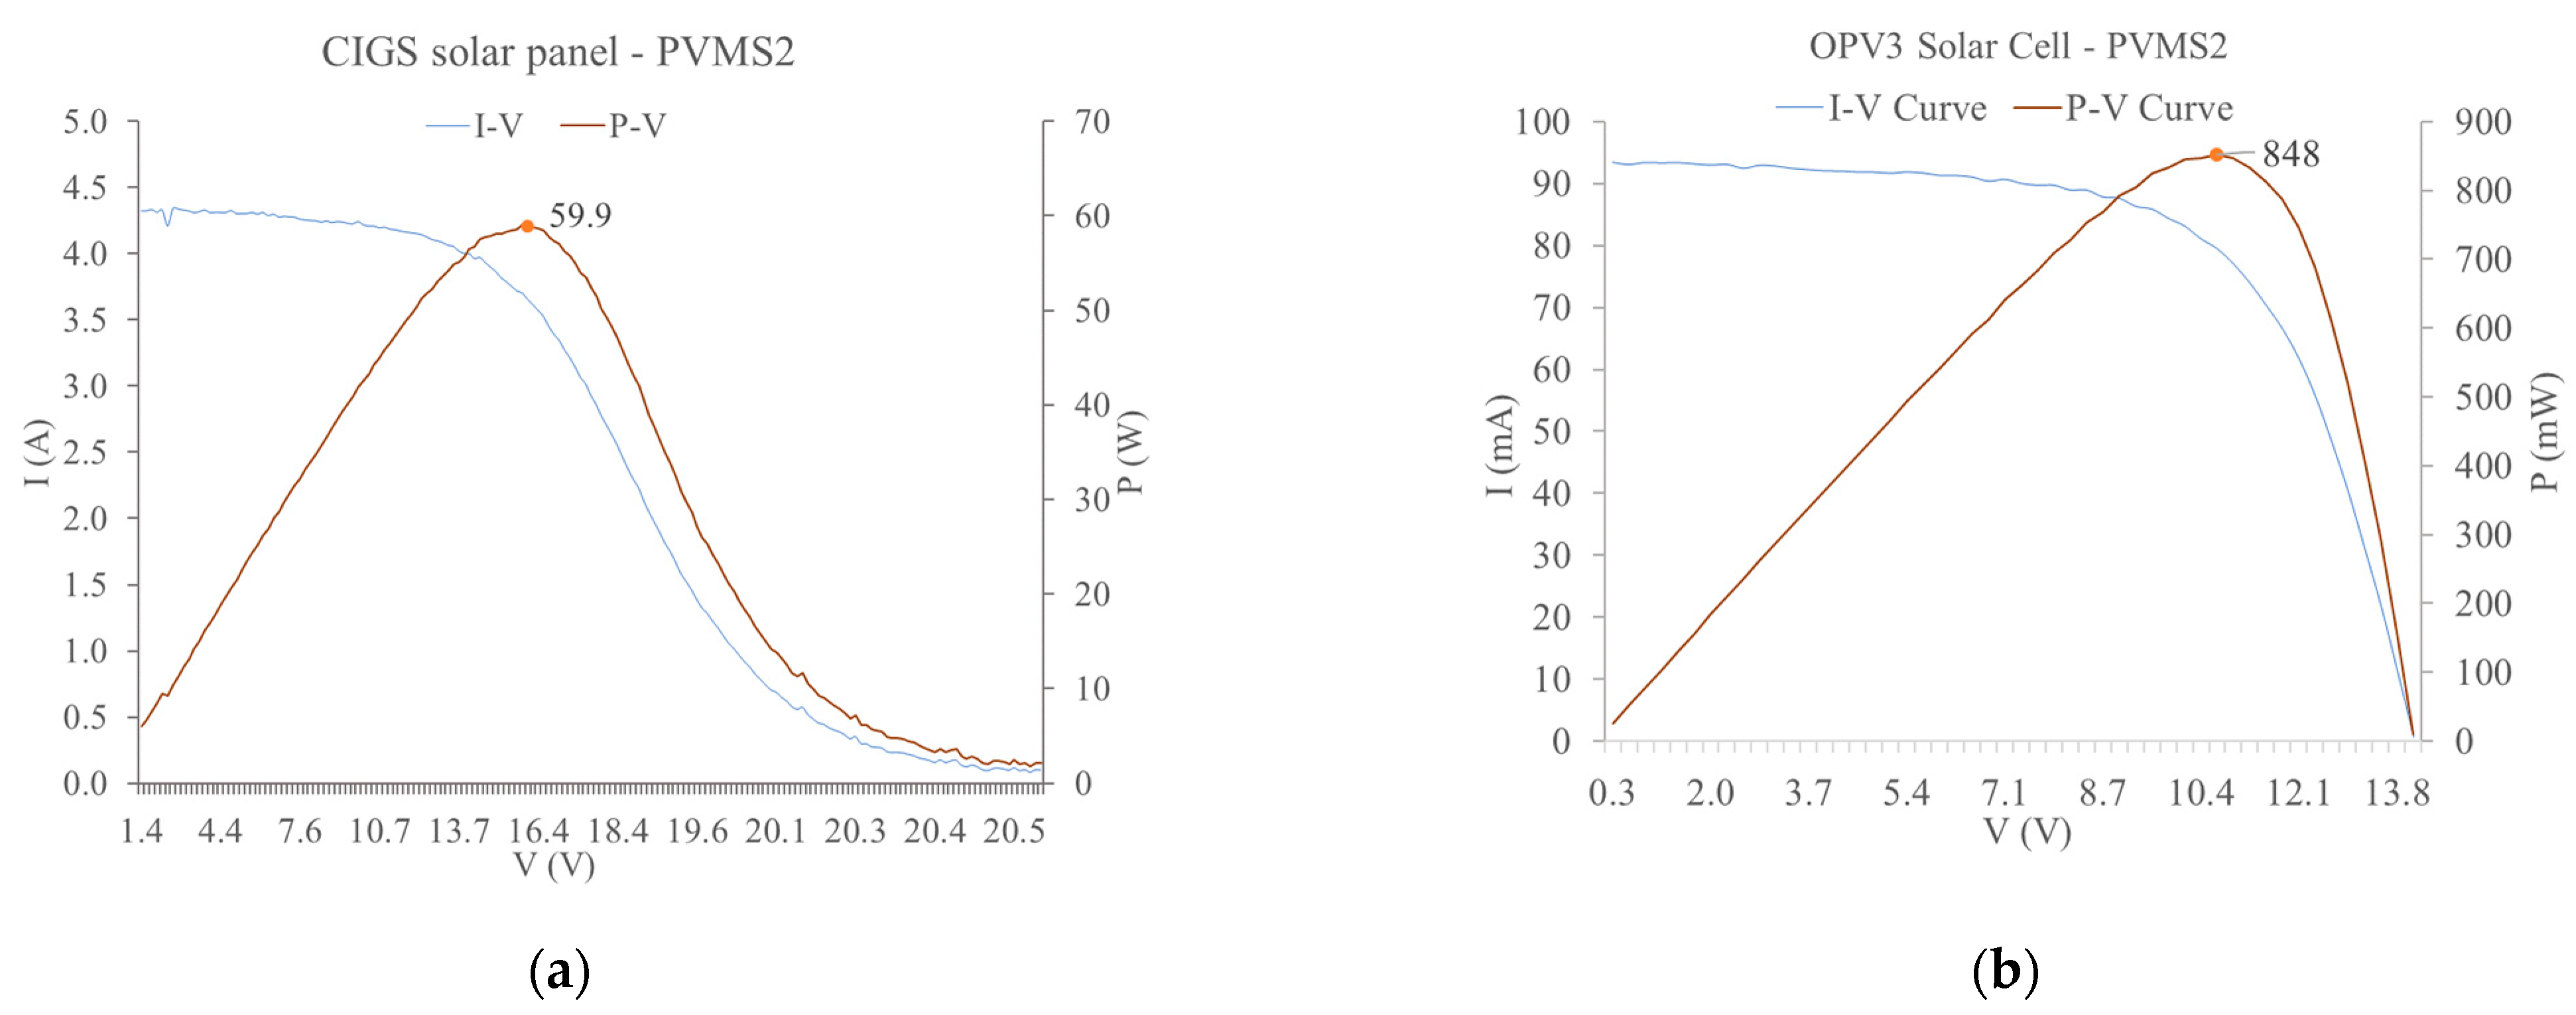
  • Trace the I-V curves for the flexible CIGS and OPV modules placed in PVMS1, as is shown in Figure 5.
  • Obtain the values of open-circuit voltage (Voc), short circuit current (Isc), maximum voltage (Vmpp), and maximum current (Impp) from the I-V curves.
  • Graph the calculated P-V curve for the selected technologies from the I-V curves and the calculated maximum power (Pmax).
  • Compare the above obtained and calculated values with the ones provided by the manufacturers.
It is essential to mention that there is a slight difference between the PV parameters measured and those provided by the manufacturer, although the test conditions are different. For example, for the flexible CIGS module, the Voc and Isc values provided by the manufacturer under STC are 23.2 V and 4.67 A, while the values measured under an uncontrolled environment are 21.58 V and 4.51 A.
In order to compare and verify the validity of the I-V curves and photovoltaic parameters registered by the platform, some validation tests were carried out using the PROVA 210 Solar analyzer, which is a commercial portable solar analyzer with a resolution of 10 mV and accuracy of ±1% ± (1% of Voc ± 0.09 V) in the range of 10 to 60 V, and resolution of 1 mA and accuracy of ± 1% ± (1% of Isc ± 9 mA) in the range of 1 to 6 A. I-V curves and PV parameters were acquired for PV technologies using the PROVA 210 analyzer and the PVMS2 in the presence of high, medium, and low irradiances. Figures S5–S10 of Supplementary Information allow comparing the I-V curves and PV parameters captured for the CdTe panel (see Table S2 of Supplementary Information). Table 3 shows the percent error found for each PV parameter measured in PVMS2 with respect to PV parameters measured with the PROVA 210 analyzer.
It is worth mentioning that the PV solar panel analyzers were previously calibrated and verified using Tektronix PWS2185 DC Power Supply 0–18 V, 5 V, a BK Precision DC Regulated Power Supply 1671A, and a Tektronix DDM 4020 5-1/2 Digit Multimeter. Section S4 of Supplementary Information shows the results of the validation process of voltage and current measurements of the PV solar panel analyzer.

3. Results and Discussion

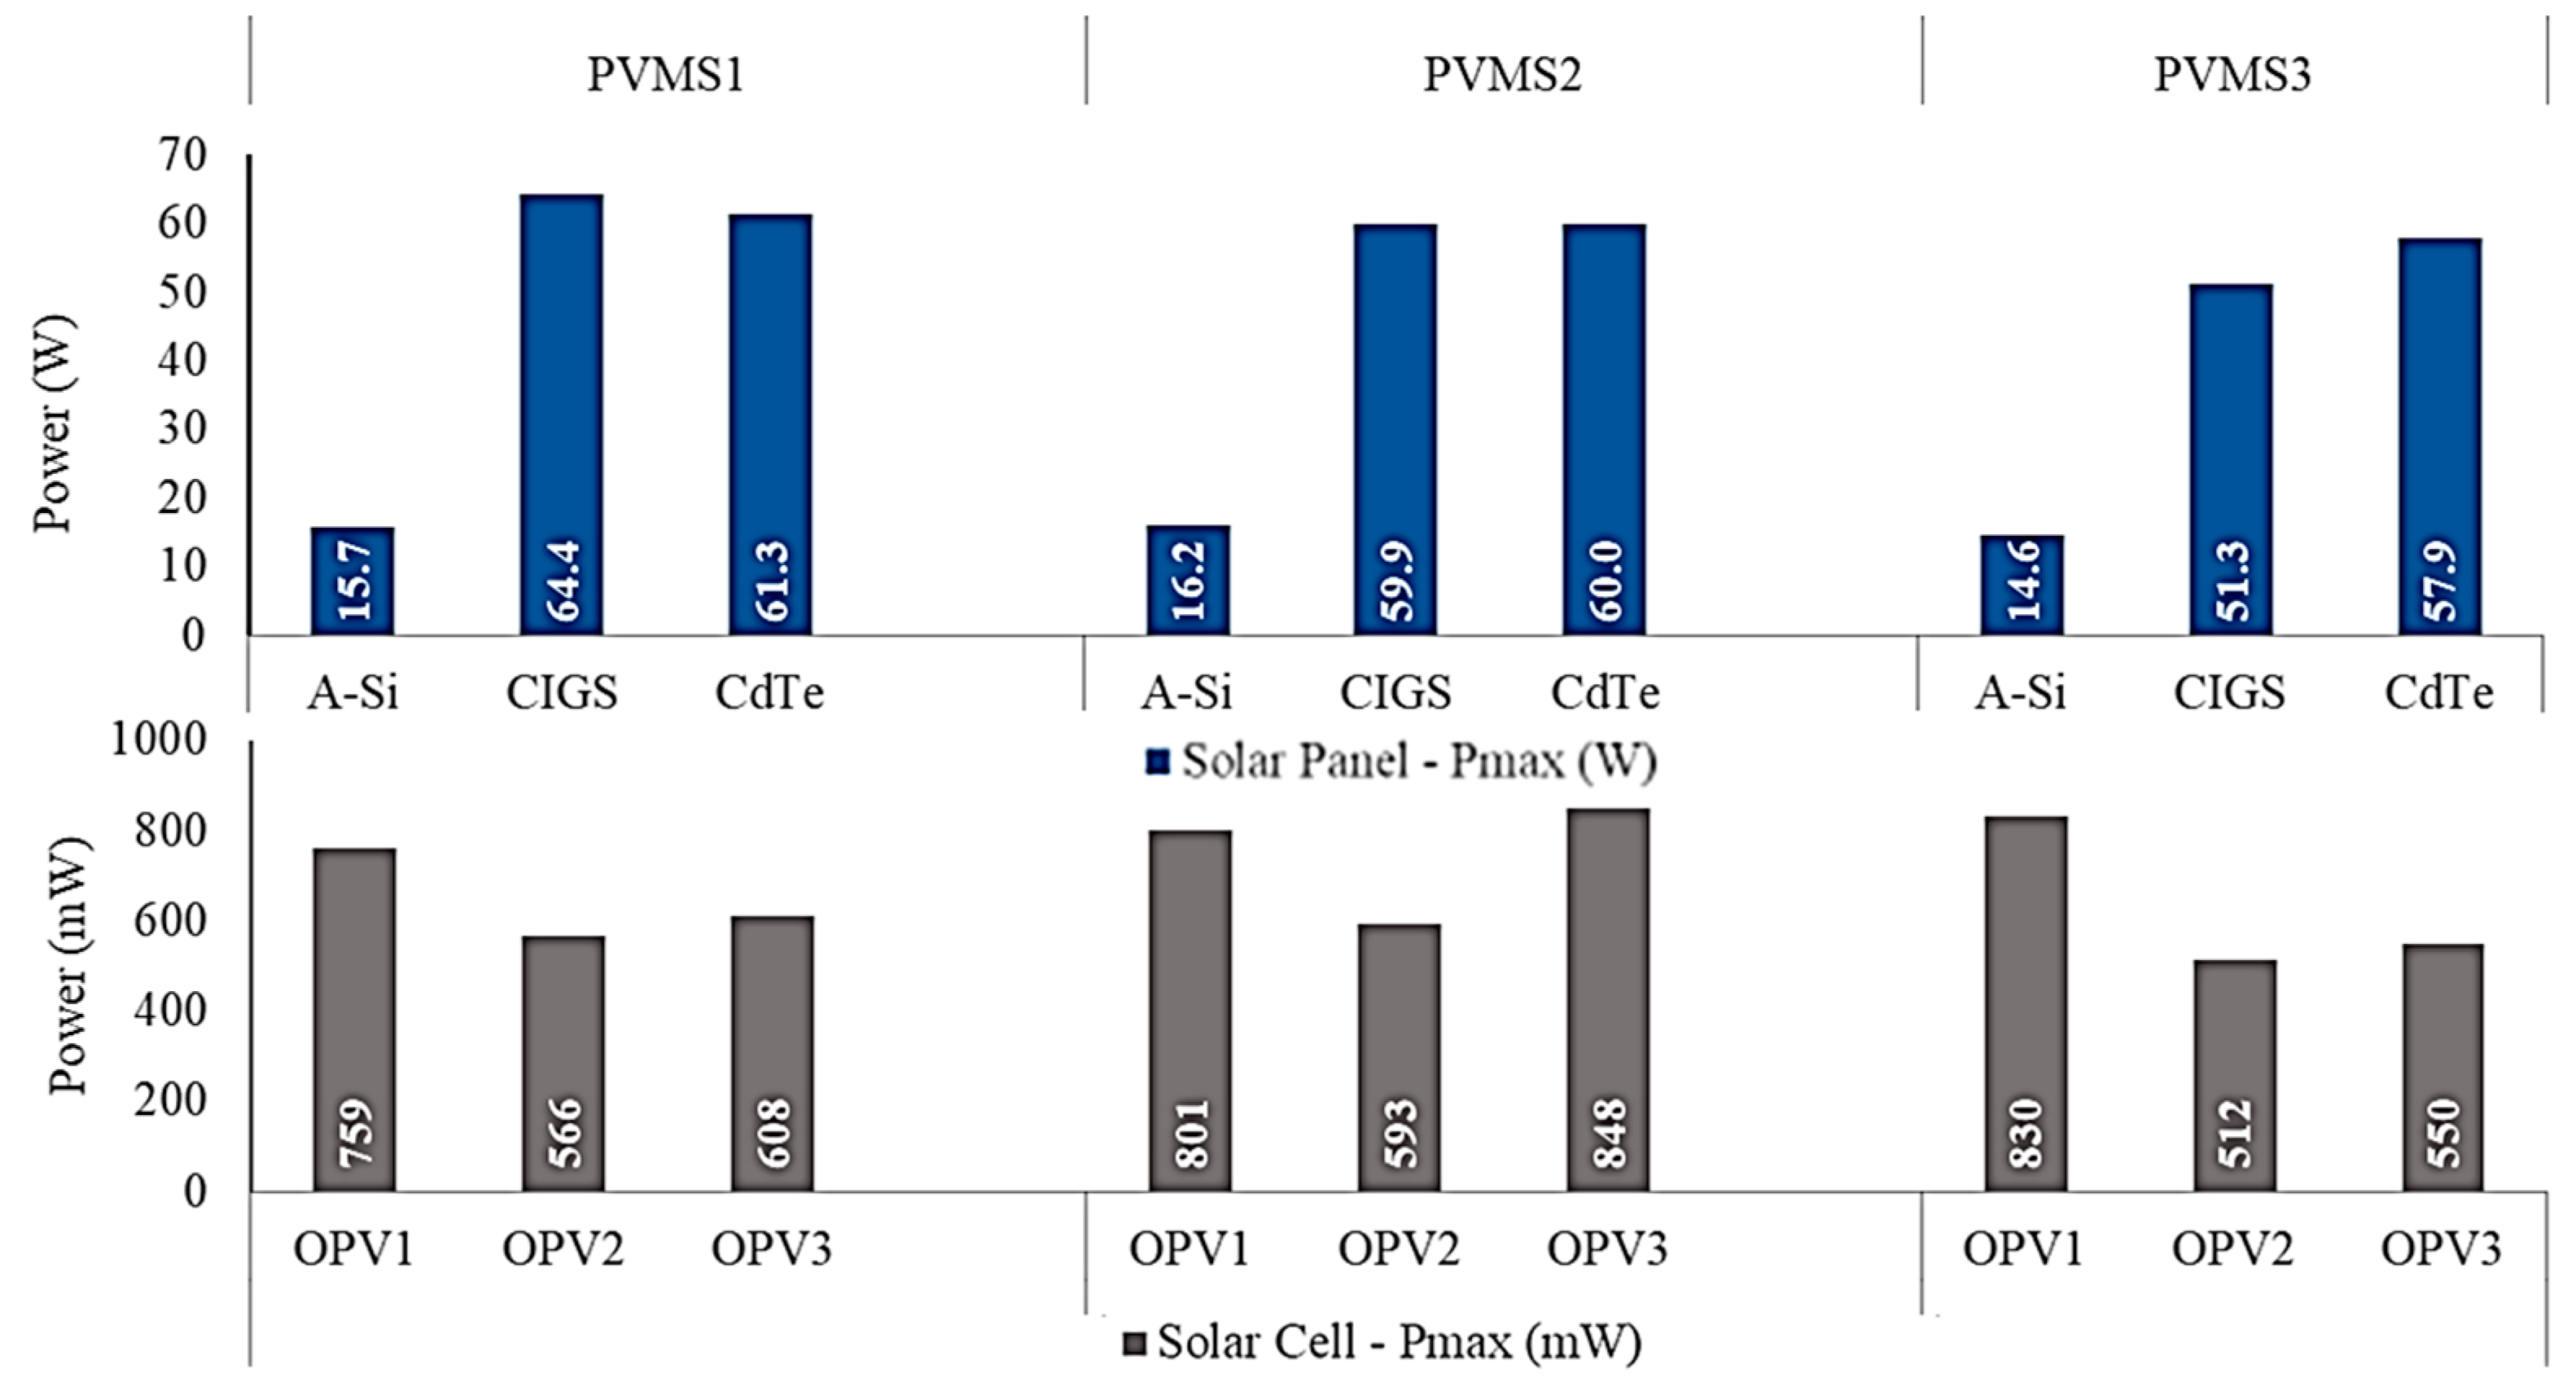
3.1. Results of Maximum Power Generated

The obtained results are used to compare the maximum power generated by each PV technology in each PVMS for an irradiance value of 1033 W/m2, which is close to the one established by STC (1000 W/m2), as shown in Figure 6. The PV parameters were measured at different times, and a filter was required to obtain the selected irradiance from the dataset.
Figure 7 shows slight differences in the maximum power values generated for the same PV/OPV technology in each PVMS, which may be due to the dust and the solar cell temperature affecting the efficiency. However, the OPV3 mini module presents a significant difference due to an encapsulation defect or damage during its installation.

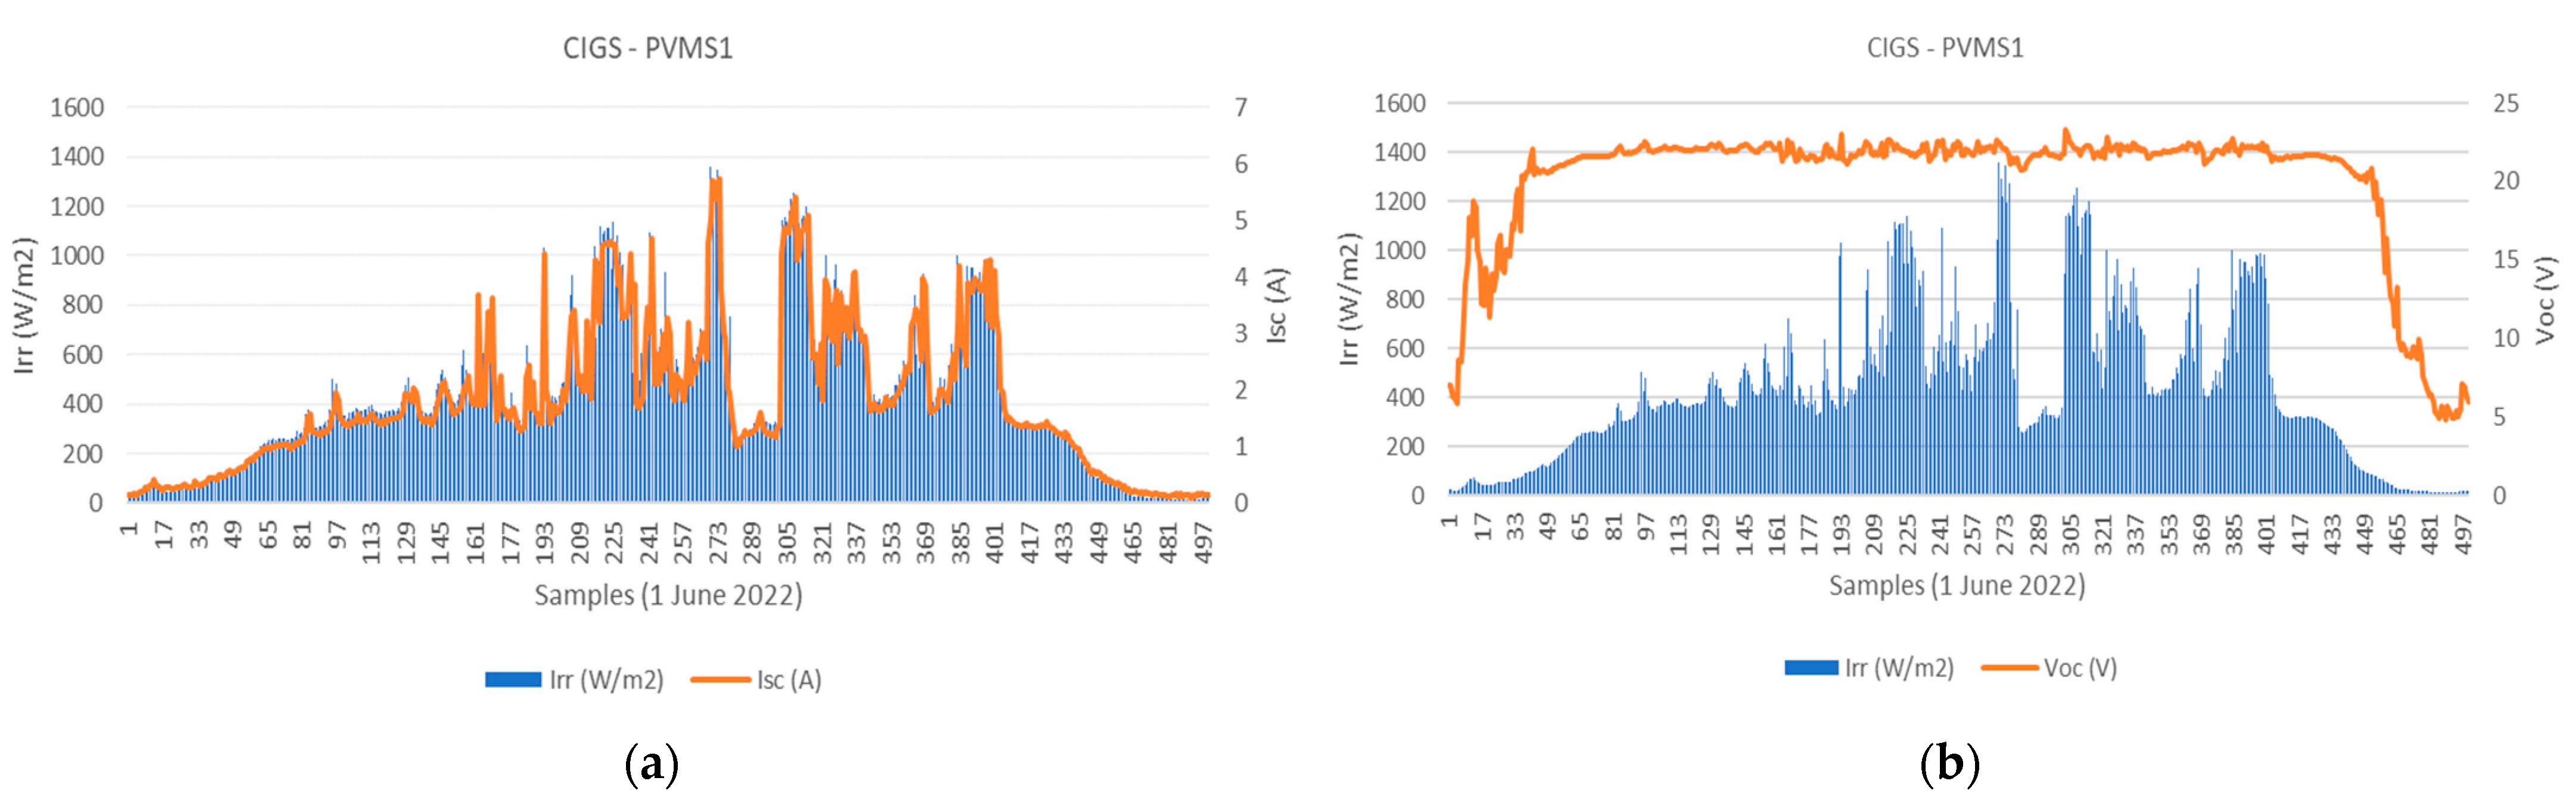
3.2. Analysis of Isc and Voc with Respect to Irr

Figure 7a shows the direct relation between Irr and Isc measured during a sunny day for the CIGS technology. From this figure, it can be observed that Isc depends on Irr. In contrast, the relation between Irr and Voc is relatively invariant throughout the day, except when the irradiance is very low at the beginning and end of the day, as seen in Figure 7b.

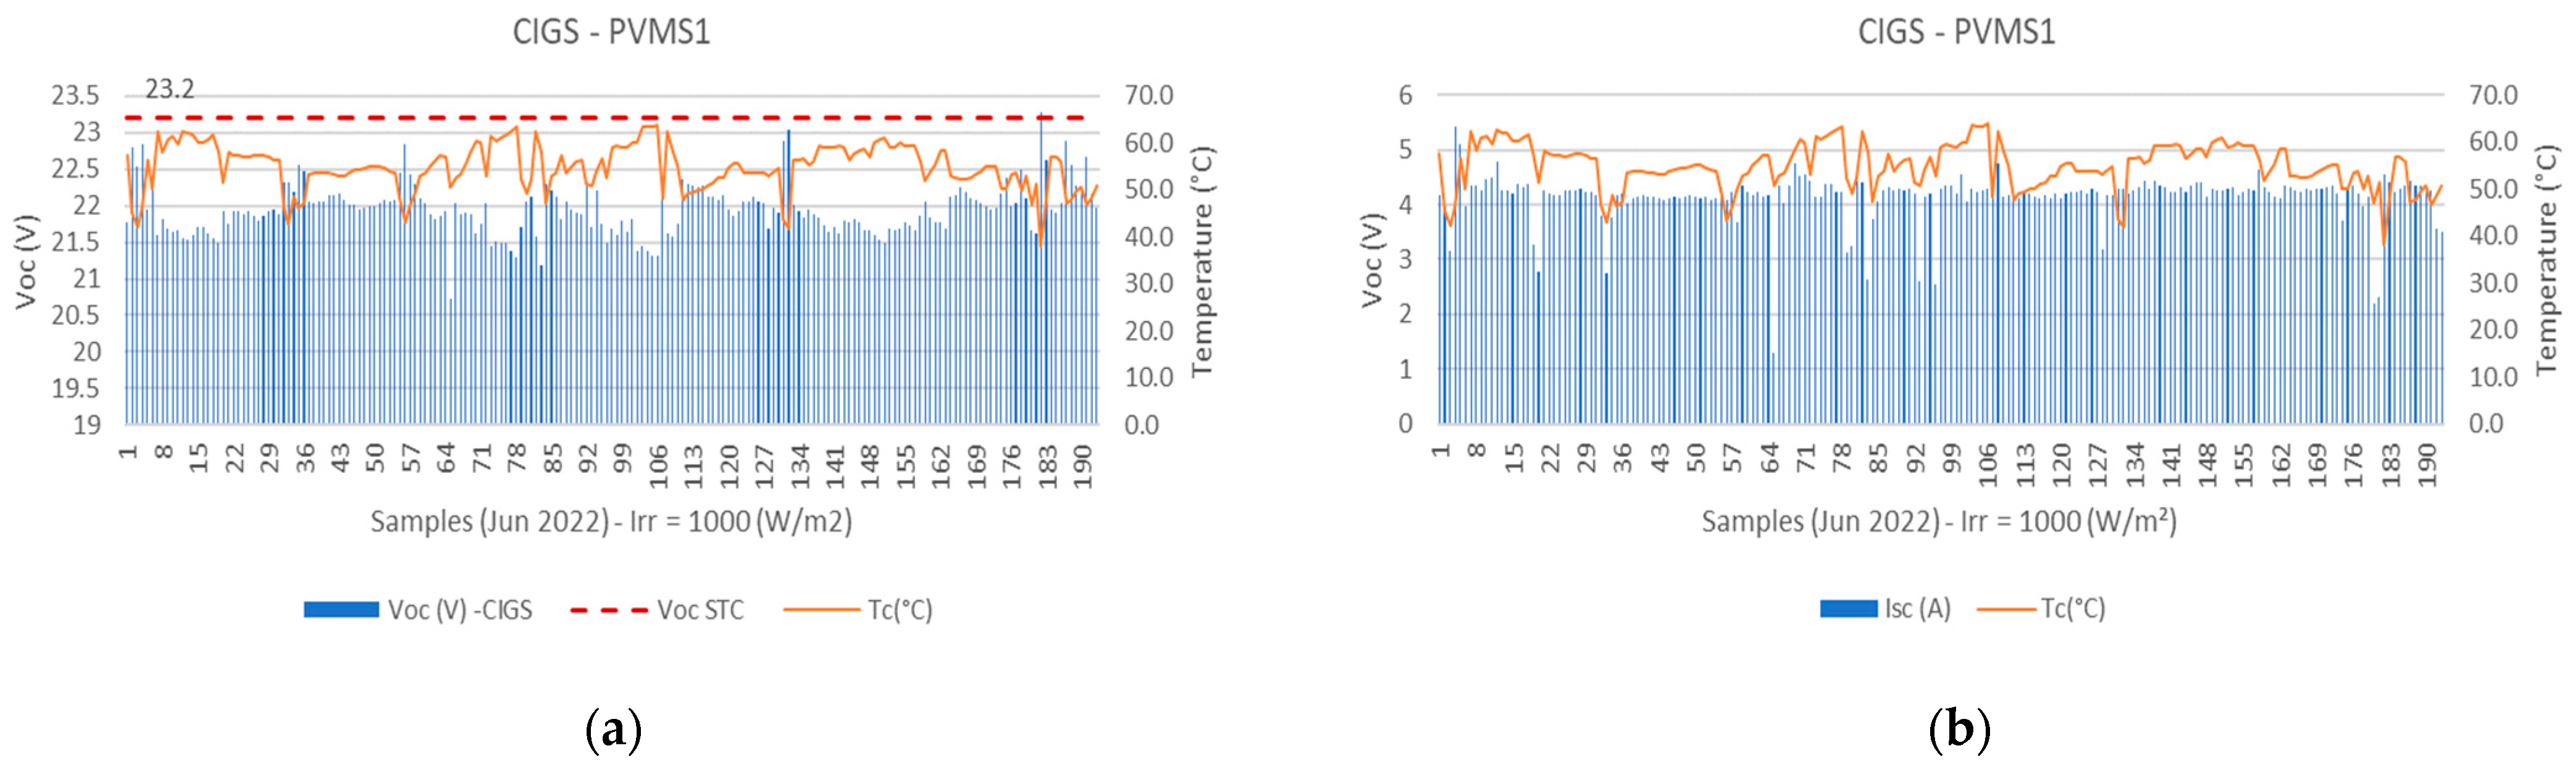
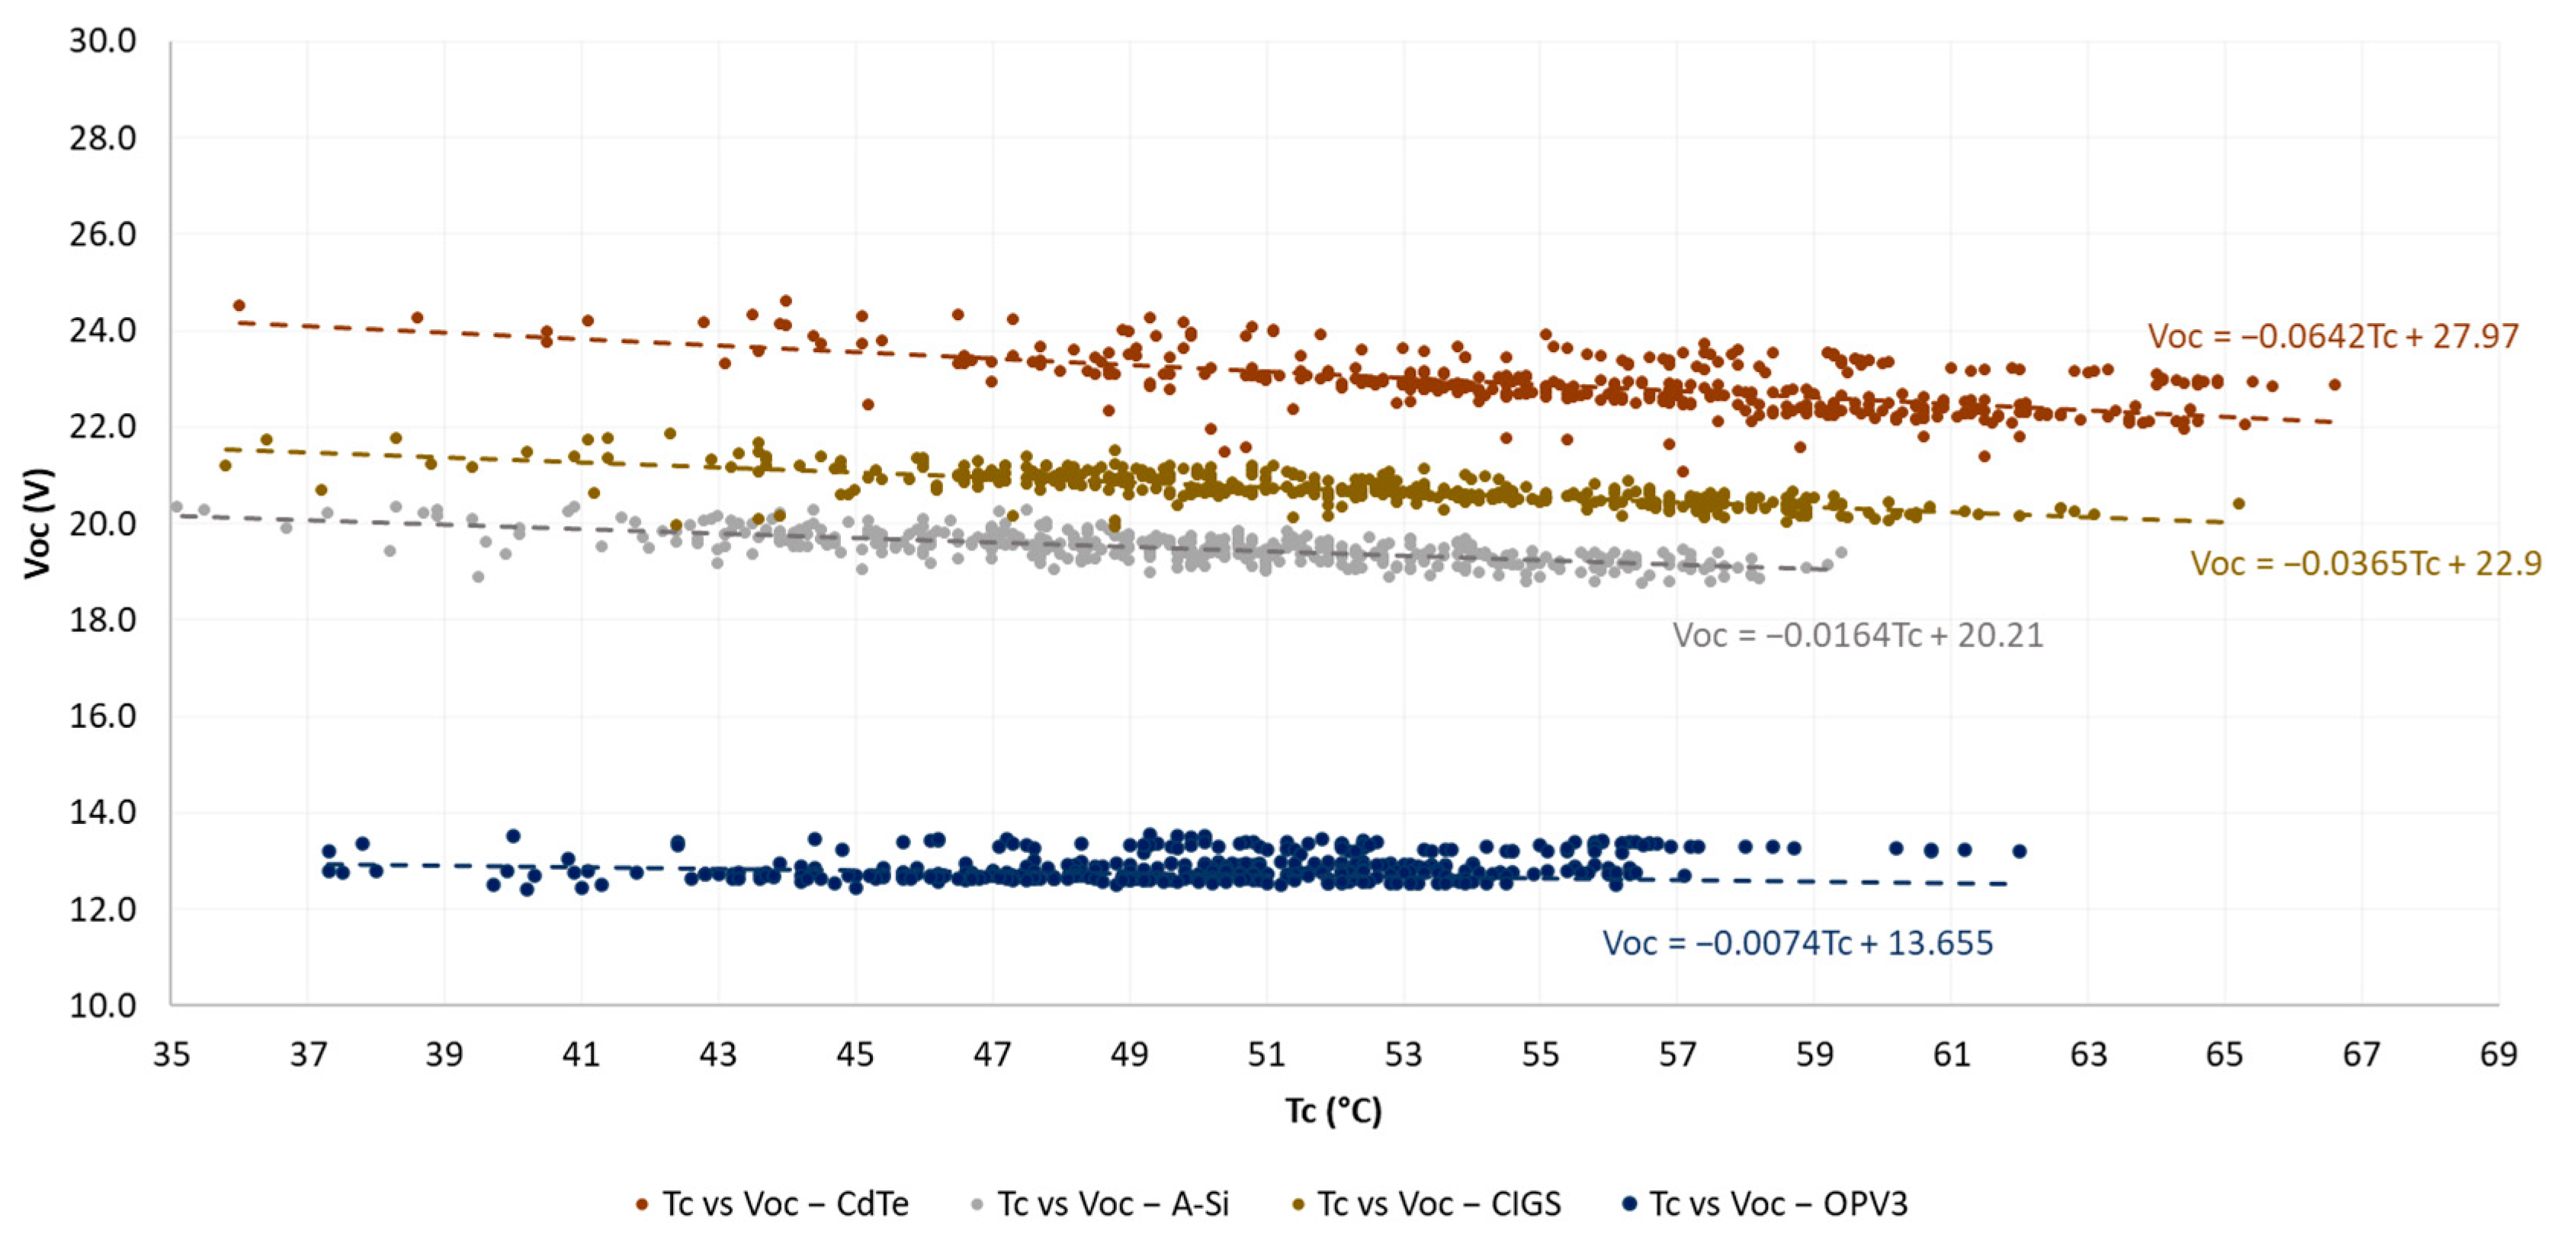
3.3. Analysis of Voc with Respect to Tc

The I-V curves obtained for an irradiance constant at 1000 W/m2 during June 2022 were selected to analyze the tendency of Voc and Isc with respect to the temperature for the CIGS technology at PVMS1, as shown in Figure 8.
From Figure 8a, Voc decreases when the temperature increases, whereas the Isc remains constant, as shown in Figure 8b. Due to the increase in Tc affecting the voltage level in the PV modules, it is essential to analyze the voltage behavior in the different PV technologies. For this, filtered data were used for an Irr of 1000 ± 5 (W/m2) in the three PVMSs. For example, Figure 9 shows the data obtained for PVMS2.
Figure 9 shows that the Voc decreases when Tc is increased for all the PV technologies; however, a greater dependence of the Voc can be noted for the CdTe technology which is minor for the OPV technology. From data in Figure 9, it can be found that the voltage loss rate due to the increasing in Tc (V/°C) is 0.047 V/°C, 0.093 V/°C, 0.048 V/°C, and 0.025 V/°C for CIGS, CdTe, A-Si, and OPV technologies, respectively. Results obtained for PVMS1 and PVMS3 were very similar, as seen in Table 4, from where it can be seen that the average voltage loss rate is lower than provided by the manufacturer; however, the manufacturers calculated it under NOCT conditions (Tc = 48 °C and Irr = 800 W/m2), which differs from the environmental conditions of each PVMS location.

3.4. Outdoor Performance Results

3.4.1. Results for a Sunny Day

The measured parameters from PVMS2 during a sunny day (8 April 2022) are used to evaluate the performance of each PV technology considering the PCE, FF, Jsc, irradiance, and cell-surface temperature shown in Figure 10. In this case, the data are obtained every 10 min to facilitate the visualization.
From Figure 10a, it is possible to observe that the cell-surface temperature increases with the irradiance while the ambient temperature presents small changes. The CIGS solar panel reached the highest cell-surface temperature at 61.2 °C, and the daily average cell-surface temperature for the CdTe, A-Si, CIGS, and OPV technologies was 48.17 °C, 46.19 °C, 49.2 °C, and 48.39 °C, respectively. These averages were calculated when the irradiation was superior to 100 W/m2.
From Figure 10b,c, it is possible to observe that the PCE and FF present minor variations for the A-Si, CdTe, and OPV modules. However, the CIGS module shows some significant variations for PCE, which may be due to the changes in the cell-surface temperature, affecting the Voc parameter. The daily average PCE for the A-Si, CdTe, CIGS, and OPV technologies was 2.59%, 8.26%, 10.28%, and 3.60%, respectively. From Figure 10d, the dependence of Isc and Jsc of each PV technology can be observed regarding the irradiance. The average daily Jsc for the A-Si, CdTe, CIGS and OPV technologies was 1.67 A/m2, 4.06 A/m2, 4.82 A/m2, and 3.13 A/m2.
Table 5 shows that the average PCE calculated for the PV technologies is minor compared to the reported by the manufacturers. It is an expected result since the average cell-surface temperature for each module exceeds 46 °C, and the PCE registered under STC is at 25 °C. The average relative humidity level on the testing day was 80.9%, with a maximum of 96.1% and a minimum of 56.9%. The average irradiance was 410.91 W/m2 with a maximum of 1507 W/m2, and the average solar radiation was 4.55 kWh/m2.

3.4.2. Results for Four Months

From the CSV file-2 generated during four months of measurements on the three PVMSs, it was possible to observe the tendency of Pmax and PCE for each PV technology at an irradiance of 1000 ± 5 (W/m2). Figure 11 shows the variation of PCE for all the PV technologies under test in PVMS2, which allows calculating the loss of efficiency in each PV technology.
The average daily efficiency of each technology (see Figure S15 of Supplementary Information) was calculated since PCE has variations due to changes in temperature and irradiance by considering a tolerance margin of 5% for irradiance data filtering. Then, the initial and end average PCE is recorded for each PVMS as presented in Table 6, Table 7 and Table 8.
The above tables show that the CdTe technology presents a significant loss of efficiency compared to the other technologies. However, CdTe in PVMS3 located at 2000 m.a.s.l has the lowest PCE value. Moreover, it is possible to observe that PCE losses are lower for the PV technologies in PVMS3, and CIGS has the best outdoor performance in all the PVMSs, with an average loss of efficiency of 3.93%.
The PCE losses of CIGS and A-SI panels in PVMS2 are similar to those in PVMS1. However, the efficiency loss is significantly higher in the OPV mini modules, which can be due to oxygen filtration through encapsulation.

4. Conclusions

This paper presents the hardware–software design and implementation of an integrated and scalable photovoltaic monitoring platform oriented to the outdoor real-time characterization of the emerging photovoltaic technologies. The proposed platform can provide continuous monitoring and integrate the more relevant PV and meteorological parameters. It can also add other devices to characterize new PV technologies achieving scale-up of the platform.
The designed IPHU device has the Raspberry Pi as its CPU, which has a remarkable advantage because it is a low-cost board that allows the designer to make modifications or additions without making significant changes to the hardware. The above reduces the design time and provides flexibility to implement future developments, such as adding new PV analyzers and sensors.
The platform is very suitable for outdoor characterization and performance analysis of the emerging PV technologies at periods with high, medium, and low irradiance and for knowing their PCE and degradation ratio at different thermal floors.
From the results, it can be concluded that the average PCE of the characterized PV technologies is lower than the PCE reported by the manufacturer because the Voc decreases when the cell-surface temperature is highly increased.
Furthermore, it can be concluded that CIGS technology presents the best outdoor performance on the three thermal floors, and OPV technology has the best behavior at high temperatures since its voltage loss rate of 0.0206 V/°C is the lowest of all PV technologies tested, and its average PCE is close to the one reported by the manufacturer. On the other hand, the CdTe technology is the most affected by temperature, with a voltage loss rate of 0.0803 V/°C.
The above results show the importance of the proposed platform because it allows outdoor real-time characterization of PV technologies considering average temperatures higher than those under NOCT conditions. In this study, the average cell-surface temperatures for PV technologies were 53.18 °C, 51.62 °C, and 42.92 °C for PVMS1, PVMS2, and PVMS3, respectively.

Supplementary Materials

The following supporting information can be downloaded at: https://www.mdpi.com/article/10.3390/en16062907/s1.

Author Contributions

Conceptualization, S.J.M.-D. and C.A.G.-G.; methodology, C.A.G.-G.; validation, S.J.M.-D. and C.A.G.-G.; investigation, S.J.M.-D.; resources, J.V.-M.; writing—original draft preparation, S.J.M.-D. and C.A.G.-G.; writing—review and editing, C.A.G.-G. and J.V.-M.; visualization, S.J.M.-D.; supervision, J.V.-M.; project administration, J.V.-M.; funding acquisition, J.V.-M. All authors have read and agreed to the published version of the manuscript.

Funding

This research and the APC was funded by Fondo CTeI—Sistema General de Regalías, grant number BPIN-2018000100092.

Institutional Review Board Statement

Not applicable.

Informed Consent Statement

Not applicable.

Data Availability Statement

The data presented in this study are available on request from the corresponding author.

Acknowledgments

We want to thank Christoph J. Brabec for his support and providing the OPV mini modules with characterization data obtained in laboratory tests.

Conflicts of Interest

The authors declare no conflict of interest.

References

  1. Kawagoe, K.; Hishikawa, Y.; Yamada, N. Outdoor Direct STC Performance Measurement of PV Modules Based on a Sun-Shading Technique. IEEE J. Photovolt. 2017, 7, 1725–1730. [Google Scholar] [CrossRef]
  2. Dolara, A.; Leva, S.; Manzolini, G. Comparison of different physical models for PV power output prediction. Sol. Energy 2015, 119, 83–99. [Google Scholar] [CrossRef] [Green Version]
  3. Alshayeb, M.; Chang, J.D. Photovoltaic Energy Variations Due to Roofing Choice. Procedia Eng. 2016, 145, 1104–1109. [Google Scholar] [CrossRef] [Green Version]
  4. Seera, M.; Tan, C.J.; Chong, K.-K.; Lim, C.P. Performance analyses of various commercial photovoltaic modules based on local spectral irradiances in Malaysia using genetic algorithm. Energy 2021, 223, 120009. [Google Scholar] [CrossRef]
  5. Dubey, S.; Sarvaiya, J.N.; Seshadri, B. Temperature Dependent Photovoltaic (PV) Efficiency and Its Effect on PV Production in the World—A Review. Energy Procedia 2013, 33, 311–321. [Google Scholar] [CrossRef] [Green Version]
  6. Zendehdel, M.; Nia, N.Y.; Yaghoubinia, M. Emerging Thin Film Solar Panels. In Reliability and Ecological Aspects of Photovoltaic Modules; IntechOpen: London, UK, 2020. [Google Scholar]
  7. Smets, A.H.M.; Jäger, K.; Isabella, O.; van Swaaij, R.A.; Zeman, M. Solar Cell Parameters and Equivalent Circuit. Sol. Energy Phys. Eng. Photovolt. Convers. Technol. Syst. 2016, 113–121. Available online: https://ocw.tudelft.nl/wp-content/uploads/solar_energy_section_9_1_9_3.pdf (accessed on 1 May 2022).
  8. Elibol, E.; Özmen, Ö.T.; Tutkun, N.; Köysal, O. Outdoor performance analysis of different PV panel types. Renew. Sustain. Energy Rev. 2017, 67, 651–661. [Google Scholar] [CrossRef]
  9. Freitas, A.M.; Gomes, R.A.M.; Ferreira, R.A.M.; Porto, M.P. Experimental performance of commercial OPV panels tested outdoor. Renew. Energy 2019, 135, 1004–1012. [Google Scholar] [CrossRef]
  10. Madeti, S.R.; Singh, S.N. Monitoring system for photovoltaic plants: A review. Renew. Sustain. Energy Rev. 2017, 67, 1180–1207. [Google Scholar] [CrossRef]
  11. Triki-Lahiani, A.; Bennani-Ben Abdelghani, A.; Slama-Belkhodja, I. Fault detection and monitoring systems for photovoltaic installations: A review. Renew. Sustain. Energy Rev. 2018, 82, 2680–2692. [Google Scholar] [CrossRef]
  12. Dolara, A.; di Fazio, G.; Leva, S.; Manzolini, G.; Simonetti, R.; Terenzi, A. Outdoor Assessment and Performance Evaluation of OPV Modules. IEEE J. Photovolt. 2021, 11, 391–399. [Google Scholar] [CrossRef]
  13. Choi, S.; Ishii, T.; Sato, R.; Chiba, Y.; Masuda, A. Performance degradation due to outdoor exposure and seasonal variation in amorphous silicon photovoltaic modules. Thin Solid Film. 2018, 661, 116–121. [Google Scholar] [CrossRef]
  14. Monteiro, L.G.; Macedo, W.N.; Cavalcante, R.L.; Junior, W.B.; Torres, P.F.; Brito, T.R.; Silva, M.M.; Lopes, B.M.; Fraga, J.M.; Alves, D.D.; et al. Field I-V Curve Measurements Methodology at String Level to Monitor Failures and the Degradation Process: A Case Study of a 1.42 MWp PV Power Plant. IEEE Access 2020, 8, 226845–226865. [Google Scholar] [CrossRef]
  15. Farooq, W.; Khan, A.D.; Khan, A.D.; Rauf, A.; Khan, S.D.; Ali, H.; Iqbal, J.; Khan, R.U.; Noman, M. Thin-Film Tandem Organic Solar Cells with Improved Efficiency. IEEE Access 2020, 8, 74093–74100. [Google Scholar] [CrossRef]
  16. Velilla, E.; Cano, J.B.; Jaramillo, F. Monitoring system to evaluate the outdoor performance of solar devices considering the power rating conditions. Sol. Energy 2019, 194, 79–85. [Google Scholar] [CrossRef]
  17. Tawa, H.; Ota, Y.; Inagaki, M.; Mikami, R.; Iwasaki, T.; Ueyama, M.; Nishioka, K. Comparison of CPV systems with lattice-matched and mismatched solar cells in long-term outdoor performance. In Proceedings of the 2018 IEEE 7th World Conference on Photovoltaic Energy Conversion (WCPEC) (A Joint Conference of 45th IEEE PVSC, 28th PVSEC & 34th EU PVSEC), Waikoloa, HI, USA, 10–15 June 2018; Volume 1, pp. 961–964. [Google Scholar] [CrossRef]
  18. Ustun, T.S.; Nakamura, Y.; Hashimoto, J.; Otani, K. Performance analysis of PV panels based on different technologies after two years of outdoor exposure in Fukushima, Japan. Renew. Energy 2019, 136, 159–178. [Google Scholar] [CrossRef]
  19. Stoichkov, V.; Bristow, N.; Troughton, J.; de Rossi, F.; Watson, T.M.; Kettle, J. Outdoor performance monitoring of perovskite solar cell mini-modules: Diurnal performance, observance of reversible degradation and variation with climatic performance. Sol. Energy 2018, 170, 549–556. [Google Scholar] [CrossRef] [Green Version]
  20. Stoichkov, V.; Sweet, T.K.N.; Jenkins, N.; Kettle, J. Studying the outdoor performance of organic building-integrated photovoltaics laminated to the cladding of a building prototype. Sol. Energy Mater. Sol. Cells 2018, 191, 356–364. [Google Scholar] [CrossRef]
  21. Gao, B.; Shao, Y.; Liu, W.; Xiang, H.; Yu, Y.; Liu, Z. Outdoor reliability and degradation of HIT, CIGS, n-type multi-busbar, PERC, and CdTe modules in Shanghai, China. Sol. Energy Mater. Sol. Cells 2022, 236, 111490. [Google Scholar] [CrossRef]
  22. Dolara, A.; Leva, S.; Manzolini, G.; Simonetti, R.; Trattenero, I. Outdoor Performance of Organic Photovoltaics: Comparative Analysis. Energies 2022, 15, 1620. [Google Scholar] [CrossRef]
  23. Repins, I.; Contreras, M.A.; Egaas, B.; DeHart, C.; Scharf, J.; Perkins, C.L.; To, B.; Noufi, R. 19·9%-efficient ZnO/CdS/CuInGaSe2 solar cell with 81·2% fill factor. Prog. Photovolt. Res. Appl. 2008, 16, 235–239. [Google Scholar] [CrossRef] [Green Version]
  24. Garris, R.L.; Johnston, S.; Li, J.V.; Guthrey, H.L.; Ramanathan, K.; Mansfield, L.M. Electrical characterization and comparison of CIGS solar cells made with different structures and fabrication techniques. Sol. Energy Mater. Sol. Cells 2018, 174, 77–83. [Google Scholar] [CrossRef]
  25. Lee, T.D.; Ebong, A. Thin film solar technologies: A review. In Proceedings of the 2015 12th International Conference on High-capacity Optical Networks and Enabling/Emerging Technologies (HONET), Islamabad, Pakistan, 21–23 December 2015; pp. 33–42. [Google Scholar] [CrossRef]
  26. Ferekides, C.S.; Hsu, C.-A. CdTe Thin Film PV: How Has the Technology Evolved and What Challenges Lie Ahead. In Proceedings of the 2019 26th International Workshop on Active-Matrix Flatpanel Displays and Devices (AM-FPD), Kyoto, Japan, 2–5 July 2019; pp. 1–4. [Google Scholar] [CrossRef]
  27. Meng, W.; Jinqing, P.; Hongxing, Y.; Yimo, L. Performance evaluation of semi-transparent CdTe thin-film PV window applying on commercial buildings in Hong Kong. Energy Procedia 2018, 152, 1091–1096. [Google Scholar] [CrossRef]
  28. Meng, L.; Zhang, Y.; Wan, X.; Li, C.; Zhang, X.; Wang, Y.; Ke, X.; Xiao, Z.; Ding, L.; Xia, R.; et al. Organic and solution-processed tandem solar cells with 17.3% efficiency. Science 2018, 361, 1094–1098. [Google Scholar] [CrossRef] [PubMed] [Green Version]
  29. Yu, K.; Rich, S.; Lee, S.; Fukuda, K.; Yokota, T.; Someya, T. Organic Photovoltaics: Toward Self-Powered Wearable Electronics. Proc. IEEE 2019, 107, 2137–2154. [Google Scholar] [CrossRef]
Figure 1. Platform architecture for outdoor real-time characterization of PV panels and OPV mini modules.
Energies 16 02907 g001
Figure 2. Procedures of IPHU software.
Energies 16 02907 g002
Figure 3. Main window of software user interface receiving real-time data from PVMS1.
Energies 16 02907 g003
Figure 4. Data report window for outdoor performance analysis of PV technologies.
Energies 16 02907 g004
Figure 5. I-V and PV curves for (a) 70 w semi-flexible CIGS technology and (b) 1 W OPV3 mini-module.
Energies 16 02907 g005
Figure 6. Pmax generated by each PV/OPV technology in PVMSs for Irr = 1033 (W/m2).
Energies 16 02907 g006
Figure 7. (a) Isc/Irr throughout a sunny day and (b) VOC/Irr throughout a sunny day.
Energies 16 02907 g007
Figure 8. (a) Voc/Tc and (b) Isc/Tc at Irr = 1000 (W/m2) for CIGS panel during one month.
Energies 16 02907 g008
Figure 9. Voc vs. Tc at PVMS2 at Irr = 1000 ± 5 (W/m2) during five months (Feb–Jun 2022).
Energies 16 02907 g009
Figure 10. Diurnal PV/OPV technologies performance in PVMS1 for a sunny day (8 April 2022). (a) Irr/Temp. vs. Time; (b) Irr/PCE vs. Time; (c) Irr/FF vs. Time, (d) Irr/Jsc vs. Time.
Energies 16 02907 g010
Figure 11. Variation of PCE in PVMS2 during four months at Irr = 1000 ± 5 (W/m2), average Tamb = 27.53 °C, average humidity = 66.86%.
Energies 16 02907 g011
Table 1. Technical characteristics of PV panels and OPV mini modules.
PV TechnologyCdTeOPVCIGSA-Si
Technical referenceBIPVZAE BAYERN FLEX–03 70NPower Film 21W
Dimensions1200 × 600 mm9.75 cm²/cell × 20 1709 × 348 mm1544.3 × 370.8 mm
Weight11.8 kg-1.56 kg0.7 kg
Maximum power (Pmax)77 W-70 W21 W
Maximum Voltage (Vmpp)21 V9.15 V18.1 V15.4 V
Maximum Current (Impp)3.66 A89.22 mA3.88 A1.35 A
Open circuit voltage (Voc)28 V14.00 V23.2 V21.9 V
Short Circuit Current (Isc)3.91 A99.40 mA4.67 A1.6 A
Efficiency10.69%4.18%11.77%3.68%
Table 2. PV and meteorological parameters measured for each PV technology placed in PVMSs.
StationPV Tech.Irr (W/m2)Voc (v)Isc (A)Pmax (W)Vmax (v)Imax (A)TA (°C)Tc. (°C)RH (%)
PVMS1
0 (m.a.s.l)
OPV1103312.760.100.768.690.08731.8358.1069.30
A-Si103319.021.7915.7512.551.2631.8354.1069.30
CIGS103321.584.5164.4316.703.8631.8357.9069.30
CdTe103323.424.4261.3216.733.6731.8354.0069.30
PVMS2
1000 (m.a.s.l)
OPV3103314.040.0930.8510.610.08026.5054.9074.20
A-Si103319.601.7116.1813.191.2326.5050.2074.20
CIGS103320.724.3859.8815.983.7526.5051.3074.20
CdTe103322.864.4460.0516.193.7126.5057.1074.20
PVMS3
2.000 (m.a.s.l)
OPV1103413.510.090.8310.2770.0818.6142.8087.5
A-Si103419.901.5114.6213.1891.1118.6128.7087.5
CIGS103421.613.8051.3216.7403.0718.6141.1087.5
CdTe103425.613.7057.9119.2073.0118.6141.6087.5
Table 3. Percent error calculated in the measurement of PV parameters with PVMS2 in reference to PROVA 210.
Measurement Error (%)
PV ParameterHigh IrrMedium IrrLow Irr
Voc (v)0.64%0.43%4.23%
Isc (A)0.70%1.64%2.97%
Pmax (W)0.35%2.24%0.91%
Vmax (v)0.45%0.01%4.25%
Imax (A)1.01%2.41%4.93%
Table 4. Voltage loss rate due to temperature in the different monitoring stations.
CIGS (V/°C)CdTe (V/°C)A-Si (V/°C)OPV (V/°C)
PVMS1 0.0450.0840.0500.023
PVMS20.0470.0930.0480.025
PVMS30.0430.0640.0510.014
Average Voltage loss rate0.0450.0800,0490.021
Datasheet0.0650.0890.052--
Table 5. Daily average PCE obtained for the PV technologies.
PV TechnologiesPCE Obtained
(%)
PCE in STC (%)Average Tc
(°C)
CIGS10.2811.7749.20
CdTe8.2611.1048.17
OPV3.604.1848.39
A-Si2.593.6846.19
Table 6. PCE losses for PV technologies in PVMS1 after four months.
CIGSCdTeA-SiOPV
Initial PCE (%)10.39.462.604.22
Final PCE (%)10.07.152.403.36
Losses (%)3.3824.47.6920.4
Avg Tc (°C)54.753.152.152.85
Avg RH (%)76.19
Avg TA (°C)31.90
Table 7. PCE losses for PV technologies in PVMS2 after four months.
CIGSCdTeA-SiOPV
Initial PCE (%)9.918.892.81%4.96
Final PCE (%)9.487.262.6%3.45
Losses (%)4.3418.3411.8930.4
Average Tc (°C)51.4254.9649.9150.2
Avg RH (%)66.86
Avg TA (°C)27.53
Table 8. PCE losses for PV technologies in PVMS3 after four months.
CIGSCdTeA-SiOPV
Initial PCE (%)8.858.852.604.40
Final PCE (%)8.498.202.573.99
Losses (%)4.040.361.159.32
Average Tc (°C)4444.73548
Avg RH (%)84.78
Avg TA (°C)20.1
Disclaimer/Publisher’s Note: The statements, opinions and data contained in all publications are solely those of the individual author(s) and contributor(s) and not of MDPI and/or the editor(s). MDPI and/or the editor(s) disclaim responsibility for any injury to people or property resulting from any ideas, methods, instructions or products referred to in the content.

