Article

Extensive Experimental Characterization with Kinetic Data for the Gasification Simulation of Solid Biofuels

1
Institute for Water and Energy Management, University of Applied Sciences Hof, 95028 Hof, Germany
2
DBFZ Deutsches Biomasseforschungszentrum Gemeinnützige GmbH, 04347 Leipzig, Germany
*
Author to whom correspondence should be addressed.
Energies 2023, 16(6), 2888; https://doi.org/10.3390/en16062888
Submission received: 21 February 2023 / Revised: 10 March 2023 / Accepted: 14 March 2023 / Published: 21 March 2023
(This article belongs to the Special Issue Pyrolysis and Gasification of Biomass and Waste II)

Abstract

:
In this study, biomass–specific gasification data is experimentally collected for numerical simulations of fixed–bed reactors. Since biomass properties vary, it is crucial to have characteristic biomass data. Extensive data is collected to determine an appropriate description of specific biomass behavior, including basic data (e.g., heating value, size, densities, ultimate and total analysis etc.), biomass pyrolysis and heterogeneous gasification reaction data. Heterogeneous reactions were comparatively investigated in the forms of powder, particles, and a fixed–bed. The powder was investigated in depth with CO2, O2, and H2O (gas fraction 5–20 vol.%; temperature CO2, O2 and H2O, respectively, at 730–790 °C, 360–405 °C, 720–780 °C), while particle reactions and fixed–bed reaction were only studied with CO2. A model description for a fixed–bed batch reactor was applied, modified, and compared to experimental fixed–bed batch reactor results. This study concludes that determining the appropriate characteristic particle size and parameters for the porous structure of specific biomass char is essential for simulation based on preliminary biomass characterization. Therefore, in future investigations, the description for biomass-specific differences between powder, single particles, and bulk of biomass char may be of greater focus, also taking into consideration O2 and H2O.

1. Introduction

Several scientific and experimental efforts have been made to harvest energy from alternative sources such as solar, water, wind, geothermal and biomass. For the latter, thermal biomass gasification is a widely explored scientific field of research with many facets [1]. Due to the rising demand for renewable energies, there is still the necessity of enhancements and improvements in the field of biomass gasification. It can be primarily divided into the following processes [2,3,4,5]:
  • drying (evaporation of humidity water);
  • pyrolysis (further devolatilizing to char, tar, water, and gas);
  • tar cracking (secondary tar reactions);
  • homogeneous reactions;
    -
    water–gas shift reaction;
    -
    combustion of H2, CO, gaseous hydrocarbons (e.g., mainly CH4) and tars;
  • heterogeneous reactions;
    -
    char combustion;
    -
    Boudouard reaction;
    -
    steam gasification.
The purpose of this study is to identify suitable biomass-specific characteristics of the previously named processes for modelling syngas production in fixed–bed downdraft gasification. Syngas enables the use of biomass as a source for heat and power generation, as well as a natural gas substitute for industrial process heat and more applications.
Many approaches have been made in the literature to mathematically describe the pyrolysis and gasification of biofuels. Basu et al. [6] classify the modelling into thermodynamic equilibrium, kinetic, computational fluid dynamics (CFD), and artificial neural network (ANN). Further, the benefits of computer models such as finding optimum conditions or assisting up and down scaling with less experimental time and effort are mentioned.
In 2019, a promising approach for a fixed–bed downdraft reactor model with integrated tar adsorption was developed by Gradel et al. The model is based on standardized wood pellets as fuel. The parameters and data used for modelling were obtained by studies (e.g., homogeneous reaction kinetics, pyrolysis data) but also from self–performed measurements (heterogeneous reaction kinetic data, pyrolysis data and BET analysis) [4].
In 2011, Neves et al. made an extensive summary of pyrolysis research in their work, showing that many studies in the field of pyrolysis with a vast variety of biomass were conducted [7]. But this also leads to a lack of comparability when it comes to comparing the process behavior of a specific type of biomass. Although the first table in the work of Neves et al. might not contain every biomass study, only a few types of biomasses can be found more than three times in the reviewed studies. Furthermore, the varying experimental setups used in the research of Neves et al. have resulted in a wide range of results, making it difficult to use them as comparable biomass-specific pyrolysis and gasification data. Beech and pine were the most common found wooden biomass in the research papers investigated by Neves et al. It is important to mention that not every study presented in [7] was additionally evaluated here for beech and pine data.
In 2017, Morin et al. studied the kinetics of biomass char combustion. Their review of the literature lists some research in this field [8]. They also concluded the following dependencies in reactivity based on studies and experiments:
  • An increase in the particle heating rate increases the reactivity of char [9,10,11,12,13];
  • Higher pyrolysis pressure decreases char reactivity [10,11,12,13,14];
  • Residence time at final pyrolysis temperature: either decrease of reactivity [11,15] or no effect [13];
  • Higher final temperature leads to decrease of reactivity [16];
  • Also highly depending on chemical structure and ash content, which refers to the nature of biomass [16].
Therefore, a different type of biomass char has varying reaction characteristics. Morin et al. primarily investigated combustion behavior. The kinetics for char gasification agents like CO2 and H2O were mentioned but not in focus [8]. In 2010, Irfan et al. specifically reviewed coal gasification in a CO2 atmosphere [17]. Yet, the combined characterization with pyrolysis and the gasification agents CO2, O2 and H2O is not commonly reported in the literature. As a result, there is a lack of data available for characterization of one specific biomass for kinetic reactor modelling purposes. Thus, this work aims for an extensive characterization with consideration of elemental analysis, pyrolysis behavior and products, and intrinsic char reactivity with CO2, H2O, O2, considering different scales (intrinsic, particle, bed), to provide more reliable and reproducible biomass–specific data for more accurate mathematical models.

2. Materials and Methods

Spruce in the form of defined wooden chips (DWC) was used as a reference fuel. They were processed by chipping and sufficient sieving to contain a homogeneous size between 12 mm and 16 mm. The defined wooden chips contained nearly no bark. A sample of the chosen biomass is shown in Figure 1. The biomass was primarily chosen in consideration of particle size and size distribution, availability, and a high ratio of domestic spruce logging in Germany (74.8% in 2021) [18]. For ultimate analysis, a Vario Macro Cube from Elementar Analysensysteme GmbH (Langenselbold, Germany) was used, in the manner of DIN EN ISO 16948 [19].
The total analysis procedure was conducted with ICP–OES in accordance with DIN EN ISO 16967;2015-07 [20] and DIN EN ISO 16968;2015-09 [21]. Ash content was measured in the manner of DIN EN 14775 (550 °C) [22] for biomass and DIN 51719 [23] for the pyrolysis char. Water content was determined with DIN EN 14774-2 [24]. Volatile matter was analyzed with DIN EN ISO 18123 [25].
The evaluated properties of the biomass are listed in Table 1. For true density, apparent (particle) density and particle porosity of spruce char, the values evaluated by Dufourny et al. [26] were used. Bulk density was measured by filling a beaker (1000 mL for biomass, 200 mL for char) to a defined volume and measuring the mass five times and again by another person. The calculated bulk density was averaged. The Sauter diameter was calculated as in DIN EN ISO 9276-2 [27].
The results of small–scale experiments (advanced properties and powder gasification) are used to calculate and compare particle and fixed–bed experiments to indicate and precise the main data needed for fixed-bed gasification simulation and improve the model used.

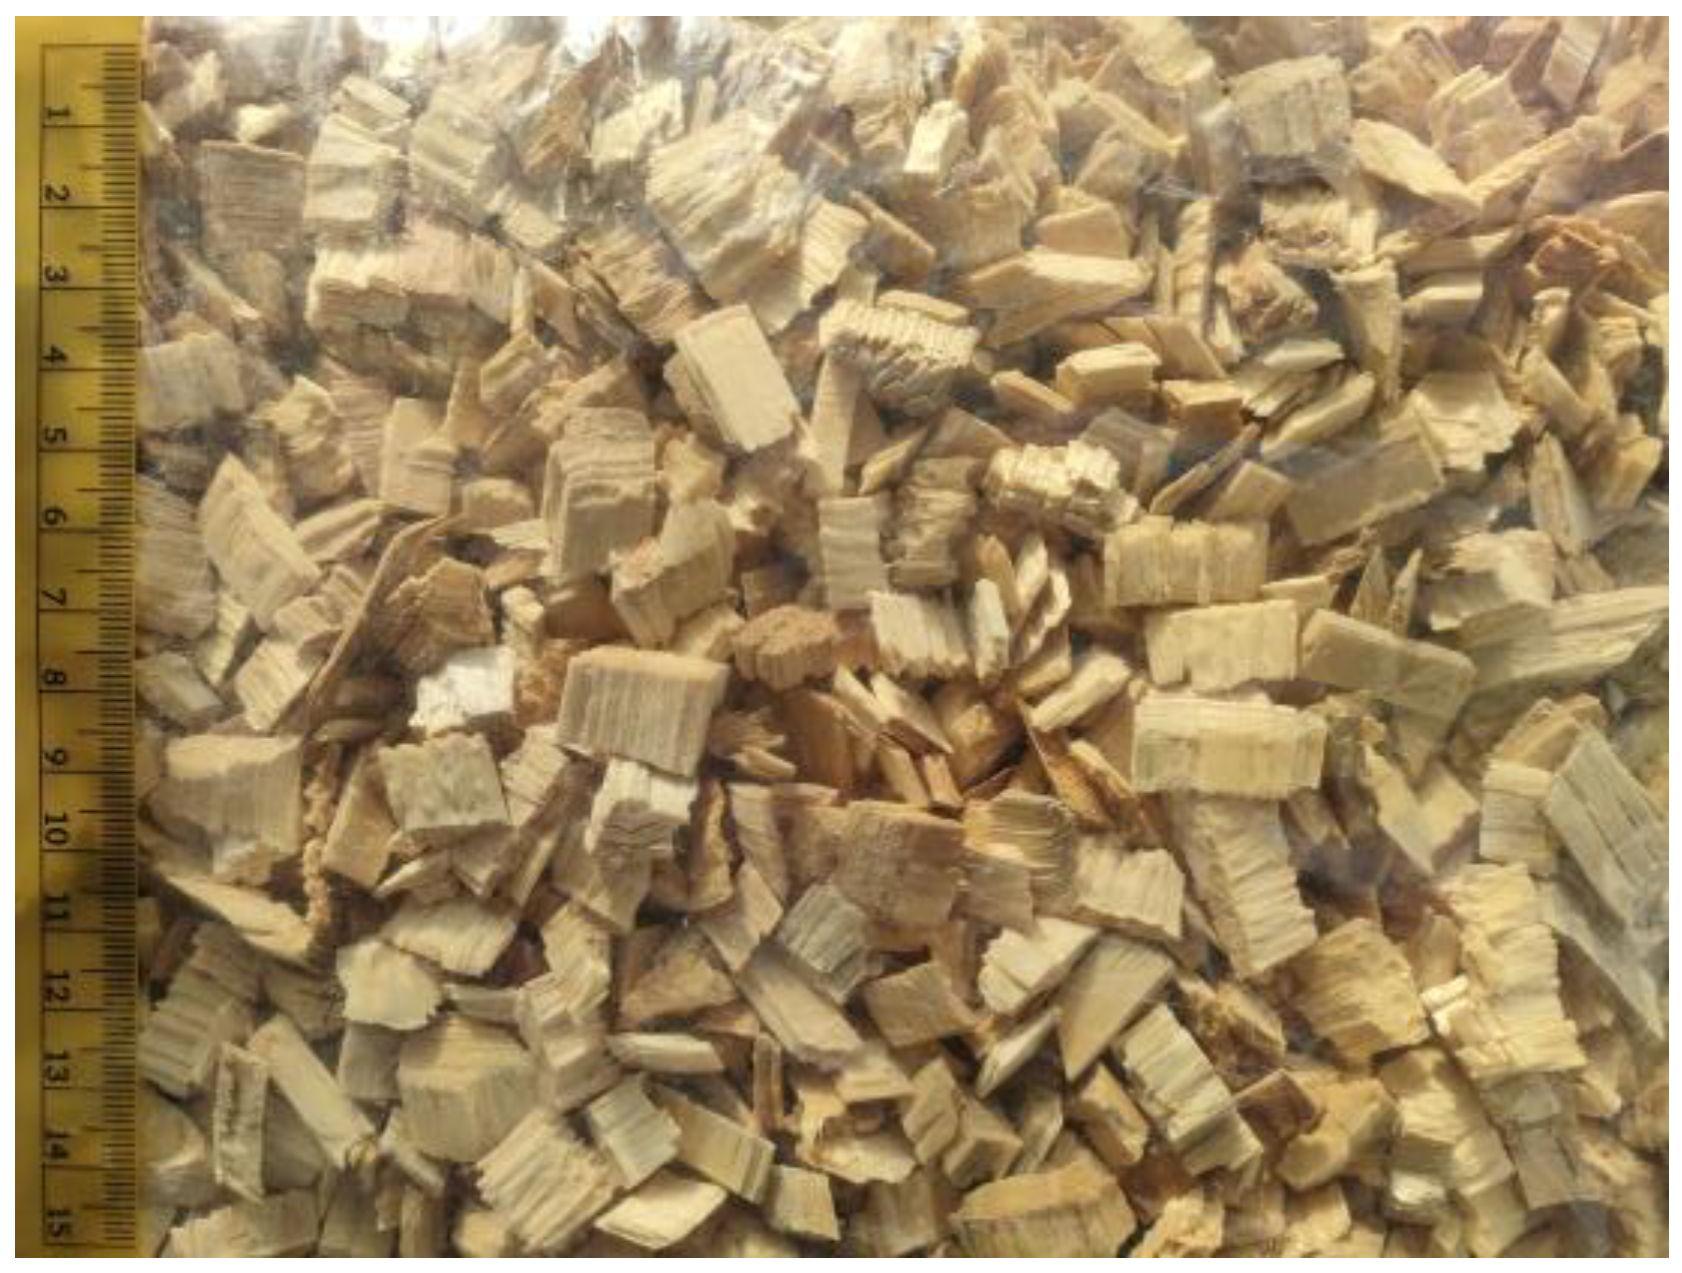
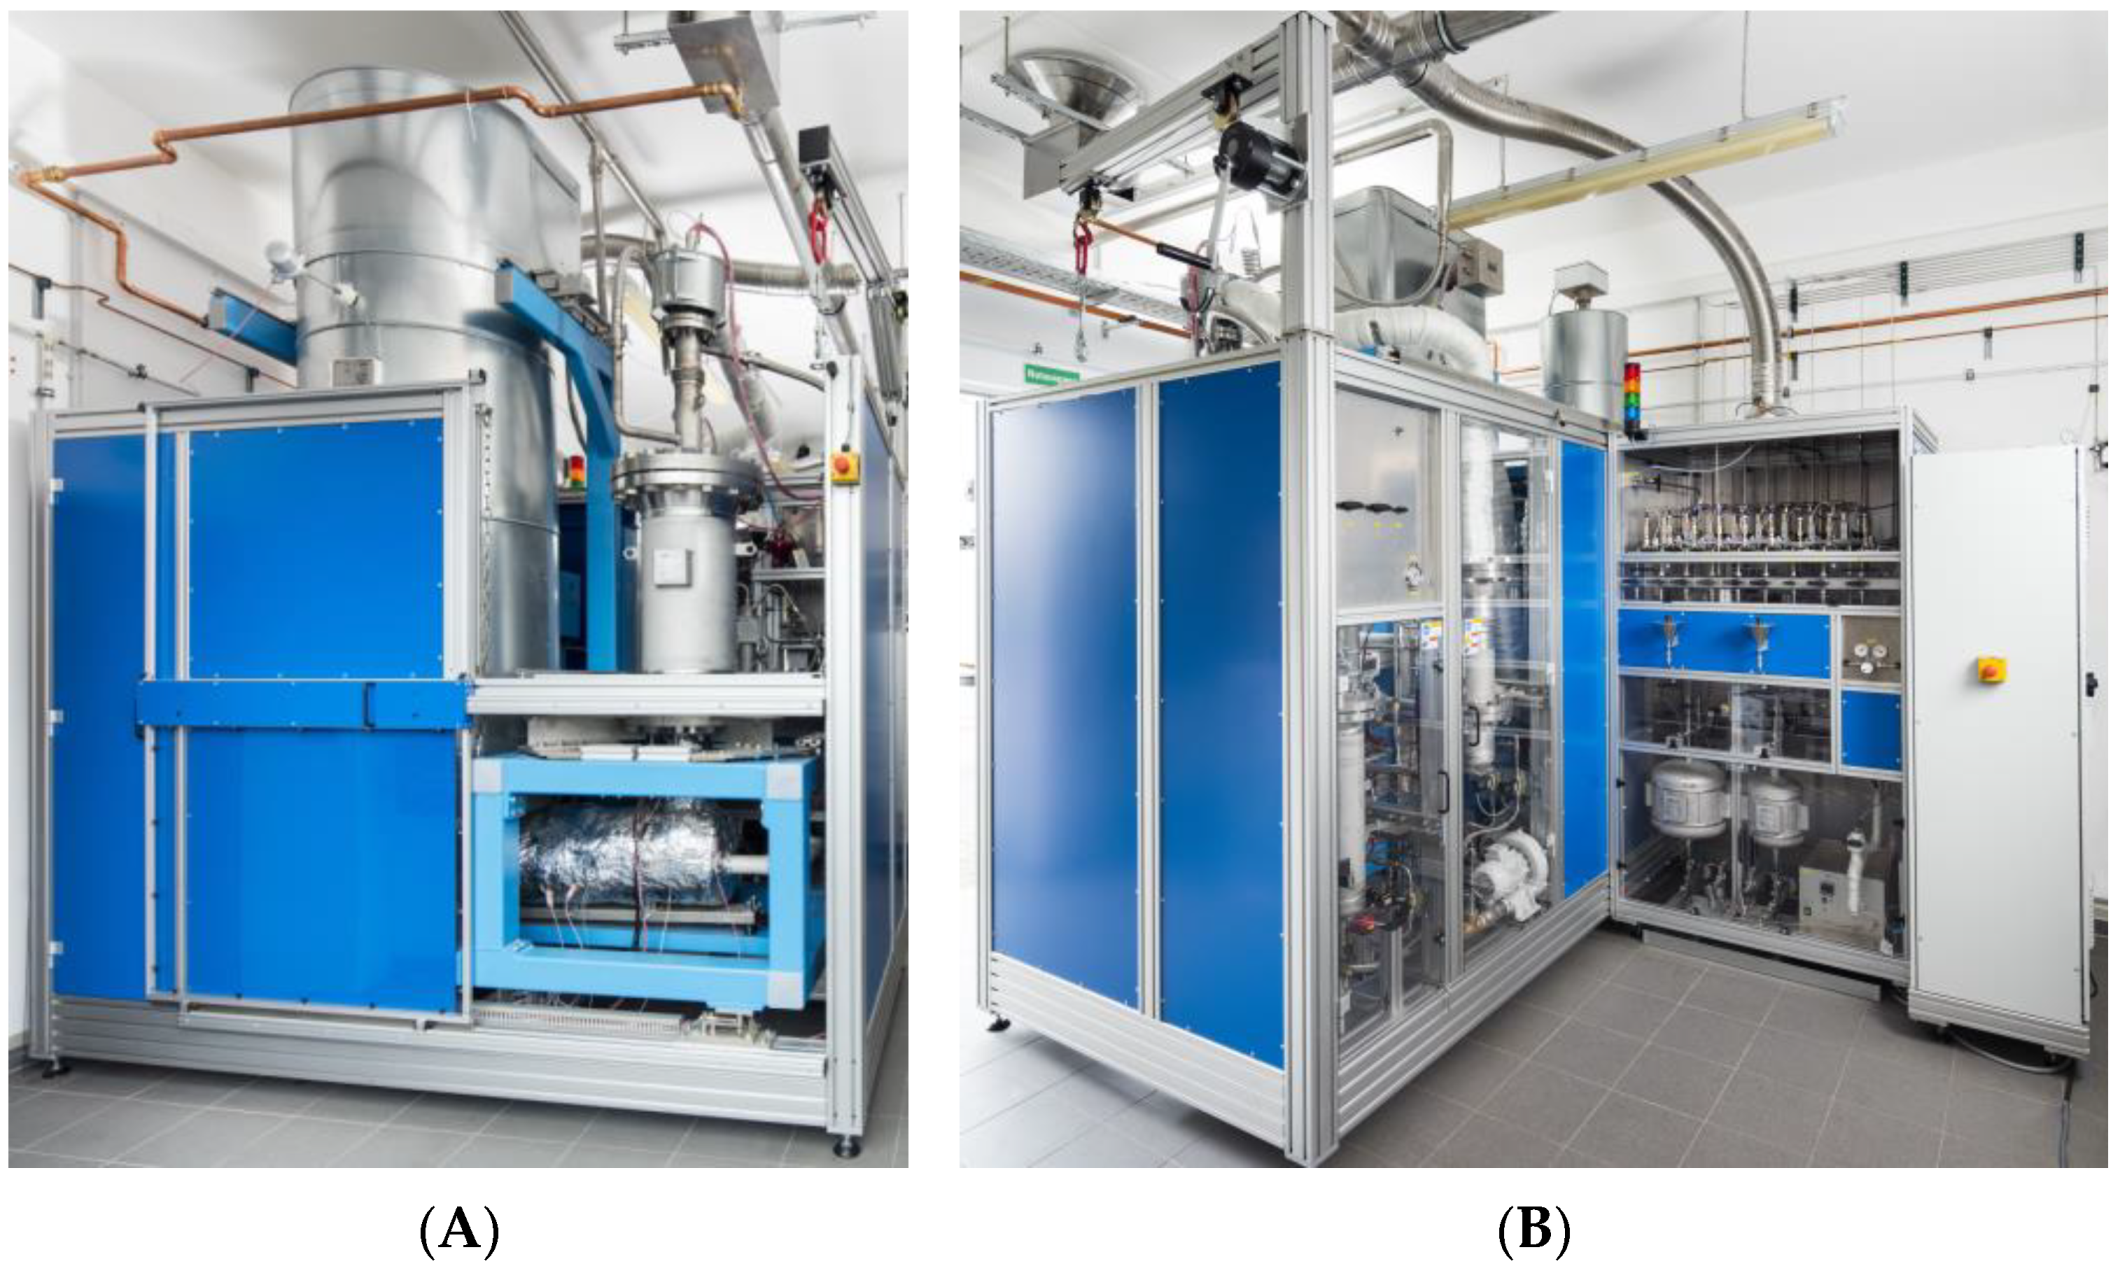
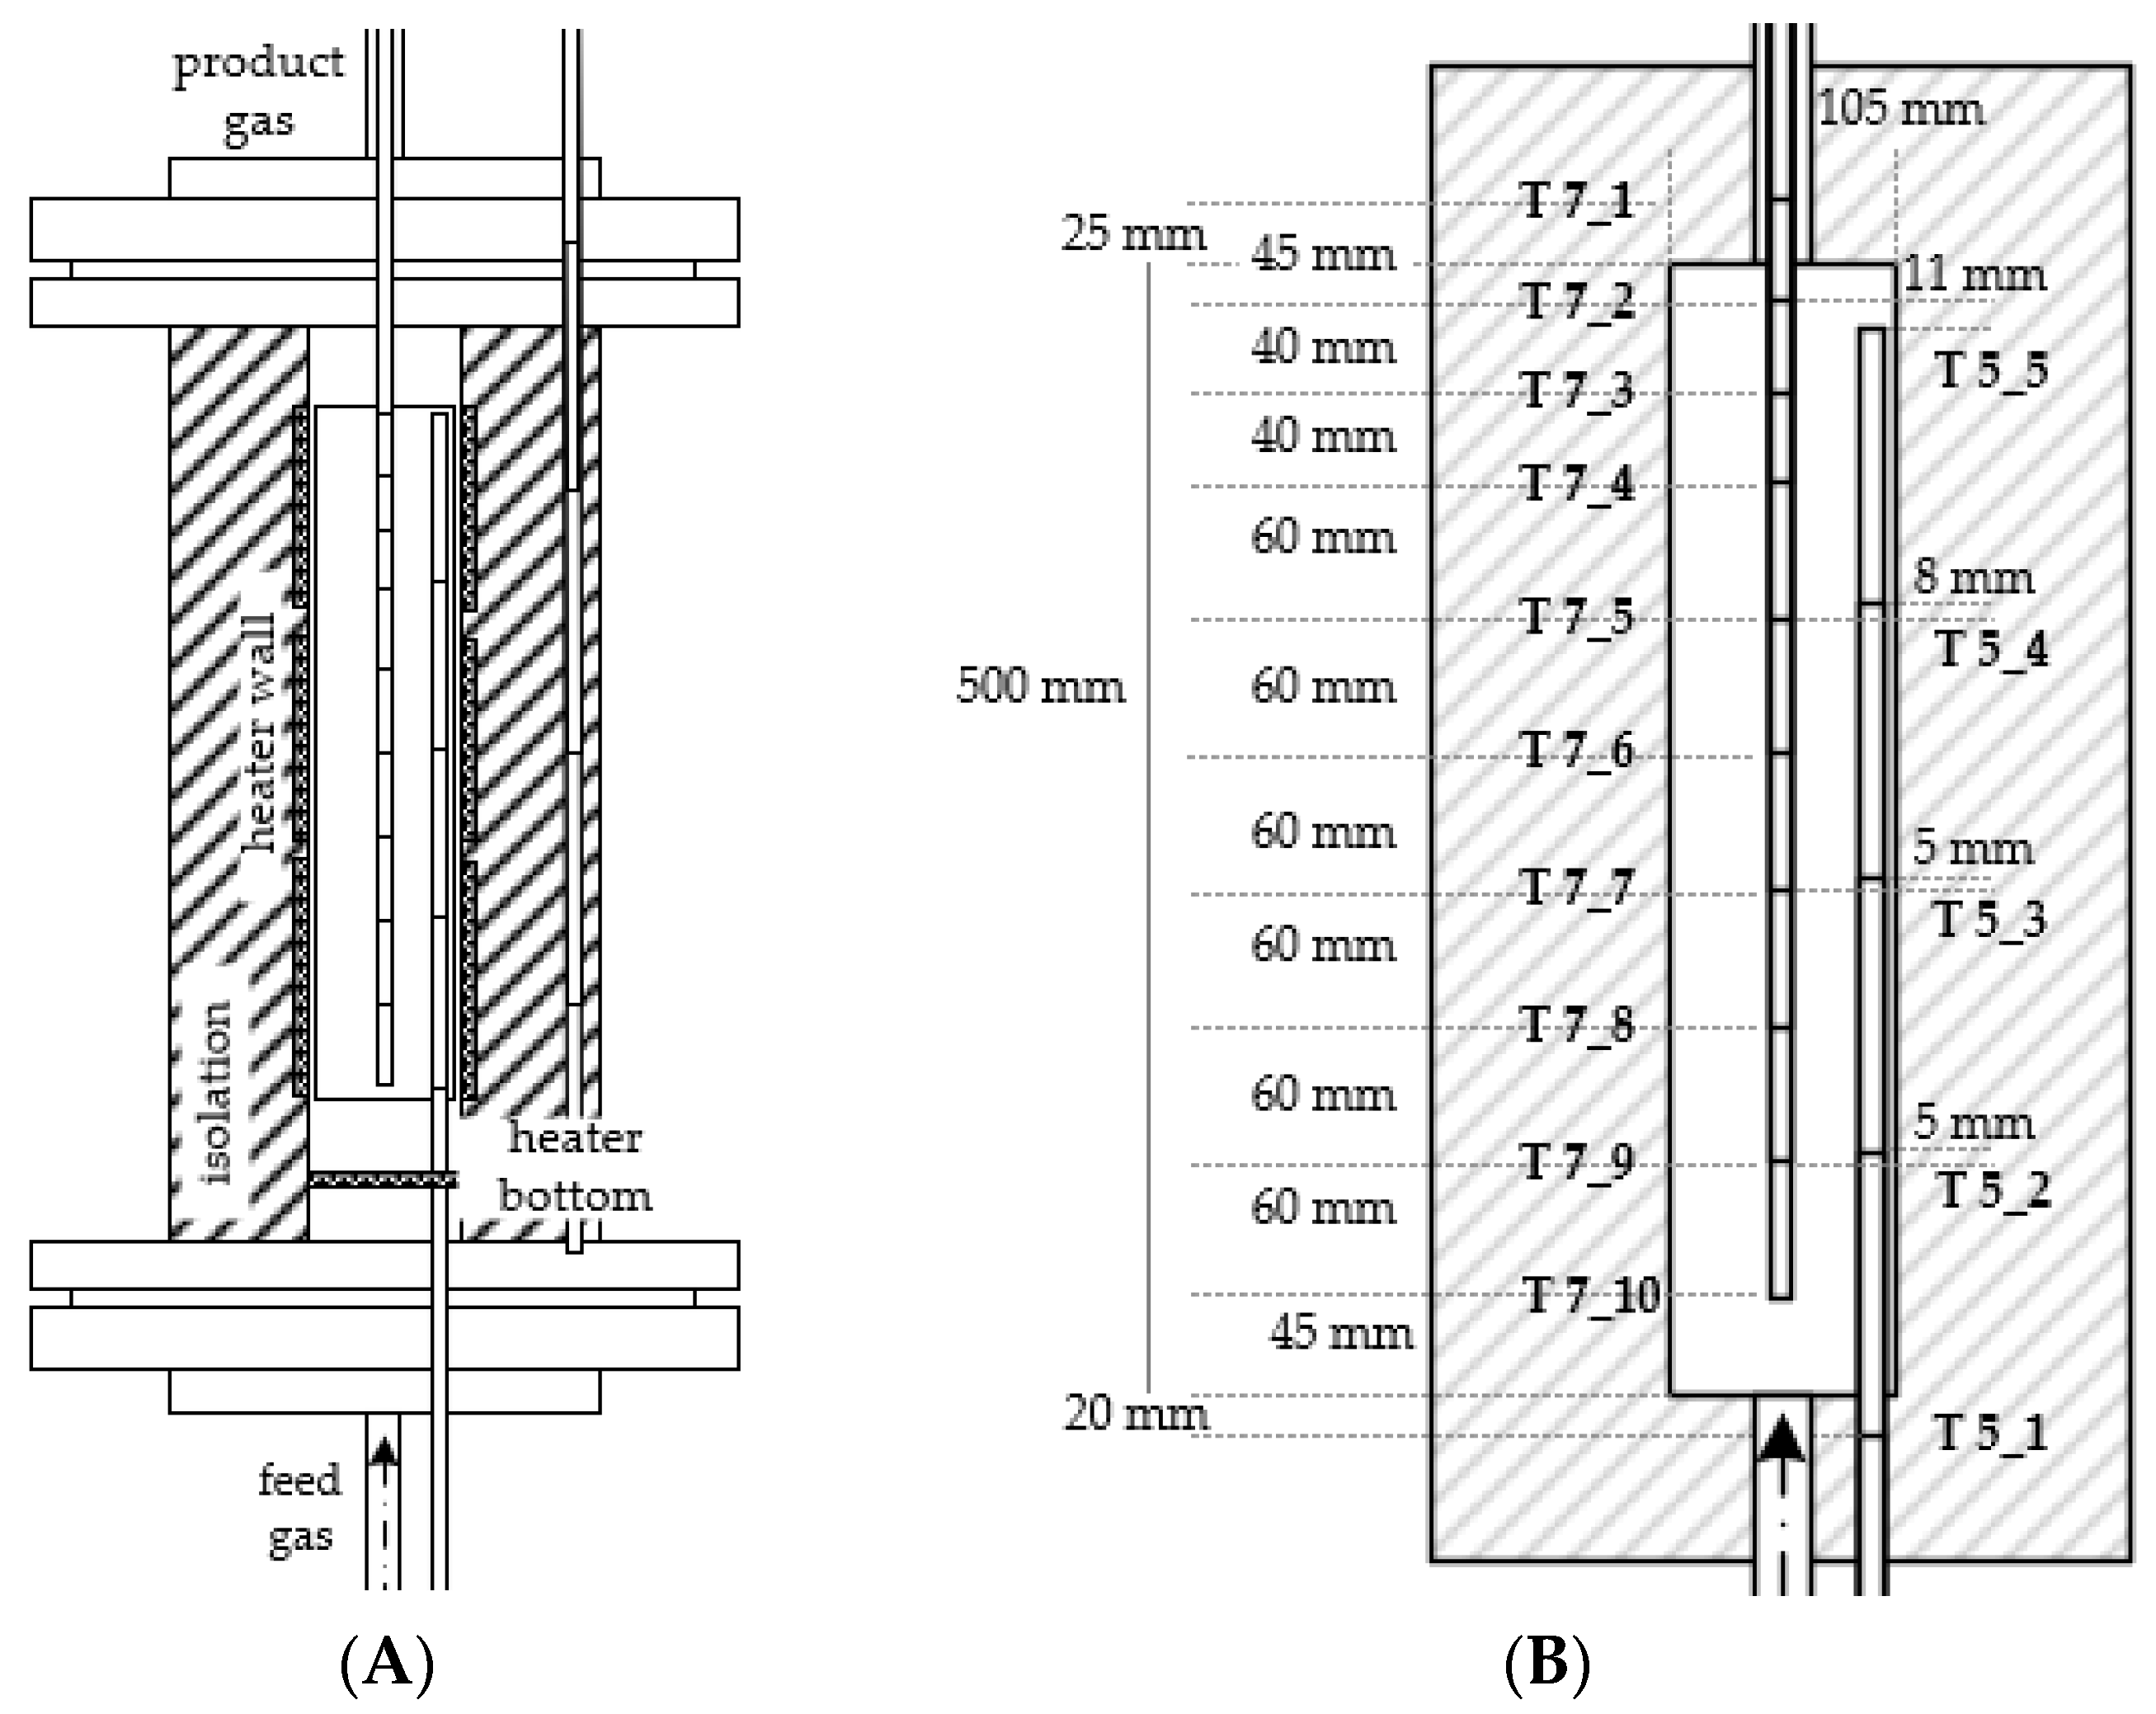
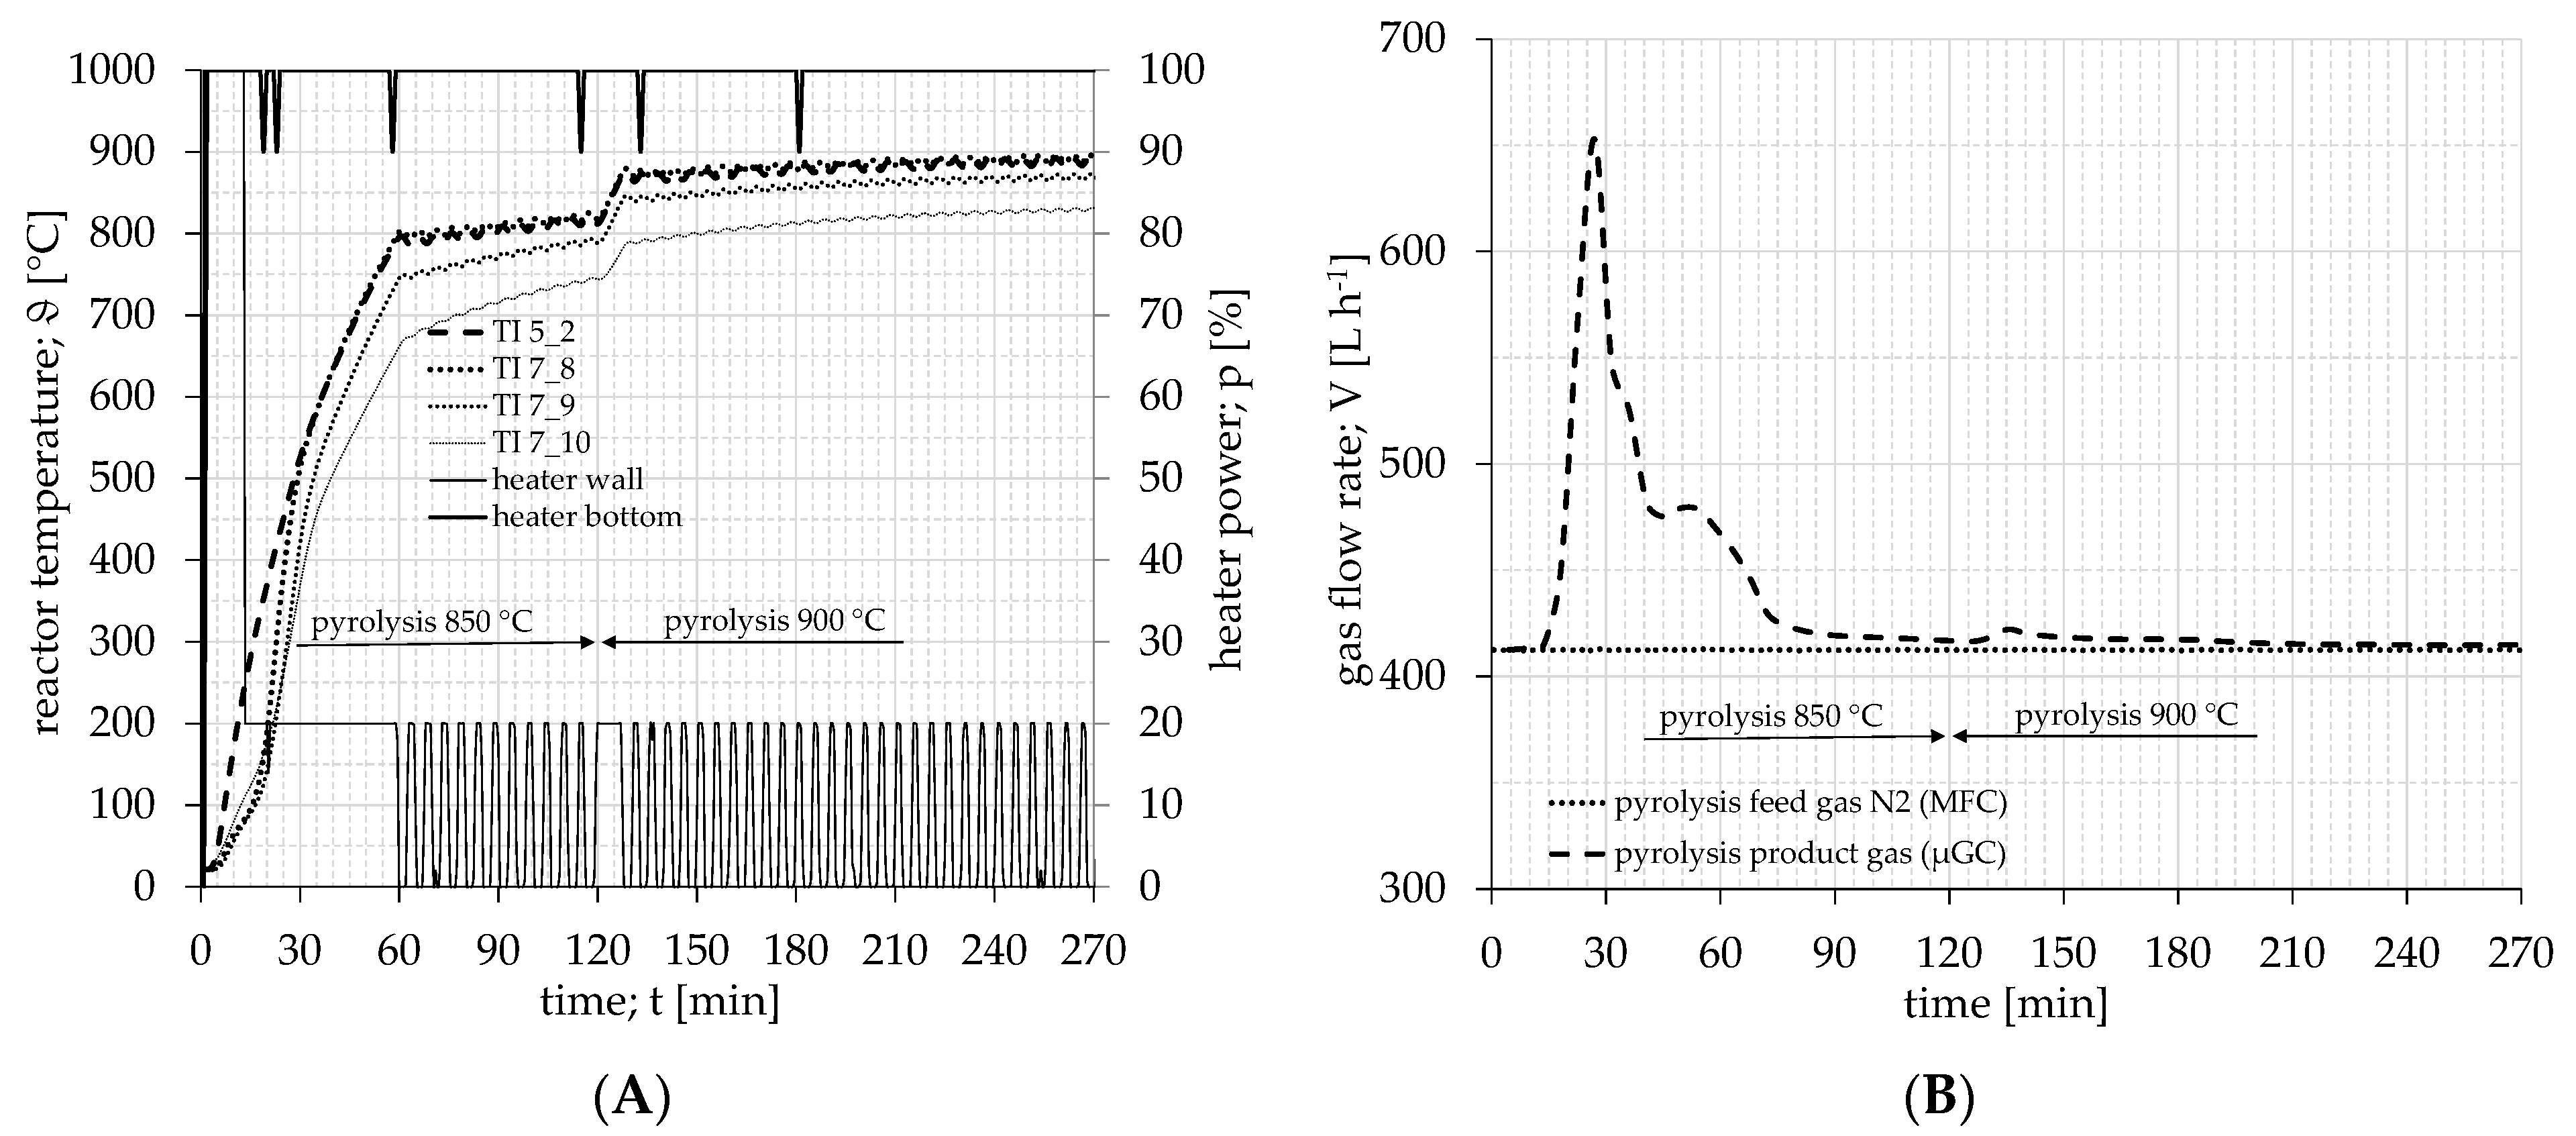
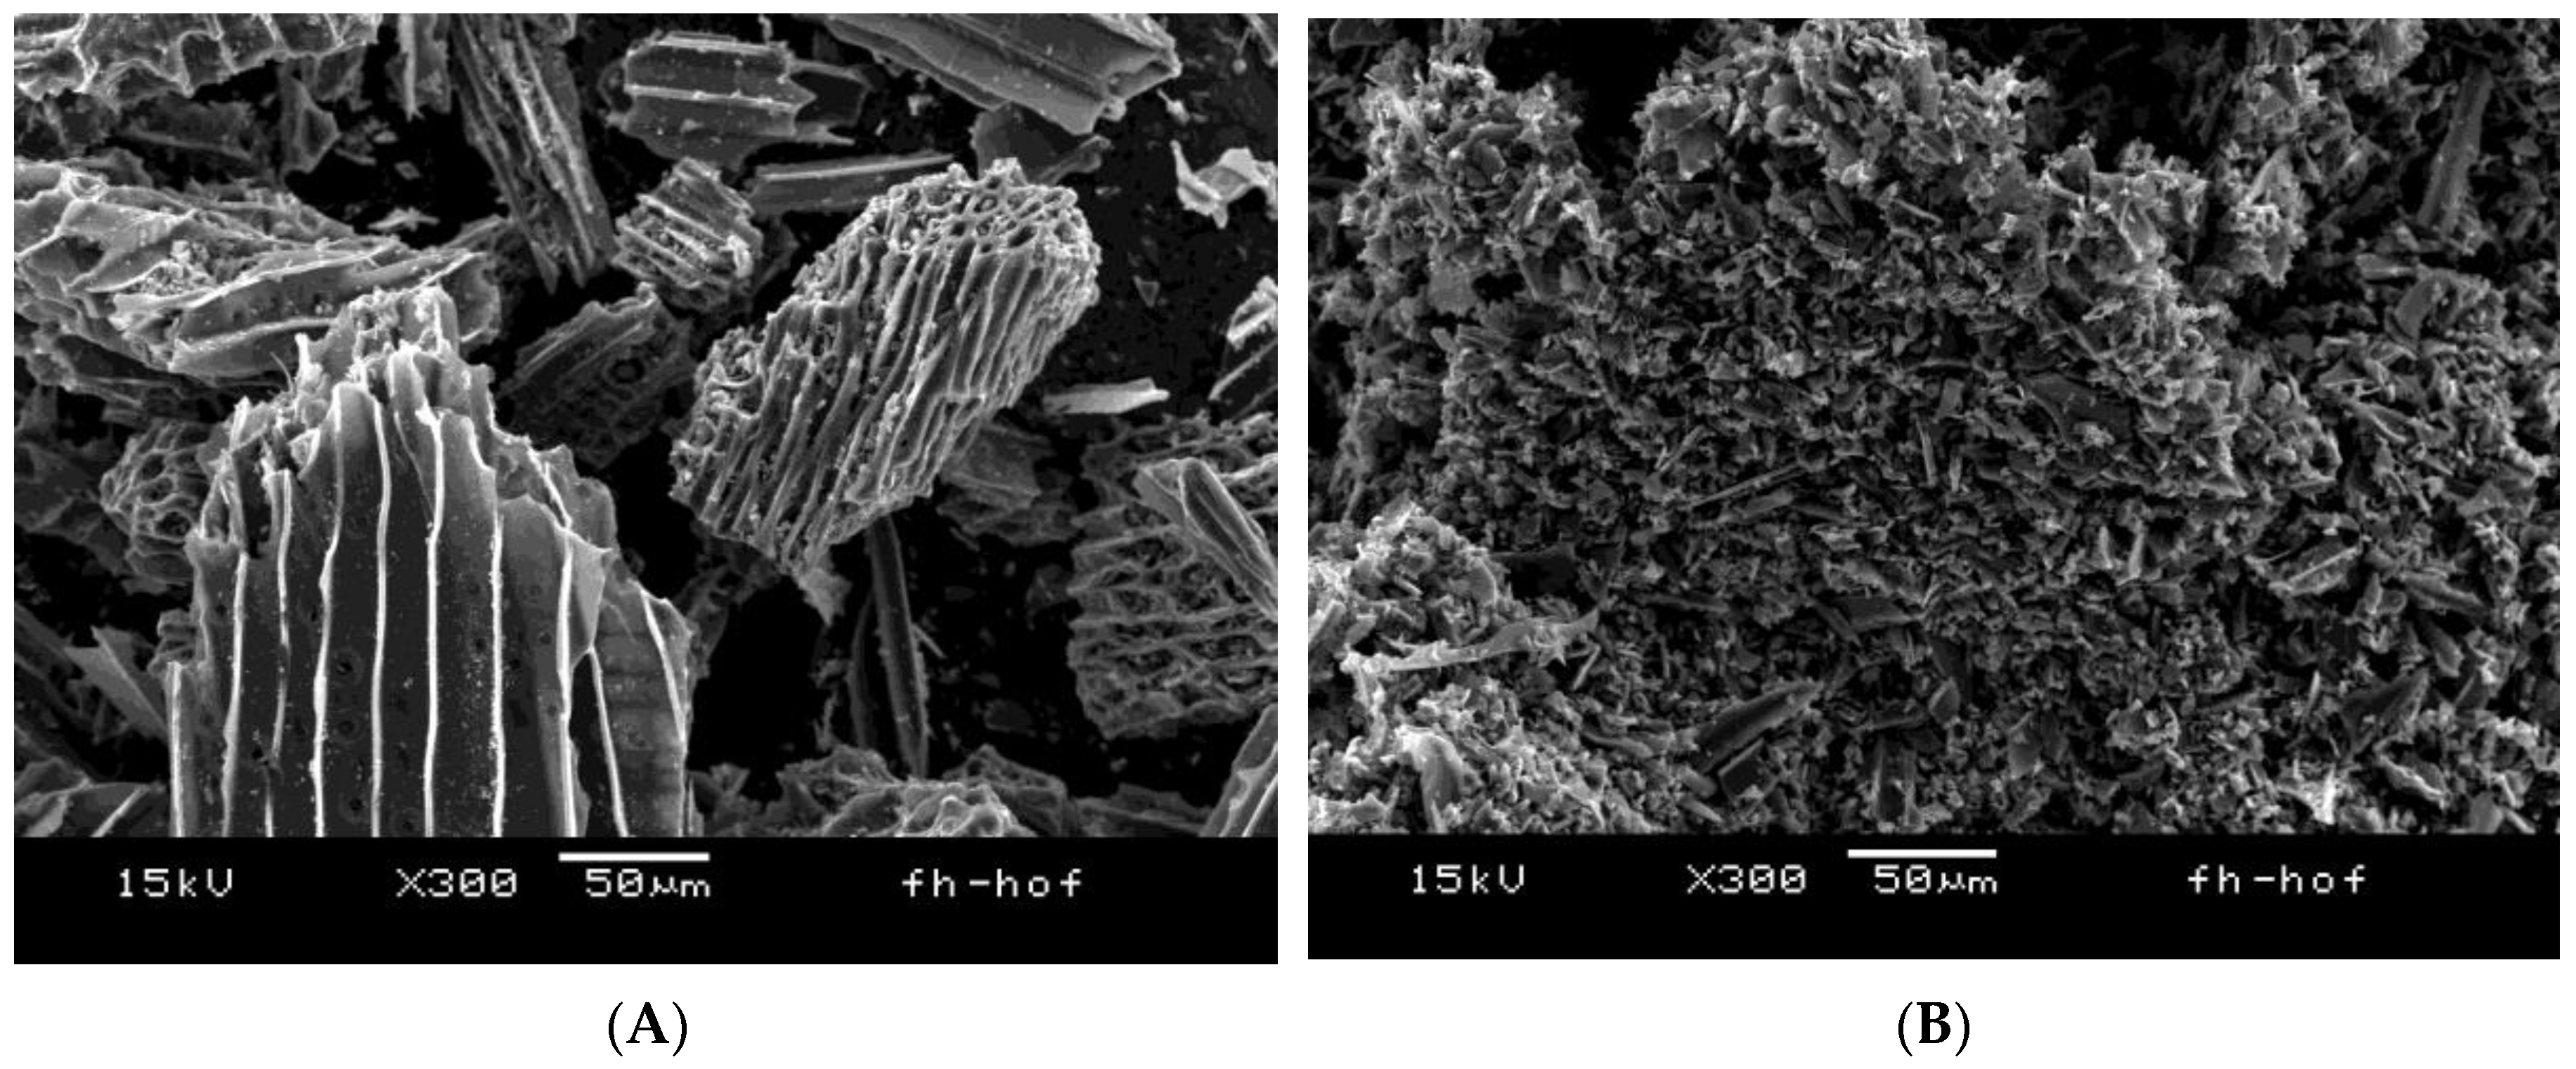
2.1. Fixed–Bed Batch Reactor Wood Chip Pyrolysis

A batch of around 500 g of fuel was pyrolyzed as a fixed–bed in a laboratory-scale reactor to characterize the pyrolysis reaction via mass balance. The reaction products were char inside the reactor, product gas with liquids (respectively, tar and water) and gaseous parts, which were measured. The used fixed–bed batch reactor is located at the DBFZ in Leipzig (Figure 2). The reactor can be described as an inverted downdraft reactor. It is electrically heated at the bottom and sidewalls with adjustable power up to 8.8 kW. Preliminary tests were done to reach a target heating rate of 7–16 K min−1. To ensure the feasibility of experiments, the measurement devices were comparably checked and/or calibrated.
The plant consists of several preheaters and a bypass for heating at the beginning, as well as the reactor and product gas cooling. Inside the reactor are 15 thermocouples to measure the axial and wall temperature profile (Figure 3) during the experiment. Gas analyzers were installed to measure H2, CO, CH4, CO2, O2, N2, C2H6, and C2H4 in the cooled (5 °C) dry gas. At the beginning and end of the experiments, the gas analyzers were checked with test gas to determine and document the measurement errors. N2, O2, steam, CO2 and mixtures thereof were available as feed gas in the range up to 3500 L min−1 (STP). The several preheaters heat the reactor feed gas up to 700 °C in bypass of the cold reactor. After the target temperature had been reached, the hot gas was switched from the bypass to the reactor with a fixed–bed of wood or char. After gasification or pyrolysis inside the reactor, the resulting product gas was transported to the cooler at 450 °C, cooled down to 10–20 °C and analyzed with micro gas chromatography (µGC), Fourier–transform infrared spectroscopy (FTIR), optical oxygen sensor and diaphragm gas meters.
The target temperature for the first pyrolysis experiments was 500 °C. Preliminary tests showed that the reactor temperature varied over the complete height by 50–100 °C. This is due to the reactor geometry and massive connectors dissipating heat close to the upper and lower ends of the heating zone while warming up. To ensure a minimum pyrolysis temperature of 450 °C, the target process temperature was set to 500 °C to prevent heterogeneous reactions between char and CO2/H2O. The process was continuously purged with preheated nitrogen at 500 °C (Figure 4). The measured heating rate was 7–10 K min−1. The heating rate was chosen in that range, so that the pyrolysis speed was nearly comparable with the planned use of a real gasification plant later in the project. Gas composition was also tracked during this process. A fine-meshed steel basket (1.4841/AISI 314) holds during pyrolysis with a diameter of 100 mm and a filling height of around 500 mm. The vertical temperature profile was measured in the center of the bed every 60 mm (Figure 3) and horizontal at the outer rim of the bed at a height of 120 mm to further monitor local temperatures. After reaching the target temperature, the process was continued until no more product gases were detected (i.e., about 90 min). The product gas was cooled down to 10–20 °C to collect condensable parts in a trap system.
Afterwards, the char was weighed and summed up with the fuel–input and gas–output (calculated from the gas components and inert nitrogen flow) for the mass balance. The difference between input (fuel) und output (gas, char) is the condensable parts (water and tar).
After characterization, the pyrolysis at 500 °C and pyrolysis at 850 °C were started. The experimental procedure was identical to the pyrolysis with 500 °C up to the reactor temperature. The target of the 850 °C-pyrolysis was the characterization of the pyrolysis reactions and preparation of pyrolysis char for further use for CO2 gasification experiments. If the pyrolysis coke is prepared at 500 °C and then heated to 800 °C, for the subsequent gasification reaction, pyrolysis resumes above 500 °C, which then superposes the gasification reaction; therefore, the pyrolysis temperature was raised to 850 °C. Figure 5A shows the temperature profile inside the fuel/char fixed–bed and flow of nitrogen (Figure 5B). As with the 500 °C pyrolysis, the experiment with 850 °C was stopped only when no pyrolysis gas was measured in the reactor product gas (Figure 5B). After pyrolysis, the char was taken out of the reactor for weighing and refilled into the reactor for gasification.
However, subsequent CO2 gasification reactions with 850 °C char showed that the pyrolysis temperature is furthermore too low to accurately characterize the char-gasification reaction at 850 °C. Since the fixed–bed does not reach 850 °C everywhere during 850 °C pyrolysis, it was found in initial tests that few pyrolysis reactions still proceed. Thus, the pyrolysis temperature was raised from 850 °C to 900 °C (Figure 6) to be able to simultaneously exclude occurring pyrolysis reactions during the subsequent CO2 gasification. The measured heating rate for these experiments was 12–13 K min−1 similar to pyrolysis at 500 °C with 7–10 K min−1.
The temperature profile and gas flow were identical to those of the previous 850 °C tests until the temperature was changed to 900 °C. After the temperature was changed to 900 °C, the temperature in the fixed–bed was increased in conjunction with an increased outgassing of the fuel. This shows a peak in the product gas ratio after 120 min. Here, too, the experiment was only stopped when no more pyrolysis gas could be measured in the product gas of the reactor.

2.2. Char Powder Gasification

The thermogravimetric analysis (TGA) was performed on an STA 449 F5 Jupiter (manufacturer: NETZSCH–Gerätebau GmbH, Selb, Germany) under atmospheric pressure with nitrogen as the protective purge gas. The reactive gases were CO2, O2 and H2O. To determine the intrinsic rate of reaction in a TGA, some pieces of the produced pyrolysis char were ground down with a small laboratory mortar and pestle. The char powder was sieved through a 25 µm stainless steel mesh. Thus, a particle size smaller than 62 µm can be obtained for measurements as mentioned by Magnaterra et al. [30]. The powder showed a specific surface area of dimension 350 m² g−1 in a BET–Measurement.
Figure 7 shows images from a scanning electron microscope (SEM; type: JEOL JSM-6360) for structure and size investigation. Comparing the leftover powder particles from sieving (Figure 7A) and the sieving product powder (Figure 7B), the wooden structure was abolished and the small particle size was achieved.
The samples were measured in a cylindrical 85 µL aluminum oxide crucible (inner diameter 5.9 mm and inner height 3.7 mm). The crucibles were placed on a differential scanning calorimetry (DSC) sample carrier to make use of an automatic sample changer (ASC).
The sample weight of all samples was 2 mg ± 0.2 mg. Special care was taken to spread the powder uniformly on the bottom of the crucible to provide a very thin layer and further minimize diffusion effects, as also mentioned by Magnaterra et al. [30].
The total gas flow rate was set to 200 mL min−1 during measurement. With an inner diameter of 26 mm and a temperature of 800 °C, the estimated gas velocity was 20 mm s−1. Passing the round DSC sample carrier with a diameter of 23.5 mm, the gas may be accelerated to 105 mm s−1. At a low reactive volume fraction of 5%, the gas flow may replenish reactive gas for a reaction of 0.09 mg s−1, which is 13 times the maximum rate measured at 950 °C and v f , C O 2 = 20 vol.%. Thus, the feed of reactive gas is considered to continuously provide the target gas concentration at the top of crucible throughout the experiments.
The reactive gas was set with the internal mass flow controller (MFC) to the gas concentrations, respectively (e.g., 160 mL min−1 I2 with 40 mL min−1 CO2 for v f , C O 2 = 20 vol.%). The purity of gases were 99.999% for N2 and O2 and 99.995% for CO2. The temperature program of a measurement was set up as described in Table 2.
For H2O reaction, the process humidity is provided by a modular humidity generator (proUmid MHG32; MHG). Therefore, the humid nitrogen flow of the MHG is added as purge gas and mixed with the protective gas before reaching the sample. The humidity can be controlled by setting the temperature and relative humidity of the MGH–flow.
The MHG–flow was set to a total of 166 mL min−1 and protective gas flow to 34 mL min−1. An adjusted relative humidity of 51.4% at 80 °C leads to a volume fraction of 24.2 vol.% H2O in MHG–flow. With the 34 mL min−1 protective flow, a volume fraction of 20 vol.% H2O at a total flow of 200 mL min−1 can be obtained. For lower total volume fractions of 12.5 vol.% and 5 vol.% H2O, the relative humidity was set to 32.1% and 12.9%, respectively. Fully demineralized water was used. The possible content of O2 solved in liquid salt-free water is at a maximum of 9.1 mg dm−3 at 20 °C [31]. At a volume fraction of 20 vol.% H2O as reactive gas, the O2 content is approximately 1 ppm and thus considered negligible.
Preliminary tests were conducted to ensure that nitrogen neutralization is acquired during steps #1 to #3 by N2 purging with success. After heating in step #4 and #5, isothermal step #6 was performed to stabilize the system. At step #7, the gas flow was changed to the desired volume fraction of reactive gas. After about 60 s, the gas mixture reached the sample.
To find the designated target temperatures Ttarget, a test run with each reactive gas was preliminary made. The sample was heated with the same temperature program as shown in Table 2 with a difference in step #7. Instead of the isothermal step, a heating rate of 0.5 K min−1 was set at a starting temperature of 700 °C, 280 °C and 680 °C for CO2, O2 and H2O, respectively.
The temperature test measurement was conducted with a reactive gas atmosphere of 20 vol.%. Figure 8 shows the mass fraction Fj and rate of conversion with the three reactive gases. Comparing Figure 8A,B, an exponential behavior merely due to the change in temperature is assumed between 720 °C and 800 °C. Similarity is observed to Figure 8C–F only with different temperatures. Thus, Ttarget was determined as listed in Table 3 for the long–term experiments to observe solely isothermal behavior.

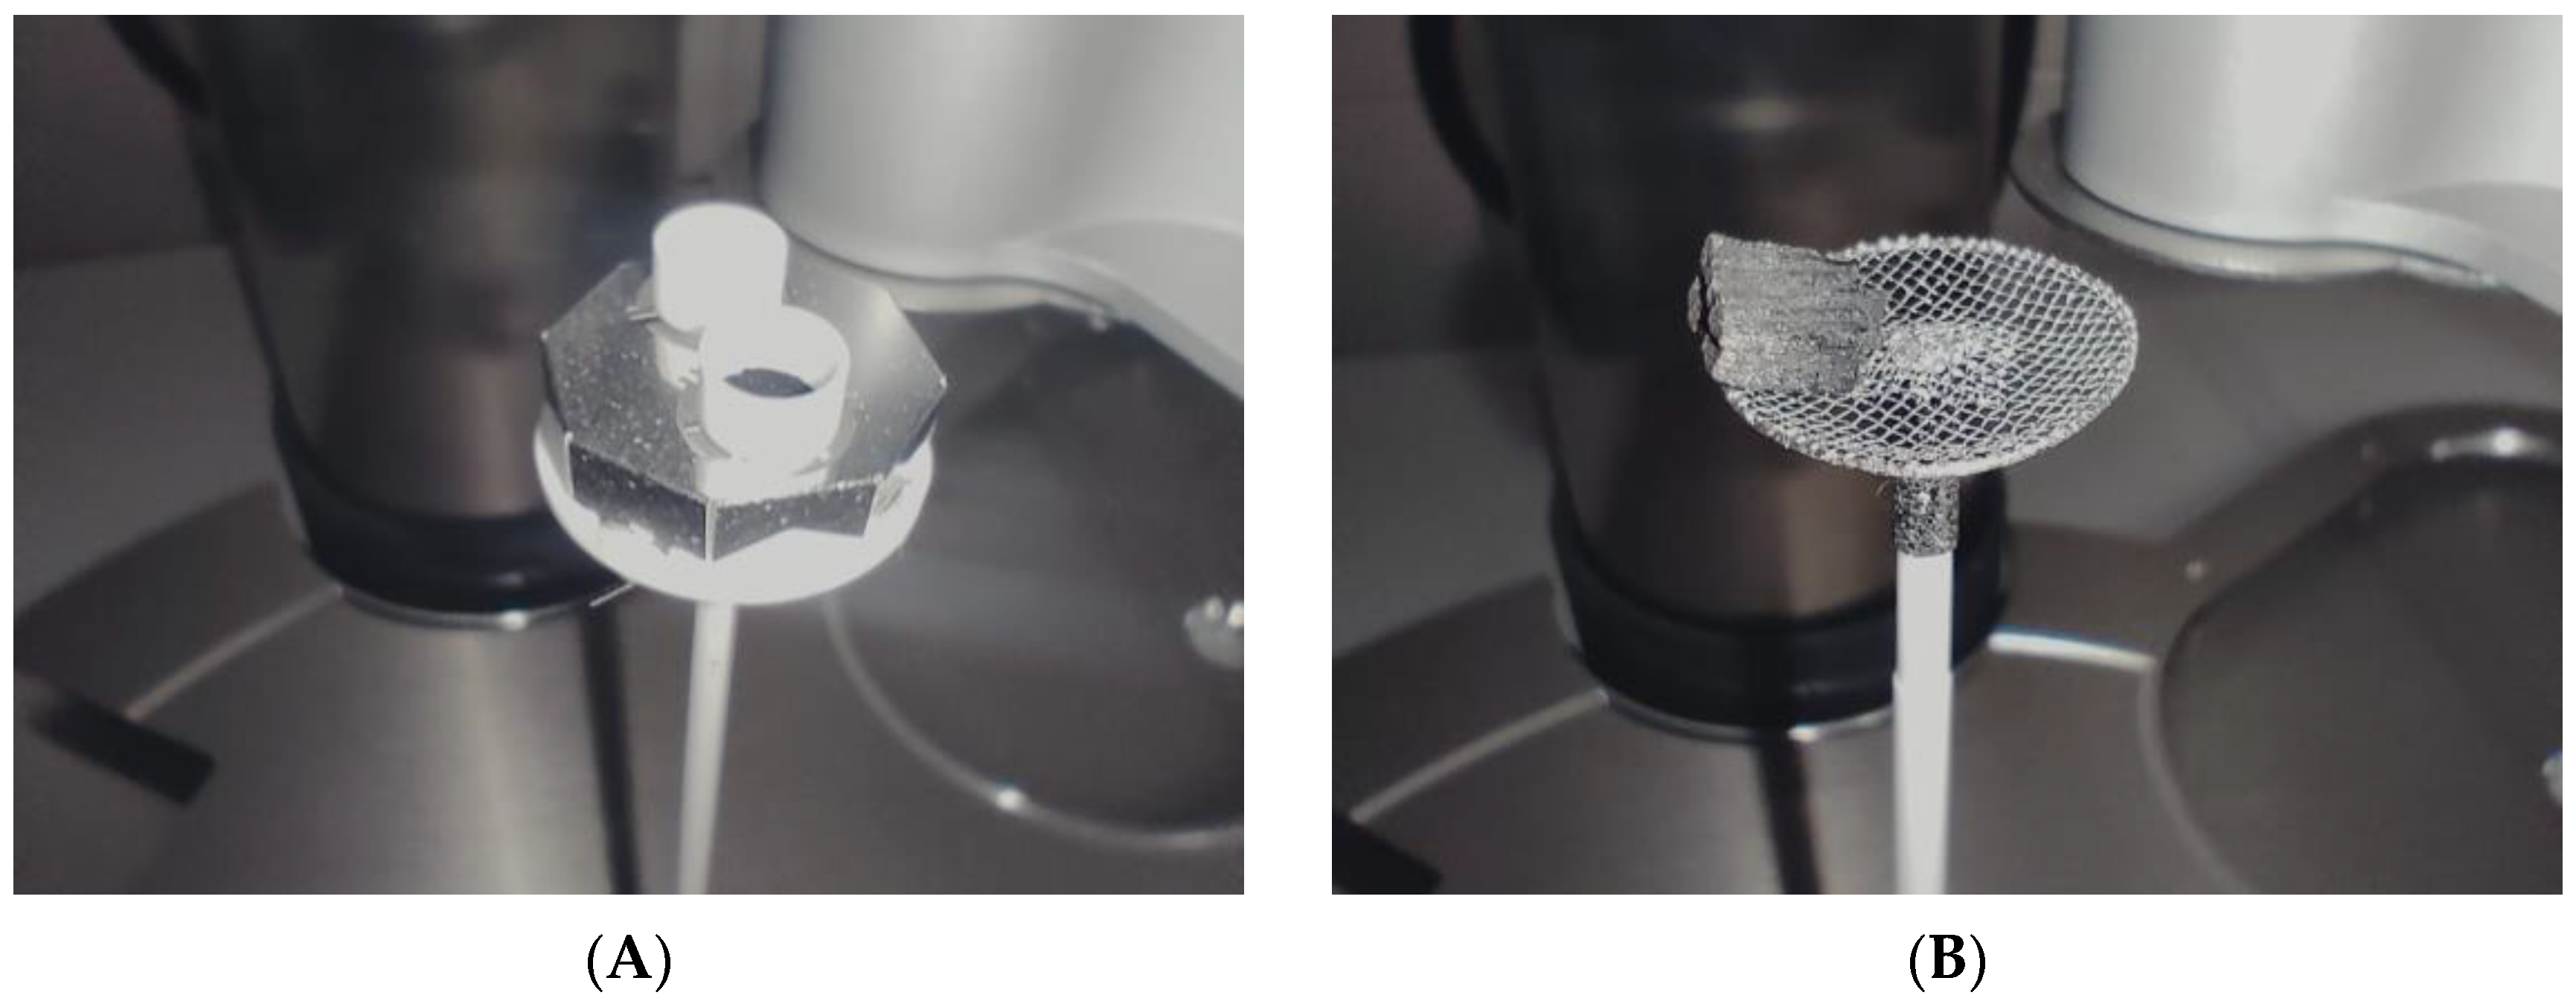
2.3. Single Particle Char Gasification

To compare the supposed chemically controlled reaction with a diffusion limited particle reaction, the single particle reactions were investigated. Therefore, a TGA sample carrier with a platinum mesh (100 Mesh/149 µm) was used to enable almost free gas flow at the particle surface. Both the DSC and TGA sample carrier are shown in Figure 9. Particles were placed aside from the thermocouple to eliminate the possibility of an over regulation of temperature due to endothermic reaction close to the thermocouple.
The gas flow rate was set to a total of 248 mL min−1. The volume fraction was set to v f , C O 2 = 0.14, for comparison with the experiments at the DBFZ’s laboratory reactor. Thus, a flowrate of CO2 was set to 35 mL min−1. Considering a particle with a starting mass of 30 mg, the CO2 supply by gas flow at 900 °C wad about six times the estimated chemical reaction rate. The temperature program is equivalent to Table 2. Particle mass was determined on a laboratory scale with ±0.1 mg. The approximated particle size was manually measured with a caliper. To maintain the natural shape and structure, the particles were not sanded to a cuboid form. The temperature was set to 770 °C, 800 °C, 850 °C and 900 °C.
Experiments with 850 °C were conducted separately and with v f , C O 2 = 0.125 to primarily produce different active carbon particles. Yet, the results were averaged and compared due to a small experimental difference of Δ v f , C O 2 = 0.015 compared to the fluctuating reaction rate observed, as later shown in the results.
The reaction rates evaluated from particle measurements were the average rate of the first 25% to 30% of conversion. The mass fraction was calculated as dry ash free (daf). Full decomposition of char was not achieved throughout the experimental time. Thus, the average ash content was used.

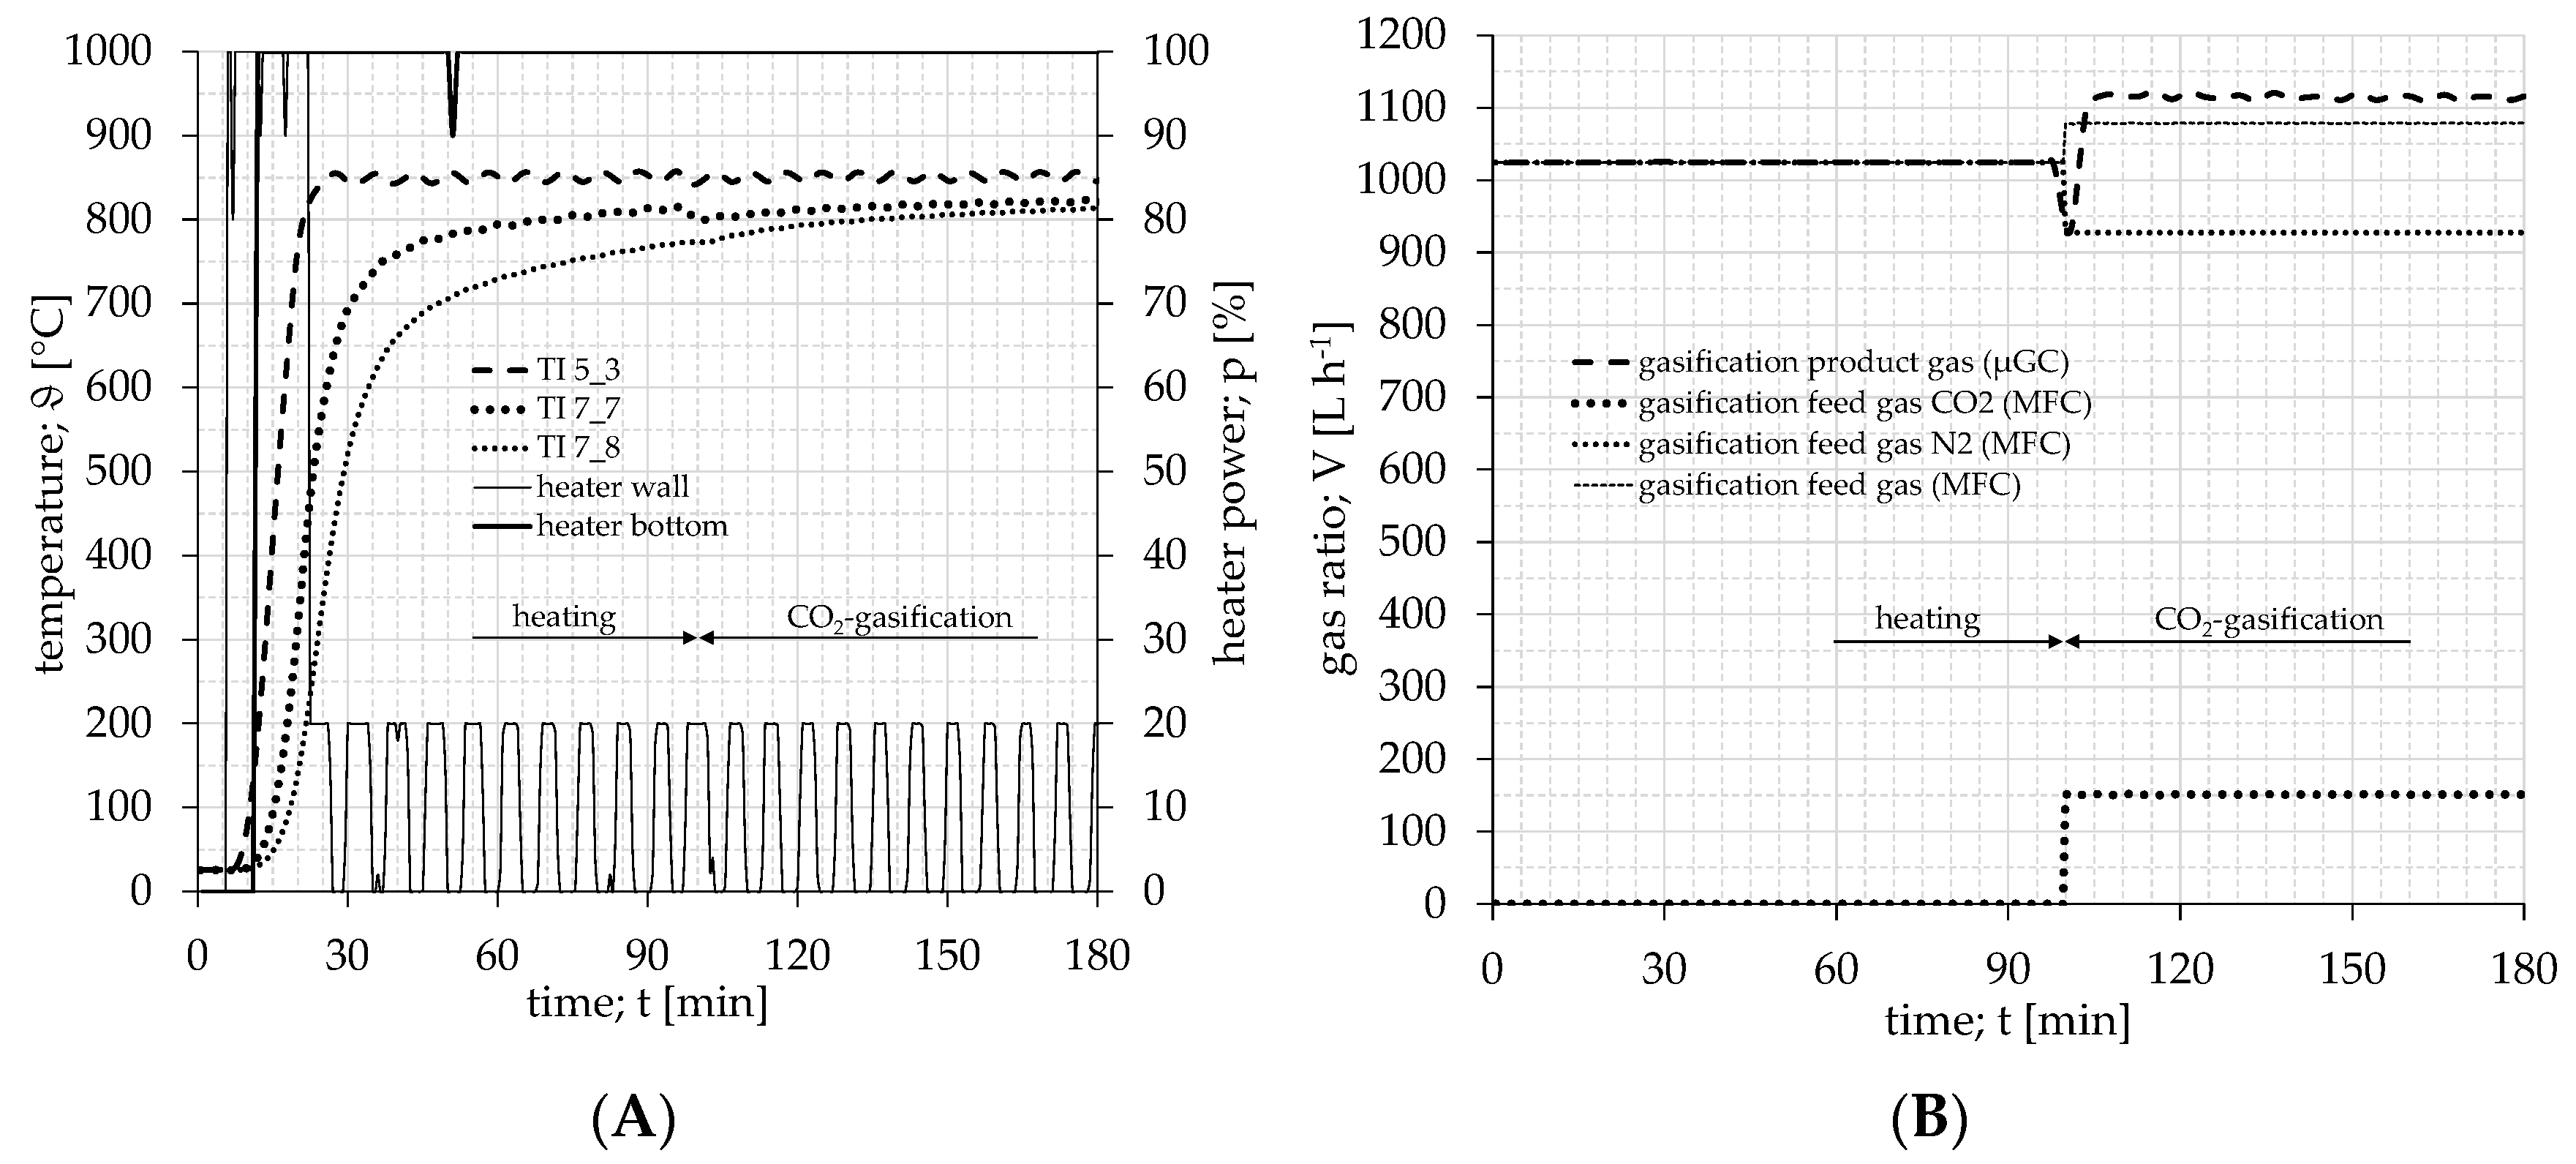
2.4. Fixed–Bed Batch Char Gasification

In addition to the gasification experiments at the TGA, the CO2 gasification was also investigated in the DBFZ fixed–bed batch reactor (Section 2.1). In these experiments, the char of the previous pyrolysis experiments was filled into the batch reactor (nearly 100 g). The char fixed–bed was brought to the target temperature of 800 °C with nitrogen directly in the reactor without prior switching to the bypass. After this temperature or a steady temperature profile within the reactor had been reached, CO2 was switched over as gasification agent. The nitrogen at 1000 L min−1 was replaced by a mixture of 905 L min−1 nitrogen and 95 L min−1 CO2 (Figure 10). This mixture ratio of nitrogen and CO2 was determined in coordination with the STA experiments to generate comparable results. Analogously to the pyrolysis experiments carried out before, the product gas concentration and amount were measured after the gas cooling. After 90 min CO2 gasification, the reactor was cooled with nitrogen (1000 L min−1) and switched–off heaters.

2.5. Model for Laboratory Reactor

For modelling the laboratory reactor, the adapted equations in Table 4 are used for the special case of the laboratory reactor. Here, a one–dimensional model is used. Therefore, the original with references are given and comparably listed with the adapted equations. The target is to determine more biomass-specific differences between chemical reaction, single particles, and char in a bulk.
It is important to mention that γ is the density of a species per 1 m3 of reactor volume (kg m−3R). The transport of solids and change of solid mass were reduced to a change of mass due to a batch experiment. Diffusive effects were neglected in gas transport between numerical elements. The gas velocity u g , n , i + 1 for each next timestep regards produced gas and temperature. For the special case of the laboratory reactor, a constant temperature was preliminary assumed and, therefore, energy terms and wall heating equations reduced to given temperatures.
Yet, the temperature could not be held constant over time and height throughout the experiments. Further information can be found in Section 3.4. Thus, the experimental temperature data from laboratory CO2 gasification was adaptively used to create representative time dependent polynomials (5) and (6) for the two thermocouples T7_7 and T7_8, respectively. Those were interpolated by polynomials of order four and two for T7_7 and T7_8, respectively, with the method of least squares. The subscripts for T7_7 and T7_8 are TC2 and TC1, respectively. For the individual time step, a linear regression between T7_7 and T7_8 was used to estimate the height dependent temperature.
The porosity of the particle was assumed to directly change with the mass of char. Hence, the char reaction rate was used to calculate increasing particle porosity by linking it with the factor ( 1 ε p , 0 ) .
Drying and pyrolysis were not applied. An effective reaction rate was described by an outer mass transport at the particle surface and effectiveness factor for internal pore diffusion effects, as used for catalysts by Jess and Wasserscheid [32]. Additionally, a modified Thiele–modulus is used with the assumption of a cylindrical particle and correction factor ω c f , which is described in Section 3.4 and discussed in Section 4. The binary diffusion coefficient was used with N2 as secondary gas.
The calculation was performed with MATLAB R2020a and the solver “ode113” was used. The code is provided in the Supplementary Materials.
Table 4. Model equations used to describe the laboratory reactor (equations no. refer to original and adaption left and right side respectively).
DescriptionOriginalRef.Adaption for Laboratory ReactorEquation No.
transport of solids and change of solid mass γ i t = u s γ i z + M i r i [4] γ c h a r t = r c h a r M c h a r (1a)(1b)
gas transport and γ j t = u g γ j z + z D j y j z + ε M j r j [4] γ j t = u g γ j z + M j j r j (2a)(2b)
gas velocitynot explicitly described in reference u g , n , i + 1 = u g , n 1 + R p 0 n z ε s j γ j T g i T g n (-)(3)
energy and heat transport γ s T s c p , s t = γ s u s T s · c p , s z + z λ s T s z + n r n H n , i + Q ˙ w s + Q ˙ g s [4] T T C 1 t = A T C 1 t 4 + B T C 1 t 3 C T C 1 t 2 + D T C 1 t + E T C 1 (4)(5)
T T C 2 t = A T C 2 t 2 + B T C 2 t + C T C 2 (6)
T z , t = T T C 2 T T C 1 Z T C 2 Z T C 1 z z T C 1 + T T C 1 (7)
γ g T g c p , g t = γ g u g T g c p , g z + z λ g T g z + ε m r m H m , j + Q ˙ w g + Q ˙ s g A T C 1 = −2.0448 × 10⁻¹⁴
B T C 1 = 5.5397 × 10⁻¹⁰
C T C 1 = −4.9341 × 10⁻⁶
D T C 1 = 2.2135 × 10⁻²
E T C 1 = 7.6942 × 10²
A T C 2 = −6.1077 × 10⁻⁷
B T C 2 = 7.1354 × 10⁻³
C T C 2 = 8.0184 × 10²
(8)(-)
wall heater T w t = z λ w T w z + Q ˙ e l · d z l R + Q ˙ g w + Q ˙ s w · d V π 4 d R , o d R , i 2 ρ w c p , w d z [4]not applied(9)(-)
particle porosity ε p t = u s ε p z i γ i t 1 ε ρ i [4] ε p t = r c h a r M c h a r 1 γ c h a r , 0 ( 1 ε p , 0 ) (10a)(10b)
water evaporation r v = S p , o β H 2 O c H 2 O , s a t c H 2 O [33]not applied(11)(-)
pyrolysis r p y r = m b m k 0 , p y r M b m e E A , p y r R · T [4]not applied(12)(-)
mass transport coefficient β j = S h j D j , N 2 d p [32]applied(13)(-)
Sherwood–number S h j = 1.9 · 2 + 0.644 R e 0.5 S c j 0.33 [32]applied(14)(-)
binary diffusion coefficient D j , N 2 = 1.43 × 10 7 T 1.75 1 M j + 1 M N 2 1 2 2 G j 1 3 + G N 2 1 3 2 [34]applied(15)(-)
effective diffusion coefficient D j , e f f = ε p τ D p o r e
with τ = 3 and D p o r e =   D j , N 2
[32]applied(16)(-)
modified Thiele–modulus Φ = d p 6 v c , j + 1 2 k c h a r , j , c h e m ρ c 1 ε p c j v c , j 1 D j , e f f [32] Φ = ω c f d p 6 v c h a r , j + 1 2 k c h a r , j , c h e m ρ c h a r 1 ε p c i v c , j 1 D j , e f f (17a)(17b)
effectiveness factor η = t a n h Φ Φ [32]applied(18)(-)
effective reaction rate k c h a r , j , e f f = 1 1 S p , o β j c j 1 v c , j + 1 η k c h a r , j , c h e m [35]applied(19)(-)

3. Results and Discussion
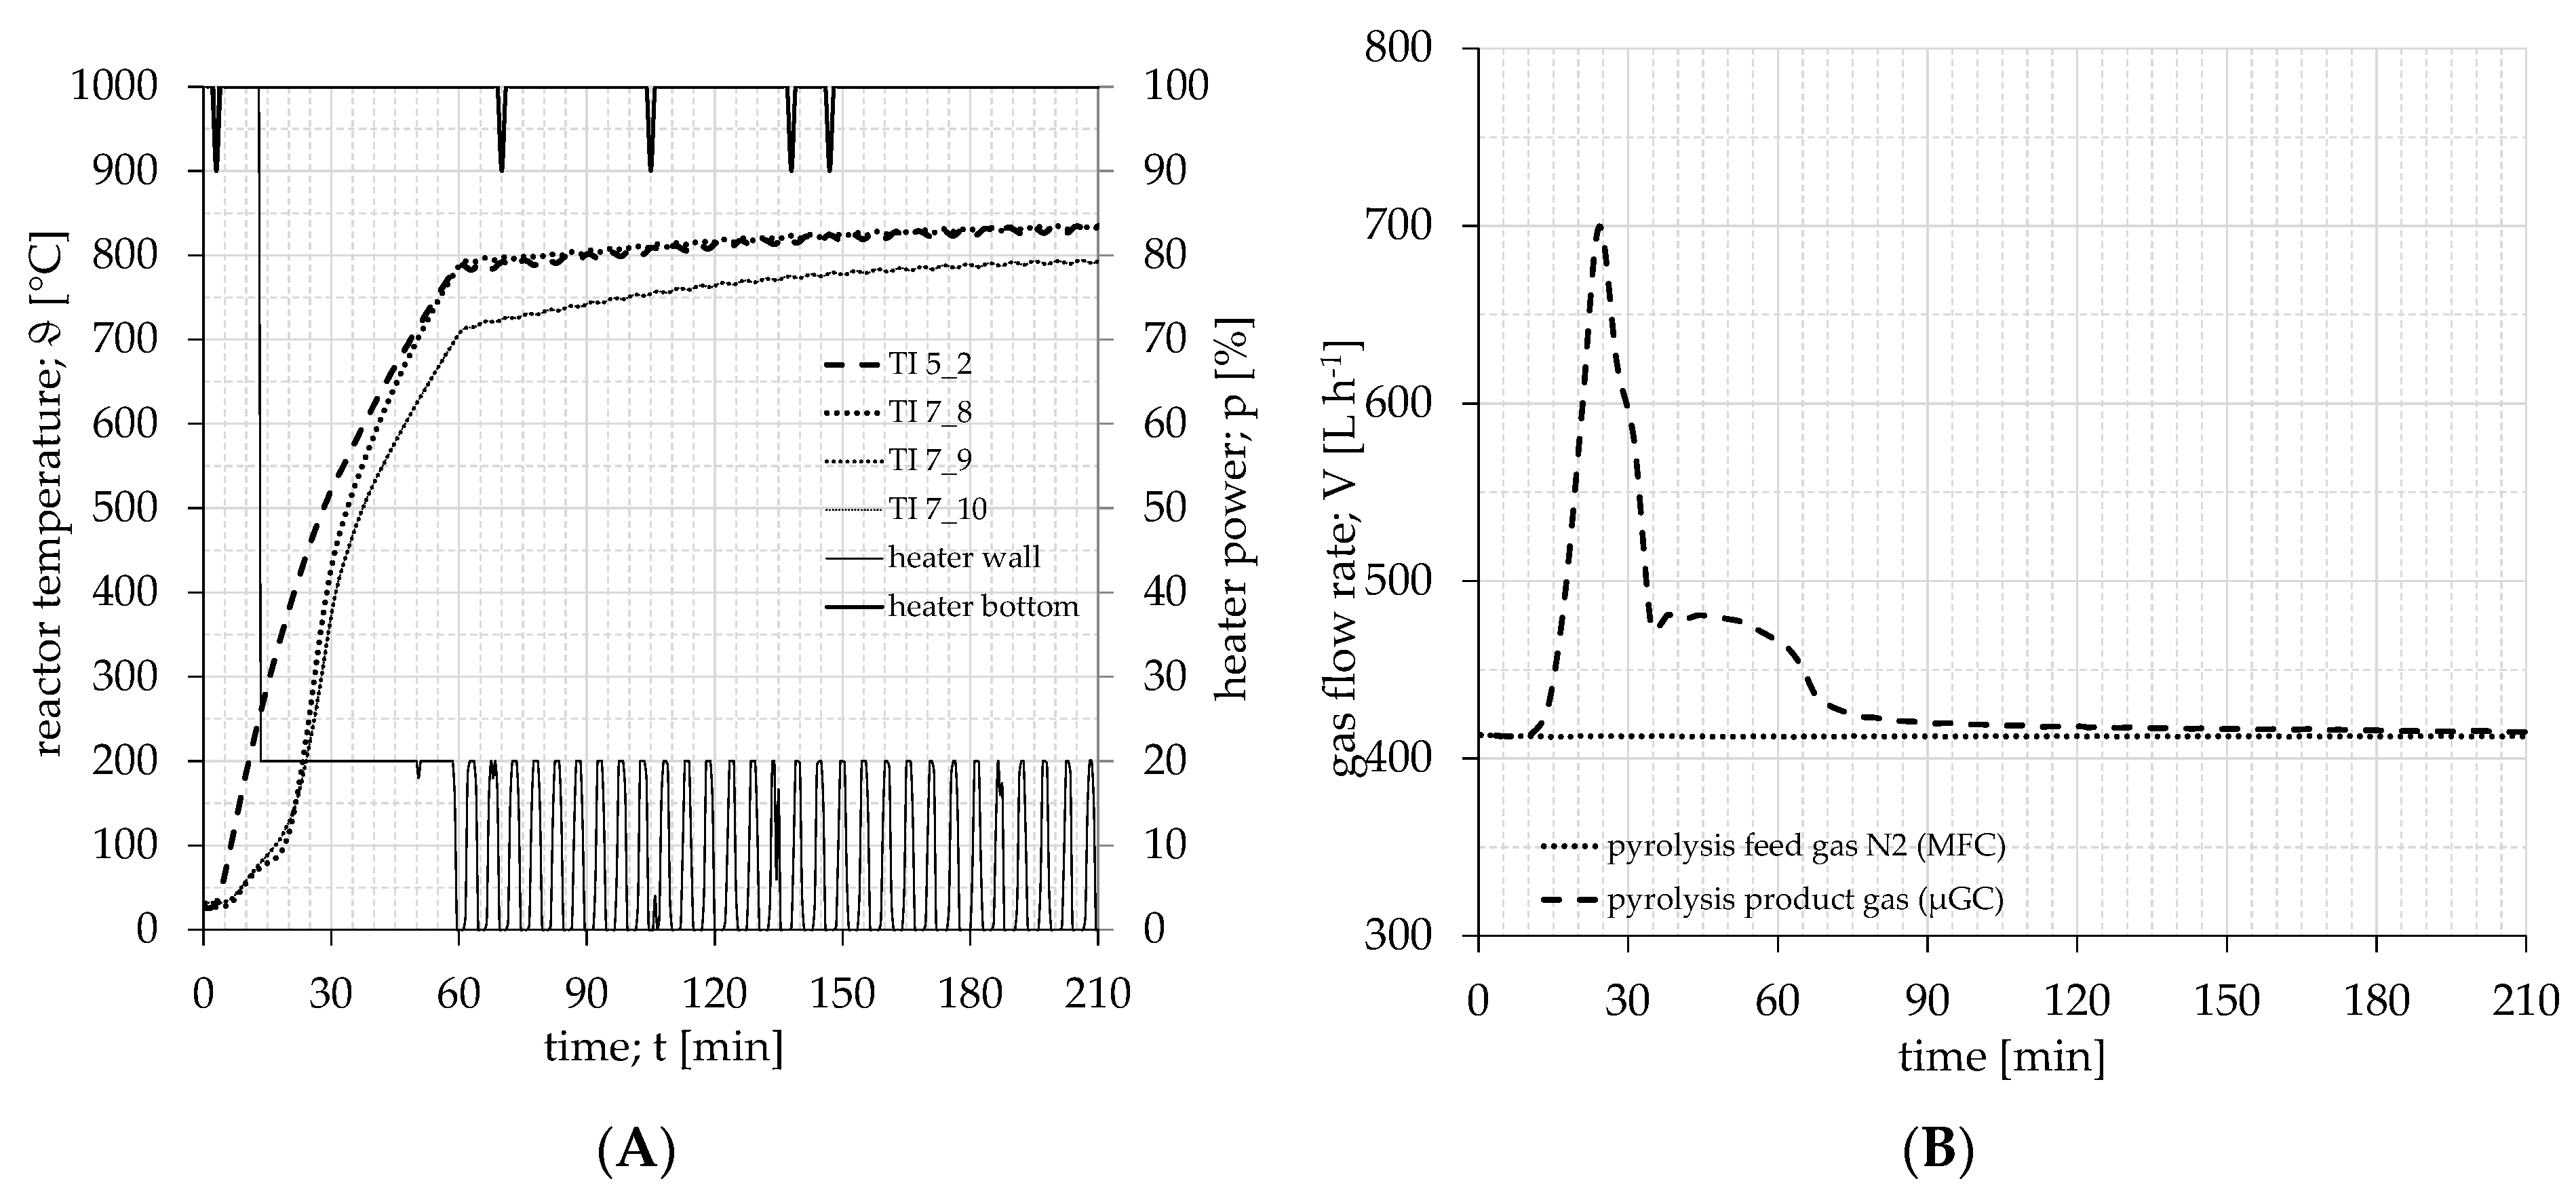
3.1. Pyrolysis

As result of the different pyrolysis experiments, the measured product gas concentrations are shown in Figure 11. For all three pyrolysis temperatures, the characteristic product gas profile is nearly identical. The profiles are only time–shifted.
First, CO and CO2 concentrations rise to a peak of 17.5 vol.%. Nearly four minutes later, the CH4 concentration also rises to a 6 vol.% peak. The CO and CO2 concentrations decrease uniformly again to 0 vol.%. The CH4 concentration drops to 3 vol.% and then rises again to a second peak with 4 vol.%. Then, it drops evenly to 0 vol.%. The H2 concentration rises approximately at the same time as the CH4–concentration, but with a much flatter increase, resulting in a 9.5 vol.% peak, which takes 35 min to increase. After that, the H2 concentration drops only as fast as it has risen and then flattens off. At the end of the experiment, the H2 concentration drops from 1.8 vol.% to 0.6 vol.% in 120 min.
For the pyrolysis experiments at 500 °C, 850 °C and 850 °C/900 °C for several measurements, the following mass balances could be established. They show a stable ratio between the product components (char, gas, condensate in relation to the fuel–input) for the different experiments. So, the input–fuel was transformed by pyrolysis: 500 °C to 25–26% char, 14–15% dry gas and 59–61% condensable parts (water and tar). By pyrolysis with 850 °C and 850 °C/900°C, the fuel transformed to 21–22% char, 18–19% dry gas, and 57–61% condensable parts. An overview is provided in Table 5. The condensable components are calculated as the difference between input (fuel) and output (char and gas) and cannot be detected or separated by measurement technology with the currently existing experimental setup. In the future, the condensable components are to be separated by measurement using a steam analyzer or FTIR in the hot product gas. The composition of dry gas is shown in Table 6.

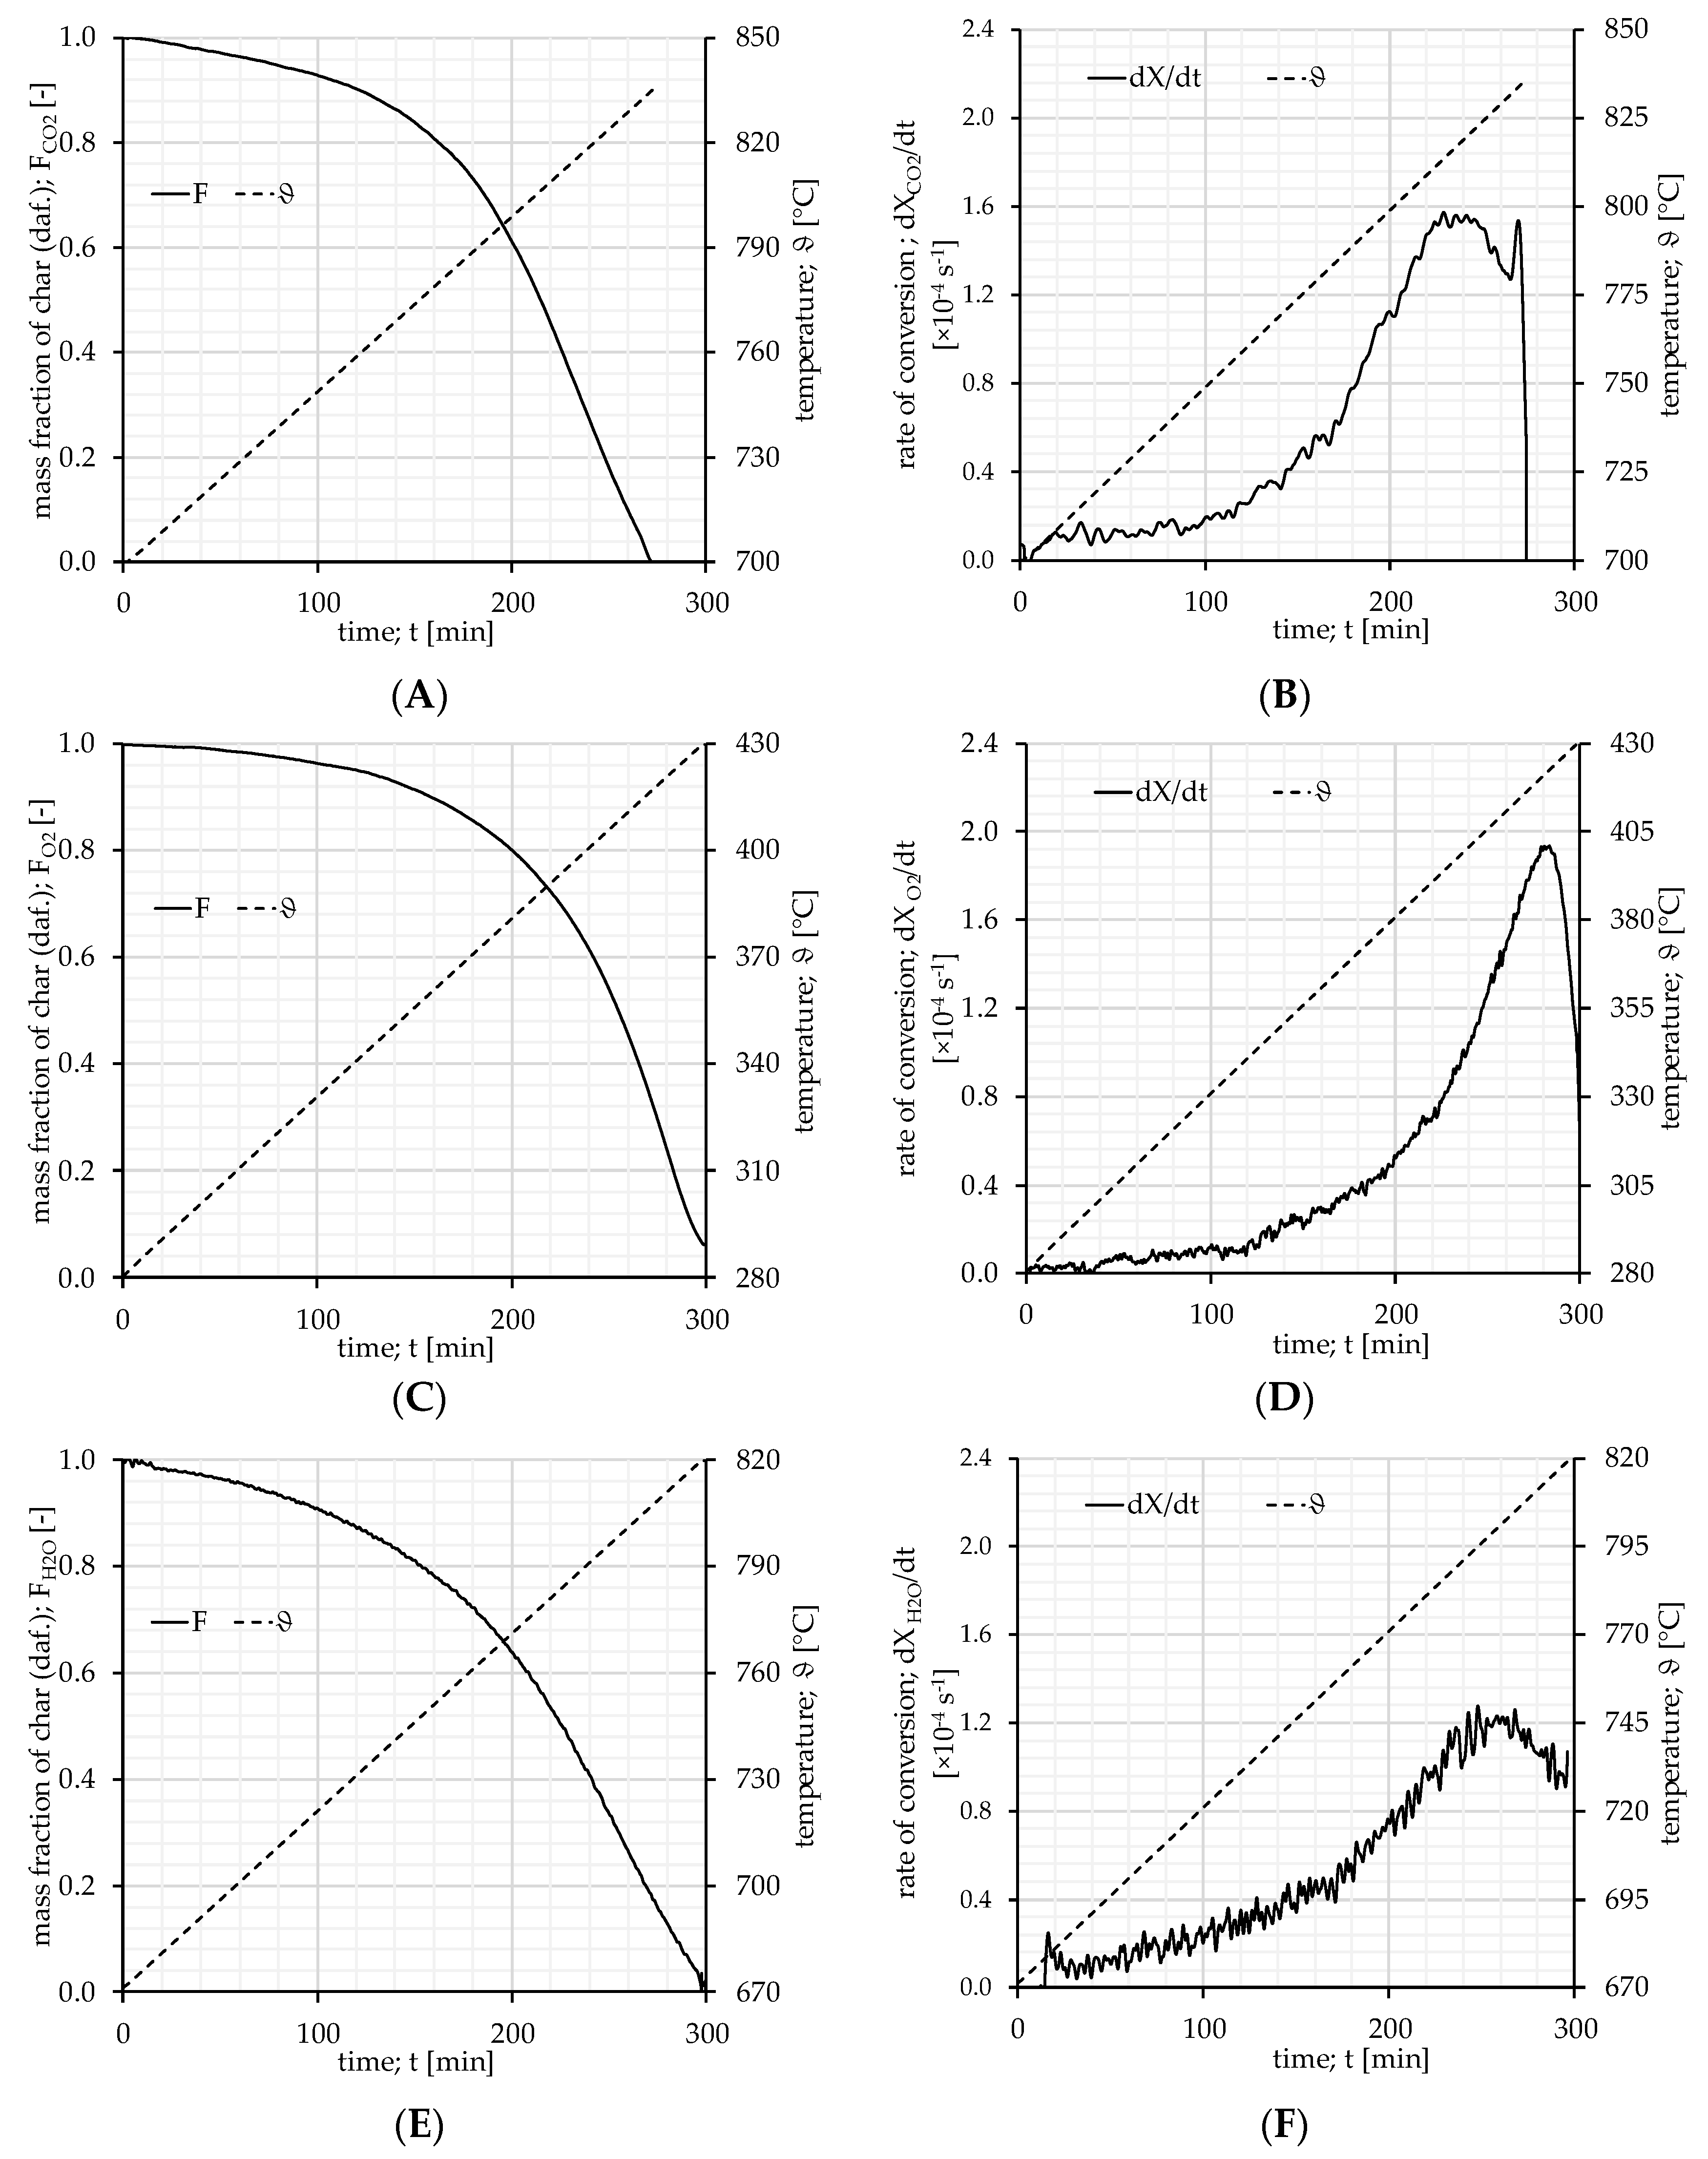
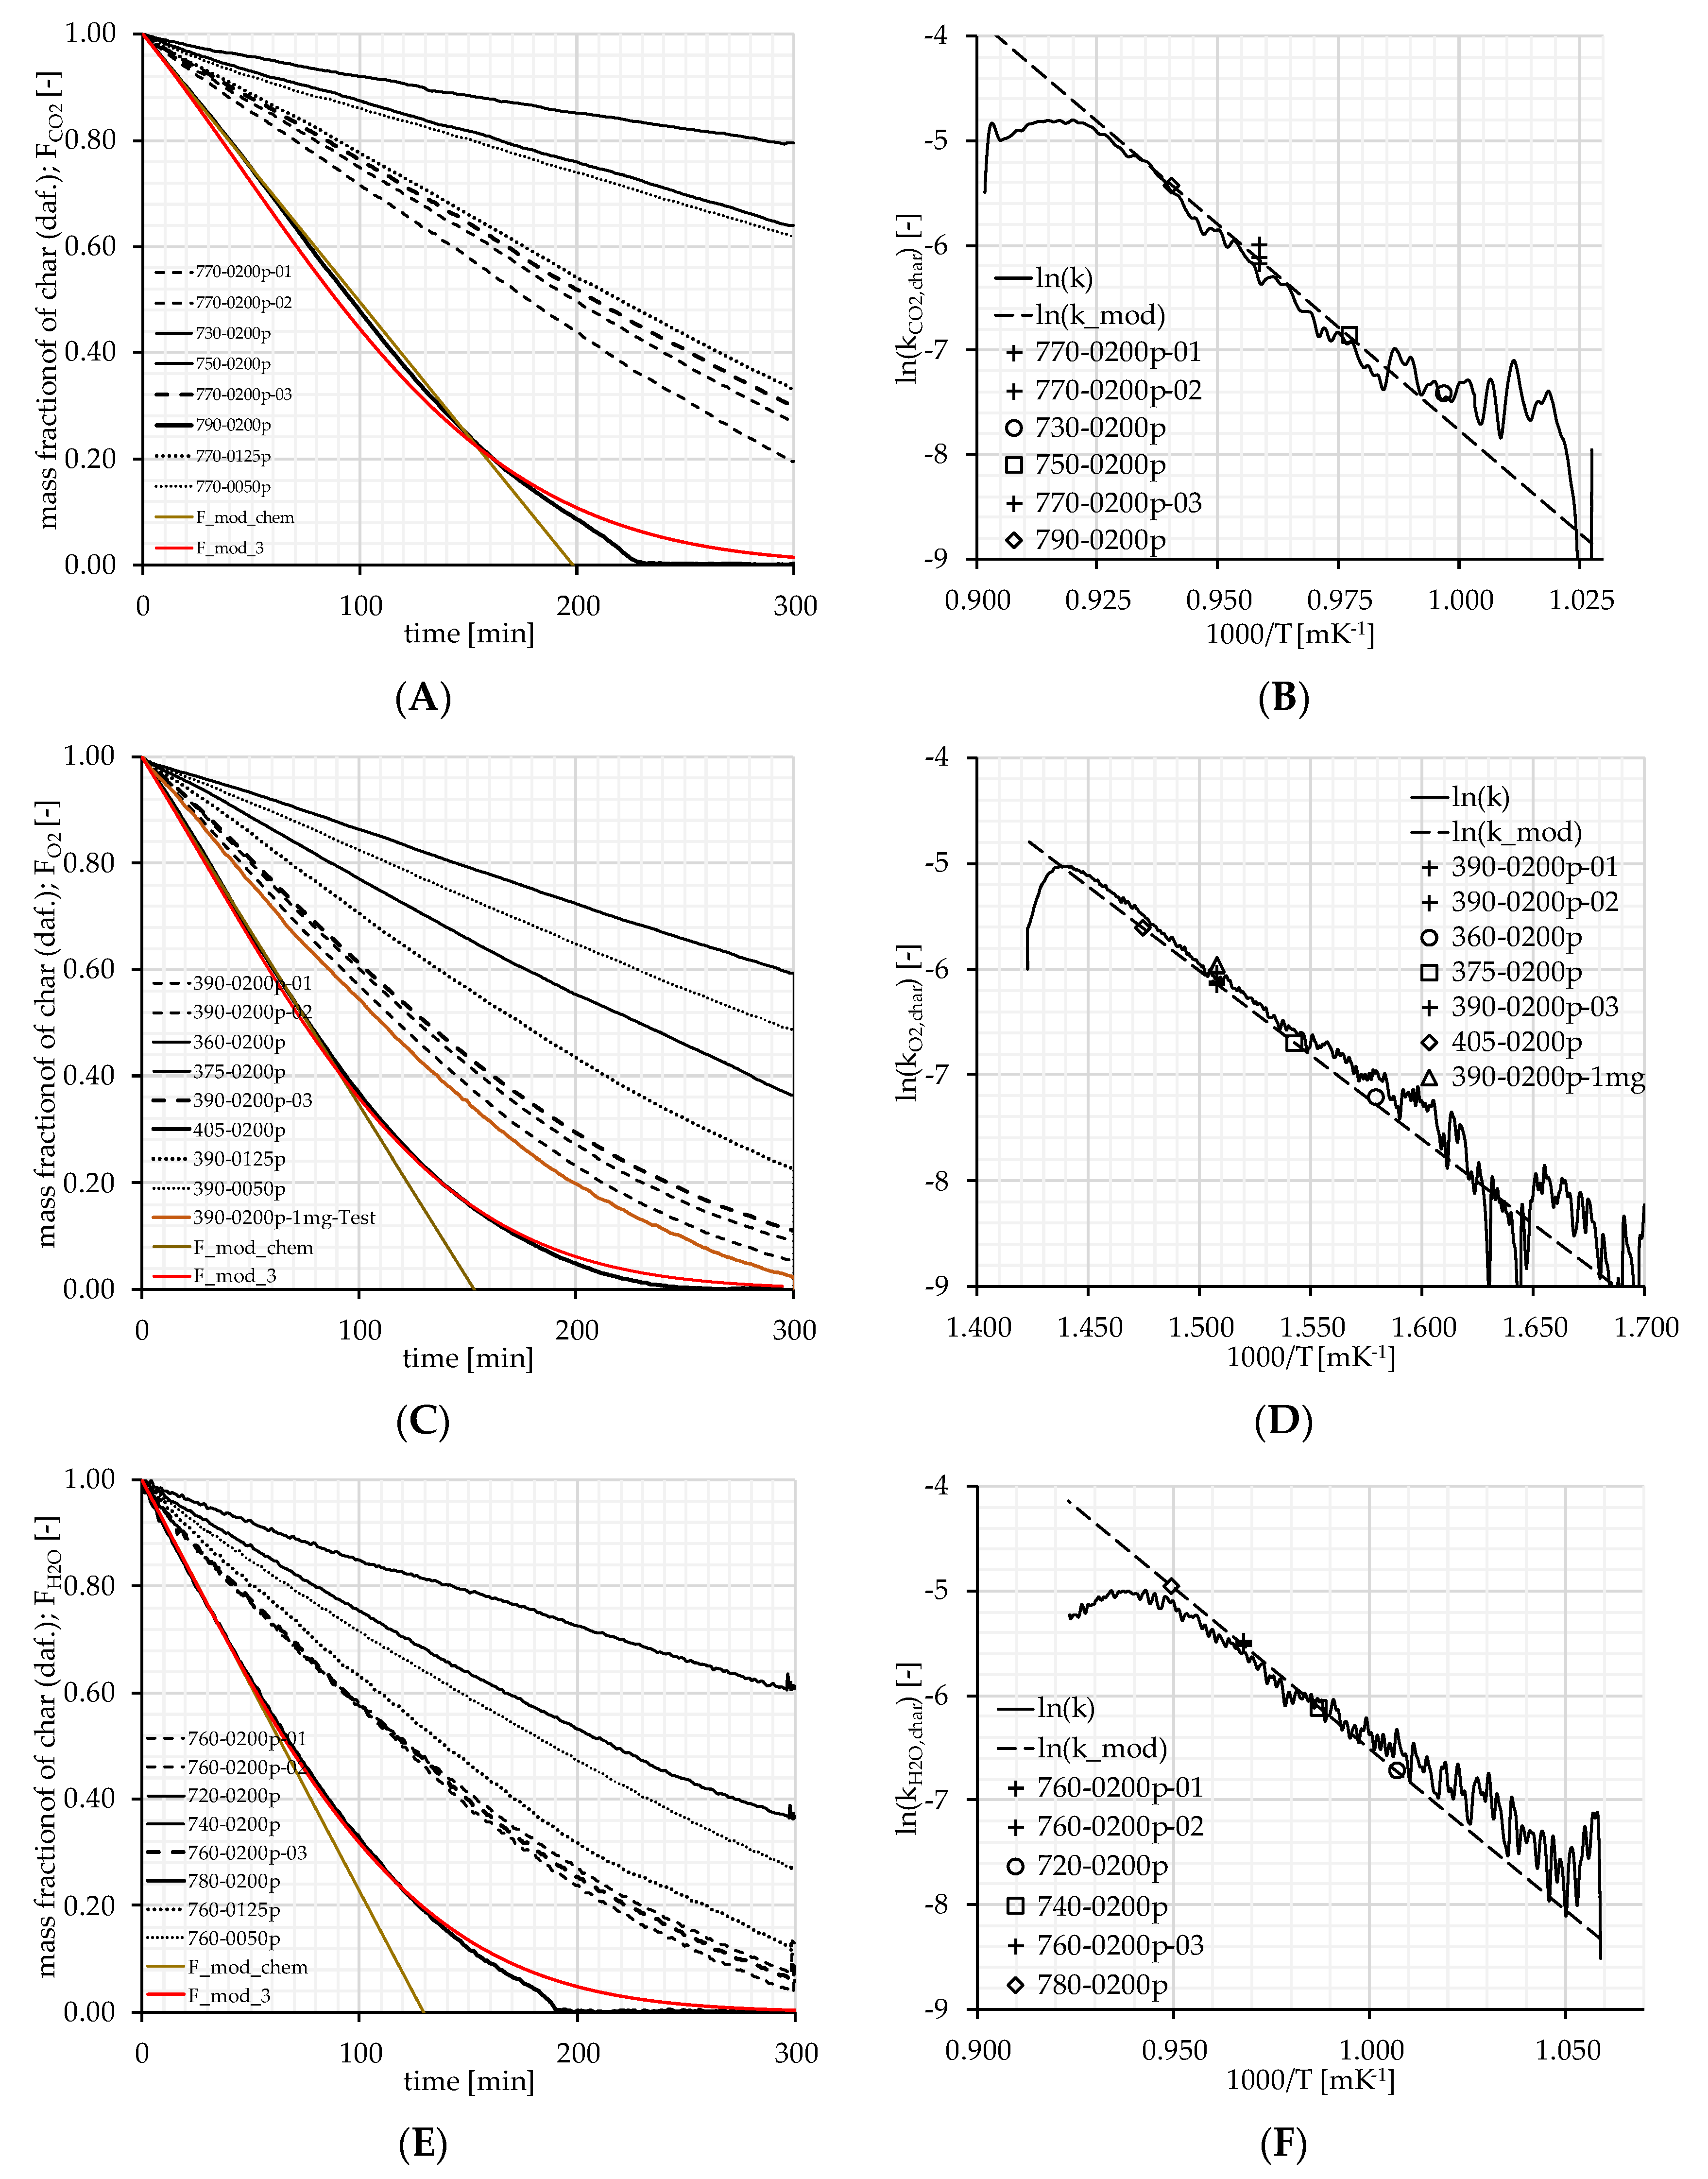
3.2. Char Powder Gasification

For gasification and combustion kinetics, studies report on several models to describe the char combustion. The approach with an Arrhenius–equation is commonly used and modified to obtain a fitting model equation [8]. Here an approximation also based on an Arrhenius equation was used similar to Gradel et al. to evaluate the parameters E A , A 0 , and ν [4]. The following assumptions are made:
  • the dependence on actual mass is of order zero in the first 25% of conversion;
  • the reaction rate is chemically controlled without diffusion effects;
  • a simple power law applies with respect to the reactive gas concentration;
  • M c h a r is a hypothetical molar mass based on an ultimate analysis;
  • m 0 , c h a r is dry and ash free (daf).
Therefore, a zero-order approach for the solid fuel was used as shown in Equation (20).
d m t , c h a r d t = m 0 , c h a r M c h a r c j ν j , c h a r A 0 , j , c h a r e E A , j , c h a r T · R
Morin et al. showed a list of kinetic expressions from former investigations of char combustion, such as those from Kashiwagi and Nambu [36] or Várhegyi, Sebestyén et al. [37], where dependence on the gas fraction is considered by partial pressure. Here, the gas concentration is used. The gas concentration is calculated by Equation (21).
c j ( T ) = p a m b v f , j R T
The experimental value evaluated is the mass fraction F ( t ) . To calculate E A , j , c h a r , A 0 , j , c h a r and ν j , c h a r the change of mass fraction is used as described with Equation (22).
d F d t = d m t , c h a r d t 1 m 0 , c h a r
Although the char was from a preliminary 850 °C pyrolysis, the TGA experiments show changes in mass during the first steps. Until step #4, a change due to evaporation of adsorbed water is assumed. Yet, a slight weight loss is additionally observed during the next heating phase with the investigated samples. This weight loss starts immediately with the heating step #4 at 130 °C and ends with step #5 when reaching Ttarget. The total weight loss during this period is 3–5 wt.% (of starting char mass). In the following stabilizing step #6, no weight loss occurs and a stagnation plateau can be observed. The weight loss until stagnation plateau d m s t a g is used to calculate m 0 , c h a r and m t , c h a r where m i , c h a r was the initial char mass:
m 0 , c h a r = m i , c h a r d m s t a g m a s h
m t , c h a r = m i , c h a r d m s t a g m a s h
Preliminary tests showed differences regarding the leftover ash in the TGA after a long reaction time with the different gases as listed in Table 7. Here, a standard deviation of up to 2.64 wt.% in ash content can be found. This may lead to an estimated total error of up to 6% in the evaluated value for d F d t .
For the kinetic plots, k j , c h a r , m o d e l was calculated as follows:
k j , c h a r , m o d e l T = A 0 , j , c h a r e E A , j , c h a r T · R
Logarithmic linear regression was used to evaluate E A , j , c h a r , A 0 , j , c h a r by temperature variation and isolating k j , c h a r , m o d e l .
A 0 , j , c h a r e E A , j , c h a r T · R = d F 75 d t c j ν j , c h a r M c h a r
Further, ν j , c h a r was evaluated with the established values for E A , j , c h a r , A 0 , j , c h a r and the change of gas concentration in the experiments.
In Figure 12, the experimental data is shown. The “ F m o d , c h e m ” line depicts the line for the evaluated model parameters from the first 25% of conversion without any limitation enhancements. Equation (27) is a model enhanced by a term based on the research for the random pore model of Bhatia and Perlmutter [38,39]. Here, a structural parameter Ψ j is shown and may be described by Equation (28).
d F m o d 3 d t = M c h a r c j v j , c h a r A 0 , j , c h a r e E A , c h a r , j R · T F 1 Ψ j ln ( F )
Ψ j = 4 π L 0 1 ε 0 S 0 2
Values for L 0 and S 0 were shown on a scale of 3 × 106 cm cm−3 and between 2 × 10³–1.5 × 105 cm² cm−3, respectively, by Bhatia and Perlmutter [38]. Yet, those values were not evaluated or applied in this study and the structural parameter Ψ j was fitted by the least sum of squares for each reactive gas separately and only after evaluation of E A , j , c h a r , A 0 , j , c h a r and ν j , c h a r which are shown in Table 8.
Since the experiments showed a significant change in reaction at around F = 0.5 , an additional experiment with 1 mg powder instead of 2 mg was conducted to evaluate if the char powder height in the crucible or starting mass may be further influential. The experiment showed similar reaction behavior and only slightly faster decomposition, and thus assumed less influential as it was only half the starting mass.
In Figure 12A,E compared to Figure 12C, the curvature changes at around F = 0.2 and reaction takes place faster. In some cases, this is also later observed in particle measurements in Figure 14C in Section 3.3. While using least square fitting for Ψ C O 2 , it may cause a slightly higher value for Ψ C O 2 . In consequence, this may lead the model equation to a rate underestimation for F 0.2 and a rate overestimation for F 0.2 .

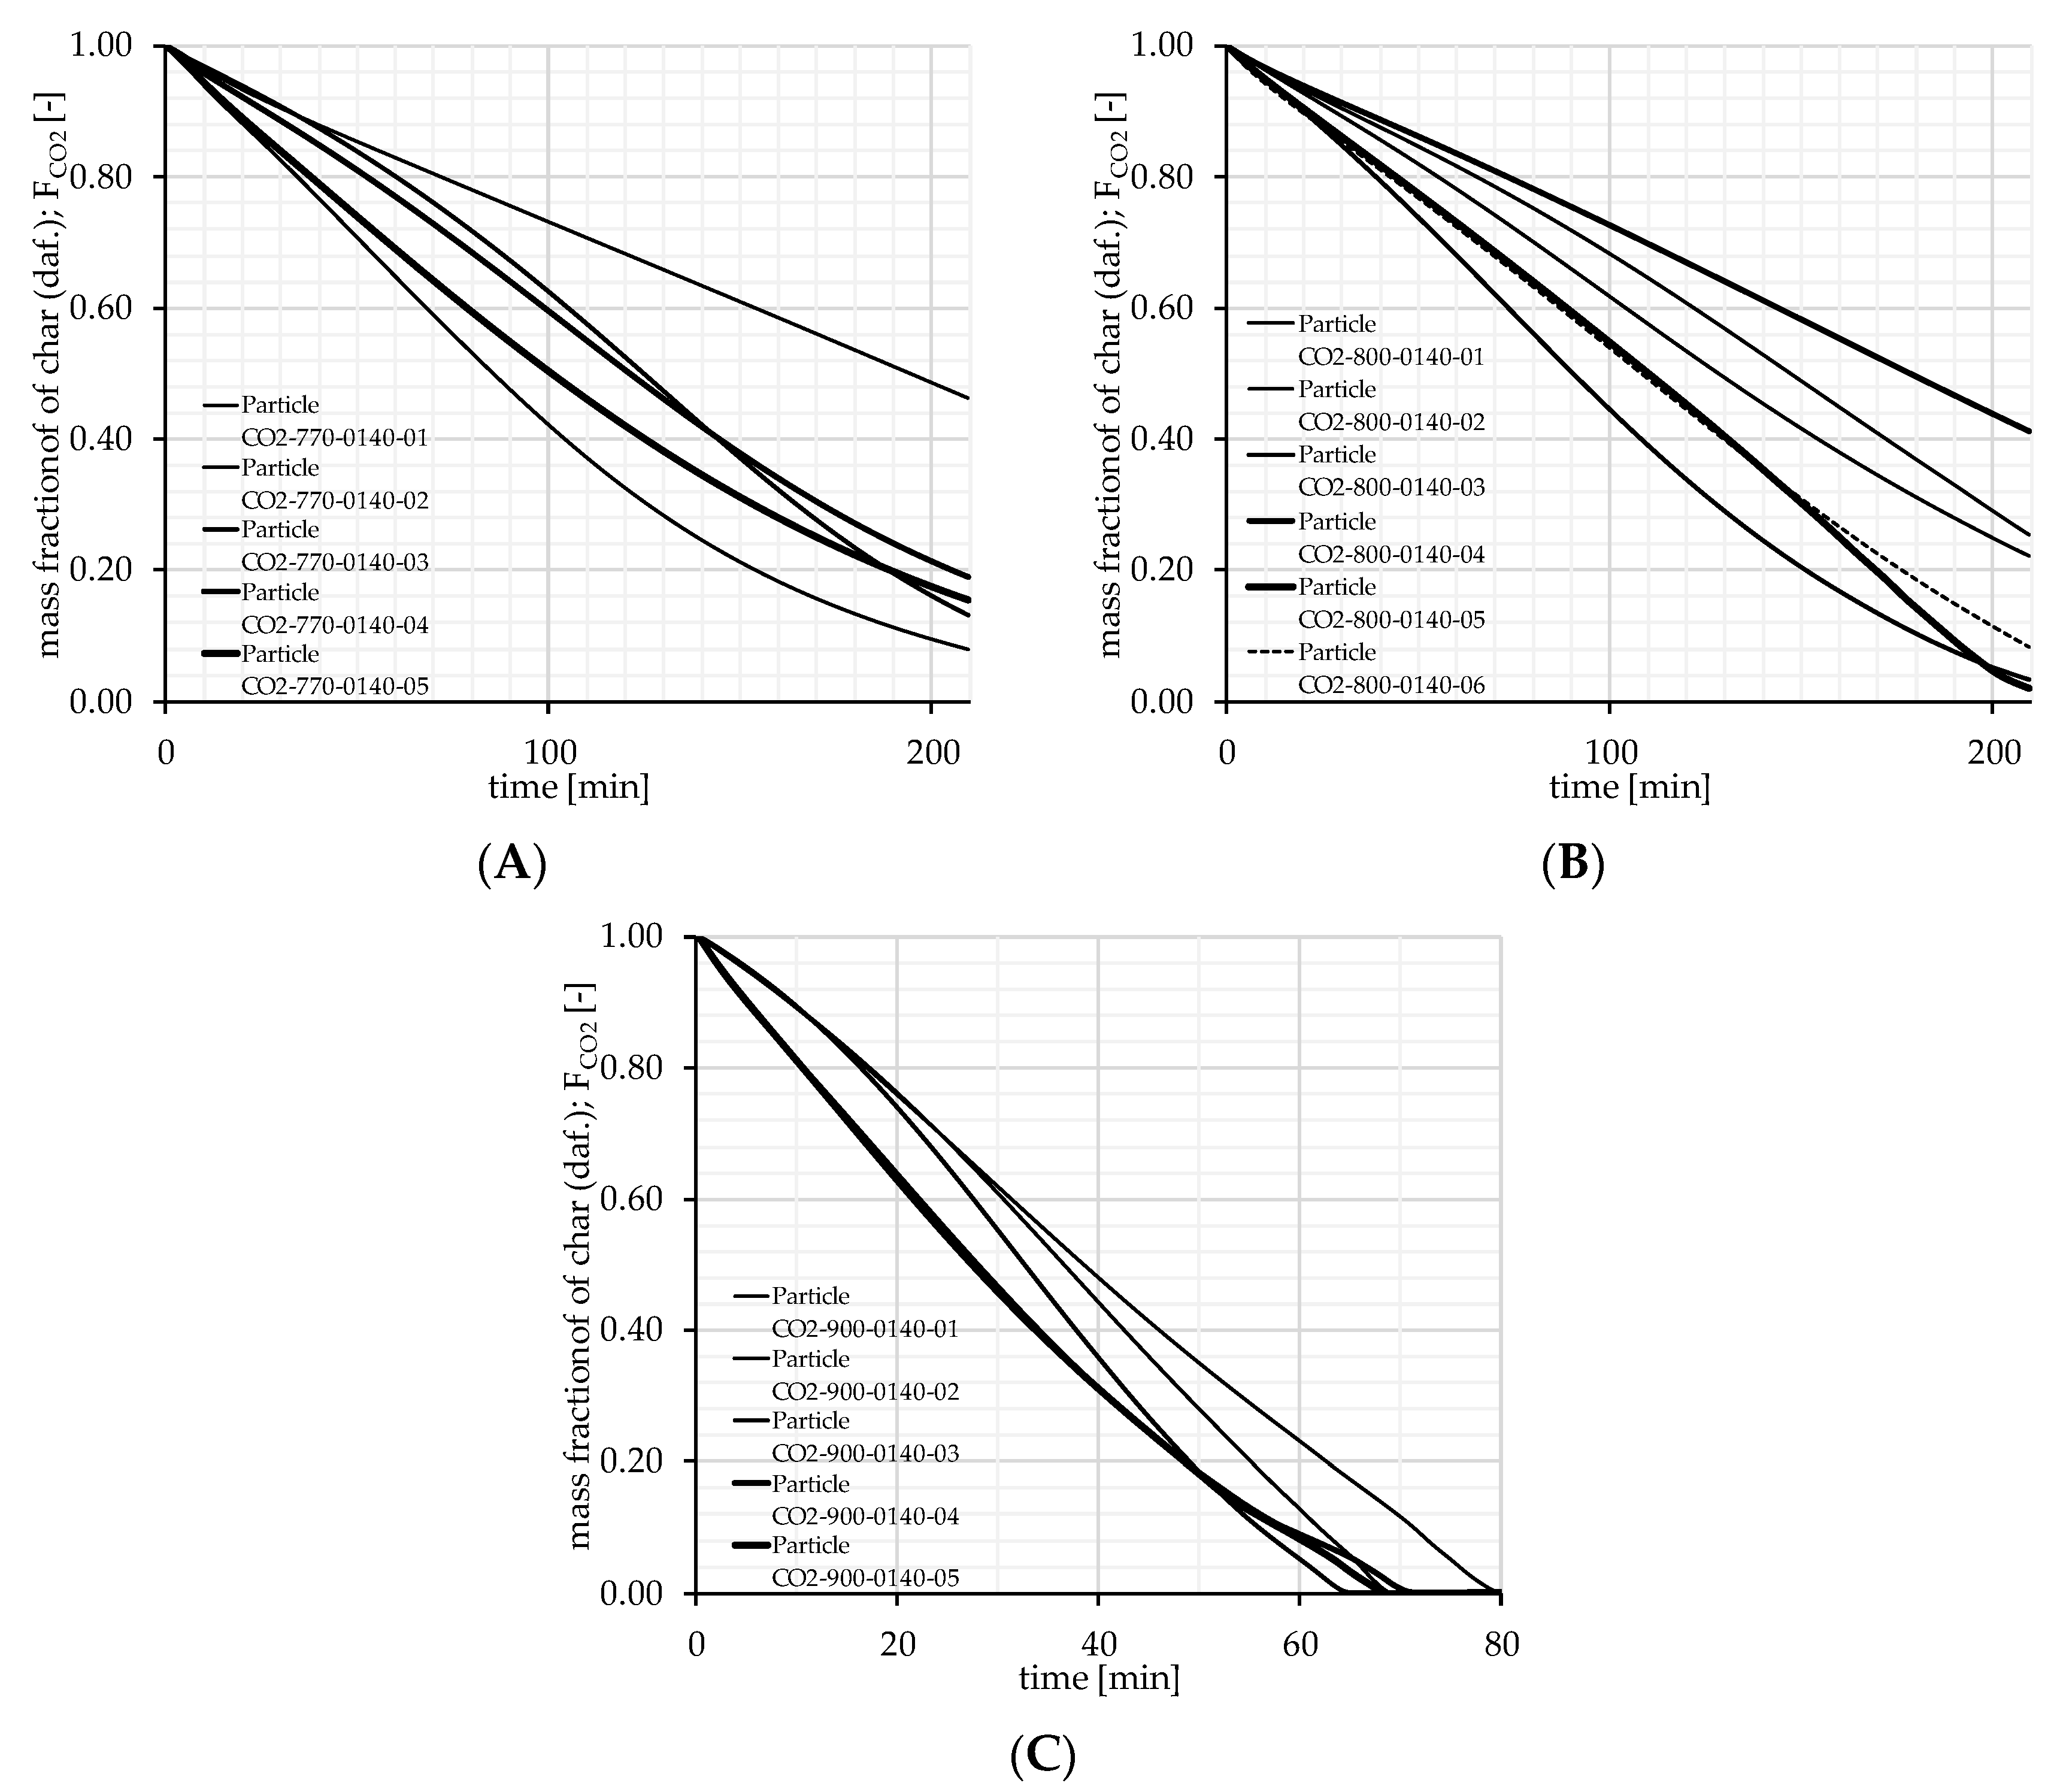
3.3. Single Particle Char Gasification

Particle reaction and powder reaction are compared in Figure 13, where powder reaction is calculated by Equation (25) and the effective limitation k c h a r , j , e f f is calculated and applied by Equation (19). To achieve the appropriate limitation with Equation (17b), a tentative correction factor of ω c f = 10 was introduced. Without this factor, k c h a r , j , c h e m and D j , e f f are key influential parameters under the square root. Yet, k c h a r , j , c h e m was evaluated by experiments and D j , e f f was calculated by Equation (16) and showed good agreement in the former investigations [4,34]. The correction factor is further discussed in Section 4. The influence of d p is depicted by two dashed lines with lower and upper boundaries of d p for comparison purpose. Since the standard deviation of the reaction rate in particle measurements is around ±20%, these totaling 40% are roughly depicted by the spread of lines and thus show the significant influence of d p as a particle size parameter.
The rate evaluated in batch measurements of the DBFZ is assumed with an average temperature of 810 °C with a standard deviation of 12 °C depicted horizontally. Here, particle measurements with 800 °C and v f , C O 2 = 0.14 already show a higher reaction rate. Thus, this underlines a significant gap between single particle and bulk measurements.
The measurement of particles at 770 °C on the gridded sample carrier showed higher reaction rates than the supposed chemically controlled reaction rate by powder measurements. Yet, the mean particle reaction rate at 770 °C was higher by a factor of two. Some particle rates were higher by a factor of three. Also, the particle measurements at 770 °C show higher rates than those at 800 °C.
Figure 14A–C shows the mass fraction during experiments. Here, the differences become clearer to see as the particles react quite differently. Some particles show a stronger decomposition at the beginning and tend to a lower reaction rate in the end, and vice versa. Thus, the divergence in reaction rate for a single particle tends to narrow close to full conversion in some cases. Anyways, the reaction rate after a conversion of 0.25 was used for comparison of particle and powder measurements.

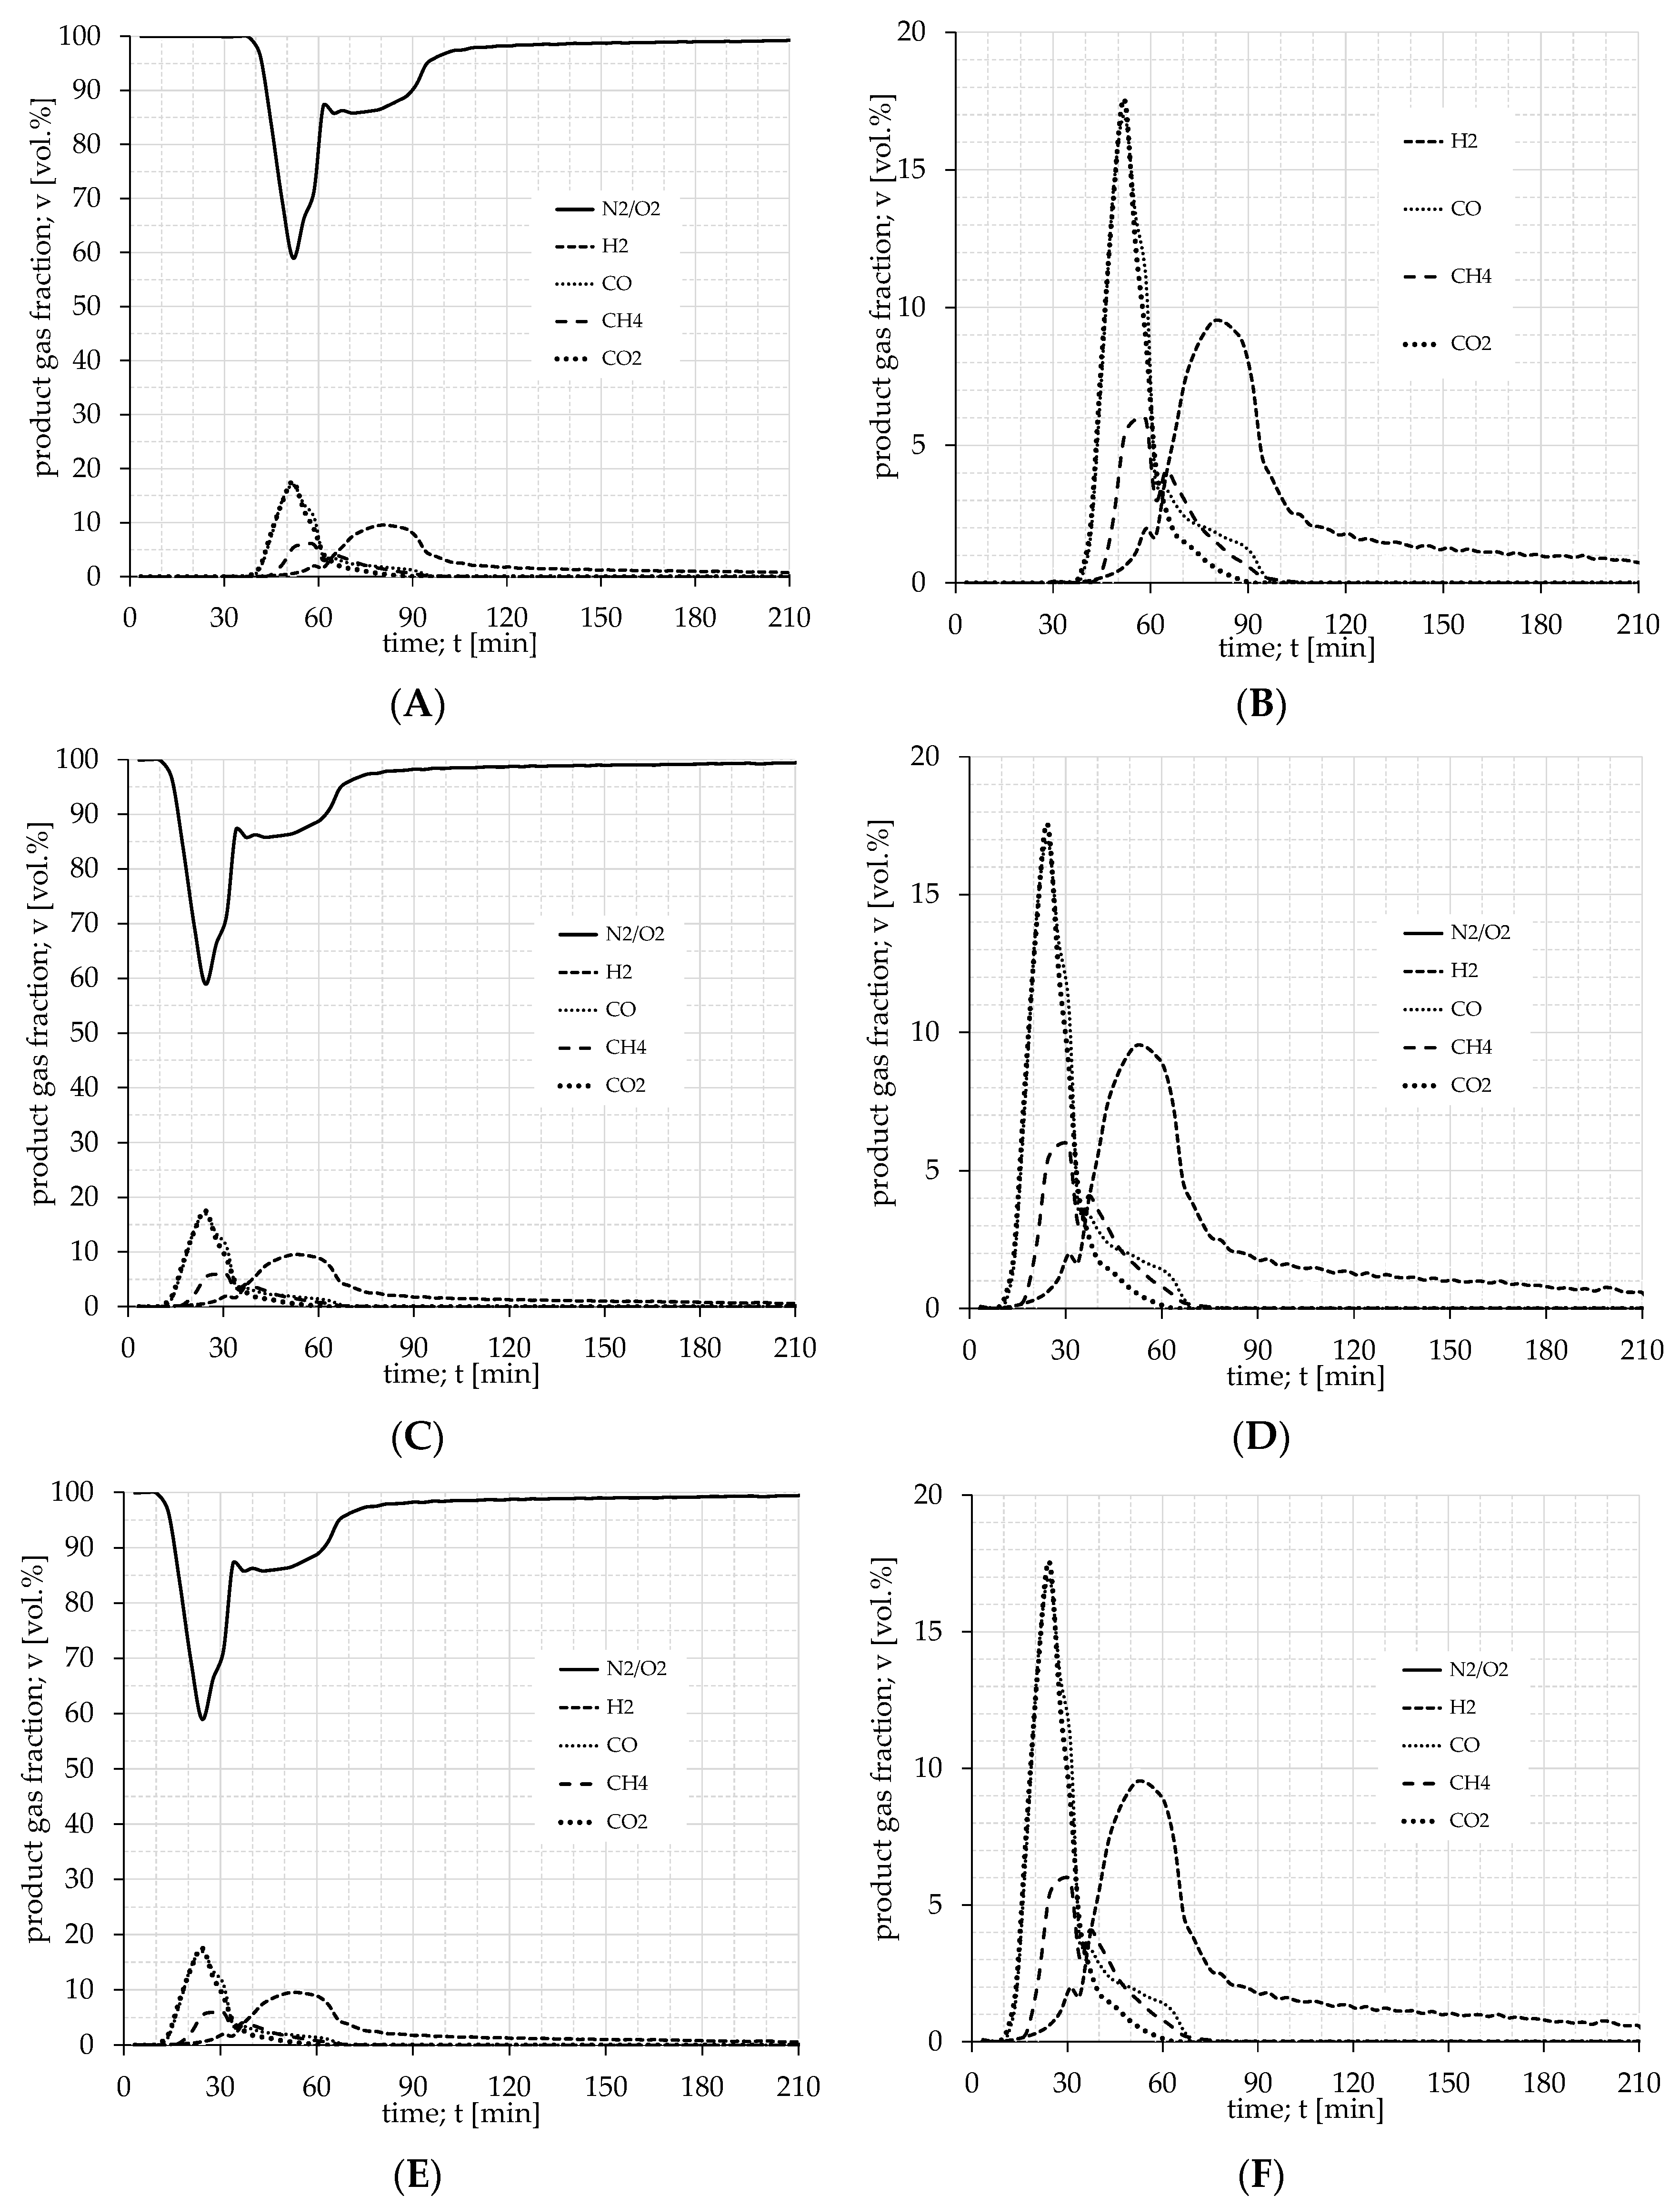
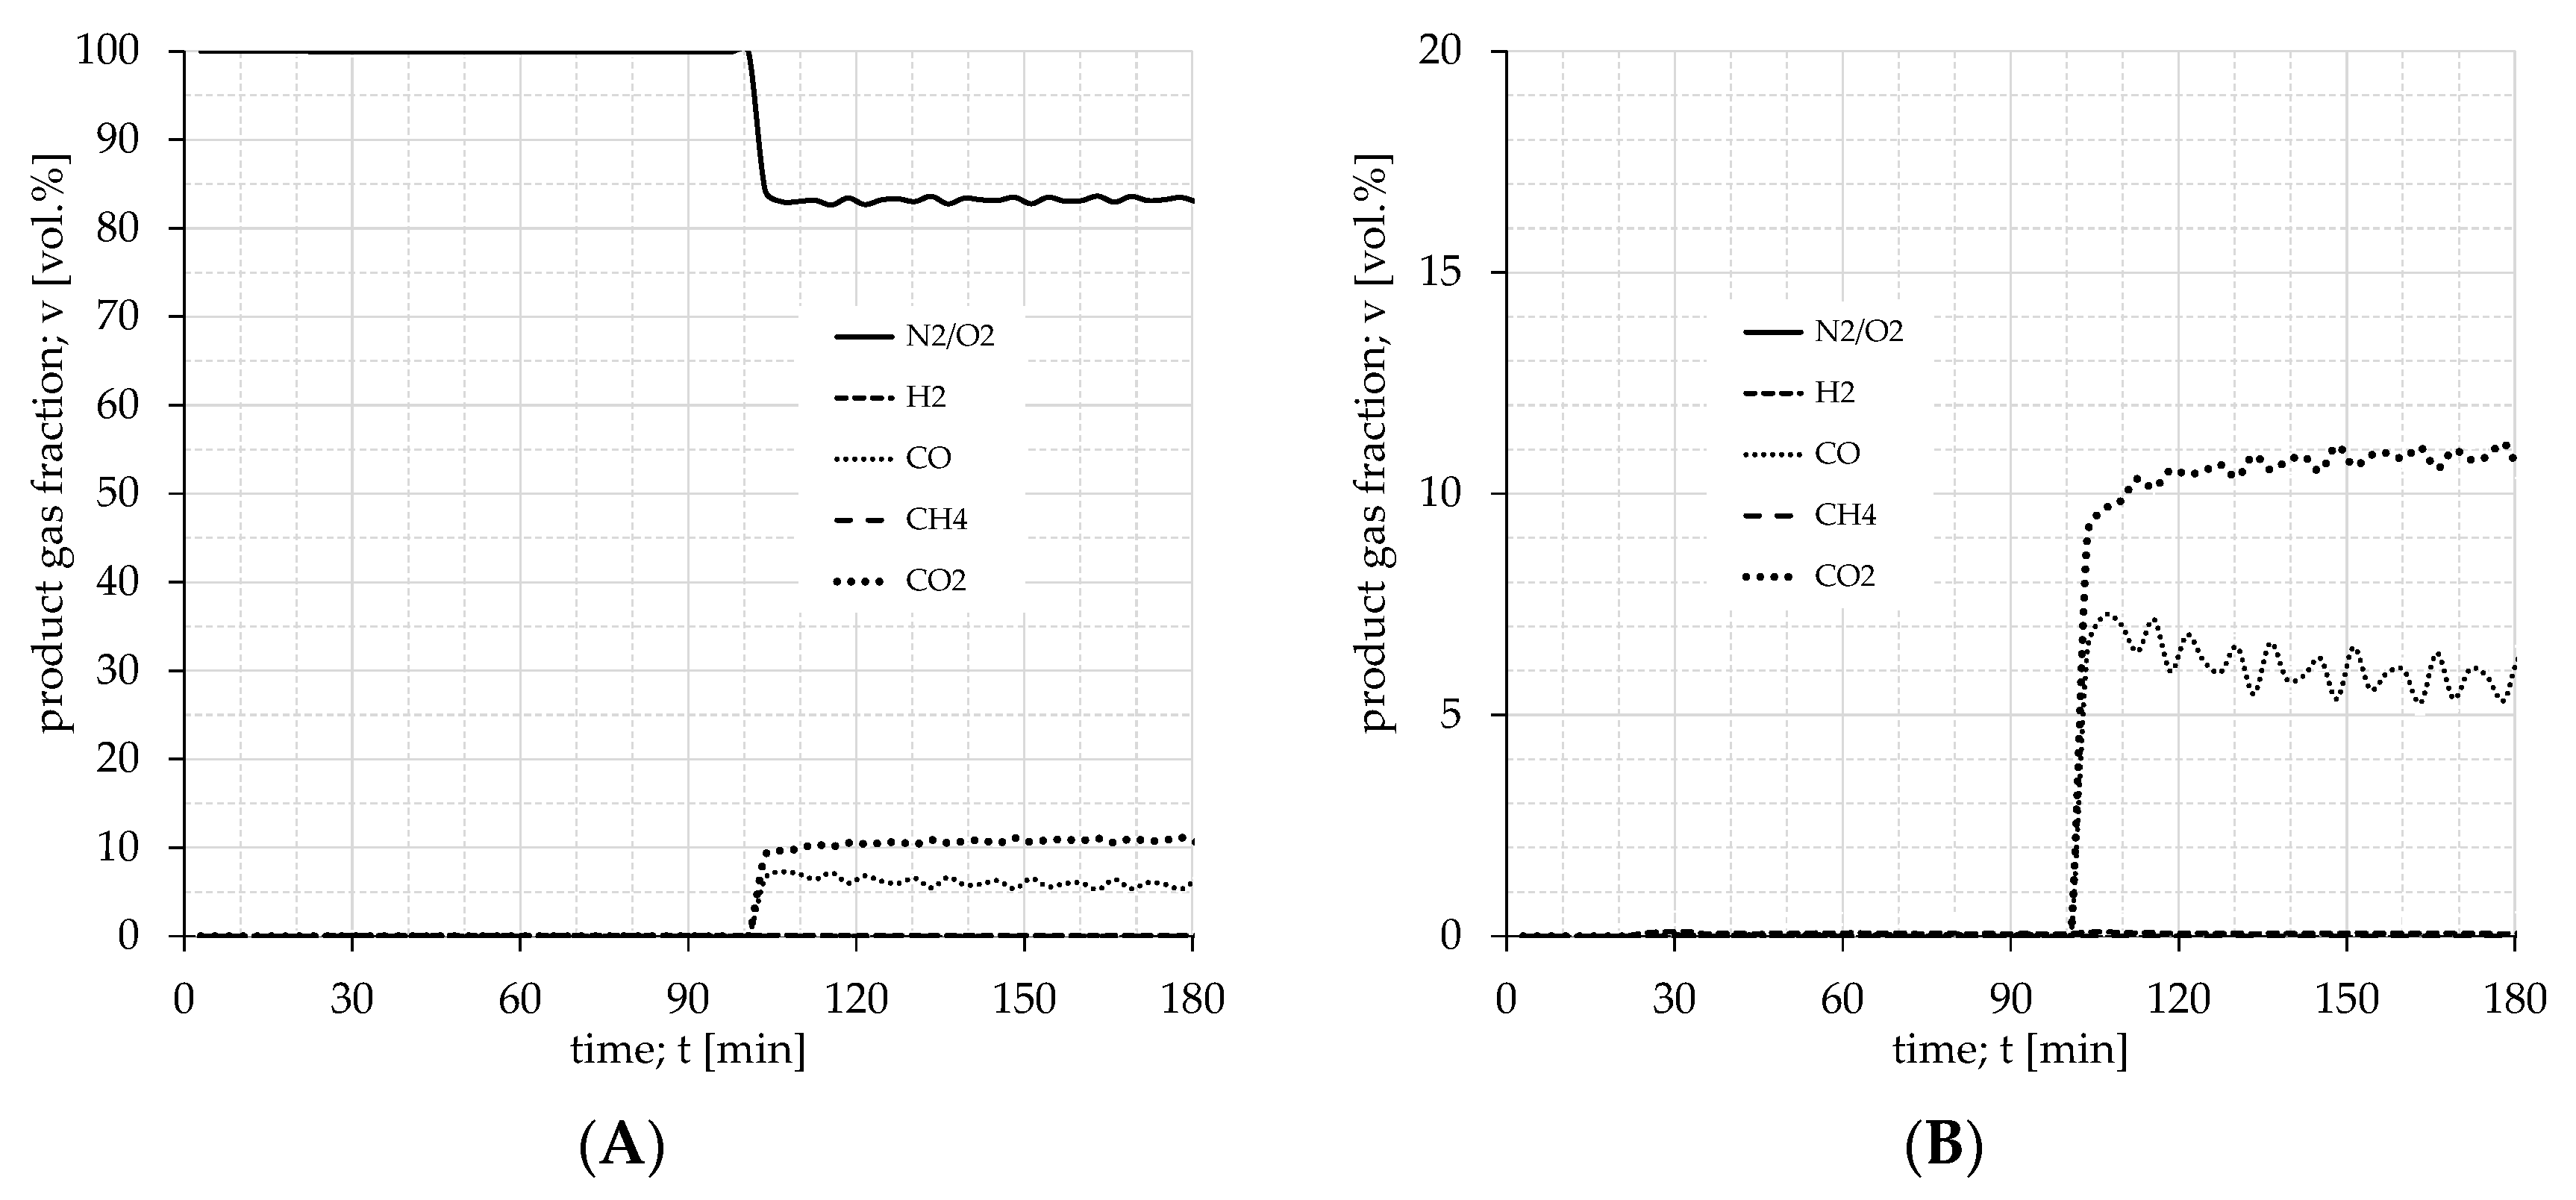
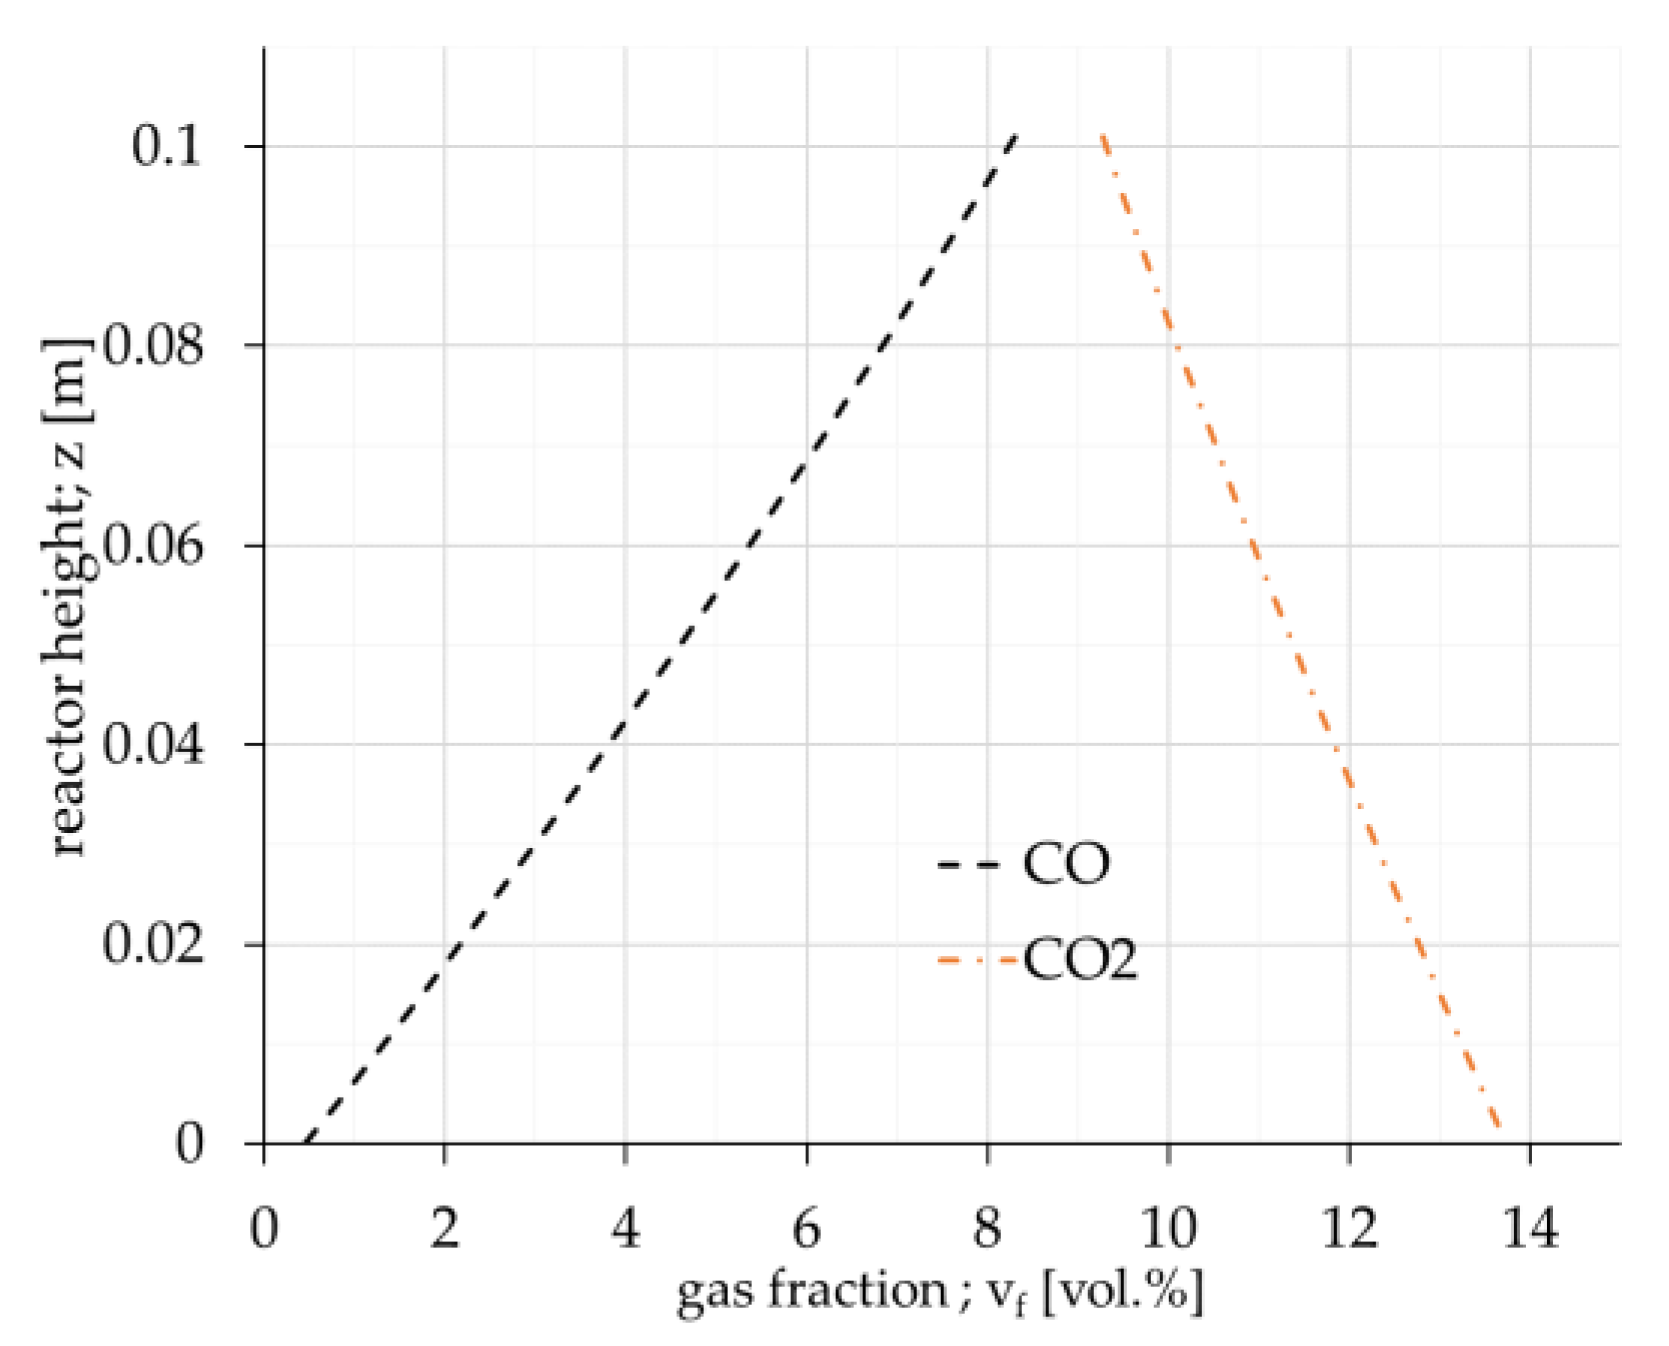
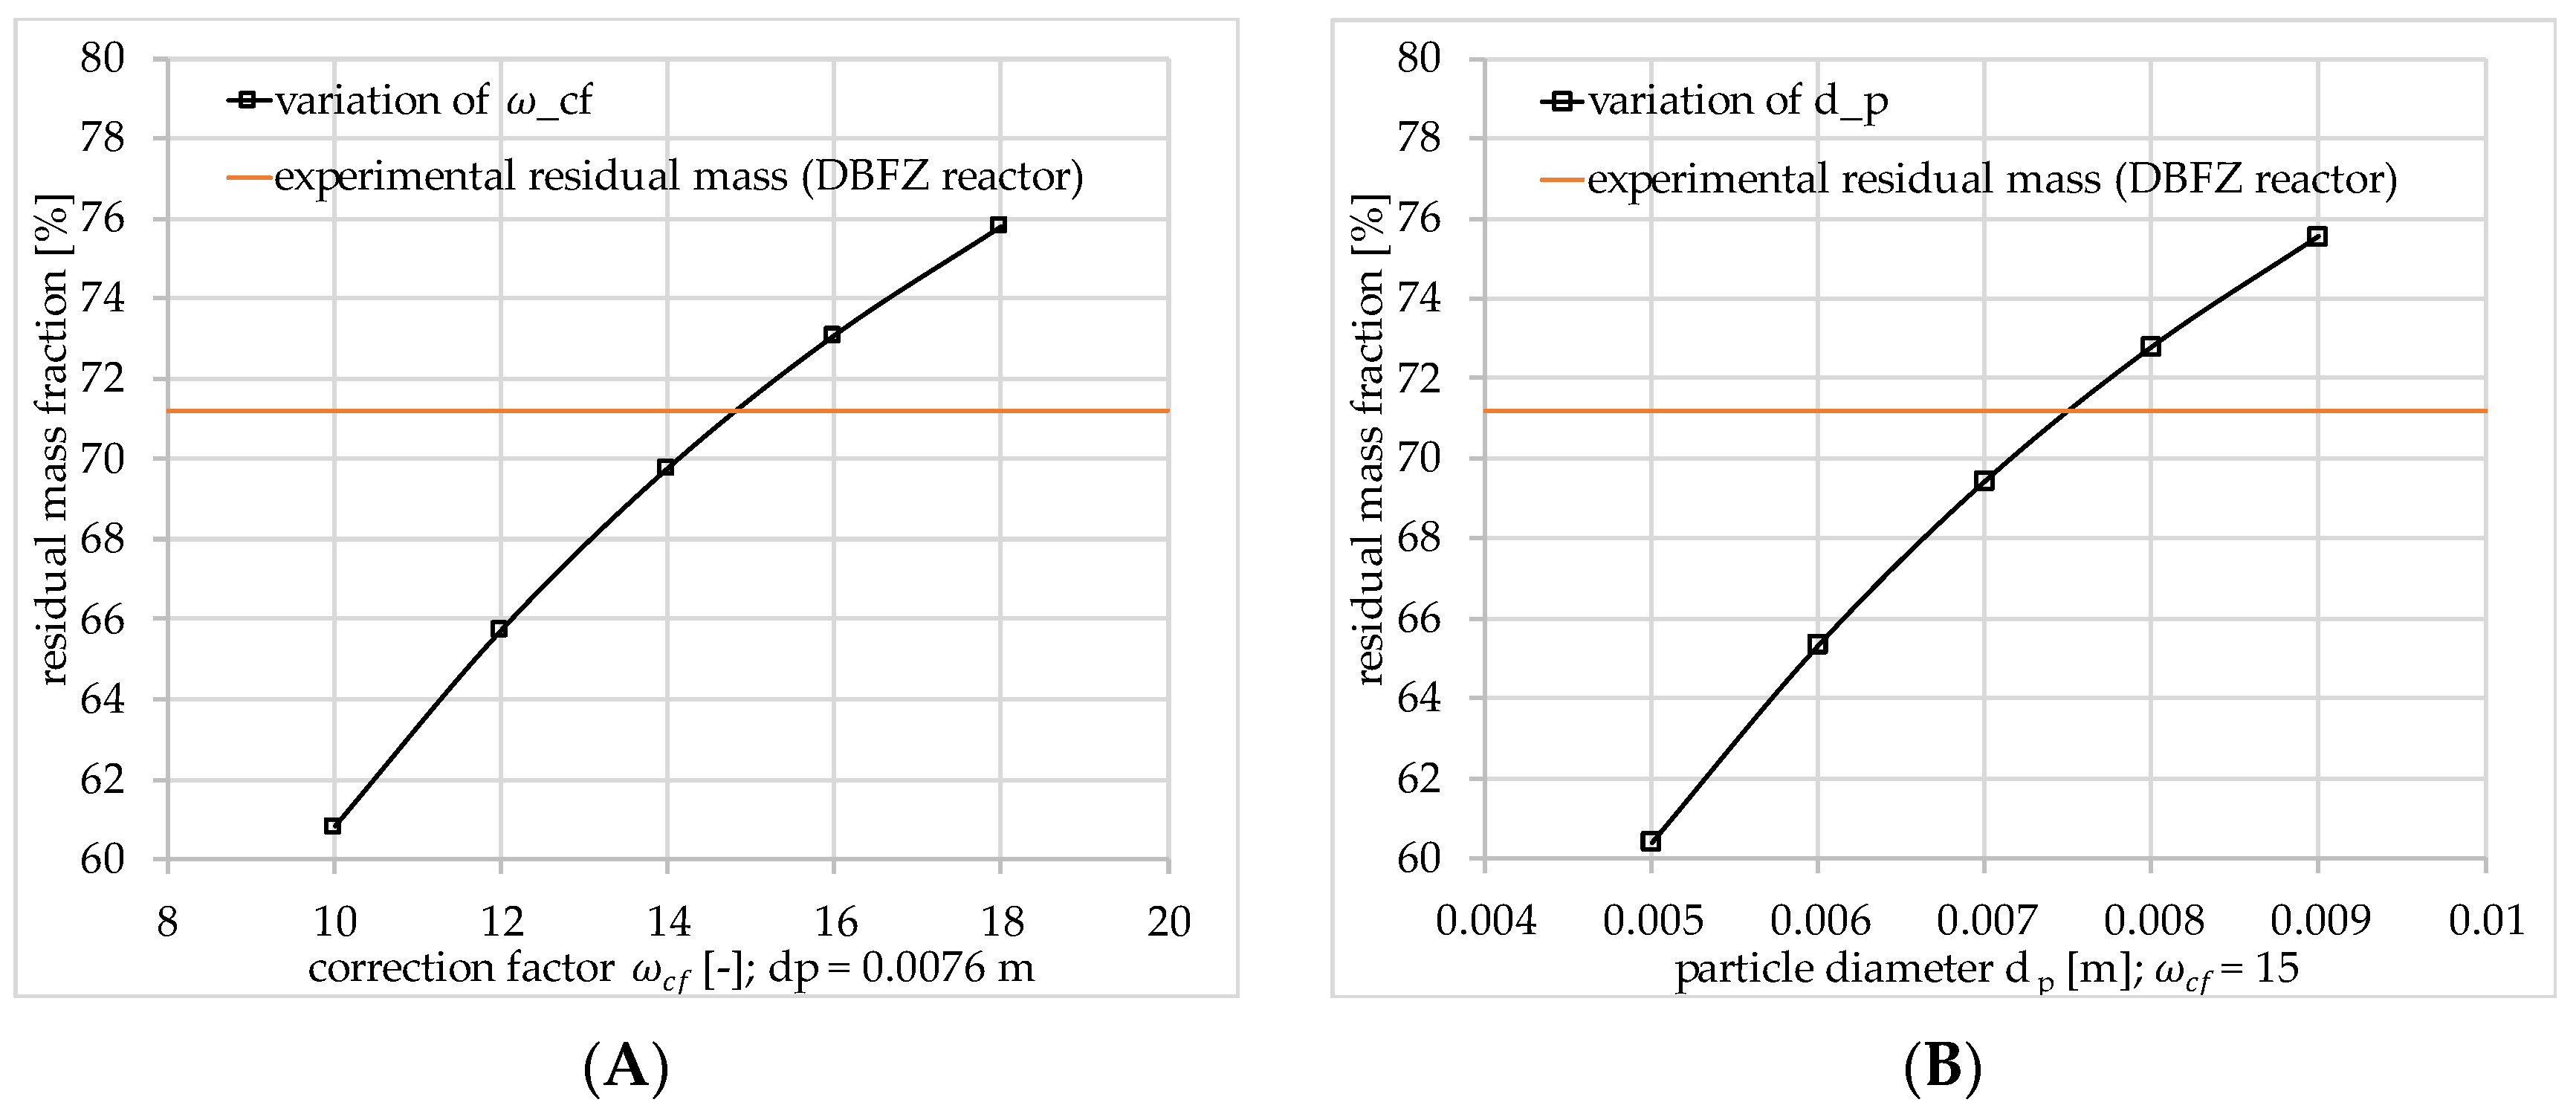
3.4. Fixed–Bed Batch Char Gasification and Model Comparison
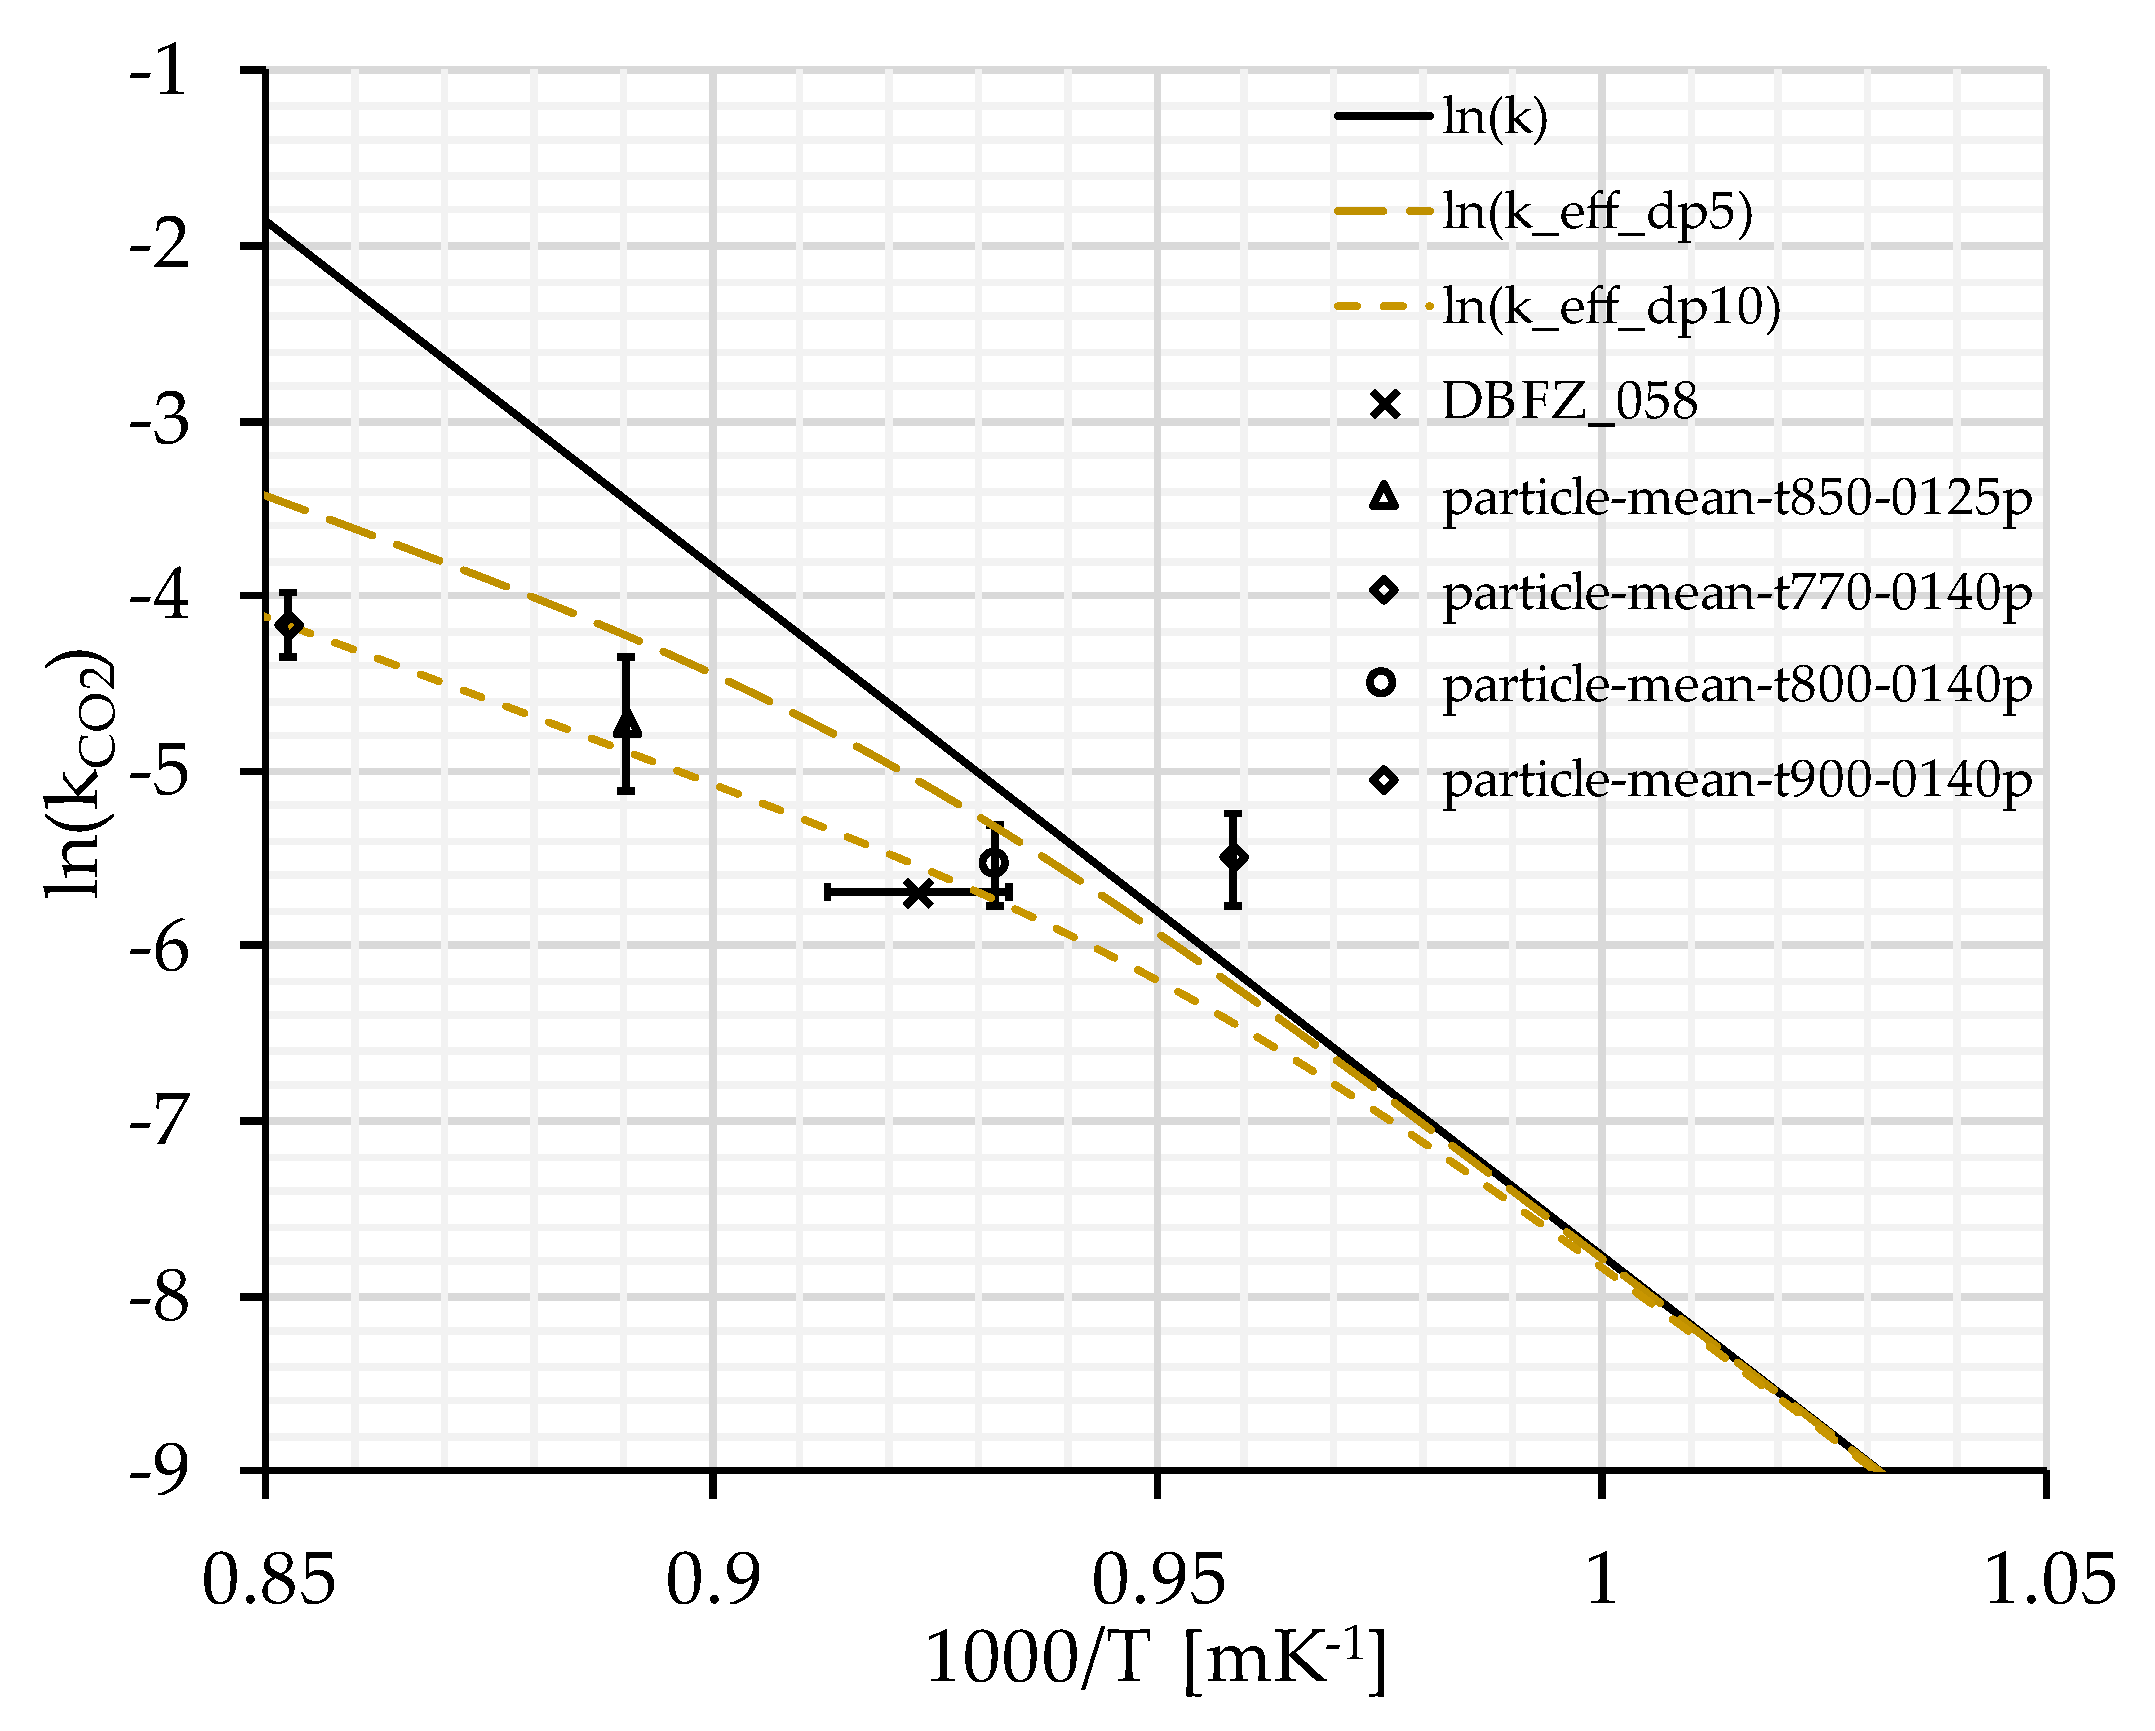
The char pyrolyzed at 850 °C/900 °C was used for the CO2 gasification in the DBFZ fixed–bed reactor (Section 2.4). Figure 15 shows a characteristic profile of the measured product gas. After switching from the N2 to N2/CO2 mixture (86 vol.%/14 vol.%) at the reactor inlet, a stable gas mixture of 11 vol.% of CO and 5.5 vol.% of CO2 is established in the product gas.
The CO2 gasification mass balances are shown in Table 12. The table shows 65–72% of the pyrolysis char mass remains in the reactor after the reaction as gasification char. The other part of the pyrolysis char enters the product gas through the 80 min gasification reaction. The mass balance agreed with the measurement results. Measurement errors or deviations in the mass balance in the range of 1% result from the lack of measurement of the product gas moisture and pyrolysis reaction in the non–measurable range.
The mass balance for the gasification reaction inside the DBFZ fixed–bed reactor can be established in the experimental period for the various experiments. Table 13 shows such a reactor mass balance for the experiment 2022−00058, with a maximal measurement error calculation.
The target of the CO2 gasification experiments was to investigate or characterize the reaction of carbon (C) with carbon dioxide (CO2) to carbon monoxide (CO). For the experiment 2022-00058, this reaction can be represented based on the measured values as shown in Table 14. The pyrolysis char reacts with CO2 as expected according to the theory, while the mass balance of the reaction could be closed by measured values. Thus, the measured values obtained can be used to compare the simulation model.
To evaluate and compare the results of the model and the gasification in the laboratory reactor, the gas fraction of CO2 and CO are compared at the outlet in Figure 16B. Additionally, the residual char after the experimental time of roughly 90 min is used as an indicator. The experimental data shows a higher CO output and thus reaction rate in the beginning, decreasing during the experiment. Hence, the model may correlate more strongly to the given temperature than the experimental data from the laboratory reactor.
Figure 16A shows the temperatures measured in the reactor, temperatures modeled by polynomials (5) and (6), and the extrapolated temperatures at the bottom and the top element in the model. The upper thermocouple (T7_7) shows a temperature reduction of 15 K in the first five minutes of the experiment indicating a stronger reaction and therefore cooling by endothermic reaction. The temperature rises as the experiment progresses. The lower thermocouple (T7_8) begins at 773 °C and ends at 813 °C. The fluctuation in temperature is due to the regulation of the heating system.
Figure 17 depicts the modeled volume fraction of gas throughout the reactor bed at the end of the experimental time and indicates a slightly decreasing reaction rate at the reactor end. The experimental residual mass was a mass fraction of 71.2% after 5171 s.
Figure 18A analyzes the model sensitivity using the Sauter diameter of 0.0076 m as a reference. With the assumed temperature profile in the model, the previously used correction factor of ω c f = 10 for matching the particle measurements is insufficient in describing the reaction in the bulk. Here, a stronger limitation is needed than solely the model for external and internal particle diffusion. In this case, ω c f would have to be of a magnitude of 15. However, the used correction factor is a link to the physical properties for pore diffusion and not to those of the bulk. Thus, there is yet a missing factor between the particle and bulk measurements. A conversion of 39% in the model compared to a conversion of 29% in the experiment shows that the reaction rate needs a further bulk limitation of about the factor 0.75. Figure 18B shows the model sensitivity for changing values of d p with ω c f = 10. Changing d p in the range from 5 mm to 9 mm and ω c f from 10 to 18 shows an impact of up to 15% in total on the residual mass fraction after an experimental time of 5171 s.

3.5. Discussion

The pyrolysis products in this study are 21–22 wt.% residual char, 57.3–60.6 wt.% condensate, and 17.9–20.7 wt.% gas, as shown in Table 6. A possible comparable data set for spruce pyrolysis is provided by Anca–Couce et al. [40]. It is important to consider that the heating rate is 60 K min−1 and the biomass is pelletized in their research. The closest comparison is the pyrolysis between 650 °C and 750 °C due to seemingly uncracked tar compared to 950 °C. While the amount of H2 is not shown, the mass fractions of CO, CO2, CH4, condensate (H2O and tar), and char are compared in Table 15. Some values like condensate and total gas are matching at 650 °C while others like CH4 do so at 750 °C. Also, some values for pine (as another softwood) are listed by Grieco and Baldi [41] with a heating rate of 3 K min−1 and 703 °C in pyrolysis. Overall, the total fractions of char, condensate and gas are in a similar range as in the literature. Due to different pyrolysis conditions, the gas fractions may vary. However, the measurement equipment was calibrated before and after the pyrolysis in this study for valid data.
An explicit comparison of the evaluated parameters, E A , j , c h a r , A 0 , j , c h a r and ν j , c h a r for the proposed model with previous studies is limited. Multiple factors like char types, particle sizes, experimental methods, evaluation routines, and more are difficult to match. Di Blasi found throughout various literature a strong deviation as shown in Table 16 [42]. The deviation can be partly explained by multiple factors previously named. In this study, the order ν j refers to the gas concentration while some refer to partial pressure and some to neither. Therefore, the unit of the preexponential factor A 0 varies as well. Comparing the evaluated combustion parameters, this study shows agreement within the range shown in the literature. The H2O gasification parameters of this study seem only slightly out of range. For CO2 gasification, the parameters are far more out of range, although the evaluation routine is equal to the ones with the other reactive gas agents. Exemplarily, Schneider et al. also reported parameters for CO2 gasification slightly outside the range compared herein for high temperature pyrolyzed beech wood (>1400 °C) with a power law model [43].
Further in 2022, Trubetskaya reviewed the influence of inorganic content in biomass on gasification rates with a view to investigating inorganic elements in combination with reaction rates [44]. Therefore, the inorganic elements for the analyzed biomass can be found in Appendix A.
Single particle experiments showed limited reaction behavior at temperatures of 800 °C, 850 °C and 900 °C compared to powder measurements with the exception of 770 °C. Here, the particle reaction rate was higher. This may indicate better access of the reactive gas to the internal char surface of a particle at particles on the meshed sample carrier than to the char powder in the crucible on the DSC sample carrier.
Yet, surprising were the results of single particles reacting at faster or similar rates at 770 °C than those at 800 °C in a CO2 atmosphere. A hypothesis may be that in this temperature range, the transition between the accessible internal surface and evolving reaction layer occurs. The product gas begins to block the reactive gas from access to deeper pore structure while at 770 °C; due to slower local reaction, the reactive gas may still access more internal surfaces and spread more evenly throughout the whole particle leading to a similar or even faster reaction. Additionally, because of less local accumulation of product gas near the outer particle surface, there might be a better gas exchange inside the particle. Hence, a future field of interest may be to explain this transitional behavior more precisely.
Further investigation must be made due to the tentative correction factor ω c f . This work priory assumed no Knudsen regime to be present and thus no influence of pore diameter d p o r e . Knudsen regime occurs at d p o r e ≤ 10 nm, and adds the pore diameter dependency to D j , m i x with D K n u as found in descriptions by Jess and Wasserscheid [32]. Thus, the calculation of D p o r e may be enhanced as follows:
D p o r e = 1 D j , N 2 + 1 D K n u 1
with
D K n u = 1 3 8 R T π M d p o r e
Pore structure and thus diameter may vary depending on type of biomass char, pyrolysis conditions and further along different conversion levels of the biomass char. A comparison with yet unvalidated BET–data showed average d p o r e values of magnitude 1–4 nm. Former investigations by Gradel [35] on wood pellets showed values of 2.5 nm. Using D K n u with these pore diameters in the limitation function (17a) may achieve its purpose without ω c f for single particle predictions. Hence, more profound BET–data must be acquired, and investigations made for the used biomass and others.
In 2020, Wu et al. showed related parameters evolving during conversion like micro–pore area, external surface area and porosity [45]. Their research covers higher volume fractions of CO2 (0–90%) and H2O (0–50%) in temperature ranges of 1150–1350 °C with poplar wood, switch grass and corn stover. Liang and Singer used detailed 3-D CFD modeling and X-ray micro-computed tomography with high resolution on single particle bituminous coal combustion to assess the limitation and effectiveness factors for 1-D reactor modeling with data of pore structure [46]. Research of Nguyen et al. showed similar detailed particle modelling in 2021 [47]. Their CFD model involves a detailed description for a spherical particle and the evolving morphology during char conversion using likewise data for pore structure and gasification kinetics. Thus, representative particle size for a specific biomass bulk must be determined as well as the description of pore structure by representative values of specific surface area, porosity, and pore diameter.
However, the bulk measurements on the laboratory scale show an even lower overall reaction rate by a factor of 0.75 compared to single particle reaction, although good purging with reactive gas was achieved in the laboratory fixed–bed batch reactor, which is why corrections and therefore further investigation must be made. Additionally, these differences may be investigated with H2O, O2 and combinations as well.

4. Conclusions

This work aims to produce wholesome combined data for modeling thermal fixed–bed gasification with biomass-specific data evaluated in small-scale laboratory measurement routines. Thus, many properties of the investigated biomass are provided and reproducible pyrolysis data is presented. TGA measurements of fine char powder were conducted, in a controlled regime below 800 °C to evaluate the reaction parameters, E A , j , c h a r , A 0 , j , c h a r and ν j , c h a r for reactive gases CO2, O2, and H2O for the use in the proposed model. Additionally, single particle and bulk gasification in a CO2 atmosphere were investigated for the limitation modeling and model validation. The particle measurement showed similar reaction rates at 770 °C and 800 °C. Furthermore, at 770 °C, the particle reaction rate was higher than the evaluated powder reaction rate in a controlled regime. Thus, supplementary investigations are needed to describe those phenomena.
Recent detailed particle simulation may benefit from a reliable database of biomass-specific characteristics such as reaction parameters or pore structure. Yet, the suitability of this study for different models must be determined. More pore structure measurements must be conducted since the Knudsen regime and thus pore diameter is significant for biomass char. Sophisticated simulation models with reliable biomass data can provide efficient and adaptable predictions to enhance the development of industrial gasification and make greater use of the biomass spectrum.

Supplementary Materials

Supporting information will be provided under the following depository link: https://www.mdpi.com/article/10.3390/en16062888/s1.

Author Contributions

Conceptualization, M.R.H., A.H., A.G., M.K. and T.P.; data curation, M.R.H. and A.H.; formal analysis, M.R.H. and A.H.; funding acquisition, T.P.; investigation, A.H.; methodology, M.R.H. and A.H.; project administration, T.P.; software, M.R.H. and A.G.; supervision, M.K. and T.P.; validation, M.R.H. and A.H.; visualization, M.R.H. and A.H.; writing—original draft, M.R.H.; writing—review & editing, M.R.H., A.H., A.G., M.K. and T.P. All authors have read and agreed to the published version of the manuscript.

Funding

This research and APC was funded by Federal Ministry for Economic Affairs (Germany) and Climate Action, grant number “03KB163A” (Bundesministerium für Wirtschaft und Klimaschutz BMWK).

Institutional Review Board Statement

Not applicable.

Informed Consent Statement

Not applicable.

Data Availability Statement

The data presented in this study are available on request from the corresponding author. The data are not publicly available due to English language preparation and distinguishing from other private data evaluation, yet. Any requested material will be publicly provided here: https://nextcloud.hof-university.de/s/zjtBsGJHYQaRQ9N.

Conflicts of Interest

The authors declare no conflict of interest. The funders had no role in the design of the study; collection, analyses, or interpretation of data; writing of the manuscript; or decision to publish the results.

Nomenclature

Symbols UsedUnit
A0preexponential factorm3 kg−1
cmolar concentrationmol m−3
cpheat capacityJ kg−1 K−1
d, didiameter, inner diameterM
Ddiffusion coefficientm2 s−1
EAactivation energykJ mol−1
Fresidual mass fraction -
hheightm
Hreaction enthalpyJ mol−1
llengthm
L0total length of overlapped system per unit volumecm cm3
Mmolar masskg mol−1
nnumber
NuNusselt number -
p0atmospheric pressurekg m−1 s−2
Qheat flow -
rreaction ratemol s−1 m−3
Rgas constantJ kg−1 mol−1
ReReynolds number -
Ssurface aream2
S0inner surface area per unit volume at t=0cm2 cm3
Sp,oouter surface area per unit mass of particlem² kg−1
ScSchmidt number -
ShSherwood number -
ttimes
Tabsolute temperatureK
Uvelocitym s−1
vfvolume fraction -
wmass fraction -
x 1,2 Sauter diameterm
Xconversion -
zcoordinatem
Sub– and SuperscriptsUnit
0at the beginning
bmbiomass
chemchemically
charinvestigated char
effeffective
ggas
iindicator solid species; numerical time step
jindicator gaseous species
nnumerical element step
pparticle
pyrpyrolysis
ssolid
ttime dependent
TCthermocouple
totale.g., total porosity
wwall
Greek Letters
β mass transfer coefficientm s−1
γ mass concentrationkg m−3
ε porosity mg3 m−3
φ structure factor -
ϕ Thiele modulus -
ν reaction order -
ρ densitykg m−3
τ tortuosity -
λ heat conductivityW m−1 K−1
η effectiveness factor -
ϑ temperature°C
Ψ structural factor -
ω c f correction factor -
Abbreviations
n.d.not detectable
ASCautomatic sample changer
DSCdifferential scanning calorimetry
DWCdefined wooden chips
dafdry ash free
FTIRFourier-transform infrared spectroscopy
ICP-OESinductively coupled plasma optical emission spectrometry
µGCmicro gas chromatography
MFCmass flow controller
SDstandard deviation
TGAthermogravimetric analysis

Appendix A

Table A1. ICP–OES results of biomass and char with 24 listed elements.
Amount [mg kg−1(Dry)]
ElementSpruceChar
Aluminum4.3534
Barium27.686.2
Cadmium0.375n.d.
Calcium11503060
Chrome0.6423.88
Cobalt0.3990.202
Copper0.9043.27
Iron15.149.6
Leadn.d.n.d.
Lithiumn.d.n.d.
Magnesium160480
Mangan350603
Molybdenumn.d.n.d.
Nickel0.6625.53
Phosphorus48.5192
Potassium2601570
Silicon48.2n.d.
Sodiumn.d.41.3
Strontium7.1720.3
Sulfur84.494.9
Thalliumn.d.n.d.
Titanium0.8818.95
Tungstenn.d.n.d.
Zinc16.837.5

References

  1. Sikarwar, V.S.; Zhao, M.; Clough, P.; Yao, J.; Zhong, X.; Memon, M.Z.; Shah, N.; Anthony, E.J.; Fennell, P.S. An overview of advances in biomass gasification. Energy Environ. Sci. 2016, 9, 2939–2977. [Google Scholar] [CrossRef] [Green Version]
  2. Anca-Couce, A. Reaction mechanisms and multi-scale modelling of lignocellulosic biomass pyrolysis. Prog. Energy Combust. Sci. 2016, 53, 41–79. [Google Scholar] [CrossRef]
  3. Di Blasi, C. Heat, momentum and mass transport through a shrinking biomass particle exposed to thermal radiation. Chem. Eng. Sci. 1996, 51, 1121–1132. [Google Scholar] [CrossRef]
  4. Gradel, A.; Honke, R.; Wünning, J.A.; Plessing, T.; Jess, A. Modeling of Biomass Gasification in a Downdraft Gasifier with Integrated Tar Adsorption. Chem. Eng. Technol. 2019, 42, 1895–1906. [Google Scholar] [CrossRef]
  5. Kaltschmitt, M.; Hartmann, H.; Hofbauer, H. Energie aus Biomasse: Grundlagen Techniken und Verfahren, 3rd ed.; Springer: Berlin/Heidelberg, Germany, 2016; ISBN 978-3-662-47437-2. [Google Scholar]
  6. Basu, P. Gasification Theory. In Biomass Gasification, Pyrolysis and Torrefaction: Practical Design and Theory, 3rd ed.; Basu, P., Ed.; Academic Press: London, UK, 2018; pp. 211–262. ISBN 9780128129920. [Google Scholar]
  7. Neves, D.; Thunman, H.; Matos, A.; Tarelho, L.; Gómez-Barea, A. Characterization and prediction of biomass pyrolysis products. Prog. Energy Combust. Sci. 2011, 37, 611–630. [Google Scholar] [CrossRef]
  8. Morin, M.; Pécate, S.; Masi, E.; Hémati, M. Kinetic study and modelling of char combustion in TGA in isothermal conditions. Fuel 2017, 203, 522–536. [Google Scholar] [CrossRef] [Green Version]
  9. Guerrero, M.; Ruiz, M.P.; Alzueta, M.U.; Bilbao, R.; Millera, A. Pyrolysis of eucalyptus at different heating rates: Studies of char characterization and oxidative reactivity. J. Anal. Appl. Pyrolysis 2005, 74, 307–314. [Google Scholar] [CrossRef]
  10. Cetin, E.; Moghtaderi, B.; Gupta, R.; Wall, T. Influence of pyrolysis conditions on the structure and gasification reactivity of biomass chars. Fuel 2004, 83, 2139–2150. [Google Scholar] [CrossRef]
  11. Kumar, M.; Gupta, R.C. Influence of carbonization conditions on the gasification of acacia and eucalyptus wood chars by carbon dioxide. Fuel 1994, 73, 1922–1925. [Google Scholar] [CrossRef]
  12. Fushimi, C.; Araki, K.; Yamaguchi, Y.; Tsutsumi, A. Effect of Heating Rate on Steam Gasification of Biomass. 1. Reactivity of Char. Ind. Eng. Chem. Res. 2003, 42, 3922–3928. [Google Scholar] [CrossRef]
  13. Mermoud, F.; Salvador, S.; Vandesteene, L.; Golfier, F. Influence of the pyrolysis heating rate on the steam gasification rate of large wood char particles. Fuel 2006, 85, 1473–1482. [Google Scholar] [CrossRef] [Green Version]
  14. Okumura, Y.; Hanaoka, T.; Sakanishi, K. Effect of pyrolysis conditions on gasification reactivity of woody biomass-derived char. Proc. Combust. Inst. 2009, 32, 2013–2020. [Google Scholar] [CrossRef]
  15. Zanzi, R.; Sjöström, K.; Björnbom, E. Rapid high-temperature pyrolysis of biomass in a free-fall reactor. Fuel 1996, 75, 545–550. [Google Scholar] [CrossRef]
  16. Morin, M.; Pécate, S.; Hémati, M.; Kara, Y. Pyrolysis of biomass in a batch fluidized bed reactor: Effect of the pyrolysis conditions and the nature of the biomass on the physicochemical properties and the reactivity of char. J. Anal. Appl. Pyrolysis 2016, 122, 511–523. [Google Scholar] [CrossRef] [Green Version]
  17. Irfan, M.F.; Usman, M.R.; Kusakabe, K. Coal gasification in CO2 atmosphere and its kinetics since 1948: A brief review. Energy 2011, 36, 12–40. [Google Scholar] [CrossRef]
  18. Federal Ministry of Food and Agriculture. Holzmarktbericht 2021: Abschlussergebnisse für die Forst- und Holzwirtschaft des Wirtschaftsjahres. 2021. Available online: https://www.bmel-statistik.de/forst-holz/holzmarkt/holzmarktberichte (accessed on 7 March 2023).
  19. ICS 75.160.40 (DIN EN ISO 16948); Solid Biofuels—Determination of Total Content of Carbon, Hydrogen and Nitrogen. Beuth Verlag GmbH: Berlin/Heidelberg, Germany, 2015.
  20. ICS 75.160.40 (DIN EN ISO 16967:2015); Solid Biofuels—Determination of Major Elements. Beuth Verlag GmbH: Berlin/Heidelberg, Germany, 2015.
  21. ICS 75.160.40 (DIN EN ISO 16968); Solid Biofuels—Determination of Minor Elements. Beuth Verlag GmbH: Berlin/Heidelberg, Germany, 2015.
  22. ICS 75.160.40 (DIN EN 14775); Solid Biofuels—Determination of Ash Content. Beuth Verlag GmbH: Berlin/Heidelberg, Germany, 2012.
  23. ICS 75.160.10 (DIN 51719); Testing of Solid Fuels—Solid Mineral Fuels—Determination of Ash Content. Beuth Verlag GmbH: Berlin/Heidelberg, Germany, 1997.
  24. ICS 75.160.40 (DIN EN 14774-2); Solid Biofuels—Determination of Moisture Content—Oven Dry Method—Part 2: Total Moisture—Simplified Method. Beuth Verlag GmbH: Berlin/Heidelberg, Germany, 2010.
  25. ICS 75.160.40 (DIN EN ISO 18123); Solid Biofuels—Determination of the Content of Volatile Matter. Beuth Verlag GmbH: Berlin/Heidelberg, Germany, 2016.
  26. Dufourny, A.; van de Steene, L.; Humbert, G.; Guibal, D.; Martin, L.; Blin, J. Influence of pyrolysis conditions and the nature of the wood on the quality of charcoal as a reducing agent. J. Anal. Appl. Pyrolysis 2019, 137, 1–13. [Google Scholar] [CrossRef]
  27. ICS 19.120 (DIN ISO 9276-2); Representation of Results of Particle Size Analysis—Part 2: Calculation of Average Particle Sizes/Diameters and Moments from Particle Size Distributions. Beuth Verlag GmbH: Berlin/Heidelberg, Germany, 2006.
  28. ICS 75.160.40 (DIN EN 15149-1); Solid Biofuels—Determination of Particle Size Distribution—Part 1: Oscillating Screen Method Using Sieve Apertures of 1 Mm and Above. Beuth Verlag GmbH: Berlin/Heidelberg, Germany, 2011.
  29. ICS 75.160.40 (DIN EN ISO 18125:2017-08); Solid Biofuels—Determination of Calorific Value. Beuth Verlag GmbH: Berlin/Heidelberg, Germany, 2017.
  30. Magnaterra, M.; Fusco, J.R.; Ochoa, J.; Cukierman, A.L. Kinetic Study of the Reaction of Different Hardwood Sawdust Chars with Oxygen. Chemical and Structural Characterization of the Samples. In Advances in Thermochemical Biomass Conversion; Bridgwater, A.V., Ed.; Springer: Dordrecht, The Netherlands, 1993; pp. 116–130. ISBN 978-94-010-4582-7. [Google Scholar]
  31. Benson, B.B.; Krause, D. The Concentration and Isotopic Fractionation of Gases Dissolved in Freshwater in Equilibrium with the Atmosphere. 1. Oxygen. Available online: http://www.jstor.org/stable/2835754 (accessed on 6 August 2021).
  32. Jess, A.; Wasserscheid, P. Chemical Technology: An Integral Textbook; Wiley-VCH: Weinheim, Germany, 2013; ISBN 978-3-527-30446-2. [Google Scholar]
  33. Baehr, H.D.; Stephan, K. Wärme- und Stoffübertragung, 9th ed.; aktualisierte Auflage; Springer Vieweg: Berlin/Heidelberg, Germany, 2016; ISBN 978-3-662-49676-3. [Google Scholar]
  34. Fuller, E.N.; Schettler, P.D.; Giddings, J.C. New method for prediction of binary gas-phase diffusion coefficients. Ind. Eng. Chem. 1966, 58, 18–27. [Google Scholar] [CrossRef]
  35. Gradel, A. Gleichstromvergasung von Holzpellets mit integrierter Adsorption von Teerkomponenten. Ph.D. Thesis, Universität Bayreuth, Bayreuth, Germany, 2020. [Google Scholar]
  36. Kashiwagi, T.; Nambu, H. Global kinetic constants for thermal oxidative degradation of a cellulosic paper. Combust. Flame 1992, 88, 345–368. [Google Scholar] [CrossRef]
  37. Várhegyi, G.; Sebestyén, Z.; Czégény, Z.; Lezsovits, F.; Könczöl, S. Combustion Kinetics of Biomass Materials in the Kinetic Regime. Energy Fuels 2012, 26, 1323–1335. [Google Scholar] [CrossRef] [Green Version]
  38. Bhatia, S.K.; Perlmutter, D.D. A random pore model for fluid-solid reactions: I. Isothermal, kinetic control. AIChE J. 1980, 26, 379–386. [Google Scholar] [CrossRef]
  39. Bhatia, S.K.; Perlmutter, D.D. A random pore model for fluid-solid reactions: II. Diffusion and transport effects. AIChE J. 1981, 27, 247–254. [Google Scholar] [CrossRef]
  40. Anca-Couce, A.; Sommersacher, P.; Scharler, R. Online experiments and modelling with a detailed reaction scheme of single particle biomass pyrolysis. J. Anal. Appl. Pyrolysis 2017, 127, 411–425. [Google Scholar] [CrossRef]
  41. Grieco, E.; Baldi, G. Analysis and modelling of wood pyrolysis. Chem. Eng. Sci. 2011, 66, 650–660. [Google Scholar] [CrossRef]
  42. Di Blasi, C. Combustion and gasification rates of lignocellulosic chars. Prog. Energy Combust. Sci. 2009, 35, 121–140. [Google Scholar] [CrossRef]
  43. Schneider, C.; Zeller, M.; Böhm, D.; Kolb, T. Influence of pressure on the gasification kinetics of two high-temperature beech wood chars with CO2, H2O and its mixture. Fuel 2021, 299, 120523. [Google Scholar] [CrossRef]
  44. Trubetskaya, A. Reactivity Effects of Inorganic Content in Biomass Gasification: A Review. Energies 2022, 15, 3137. [Google Scholar] [CrossRef]
  45. Wu, R.; Beutler, J.; Price, C.; Baxter, L.L. Biomass char particle surface area and porosity dynamics during gasification. Fuel 2020, 264, 116833. [Google Scholar] [CrossRef]
  46. Liang, D.; Singer, S. Pore-resolving simulations to study the impacts of char morphology on zone II combustion and effectiveness factor models. Combust. Flame 2021, 229, 111405. [Google Scholar] [CrossRef]
  47. Nguyen, C.B.; Scherer, J.; Hartwich, M.; Richter, A. The morphology evolution of char particles during conversion processes. Combust. Flame 2021, 226, 117–128. [Google Scholar] [CrossRef]
Figure 1. Sample of the defined wooden chips used in this study. Containing spruce with particle size of 12 to 16 mm and nearly no bark with a ruler for size comparison.
Energies 16 02888 g001
Figure 2. DBFZ fixed–bed batch reactor for characterizing pyrolysis und gasification reaction. (A) Front side with preheater for gasification agent (left) and reactor (right); (B) back side with product gas handling (left) and mixing station for gasification agents (right).
Energies 16 02888 g002
Figure 3. (A) scheme of DBFZ batch reactor with two multipoint thermocouples; (B) scheme of thermocouples positions and names inside the reactor.
Energies 16 02888 g003
Figure 4. Pyrolysis (2021-00084) of wood chips in one step with 500 °C: (A) temperature profile; (B) profile of pyrolysis feed gas and product gas.
Energies 16 02888 g004
Figure 5. Pyrolysis (2022-00041) of wood chips in one step with 850 °C: (A) temperature profile; (B) profile of pyrolysis feed gas and product gas.
Energies 16 02888 g005
Figure 6. Pyrolysis (2022-00057) of wood chips in two steps with 850 °C and 900 °C: (A) temperature profile; (B) profile of pyrolysis feed gas and product gas.
Energies 16 02888 g006
Figure 7. Scanning electron microscope images of the used biomass charcoal for size and structure investigation: (A) leftover particles from sieving; (B) sieving product powder.
Energies 16 02888 g007
Figure 8. Results from preliminary test to determine Ttarget for long–term experiments with a volume fraction of 20 vol.%: (A) mass fraction from CO2 Test; (B) rate of mass fraction loss CO2 Test; (C) mass fraction from O2 Test; (D) rate of mass fraction loss O2 Test; (E) mass fraction from H2O Test; (F) rate of mass fraction loss H2O Test.
Energies 16 02888 g008
Figure 9. (A) DSC sample carrier with crucible and char powder; (B) TGA sample carrier with a char particle.
Energies 16 02888 g009
Figure 10. CO2 gasification (2022-00058) of pyrolysis char (2022-00057): (A) temperature profile; (B) profile of gasification feed gas and product gas.
Energies 16 02888 g010
Figure 11. Product gas concentration of pyrolysis of wood chips: (A,B) 500 °C (2021-00084); (C,D) 850 °C (2021-00041); (E,F) 850 °C/900 °C (2021-00057).
Energies 16 02888 g011
Figure 12. Results from TGA long–term experiments and Arrhenius–plots with rates from preliminary test measurements, points from TGA long–term experiments and the model line from established values of E A , j , c h a r , A 0 , j , c h a r and ν j , c h a r . F m o d 3 is a model approach (Form XXX-XXXXp indicates temperature in °C and v f , j ). (A) powder conversion with CO2; Ψ C O 2 = 4.8 ; (B) Arrhenius plot CO2; (C) powder conversion with O2; Ψ O 2 = 3.6 ; (D) Arrhenius plot O2; (E) powder conversion with H2O; Ψ H 2 O = 2.5 ; (F) Arrhenius plot H2O.
Energies 16 02888 g012
Figure 13. Arrhenius plot of CO2 measurements. Black line depicts resulting rate from long-term powder measurements with E A , C O 2 , c h a r , A 0 , C O 2 , c h a r . The dashed brown lines show the used limitation function for diffusion with a lower and upper value of the influencing particle diameter ( d p _ l o w = 0.005 m; d p _ u p = 0.010 m) and an applied correction factor of ω c f = 10. Single points show the average rate of particle measurements with standard deviation. The cross indicates an estimated mean temperature in the fixed–bed batch rector CO2 measurement with a horizontal error indicator showing the deviation in temperature.
Energies 16 02888 g013
Figure 14. Mass fraction of char during particle measurements v f , C O 2 = 0.14 with different particle mass and size at 770 °C, 800 °C and 900 °C in (AC), respectively. Particle details are provided in Table 9, Table 10 and Table 11 below.
Energies 16 02888 g014
Figure 15. Product gas concentration of CO2 gasification (2022−00058) of pyrolysis char (2022−00058). (A) Gas composition scaled with N2 and (B) scaled to values of CO2 and CO.
Energies 16 02888 g015
Figure 16. Comparison of experimental and model data for the laboratory batch reactor experiments: (A) temperature measured, polynomials used and extrapolated bottom and top element temperature; (B) gas fraction measured at the outlet and values at the model outlet.
Energies 16 02888 g016
Figure 17. Calculated gas composition of CO and CO2 in the reactor bed at the end of the experimental time of 5171 s.
Energies 16 02888 g017
Figure 18. (A) Residual mass fraction calculated by model variation of parameters ω c f and (B) d p ; orange line indicates the measured residual mass from the bulk experiment.
Energies 16 02888 g018
Table 1. Properties and information of the investigated biomass.
Description and
Properties
ValuesUnitComments
WoodChar
typespruce--not further specified
origincalamity wood
germany
---
particle size>1 mm0.1 wt.%--DIN EN 15149-1 [28]
>3.15 mm1.7 wt.%---
>8 mm96.9 wt.%---
>16 mm1.3 wt.%---
average dimensions16 × 11 × 411 × 8 × 3mmstatistical ( n = 30)
Sauter diameter, x 1,2 0.01050.0076mDIN EN ISO 9276-2 [27]
bulk density178.4118.8kg m−3statistical ( n = 10)
true density-1850kg m−3[26]
apparent density405221kg m−3[26]
particle porosity-0.88-[26]
HHV20,08032,500kJ kg−1DIN EN ISO 18125 [29]
LHV18,79031,830kJ kg−1DIN EN ISO 18125 [29]
bark fraction<1<1wt.%-
ash content at 550 °C0.381.5wt.% (dry)DIN EN 14775 [22]
ash content at 855 °C-1.55wt.% (dry)DIN 51719 [23]
water content15.22.6wt.%DIN EN 14774-2 [24]
volatile matter84.5-wt.%DIN EN ISO 18123 [25]
ultimate analysis DIN EN ISO 16948 [19]
C5185.9wt.% (dry)-
H6.092.93wt.% (dry)-
Sn.d.n.d.wt.% (dry)not detectable (below detection limit)
O42.9110.84wt.% (dry)calculated residual
Nn.d.n.d.wt.% (dry)-
ICP–OES Total analysis24 elements24 elementsmg kg−1DIN EN ISO 16967 [20]
DIN EN ISO 16968 [21]
results in Appendix A
Table 2. STA steps for measurement of heterogeneous reaction rates.
StepModeTemperature
[°C]
Heating Rate
[K min−1]
Duration
[min]
Gas Flowrate
[mL min−1]
Comments
#1start40--200 N2-
#2heating 1to 13020-200 N2-
#3isothermalat 130-30200 N2to fully evaporate the humidity and inertiziation
#4heating 2Ttarget−1520-200 N2fast heating to approximate Ttarget
#5heating 3Ttarget53200 N2slow heating to acquire Ttarget
#6isothermalTtarget-40200 N2time to stabilize after heating
#7isothermalTtarget-300switch to reactive gas mixture with total flowrate of 200heterogeneous
reaction
#8end-----
Table 3. List of parameters for long–term char powder experiments.
Gas V01V02V03V04V05V06V07V08
CO2Ttarget,CO2 [°C]770770730750770790770770
v f , c o 2 [vol.%]20202020202012.55
O2Ttarget,O2 [°C]390390360375390405390390
v f , O 2 [vol.%]20202020202012.55
H2OTtarget,H2O [°C]760760720740760780760760
v f , H 2 O [vol.%]20202020202012.55
Table 5. Pyrolysis products at different temperatures and a heating rate of 7–10 K min−1.
Experiment NumberPyrolysis
Temperature
[°C]
Heating
Ratio
[K min−1]
InputOutput
Fuel Mass
[g]
Char Mass (Reactor)Gas (Dry, STP)Condensate
(Calculated)
[g][%][g][%][g][%]
2021-000785007–10470.3120.725.771.515.2278.059.1
2021-00079490.1126.625.874.515.2289.159.0
2021-00084458.8118.325.865.914.4274.659.9
2021-00108480.5124.225.865.213.6291.160.6
2021-00122485.6127.526.370.214.4288.059.3
2021-00210490.2122.625.071.314.5296.360.4
2021-00213476.9124.726.167.414.1284.859.7
2022-0002785012–13481.3105.421.993.6.19.4282.358.6
2022-00028463.5101.221.889.819.4272.658.8
2022-00040461.1101.322.093.020.2266.857.9
2022-00041475.2104.622.098.320.7272.357.3
2022-00057850/900481.2101.621.188.018.3291.660.6
2022-00065470.1101.921.784.017.9284.260.5
2022-00134466.798.121.084.118.0284.561.0
2022-00138463.3101.421.985.018.3276.959.8
Table 6. Total gas composition from 850 °C/900 °C pyrolysis and maximum calculated measurement error (2022-00057).
GasVolume
Fraction
[vol.%]
Maximum
Error
[vol.%]??
H238.7±3.5
CO26.6±3.0
CH422.1±3.4
CO211.9±0.1
C2H40.1±2.4
C2H60.6±0.7
Table 7. Ash content after distinctive gas reactions in TGA and error due to ash content deviation on the evaluated reaction rate.
GasAsh–Content
[wt.%]
SD
[wt.%]
Estimated Possible dF/dt
Error [%]
CO22.480.471.5
O24.140.972.5
H2O5.282.636
Table 8. Evaluated parameters for E A , j , c h a r , A 0 , j , c h a r and ν j , c h a r .
Gas, j A 0 , j , c h a r E A , j , c h a r ν j , c h a r
CO25.30 × 10133.27 × 1020.41
O25.79 × 1071.32 × 1020.61
H2O3.8 × 10102.57 × 1020.34
Table 9. Details on the particles used in measurements at 770 °C.
ParticleApprox. Size
[mm]
Volume
[mm³]
Weight
[mg]
d X 25 d t
[×10−5 s−1]
Approx.
ρ c , 0
[kg m−3]
LWH
01773.2156.829.54.57245
028.95.94.2220.536.69.75151
039.27.82.9208.123.95.89102
049.77.53218.333.16.56395
0512.773.5311.258.88.44198
Avg.9.57.03.4223.036.47.04162
Std.dev.1.80.70.549.812.01.8427
Table 10. Details on the particles used in measurements at 800 °C.
ParticleApprox. Size
[mm]
Volume
[mm³]
Weight
[mg]
d X 25 d t
[×10−5 s−1]
Approx.
ρ c , 0
[kg m−3]
LWH
016.95.33.3120.729.65.17245
0210.57.12.7201.330.46.18151
03107.55.5412.541.98.68102
047.272.4121.047.84.56395
0598.23.5258.351.27.19198
067.16.84.1198.047.18.02238
Avg.8.57.03.6218.641.36.63222
Std.dev.1.50.91.099.28.51.4792
Table 11. Details on the particles used in measurements at 900 °C.
ParticleApprox. Size
[mm]
Volume
[mm³]
Weight
[mg]
d X 25 d t
[×10−5 s−1]
Approx.
ρ c , 0
[kg m−3]
LWH
018.56.22.8147.628.720.7195
026.76.63.2141.528.320.6200
0386.13.9190.325.122.9132
046.95.43.5130.421.630.4166
055.55.12.879.515.431.0196
Avg.7.15.93.2137.723.825.1178
Std.dev.1.10.60.436.94.94.6526
Table 12. CO2 gasification products at different temperatures and a heating rate of 7–10 K min−1.
Experiment NumberPyrolysis
Temperature
[°C]
Heating
Ratio
[K min−1]
InputOutput
Fuel Mass
(Reactor)
Gasification AgentinoutChar Mass
(Reactor)
Gas
(Dry, STP)
[g][g][g][g][g][%][g][%]
2022-0004785031–34102.6 (2022-00041)431.2533.8529.666.464.7463.235.3
2022-0004899.4 (2022-00040)419.1518.5513.367.267.6446.132.8
2022-00058101.1 (2022-00057428.8529.9529.972.071.2457.928.8
2022-0012699.0 (2022-00065)446.1545.1542.870.971.6471.928.4
Table 13. Reactor mass balance for experiment 2022−00058 with maximum measurement error calculation.
Input MassMin
[g]
Measurement Amount
[g]
Max
[g]
MaterialMeasurement Error
fuel±0.1%101.01101.11101.21
feed gas CO2±0.23 L h−1 at 100 L h−1 STP428.15428.81429.46
feed gas N2±10.83 L h−1 at 1000 L h−1 STP1643.671663.081682.51
∑ input2172.832193.002213.18
∑ input without N2529.16529.92530.67
output mass
char ± 2%70.5571.9973.43
product gas 2028.702124.562227.15
product gas without N2 439.56457.92483.01
condensate (tar, water)-not measurednot measurednot measured
∑output2099.252196.552300.58
∑output without N2510.11529.91556.44
balance
output − input−73.583.5587.40
−3.39%of input mass0.16%of input mass3.95%of input mass
output − input
(without N2)
−19.05−0.0125.77
3.60%of input mass<0.002%of input mass4.86%of input mass
Table 14. CO2 reaction mass balance for experiment 2022-00058.
Measured CO2 Gasification Reaction
C+CO2<->2 CO
1 mol+1 mol 2 mol∑input
29.12 g 93.32 g 122.33 g122.44 g
−0.11 g (0.37%C-reaction)
mass calculation
101.01 g char input-71.99 g char output=29.12 g C reaction
428.80 g CO2 feed gas-335.48 CO2 product gas=93.32 g CO2 reaction
Table 15. Comparison of pyrolysis products with the literature in wt.% of solid fuel.
ComponentMass Fraction
[wt.% to Fuel]
This Study650 °C [40]750 °C [40]703 °C Pine [41]
char21.515.615.027
condensate58.961.548.954
thereof H2O-19.215.920
total gas19.322.134.621
H20.87--0.2
CO8.347.720.36.0
CH43.961.63.82.3
CO25.6012.39.311.5
C2H40.030.51.2-
C2H60.20---
Table 16. Comparison of gasification parameters with various literature data.
ParameterThis StudyVarious Research
Reviewed by Di Blasi
[42]
Schneider et al.
[43]
Unit
E A , C O 2 3.270.88–2.503.0–3.1[×102 kJ/mol]
A 0 , C O 2 5.30 × 10133.1 × 106–2.59 × 1085.68 × 109–1.02 × 10¹⁰varying
ν C O 2 0.410.4–0.60.19–0.21-
E A , O 2 1.320.76–2.29-[×102 kJ/mol]
A 0 , O 2 5.79 × 1075.3 × 105–4.5 × 10⁸-varying
ν O 2 0.610.5–1--
E A , H 2 O 2.571.43–2.372.35–2.64[×102 kJ/mol]
A 0 , H 2 O 3.8 × 10101.7 × 105–2.62 × 1081.55 × 106–5.7 × 10⁸varying
ν H 2 O 0.340.4–10.45–0.47-
Disclaimer/Publisher’s Note: The statements, opinions and data contained in all publications are solely those of the individual author(s) and contributor(s) and not of MDPI and/or the editor(s). MDPI and/or the editor(s) disclaim responsibility for any injury to people or property resulting from any ideas, methods, instructions or products referred to in the content.

