Article

Numerical Investigation of the Long-Term Load Shifting Behaviors within the Borehole Heat Exchanger Array System

1
School of Energy and Power Engineering, Xi’an Jiaotong University, Xi’an 710049, China
2
Shaanxi Coalbed Methane Development Co., Ltd., Xi’an 710119, China
3
School of Human Settlements and Civil engineering, Xi’an Jiaotong University, Xi’an 710049, China
4
School of Civil Engineering and Architecture, Henan University of Science and Technology, Luoyang 471000, China
*
Authors to whom correspondence should be addressed.
These authors contributed equally to this work.
Energies 2023, 16(5), 2497; https://doi.org/10.3390/en16052497
Submission received: 27 January 2023 / Revised: 3 March 2023 / Accepted: 4 March 2023 / Published: 6 March 2023
(This article belongs to the Topic Heat Exchanger Design and Heat Pump Efficiency)

Abstract

:
In the process of development and utilization of a large-scale borehole heat exchanger (BHE) array system, the phenomenon of load shifting within BHE array can be observed. In this paper, OpenGeoSys software coupled with TESPy toolkit is used to establish a comprehensive numerical model of BHE system (without depicting the heat pump part), and the behaviors of load shifting between BHEs with different design parameters are studied. The results show that the outlet temperature of single BHE and BHE array is generally rising, and the soil temperature around the BHE has accumulated unbalanced heat. The soil temperature near the BHEs array fluctuates more obviously than the single BHE system, and the distribution is uneven. At the end of the 15th year, the soil temperature near the center BHE increased by 2 °C compared with the initial soil temperature, which was more favorable in winter, but was not conducive to the performance improvement in summer. Further analysis by changing the inter-borehole spacing shows that with the increase of the inter-borehole spacing, the load shifting behaviors are gradually weakened, and the maximum shifted load of the central BHE is linear with the change of the inter-borehole spacing. After changing the layout methods, we observe that the more intensive the layout is, the more load shifting behavior is, and the unbalanced rate of soil temperature distribution around the linear layout is lower than other layouts. With the increase in the number of BHEs, the load shifting behaviors are further enhanced. By analyzing the proportion of shifted load amount relative to the average value, it is found that the system will take a longer time to reach heat balance with the increase of BHEs’ number. A shutdown of part of BHEs for a certain period of time will help to improve the long-term operational efficiency of the large-scale shallow ground source heat pump (GSHP) system.

1. Introduction

Heating, cooling and lighting are the major energy consumers in the building sector, accounting for about 40% of the total energy consumption [1], and their carbon emissions have a significant impact on environmental issues such as haze [2]. The proportion of space heating and domestic hot water consumption varies from country to country within the building sector, with more than 40% in China [3] and more than 75% in Europe [4]. According to statistics, China’s building energy consumption will become an important factor in energy consumption and carbon emissions in the next 20 years [5]. Increasing the proportion of clean energy in total energy consumption in the building sector is of great significance for the early realization of China’s dual-carbon vision [6]. In particular, reducing building heating and air conditioning energy consumption, improving energy efficiency, and promoting the application of clean energy and renewable energy technology in buildings, has become the focus of energy conservation and emission reduction in the field of construction in China [7,8,9].
With the acceleration of urbanization in China, the energy consumption of building heating and air conditioning will continue to grow rapidly in the future [2,10], so it is imperative to seek clean energy and sustainable energy supply for building heating and air conditioning. Geothermal energy is a renewable alternative to fossil fuels, and although the high investment costs associated with drilling are to be taken into account when using geothermal energy, it is still one of the viable energy solutions in many countries [11] due to advances in technological solutions [12]. Building heating in China mainly relies on coal-fired boilers, thermal power plants, gas boilers, ground source heat pumps (GSHPs), and other forms of heat sources [13,14,15]. The GSHP system mainly uses shallow or medium-deep geothermal energy, and its total installation covers about 71% of the total installation of geothermal energy utilization [16,17]. As a safe and low-carbon clean energy, geothermal energy has been rapidly developed in China because of its abundant resources (recoverable reserves equivalent to 4626.5 billion tons of standard coal) and sustainable utilization [18]. In the 14th Five-Year Plan development proposal of China in 2021, the State Energy Administration issued the Notice on Renewable Energy Heating Work According to Local Conditions, which regards geothermal energy as an important way of renewable energy heating, and China’s geothermal energy industry will flourish in the future.
As the most widely used form of shallow geothermal energy, shallow GSHP system [19] usually includes three parts: building terminal system, ground source heat pump unit and borehole heat exchanger (BHE) [20,21]. At present, shallow GSHP system accounts for a large proportion of China’s heat pump engineering. Reasonable system design is the cornerstone to ensure the efficient operation of shallow GSHP system [1,22]. In recent years, a large number of BHEs have been deployed in the shallow GSHP projects to meet the increasing building load demand, some even up to hundreds of BHEs [23]. The performance of the BHE array system is affected by the thermal interaction between the BHEs [24]. At present, the thermal interaction between the large BHE array has been investigated by some scholars [25].
Naicker and Rees [26] have reported the detailed investigation of the performance of a large GSHP system during its first three years of operation and McDaniel et al. [27] have studied the ultra-large-scale BHE array systems. These analysis focused on the short-term behavior of the system. Li et al. [28] have studied the long-term performance of the BHE array systems, but all did not consider the coupling characteristics of the ground pipe network. On the other hand, most analytical solutions have difficulty in quantifying thermal interactions in BHEs, in contrast to numerical models which are more realistic by considering different boundary conditions, soil heat recharge, groundwater flow, and geothermal gradients [29,30].
For large-scale shallow GSHP technology, Shao and Randow et al. [31] used their self-developed open source software OpenGeoSys (OGS) to couple Python toolkit TESPy to realize the coupling dynamic simulation of coupled soil heat exchange of underground BHEs and hydraulic characteristics of pipe network system. Cai et al. [32] investigated the load shifting behaviors within the DBHE array coupled with the ground pipe network and further studied the long-term system performance affected by different arrangements of the array. Chen et al. [33] validated the results of a large BHE array running for two years by simulation, and found that the system accumulated heat due to the influence of cooling load, and at the same time, the shifting behaviors occurred in the array. This phenomenon of load shifting refer to the behavior that the actual cooling or heating loads imposed on the BHEs at different positions in the BHE array deviate from the design loads when the large-scale GSHP system runs for a long time. Wang et al. [34] proposed a new type system, the medium-shallow BHE system. Through long-term simulation of the comprehensive numerical model, it was found that the results showed that the load imbalance rate of the BHEs located at the edge and the center was greatly different due to the influence of load shifting phenomenon.
Based on the above literature review, it can be seen that with the operation of the shallow GSHP system, the cooling or heating load imposed on each BHE within the BHE array are not identical. The load will be shifted from one BHE to another. This kind of load shifting phenomenon will aggravate the heat or cold accumulation of subsurface. It is necessary to quantify the load shifting behavior under different design parameters, which will provide a reference for the future design of shallow BHE array system. Considering the convenience of numerical method compared to in situ experimental study [35,36], we have studied the performance of the BHE array equipped with a pipe network. However, our previous work was executed for only two years, which cannot depict the long-term performance of BHE array. In this work, the 15-year simulation with different design parameters [35] of BHE array with pipe network features is firstly implemented and the corresponding design suggestions are given.
Firstly, the difference in inlet and outlet water temperature between 9 U-type BHE (hereinafter referred to as x-U for x single U-type BHE) and single BHE was discussed and the relationship between soil temperature and thermal interaction of BHEs was analyzed. Secondly, the design parameters (inter-borehole spacing, layout method) are changed to understand the load shifting behaviors at this time. Finally, the number of BHEs is altered. The load shifting behaviors of 5-U, 9-U, and 25-U BHEs are compared. The whole work was analyzed from multiple perspectives around the load shifting behaviors, which provides a reference for the subsequent shallow GSHP project.

2. Methodology

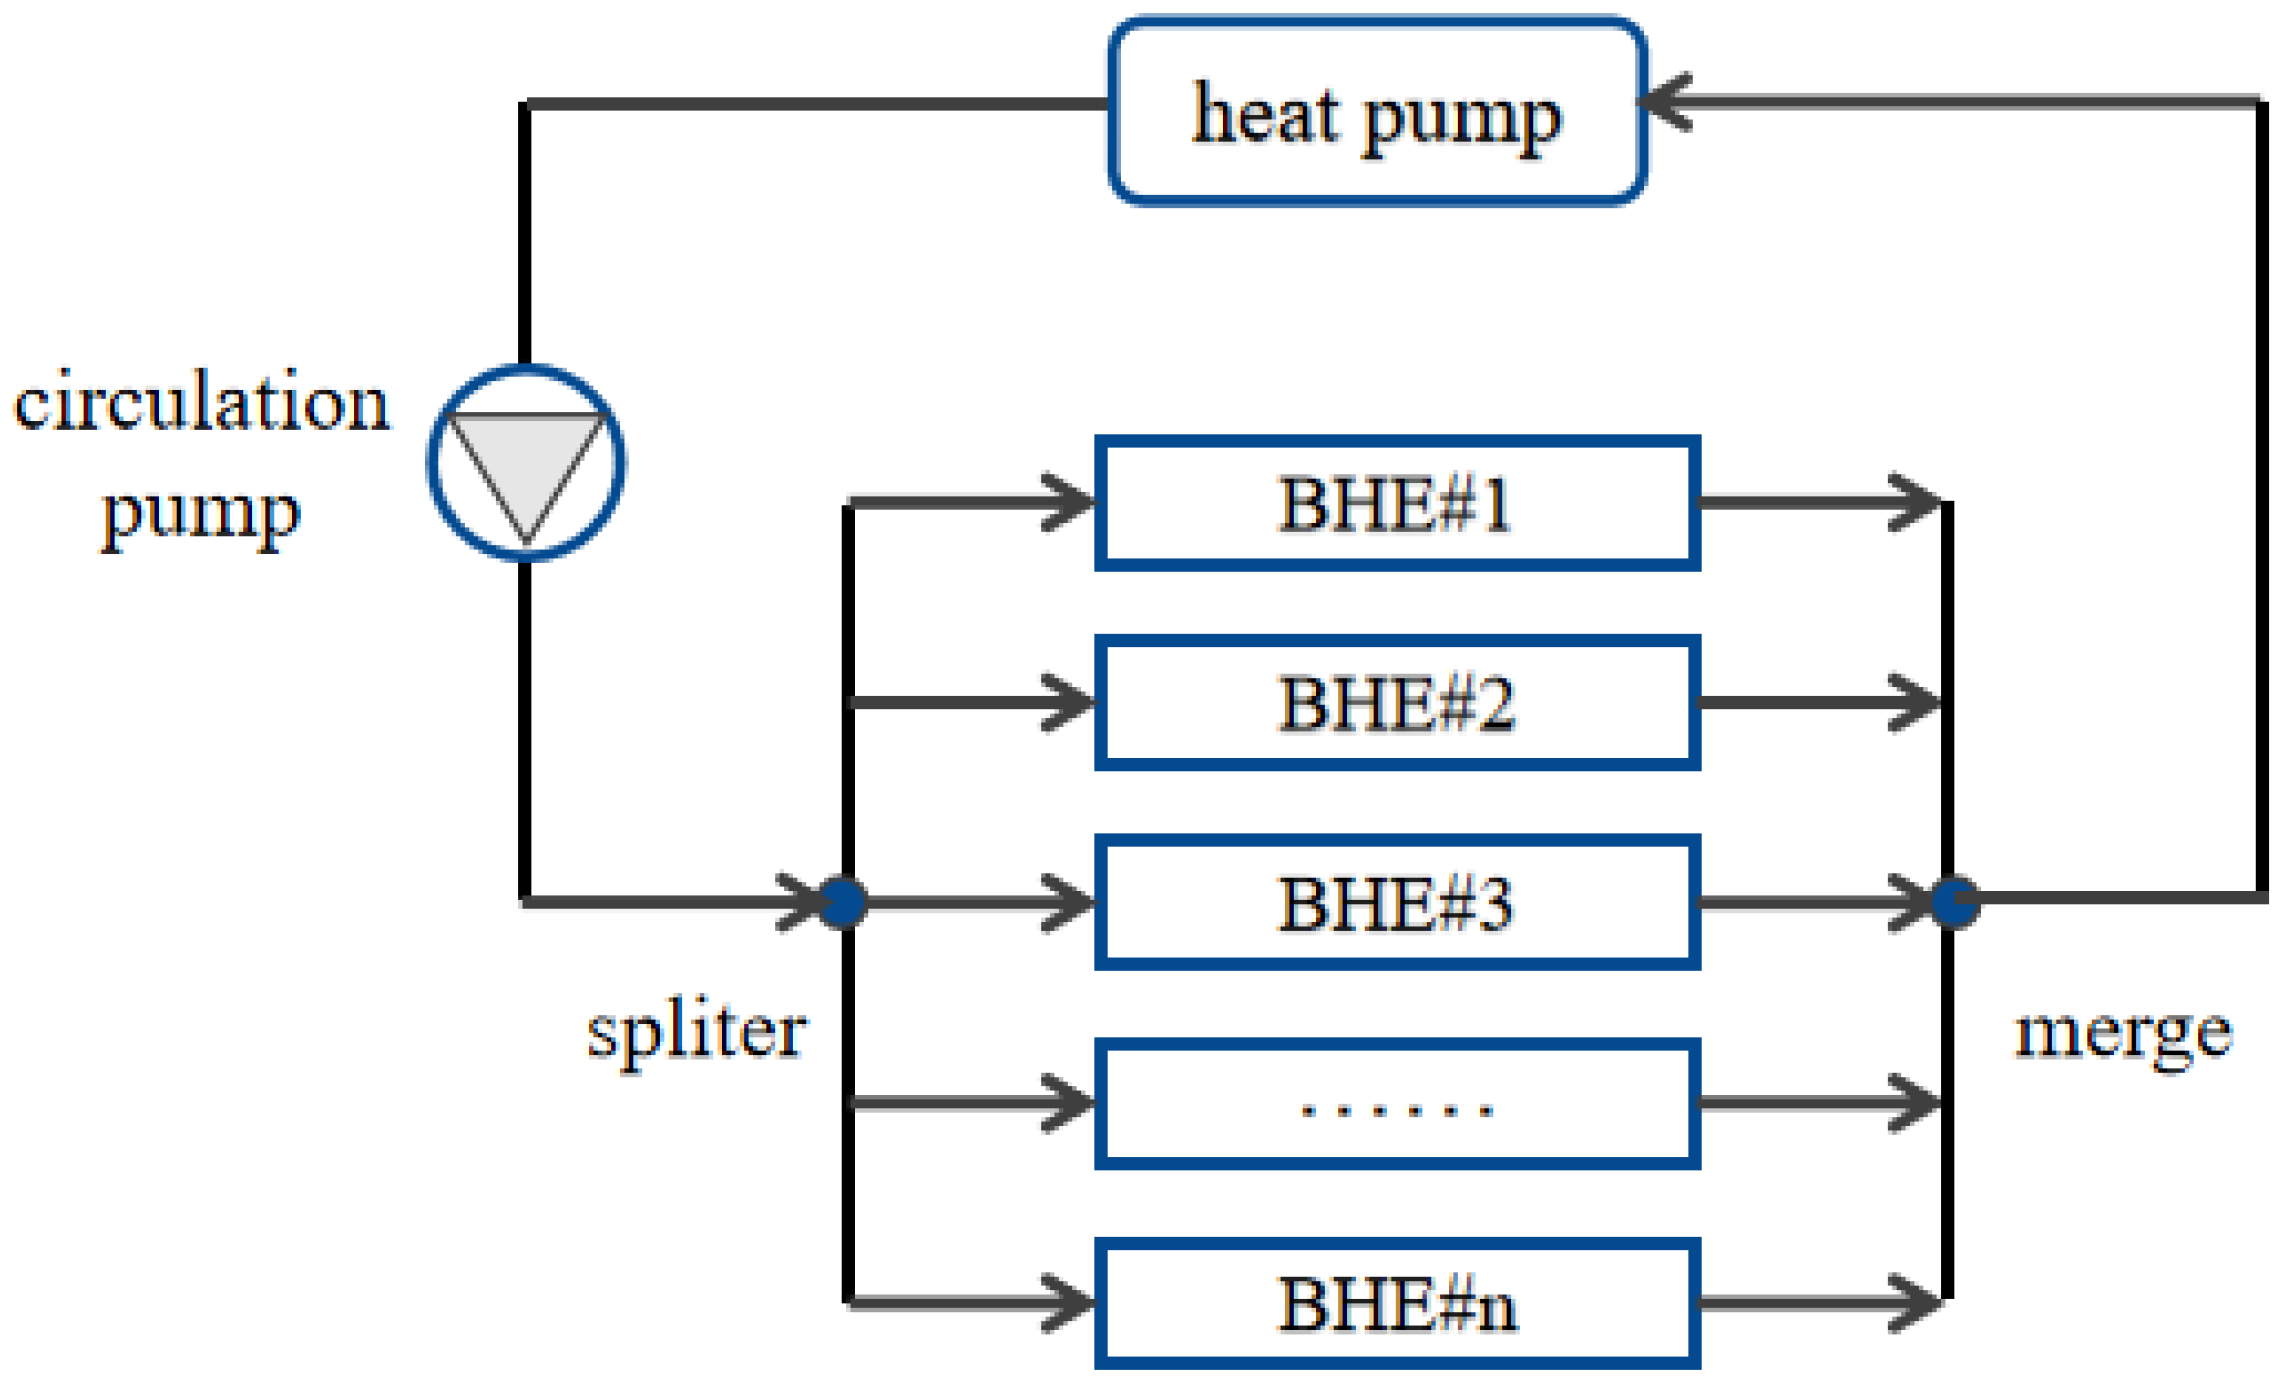
2.1. OGS Coupled TESPy

OGS uses the bi-continuum finite element method to simplify the borehole part of the BHE model domain into a one-dimensional linear finite element mesh (including the shallow BHE array and the surrounding backfill material), and uses discrete three-dimensional prism elements to replace the soil part. Then the Robin boundary condition is used to couple the borehole part and the soil part, and the underground heat transfer process is reflected by solving the convection and conduction heat balance equations in the three-dimensional model domain [36,37].
With the rapid expansion of construction projects in China, the thermal load increases sharply, and the GSHP system often needs to be composed of dozens or even hundreds of BHEs. In the long-term operation, the hydraulic interaction effect caused by the connection between the BHEs and the ground pipe network needs to be considered, while the long-term simulation running time of OGS is maintained at an acceptable level [36]. On the other hand, TESPy [38] can be used to calculate the pressure, mass flow rate and enthalpy of fluid at each pipe network connection in the BHE array. In each iteration, the outlet temperature of the BHE is calculated by OGS and transmitted to TESPy. According to the load situation, TESPy will calculate the inlet temperature and flow rate of each BHE and send them back to OGS for the next iteration, where the hydraulic head loss due to friction in the single U BHE of the BHE array is quantified by the Darcy–Weisbach equation. When the standard deviation of the iterative results is less than the set residual, the model converges. Figure 1 shows a simplified closed pipe network model including BHEs, heat pumps (this part is not involved in this work but will be further investigated in the future), and water pumps in OGS-TESPy.

2.2. Proportion of the Shifted Load
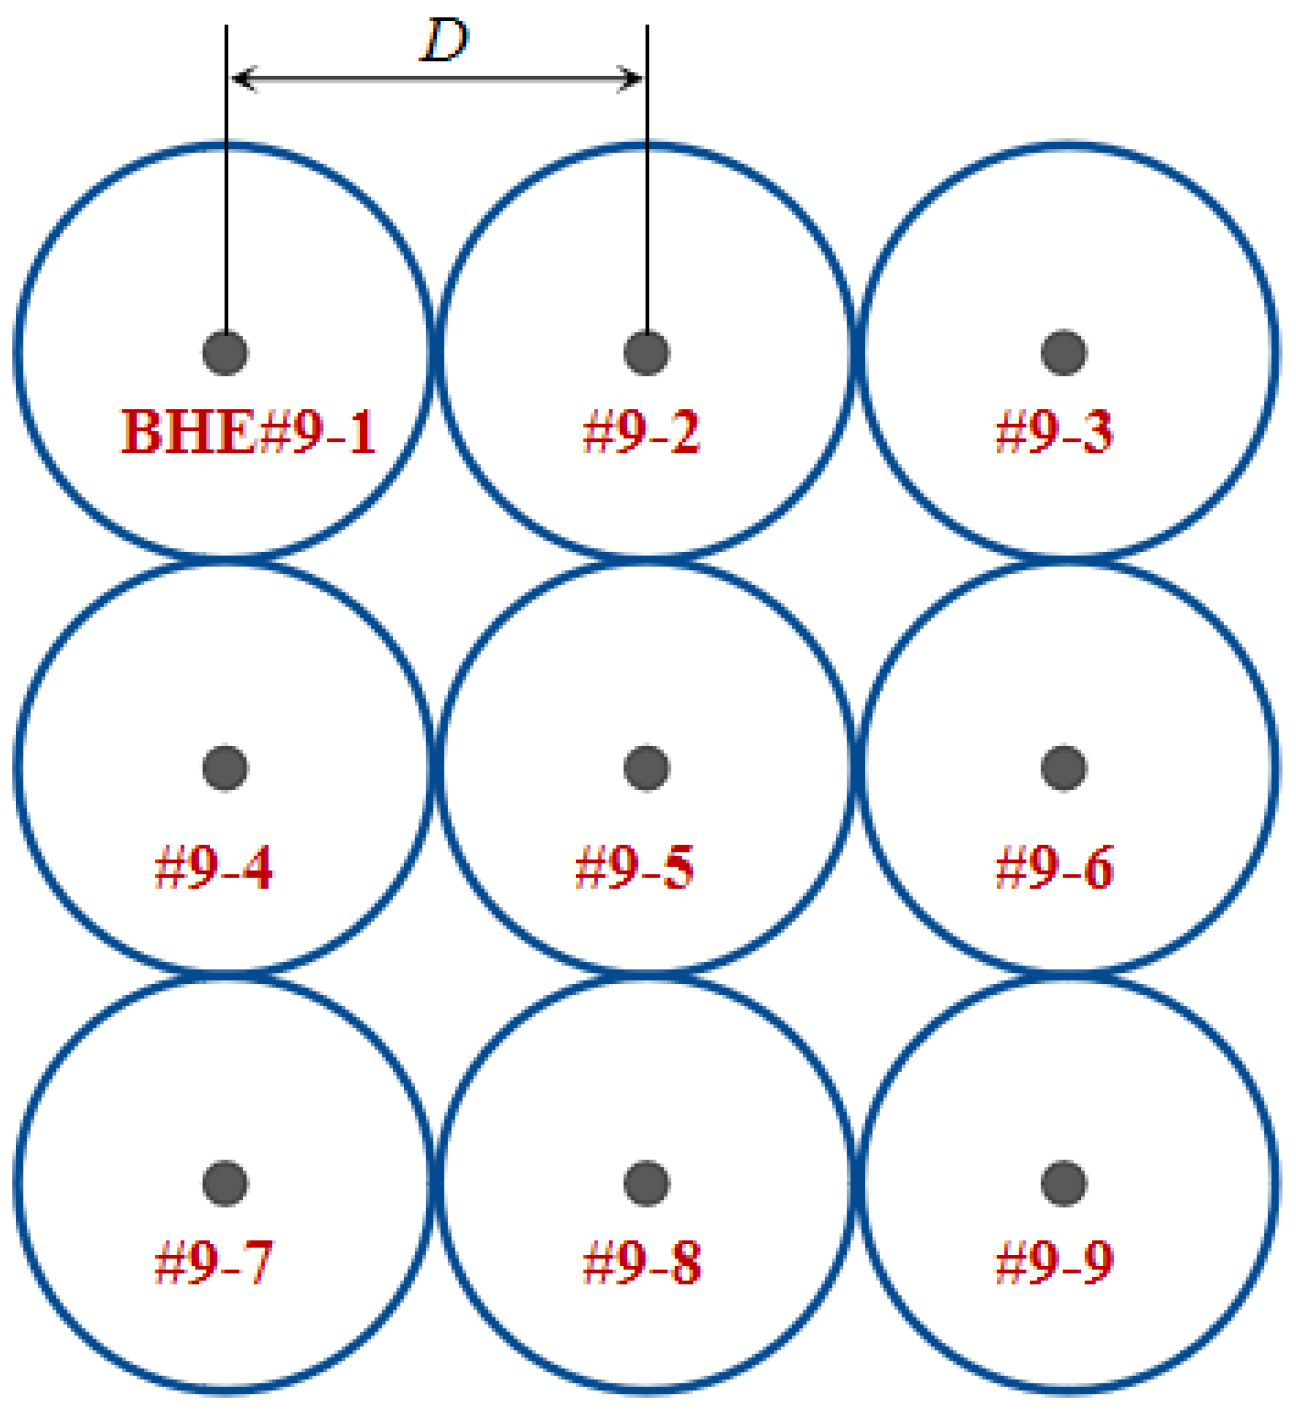
In this paper, the cooling or heating load is amount of heat extracted from the underground, which is directly loaded on the BHE array in the simulation. In order to clarify the soil heat accumulation and the shifted load within the BHEs, OGS software was used to simulate the inflow and outflow temperature changes of every single BHE in shallow GSHP system, and the actual heat exchange rate of each BHE was calculated from Equation (1).
Q ˙ i = c f m ˙ ( T i n T o u t ) d t
where i refers to the index of the BHE in the array. Q ˙ i is the heat injection rate at i-th BHE. c f is the specific heat capacity of the circulating fluid. m ˙ is mass flow rate.
For each BHE, the heat exchange rate is compared with the system average value, and the shifted load of each BHE is calculated and expressed by Q . The percentage of the shifted thermal load (PSTL) can also be used to further analyze the load shifting behaviors and its shifted rate, which be calculated from Equation (2) for each of the BHEs.
P S T L = Q Q ˙ m e a n × 100 % = Q ˙ i Q ˙ m e a n Q ˙ m e a n × 100 %
where Q ˙ m e a n is the mean heat injection rate of the BHEs array.

3. Model Setting

As for the model setting, the geological conditions of model used in this study is set up based on our previous publication [33,39]. The Dirichlet boundary condition with monthly mean ambient temperature is assigned to the top of the model domain. The lateral surface of the domain is set as the no-heat-flux boundary condition. The bottom of the domain is also set as the Neumann boundary condition with the standard geothermal heat flux in the Leicester area. The domain size is designed as 100 × 100 × 135 m to avoid the interference of the thermal plume generated, then again, the maximum size of the axial element is set to 8 m and the vertical grid density is set to 10 m to ensure the accuracy and save the calculation cost at the same time [32,34]. The wall material of BHE is high density polyethylene and the heat exchange capacity of our each BHE model is set as 12.5 W per meter [36]. Furthermore, the length of BHE is 100 m, and the scale of heat exchange capacity for each BHE in the BHE array is 1.25 kW. Table 1 shows the detailed parameters of the BHE model. In addition, the OGS-TESPy numerical model has been validated for two years in our previous work [33]. The simulated and predicted outlet temperature evolution is in agreement with the observed.

4. Results

4.1. Long-Term Performance

In this work, nine single U-type BHEs are selected to study the load shifting behaviors between BHE array in long-term operation. The arrangement of 9-U BHE is as shown in Figure 2, and the inter-borehole spacing (D) is set as 4 m. In order to understand the specific conditions of boreholes at different positions in the system, the characteristic boreholes of a single borehole and 9-U BHE (BHE# 9-1 and # 9-3, # 9-7, and # 9-9 are symmetrically distributed, and BHE # 9-2 and # 9-4, # 9-6, # 9-8 are symmetrically distributed. The law of interaction between BHEs is basically the same, so this paper selects the representative boreholes # 9-1, # 9-2, and # 9-5 for analysis) were simulated for a long period of 15 years.

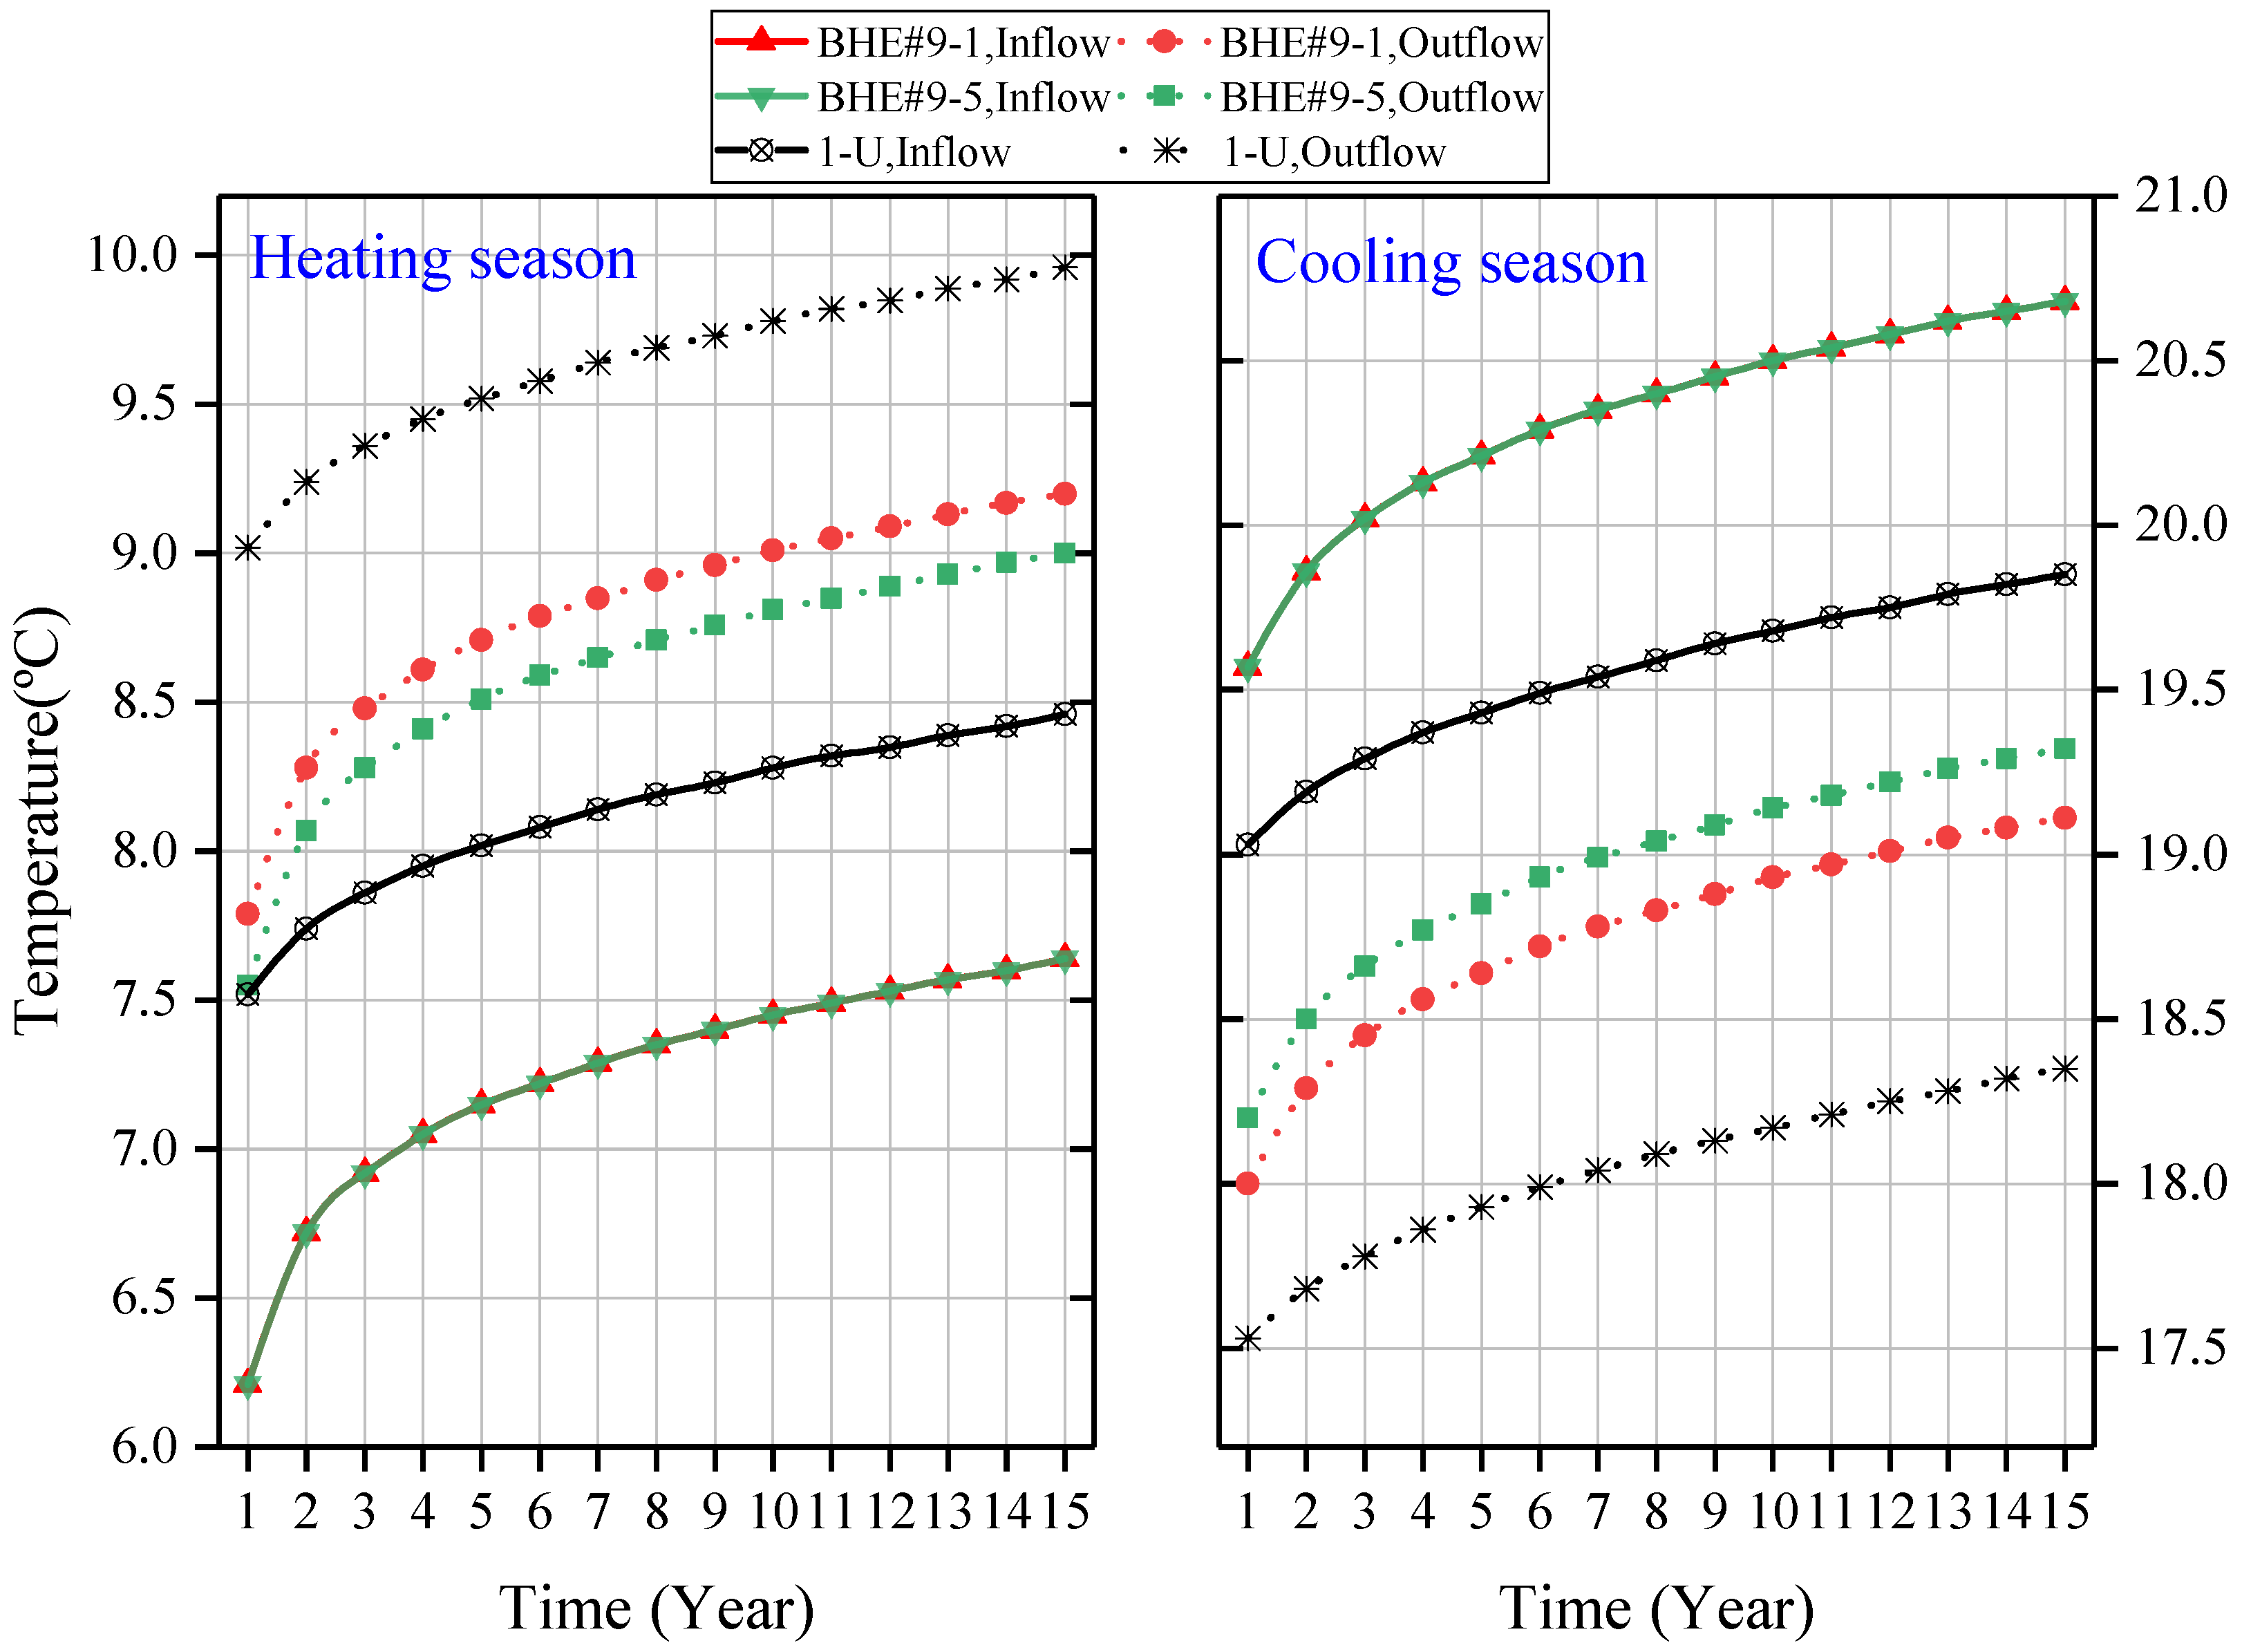
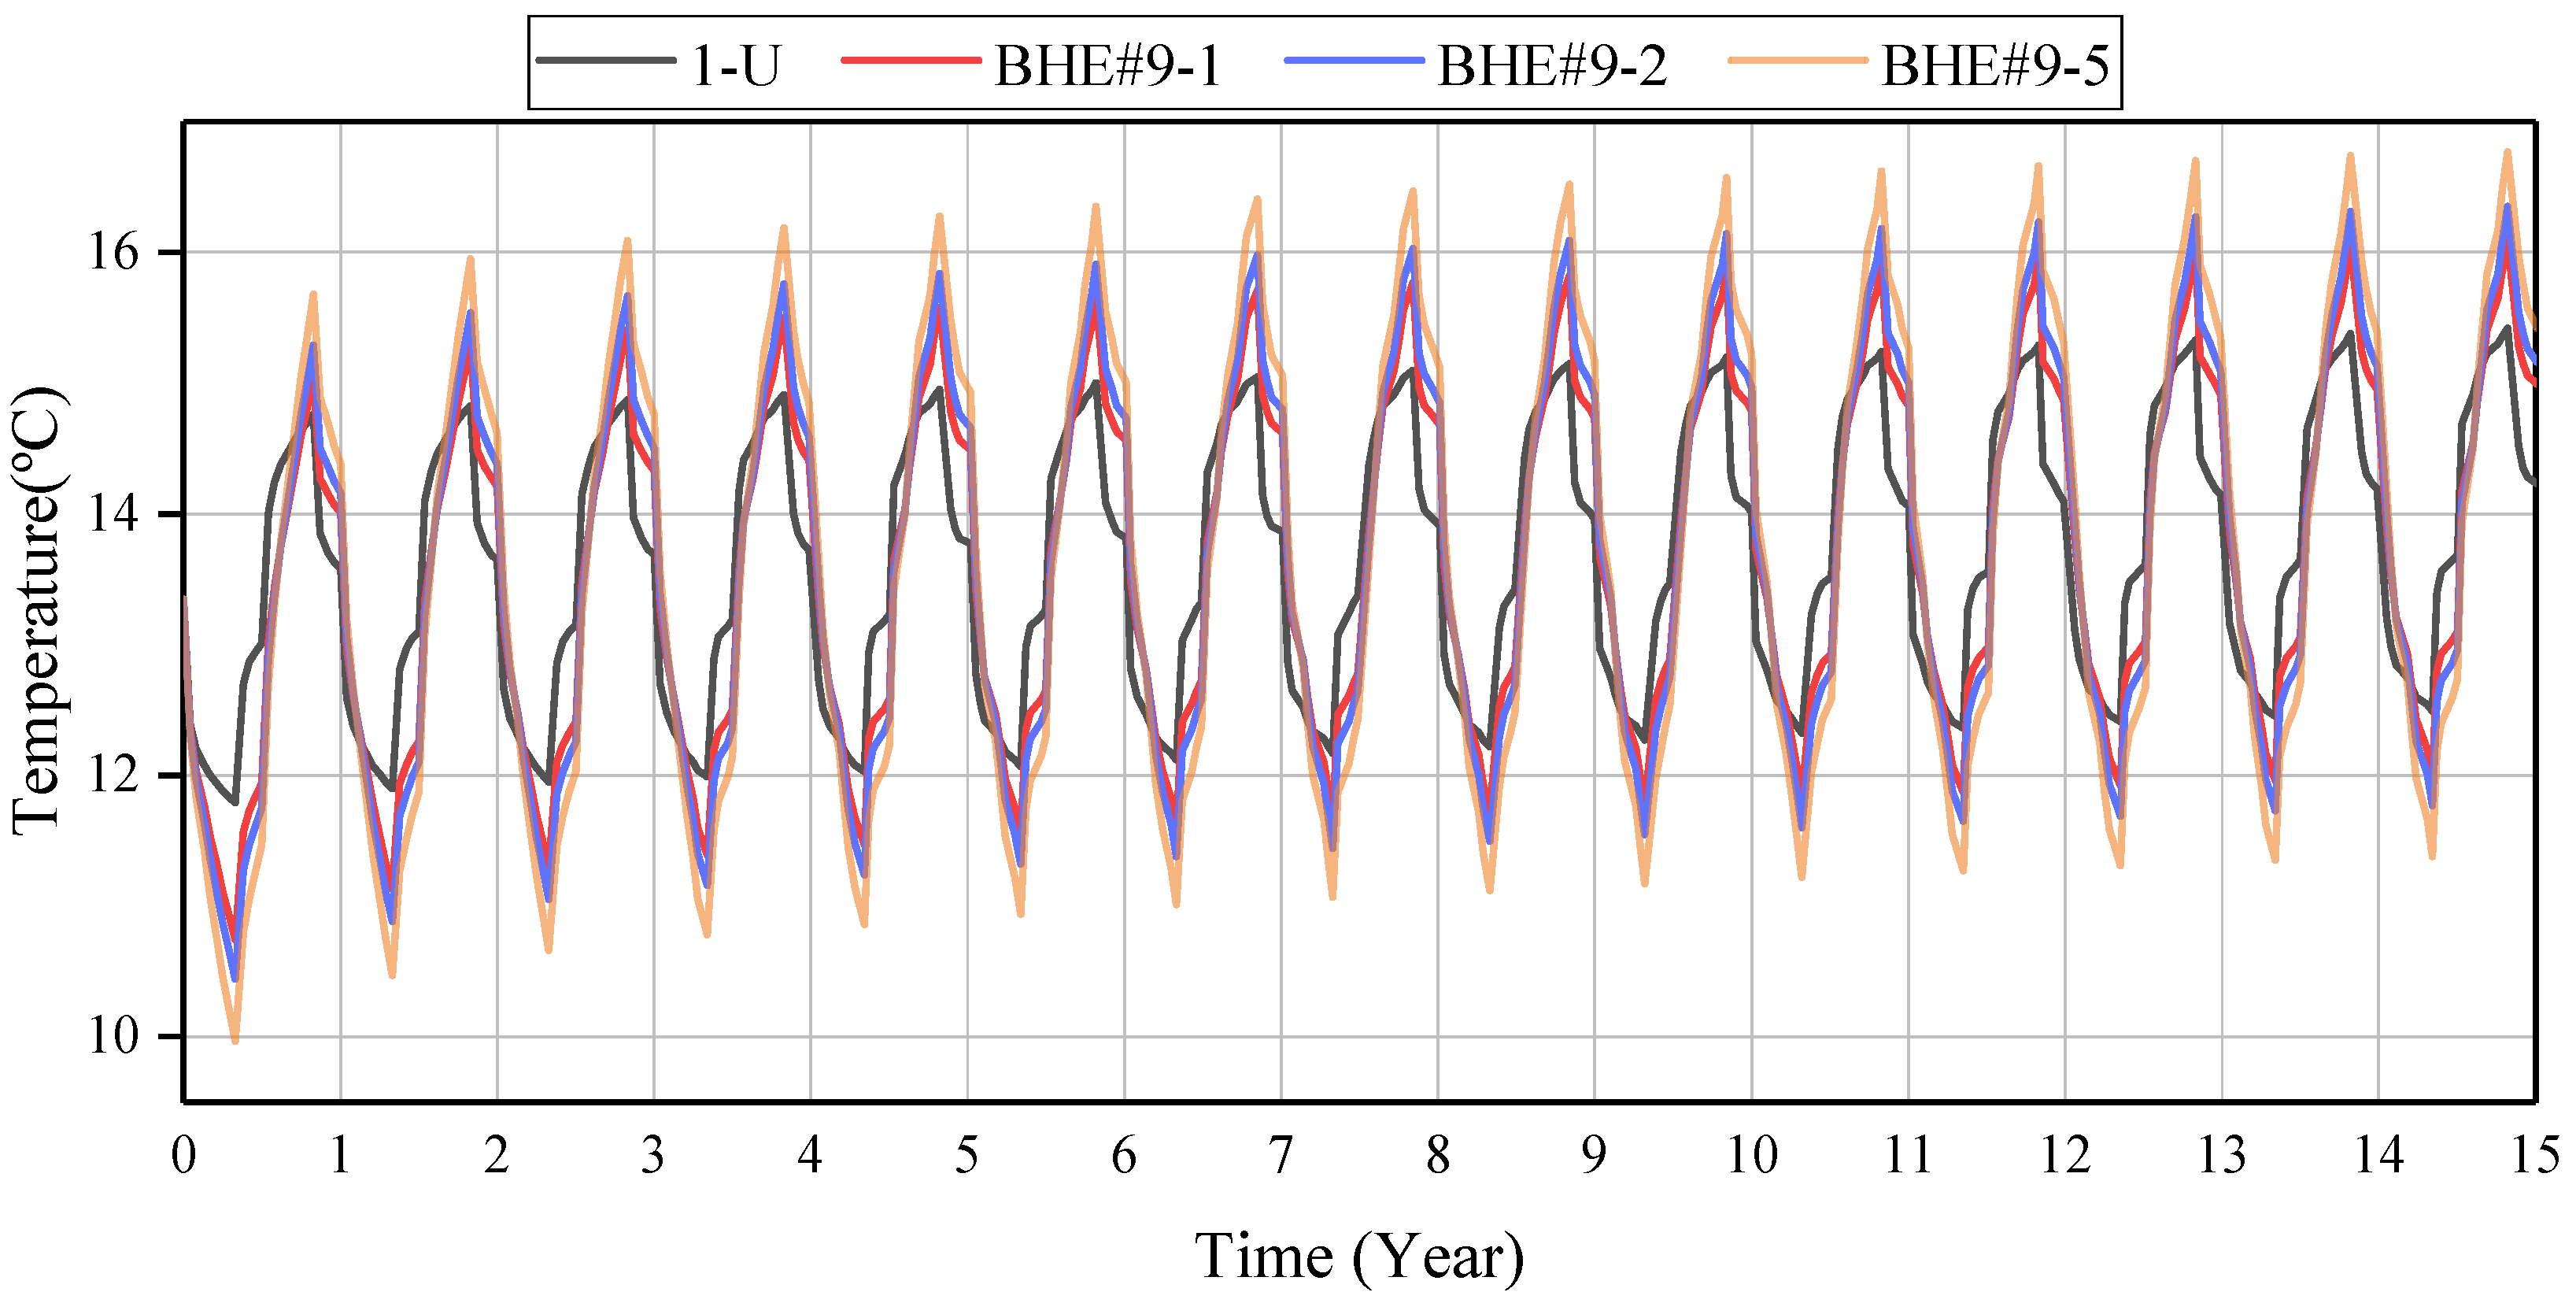
4.1.1. Evolution of Inlet and Outlet Temperatures

Figure 3 shows the change of inlet and outlet temperature at the end of the heating and cooling season for 9-U BHE and single BHE over 15 years. In the case of single BHE, the overall change of inflow and outflow temperature in the heating and cooling season increases steadily year by year. After 15 years of operation, the outlet temperature in heating season increases by 0.94 °C, and the outlet temperature in cooling season increases by 0.82 °C. In the 9-U BHE array, due to the parallel operation of the BHE, the inlet temperature of all boreholes in the BHE array is kept the same, but the outlet temperature curve is not overlapped, and the outlet temperature curve of # 9-1 is located above # 9-5, which indicates that during the operation of the system, the load imposed on each BHE is different from that of other BHEs, and the heat exchange rate of the central BHE is lower than that of the edge BHE.
Further observation of Figure 3 shows that the maximum difference between the outlet temperature at the end of the first heating season and the second heating season in 15 years is observed. For # 9-5, the outlet temperature rises by 0.52 °C at this time. However, for # 9-1, the outlet temperature increased by 0.49 °C at the end of the second heating season, which shows that the temperature fluctuation of the central BHE is more obvious than that of the edge, and the water temperature of the central BHE is more affected by the interaction between the BHE array. The outlet temperature of each borehole increases slowly with the increase in operation time, and the temperature fluctuation does not exceed 0.10 °C from the sixth year.
The temperature change trend of the inflow and outflow of the BHE in the heating season and the cooling season is the same as that of the single BHE in the long-term operation. At the end of each heating and cooling season, the inlet and outlet water temperature of each BHE in the BHE array is lower than that of a single BHE in the same period. At the end of the first heating season, the outlet temperatures of # 9-5 and # 9-1 were 7.55 °C and 7.79 °C which were 1.47 °C and 1.23 °C lower than those of the single BHE, respectively. It can be seen that the outlet temperature of the central BHE decreased more. After 15 years of operation, the difference is slightly reduced to 0.96 °C and 0.76 °C, respectively. For the cooling season, the water temperature curve of the inlet and outlet of the single BHE is also more gentle than that of the BHE array. After 15 years’ operation of the system, the outlet water temperature of the BHE array continues to rise, indicating that the soil temperature around the BHE has accumulated residual heat.

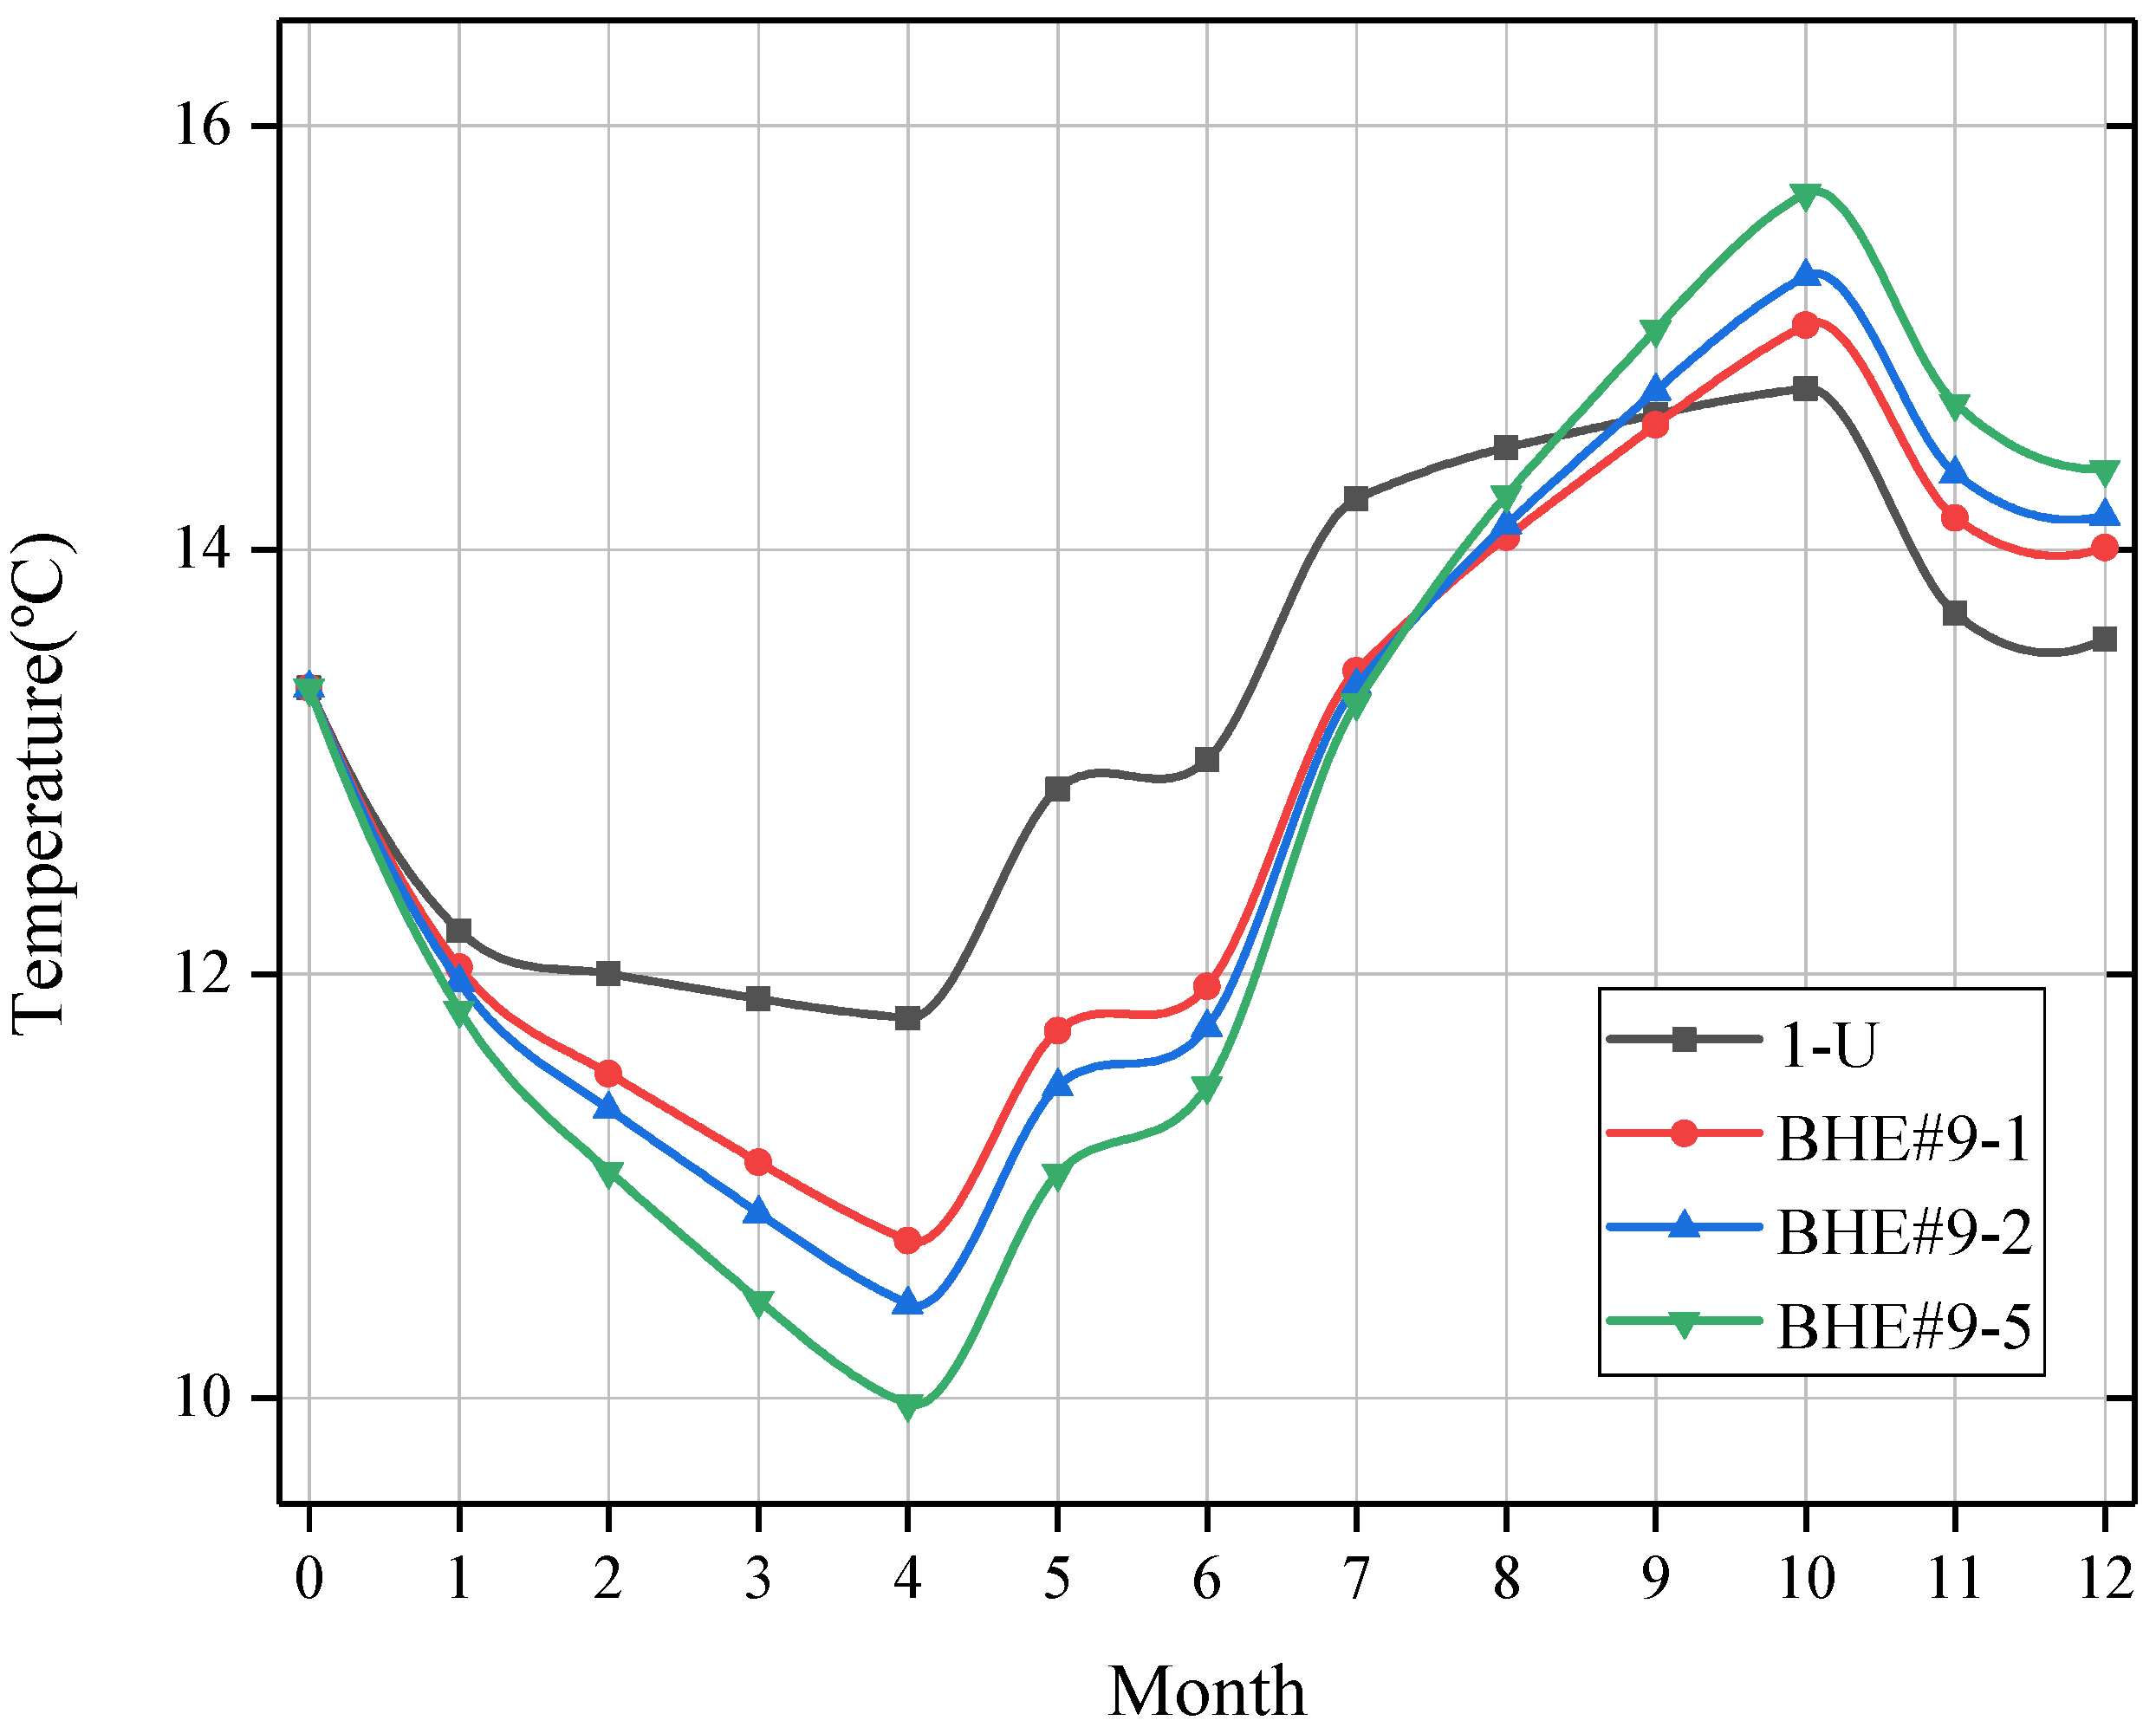
4.1.2. Evolution of Soil Temperature

In order to further explore the continuous accumulation of this residual heat underground, Figure 4 describes the soil temperature in the first year. The initial soil temperature here is 13.35 °C, the selected location is 0.38 m away from the BHE and the depth is 55 m. For a single BHE, the fluctuation of soil temperature in a year is small. In the heating season from January to April, the change of soil temperature is 0.41 °C and it decreases significantly only in the first month. In the cooling season from July to October, the increase of soil temperature is 0.52 °C and it falls back to 13.58 °C in December. The difference to the initial ground temperature is small. For 9-U BHE, because of the thermal interference between adjacent BHEs, the overall soil temperature change is more obvious, and the soil temperature changes around different BHEs are different. Evidently, the soil occurs heat imbalance. The soil temperature near the # 9-5 fluctuated most, and at the end of the heating season in late April, the temperature there dropped by 3.38 °C. After the end of the heating season, the soil temperature rose by 1.5 °C after two months of recovery. At the end of the cooling season, the soil temperature near # 9-5 increased dramatically, more than 4 °C higher than that in June, which was about 3 °C higher than that of single BHE in the same period. After two months of the recovery period, the soil temperature near the # 9-5 has increased by 1 °C compared with the initial soil temperature, while the soil temperature near the # 9-1 is 0.66 °C higher than the initial soil temperature. The most obvious heat accumulation occurs in the central borehole.
Figure 5 shows the variation of soil temperature after 15 years of long-term operation of the system. During the operation of the GSHP system, the soil temperature changes periodically in the cooling-transition-heating of working period, which is characterized by the soil temperature rising in the cooling season, falling in the heating season, and gradually recovering in the transition season. The change of soil temperature near the single BHE was the smallest, and the maximum soil temperature at the end of the cooling season could reach 15.42 °C after 15 years of continuous heat accumulation, while the soil temperature at the end of 15 years was only 0.7 °C higher than the initial soil temperature. The soil temperature near # 9-1 is smaller than that near # 9-5. The lowest soil temperature near # 9-5 is 9.97 °C, and the highest is 16.77 °C. At the end of the 15th year, the soil temperature is 2 °C higher than the initial soil temperature. Although the temperature of soil and inlet and outlet water temperature increased with time, the temperature of inflow and outflow of different BHEs in the 9-U BHE did not differ significantly from each other at the same time. The different evolution of outflow temperature on each BHE was due to the different soil temperature distribution near each BHE with time. This rising trend is more favorable for heat extraction in winter, and the continuous accumulation of residual heat will not be conducive to the performance improvement of heat pump units in summer.

4.2. Effect of Inter-Borehole Spacing

The thermal interaction between BHEs is different with various design parameters. The distance between adjacent BHEs is an important parameter affecting the thermal interaction in BHE array [40,41]. To clarify the soil heat accumulation status and the shifted load between BHEs when the inter-borehole spacing is different, according to the standard in China [42], the inter-borehole spacing (D) between BHEs is set to 3 m, 4 m, 5 m, and 6 m respectively in this work. The arrangement of BHE is shown in Figure 2, and other relevant parameters are unchanged.

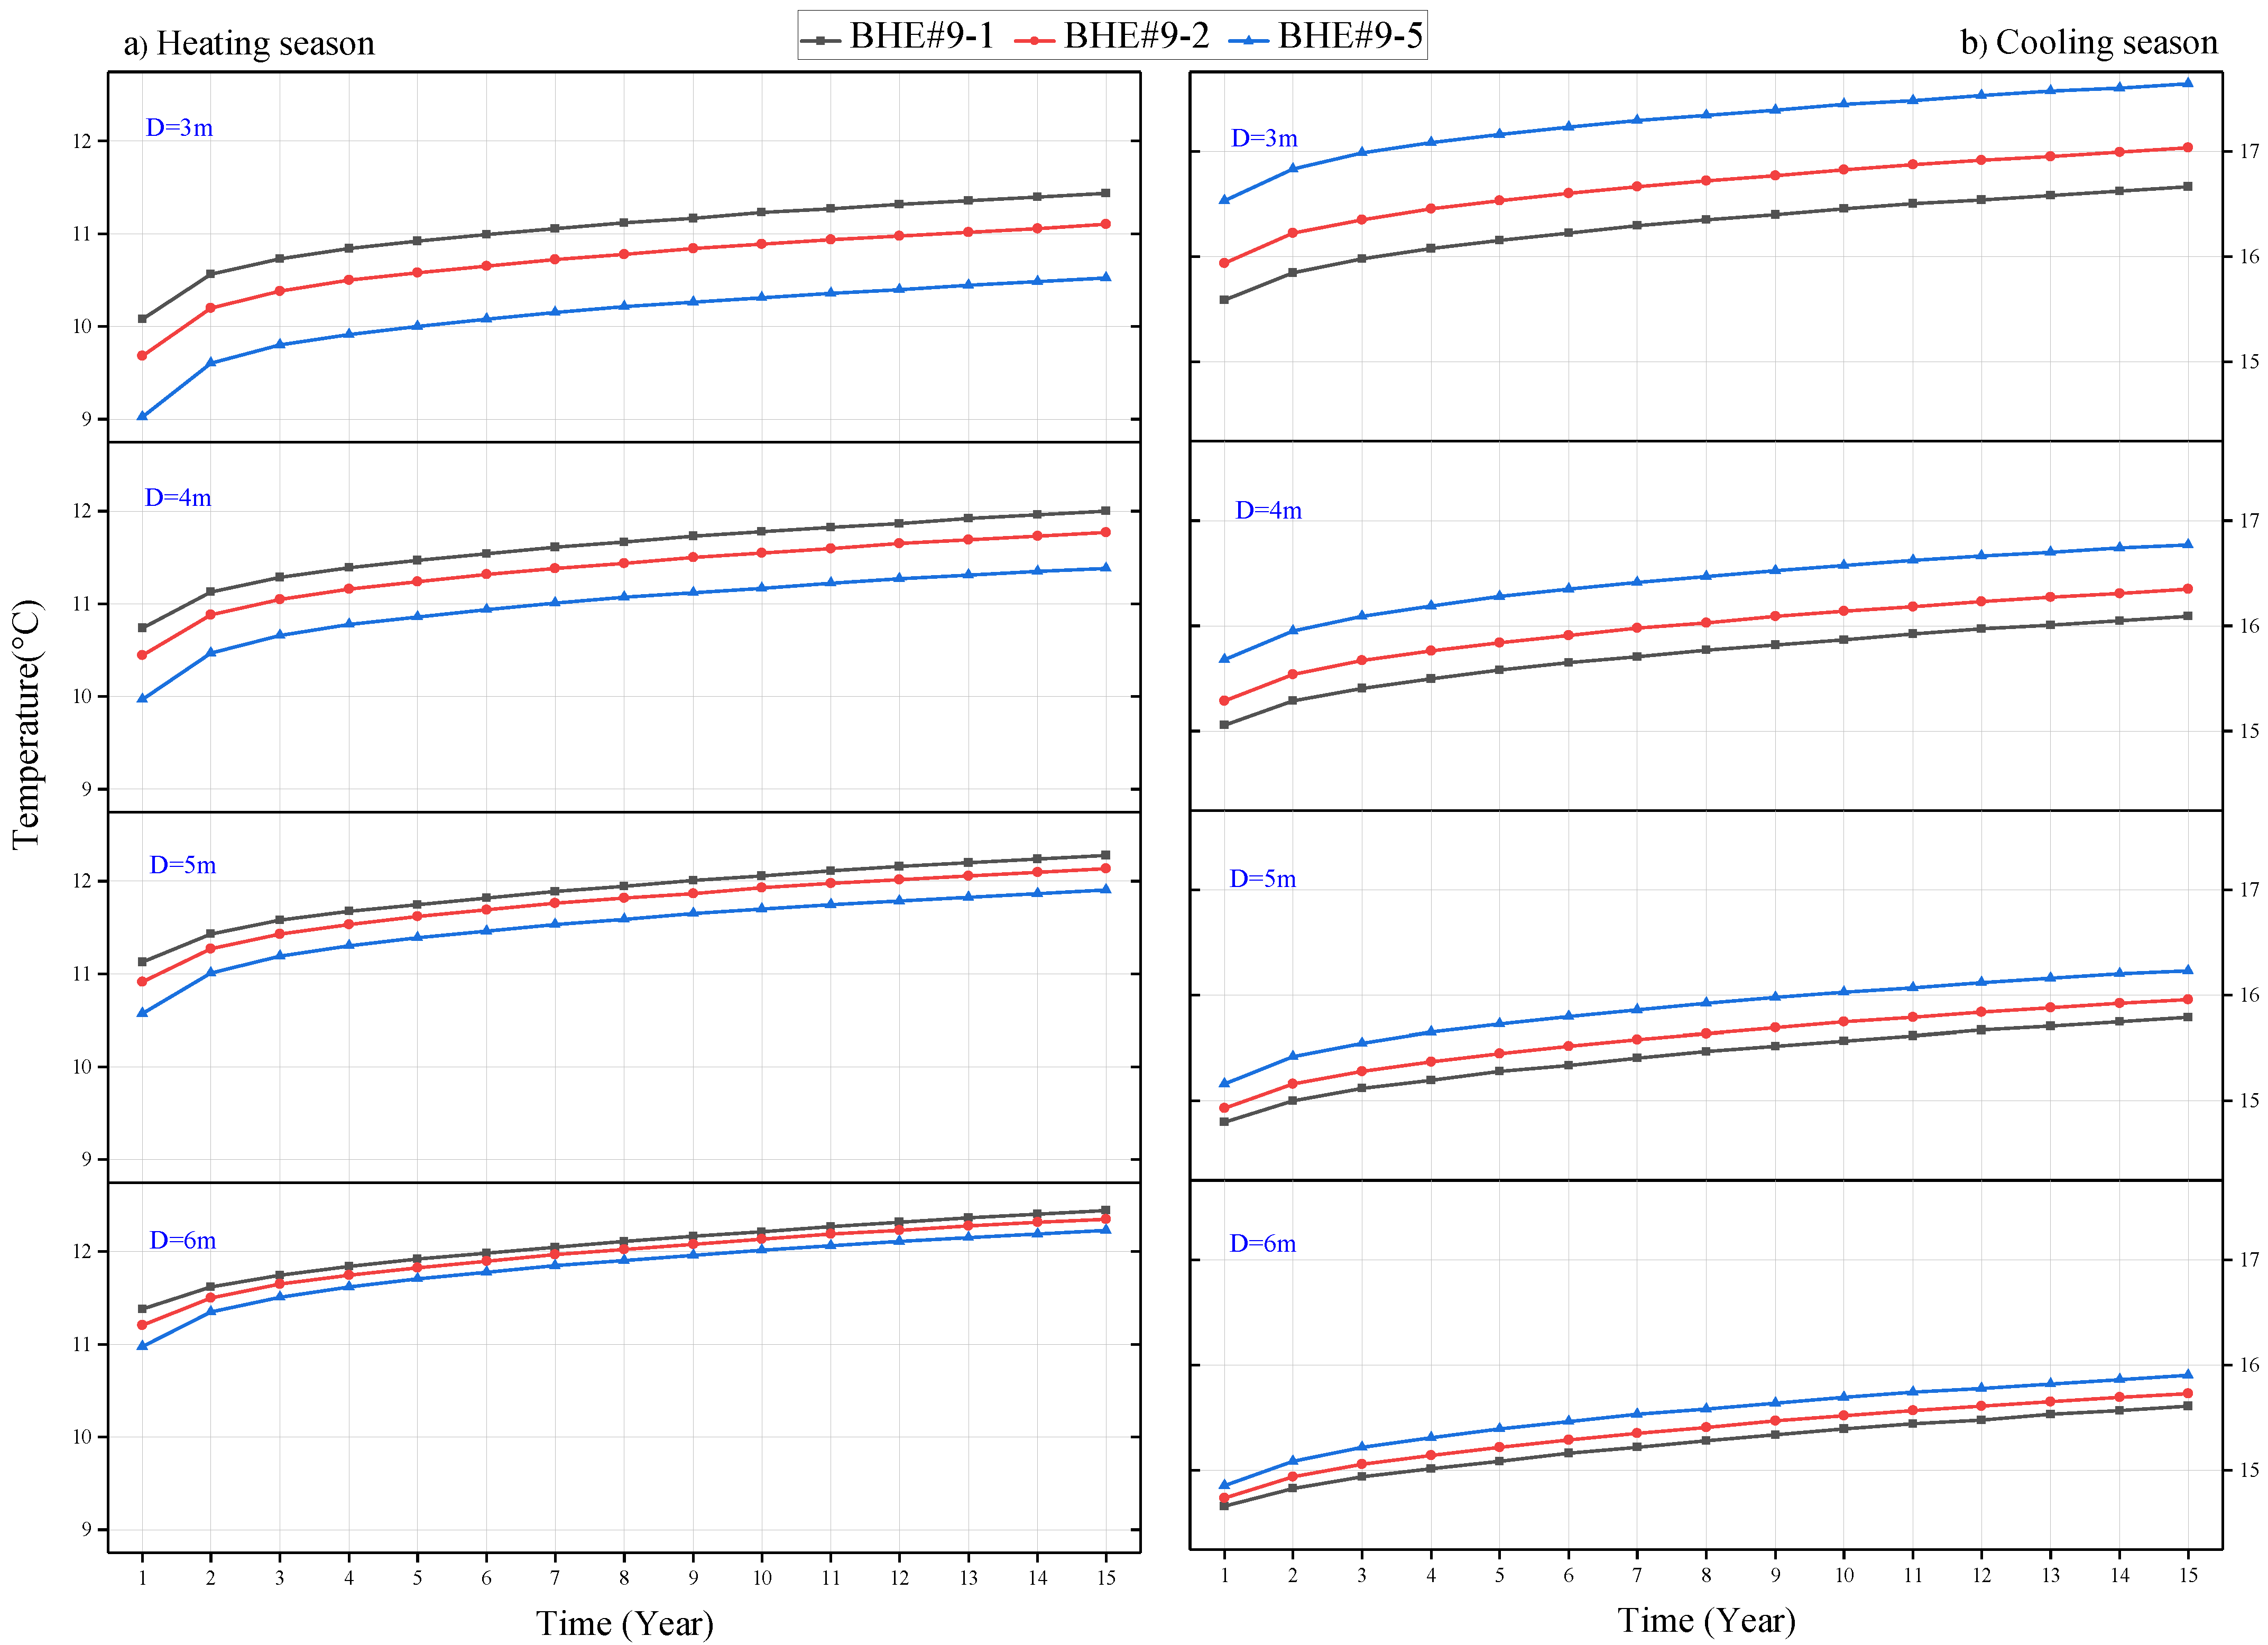
4.2.1. Evolution of Soil Temperature

Figure 6 shows the variation of soil temperature near the boreholes (the locations of simulation points are the same as in Section 4.1.2) at the end of each heating season and cooling season for the four BHE systems with different inter-borehole spacing during 15 years of operation. After 15 years of operation, the overall soil temperature rises. The heat accumulation effect is most obvious near the # 9-5, and the rising trend of soil temperature slows down with the increase of inter-borehole spacing. When D is 3 m, the soil temperature near # 9-5 reaches 17.64 °C at the end of cooling season, and drops to 15.71 °C after the recovery period, which is 2.36 °C higher than the initial soil temperature. When the distance is 6m, the soil temperature near # 9-5 is 1.58 °C higher than the initial soil temperature at the end of the 15th year. Increasing the distance of BHEs is beneficial to the recovery of soil temperature. Furthermore, it can be seen from Figure 6 that with the increase of the inter-borehole spacing, four soil temperature curves gradually close to each other, which is beneficial to weakening the non-uniformity of the heat exchange of the BHE array and enabling the system to have a long-term sustainability. From Figure 5, it is known that the soil temperature changes periodically. For the system with D at 3 m, the maximum fluctuation of soil temperature appears near the # 9-5 in the first year, which is 7.51 °C. When the system runs to the 15th year, the fluctuation of soil temperature is 7.12 °C. For every single BHE, the fluctuation of soil temperature around it becomes weaker.

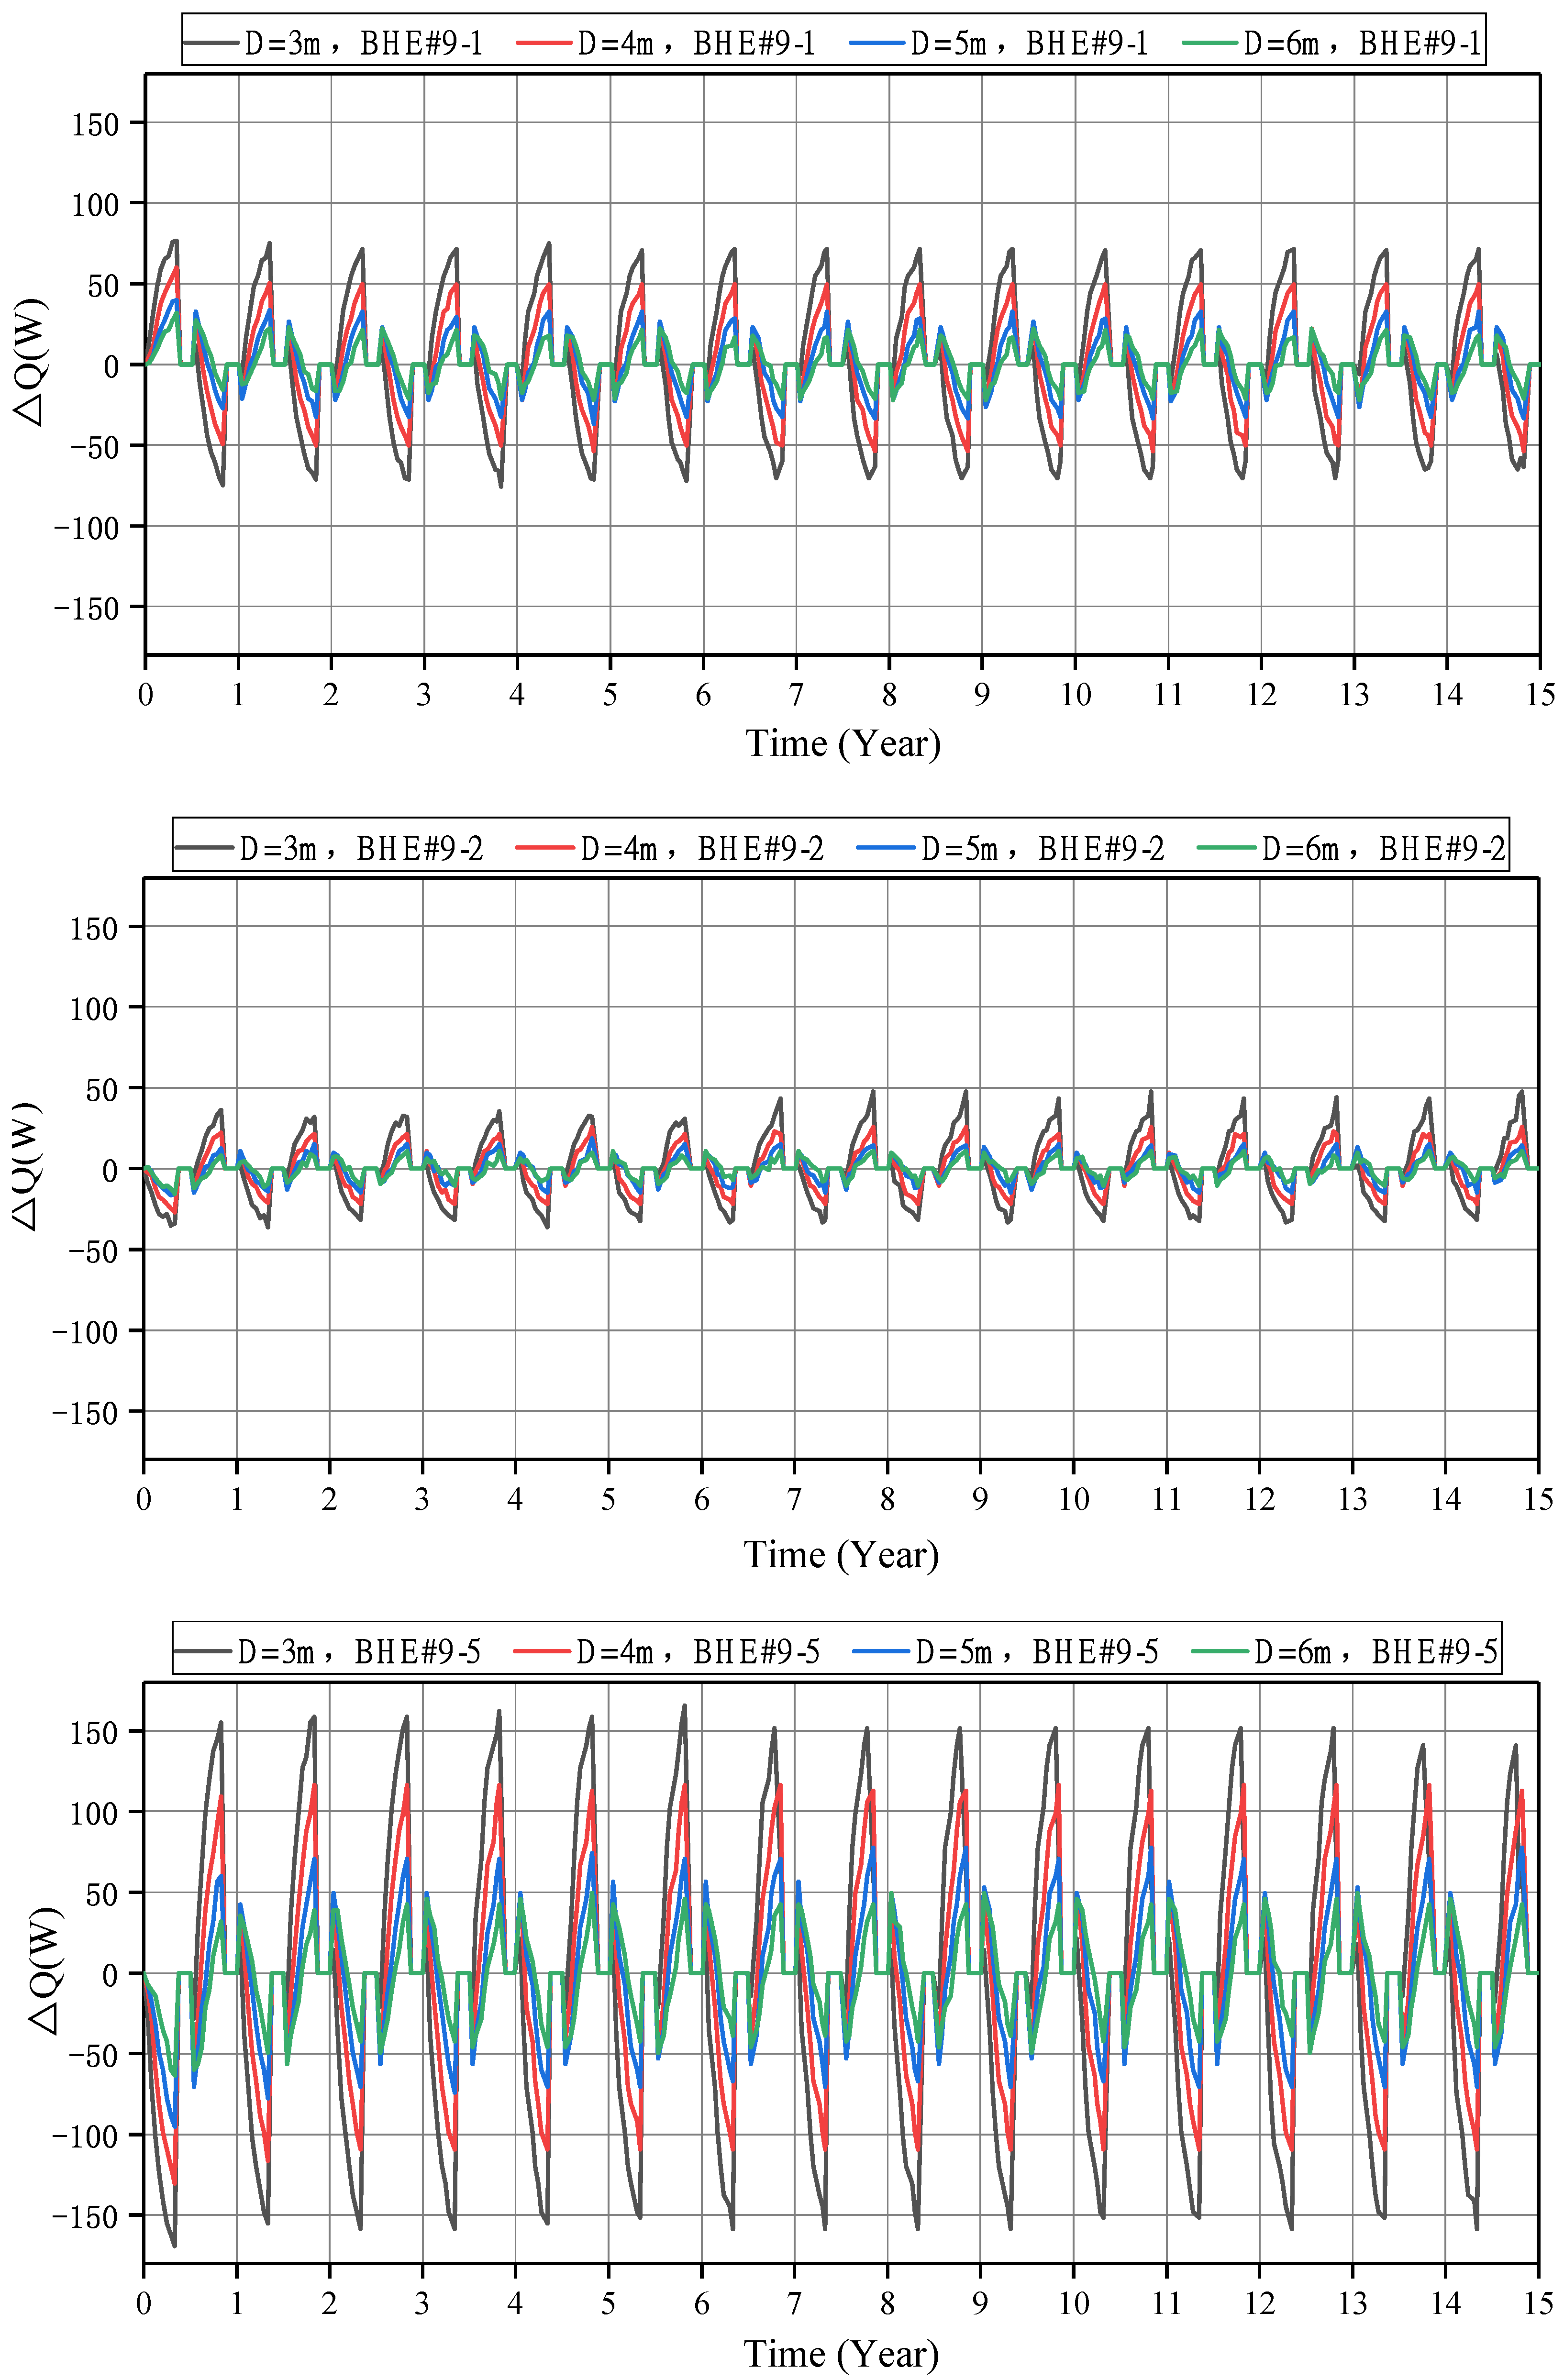
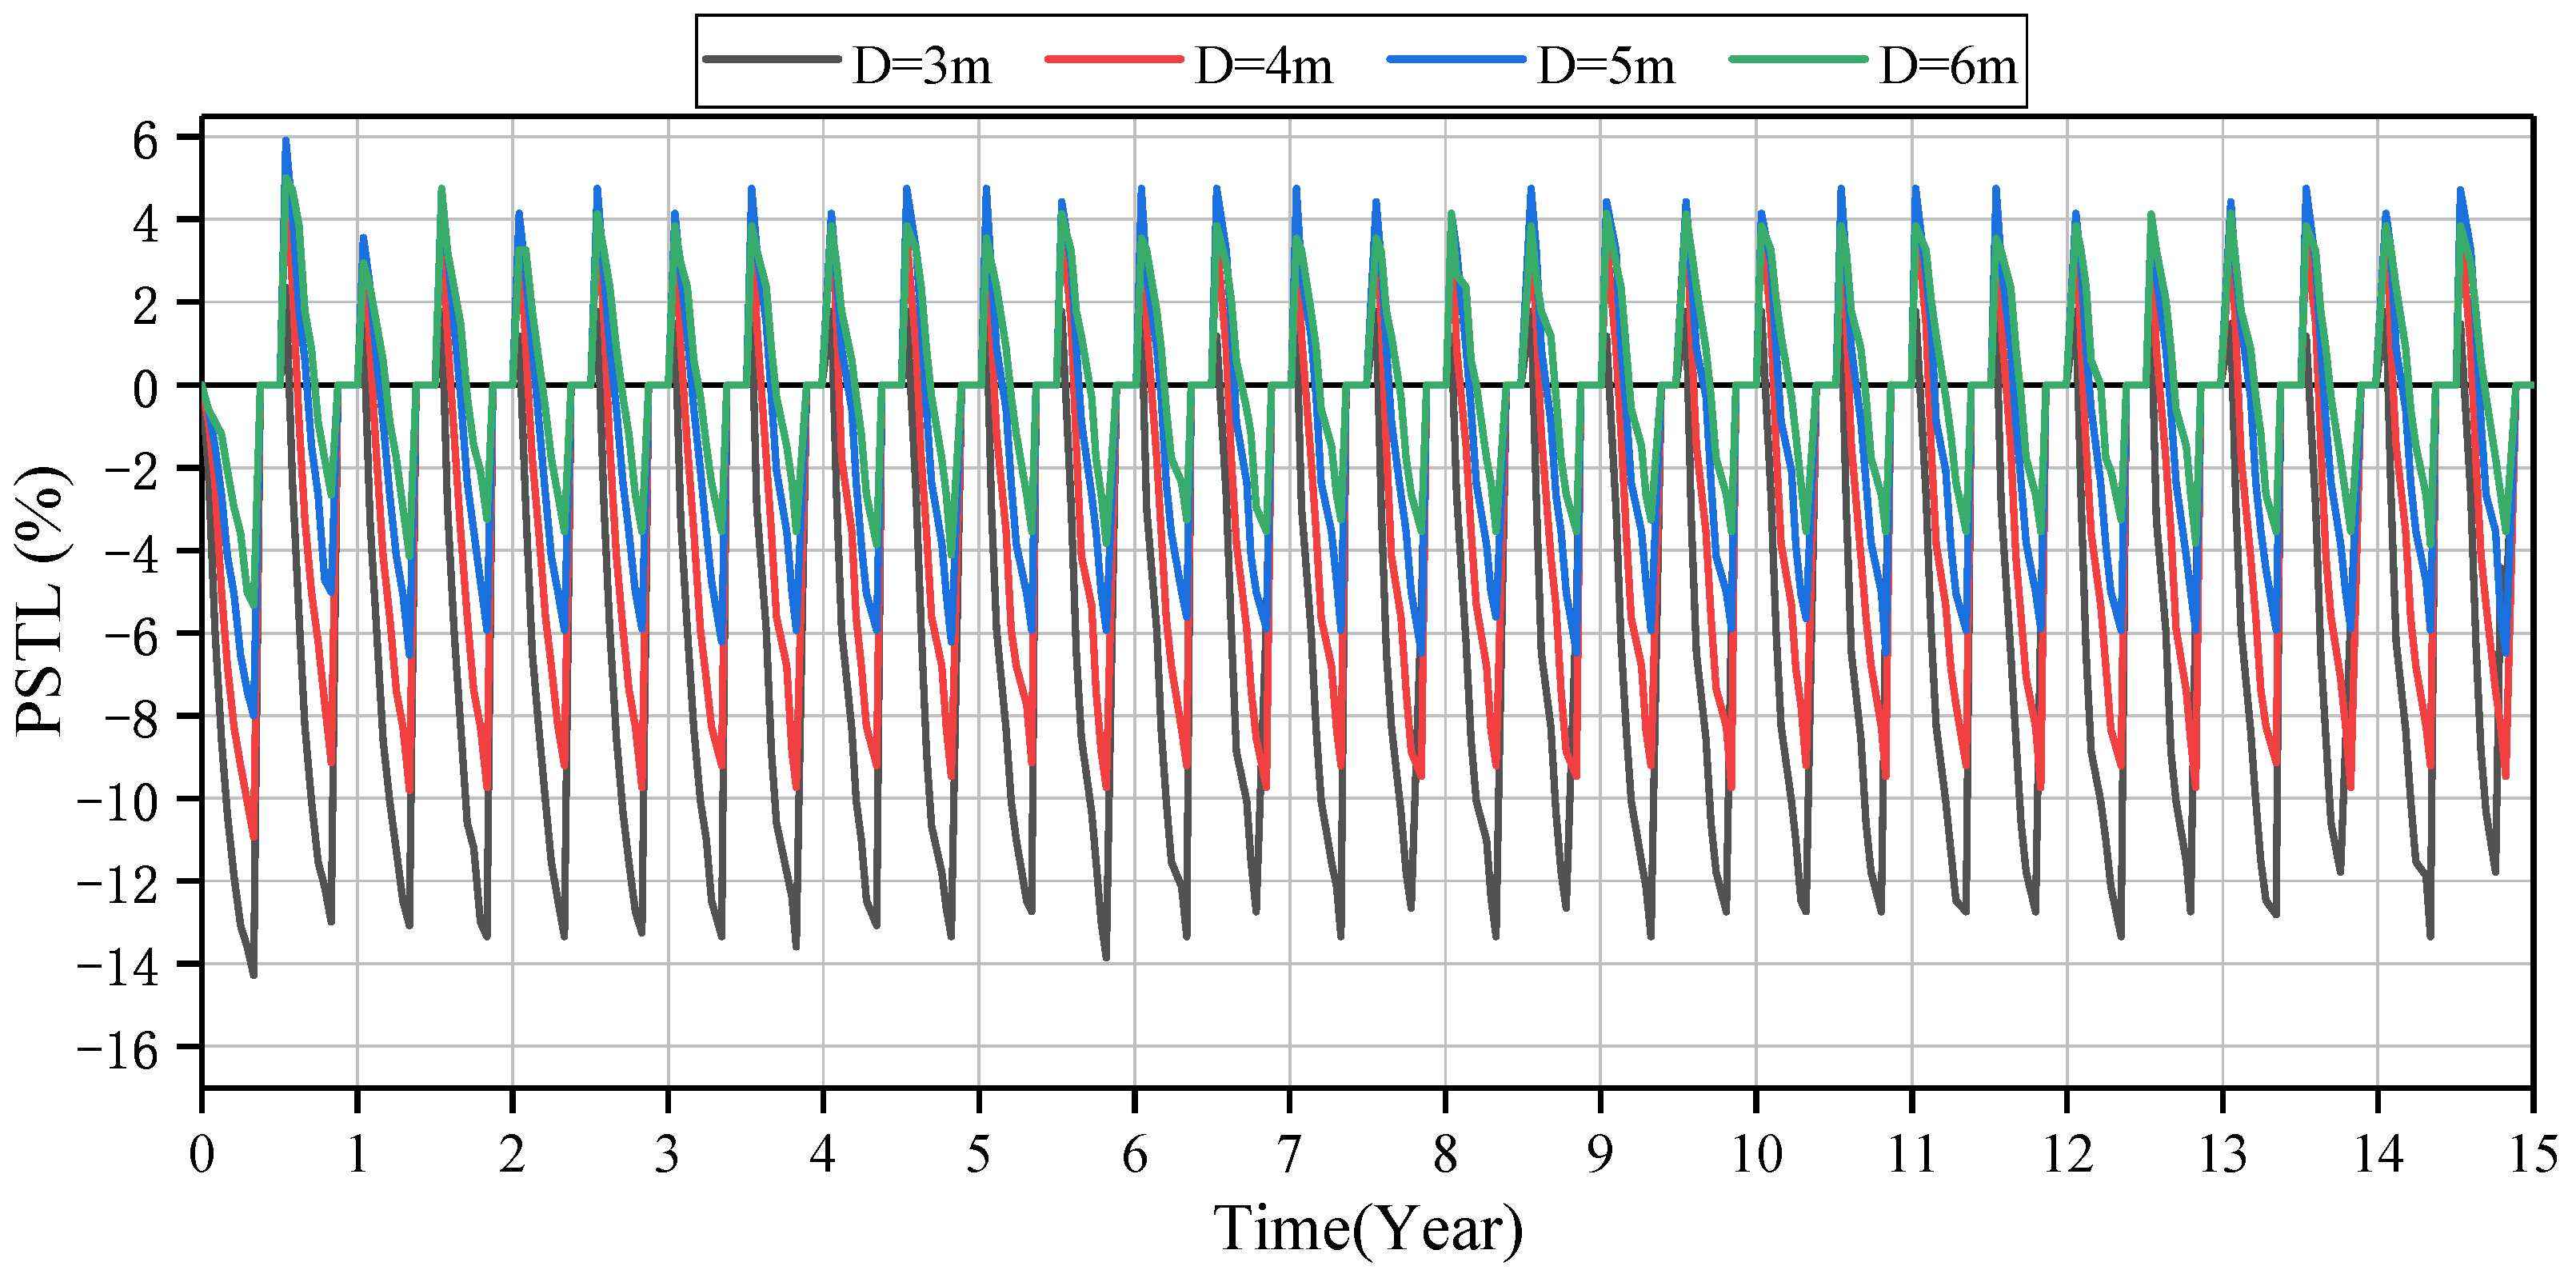
4.2.2. Load Shifting Behaviors

Figure 7 shows that the BHE located at the edge and center of the BHE array has the largest change in heat transfer. It can be seen that no matter which inter-borehole spacing is selected, the heat exchange quantity of the BHE at different positions has two kinds of changes, the heat exchange quantity of the BHE at the edge (# 9-1) is increased, and the heat exchange quantity of the BHE at the center (# 9-5) is reduced. With the operation of shallow GSHP system, the cold and heat load gradually shifts from the center to the edge of the BHE array, and there is an obvious load shifting phenomenon.
By comparing the load shifting behaviors of # 9-1, # 9-2, and # 9-5, it can be seen that the maximum shifted load of different inter-borehole spacing occurs at the central BHE for the 9-U BHE system in long-term operation. When D is 3 m, the maximum Q is −169.05 W for the # 9-5. When the inter-borehole spacing is increased to 6 m, the maximum Q is about −63.39 W, and the load shifting phenomenon is weakened with the increase of the inter-borehole spacing. Still observe the central BHE # 9-5, when D is 4 m the maximum Q is −130.31 W and when D is 5 m the maximum Q is −95.09 W, it can be seen that the change of the maximum shifted load of the central BHE is linear with the change of the inter-borehole spacing.
Over a period of 15 years, as shown in Figure 8, the trend of PSTL is similar to the Q curve in Figure 7. At D is 3 m, the PSTL varies from −14.29% to 6.4 7%, with a maximum at the end of the first heating season. When D is 6 m, the PSTL varies from −5.33% to 5.02%, it can be seen that with the increase of inter-borehole spacing, the PSTL decreases significantly. Continuing to observe the periodic variation of the PSTL, it is found that the largest fluctuation occurs in the first heating season for different inter-borehole spacing, which is the same as the variation trend of soil temperature. After 15 years of operation, the fluctuation of PSTL tends to be stable from the fourth year when D is 3 m, and the fluctuation of PSTL tends to be stable from the third year when D is 4~6 m, which means that the time for the system to reach thermal equilibrium with the underground will be prolonged if the inter-borehole spacing is reduced.

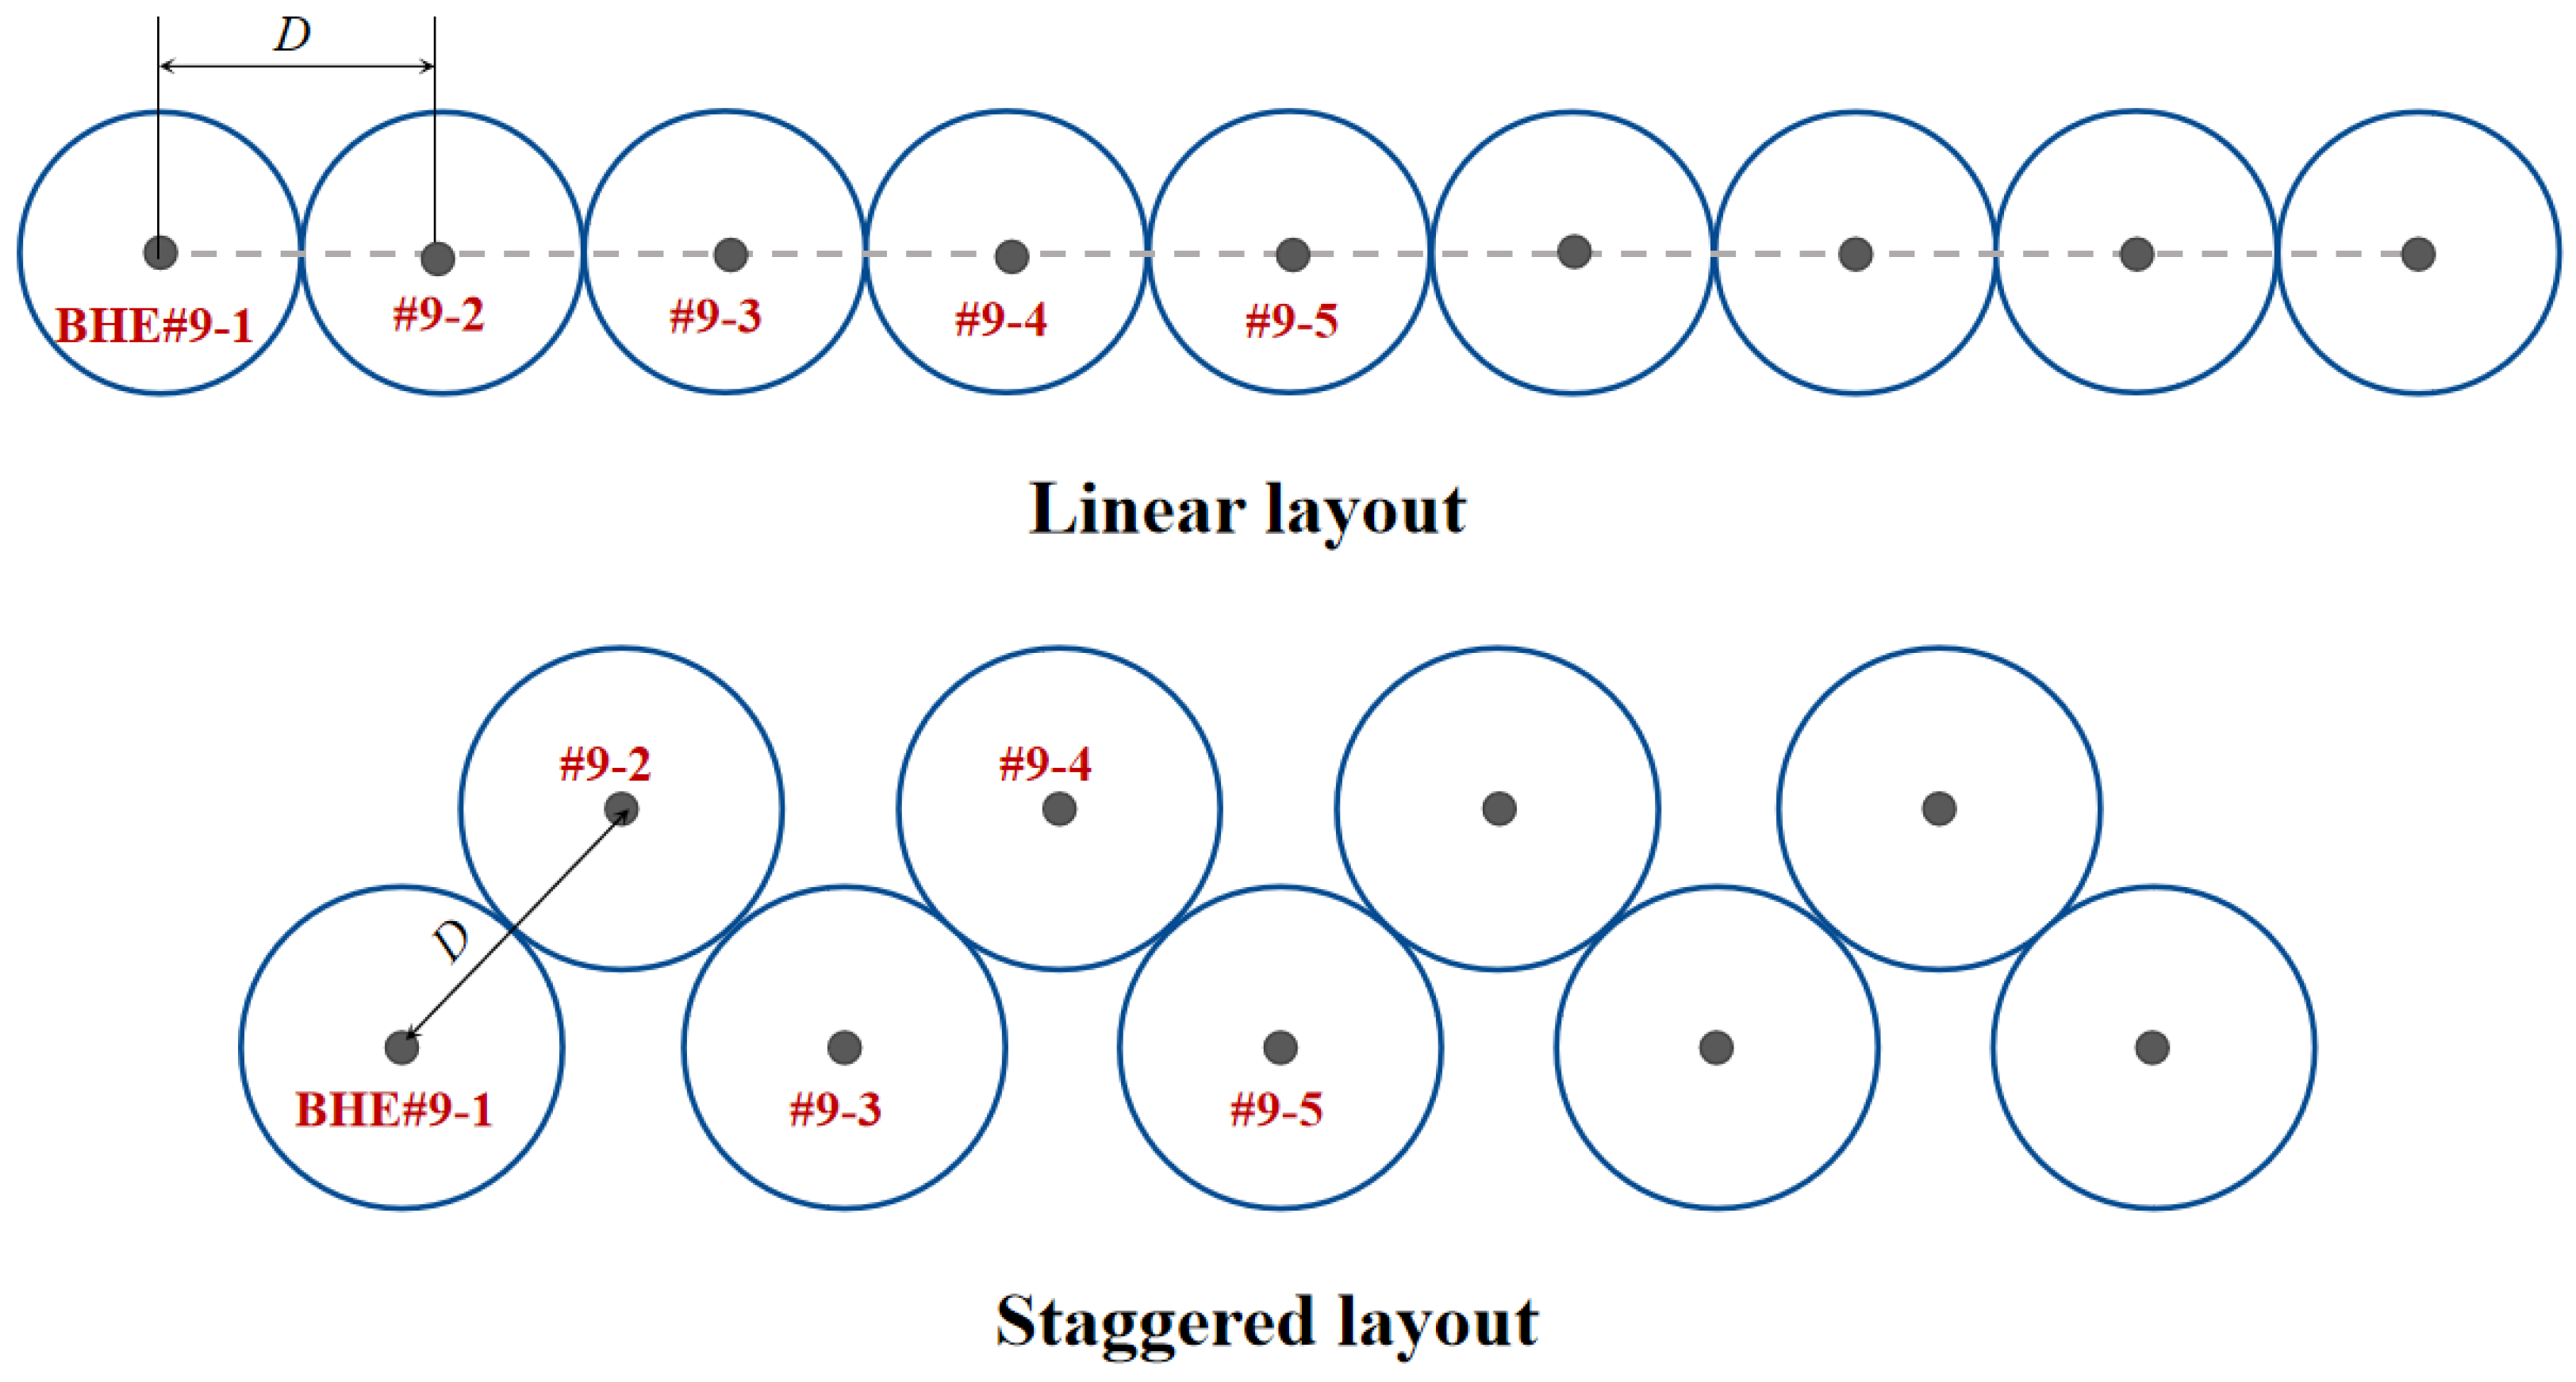
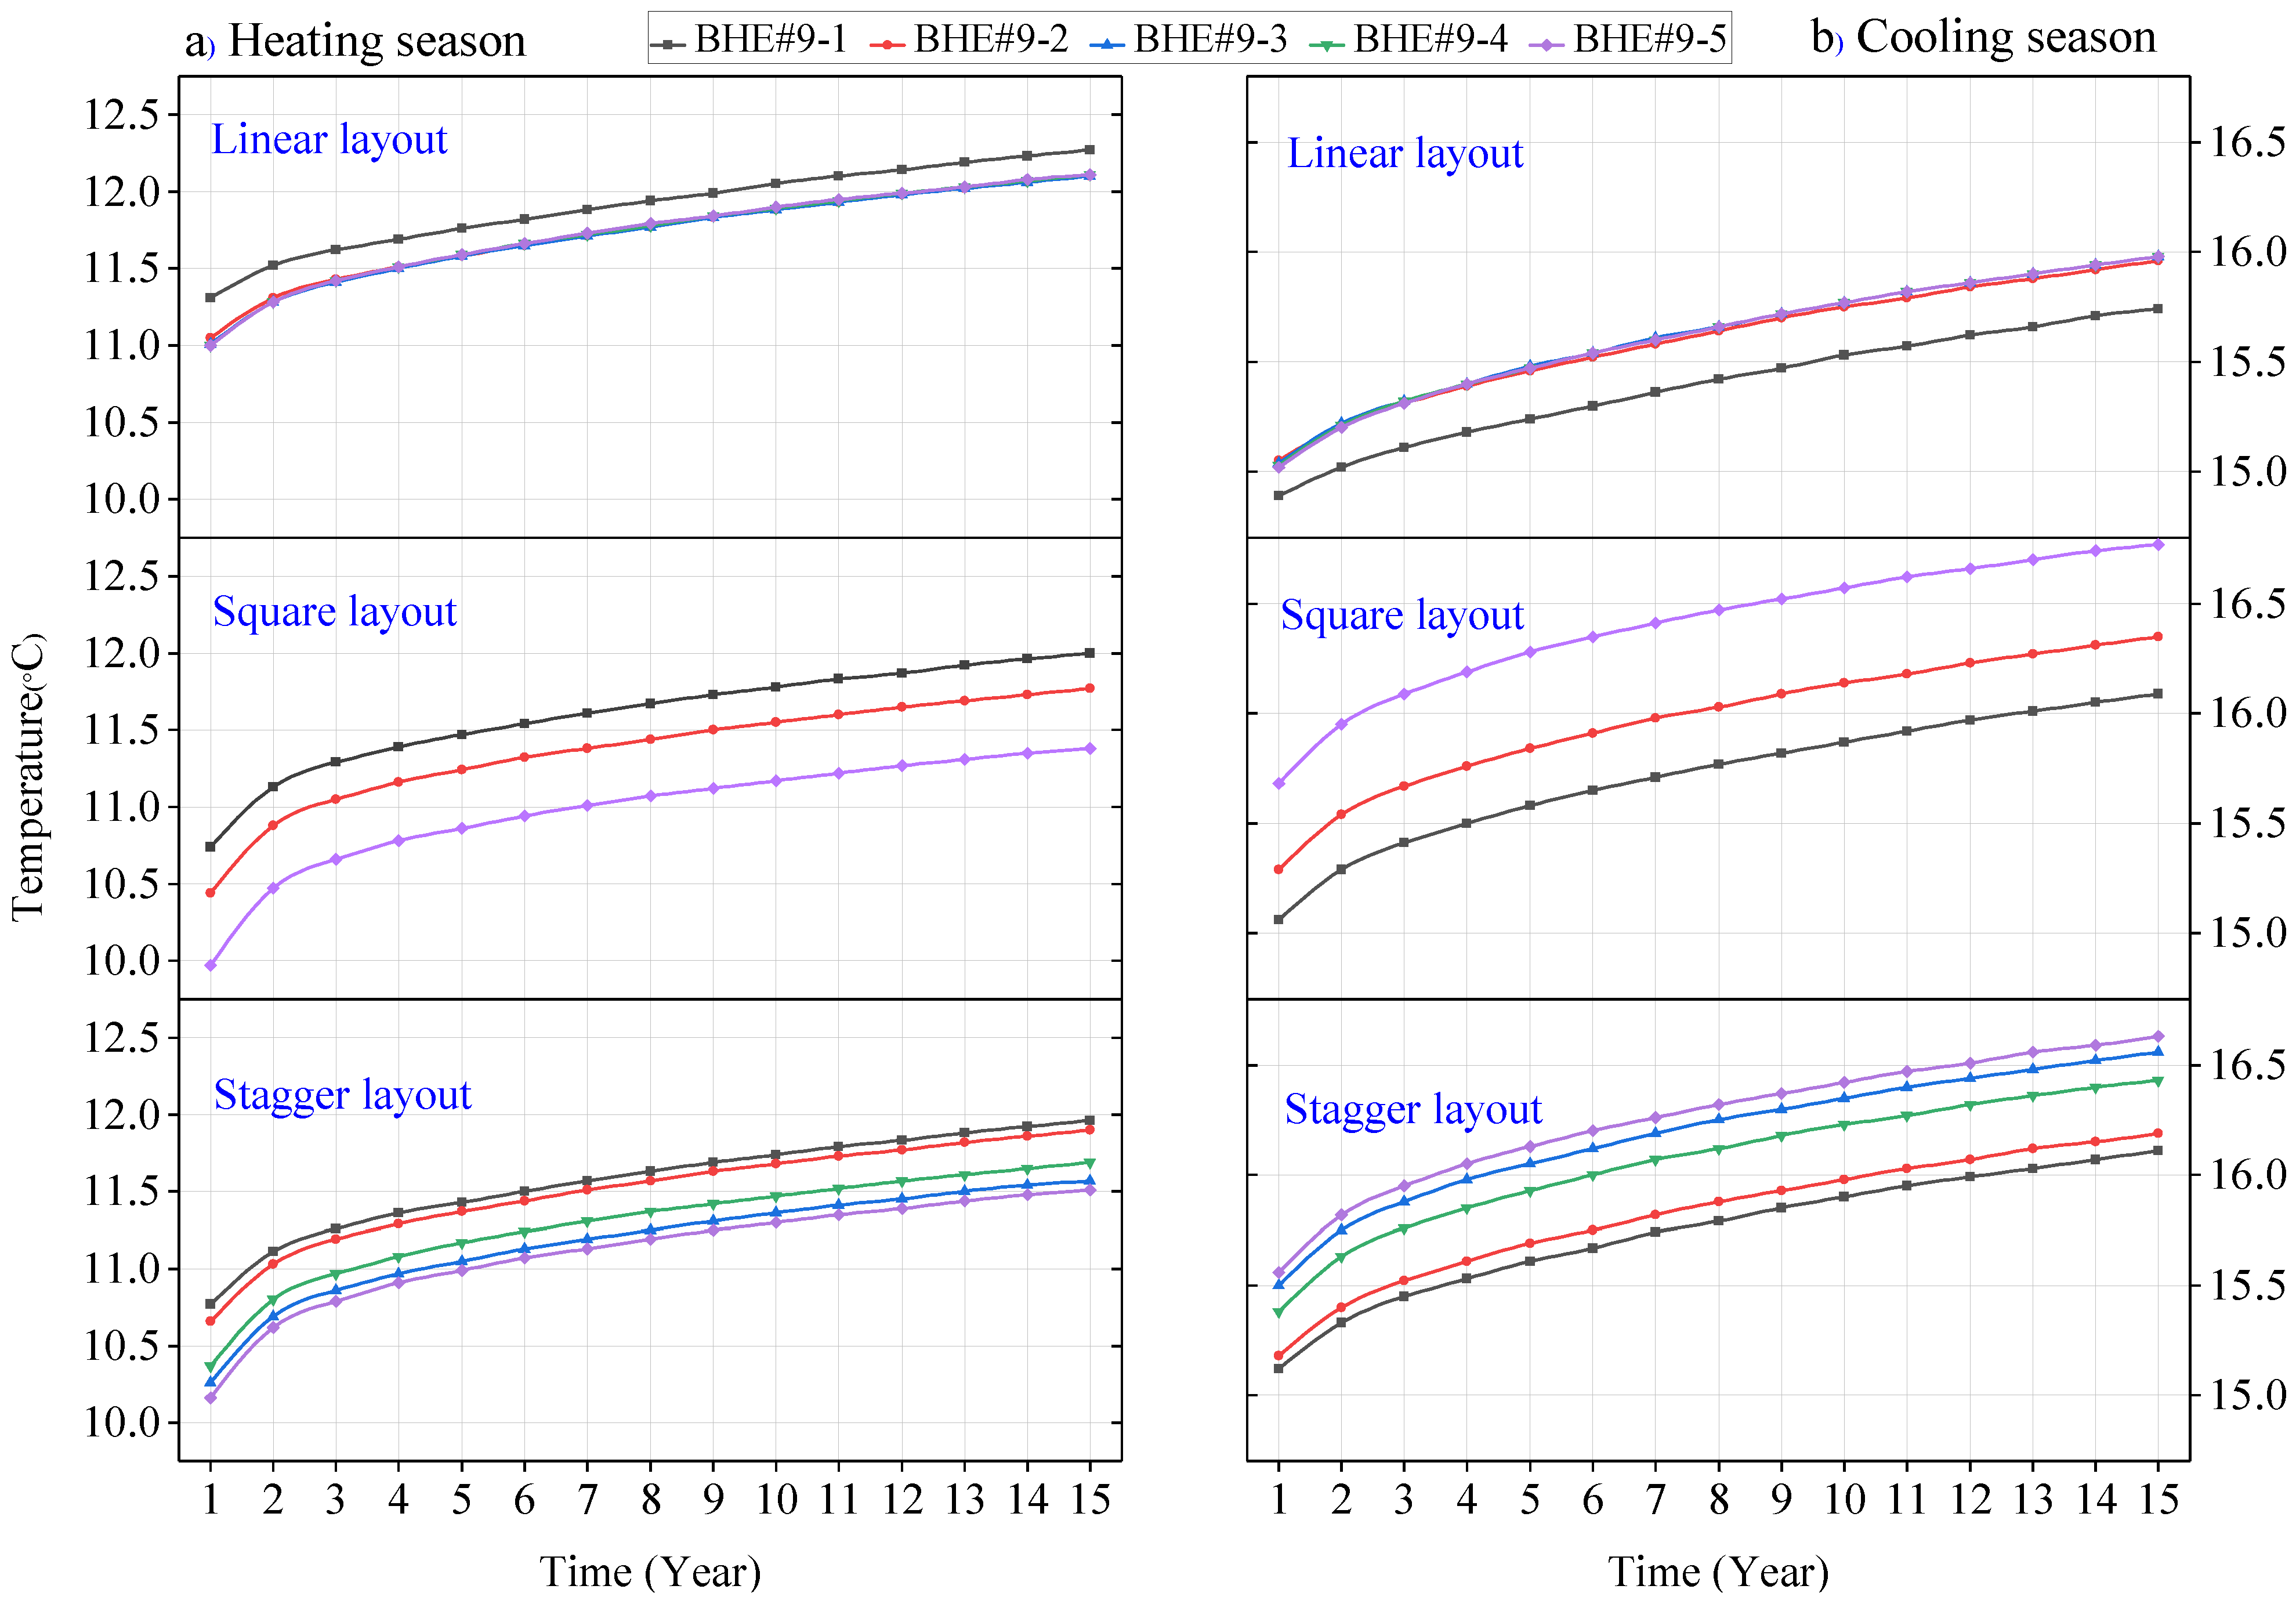
4.3. Effect of Layout Method

When studying the load shifting behaviors of shallow GSHP system with different arrangement methods, Figure 2 and Figure 9 show three common layout methods of 9-U BHE system, which are linear layout, square layout, and staggered layout, and the inter-borehole spacing between adjacent BHE is set to 4 meters, other relevant parameters unchanged.

4.3.1. Evolution of Soil Temperature

Figure 10 shows the variation of soil temperature near the boreholes (the locations of simulation points are the same as in Section 4.1.2) at the end of heating and cooling season of each year for three layouts during 15 years. After 15 years of operation, the soil temperature of the three BHE systems increased, and the heat accumulation effect was most obvious near the central borehole. The soil temperature difference between the edge BHE and the center BHE is the smallest with the linear layout, while that with the square layout is the largest (for example, at the end of the heating season in the first year, the difference is 0.30 °C for linear layout and 0.77 °C for square layout). A more concentrated layout brings a more severe imbalance of soil temperature distribution. At the end of the 15th cooling season, the soil temperature near the center BHE of square layout has risen to 16.77 °C, and that of the linear layout is 15.98 °C, which is the lowest in the three layout methods. After the recovery period, the soil temperature near the center BHE of square layout decreased to 15.42 °C, which was 2.07 °C higher than the initial soil temperature. This value was the highest of the three layout methods. For linear layout, except for # 9-1, the change of soil temperature around the other typical BHEs is almost the same, and the unbalanced rate of soil temperature distribution was lower than that of the other two layout methods. Among the three layout methods, the linear layout is more sustainable for the shallow GSHP in the long-term operation.

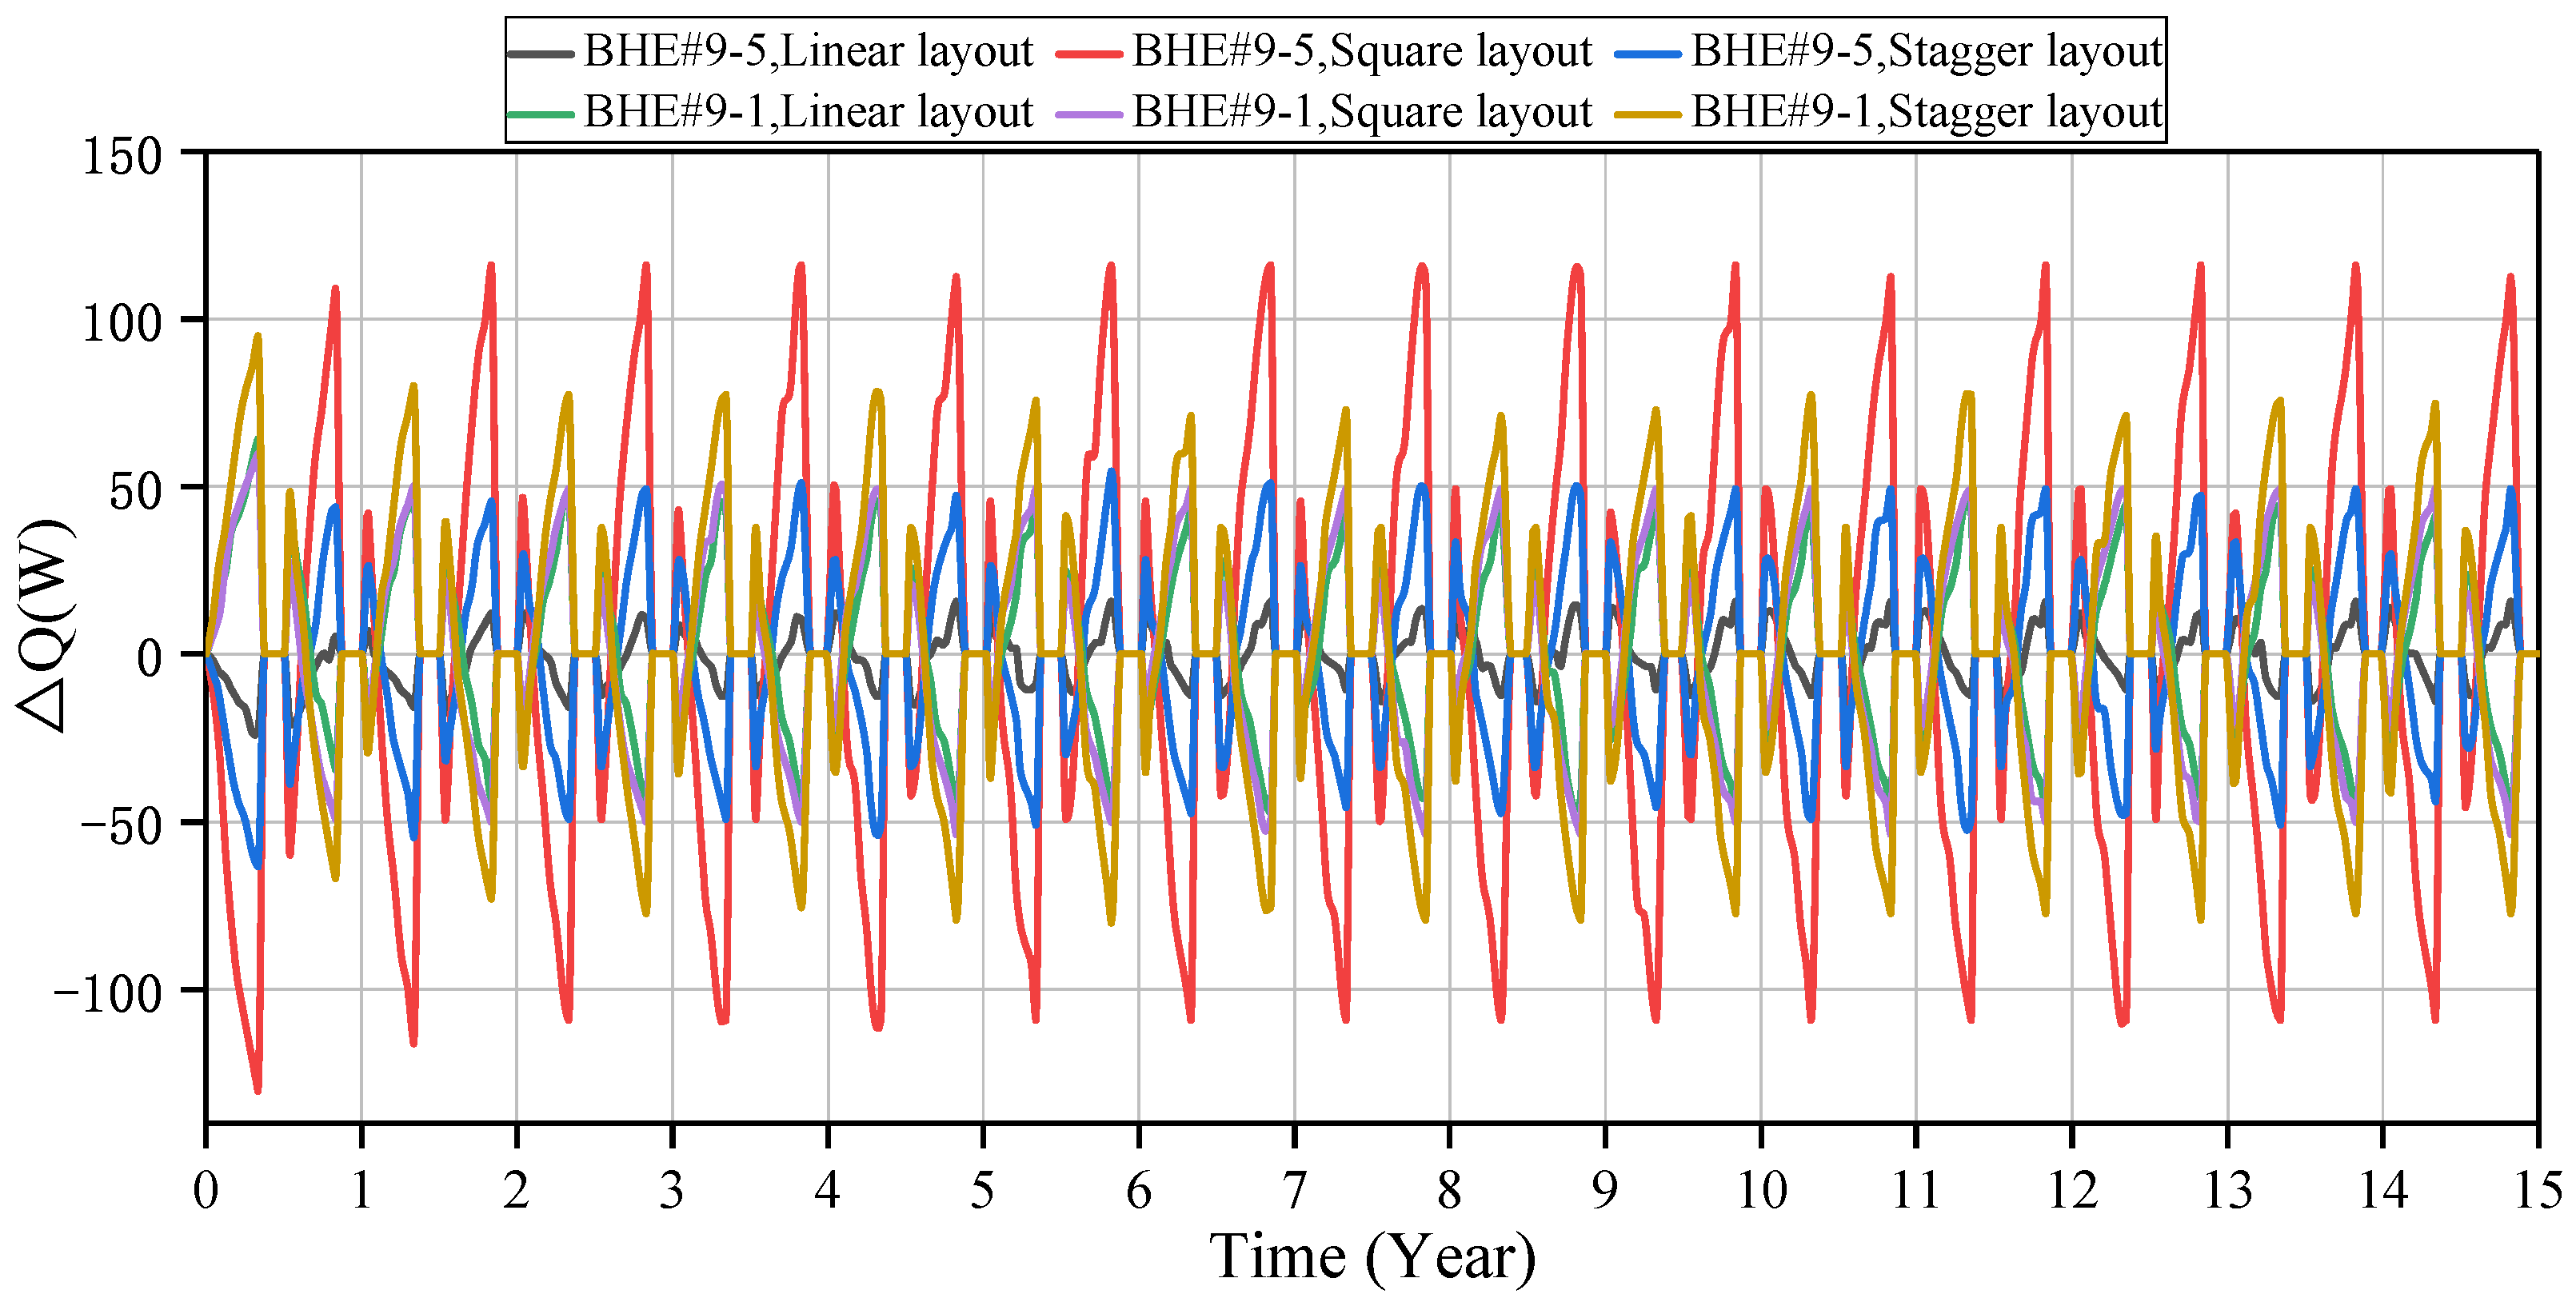
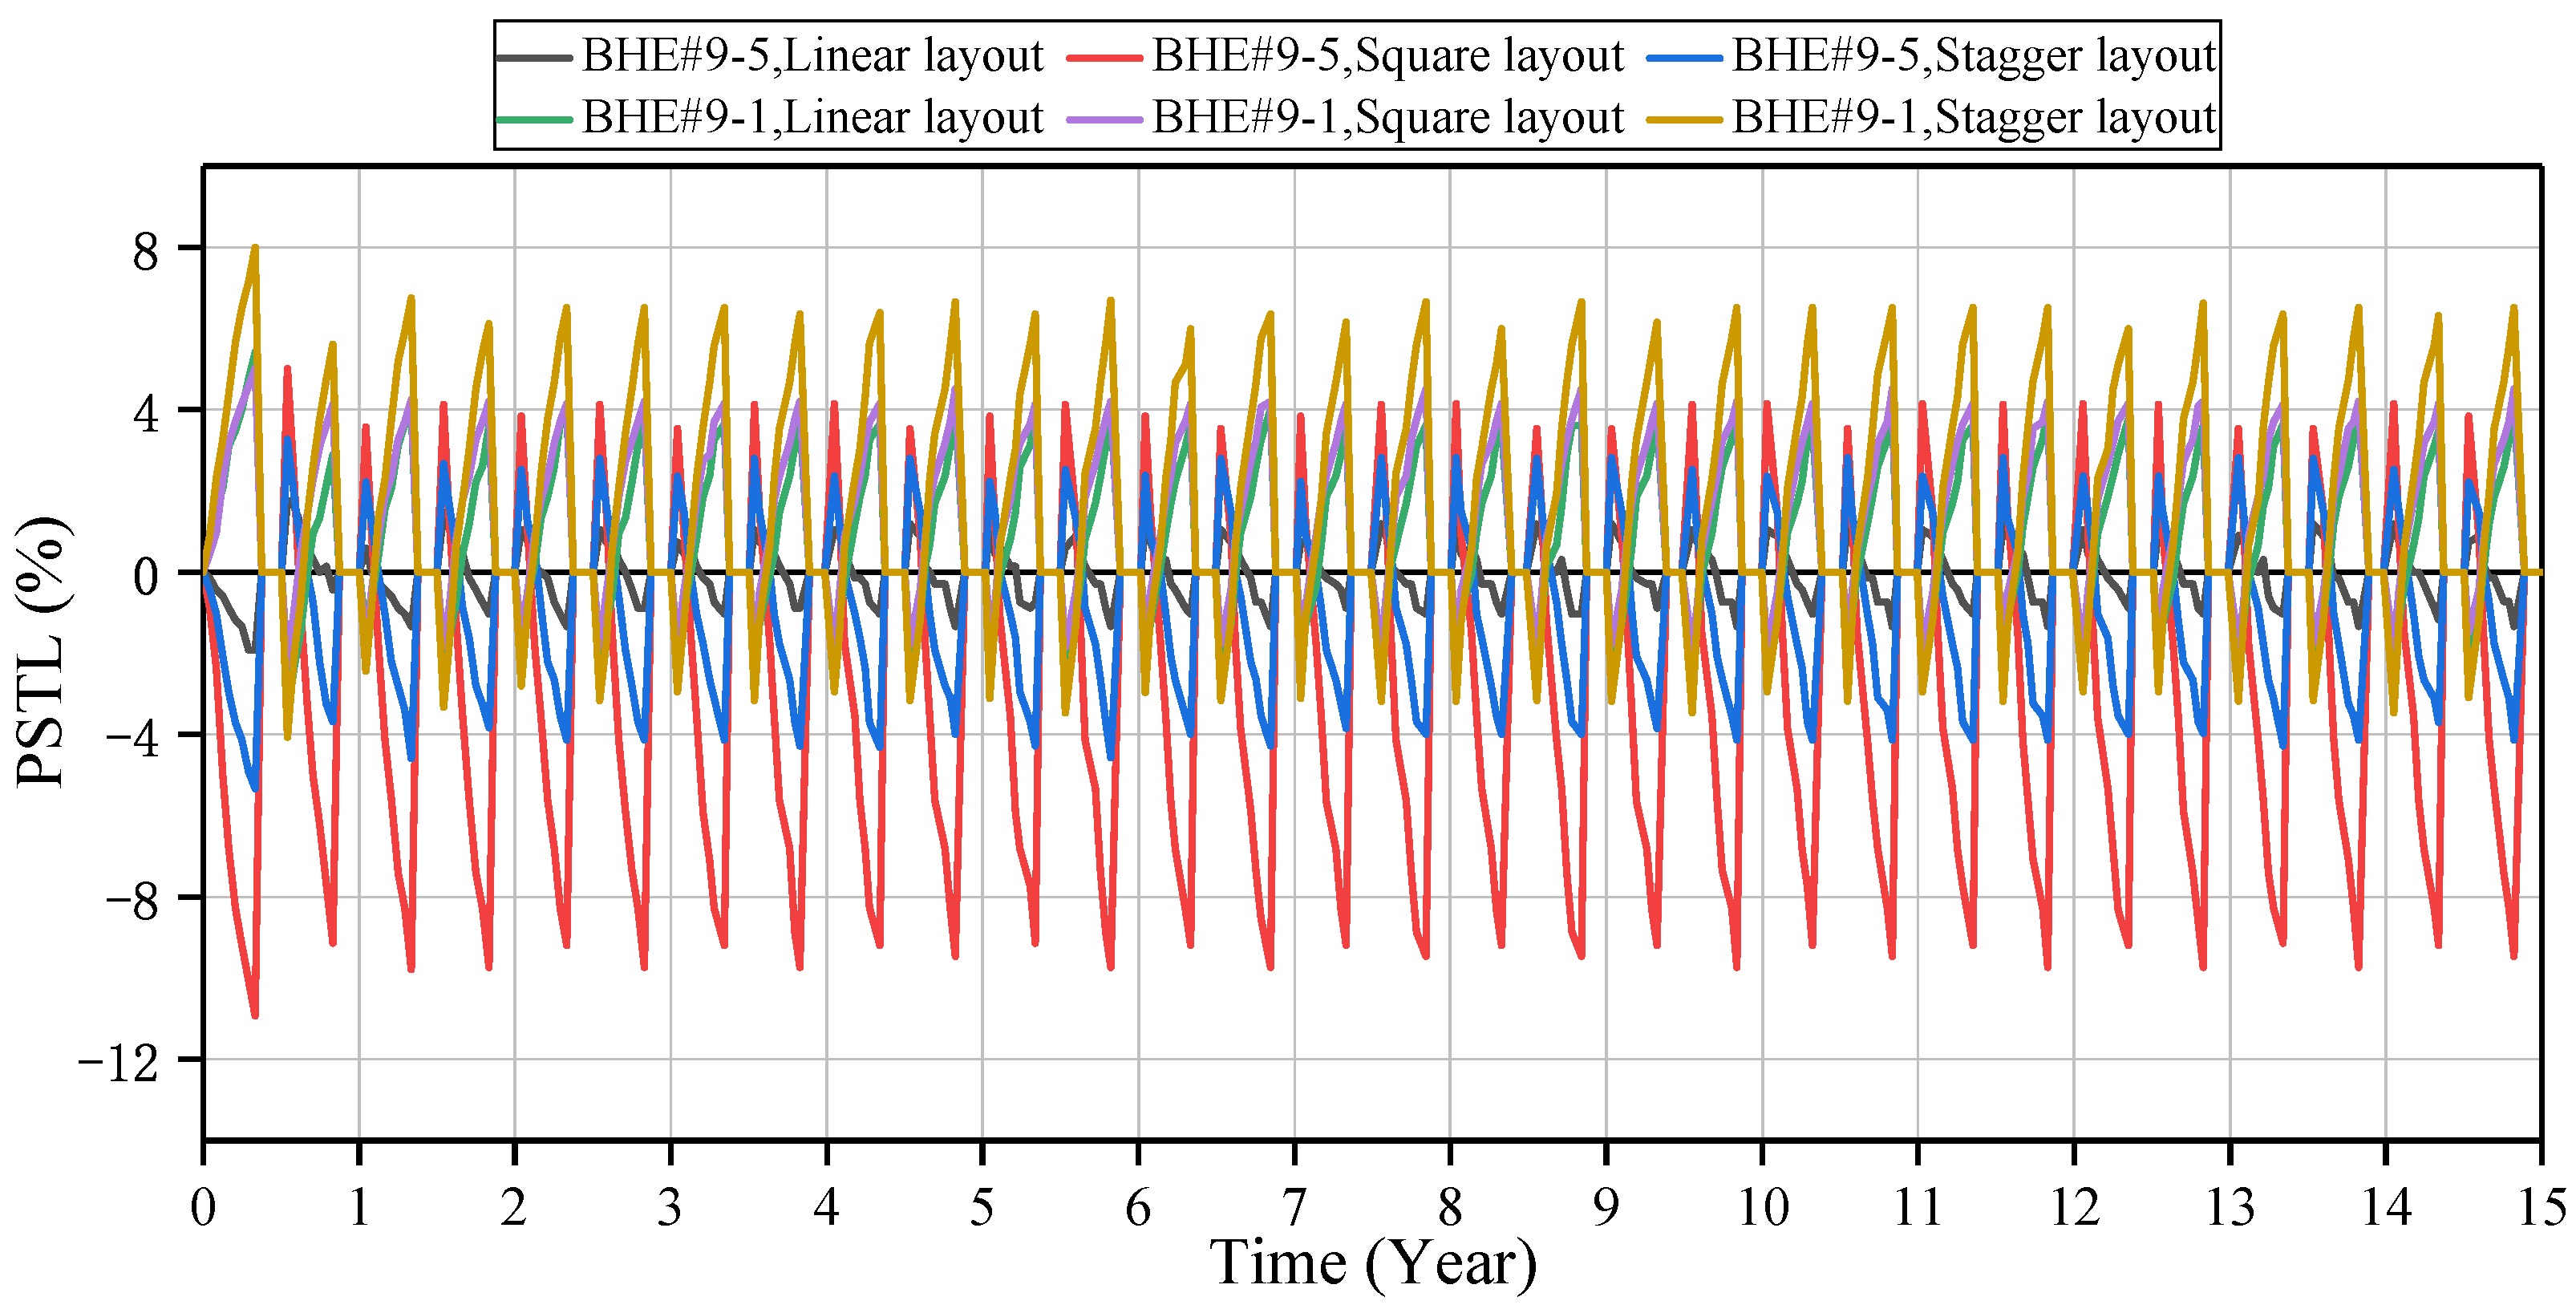
4.3.2. Load Shifting Behaviors

Figure 11 shows the load shifting behaviors of typical BHEs of 9-U BHE system with different layout methods during long-term operation. For the BHE laid in a straight line, the maximum shifted load (64.27 W) is observed at # 9-1, which is a positive transfer, while the maximum shifted load at # 9-5 is −22.89 W at the same time. It was obvious that the heat load imposed on the center of the BHE array gradually moved to the periphery. For the staggered layout, the maximum shifted load is found at # 9-1, which is 95.10 W, while for the square layout, the maximum shifted load is observed at # 9-5 (−130.31 W). The BHE locations for maximum shifted load are different for the three layout methods, which means the maximum load shifting behavior occurs at the edge or at the center BHE. It can be seen that the load shifting behavior of linear layout is the mildest, followed by the staggered layout, and the load shifting behavior of square layout with most intensive layout has the severest impact on the long-term stability of BHE array system.
The load shifting behaviors of different BHE systems can also be described by PSTL (see Figure 12). The PSTL of three shallow GSHP systems with different layout methods is different, yet the overall trend is similar to Q in Figure 11. For linear layout, after 15 years of operation, the PSTL varies from −3.55% to 5.41%. It is −5.33% to 8.00% with stagger layout, and for square layout, it is −10.93% to 5.02%. It is obvious that the dense layout brings more obvious load shifting behaviors. On the other hand, the maximum PSTL appears at the end of the first heating season for the three layout methods, and then the PSTL of the three layout methods enters the heat balance state in the third year of the BHE array system operation.

4.4. Effect of BHE Numbers

Larger construction projects are often faced with a greater number of BHEs, and the different BHE numbers may bring about changes in the load imposed on BHE at different locations in the system. Because the load shifting behaviors caused by square layout are more intense, this work changes the number of BHEs with square layout to 5-U, 9-U, and 25-U respectively. The inter-borehole spacing between adjacent BHE is set to 4 meters, and other relevant parameters are unchanged. The arrangement and typical BHEs location of the three BHE array systems are shown in Figure 13.

4.4.1. Evolution of Soil Temperature

Simulation locations of soil temperature are the same as in Section 4.1.2. After 15 years of operation, the soil temperature near # 25-13 showed the largest fluctuation at 6.07 °C in the first year, and that value is 5.71 °C for the 9-U BHE and 4.86 °C for the 5-U BHE. As shown in Figure 14, the accumulation of heat is most pronounced near the central BHE. Every year at the end of the heating season, the soil temperature near # 9-1 and # 9-5 is lower than BHE of 5-U system. For the 25-U BHE system, the soil temperature near # 25-1 is affected by more BHEs, and the temperature increase exceeds that near # 9-1 in the same period in the 6th year, and then the overall upward trend slows down. At the end of the fourth cooling season, the soil temperature near # 25-1 and # 25-13 exceeded near # 5-1 and # 9-5. The imbalance of soil temperature is aggravated in the 25-U BHE system. The soil temperature near the # 25-13 reached 16.91 °C at the end of the 15th cooling season (it is noteworthy that this value is lower than the soil temperature of the 9-U BHE system laid in square shape with an inter-borehole spacing of 3 m at the same period), and then fell back to 15.97 °C after the recovery period, which is 2.62 °C higher than the initial soil temperature. A larger number of BHEs is more detrimental to the long-term performance of the shallow GSHP system.

4.4.2. Load Shifting Behaviors

In the 5-U BHE array, the maximum Q was observed at the # 5-3, which was −88.75 W, and this value also appeared at the central BHE # 9-5 in the 9-U BHE array, which was −130.31 W. In contrast, this value appeared at the # 25-1 in the 25-U BHE array, which was 155.63 W. Figure 15 shows that load shifting has a greater impact on system performance when the number of BHEs is increased. On the other hand, in the 5-U and 9-U BHE array, Q of all the BHEs decreased after a recovery period of two months every year, indicating that the recovery of soil temperature provided a certain amount of heat replenishment to the system and weakened the phenomenon of load shifting. However, this rule is not applicable in the # 25-13 of the 25-U BHE array system. In the second, third, and fifth year of the system operation, Q increases after the recovery period. The effect of soil temperature recovery on load shifting decreases with the increase of the number of BHEs. Closing some BHEs within a certain period of time may help to improve the long-term operational efficiency of the whole shallow GSHP system. Further analysis of the change of PSTL in 15 years shows that the BHE # 5-3 has the largest PSTL (−7.46%) in the third month of the first heating season of operation, and the fluctuation of PSTL is between −7.46% and 1.6% during the whole operation period.
It is known that the maximum PSTL of 9-U BHE array is −10.93% at the end of the first heating season of # 9-5, while the maximum PSTL of 25-U BHE array is 13.15% at the end of the first heating season of # 25-1. The increase of BHEs number will bring a more intense load shifting phenomenon. On the other hand, in the sixth year of operation of the 25-U BHE array, the PSTL variation of # 25-1 is about −7.11%, which tends to be stable as a whole, while for the 5-U BHE array, the system has been basically stable in the second year. It can be seen that the time for the system to reach thermal equilibrium has a greater relationship with the number of BHEs, and the increase of the number of BHEs will be detrimental to the long-term stability of the system.

5. Conclusions

In this work, a transient numerical calculation model based on OGS-TESPy is established for the shallow GSHP system, and the load shifting behaviors of BHE array with different design parameters are studied. The design heating or cooling load imposed on each BHE is 12.5 kW. The main points of this work are listed as follows:
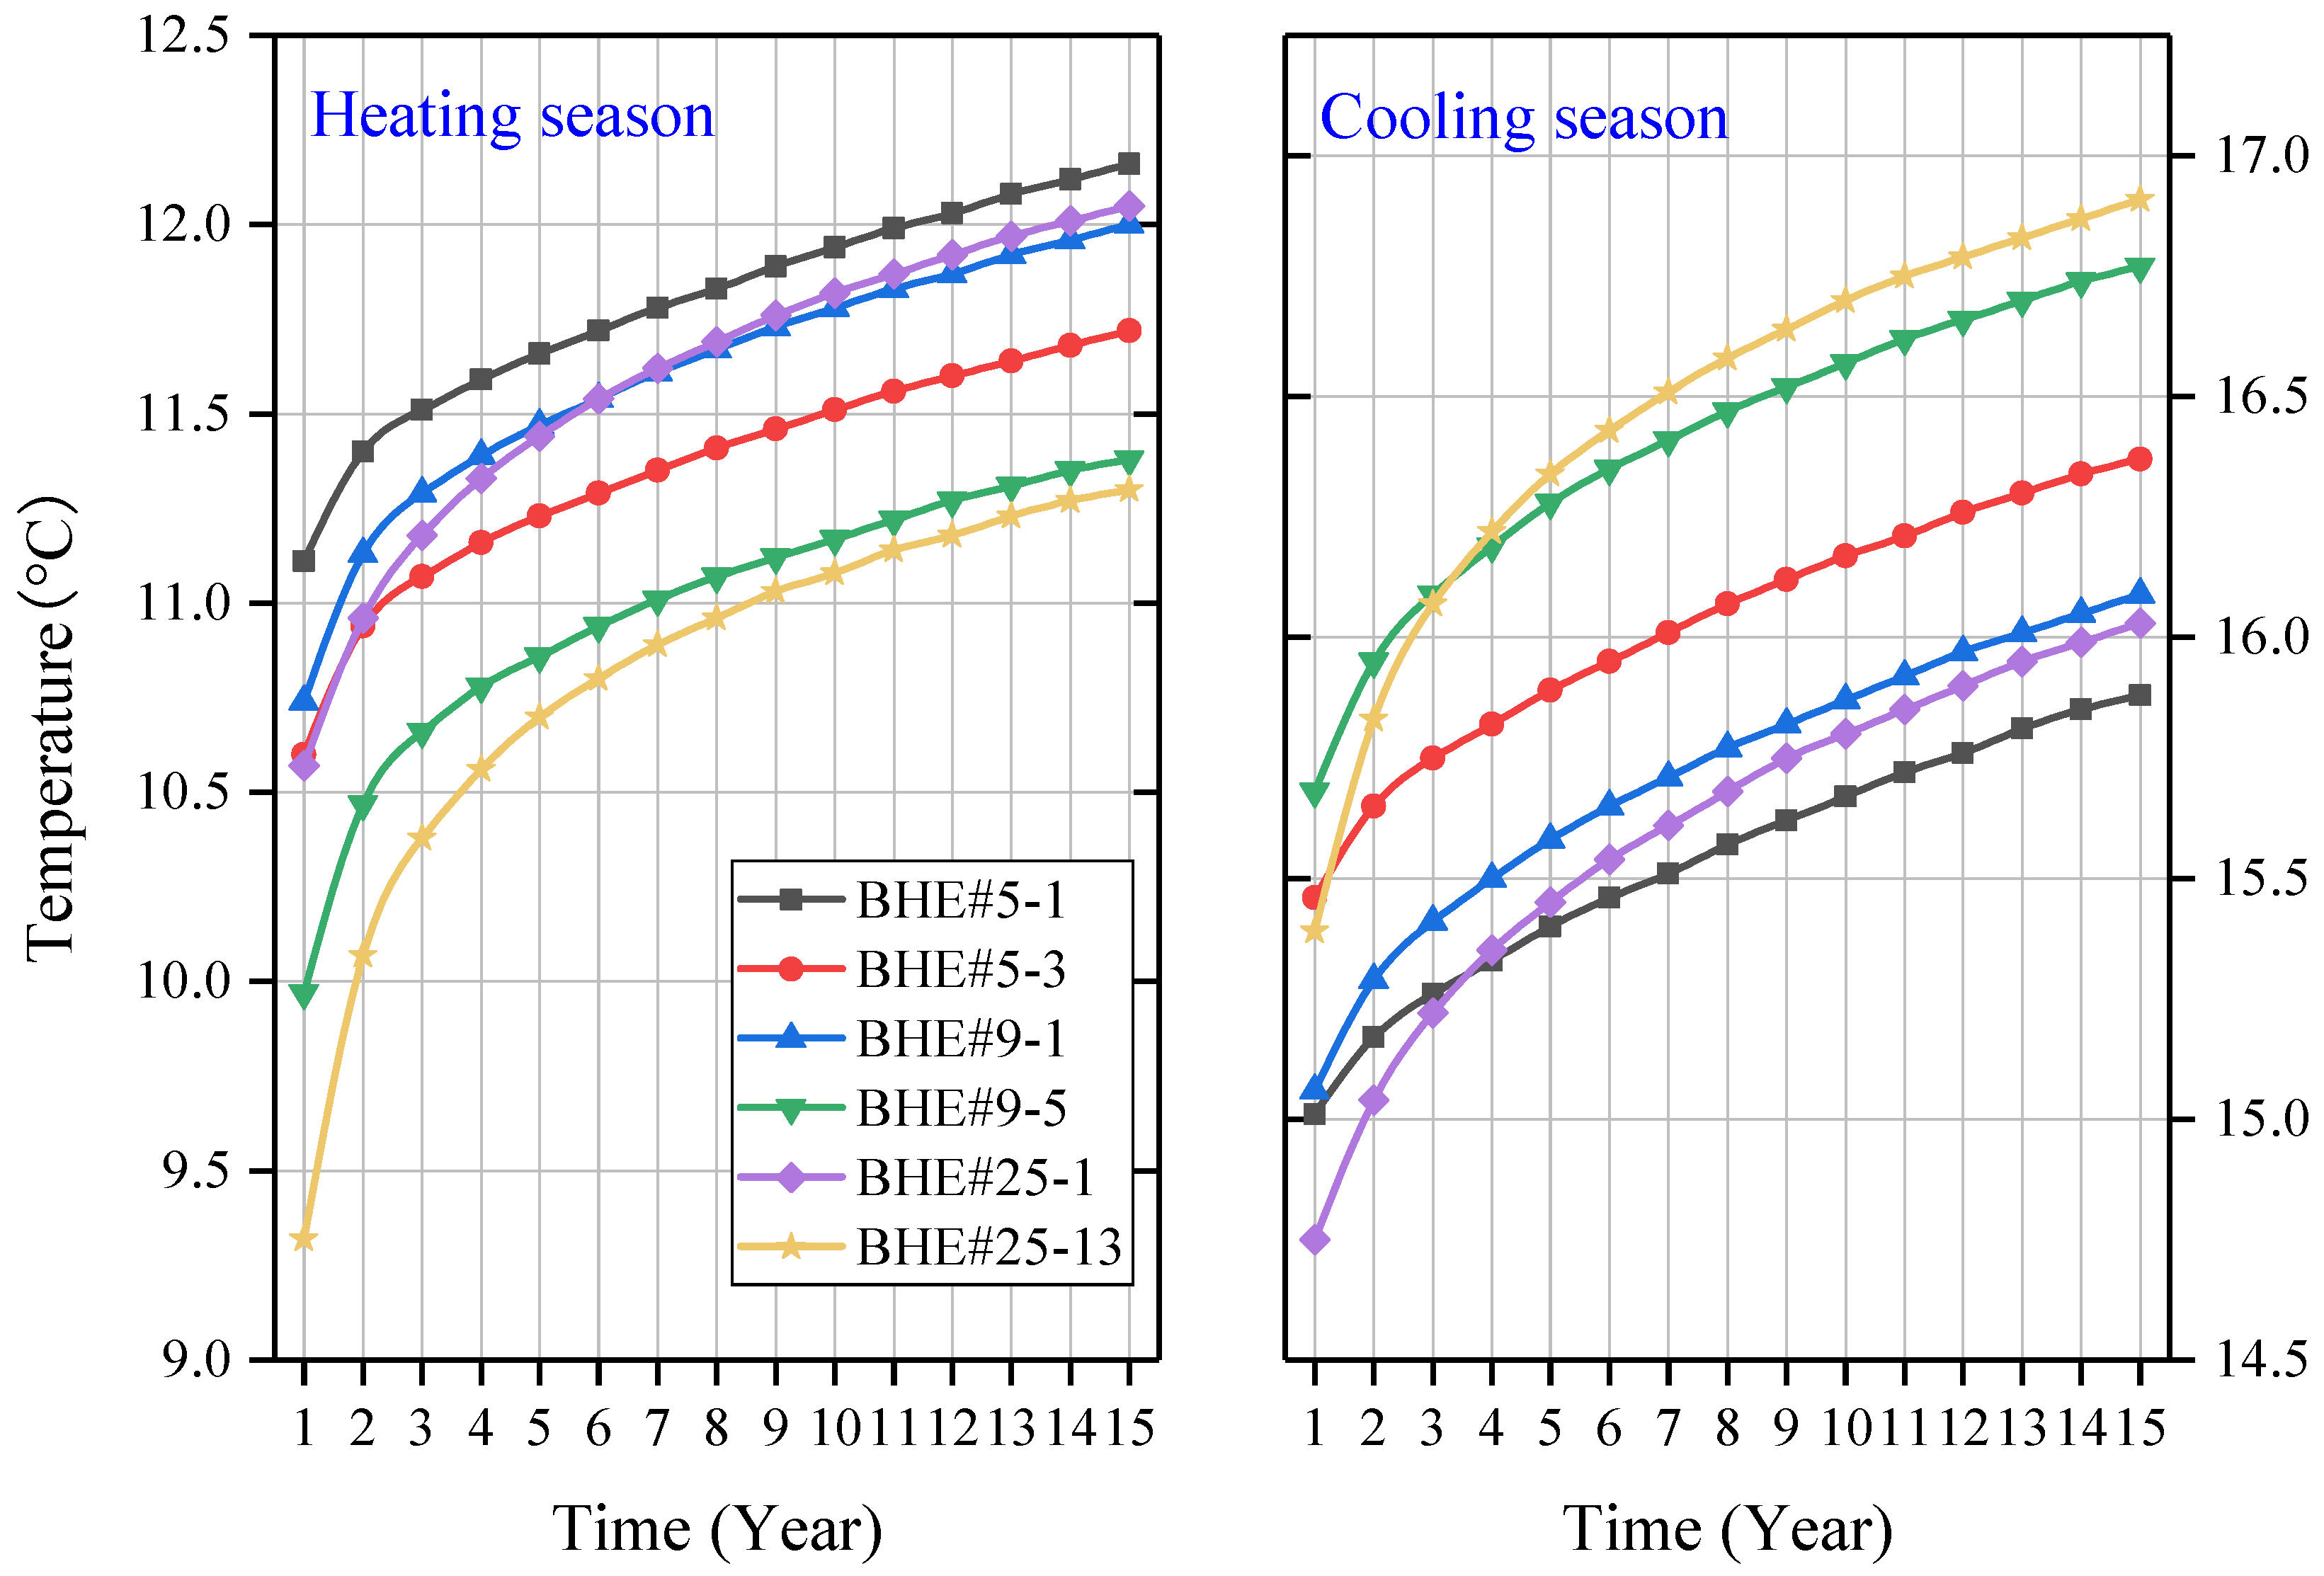
  • Inlet and outlet temperatures: With the operation of the shallow GSHP system, the outlet temperature of the single BHE and the BHE array is rising as a whole, which means the soil temperature around the BHE appears the residual heat accumulation, and the temperature fluctuation of the center BHE is more obvious than that of the edge BHE.
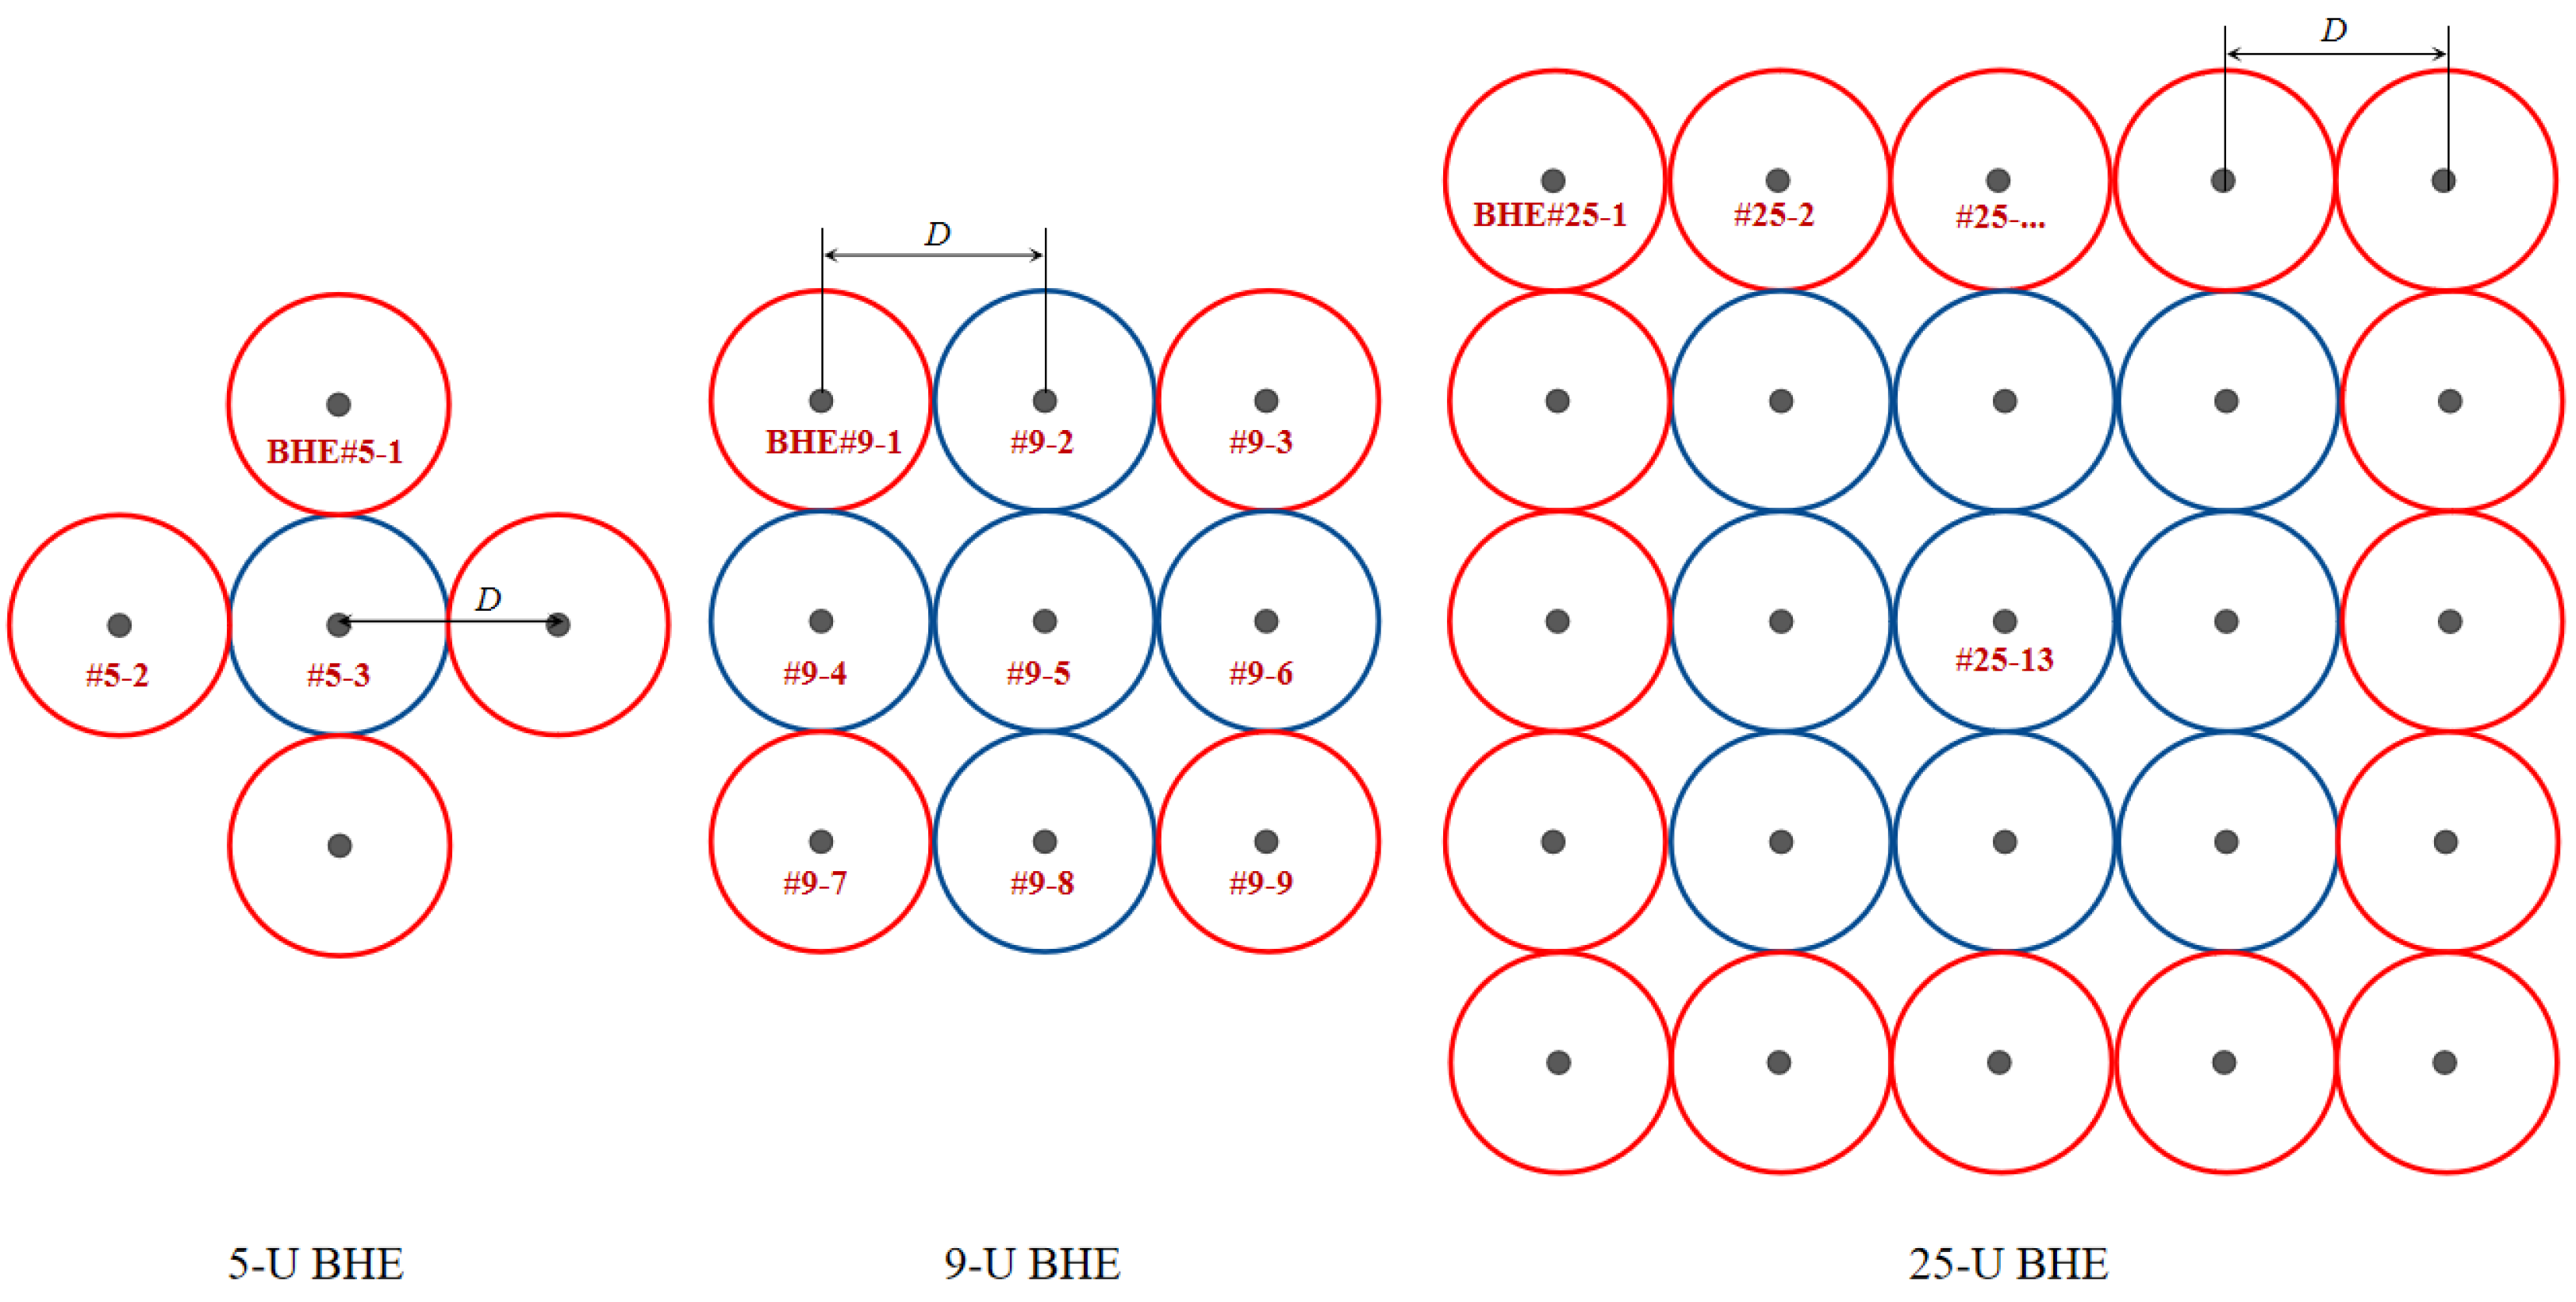
  • Soil temperature: The soil temperature of single BHE fluctuated slightly in the first year, and finally dropped to 13.58 °C in December, which had little difference from the initial soil temperature. For the 9-U system, the heat in the center of the array appears the most obvious accumulation, and underground heat imbalance occurred. After 15 years of operation, the soil temperature near # 9-5 increased by 2 °C compared with the initial ground temperature, which means the soil temperature recovery ability of BHE array system is poor. The accumulation of soil temperature is more favorable for heat extraction in winter, but not conducive to the performance improvement of heat pump units in summer.
    After 15 years of operation, with the increase of inter-borehole spacing, the rising trend of soil temperature slowed down, and it is conducive to the recovery of soil temperature. The unbalanced rate of soil temperature distribution with linear layout is lower than that of the other two layout methods, which means a more concentrated layout method brings a more intense imbalance of soil temperature distribution. Expanding the BHE numbers founds that with the increase of the number of BHEs, the fluctuation of soil temperature is more intense.
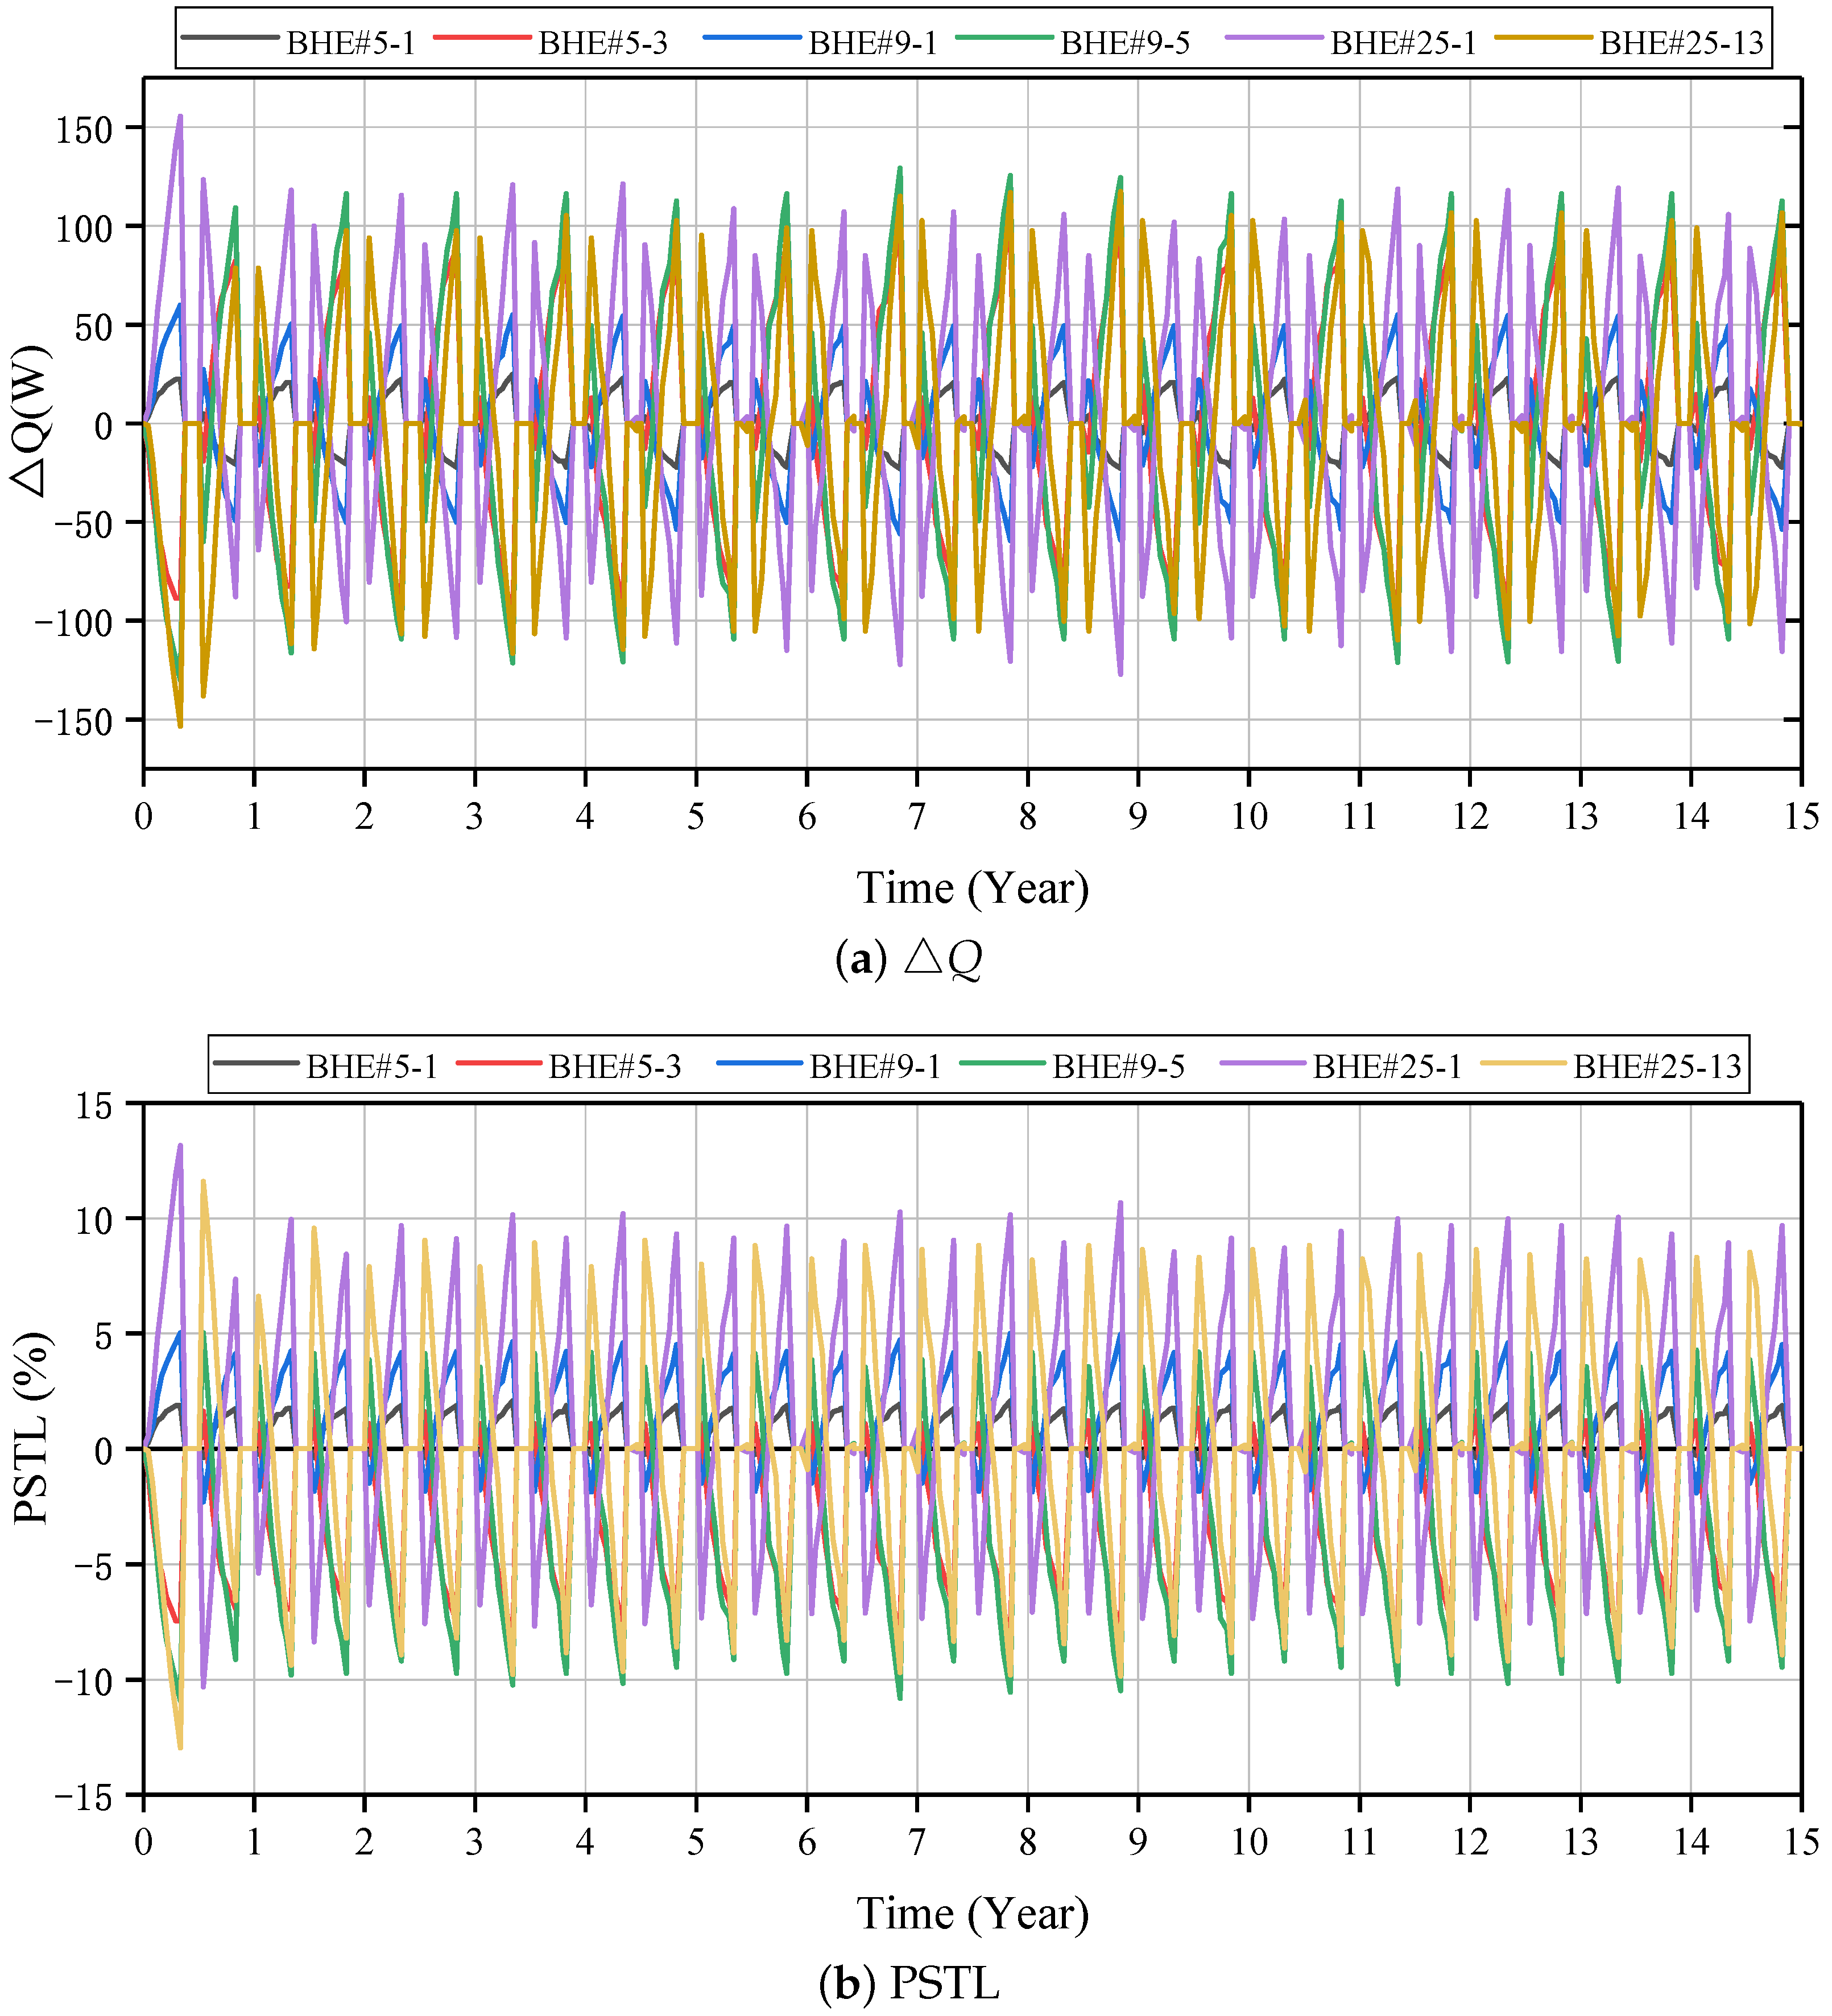
  • Load shifting behaviors: By changing the inter-borehole spacing, the analysis of Q and PSTL shows that the heat shifting of the BHE (# 9-1) located at the edge of array increases, while that located at the center (# 9-5) decreases, and there is an obvious load shifting phenomenon. Comparing with the shifted load of each BHE, it can be seen that the maximum shifted load of each inter-borehole spacing occurs at the central BHE. Q maximum is −169.05 W for BHE # 9-5 when D is 3 m. When D is increased to 6 m, the Q maximum of # 9-5 is −63.39 W. The load shifting behaviors are weakened with the increase of the inter-borehole spacing, and the time for the system to reach thermal equilibrium will be prolonged if the inter-borehole spacing is reduced. Among the three layouts, linear layouts is superior to others. The load shifting behavior of linear layout is the most gentle, which is more conducive to the long-term stability of the BHE array system.
    In the 25-u system, the maximum Q is 155.63 W at # 25-1, and the increase of the number of BHEs will bring more severe load shifting phenomenon. In addition, in the 25-U system, Q increases after the recovery period in the second, third and fifth year of the system operation. The effect of soil temperature recovery on load shifting decreases with the BHE number growing. The change of PSTL in 15 years shows that the 25-U BHE system needs a longer time to reach stability. It is found that the time for the BHE system to reach the thermal equilibrium is more related to the number of BHEs by comprehensive analysis of different design parameters. In the future design of large GSHP system, turning off the central BHEs, reducing the BHE number near the center, or increasing the inter-borehole spacing near the center BHE will improve the long-term operating performance of the system.

Author Contributions

H.Z.: Conceptualization, methodology, validation, writing—original draft. S.G.: Methodology, software, writing—original draft, visualization. R.W.: Software, validation, visualization. F.W.: Conceptualization, project administration, funding acquisition, supervision. Z.S.: Project administration, resources, supervision. W.C.: Conceptualization, software, writing—review and editing. All authors have read and agreed to the published version of the manuscript.

Funding

This research is financially supported by QinChuangyuan ‘Scientist + Engineer’ team project (2022KXJ-039) and Innovation Capability Support Program of Shaanxi Province (2021PT-028), and Social Development Demonstration Project on Science and Technology Innovation of Xi’an (20SFSF0017).

Conflicts of Interest

The authors declare no conflict of interest.

Abbreviations

The following abbreviations are used in this manuscript:
GSHPGround Source Heat Pump
BHEBorehole Heat Exchange
1-USingle U-type BHE
5-U5 U-type BHEs
9-U9 U-type BHEs
25-U25 U-type BHEs
OGSOpenGeoSys
TESPyThermal Engineering System in Python
Q ˙ i heat injection rate at i-th BHE array
Q ˙ m e a n mean heat injection rate of the BHEs array
Qshifted load (W)
PSTLpercentage of the shifted thermal load (%)

References

  1. Lucia, U.; Simonetti, M.; Chiesa, G.; Grisolia, G. Ground-source pump system for heating and cooling: Review and thermodynamic approach. Renew. Sustain. Energy Rev. 2017, 70, 867–874. [Google Scholar] [CrossRef]
  2. Wang, Z.; Yang, Z.; Zhang, B.; Li, H.; He, W. How does urbanization affect energy consumption for central heating: Historical analysis and future prospects. Energy Build. 2022, 255, 111631. [Google Scholar] [CrossRef]
  3. Lin, J.; Lin, B. The actual heating energy conservation in China: Evidence and policy implications. Energy Build. 2019, 190, 195–201. [Google Scholar] [CrossRef]
  4. Dias, J.M.; Costa, V.A. Adsorption heat pumps for heating applications: A review of current state, literature gaps and development challenges. Renew. Sustain. Energy Rev. 2018, 98, 317–327. [Google Scholar] [CrossRef]
  5. Pu, X.; Yao, J.; Zheng, R. Forecast of Energy Consumption and Carbon Emissions in China’s Building Sector to 2060. Energies 2022, 15, 4950. [Google Scholar] [CrossRef]
  6. Dong, B.; Ma, X.; Zhang, Z.; Zhang, H.; Chen, R.; Song, Y.; Shen, M.; Xiang, R. Carbon emissions, the industrial structure and economic growth: Evidence from heterogeneous industries in China. Environ. Pollut. 2020, 262, 114322. [Google Scholar] [CrossRef] [PubMed]
  7. Cao, X.; Dai, X.; Liu, J. Building energy-consumption status worldwide and the state-of-the-art technologies for zero-energy buildings during the past decade. Energy Build. 2016, 128, 198–213. [Google Scholar] [CrossRef]
  8. Xu, X.; Feng, G.; Chi, D.; Liu, M.; Dou, B. Optimization of performance parameter design and energy use prediction for nearly zero energy buildings. Energies 2018, 11, 3252. [Google Scholar] [CrossRef] [Green Version]
  9. Yang, L.; Zhao, K.; Zhao, Y.; Zhong, M. Identifying Key Factors in Determining Disparities in Energy Consumption in China: A Household Level Analysis. Energies 2021, 14, 7149. [Google Scholar] [CrossRef]
  10. Zarco-Periñán, P.J.; Zarco-Soto, I.M.; Zarco-Soto, F.J.; Sánchez-Durán, R. Influence of Population Income on Energy Consumption for Heating and Its CO2 Emissions in Cities. Energies 2021, 14, 4531. [Google Scholar] [CrossRef]
  11. Niknam, P.H.; Talluri, L.; Fiaschi, D.; Manfrida, G. Sensitivity analysis and dynamic modelling of the reinjection process in a binary cycle geothermal power plant of Larderello area. Energy 2021, 214, 118869. [Google Scholar] [CrossRef]
  12. Leontidis, V.; Niknam, P.H.; Durgut, I.; Talluri, L.; Manfrida, G.; Fiaschi, D.; Akin, S.; Gainville, M. Modelling Reinjection of Two-Phase Non-Condensable Gases and Water in Geothermal Wells. Appl. Therm. Eng. 2023, 223, 120018. [Google Scholar] [CrossRef]
  13. Su, C.; Madani, H.; Palm, B. Building heating solutions in China: A spatial techno-economic and environmental analysis. Energy Convers. Manag. 2019, 179, 201–218. [Google Scholar] [CrossRef]
  14. Su, C.; Madani, H.; Palm, B. Heating solutions for residential buildings in China: Current status and future outlook. Energy Convers. Manag. 2018, 177, 493–510. [Google Scholar] [CrossRef]
  15. Hou, X.; Zhong, S.; Zhao, J. A Critical Review on Decarbonizing Heating in China: Pathway Exploration for Technology with Multi-Sector Applications. Energies 2022, 15, 1183. [Google Scholar] [CrossRef]
  16. Lund, J.; Boyd, T. Direct utilization of geothermal energy 2015 worldwide. In Proceedings of the World Geothermal Congress, Melbourne, Australia, 19–24 April 2015. [Google Scholar]
  17. Cai, W.; Wang, F.; Liu, J.; Wang, Z.; Ma, Z. Experimental and numerical investigation of heat transfer performance and sustainability of deep borehole heat exchangers coupled with ground source heat pump systems. Appl. Therm. Eng. 2019, 149, 975–986. [Google Scholar] [CrossRef]
  18. Hou, J.; Cao, M.; Liu, P. Development and utilization of geothermal energy in China: Current practices and future strategies. Renew. Energy 2018, 125, 401–412. [Google Scholar] [CrossRef]
  19. Xu, Y.S.; Wang, X.W.; Shen, S.L.; Zhou, A. Distribution characteristics and utilization of shallow geothermal energy in China. Energy Build. 2020, 229, 110479. [Google Scholar] [CrossRef]
  20. Javadi, H.; Ajarostaghi, S.S.M.; Rosen, M.A.; Pourfallah, M. Performance of ground heat exchangers: A comprehensive review of recent advances. Energy 2019, 178, 207–233. [Google Scholar] [CrossRef]
  21. Aquino, A.; Scrucca, F.; Bonamente, E. Sustainability of Shallow Geothermal Energy for Building Air-Conditioning. Energies 2021, 14, 7058. [Google Scholar] [CrossRef]
  22. Luo, J.; Rohn, J.; Xiang, W.; Bertermann, D.; Blum, P. A review of ground investigations for ground source heat pump (GSHP) systems. Energy Build. 2016, 117, 160–175. [Google Scholar] [CrossRef]
  23. Spitler, J.D.; Gehlin, S.E. Thermal response testing for ground source heat pump systems—An historical review. Renew. Sustain. Energy Rev. 2015, 50, 1125–1137. [Google Scholar] [CrossRef]
  24. Emad Dehkordi, S.; Schincariol, R.A.; Olofsson, B. Impact of groundwater flow and energy load on multiple borehole heat exchangers. Groundwater 2015, 53, 558–571. [Google Scholar] [CrossRef] [Green Version]
  25. Skarphagen, H.; Banks, D.; Frengstad, B.S.; Gether, H. Design considerations for borehole thermal energy storage (BTES): A review with emphasis on convective heat transfer. Geofluids 2019, 2019, 4961781. [Google Scholar] [CrossRef]
  26. Naicker, S.S.; Rees, S.J. Performance analysis of a large geothermal heating and cooling system. Renew. Energy 2018, 122, 429–442. [Google Scholar] [CrossRef] [Green Version]
  27. McDaniel, A.; Fratta, D.; Tinjum, J.M.; Hart, D.J. Long-term district-scale geothermal exchange borefield monitoring with fiber optic distributed temperature sensing. Geothermics 2018, 72, 193–204. [Google Scholar] [CrossRef]
  28. Li, W.; Li, X.; Wang, Y.; Tu, J. An integrated predictive model of the long-term performance of ground source heat pump (GSHP) systems. Energy Build. 2018, 159, 309–318. [Google Scholar] [CrossRef]
  29. Chen, C.; Shao, H.; Naumov, D.; Kong, Y.; Tu, K.; Kolditz, O. Numerical investigation on the performance, sustainability, and efficiency of the deep borehole heat exchanger system for building heating. Geotherm. Energy 2019, 7, 18. [Google Scholar] [CrossRef] [Green Version]
  30. Pan, S.; Kong, Y.; Chen, C.; Pang, Z.; Wang, J. Optimization of the utilization of deep borehole heat exchangers. Geotherm. Energy 2020, 8, 6. [Google Scholar] [CrossRef]
  31. Randow, J.; Chen, S.; Lubashevsky, K.; Thiel, S.; Reinhardt, T.; Rink, K.; Grimm, R.; Bucher, A.; Kolditz, O.; Shao, H. Modeling neighborhood-scale shallow geothermal energy utilization: A case study in Berlin. Geotherm. Energy 2022, 10, 1. [Google Scholar] [CrossRef]
  32. Cai, W.; Wang, F.; Chen, S.; Chen, C.; Liu, J.; Deng, J.; Kolditz, O.; Shao, H. Analysis of heat extraction performance and long-term sustainability for multiple deep borehole heat exchanger array: A project-based study. Appl. Energy 2021, 289, 116590. [Google Scholar] [CrossRef]
  33. Chen, S.; Cai, W.; Witte, F.; Wang, X.; Wang, F.; Kolditz, O.; Shao, H. Long-term thermal imbalance in large borehole heat exchangers array—A numerical study based on the Leicester project. Energy Build. 2021, 231, 110518. [Google Scholar] [CrossRef]
  34. Wang, R.; Wang, F.; Xue, Y.; Jiang, J.; Zhang, Y.; Cai, W.; Chen, C. Numerical Study on the Long-Term Performance and Load Imbalance Ratio for Medium-Shallow Borehole Heat Exchanger System. Energies 2022, 15, 3444. [Google Scholar] [CrossRef]
  35. Cai, W.; Wang, F.; Chen, C.; Chen, S.; Liu, J.; Ren, Z.; Shao, H. Long-term performance evaluation for deep borehole heat exchanger array under different soil thermal properties and system layouts. Energy 2022, 241, 122937. [Google Scholar] [CrossRef]
  36. Chen, S.; Witte, F.; Kolditz, O.; Shao, H. Shifted thermal extraction rates in large Borehole Heat Exchanger array—A numerical experiment. Appl. Therm. Eng. 2020, 167, 114750. [Google Scholar] [CrossRef]
  37. Hein, P.; Kolditz, O.; Görke, U.J.; Bucher, A.; Shao, H. A numerical study on the sustainability and efficiency of borehole heat exchanger coupled ground source heat pump systems. Appl. Therm. Eng. 2016, 100, 421–433. [Google Scholar] [CrossRef]
  38. Witte, F.; Tuschy, I. TESPy: Thermal engineering systems in python. J. Open Source Softw. 2020, 5, 2178. [Google Scholar] [CrossRef]
  39. Naicker, S.S.; Rees, S.J. Long-term high frequency monitoring of a large borehole heat exchanger array. Renew. Energy 2020, 145, 1528–1542. [Google Scholar] [CrossRef]
  40. Gultekin, A.; Aydin, M.; Sisman, A. Effects of arrangement geometry and number of boreholes on thermal interaction coefficient of multi-borehole heat exchangers. Appl. Energy 2019, 237, 163–170. [Google Scholar] [CrossRef]
  41. Cai, W.; Wang, F.; Jiang, J.; Wang, Z.; Liu, J.; Chen, C. Long-Term Performance Evaluation and Economic Analysis for Deep Borehole Heat Exchanger Heating System in Weihe Basin. Front. Earth Sci. 2022, 10, 806416. [Google Scholar] [CrossRef]
  42. GB 50366-2009; Technical Code for Ground-Source Heat Pump System. China Architecture & Building Press: Beijing, China, 2009.
Figure 1. Schematic diagram of shallow GSHP network model in OGS-TESPy.
Energies 16 02497 g001
Figure 2. Location of BHEs in the subterranean model when the BHE system is square layout.
Energies 16 02497 g002
Figure 3. Evolution of inlet and outlet water temperature of representative BHE at the end of heating and cooling seasons in 15 years.
Energies 16 02497 g003
Figure 4. Evolution of soil temperature around single BHE and BHE array in the first year.
Energies 16 02497 g004
Figure 5. Evolution of soil temperature around single BHE and BHE array during 15 years.
Energies 16 02497 g005
Figure 6. Evolution of soil temperature near typical BHE at the end of heating and cooling seasons during 15-year operation with variable inter-borehole spacing.
Energies 16 02497 g006
Figure 7. Q evolution of typical BHEs with different inter-borehole spacing in 15 year.
Energies 16 02497 g007
Figure 8. The evolution of PSTL for typical BHE(# 9-5) with different inter-borehole spacing in 15 year.
Energies 16 02497 g008
Figure 9. Location of BHEs in the subterranean model when layout method of the BHE system are linear and staggered.
Energies 16 02497 g009
Figure 10. Evolution of soil temperature near typical BHE at the end of heating and cooling seasons during 15-year operation with diverse layouts.
Energies 16 02497 g010
Figure 11. Q evolution of typical BHEs with three layouts in 15 years.
Energies 16 02497 g011
Figure 12. PSTL evolution of typical BHEs with three layouts in 15 year.
Energies 16 02497 g012
Figure 13. Location of BHEs in the subterranean model when number of BHE array are 5-U, 9-U and 25-U.
Energies 16 02497 g013
Figure 14. Evolution of soil temperature near typical BHE at the end of heating and cooling seasons during 15-year operation with a diverse number of BHEs.
Energies 16 02497 g014
Figure 15. Q (a) and PSTL (b) evolution of typical BHEs with three number of BHEs in 15 year.
Energies 16 02497 g015
Table 1. Detailed parameters of the BHEs and the pipe network adopted in the coupling model [33,39].
ParameterValueUnit
Length of the BHE100m
Diameter of the BHE0.125m
Pipe inner diameter0.026m
Wall thickness of pipe0.003m
Wall thermal conductivity of pipe0.4W m−1 K−1
Grout density2190Kg m−3
Grout specific heat capacity1735.16J Kg−1 K−1
Grout thermal conductivity0.656W m−1 K−1
Circulating fluid density1020Kg m−3
Circulating fluid specific heat capacity3962J Kg−1 K−1
Circulating fluid thermal conductivity0.485W m−1 K−1
Circulating fluid dynamic viscosity0.0024Pa s
Initial soil temperature11.7°C
Soil density1120Kg m−3
Soil specific heat capacity1780J Kg−1 K−1
Soil thermal conductivity3.4W m−1 K−1
Geothermal gradient30°C km−1
Disclaimer/Publisher’s Note: The statements, opinions and data contained in all publications are solely those of the individual author(s) and contributor(s) and not of MDPI and/or the editor(s). MDPI and/or the editor(s) disclaim responsibility for any injury to people or property resulting from any ideas, methods, instructions or products referred to in the content.

