1. Introduction
Energy is essential for development in a society, and wind energy is currently a viable technique, representing a highly developed technology that takes heed of the global climate emergency and contributes to reducing the carbon footprint [
1,
2]. Wind energy has experienced radical technological advances that are beneficial for its future. However, the maintenance of wind turbine blades involves visual inspection that can be dangerous, time-consuming, and expensive. Therefore, a system for predicting failure through vibration monitoring would represent an improvement over blade maintenance operations, reducing costs and ensuring a future in clean energy [
3,
4,
5].
In the literature, several authors report on predictive maintenance using machine learning models [
6,
7,
8,
9,
10,
11], deep learning based on turbine performance curves, and condition monitoring to detect vibration anomalies from cleaning and processing vibration time windows signals for information extraction [
12,
13]. Moreover, image processing has been used in the analysis of rotary drives to determine their reference condition [
14,
15,
16,
17,
18].
Predictive maintenance is one of the most important processes to ensure the useful life of a wind turbine, which lasts approximately 20 to 25 years; therefore, securing continuous operation is very important for reducing the time and cost of maintenance. It should be noted that preventive, predictive, or reactive maintenance strategies aim to extend the useful life of wind turbines by performing thorough analysis of wind turbine anomalies to generate more data for maintenance needs [
8,
19,
20,
21,
22,
23].
In addition, several authors rely on a database for analysis using the Supervision, Control and Data Acquisition (SCADA) method in order to find errors that manifest themselves at intervals during different periods and determine permissible limits—for instance, the tendency to failure during the maintenance period where it is indicated that the turbines can continue in an operating state within a permitted range [
1,
8,
20,
24]. Other authors have carried out analysis for detecting anomalies in turbines to derive the required details for meeting maintenance needs [
11,
25].
Several studies have presented different application methods that have been developed for wind turbine failure analysis based on accelerometer measurements. The use of accelerometers has several advantages since, besides being economical, they can capture a wide range of frequencies, thus providing reliable results for identifying wear in mechanisms and predicting possible errors occupying various databases (which are available for research) in order to prevent possible failure [
8,
20,
26,
27,
28,
29,
30].
These methods can be used to detect wind turbine failure in real time in addition to diagnosing faults, usually based on analysis of accelerator signals from 3 axes, which is a classic technique used to understand system performance. Generally, this analysis is performed in the time and frequency domain [
19,
29,
31,
32].
Vibrations are present under normal operating conditions, and are focused on turbine failure situations, such as failures in the outer and inner bearing raceway, rolling element failures, imbalance, and misalignment—all failures that are caused by vibrations [
33]. As a result of studying vibrations, combinations of variables can be found that describe main trends and fluctuations within vibration response measured in structures to create a reference state to which new observations for damage diagnosis are evaluated; such methods can be used to detect wind turbine failure in real time [
20,
29]. A frequency response function serves as a stimulation tool through its system transfer function, and the system complexity can allow the creation of some harmonics that usually limit the frequency response function of the same application [
34].
In this paper, we present work on wind turbine mechanical vibration monitoring, where the data obtained by accelerometer measurements are used to train a machine learning algorithm by applying Bagged Trees to predict situations of synthetic failures caused by vibrations in a laboratory. The purpose is to use the collected data to ensure that the wind turbine remains in a stable state of health, with certain values acting as indicators to alert for situations where possible maintenance is required.
2. Materials and Methods
The wind turbine used is a 400 W Sunforce with a rotor 1.12 m in diameter and a 45 km/h maximum power speed. The wind turbine is equipped with anti-static plastic components that will extend the life of the wind turbine by protecting it from atmospheric corrosion and static electricity build-up. A 16-bit MPU6050 motion accelerometer was used that has three modules: an accelerometer, a gyroscope that handles three axes, “X”, "Y", and "Z” and a temperature sensor fed with 5 V. The data were acquired using Arduino hardware connected to the MPU6050 accelerometer to obtain the time series signals that were later processed using the MATLAB program together with the Classification Learner toolbox using Bagged Trees. Materials used in the methodology are in
Table 1 3. Methods and Instrumentation
The methodology is based on three stages: turbine instrumentation, vibration monitoring in different vibration scenarios, and network training for vibration type prediction.
3.1. Instrumentation and Test
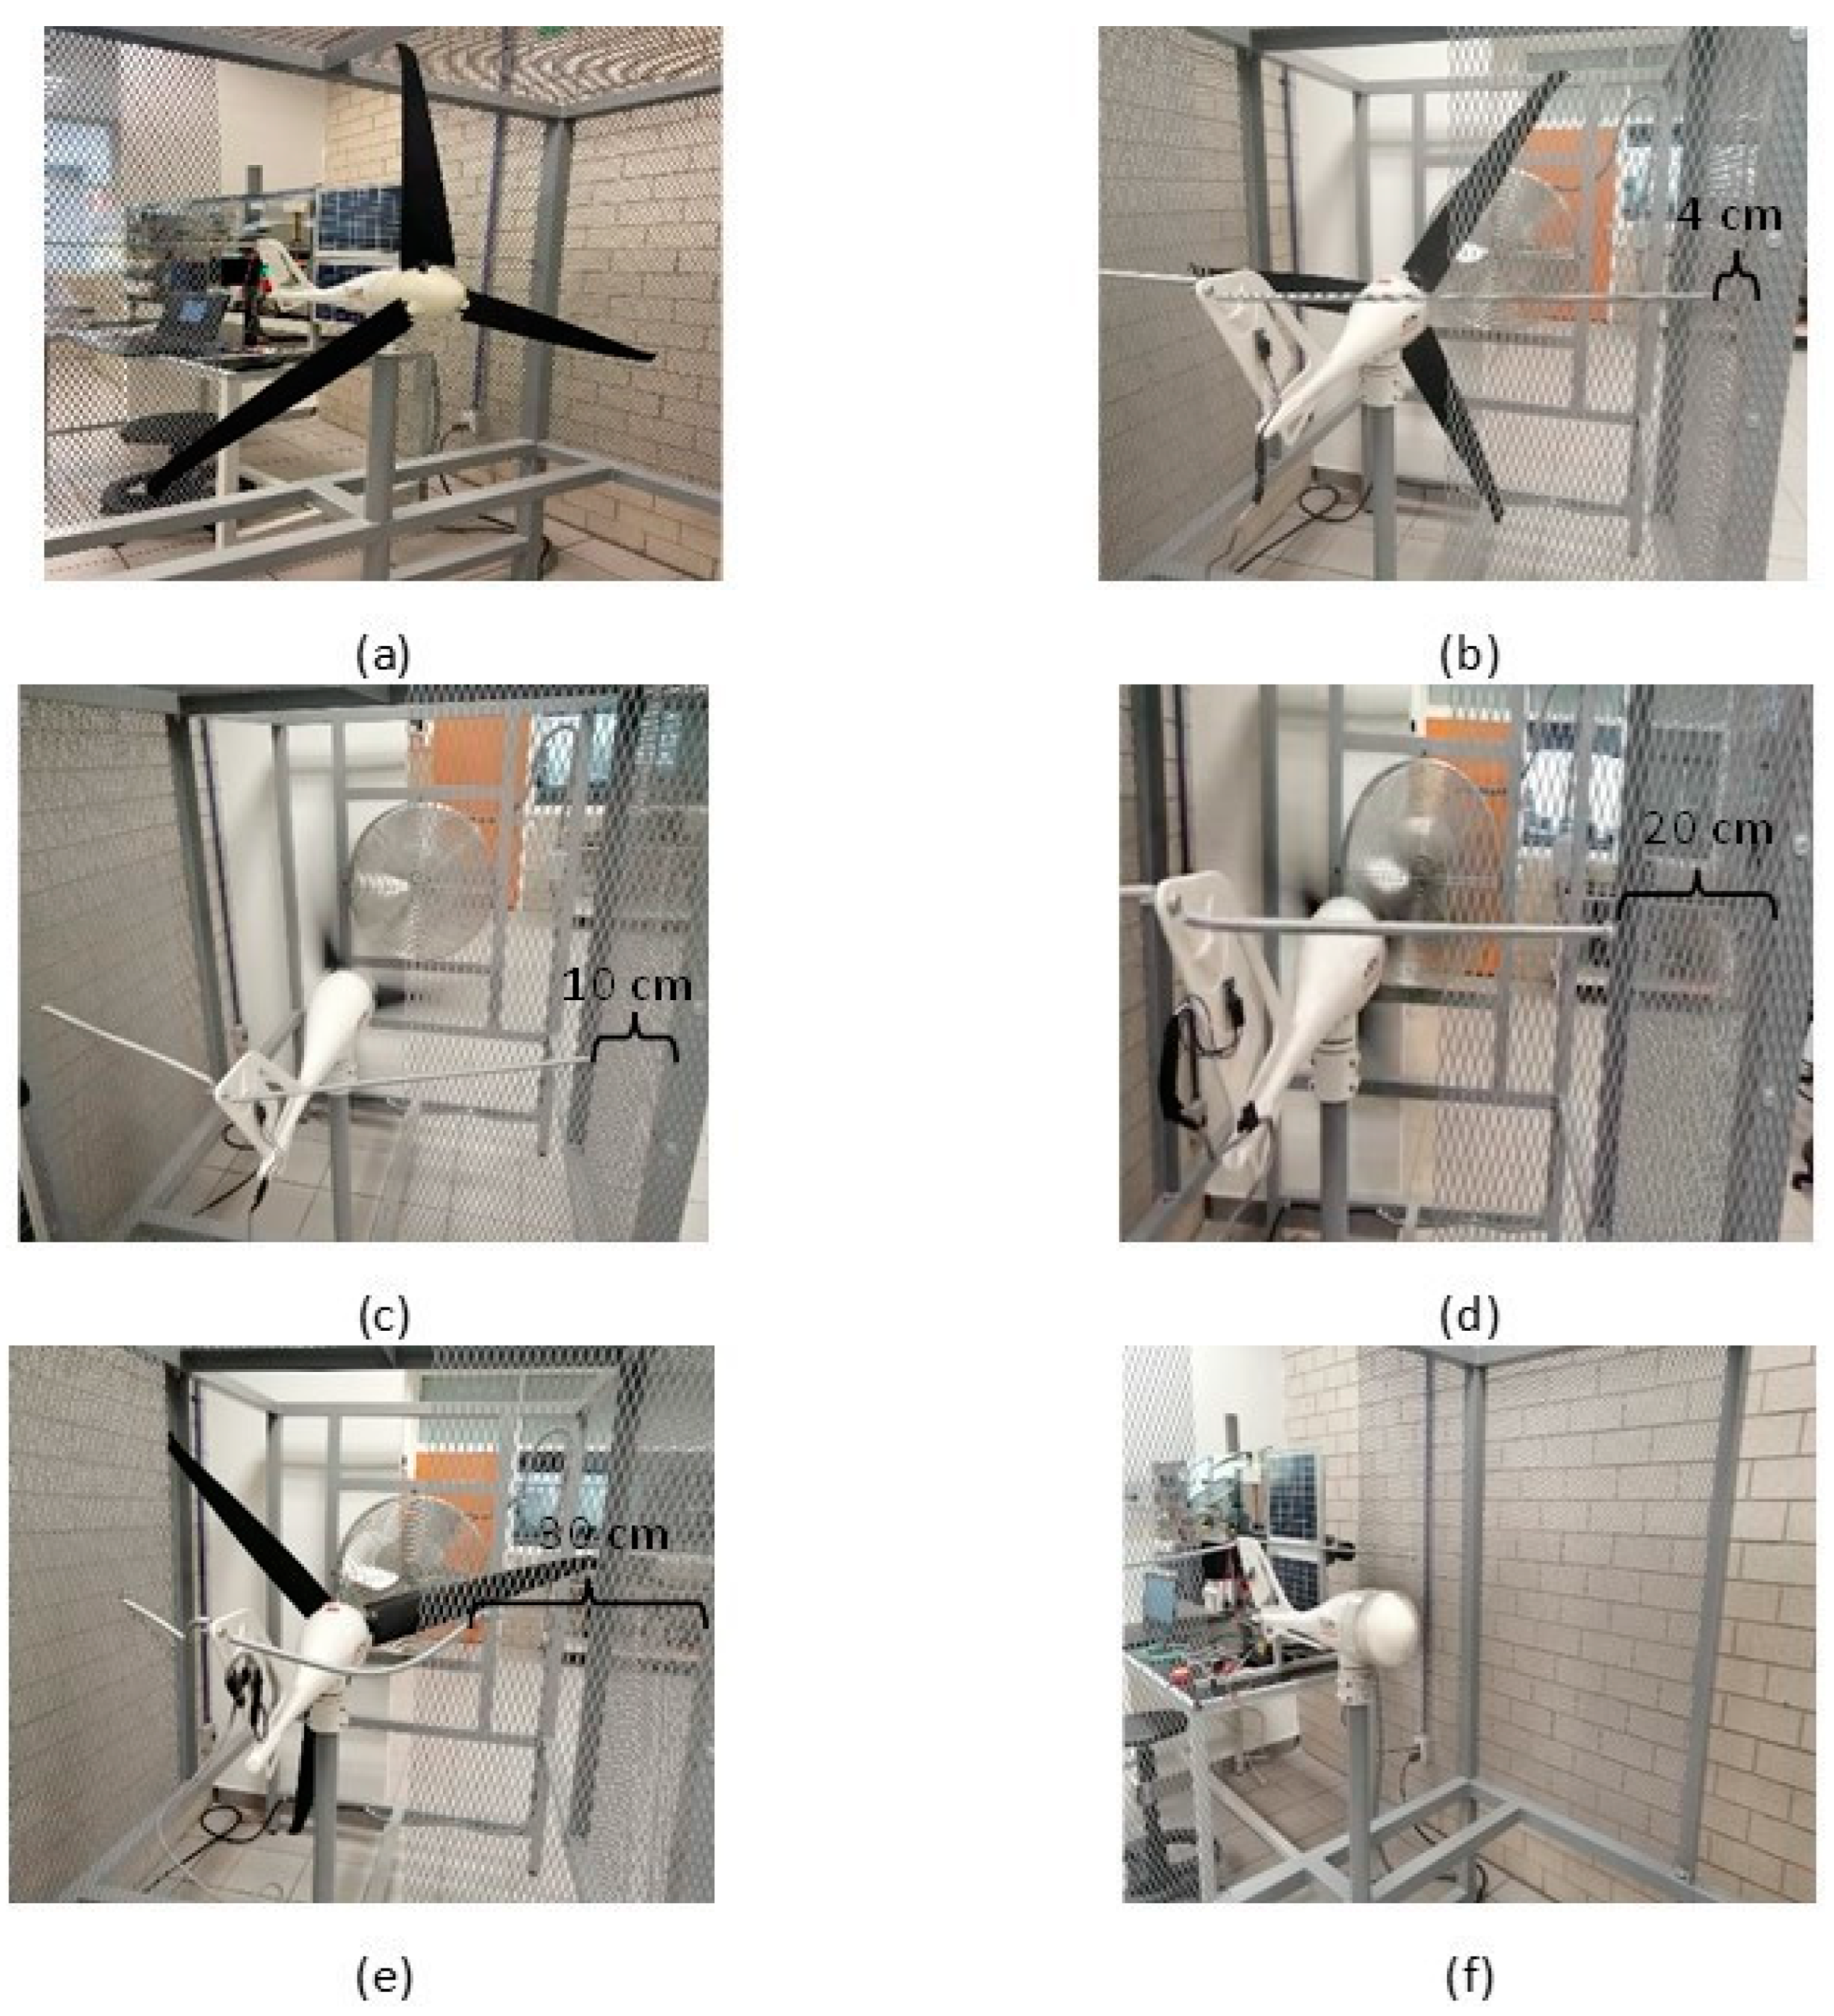
The instrumentation and tests were as follows: in the laboratory, a wind turbine was subjected (
Figure 1a) to a constant speed of 10 km/h over a period of 60 min, with supports/springs (
Figure 1) in the rear at different distances: 4 cm (
Figure 1b), 10 cm (
Figure 1c), 20 cm (
Figure 1d), and 30 cm (
Figure 1e) to reduce the angles of freedom of vibrations. The accelerometer was located at the back of the wind turbine (
Figure 1), with care always taken to ensure that the wires did not disturb the system. Once the instrumentation operation was finished, the vibration monitoring data were read.
3.2. Vibration Monitoring in Different Vibration Scenarios
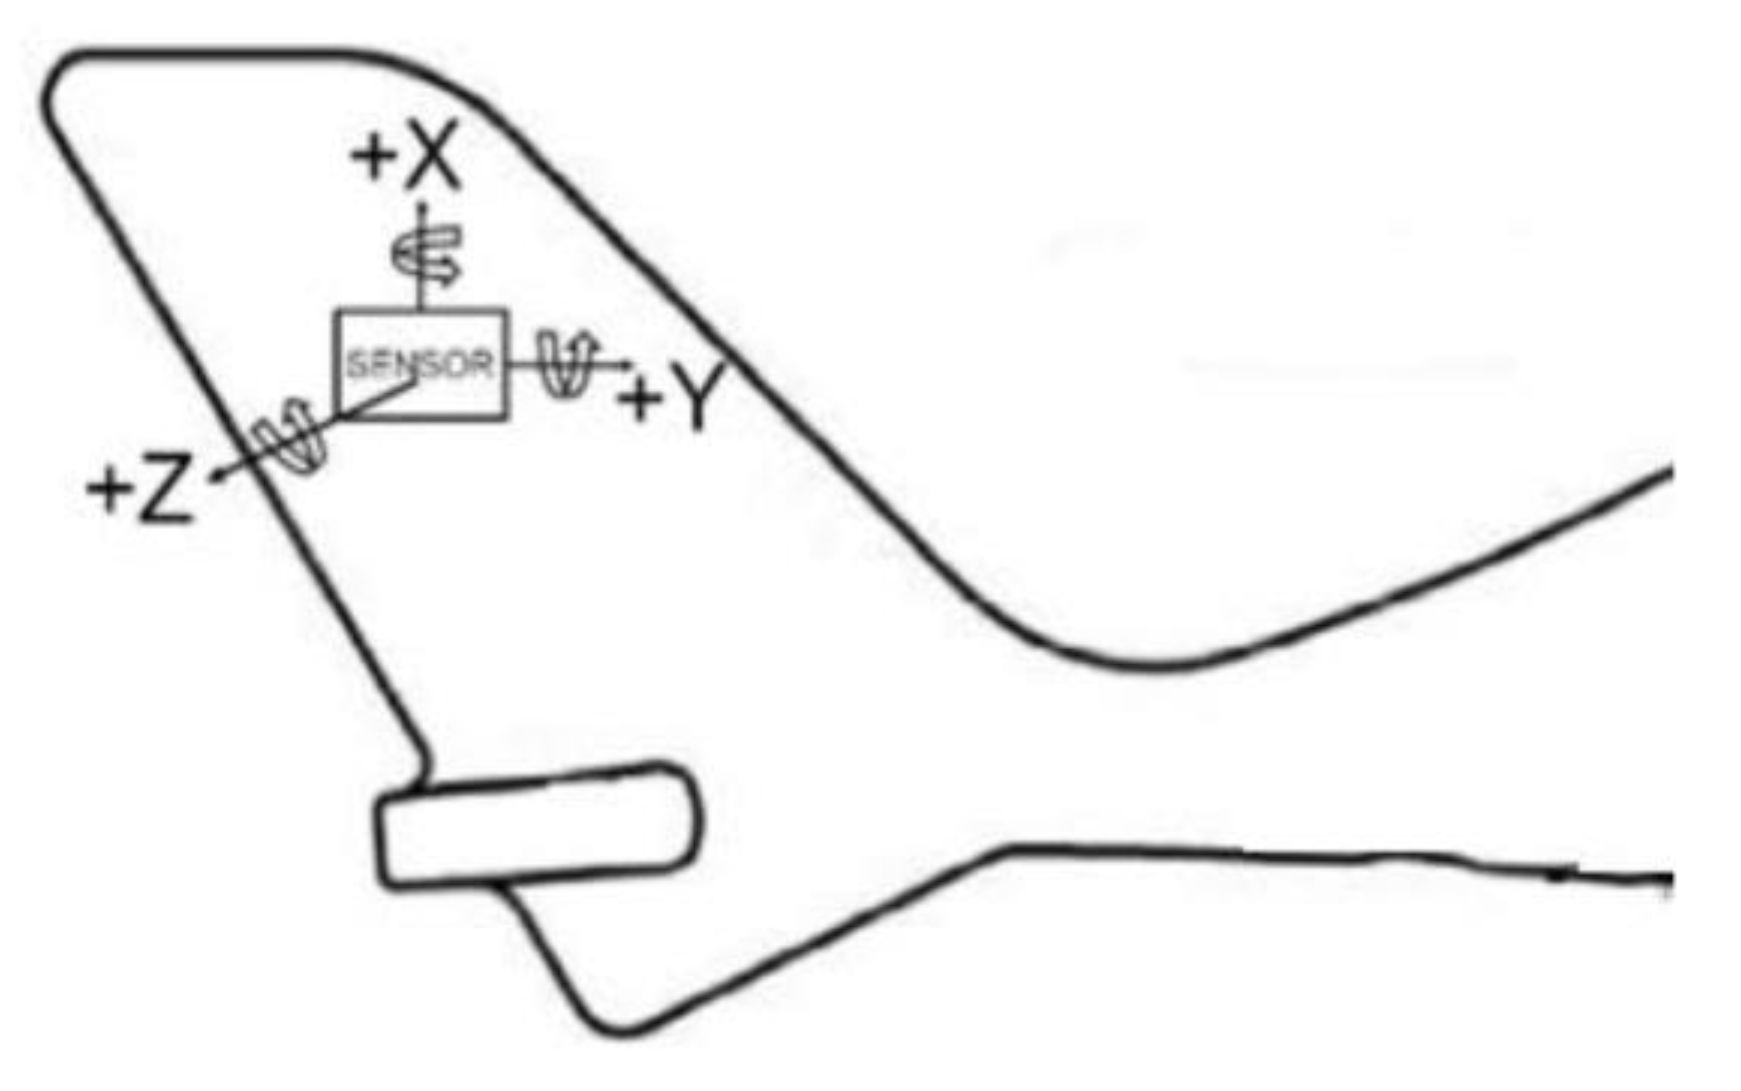
The accelerometer was placed in such a way that the “X”, “Y”, and “Z” axes were oriented as shown in
Figure 2. Arrows for each axis indicate the direction of increasing positivity.
The accelerometer was placed on the wind vane, as this was thought to be the ideal location due to the wind vane flapping. This was an conjecture as in there was no information in the literature about it, although there is some information on accelerometers placed on wind turbine blades.
3.3. Data Set for Machine Learning
Machine learning is an artificial intelligence application that has the capacity to experiment by means of an “invisible” area and thus identify patterns from collected data. Machine learning algorithms were implemented to obtain a prediction system that can detect increases in vibration. Examples include Medium Tree, Cubic SVM, Logistic Regression Kernel, Optimizable Neural Network, and Bagged Trees; of these, the highest precision was obtained for the last-named (Bagged Trees). A confusion matrix was used to measure the performance. The learning took place with retro propagation optimization for complex nonlinear problems such as wind generator vibrations.
The time series was segmented into time windows of 0.125 ms, and different parameters were extracted from each window and used for network training, including median, standard deviation, bias, kurtosis, peak2peak, RMS, and energy.
Different machine learning methods were trained to determine a prediction model to estimate the vibration level according to vibration level (from lower to higher): 4 cm = level1, 10 cm = level2, 20 cm = level3, and 30 cm = level4. For each level, time series parameters were extracted.
4. Results and Discussion of Vibration Monitoring
4.1. Longitudinal Triaxial Accelerometer Vibrations in Wind Turbine in Various Scenarios
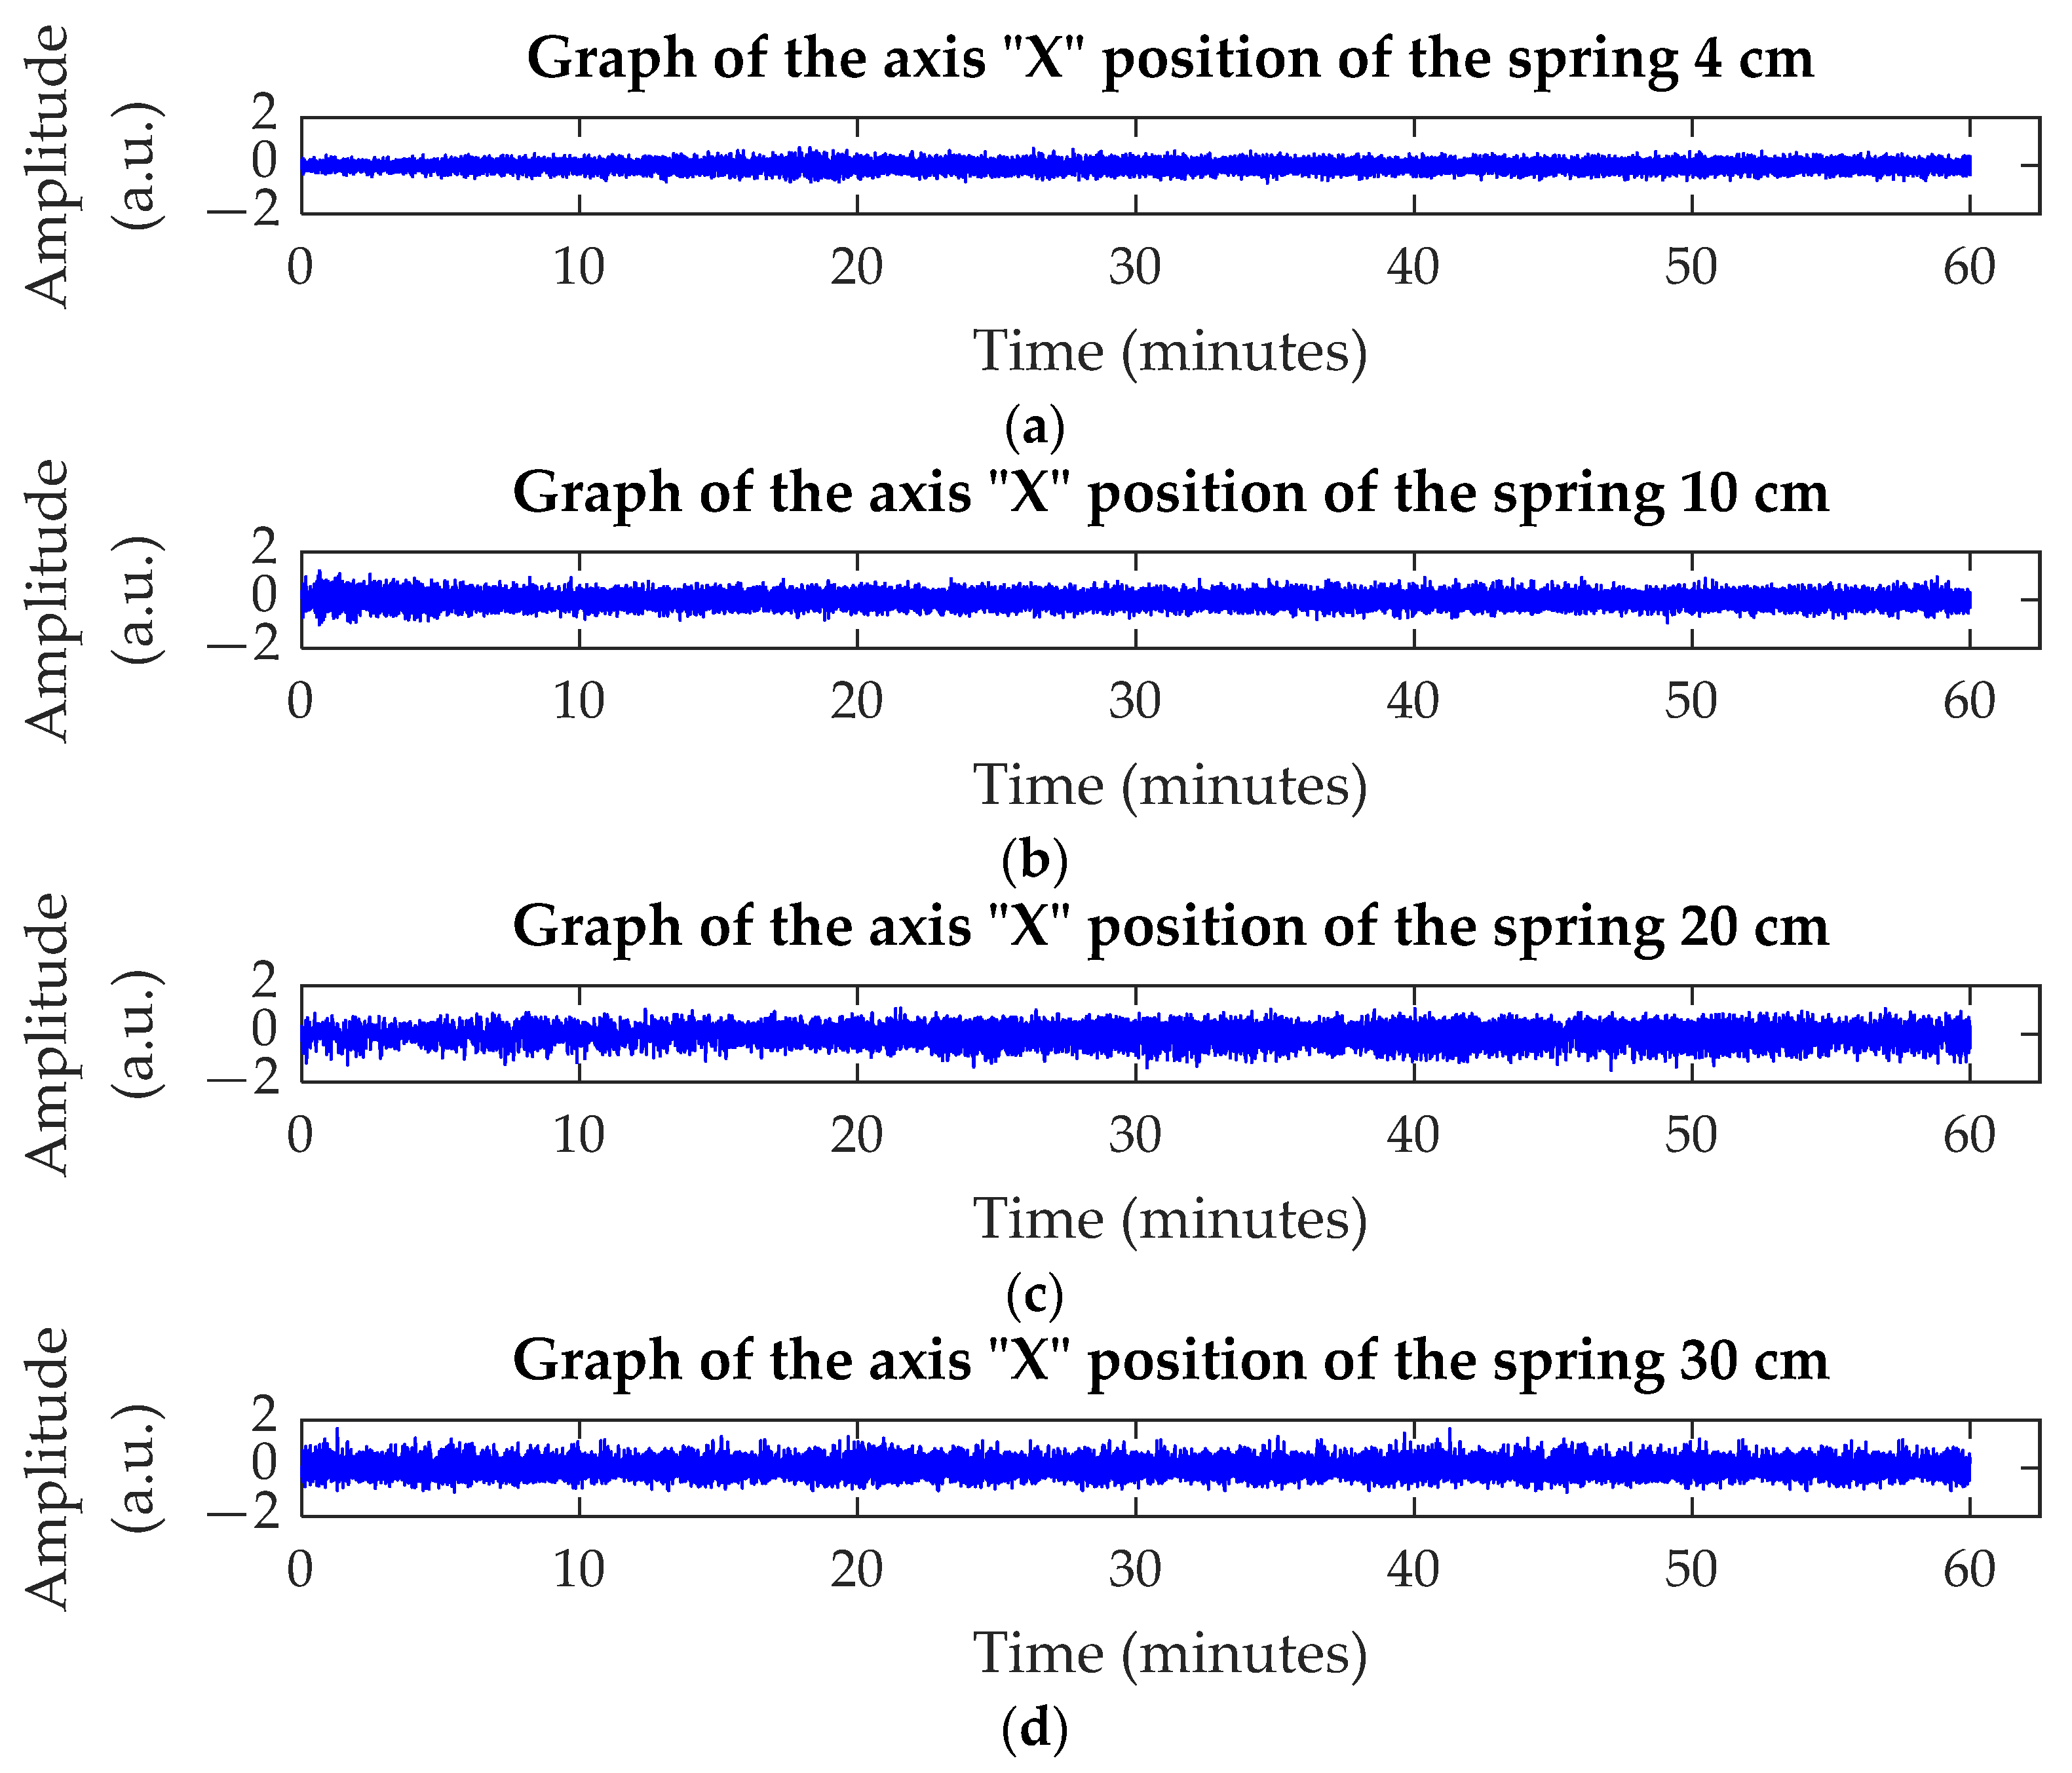
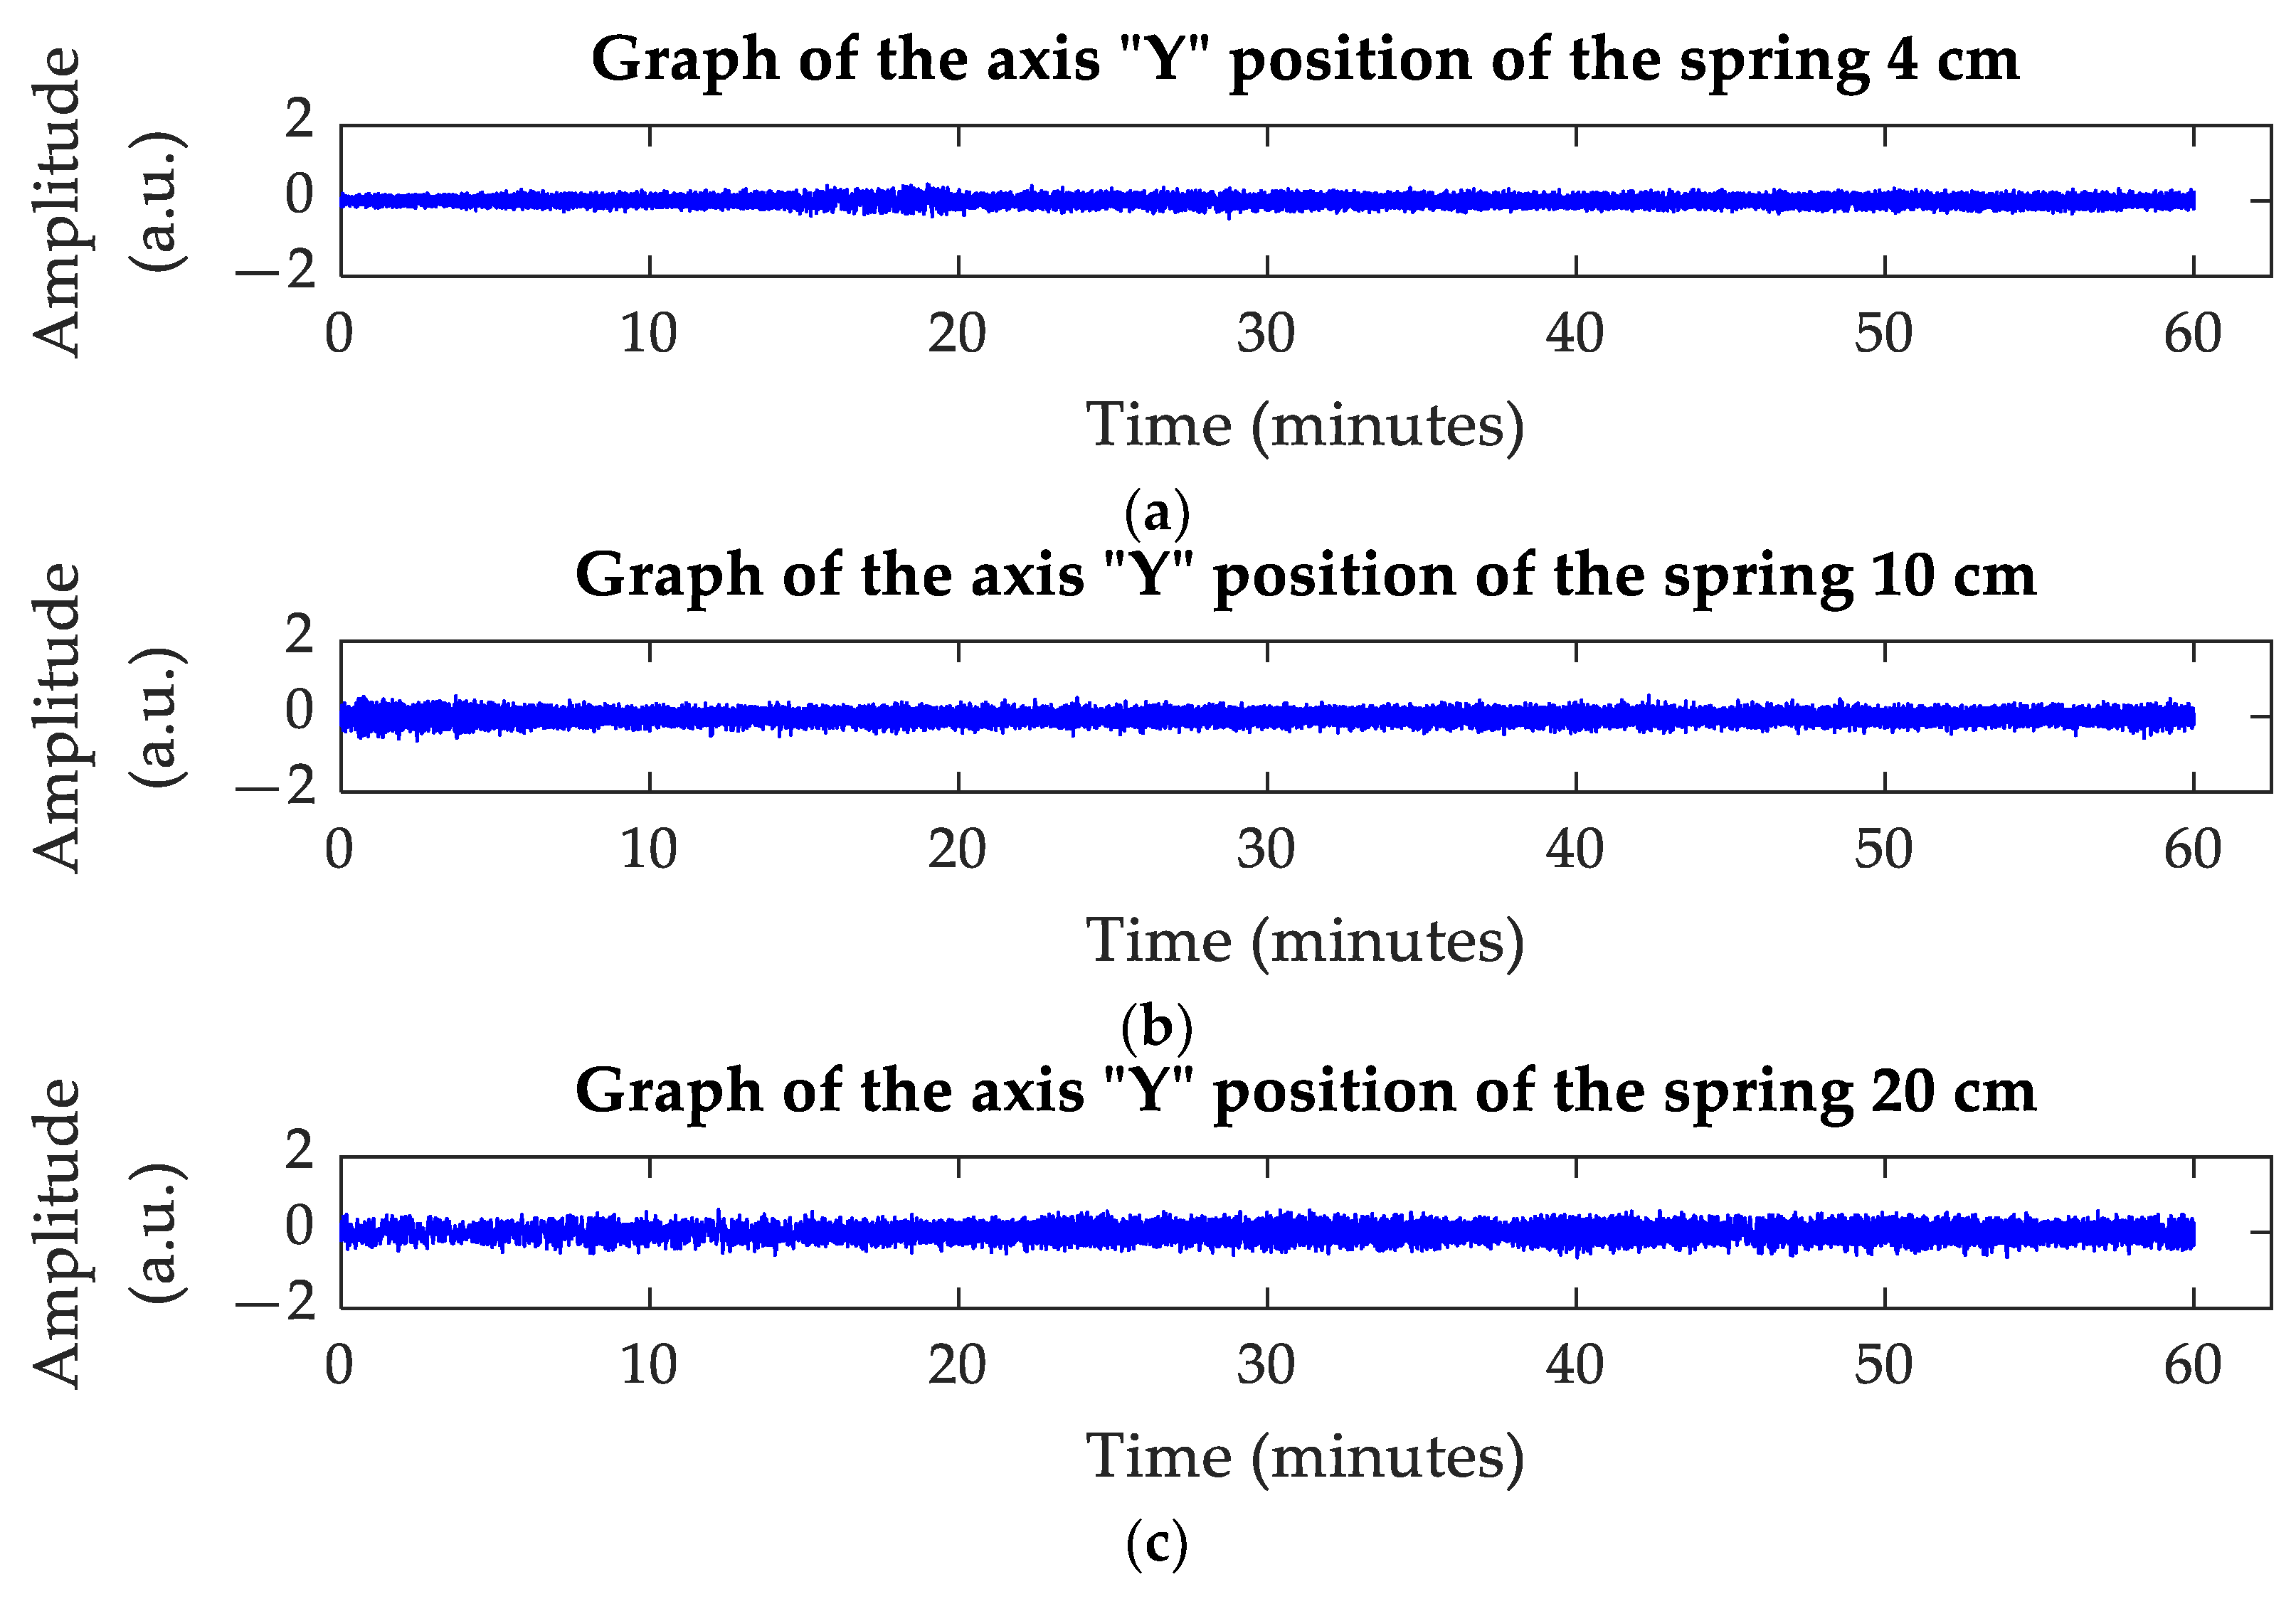
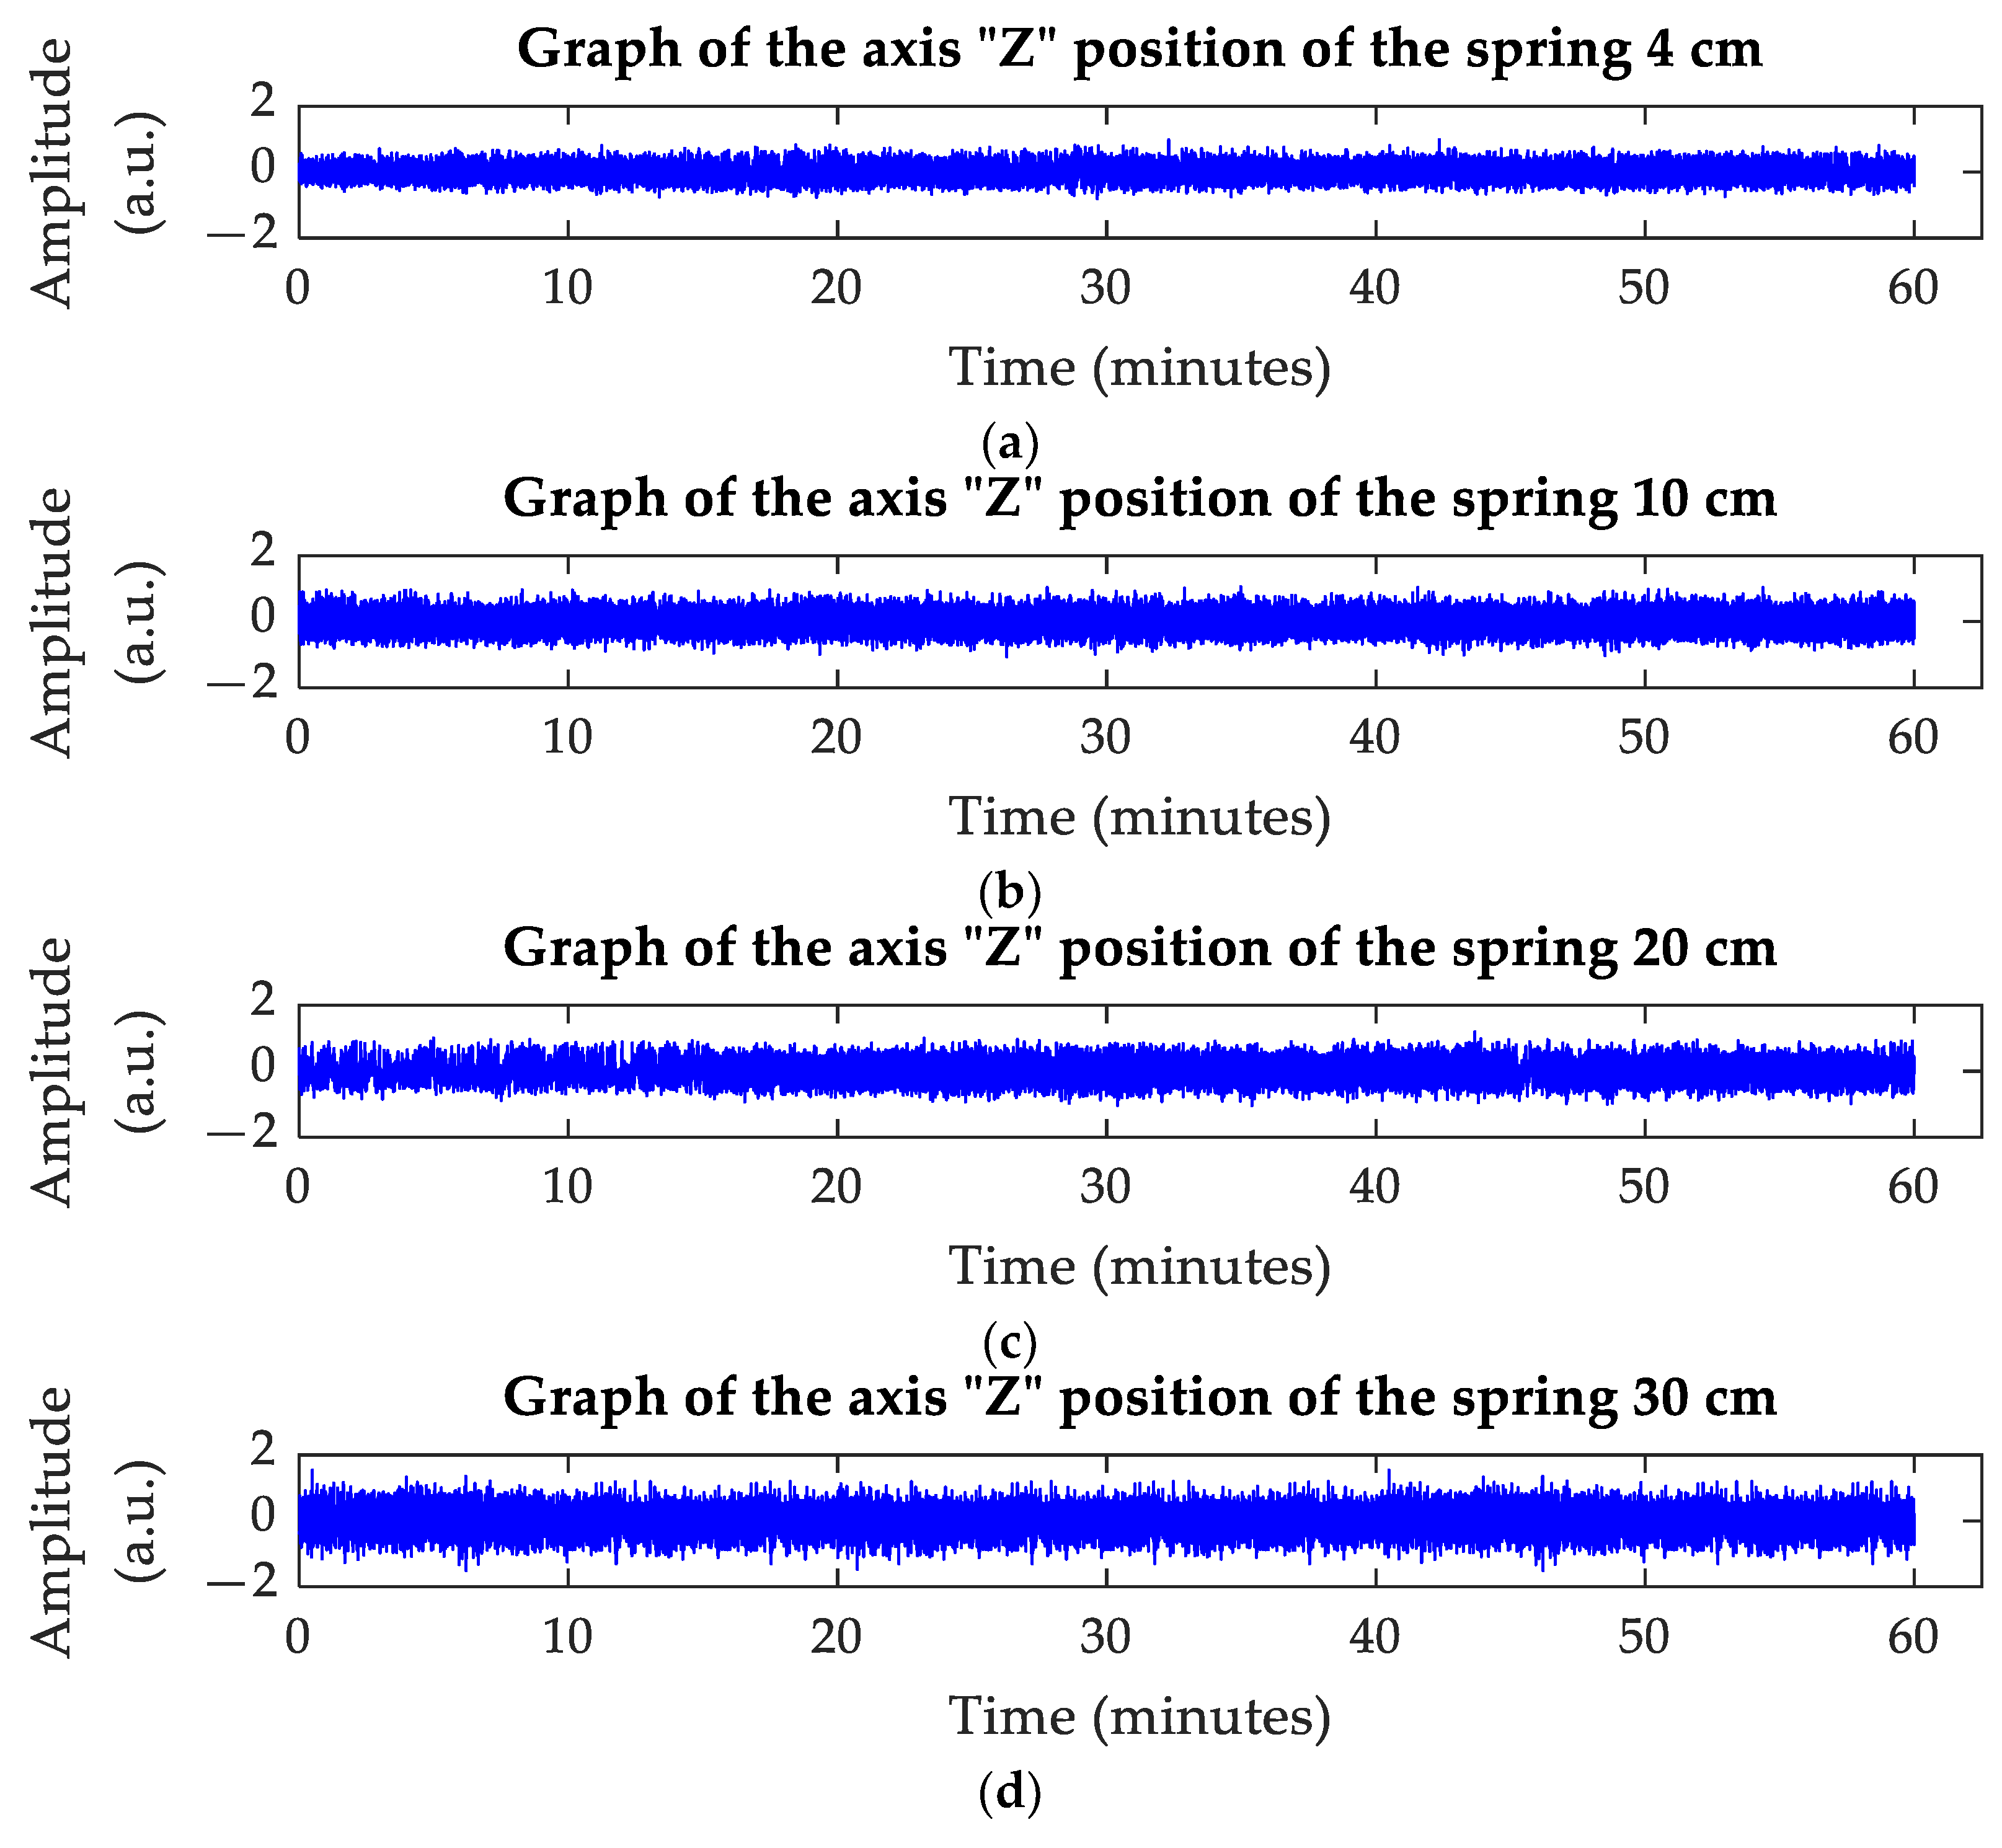
In
Figure 3,
Figure 4 and
Figure 5, the vibration amplitudes obtained by the accelerometer can be observed with respect to time on the “X”, “Y”, and “Z” axes. It can be seen that there is an increase in the vibrations according to the position of the spring.
Figure 3a,
Figure 4a and
Figure 5a show how there is an increase, and the maximum amplitude is reached without the need to increase the wind speed between 10 and 20 min, after which the vibrations decrease.
Figure 3b,
Figure 4b and
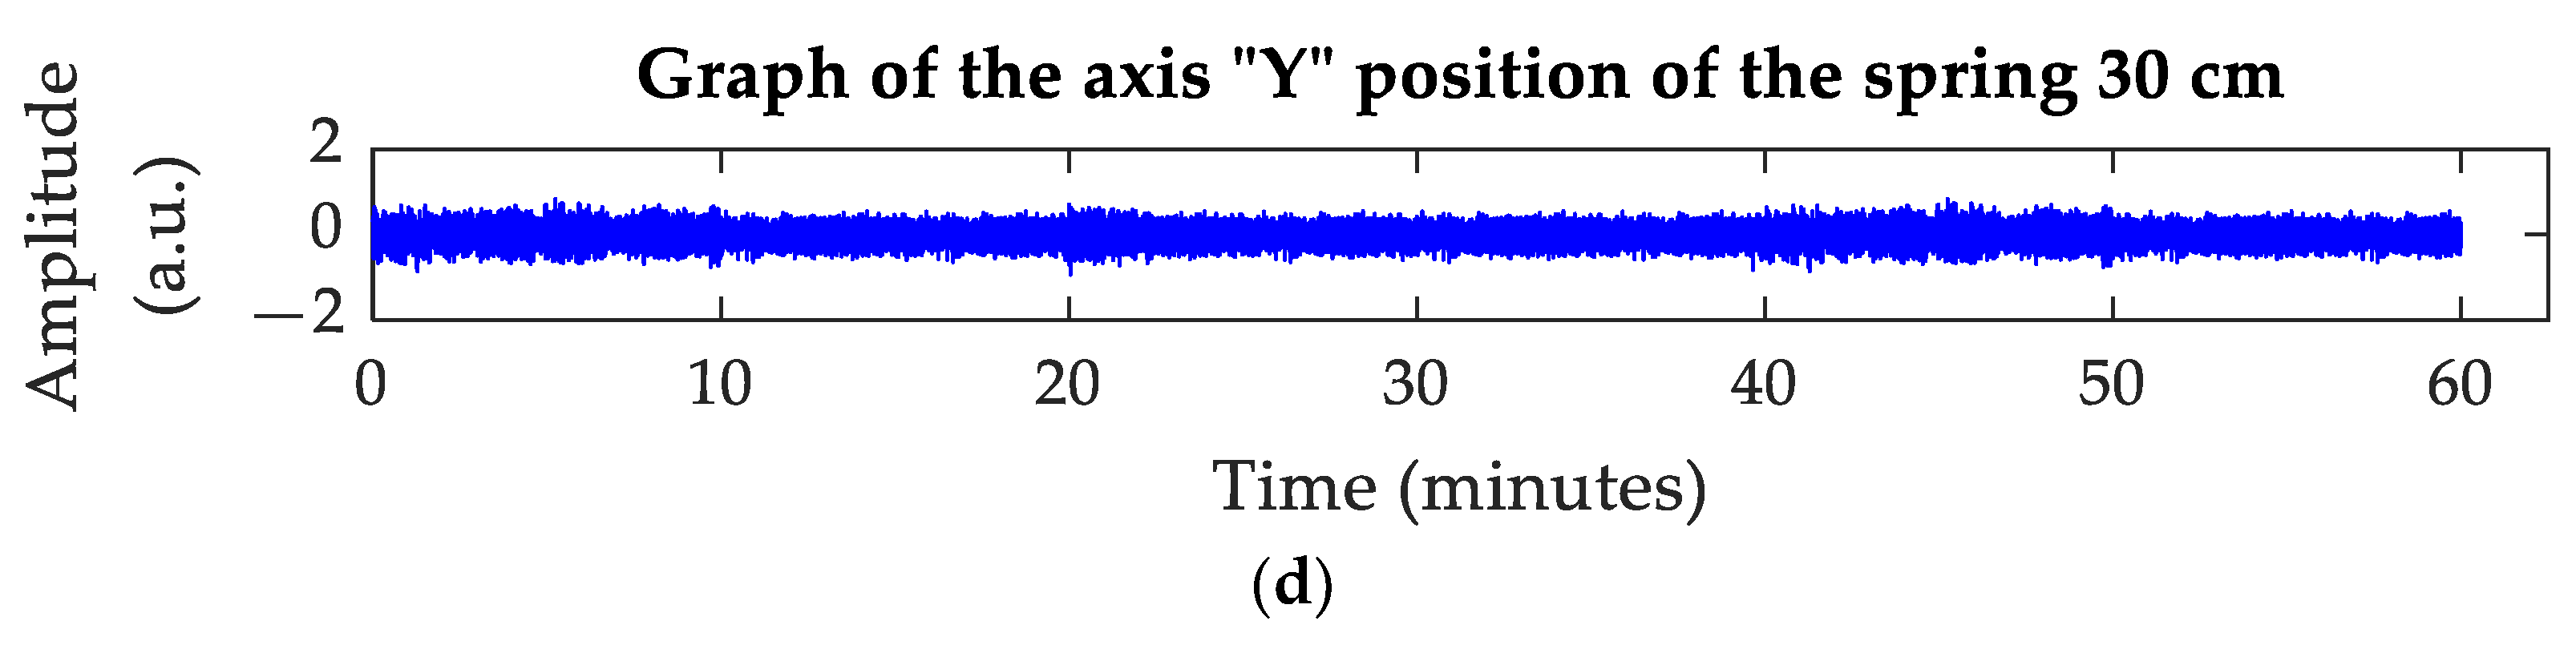
Figure 5b show an increase in vibration amplitude between 0 and 10 min, giving the springs more freedom without the need to increase wind speed due to the higher vibrations frequencies. After the 20th minute, there are pulses of the same amplitude, but they are not so frequent.
In
Figure 3c,
Figure 4c and
Figure 5c, lower vibration amplitudes are depicted up to the 10th minute, and there is an increase in vibration amplitude between 20 and 30 min.
In
Figure 3d,
Figure 4d and
Figure 5d, the amplitudes are greater than in previous graphs, reaching a larger amplitude between 40 and 50 min.
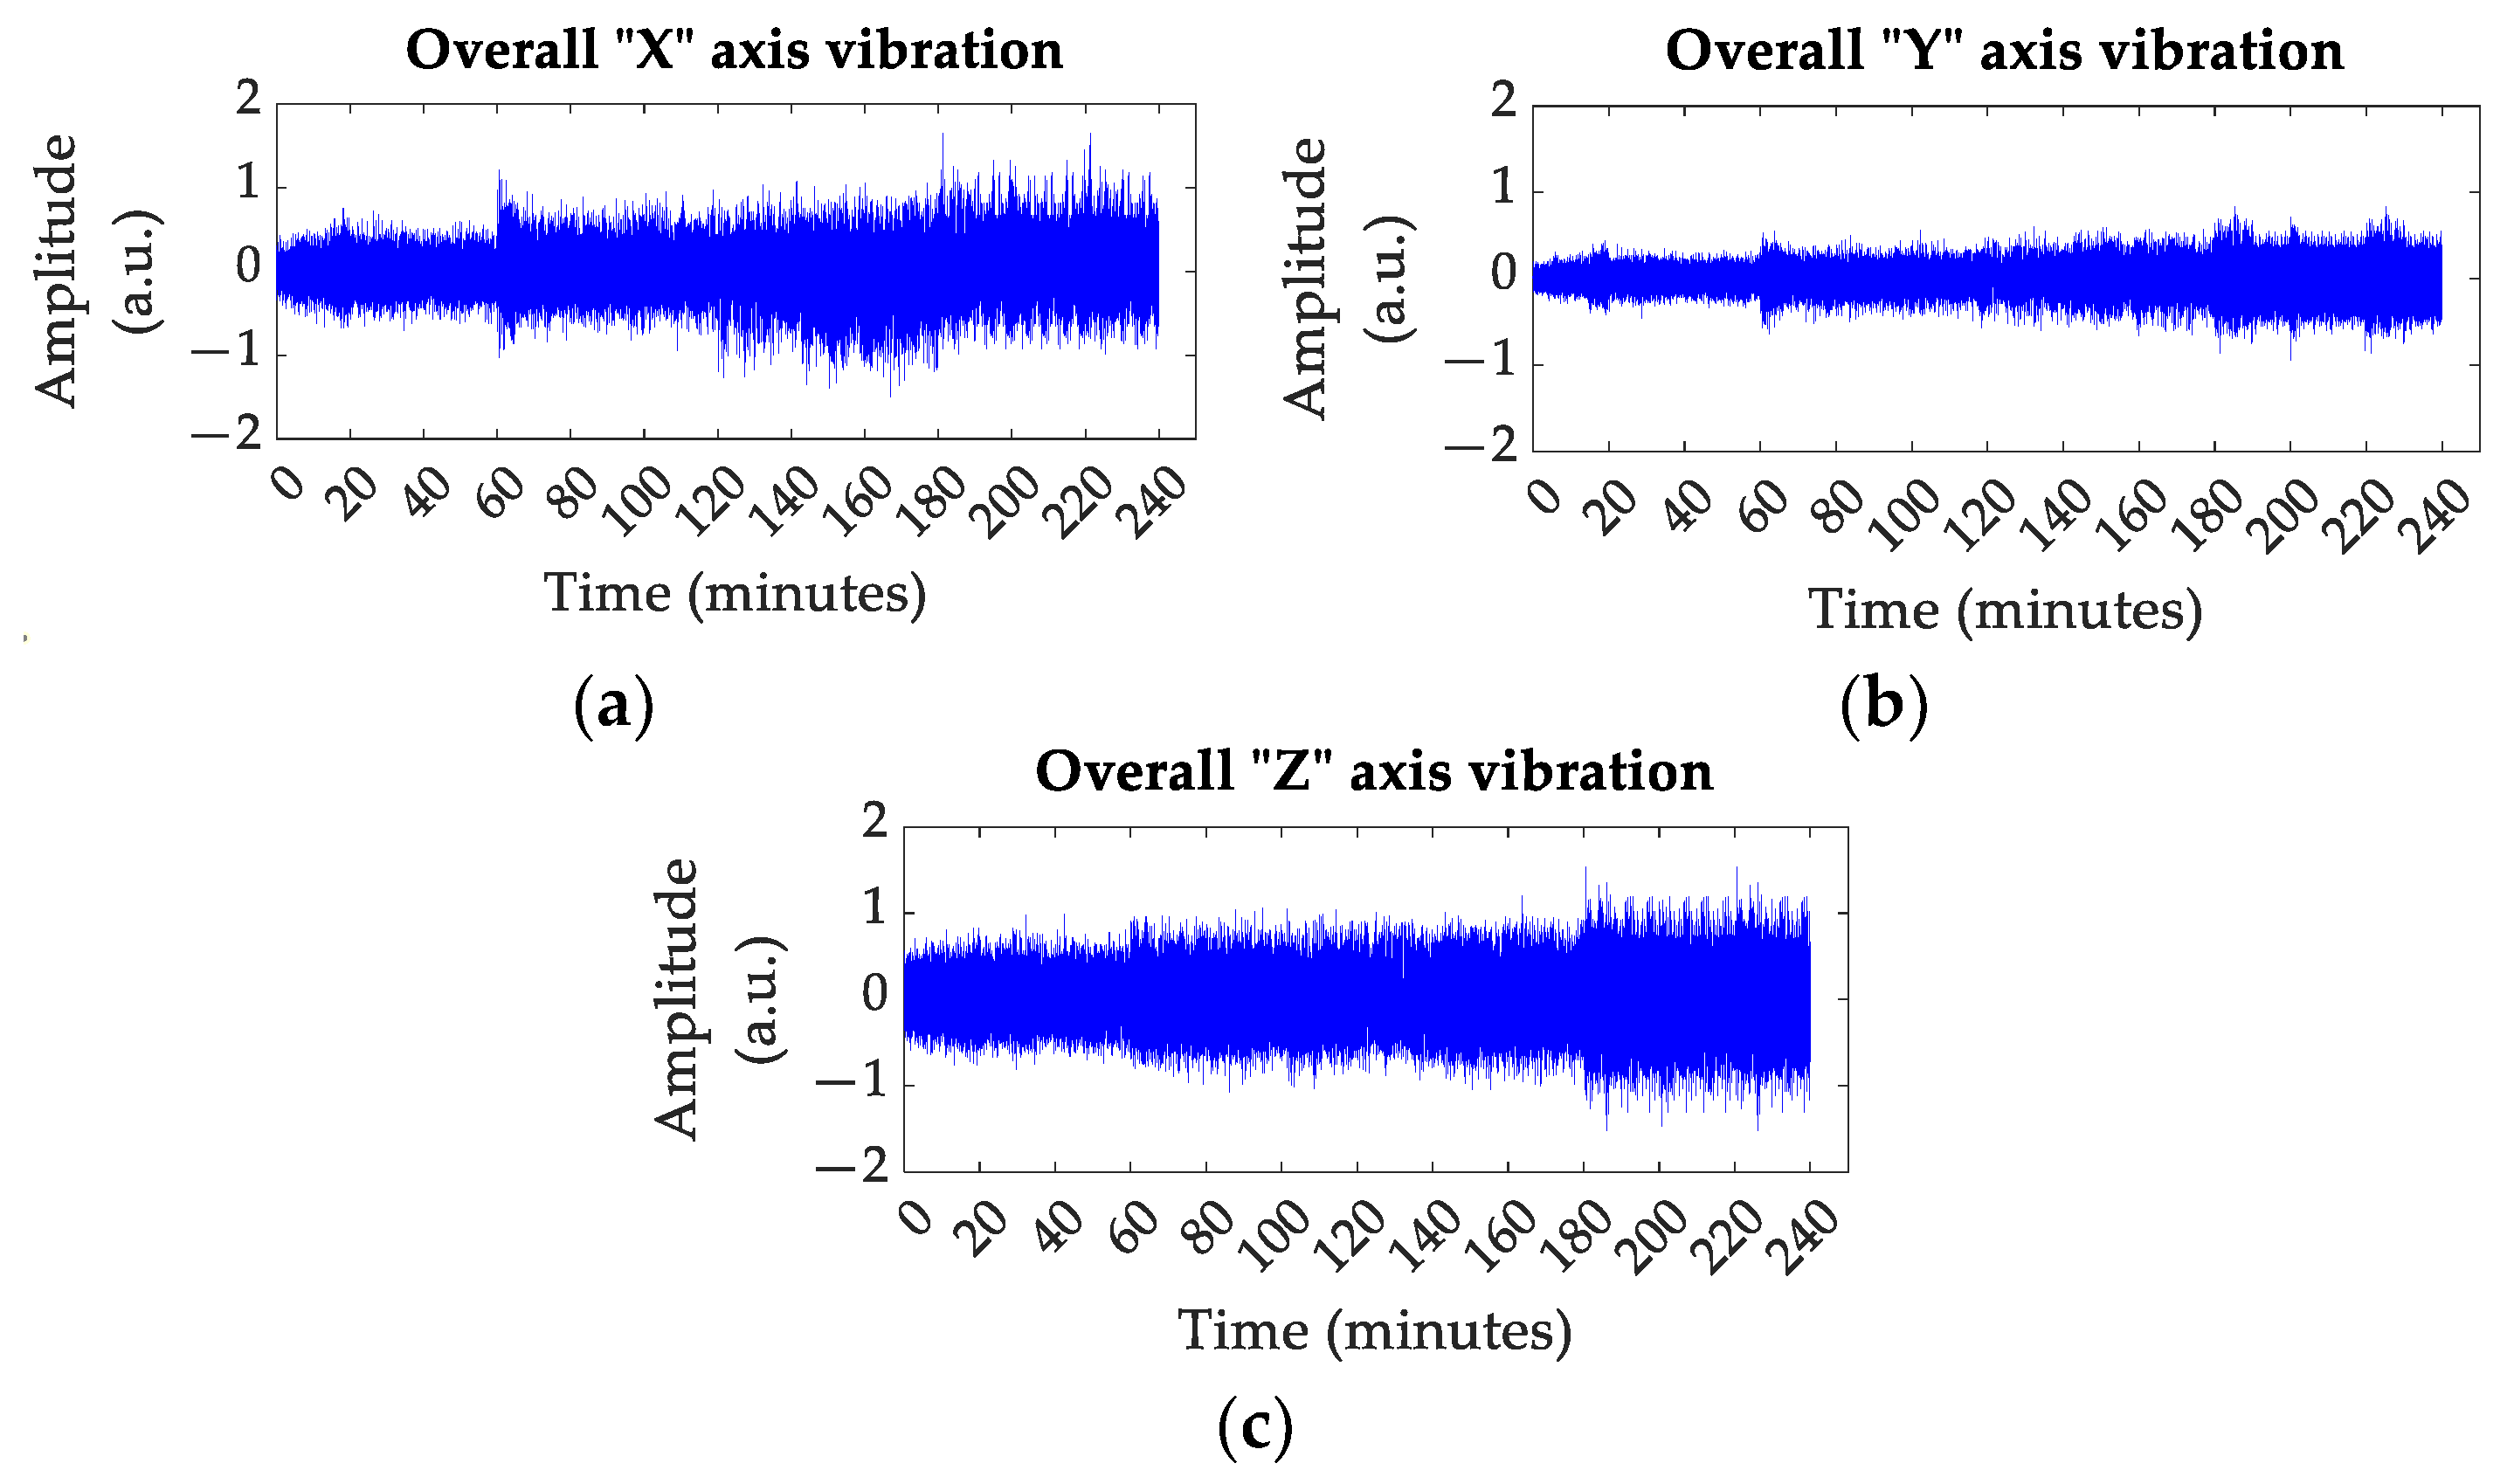
4.2. Full Vibrations Sequence per Axis
Figure 6 shows a time series corresponding to all the spring positions in the same sequence for simulation of growing synthetic failure, where the spectral behavior of failure is also generated as it can see further at
6. Model of vibrations.
By processing the signals obtained from the accelerometer, the vibrations are found to increase in amplitude when simulating synthetic failure situations. However, there is a balance between axes when there is an increase in vibration present in any axis; moreover, it can be determined for a single axis because the accelerometer measures vibrations in three axes, and each signal that the accelerometer reacts to vibration on a different axis [
35].
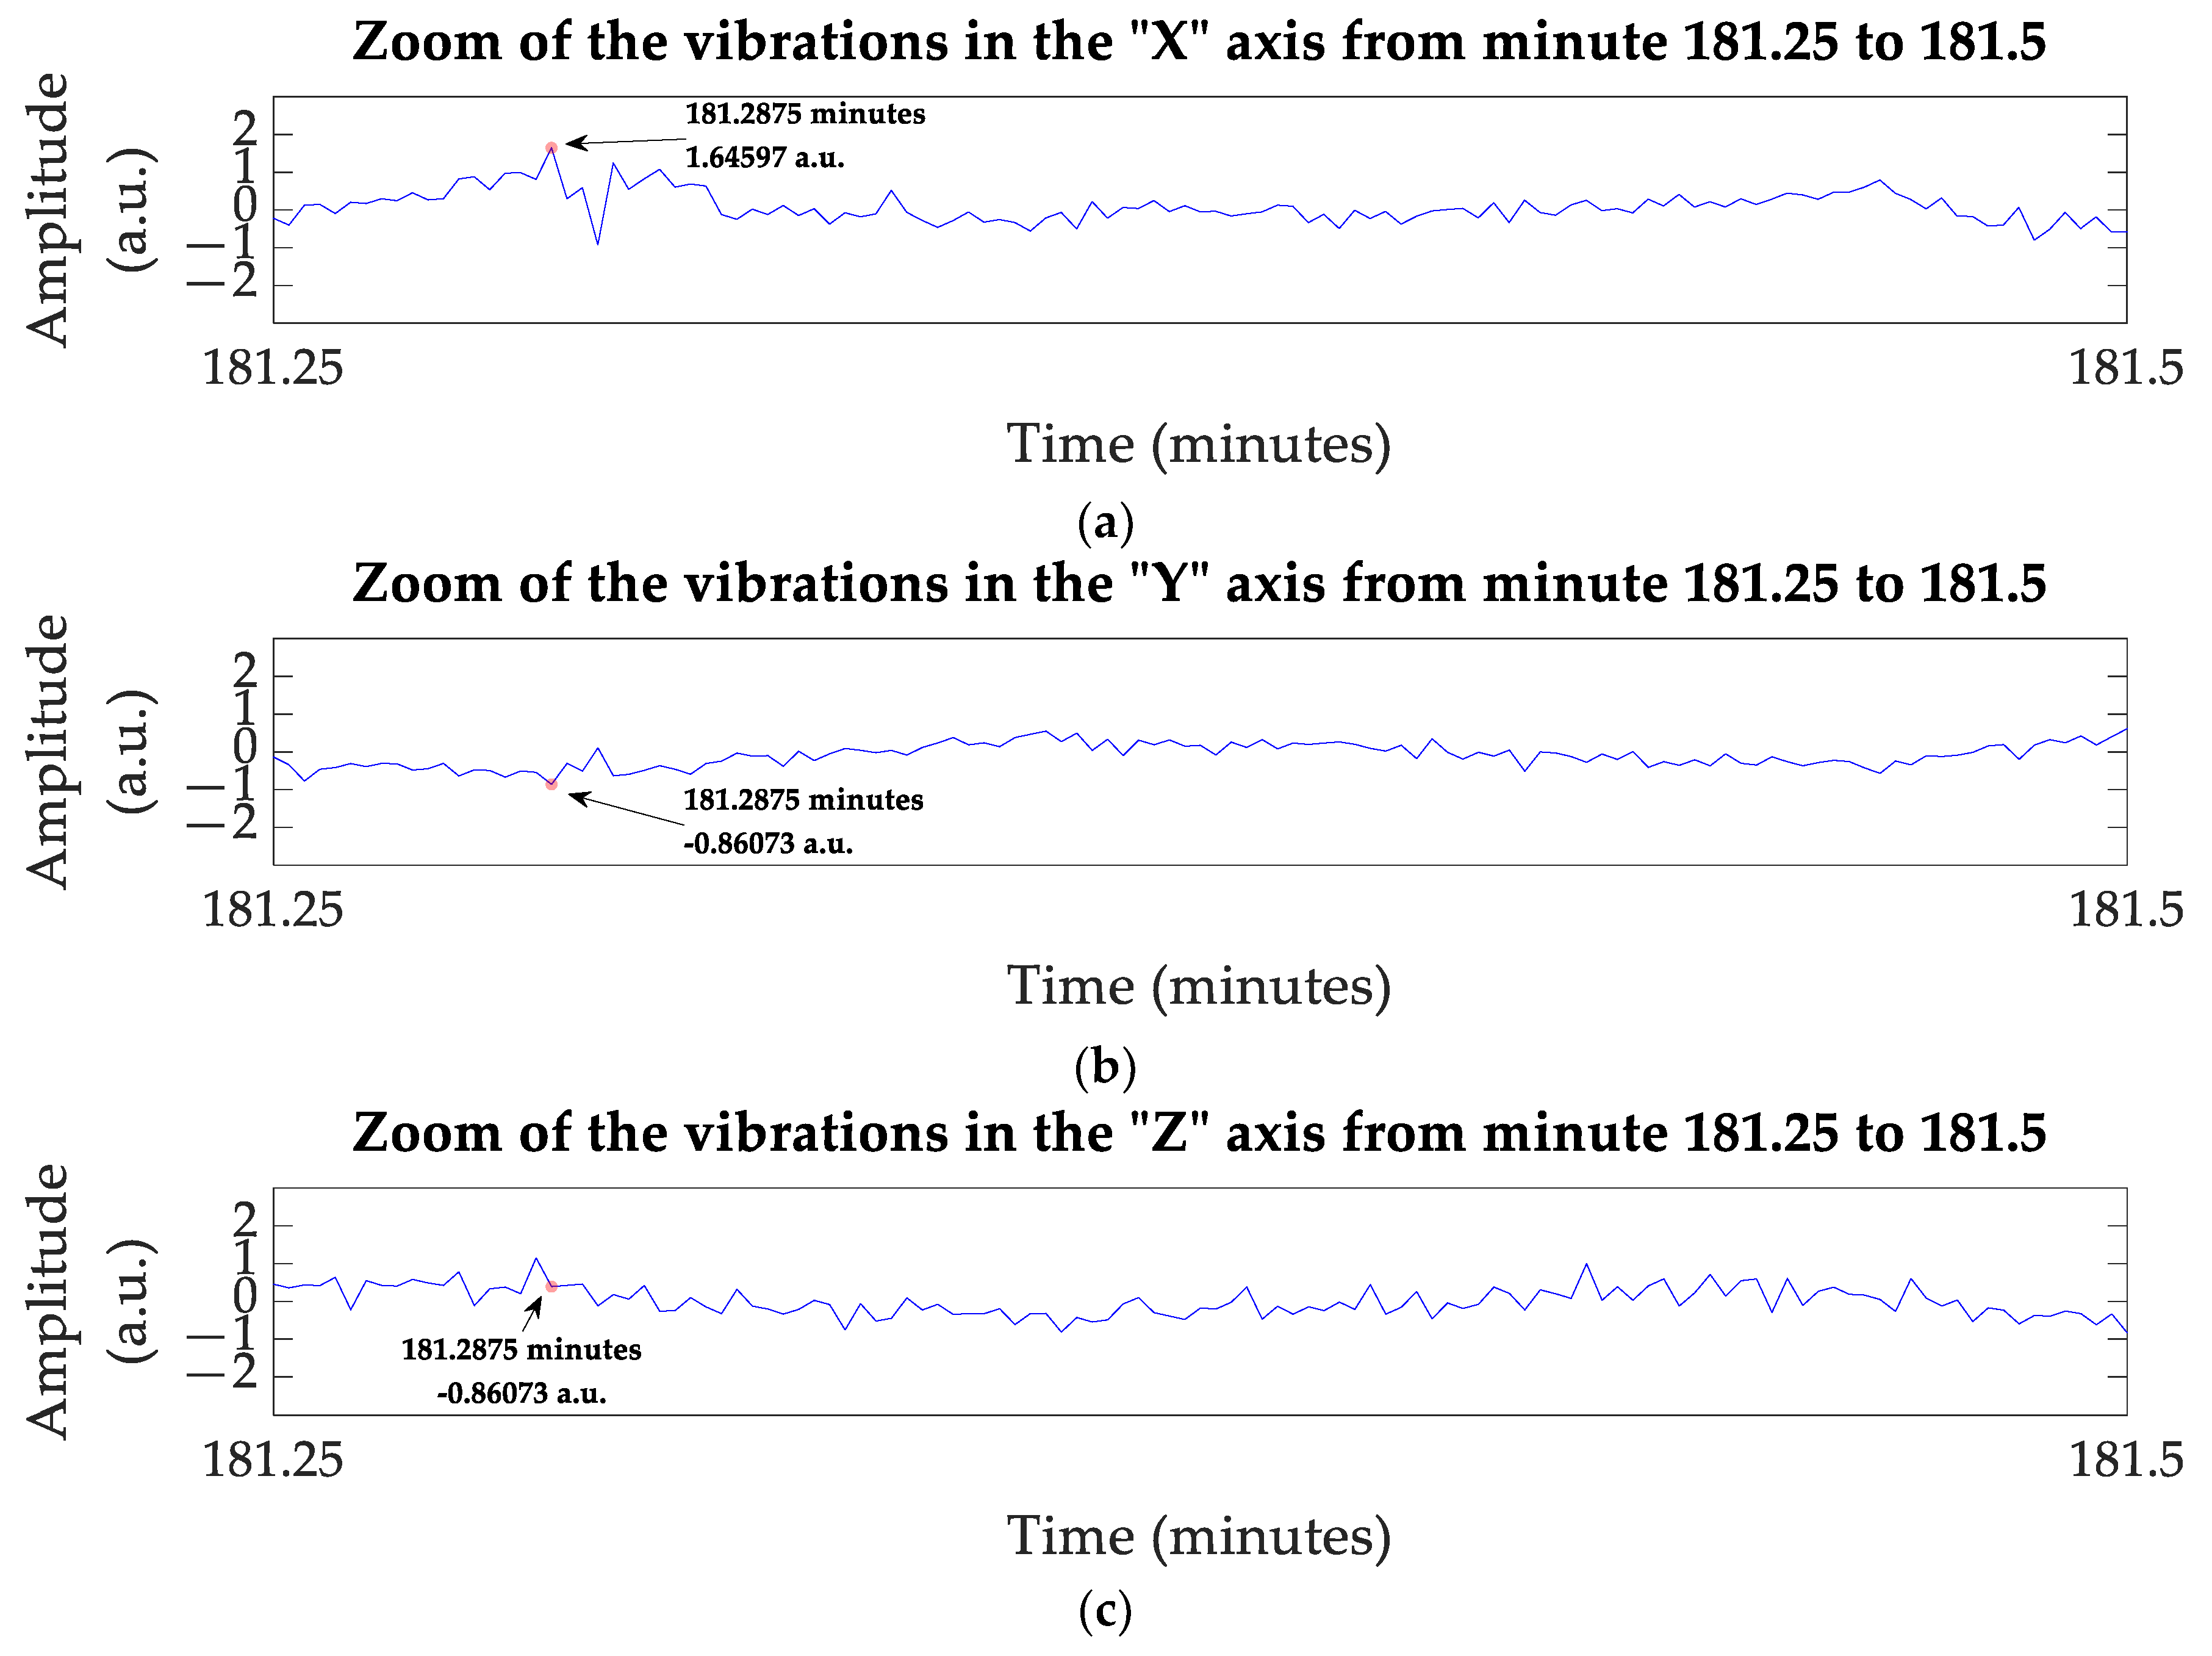
Figure 7 shows a perturbation in the system in all three axes, where the “X” and “Z” axes experience an increase in the positive amplitude of the vibration between 181 and 182 min (as indicated by the oval in
Figure 7a).
Figure 8 shows a zoom from minute 181.25 to 181.5, demonstrating the balance mentioned at minute 181.27, where the “X” axis is the one that receives the highest positive amplitude, giving a peak of 1.645 a.u. (
Figure 8a) while the “Y” axis has a negative peak of −0.860 a.u. (
Figure 8b), and the Z axis does not reach a maximum peak, but shows a positive amplitude, reaching 0.391 a.u. (
Figure 8c). In
Figure 8b, the “Z” axis does not reach a maximum peak, but shows a positive amplitude, reaching 0.391 a.u. (
Figure 8c); on the other hand, in
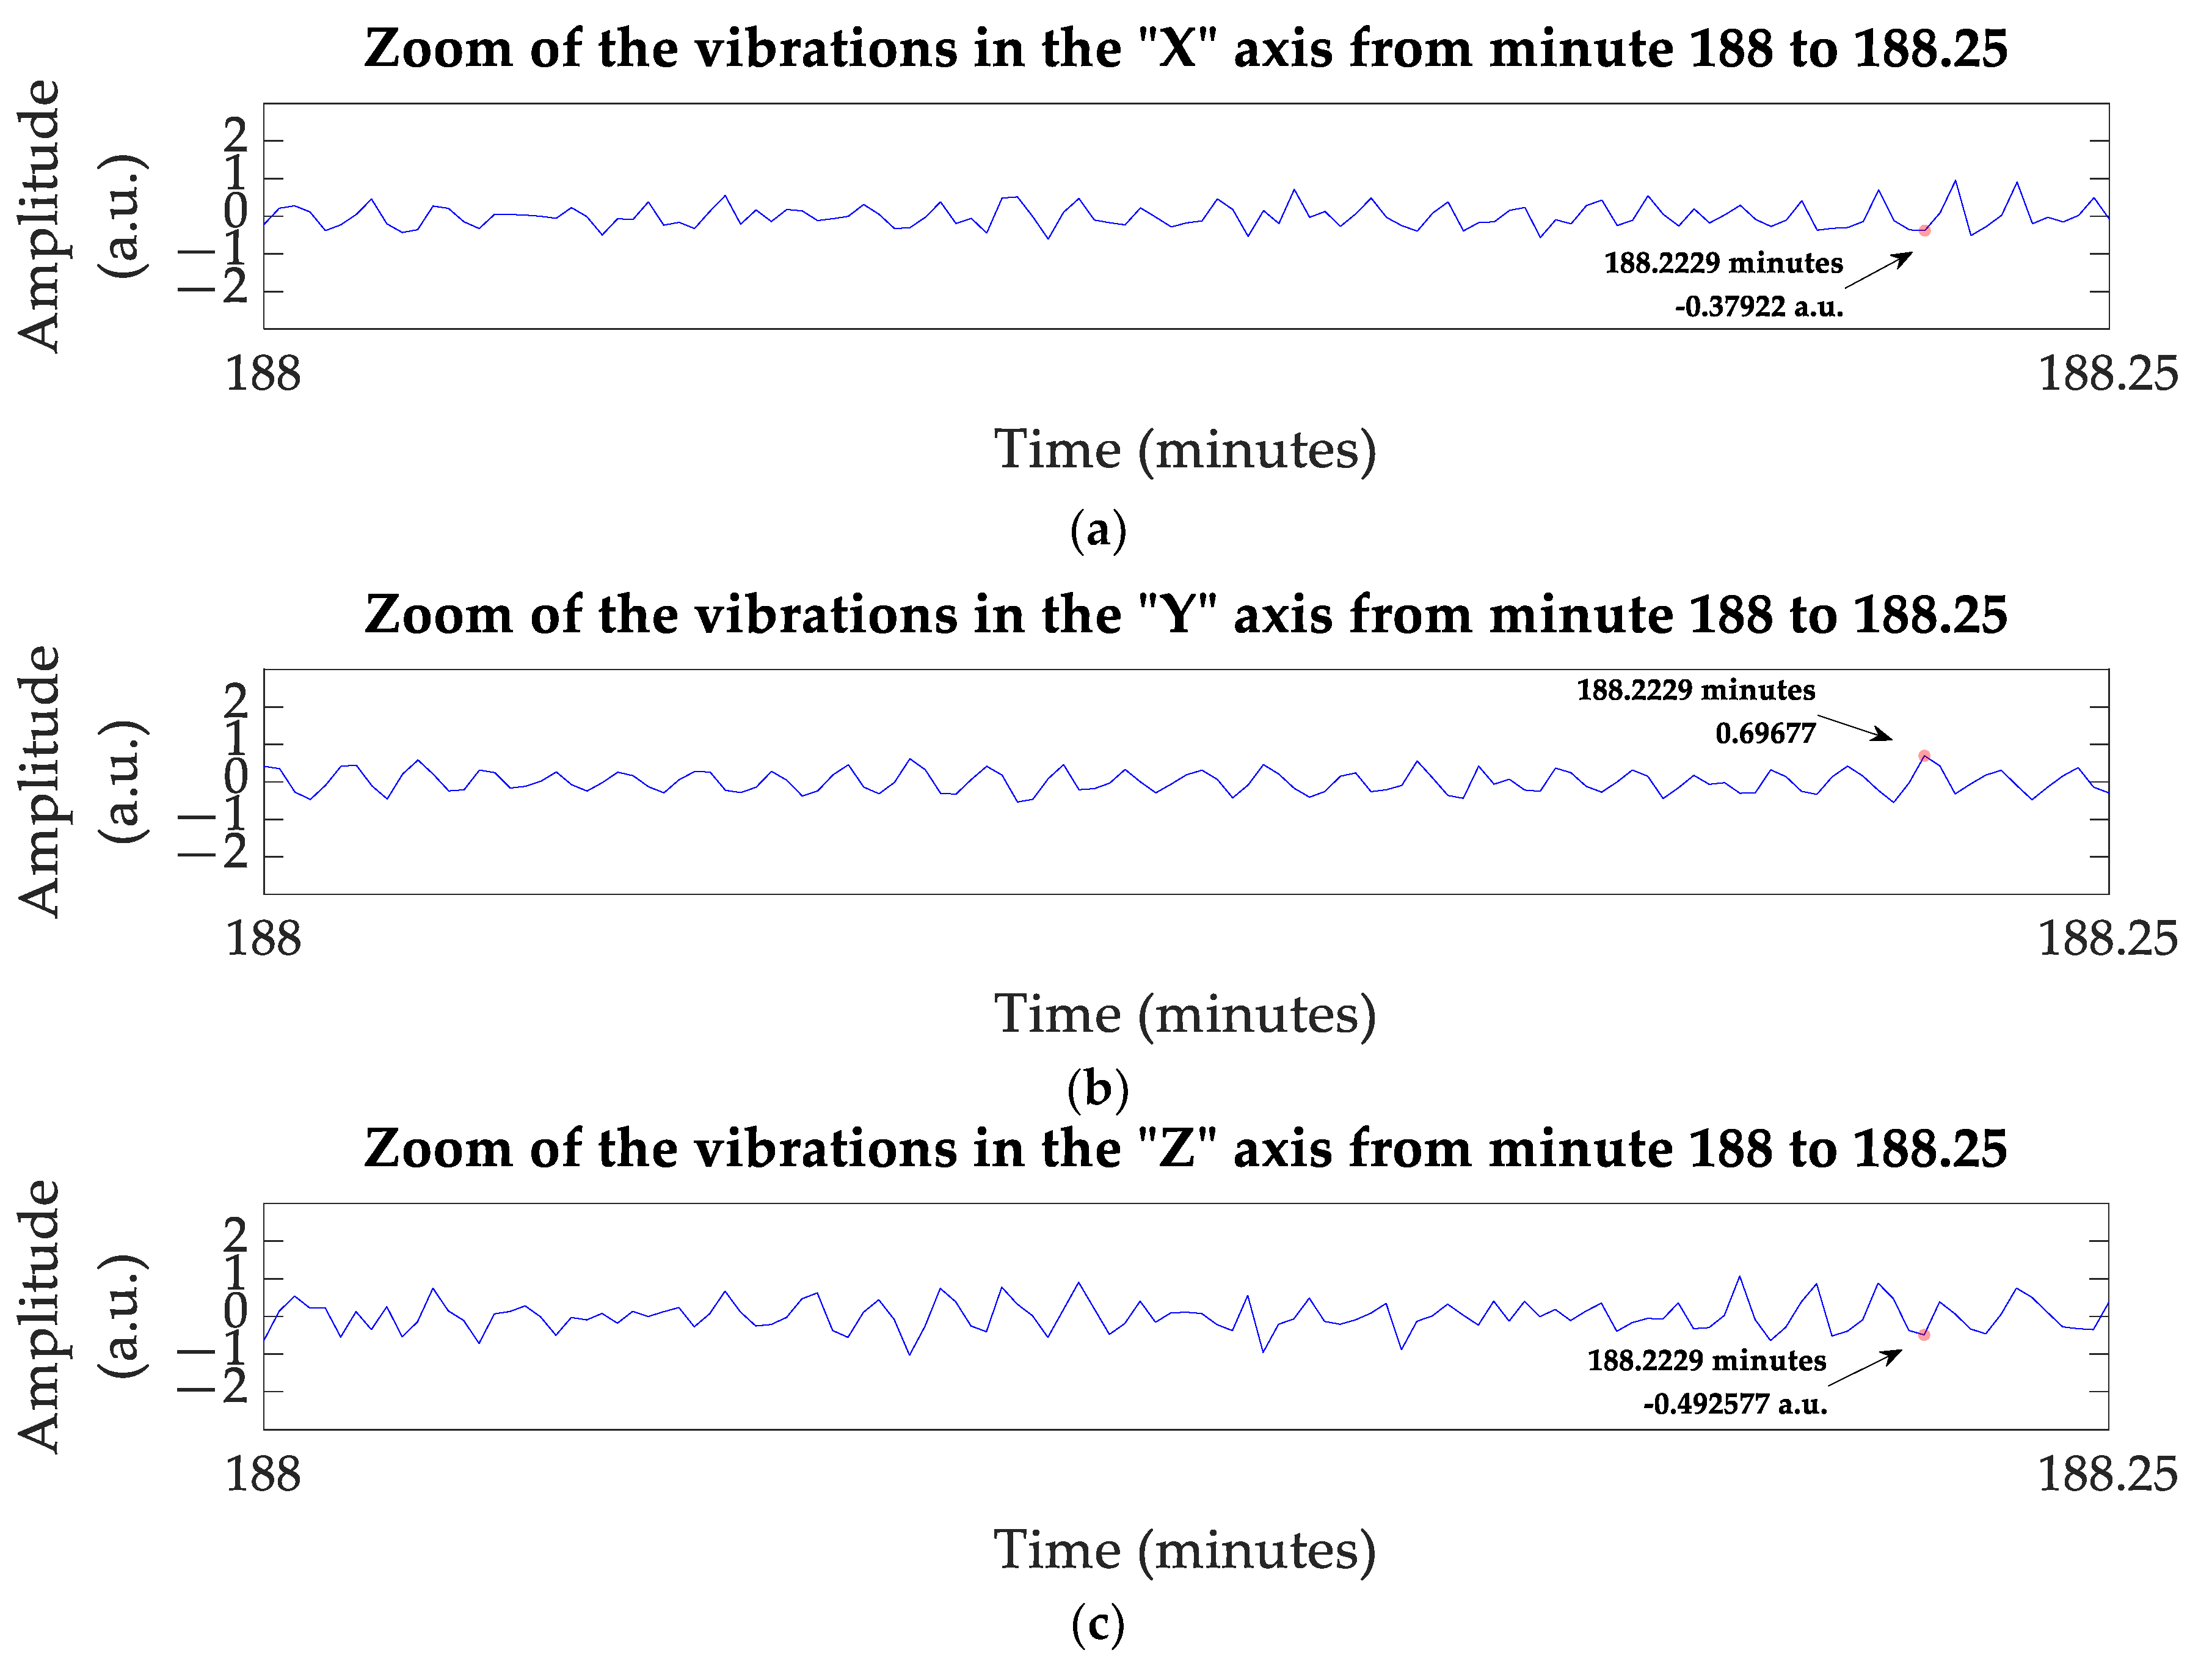
Figure 9 it shows a zoom from minute 188 to 188.25. The “Y” axis is the one that receives the highest positive amplitude at minute 188.22, having a peak of 0.696 a.u. (
Figure 9a), while the “Z” axis has a maximum negative peak of −0.492 a.u. (
Figure 9b) and the “X” axis does not reach its maximum negative peak, with amplitude of −0.379 a.u. (
Figure 9c). In contrast,
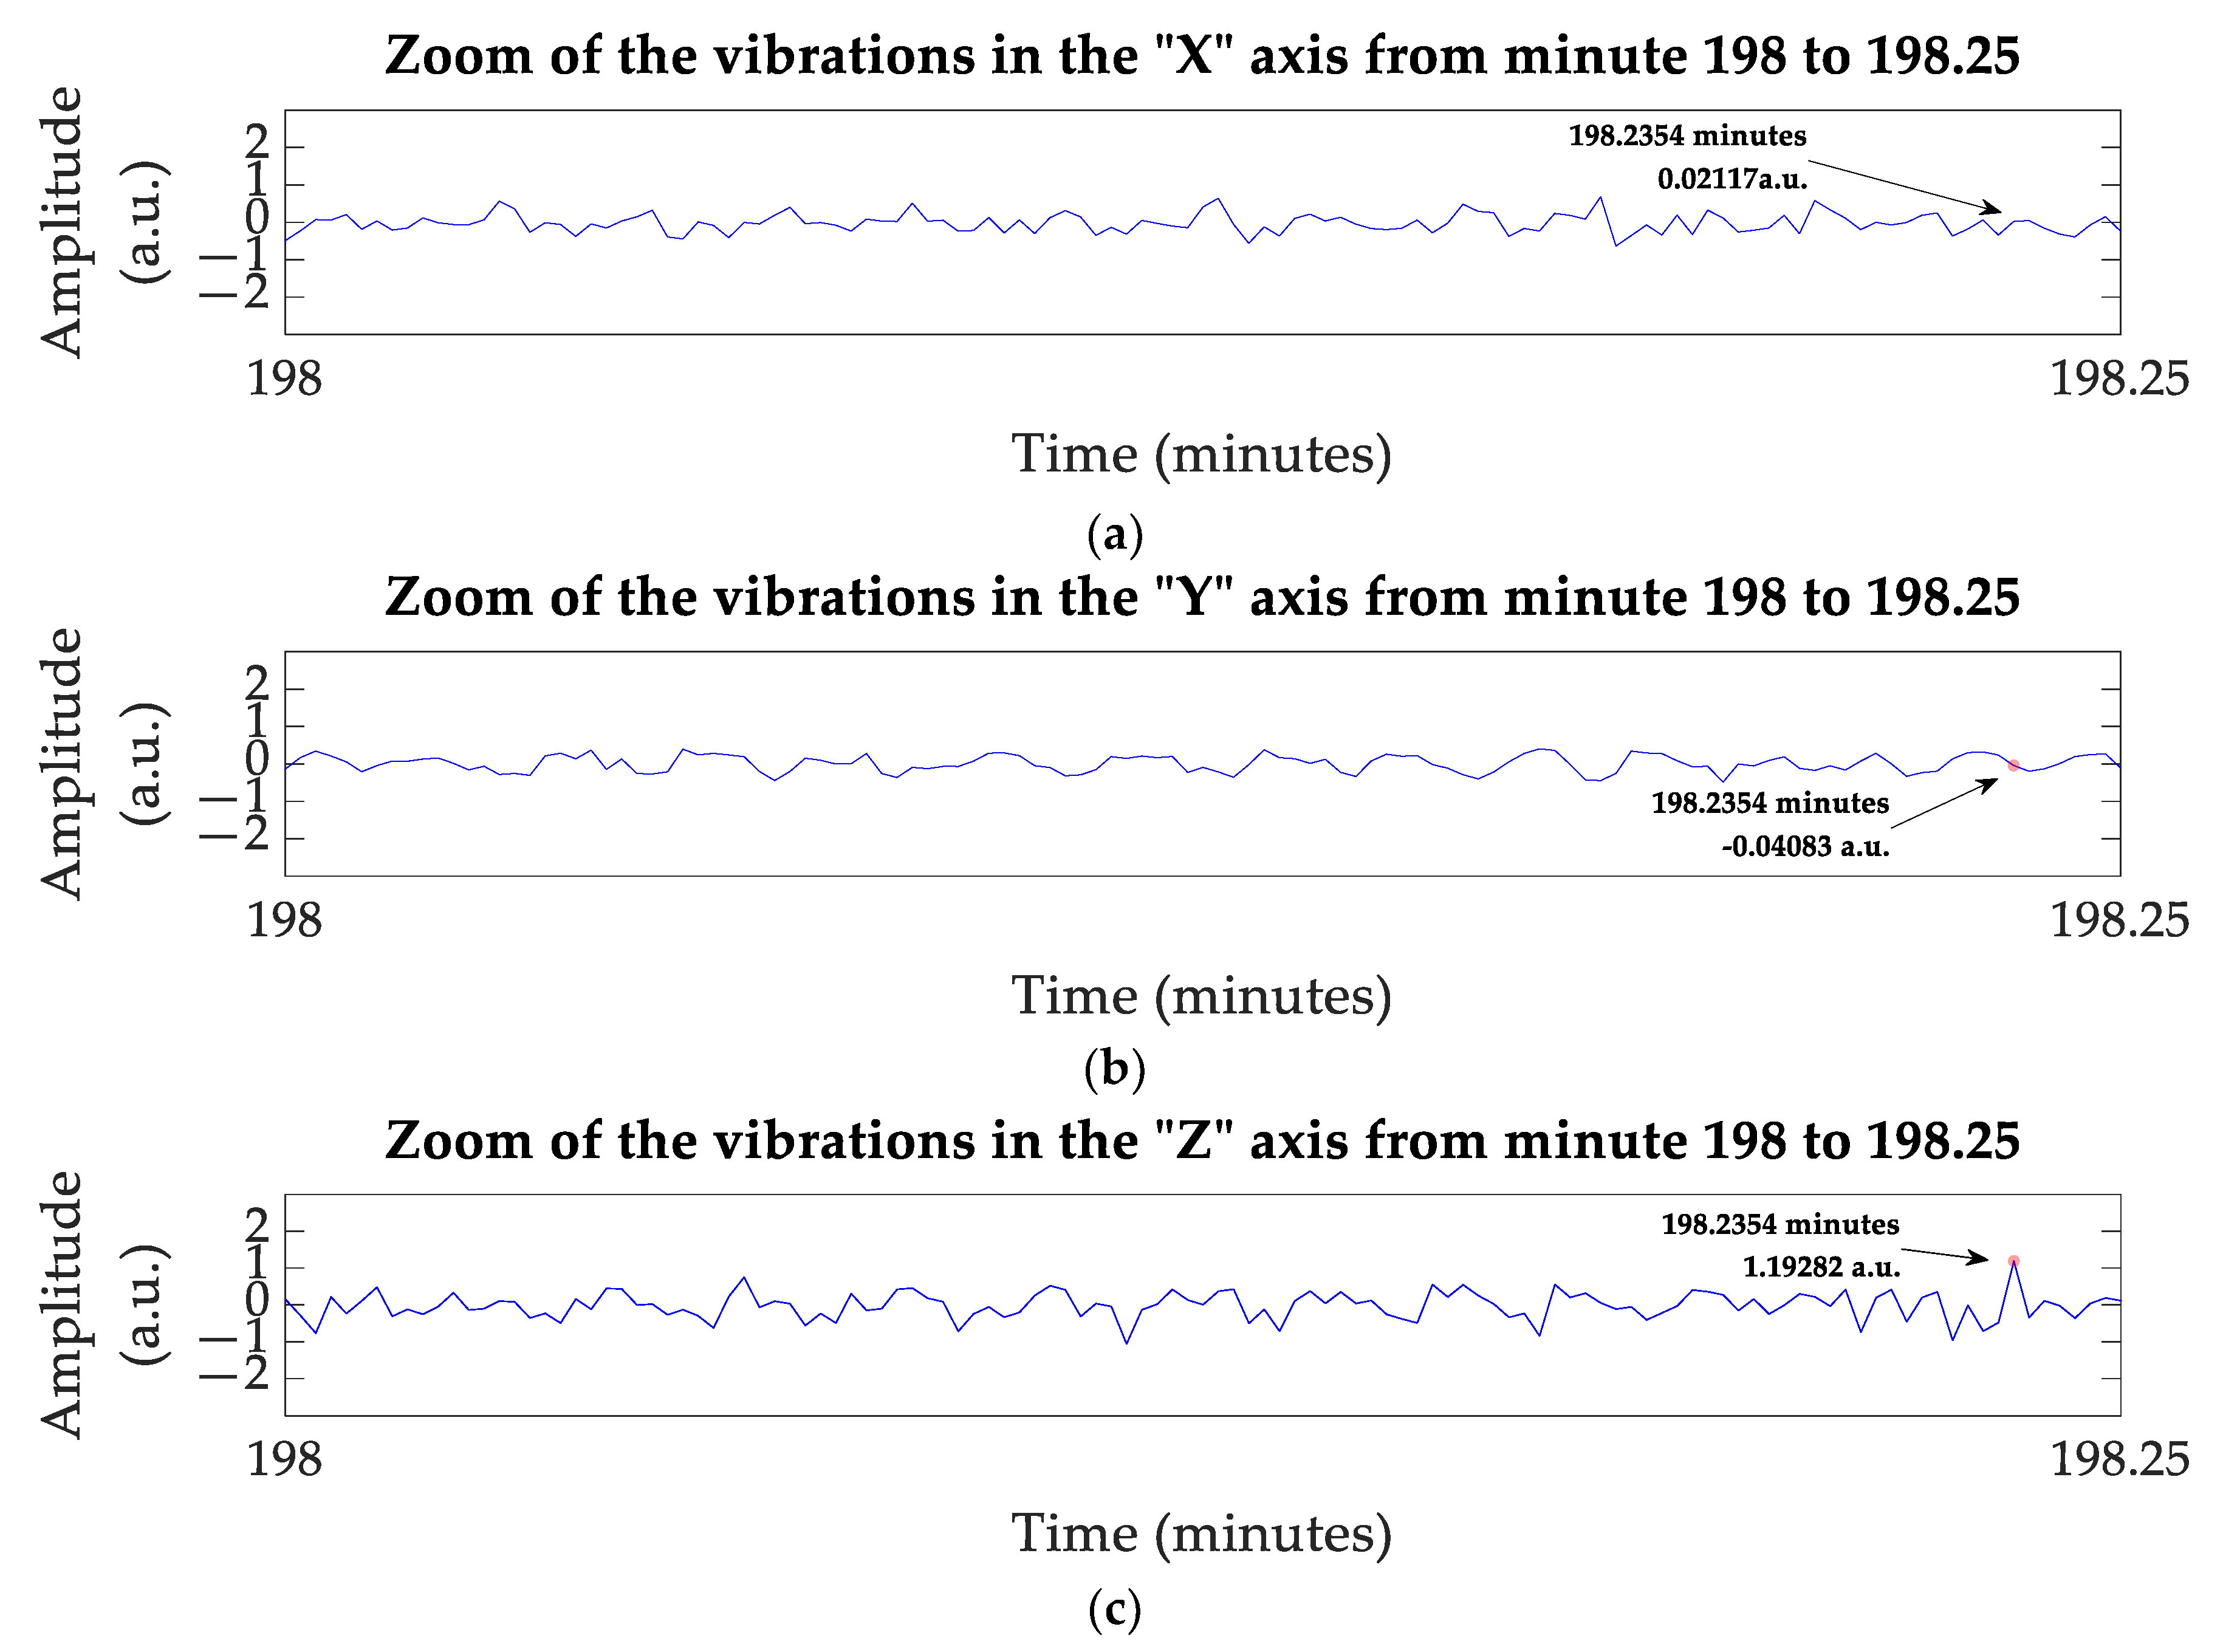
Figure 10 shows a zoom from minute 198 to minute 198.25, where the “Z” axis is the one that receives the highest positive amplitude at minute 198.23, giving a peak of 1.192 a.u. (
Figure 10a), while the “Y” axis has a negative peak of −0.040 a.u. (
Figure 10b); interestingly, the “X” axis does not reach a maximum positive peak, reaching −0.021 a.u. (
Figure 10c).
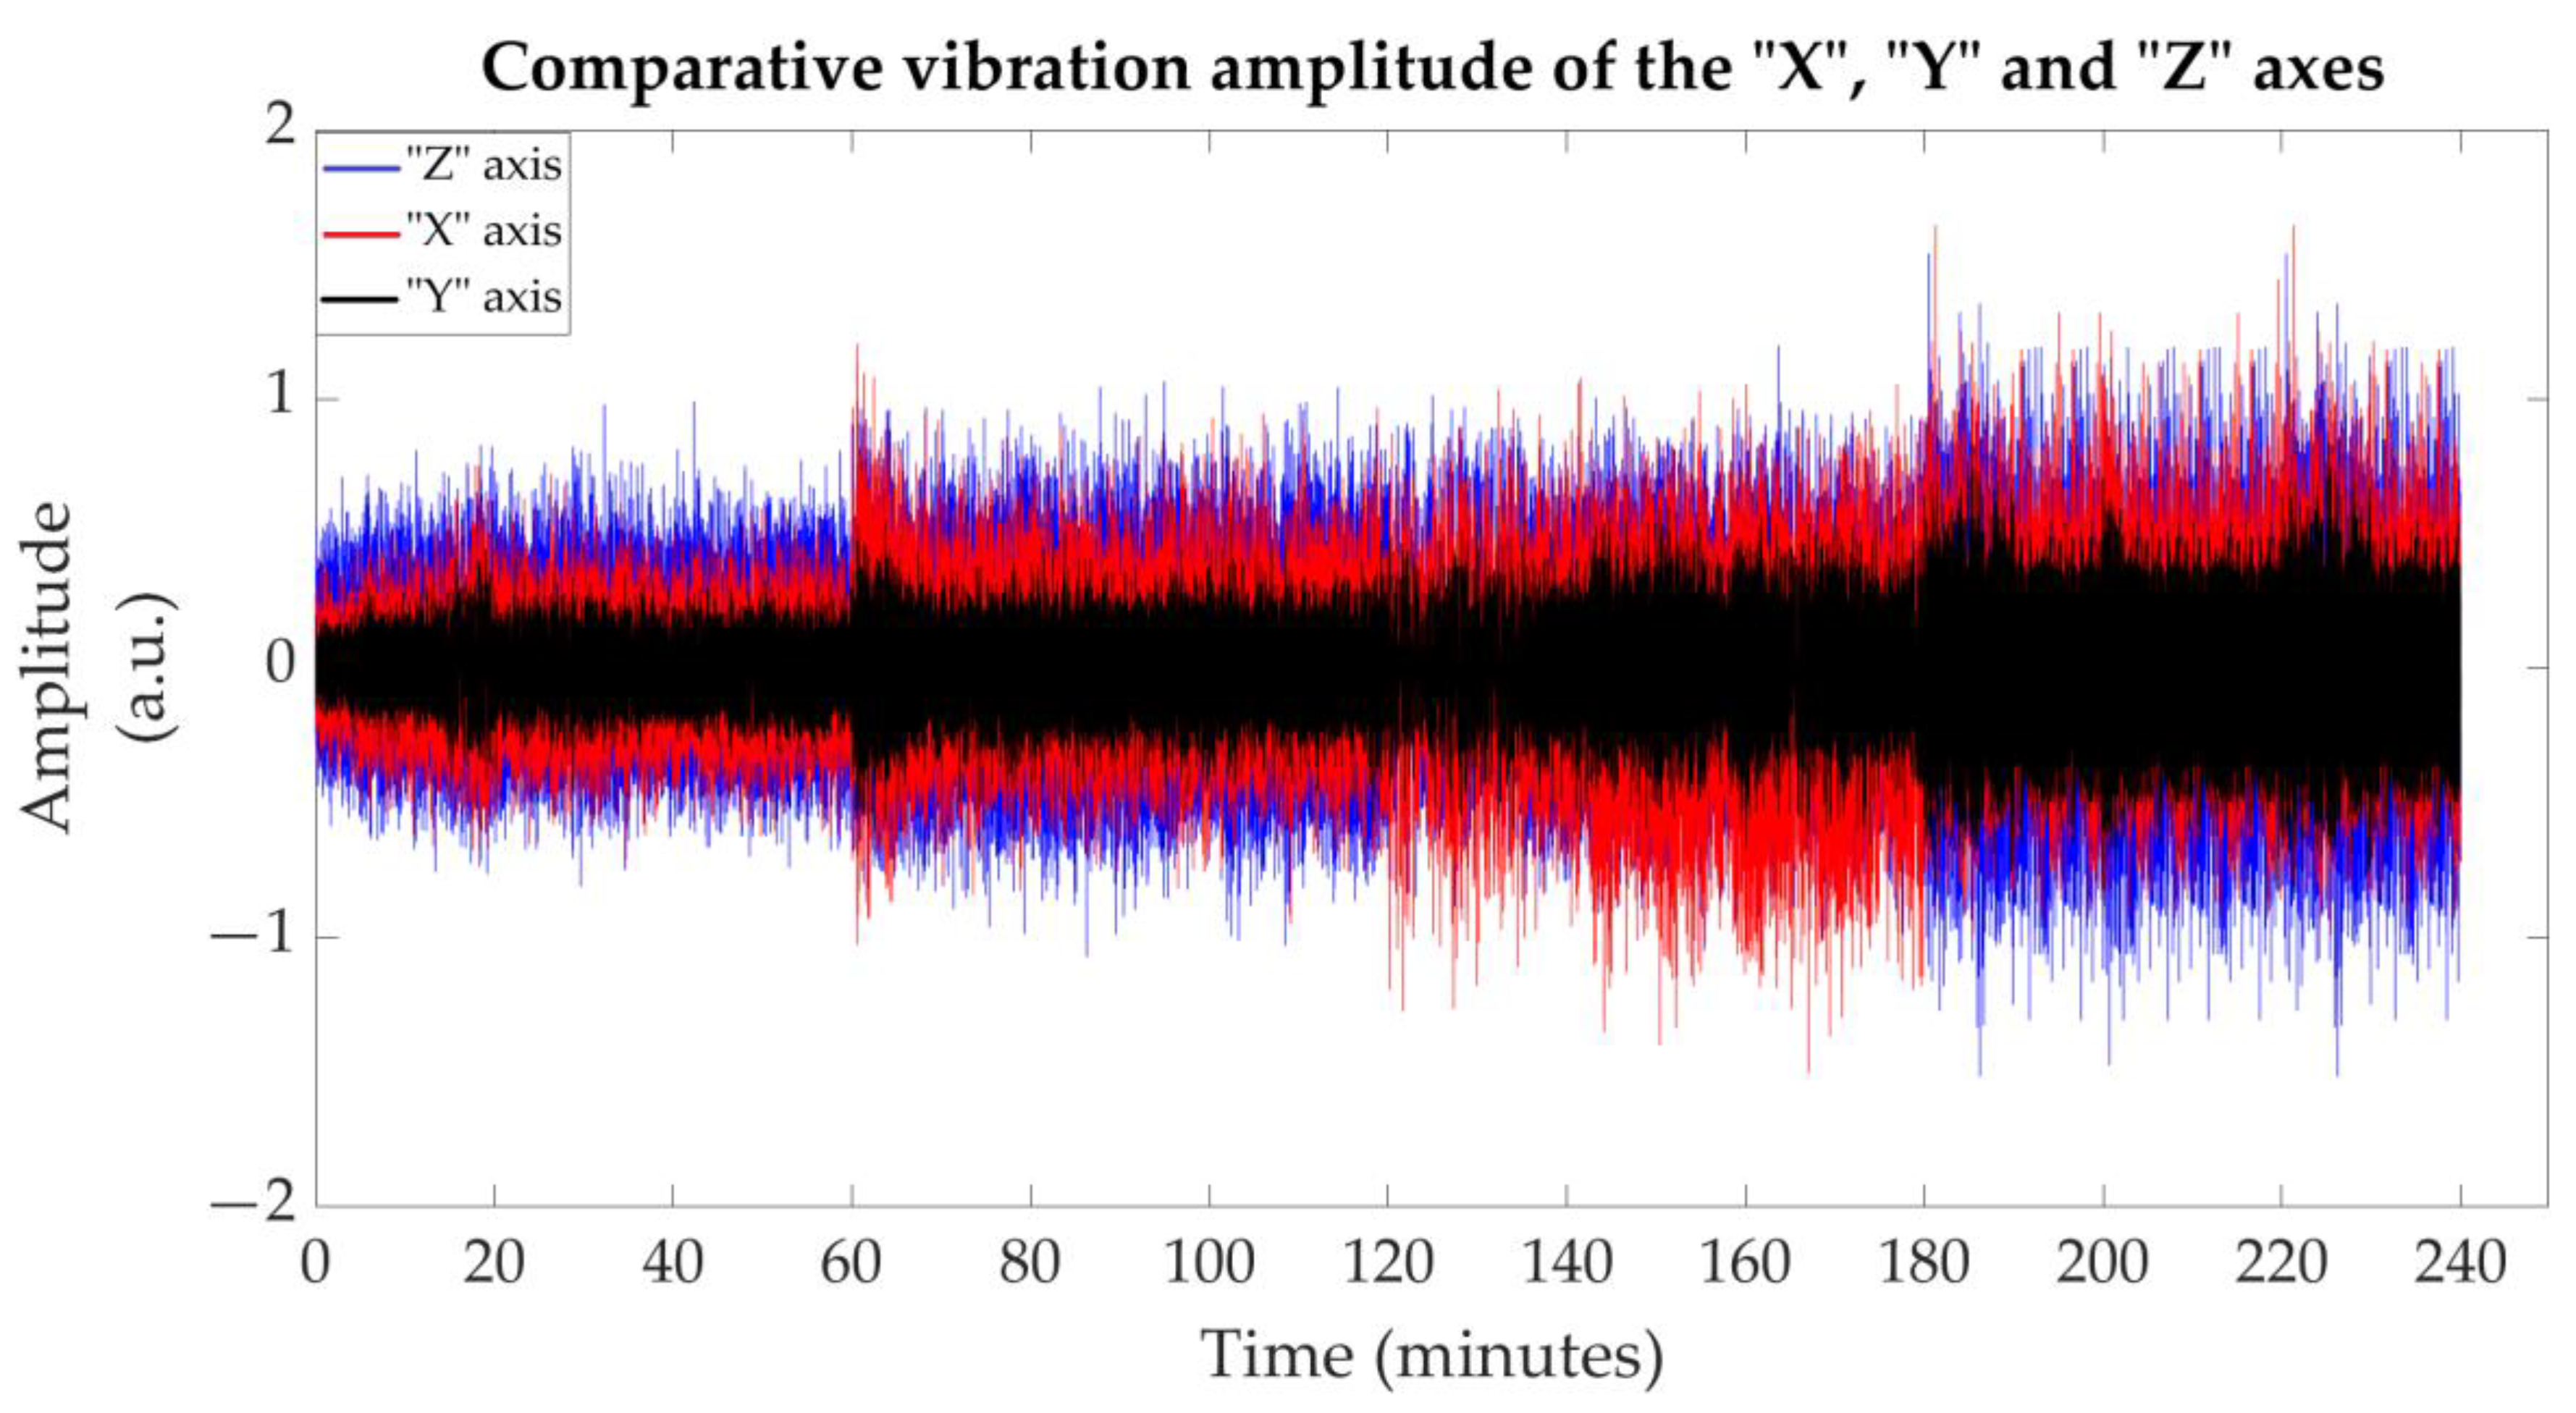
Figure 11 shows a graph with the “X”, “Y” and “Z” axes joined, showing the increase in vibrations according to the scenario; extraordinarily, it shows outstanding pulses. The authors Fajar Aswin and Zaldy Sirwansyah Suzen [
26], proposed a similar vibrations analysis and they concluded that is noise caused by electrical frequency. On the other hand, interestingly, in the Donatella Zappalá [
21] work, the signals were noted as noise; however, they stated that these signals were found due to a rotor imbalance. Therefore, these signals obtained in this work will be considered for future study.
The “Z” axis has the greatest amplitude due to flapping of the vane.
5. Results of Data Training
Neural networks usually have higher accuracy than tree predictors; however, neural networks have a larger structure and consist of a universal simplicity. However, there are complex tree predictors such as Bagged Trees, where sets and subsets are combined, which shows a greater decrease in error and show stability [
36,
37,
38].
Different machine learning methods were trained to determine a prediction model to estimate the vibration level according to vibration level (from lower to higher): 4 cm = level1, 10 cm = level2, 20 cm = level3, and 30 cm = level4. For each level, time series parameters were extracted.
The Bagged Trees model demonstrated the best performance using the following hyperparameters: Ensemble method selected type: Bag; learner type: Decision Tree; maximum number of splits: 2875; numbers of learners: 30.
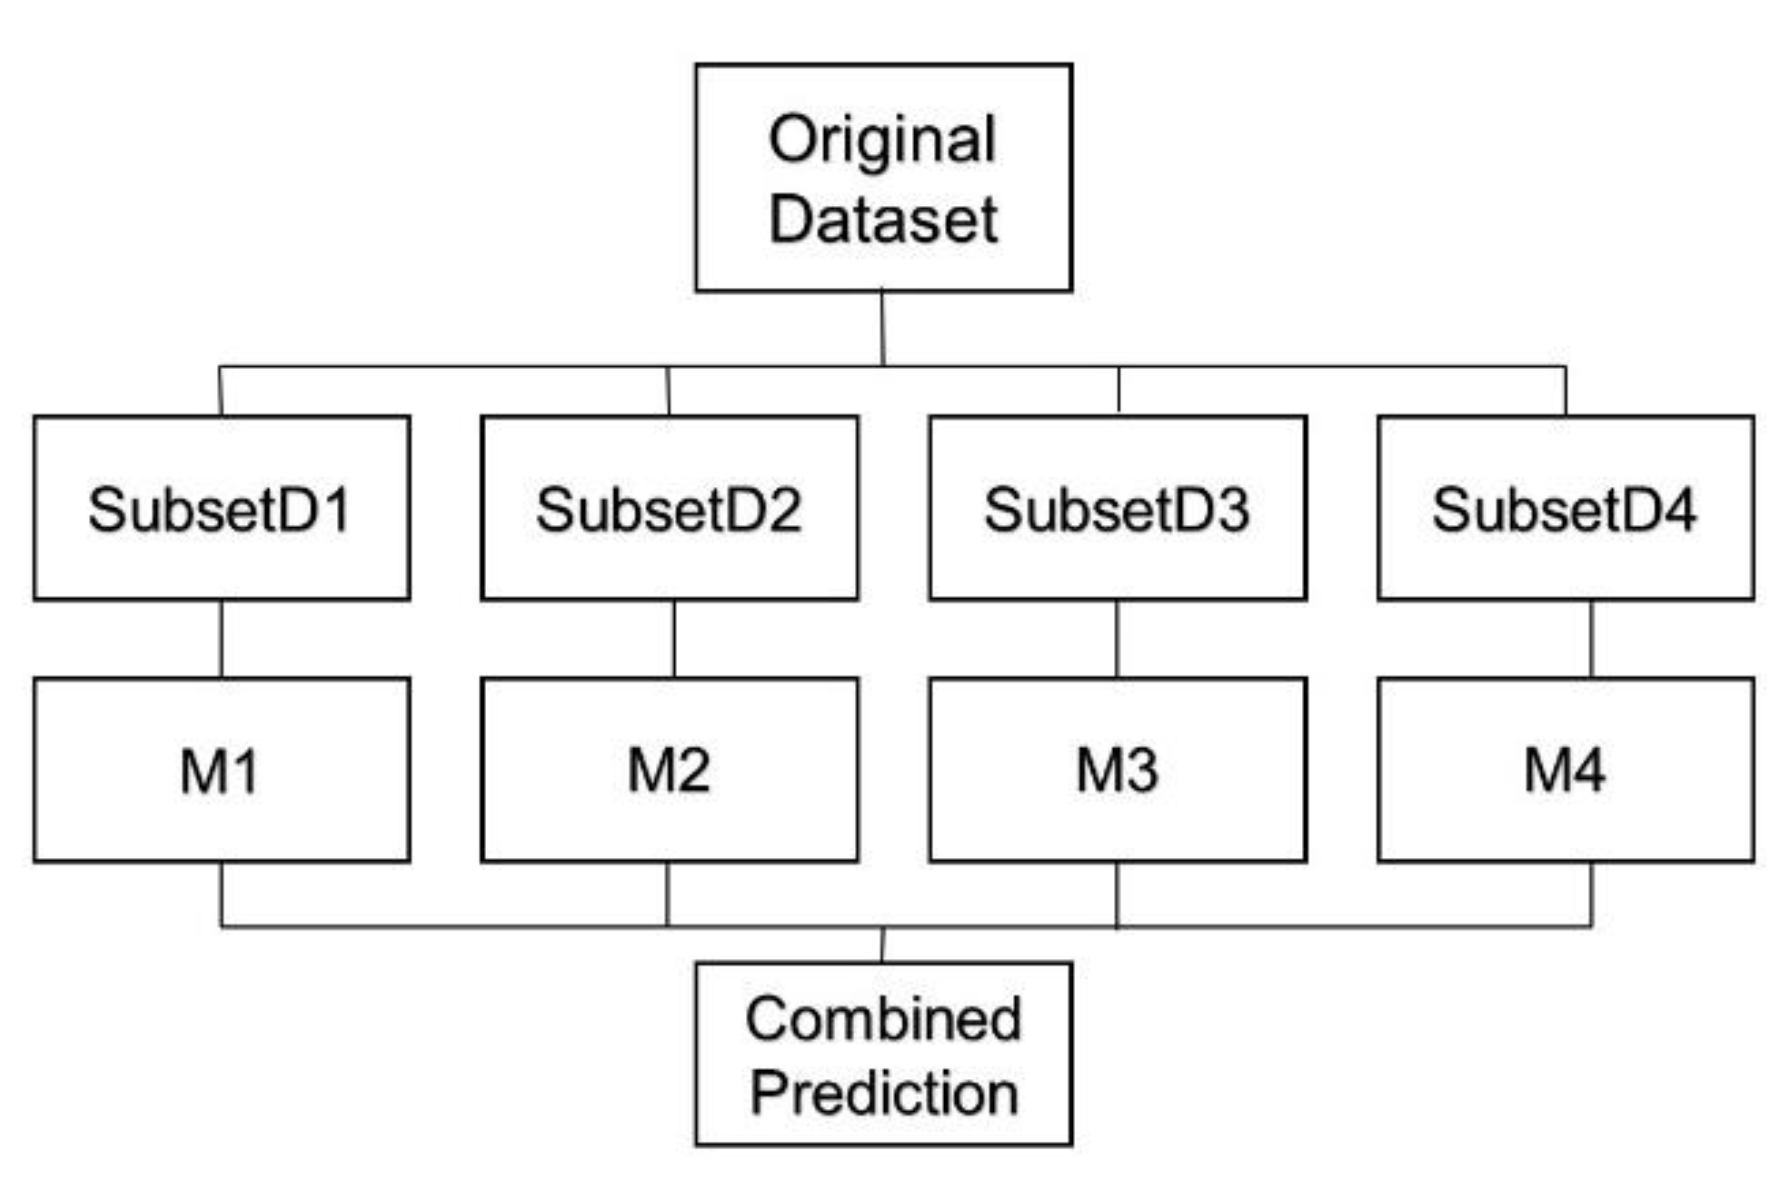
Bagged Trees is a machine learning method where multiple subsets are created from the original data set, and a base model of each subset is then created by training them independently, as shown in
Figure 12, where respective subsets are given by the blocks D1, D2, etc. The final predictions are determined by combining all subsets predictions.
The results presented for the machine learning model consist of four classes according to levels in which the data collected from data monitoring were used in training, as indicated in
Section 3. Each group went through a training and validation process.
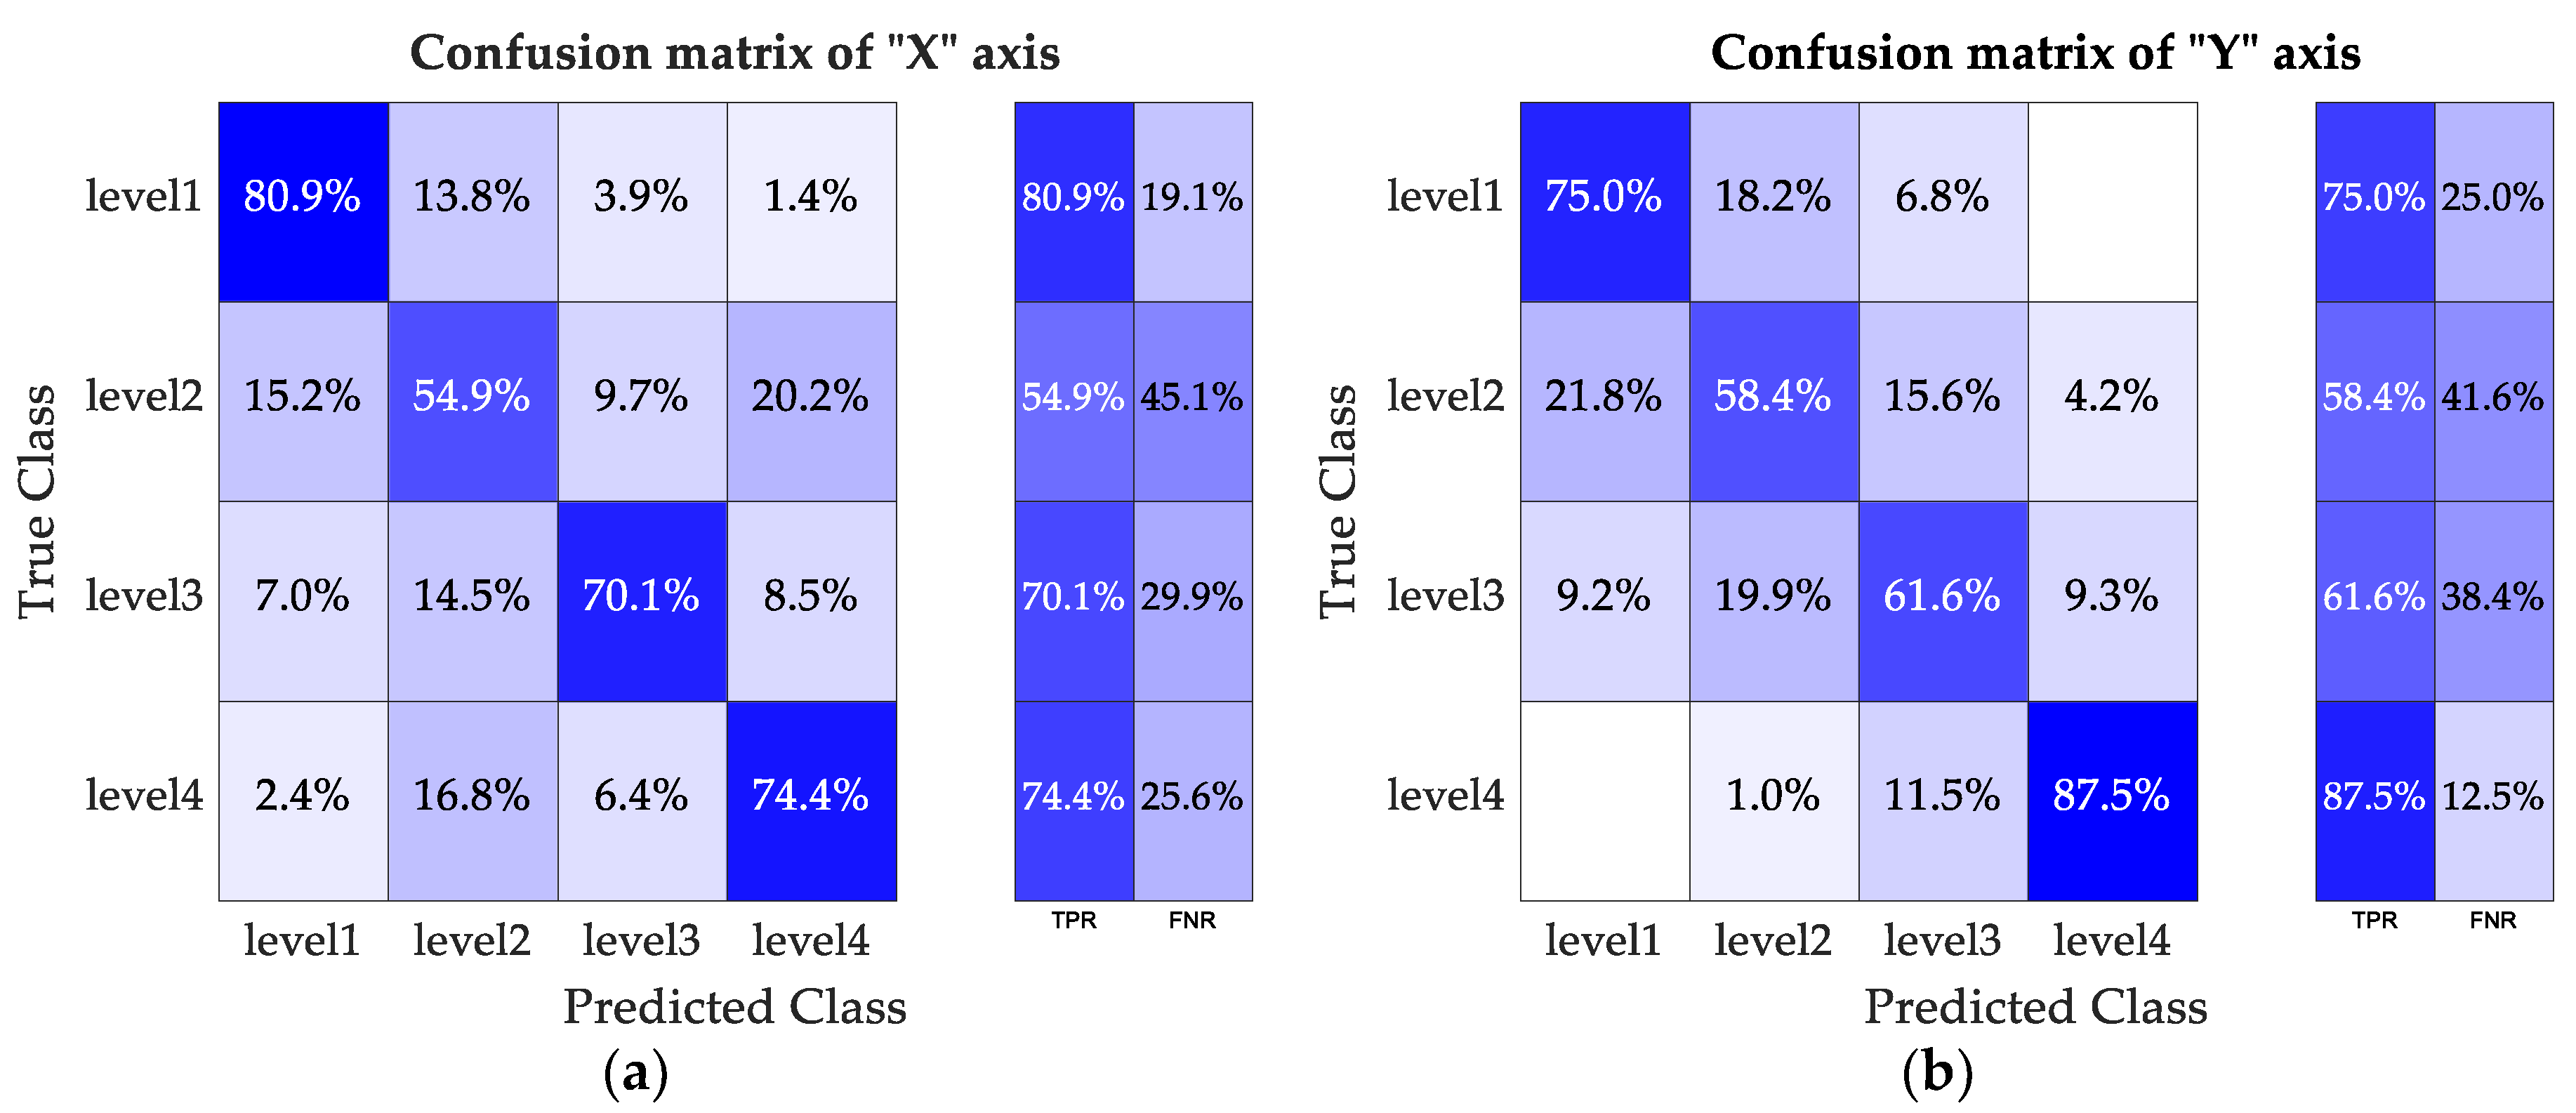
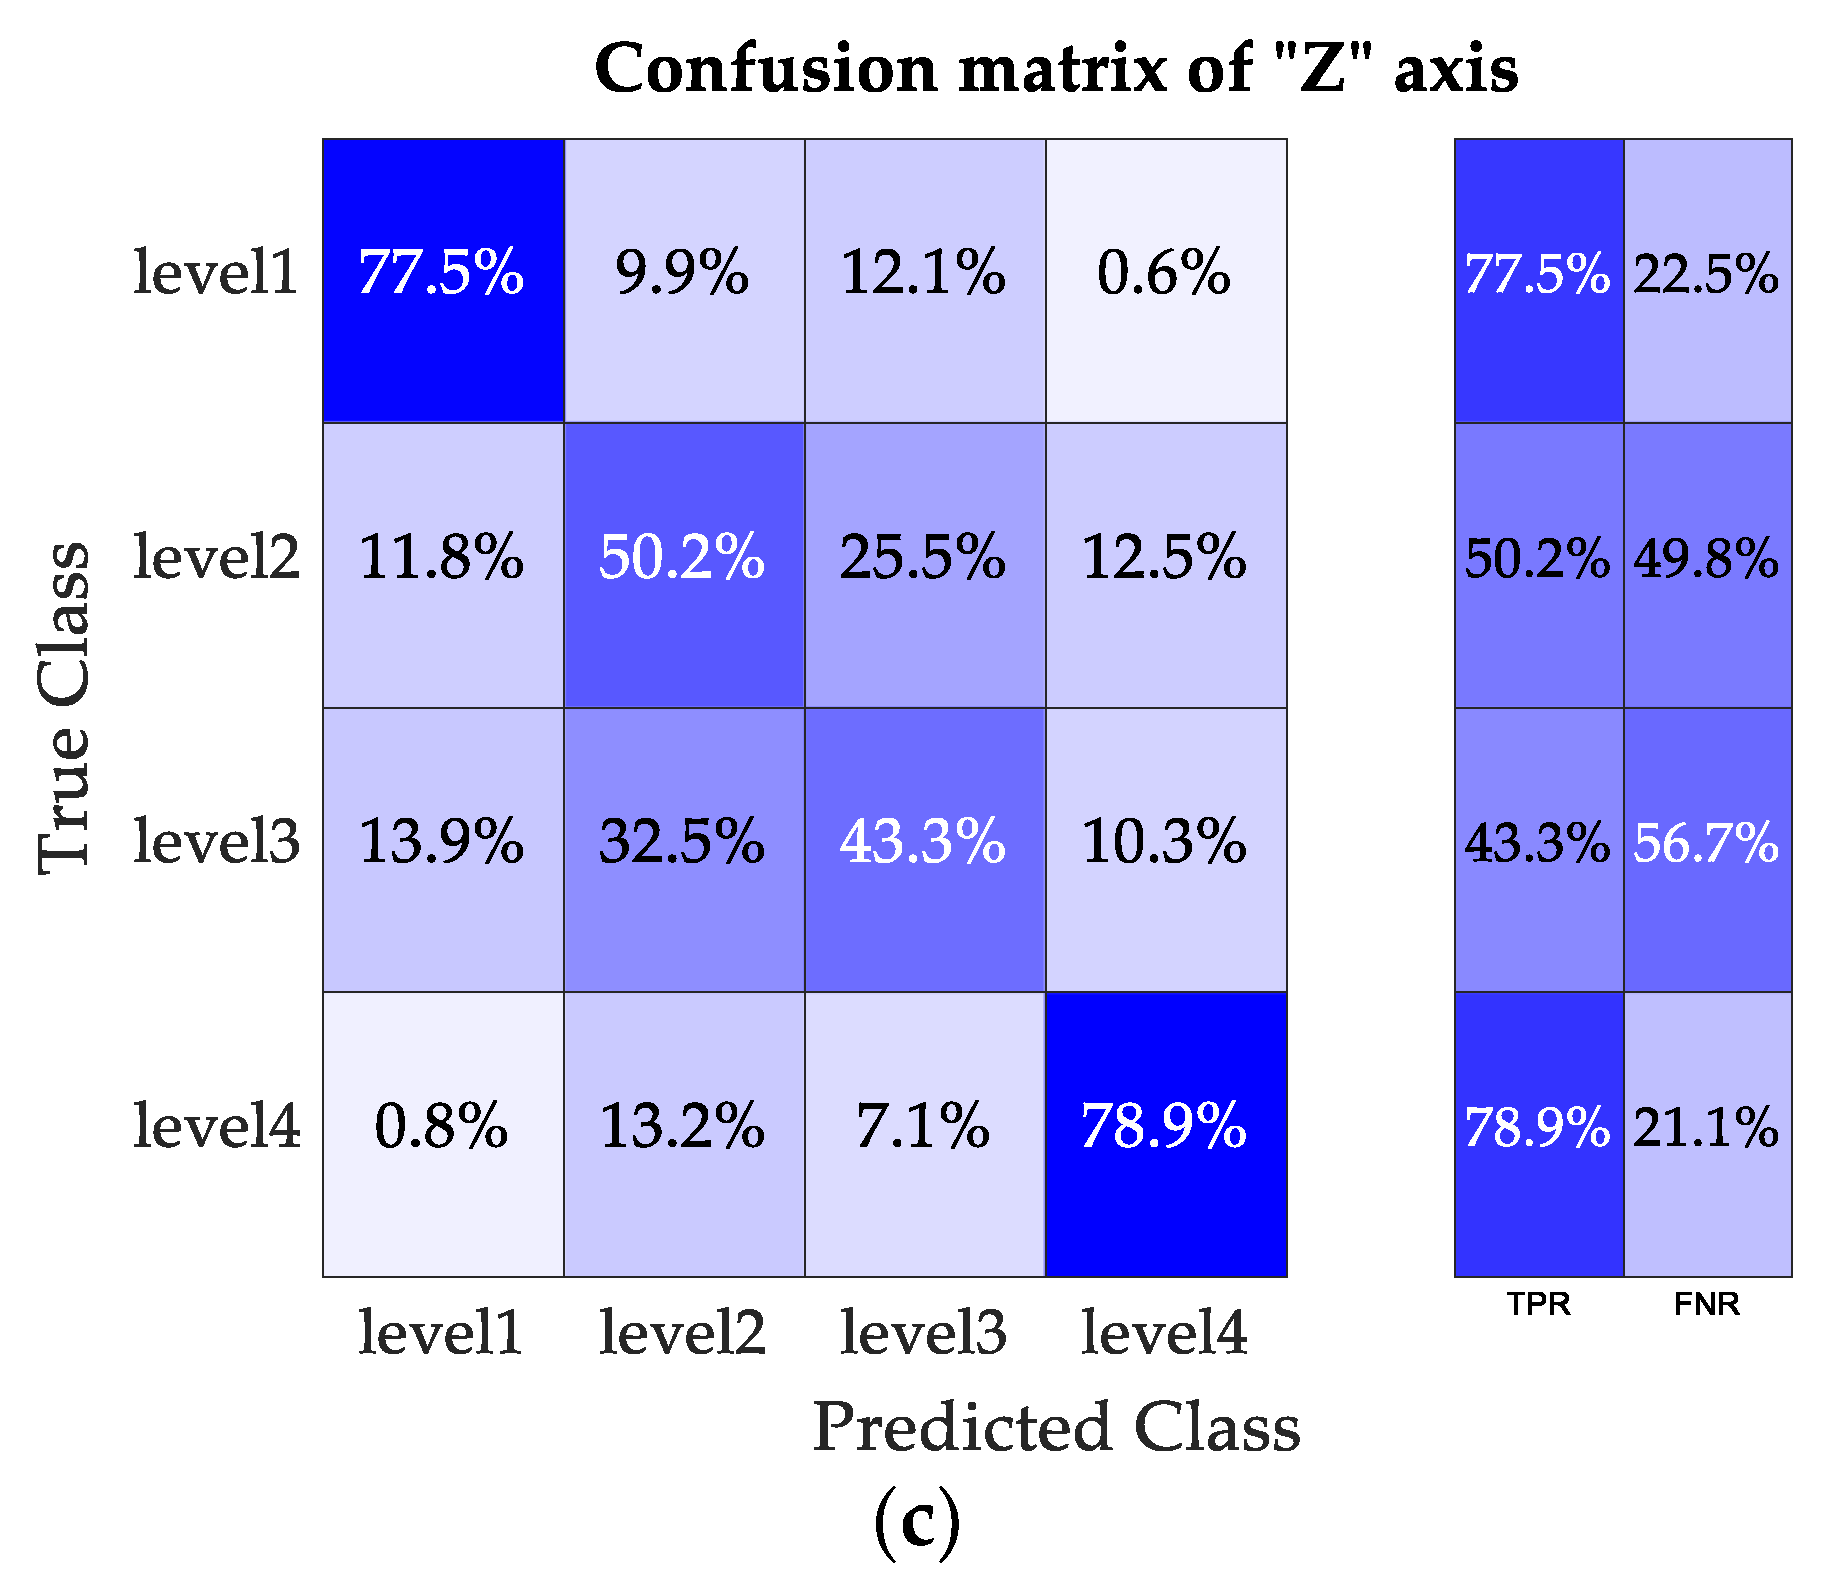
The proposed methodology performance is evaluated by confusion matrices for each axis “X”, “Y”, and “Z”, where accuracy is defined by the following equation:
A selection of performance indicators is used to track results, namely using the following parameters:
True positive rate (TPR);
True negative rate (TNR);
False positive rate (FPR);
False negative rate (FNR).
Figure 13 shows the confusion matrices for each axis “X”, “Y”, and “Z” obtained by the Bagged Trees algorithm.
As explained below in the “Model of Vibrations” section, a higher range of 2.5 a.u. (arbitrary units) was defined as a synthetic failure, i.e., level 4 is considered a synthetic failure due to the amplitude of vibrations observed in the spectrum, given that the highest peaks are observed in this condition.
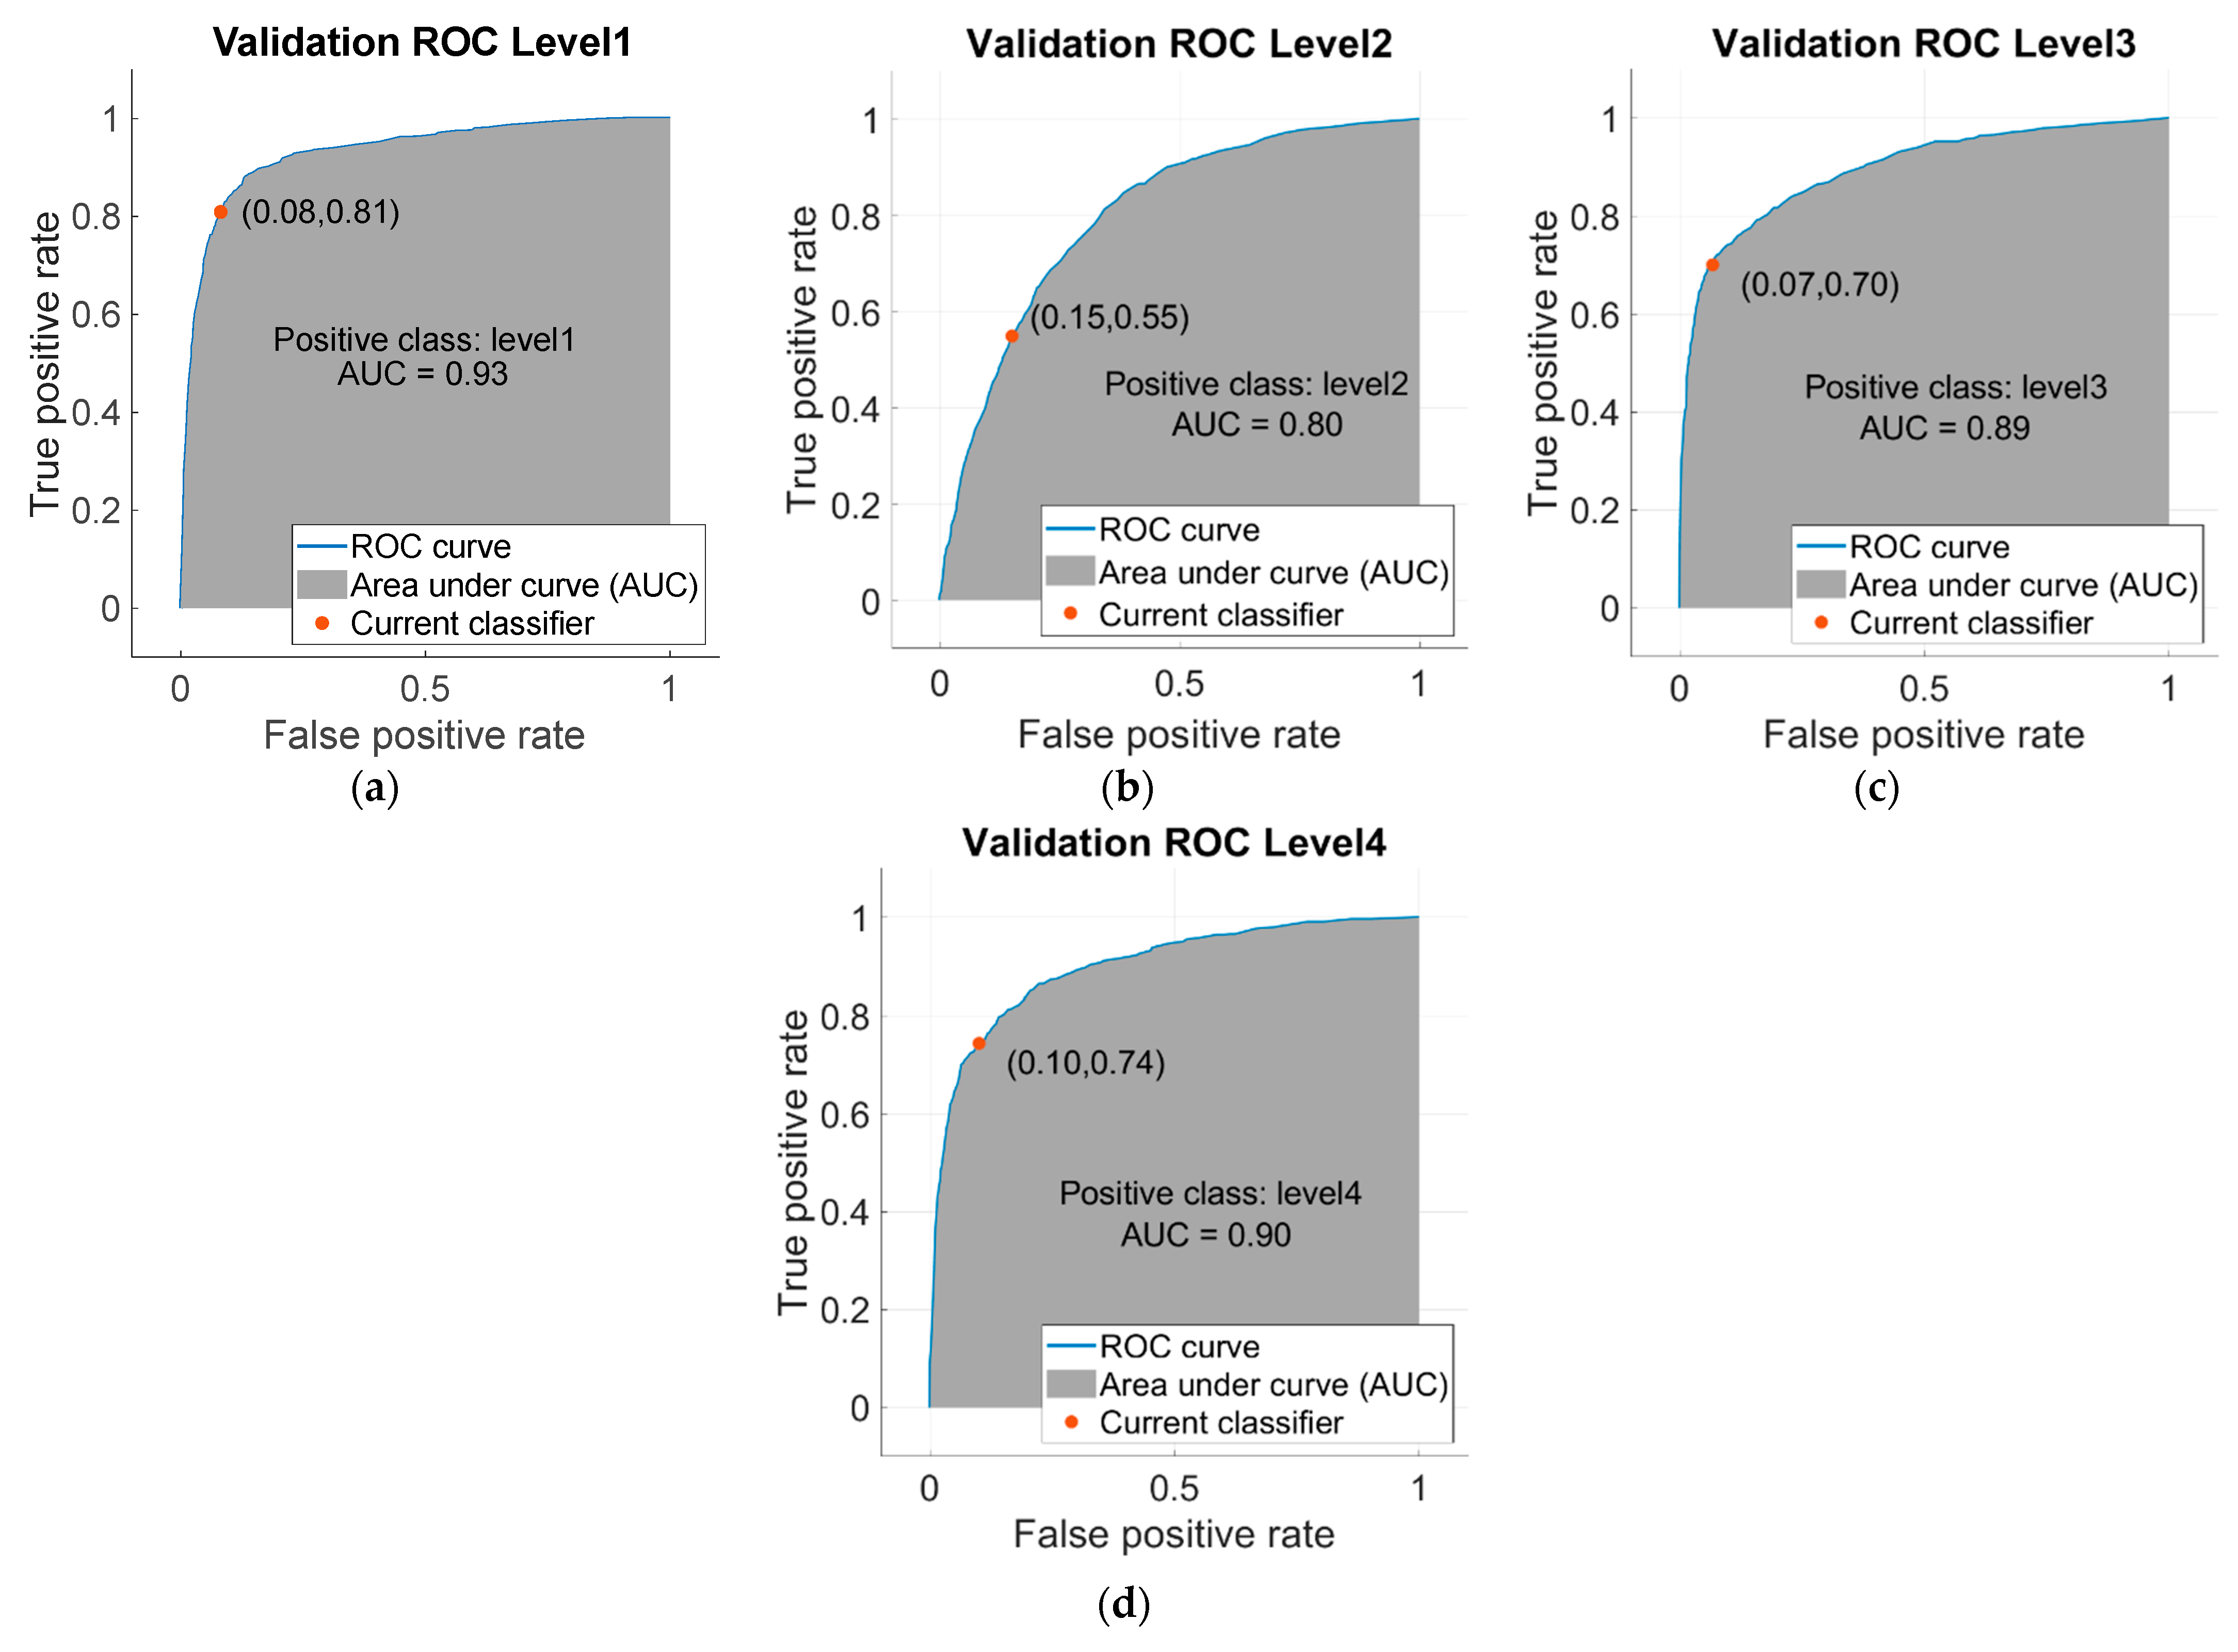
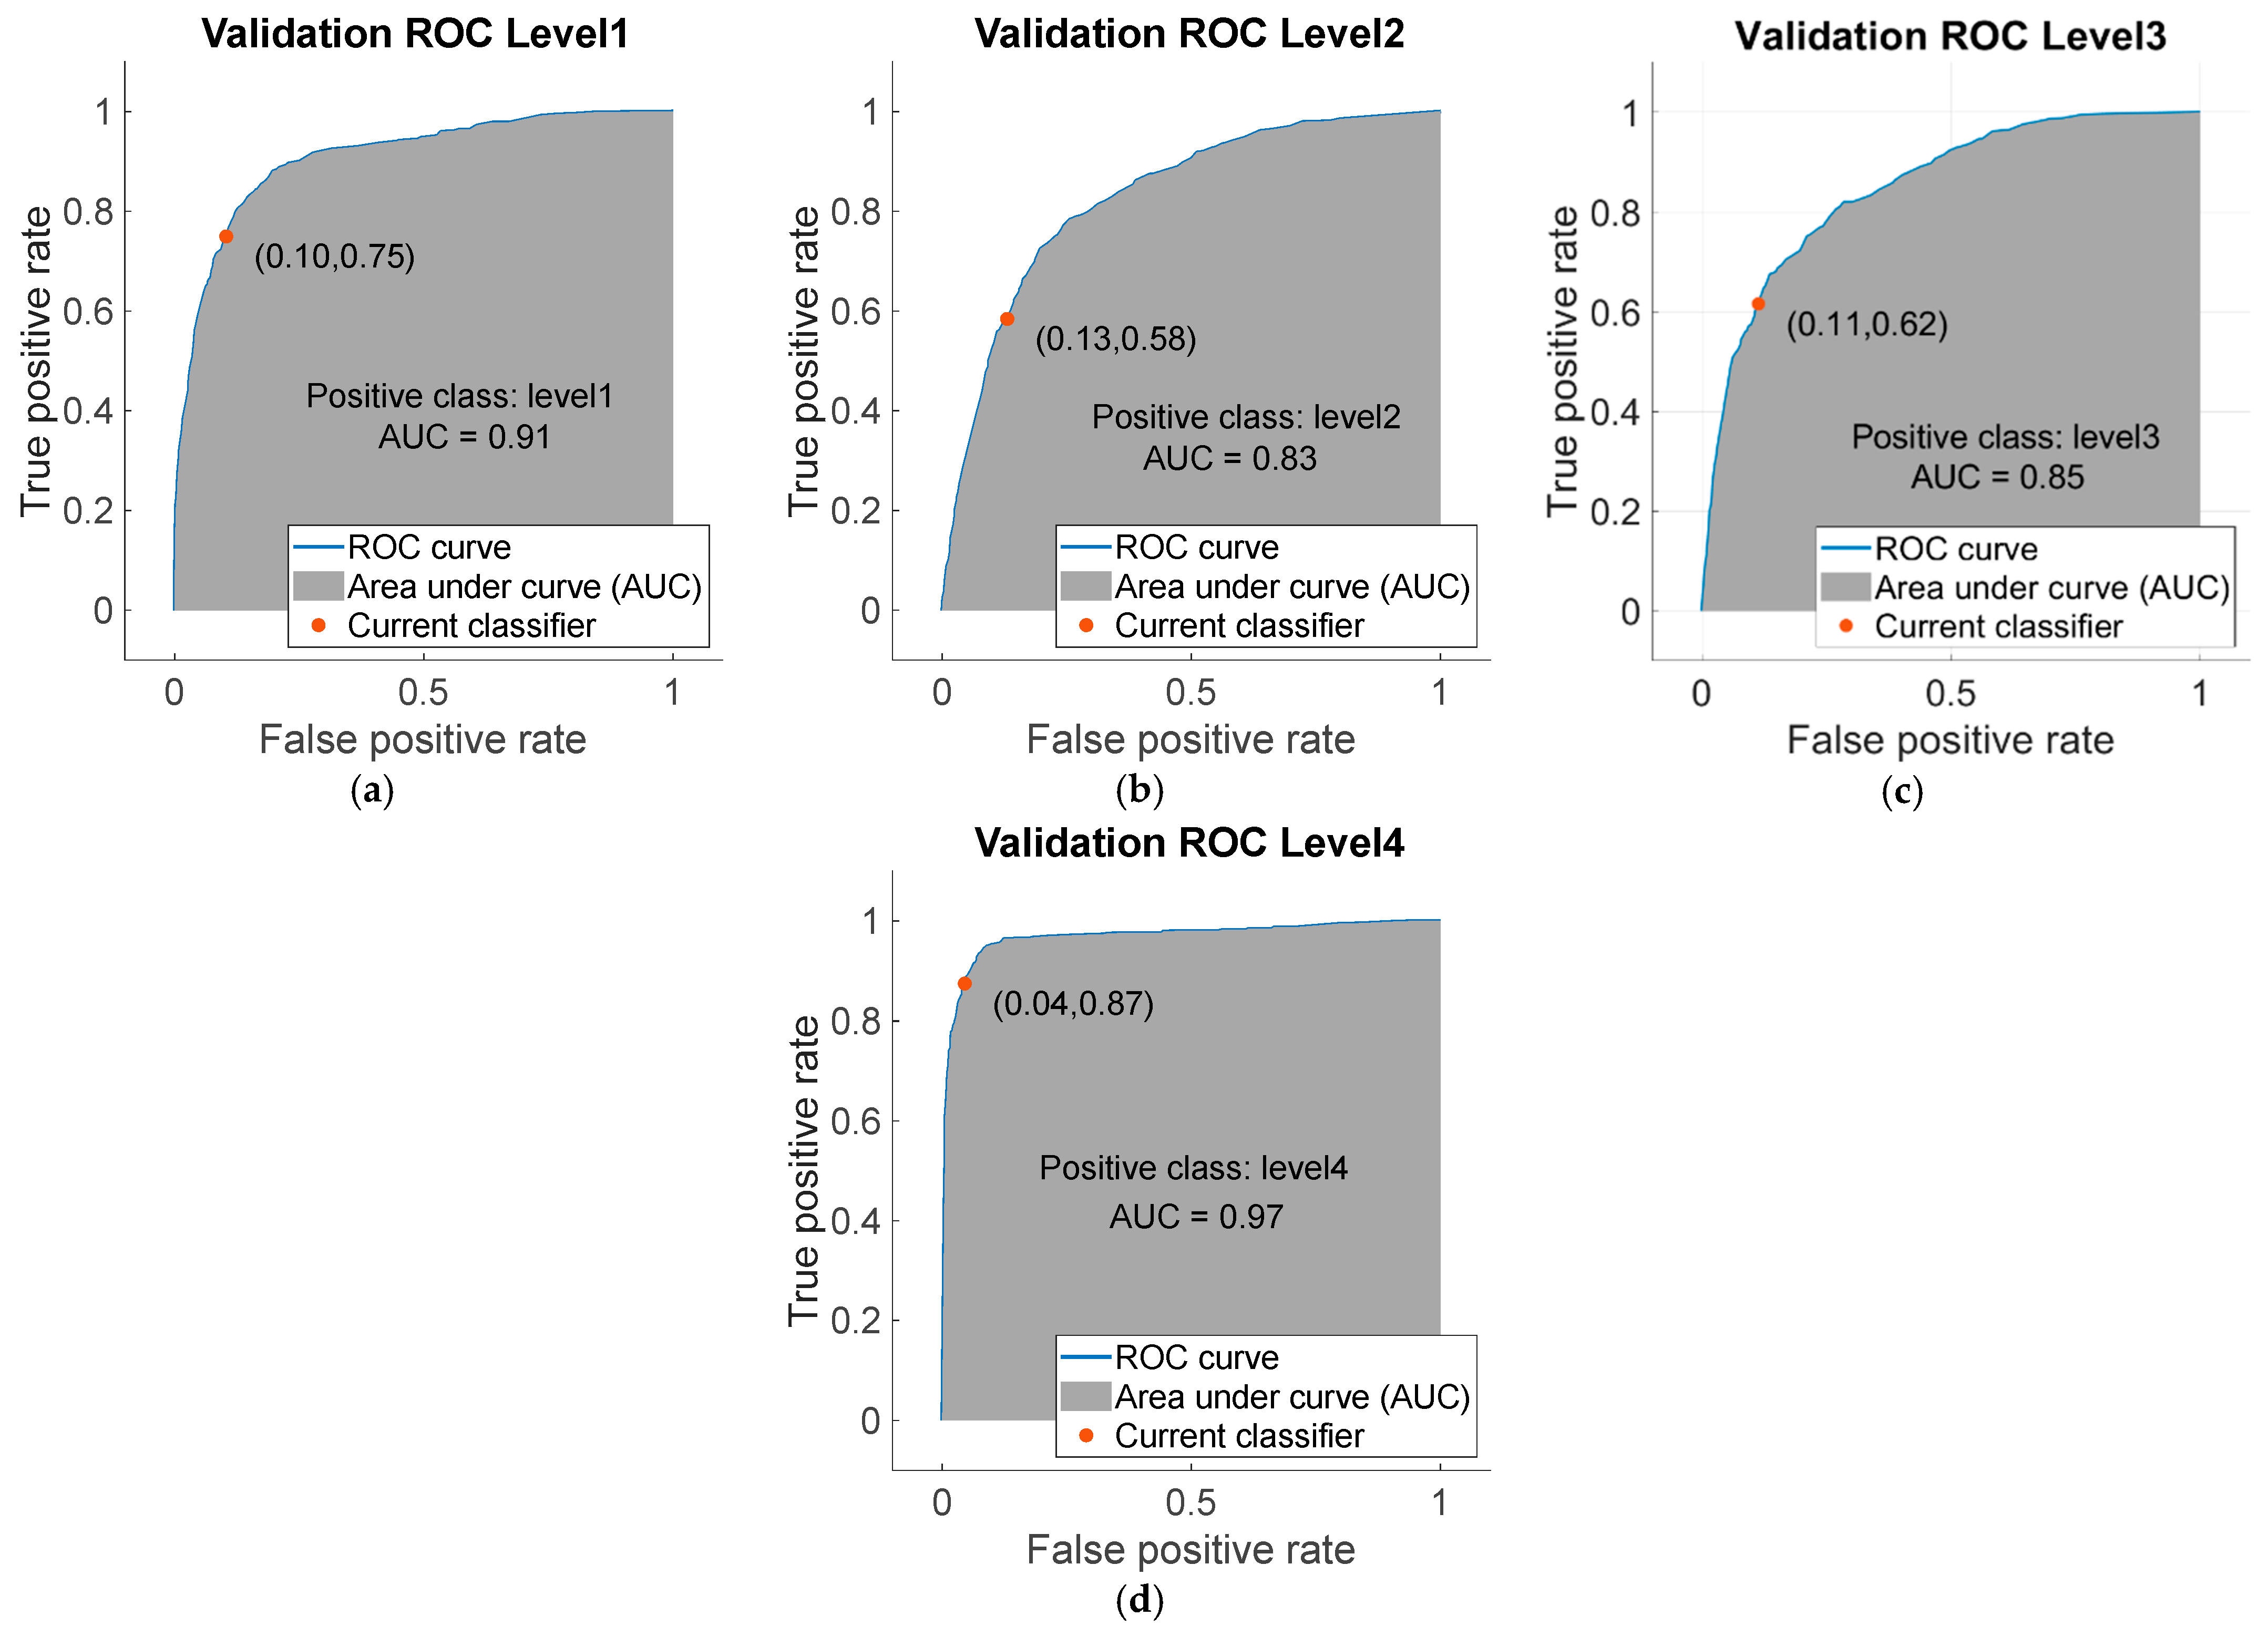
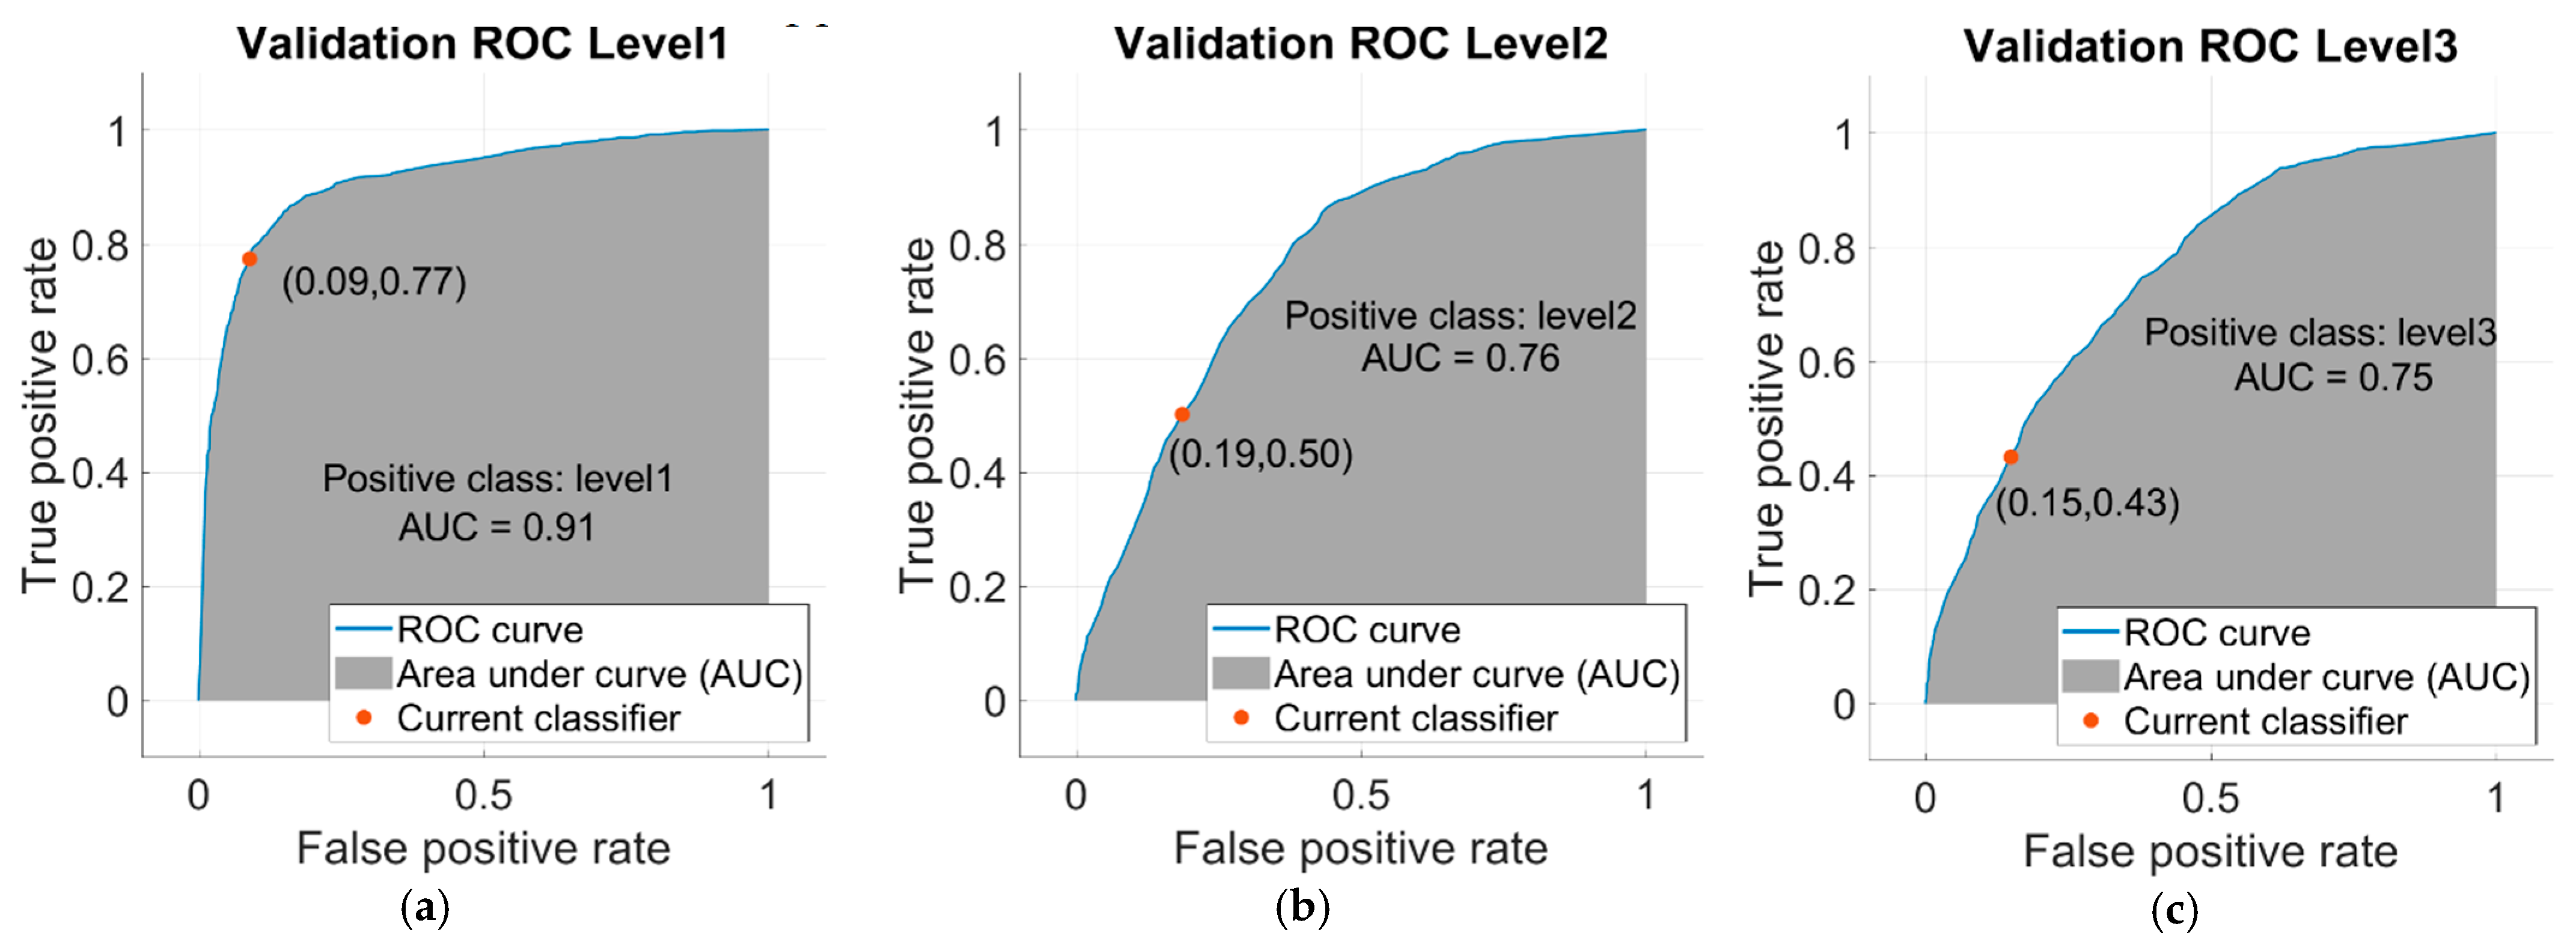
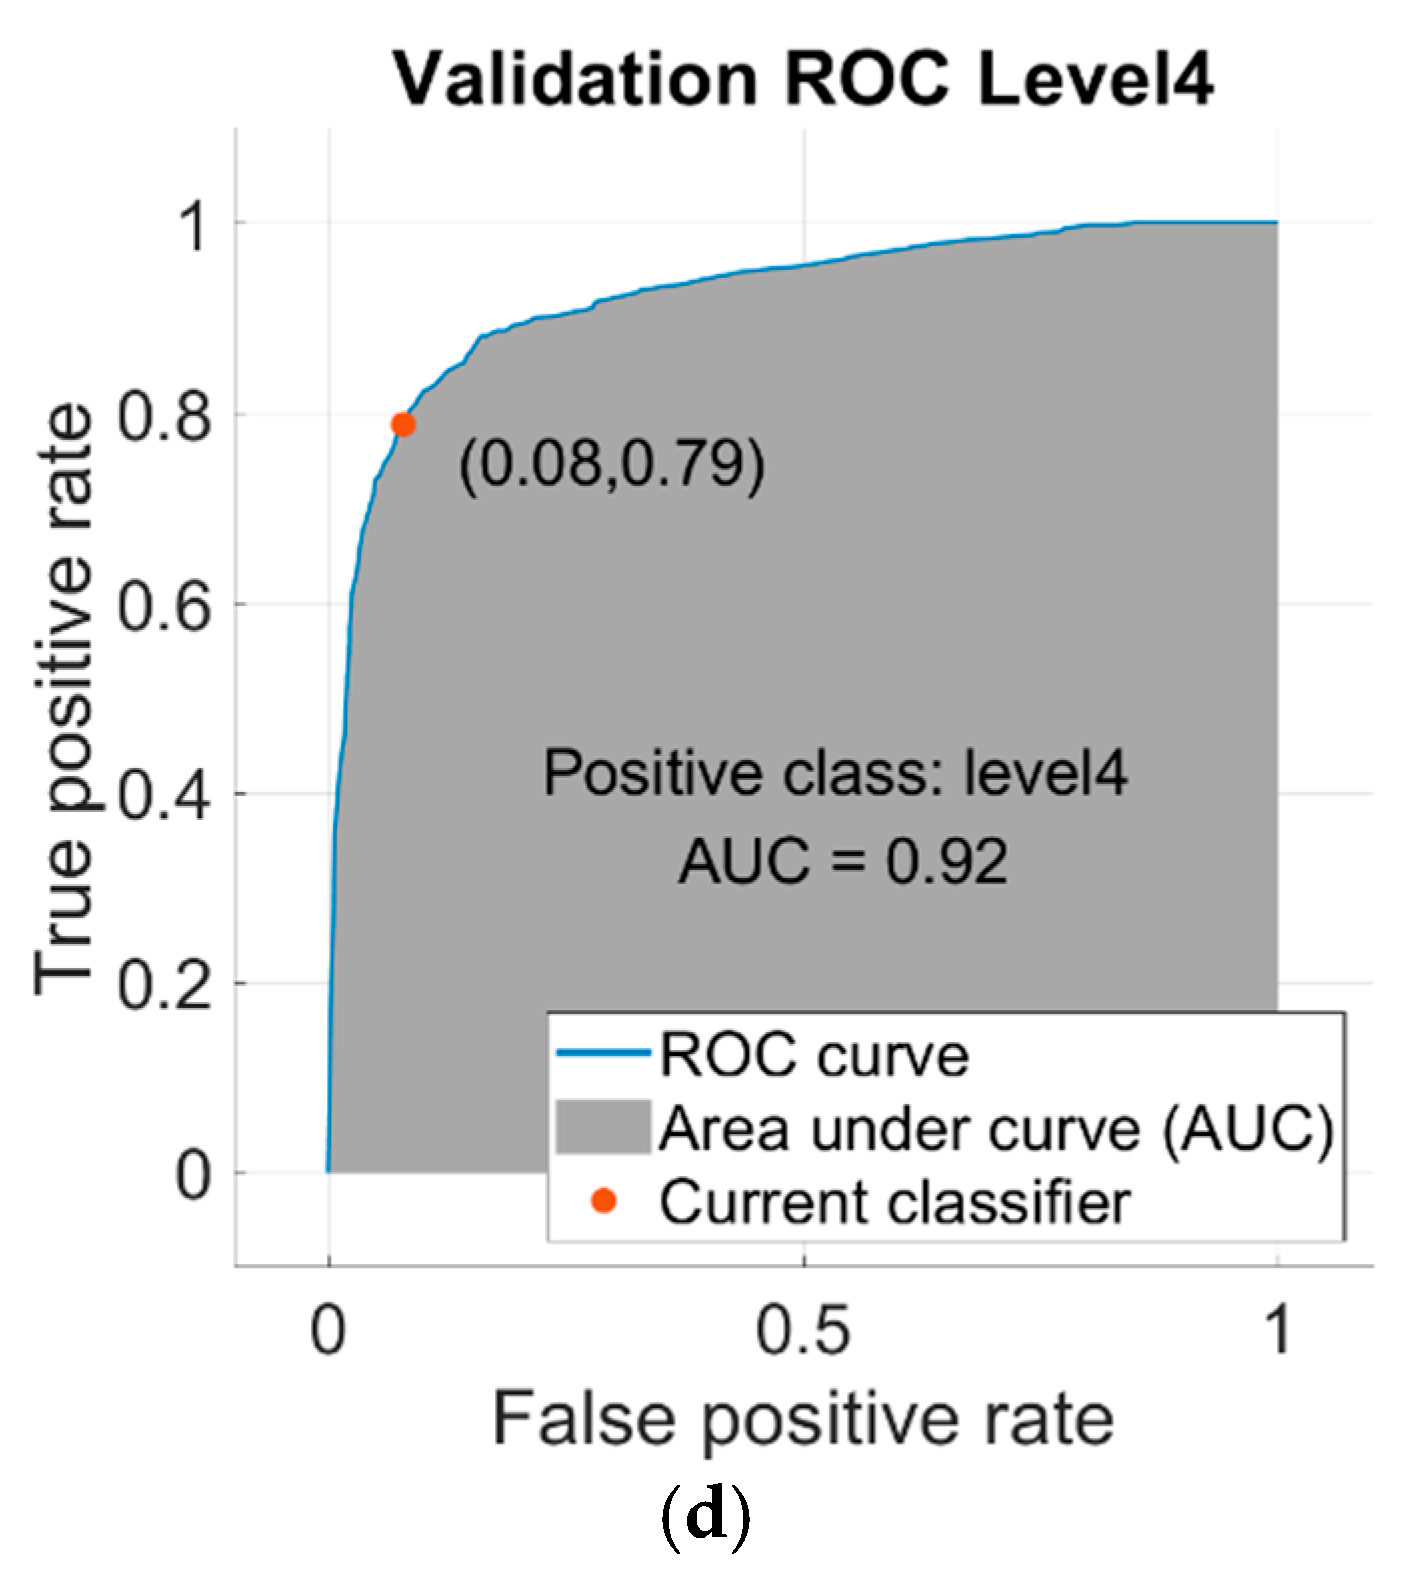
In matrix a, the level 1 expected value (true class) vs. obtained value with prediction model (predicted class) are compared, resulting in 80.9% accuracy for good wind turbine operation, while an observation of 1.4% would be classified as synthetic failure when operation is in fact normal, suggesting that maintenance would be scheduled when it is not necessary. In contrast to level 4, it is recommended to indicate possible maintenance due to vibrations when the value is 74.4%; however, 2.4% of cases were allocated as normal operation when in fact there was risk failure. In matrix b, level 1 results in 75% accuracy for determining good operation and 0% classified as failure, which is a good result as it indicates that function is optimal in the sense that it is not necessary to propose any type of maintenance in this scenario; however, at level 4, it is necessary to suggest a maintenance caused by vibrations in 87.5% of cases classified as synthetic failure. In matrix c, level 1, 77.5% are found to have good wind turbine operation with maintenance not required and 0.6% classified as synthetic failure. Finally, in level 4, 78.9% synthetic failure is obtained, which compels proposing possible maintenance in order to guarantee the wind turbine health against 0.8% failure risk assigned as a normal operation. Validation of false positive rate of Bagged Trees data training about Receiver Operating Characteristic (ROC) are observed in
Figure A1,
Figure A2 and
Figure A3 in the
Appendix A,
Appendix B,
Appendix C.
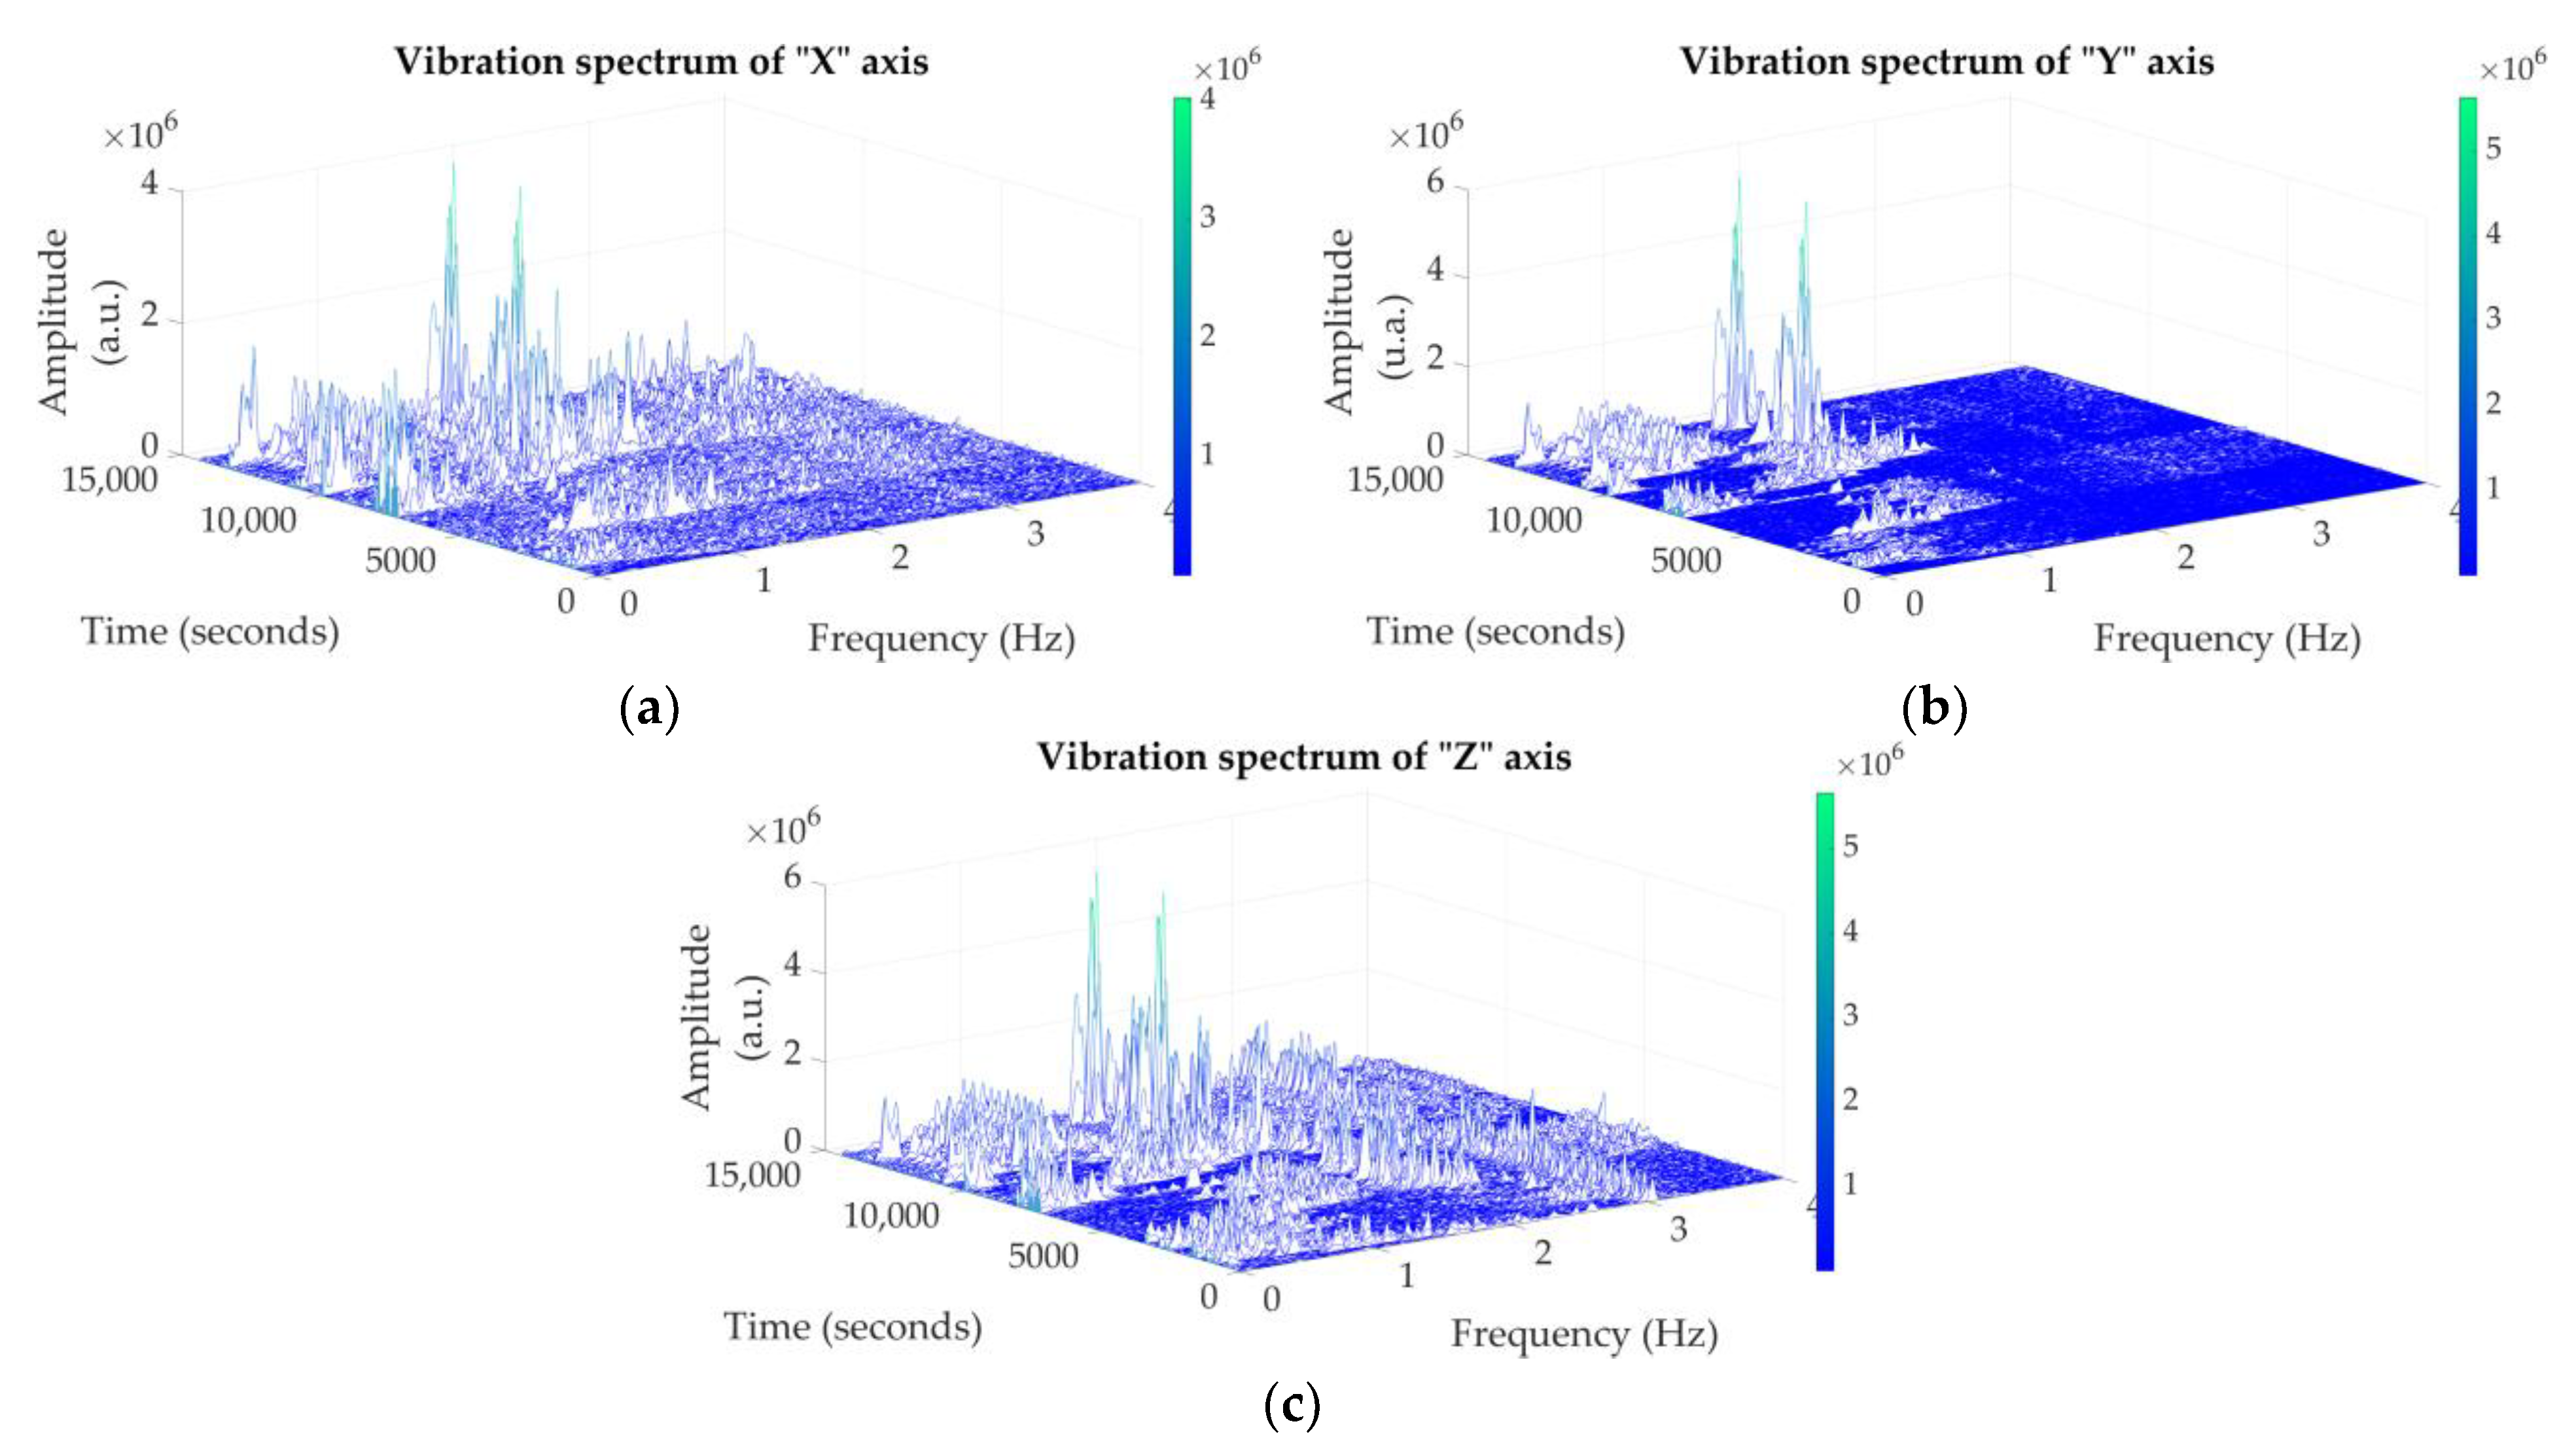
6. Model of Vibrations
Figure 14 shows the vibration spectrum for the three axes “X”, “Y”, and “Z”. It was defined as the optimal state allowed is between 0 to 2.49 a.u., since vibrations found in this range are within 70% of nonfailure wind turbine conditions. High-frequency vibrations exceeding this threshold would be considered synthetic failure. The longitudinal axis of a wind turbine is the one that suffers from longer amplitude in its vibrations (“Z” axis). In contrast, the horizontal axis (“Y” axis) is the one that receives the least vibrations, such as due to energy caused for a purpose.
The spectra presented here contribute to an improved general interpretation of wind turbine performance, since long amplitude vibrations can be cataloged as critical or synthetic failures. These vibrations must exceed the threshold of 2.49 a.u.; the larger this value, the more tenuous the amplitude vibrations in the spectrum.
7. Predictive, Preventive, and Corrective Maintenance
The wind generation industry requires a series of activities to ensure proper functioning, for which it is necessary to ensure wind turbines remain in good health through adequate maintenance; for this, possible parameters are proposed to carry out three types of maintenance—predictive, preventive, and corrective. The strategy for assigning predictive maintenance is based on the use of a machine learning method, where it is proposed that the Bagged Trees algorithm be used, which would be fed with new vibration data to determine future failures (
Figure 13) according to the scenario in which the wind turbine is located. If the failure percentage exceeds 70%, as determined by the confusion matrix, this indicates that it does not meet the permitted threshold of 2.49 a.u. of wind turbine optimal state. If these abnormal conditions are encountered, it is necessary to schedule maintenance.
In the preventive maintenance framework, it is important to consider monitoring in real time in relation to spectra (
Figure 14) and at the moment of observing vibrations that exceed the permitted limit based on the threshold of 2.49 a.u., called determined synthetic failure, since it is possible to have a planned preventive maintenance. Corrective maintenance is based on conditions of predictive and preventive maintenance in correlation with the confusion matrix, whose abnormal results indicate possible synthetic failure, or the case in spectra where extraordinary pulses are seen that exceed the permitted threshold of 2.49 a.u. In addition, to identify possible risks that arise at operation time and to correct possible breakdowns or failures, which are presented at the time of wind turbine operation time, an inspection is required to determine the health of wind turbine components, such that the wind turbine can operate optimally [
23].
8. Conclusions
This article presents data from a laboratory turbine, which the authors consider to be of great value and very interesting, since it presents original data, and no scenario-based vibration monitoring system can be found in the literature such as the one proposed by the authors in this work.
We present turbine data obtained in a laboratory, in which the turbine is subjected to four different scenarios that cause different vibrations. A monitoring system was implemented using an accelerometer that shows that the longitudinal axis “Z” receives the greatest wind turbine vibration. Data collected by monitoring were used for training under various machine learning algorithms.
The machine learning technique Bagged Trees algorithm achieved a greater precision for each axis as opposed to the trained algorithms (see
Table 2), giving 80.9% accuracy for the X axis, 87.5% accuracy for the Y axis, and 78.9% accuracy for the Z axis, and that it can be implemented to predict possible vibrations, called synthetic failures, every time the allowed threshold of 2.49 a.u. is exceeded and, thus, recommend preventive maintenance. With the data obtained, it will be proposed to create a new algorithm to train the data and improve the accuracy percentage for better maintenance.
The obtained results also show a risk of false positives; in contrast, false negatives are minimal. We consider that the data generated in this paper represent a valuable contribution based on the spectral results, which indicate when an anomaly is present when operating the turbine within a controlled environment. In the future, it is proposed that a system be used with several accelerometers placed in different wind turbine critical areas under different conditions to monitor a greater number of parameters in a remote and automated way for improving wind turbine maintenance.
Author Contributions
Conceptualization, D.P.G., M.A.O.R. and P.J.P.K.; methodology, D.P.G., M.A.O.R., P.J.P.K. and J.M.A.; validation, D.P.G., M.A.O.R., P.J.P.K. and R.A.G.D. formal analysis, D.P.G., M.A.O.R. and P.J.P.K.; investigation, D.P.G., M.A.O.R. and P.J.P.K.; resources, D.P.G., M.A.O.R. and P.J.P.K.; data curation, D.P.G., M.A.O.R., P.J.P.K. and S.A.G.L.; writing—original draft preparation, D.P.G., M.A.O.R. and P.J.P.K.; writing—review and editing, D.P.G., M.A.O.R. and P.J.P.K. All authors have read and agreed to the published version of the manuscript.
Funding
This research received no external funding.
Data Availability Statement
The data presented in this study are available on request from the corresponding author. The raw data required to reproduce these findings cannot be shared at this time as the data also forms part of an ongoing study.
Acknowledgments
The authors would like to thank Michelle Itzel Fuentes Villalobos, Ingrid Estephany Franco Gomez and Jennifer Echeverria Mercado for their technical contributions.
Conflicts of Interest
The authors declare no conflict of interest.
Appendix A
Approval curves of “X” axis
Figure A1.
(a) Validation curve of “X” axis level1; (b) Validation curve of “X” axis level2; (c) Validation curve of “X” axis level3; (d) Validation curve of “X” axis level4.
Figure A1.
(a) Validation curve of “X” axis level1; (b) Validation curve of “X” axis level2; (c) Validation curve of “X” axis level3; (d) Validation curve of “X” axis level4.
Appendix B
Approval curves of “Y” axis
Figure A2.
(a) Validation curve of “Y” axis level1; (b) Validation curve of “Y” axis level2; (c) Validation curve of “Y” axis level3; (d) Validation curve of “Y” axis level4.
Figure A2.
(a) Validation curve of “Y” axis level1; (b) Validation curve of “Y” axis level2; (c) Validation curve of “Y” axis level3; (d) Validation curve of “Y” axis level4.
Appendix C
Approval curves of “Z” axis
Figure A3.
(a) Validation curve of “Z” axis level1; (b) Validation curve of “Z” axis level2; (c) Validation curve of “Z” axis level3; (d) Validation curve of “Z” axis level4.
Figure A3.
(a) Validation curve of “Z” axis level1; (b) Validation curve of “Z” axis level2; (c) Validation curve of “Z” axis level3; (d) Validation curve of “Z” axis level4.
References
- Lin, Z.; Liu, X. Wind Power Forecasting of an Offshore Wind Turbine Based on High-Frequency SCADA Data and Deep Learning Neural Network. Energy 2020, 201, 117693. [Google Scholar] [CrossRef]
- Meyer, A. Vibration Fault Diagnosis in Wind Turbines Based on Automated Feature Learning. Energies 2022, 15, 1514. [Google Scholar] [CrossRef]
- Zhao, Y.; Pan, J.; Huang, Z.; Miao, Y.; Jiang, J.; Wang, Z. Analysis of Vibration Monitoring Data of an Onshore Wind Turbine under Different Operational Conditions. Eng. Struct. 2020, 205, 110071. [Google Scholar] [CrossRef]
- Black, I.M.; Richmond, M.; Kolios, A. Condition Monitoring Systems: A Systematic Literature Review on Machine-Learning Methods Improving Offshore-Wind Turbine Operational Management. Int. J. Sustain. Energy 2021, 40, 923–946. [Google Scholar] [CrossRef]
- Sunder Selwyn, T.; Hemalatha, S. Condition Monitoring and Vibration Analysis of Asynchronous Generator of the Wind Turbine at High Uncertain Windy Regions in India. Mater. Today Proc. 2021, 46, 3639–3643. [Google Scholar] [CrossRef]
- Yeh, C.H.; Lin, M.H.; Lin, C.H.; Yu, C.E.; Chen, M.J. Machine Learning for Long Cycle Maintenance Prediction of Wind Turbine. Sensors 2019, 19, 1671. [Google Scholar] [CrossRef] [Green Version]
- Lalik, K.; Wątorek, F. Predictive Maintenance Neural Control Algorithm for Defect Detection of the Power Plants Rotating Machines Using Augmented Reality Goggles. Energies 2021, 14, 7632. [Google Scholar] [CrossRef]
- Chen, H.; Hsu, J.Y.; Hsieh, J.Y.; Hsu, H.Y.; Chang, C.H.; Lin, Y.J. Predictive Maintenance of Abnormal Wind Turbine Events by Using Machine Learning Based on Condition Monitoring for Anomaly Detection. J. Mech. Sci. Technol. 2021, 35, 5323–5333. [Google Scholar] [CrossRef]
- Selvaraj, Y.; Selvaraj, C. Proactive Maintenance of Small Wind Turbines Using IoT and Machine Learning Models. Int. J. Green Energy 2021, 19, 463–475. [Google Scholar] [CrossRef]
- Elyasichamazkoti, F.; Khajehpoor, A. Application of Machine Learning for Wind Energy from Design to Energy-Water Nexus: A Survey. Energy Nexus 2021, 2, 100011. [Google Scholar] [CrossRef]
- Hsu, J.-Y.; Wang, Y.-F.; Lin, K.-C.; Chen, M.-Y.; Hsu, J.H.-Y. Wind Turbine Fault Diagnosis and Predictive Maintenance through Statistical Process Control and Machine Learning. IEEE Access 2020, 8, 23427–23439. [Google Scholar] [CrossRef]
- Yang, B.; Cai, A.; Lin, W. Analysis of Early Fault Vibration Detection and Analysis of Offshore Wind Power Transmission Based on Deep Neural Network. Connect. Sci. 2022, 34, 1005–1017. [Google Scholar] [CrossRef]
- Sun, L.; Liu, T.; Xie, Y.; Zhang, D.; Xia, X. Real-Time Power Prediction Approach for Turbine Using Deep Learning Techniques. Energy 2021, 233, 121130. [Google Scholar] [CrossRef]
- Xu, Z.; Zhang, H.; Wang, Y.; Wang, X.; Xue, S.; Liu, W. Dynamic Detection of Offshore Wind Turbines by Spatial Machine Learning from Spaceborne Synthetic Aperture Radar Imagery. J. King Saud Univ.-Comput. Inf. Sci. 2022, 34, 1674–1686. [Google Scholar] [CrossRef]
- Gougam, F.; Chemseddine, R.; Benazzouz, D.; Benaggoune, K.; Zerhouni, N. Fault Prognostics of Rolling Element Bearing Based on Feature Extraction and Supervised Machine Learning: Application to Shaft Wind Turbine Gearbox Using Vibration Signal. J. Mech. Eng. Sci. 2020, 235, 5186–5197. [Google Scholar] [CrossRef]
- Turnbull, A.; Carroll, J.; McDonald, A.; Koukoura, S. Prediction of Wind Turbine Generator Failure Using Two-Stage Cluster-Classification Methodology. Wind Energy 2019, 22, 1593–1602. [Google Scholar] [CrossRef]
- Kourehli, S.S.; Ghadimi, S.; Ghadimi, R. Vibration Analysis and Identification of Breathing Cracks in Beams Subjected to Single or Multiple Moving Mass Using Online Sequential Extreme Learning Machine. Inverse Probl. Sci. Eng. 2018, 27, 1057–1080. [Google Scholar] [CrossRef]
- Zhan, J.; Wu, C.; Ma, X.; Yang, C.; Miao, Q.; Wang, S. Abnormal Vibration Detection of Wind Turbine Based on Temporal Convolution Network and Multivariate Coefficient of Variation. Mech. Syst. Signal Process. 2022, 174, 109082. [Google Scholar] [CrossRef]
- Durbhaka, G.K.; Selvaraj, B. Predictive Maintenance for Wind Turbine Diagnostics Using Vibration Signal Analysis Based on Collaborative Recommendation Approach. In Proceedings of the 2016 International Conference on Advances in Computing, Communications and Informatics (ICACCI 2016), Jaipur, India, 21–24 September 2016; IEEE: Piscataway, NJ, USA, 2016; pp. 1839–1842. [Google Scholar] [CrossRef]
- Beretta, M.; Julian, A.; Sepulveda, J.; Cusidó, J.; Porro, O. An Ensemble Learning Solution for Predictive Maintenance of Wind Turbines Main Bearing. Sensors 2021, 21, 1512. [Google Scholar] [CrossRef]
- Zappalá, D.; Crabtree, C.; Vilchis-Rodriguez, D.S.; Tavner, P.J. Advanced Algorithms for Automatic Wind Turbine Generator Fault Detection and Diagnosis. Available online: https://www.researchgate.net/publication/312293897_Advanced_Algorithms_for_Automatic_Wind_Turbine_Generator_Fault_Detection_and_Diagnosis (accessed on 28 April 2022).
- Pacheco, J.; Oliveira, G.; Magalhães, F.; Moutinho, C.; Cunha, Á. Vibration-Based Monitoring of Wind Turbines: Influence of Layout and Noise of Sensors. Energies 2021, 14, 441. [Google Scholar] [CrossRef]
- Lopez, J.C.; Kolios, A. Risk-Based Maintenance Strategy Selection for Wind Turbine Composite Blades. Energy Rep. 2022, 8, 5541–5561. [Google Scholar] [CrossRef]
- Yang, W.; Tavner, P.J.; Wilkinson, M. Condition Monitoring and Fault Diagnosis of a Wind Turbine with a Synchronous Generator Using Wavelet Transforms. IET Conf. Publ. 2008. [Google Scholar] [CrossRef] [Green Version]
- Conradi Hoffmann, J.L.; Horstmann, L.P.; Martínez Lucena, M.; Medeiros de Araujo, G.; Fröhlich, A.A.; Nishioka, M.H.N. Anomaly Detection on Wind Turbines Based on a Deep Learning Analysis of Vibration Signals. Appl. Artif. Intell. 2021, 35, 893–913. [Google Scholar] [CrossRef]
- Aswin, F.; Suzen, Z.S. Analysis of Free Vibration Measurement by Mems Accelerometer Device on Wind Turbine Blade. In Proceedings of the 2018 International Conference on Applied Science and Technology (iCAST 2018), Manado, Indonesia, 26–27 October 2018; IEEE: Piscataway, NJ, USA, 2018; pp. 425–431. [Google Scholar] [CrossRef]
- Sánchez-Soto, J.R.; Téllez-Anguiano, A.d.C.; Escobar-Jimenez, R.F.; Chávez-Campos, G.M.; Gutiérrez-Gnecchi, J.A. Vibration Analysis System Applied to Fault Detection in Wind Turbines. Ing. Investig. Y Tecnol. 2019, 20, 4. [Google Scholar] [CrossRef]
- Yuvarani, P.; Prasath, R.H.; Logesh, P.; Muthuvel, S. Vibration Monitoring System Based on Mems Digital Accelerometer in Wind System|Annals of the Romanian Society for Cell Biology. Available online: https://www.annalsofrscb.ro/index.php/journal/article/view/6268 (accessed on 28 April 2022).
- Tzeng, C.B. Vibration Detection and Analysis of Wind Turbine Based on a Wireless Embedded Microcontroller System. In Proceedings of the 4th IEEE International Conference on Applied System Innovation 2018, ICASI 2018, Chiba, Japan, 13–17 April 2018; IEEE: Piscataway, NJ, USA, 2018; pp. 133–136. [Google Scholar] [CrossRef]
- De Novaes Pires Leite, G.; da Cunha, G.T.M.; dos Santos Junior, J.G.; Araújo, A.M.; Rosas, P.A.C.; Stosic, T.; Stosic, B.; Rosso, O.A. Alternative Fault Detection and Diagnostic Using Information Theory Quantifiers Based on Vibration Time-Waveforms from Condition Monitoring Systems: Application to Operational Wind Turbines. Renew. Energy 2021, 164, 1183–1194. [Google Scholar] [CrossRef]
- El Bakri, A.; Koumir, M.; Boumhidi, I. Extreme Learning Machine-Based Non-Linear Observer for Fault Detection and Isolation of Wind Turbine. Aust. J. Electr. Electron. Eng. 2019, 16, 12–20. [Google Scholar] [CrossRef]
- Cozorici, I.; Balan, H.; Munteanu, R.A.; Karaisas, P. Software Applications for Wind Turbine Vibrations Analysis. Lect. Notes Mech. Eng. 2014, 5, 689–699. [Google Scholar] [CrossRef]
- Vives, J. Vibration Analysis for Fault Detection in Wind Turbines Using Machine Learning Techniques. Adv. Comput. Intell. 2022, 2, 15. [Google Scholar] [CrossRef]
- Moghadam, F.K.; Nejad, A.R. Theoretical and Experimental Study of Wind Turbine Drivetrain Fault Diagnosis by Using Torsional Vibrations and Modal Estimation. J. Sound Vib. 2021, 509, 116223. [Google Scholar] [CrossRef]
- MPU-6000 and MPU-6050 Product Specification Revision 3.4 MPU-6000/MPU-6050 Product Specification. 2013. Available online: https://invensense.tdk.com/wp-content/uploads/2015/02/MPU-6000-Datasheet1.pdf (accessed on 8 February 2023).
- Nsaif, Y.M.; Hossain Lipu, M.S.; Hussain, A.; Ayob, A.; Yusof, Y.; Zainuri, M.A.A.M. A New Voltage Based Fault Detection Technique for Distribution Network Connected to Photovoltaic Sources Using Variational Mode Decomposition Integrated Ensemble Bagged Trees Approach. Energies 2022, 15, 7762. [Google Scholar] [CrossRef]
- Papaleonidas, A.; Psathas, A.P.; Iliadis, L. High Accuracy Human Activity Recognition Using Machine Learning and Wearable Devices’ Raw Signals. J. Inf. Telecommun. 2021, 6, 237–253. [Google Scholar] [CrossRef]
- Breiman, L. Bagging Predictors. 1994. Available online: https://www.stat.berkeley.edu/~breiman/bagging.pdf (accessed on 8 February 2023).
Figure 1.
(a) Sunforce 400 W wind turbine in laboratory; (b) wind turbine support spring at 4 cm; (c) wind turbine support spring at 10 cm; (d) wind turbine support spring at 20 cm; (e) wind turbine support spring at 30 cm; (f) wind turbine in operation.
Figure 1.
(a) Sunforce 400 W wind turbine in laboratory; (b) wind turbine support spring at 4 cm; (c) wind turbine support spring at 10 cm; (d) wind turbine support spring at 20 cm; (e) wind turbine support spring at 30 cm; (f) wind turbine in operation.
Figure 2.
Accelerometer diagram placed in the wind turbine.
Figure 2.
Accelerometer diagram placed in the wind turbine.
Figure 3.
(a) ratio between amplitude of the “X” axis and time in seconds at spring position 4 cm, a.u. (arbitrary units); (b) ratio between amplitude of the “X” axis and time in seconds at spring position 10 cm, a.u. (arbitrary units); (c) ratio between amplitude of the “X” axis and time in seconds at spring position 20 cm, a.u. (arbitrary units); (d) ratio between amplitude of the “X” axis and time in seconds at spring position, a.u. (arbitrary units).
Figure 4.
(a) ratio between amplitude of the “Y” axis and time in seconds at the spring position 4 cm, a.u. (arbitrary units); (b) ratio between amplitude of the “Y” axis and time in seconds at the spring position 10 cm, a.u. (arbitrary units); (c) ratio between amplitude of the “Y” axis and time in seconds at the spring position 20 cm, a.u (arbitrary units); (d) ratio between amplitude of the “Y” axis and time in seconds at the spring position 30 cm, a.u (arbitrary units).
Figure 5.
(a) ratio between amplitude of the "Z" axis and time in seconds at spring position 4 cm, a.u. (arbitrary units); (b) ratio between amplitude of the "Z" axis and time in seconds at spring position 10 cm, a.u (arbitrary units); (c) ratio between amplitude of the "Z" axis and time in seconds at spring position 20 cm, a.u. (arbitrary units); (d) ratio between amplitude of the "Z" axis and time in seconds at spring position 30 cm, a.u.(arbitrary units).
Figure 6.
Vibration monitoring. Total vibrations according to position of spring: (a) on the “X” axis; (b) on the “Y” axis; (c) on the “Z” axis; a.u (arbitrary units).
Figure 6.
Vibration monitoring. Total vibrations according to position of spring: (a) on the “X” axis; (b) on the “Y” axis; (c) on the “Z” axis; a.u (arbitrary units).
Figure 7.
A disturbance in the system is shown zooming in from 180 to 200 min according to the axis: (a) “X” axis; (b) “Y” axis; (c) “Z” axis; a.u (arbitrary units).
Figure 7.
A disturbance in the system is shown zooming in from 180 to 200 min according to the axis: (a) “X” axis; (b) “Y” axis; (c) “Z” axis; a.u (arbitrary units).
Figure 8.
(a) Shows a zoom from minute 181.25 to minute 181.5 on the “X” axis, a.u (arbitrary units); (b) Shows a zoom from minute 181.25 to minute 181.5 on the “Y” axis, a.u (arbitrary units); (c) Shows a zoom from minute 181.25 to minute 181.5 on the “Z” axis, a.u (arbitrary units).
Figure 8.
(a) Shows a zoom from minute 181.25 to minute 181.5 on the “X” axis, a.u (arbitrary units); (b) Shows a zoom from minute 181.25 to minute 181.5 on the “Y” axis, a.u (arbitrary units); (c) Shows a zoom from minute 181.25 to minute 181.5 on the “Z” axis, a.u (arbitrary units).
Figure 9.
(a) Shows a zoom from minute 188 to minute 188.25 on the “X” axis, a.u (arbitrary units); (b) Shows a zoom from minute 188 to minute 188.25 on the “Y” axis, a.u (arbitrary units); (c) Shows a zoom from minute 188 to minute 188.25 on the “Z” axis, a.u (arbitrary units).
Figure 9.
(a) Shows a zoom from minute 188 to minute 188.25 on the “X” axis, a.u (arbitrary units); (b) Shows a zoom from minute 188 to minute 188.25 on the “Y” axis, a.u (arbitrary units); (c) Shows a zoom from minute 188 to minute 188.25 on the “Z” axis, a.u (arbitrary units).
Figure 10.
(a) Shows a zoom from minute 198 to minute 198.25 on the “X” axis, a.u (arbitrary units); (b) Shows a zoom from minute 198 to minute 198.25 on the “Y” axis, a.u (arbitrary units); (c) Shows a zoom from minute 198 to minute 198.25 on the “Z” axis, a.u (arbitrary units).
Figure 10.
(a) Shows a zoom from minute 198 to minute 198.25 on the “X” axis, a.u (arbitrary units); (b) Shows a zoom from minute 198 to minute 198.25 on the “Y” axis, a.u (arbitrary units); (c) Shows a zoom from minute 198 to minute 198.25 on the “Z” axis, a.u (arbitrary units).
Figure 11.
Comparative vibration amplitude of the “X”, “Y” and “Z”.
Figure 11.
Comparative vibration amplitude of the “X”, “Y” and “Z”.
Figure 12.
Bagged Trees diagram.
Figure 12.
Bagged Trees diagram.
Figure 13.
(a–c) confusion matrix with true positive rate data (TPR) and false negative rate (FNR) (b) confusion matrix with positive predictive values (PPV) and false discovery rate (FDR).
Figure 13.
(a–c) confusion matrix with true positive rate data (TPR) and false negative rate (FNR) (b) confusion matrix with positive predictive values (PPV) and false discovery rate (FDR).
Figure 14.
(a) vibration spectrum on the “X” axis (b) vibration spectrum on the “Y” axis (c) vibration spectrum on the “Z” axis; a.u (arbitrary units).
Figure 14.
(a) vibration spectrum on the “X” axis (b) vibration spectrum on the “Y” axis (c) vibration spectrum on the “Z” axis; a.u (arbitrary units).
Table 1.
Materials used in the methodology.
Table 1.
Materials used in the methodology.
| Equipment Used (Hardware) | Programs Used (Software) |
|---|
| MPU6050 accelerometer | MATLAB 2022a |
Sunforce 400 W
Tension spring | |
Table 2.
Algorithms precision percentage.
Table 2.
Algorithms precision percentage.
| Algorithm | | Accuracy | |
|---|
| X | Y | Z |
|---|
| Medium Tree | 65.7% | 69.1% | 60.2% |
| Cubic SVM | 67.2% | 70.9% | 60.7% |
| Logistic Regression Kernel | 53.4% | 66.5% | 56.7% |
| Optimized Neural Network | 69.1% | 71.6% | 61.8% |
| Bagged Trees | 70.1% | 70.6% | 62.4% |
| Disclaimer/Publisher’s Note: The statements, opinions and data contained in all publications are solely those of the individual author(s) and contributor(s) and not of MDPI and/or the editor(s). MDPI and/or the editor(s) disclaim responsibility for any injury to people or property resulting from any ideas, methods, instructions or products referred to in the content. |
© 2023 by the authors. Licensee MDPI, Basel, Switzerland. This article is an open access article distributed under the terms and conditions of the Creative Commons Attribution (CC BY) license (https://creativecommons.org/licenses/by/4.0/).


 ,
, 


