


Risk Assessment of Offshore Wind Turbines Suction Bucket Foundation Subject to Multi-Hazard Events

1
Department of Ocean Science and Engineering, Kunsan National University, Gunsan 54150, Republic of Korea
2
School of Architecture and Coastal Construction Engineering, Kunsan National University, Gunsan 54150, Republic of Korea
*
Author to whom correspondence should be addressed.
Energies 2023, 16(5), 2184; https://doi.org/10.3390/en16052184
Submission received: 2 November 2022
/
Revised: 8 December 2022
/
Accepted: 23 February 2023
/
Published: 24 February 2023
(This article belongs to the Special Issue Numerical Analysis, Field Testing and Experimental Assessment of Offshore Wind Turbines 2023)
Abstract
:For the offshore wind turbines (OWTs) located in a seismically active region, the occurrence of earthquakes combined with scour is a highly possible multi-hazard event. This study developed an alternative fragility analysis framework to assess the seismic performance of suction bucket-supported OWTs under the action of scour. First, the probabilistic approach was applied to calculate the occurrence probability of scour depth (SD) and earthquake events. Then, the possible combinations of these two events were considered in the analysis model to establish the fragility surface of the suction bucket foundation. Finally, by integrating the product of scour and earthquake hazard, as well as fragility curves, the suction bucket foundation failure probability was obtained. The developed framework provides a reliable approach to risk assessment for OWT-supporting structures in extreme event situations and can be applied to other complex natural hazards.
1. Introduction
Despite the fact that the marine environment is extremely harsh and complex, offshore wind farms have been widely established in many countries. Nowadays, a significant number of offshore wind farms are constructed or being constructed. According to current data [1], there are 122 offshore wind farm projects, of which 8 currently operating around Korean coastlines, and the total offshore power capacity of the offshore wind industry in Korea will reach 18–20 GW by 2030 [2].
Compared with onshore sites, offshore wind farms have more substantial and stable wind speed conditions, reduced environmental impact, and more space for installation. However, OWTs are confronted with more complex environmental load conditions such as waves, typhoons, and ice. In particular, the planning and designing of wind turbines in offshore environments needs to consider the scouring phenomena around the foundations of the wind turbines. The bearing capacity of an SB foundation was mainly formed by the interaction between the bucket skirt and the soil. Unfortunately, scour significantly reduces this connection because a certain amount of soil layers around the SB have been removed. Therefore, it can be concluded that scour is one of the causes of deterioration in the bearing capacity of the foundation after installation. Scour has a negative impact on the capacity of the foundation and thereby on the response of the upper structure [3,4,5]. Significant studies have been carried out to evaluate the influence of scour on the bearing capacity of OWT support systems. Through his research, Li et al. [6] conclude that the bearing capacity of the OWT foundation decreases non-linearly, and the foundation-bearing envelope line shrinks. Zhao et al. [7] investigate the change in the bearing capacity of the foundation due to scour and show that scour causes the embedded depth of the foundation to decrease, thereby leading to the degradation of the bearing capacity of the foundation. Moreover, the seismic effect on the dynamic response of OWTs under scour conditions has recently attracted many researchers. Ngo et al. [8] investigated the seismic fragility of a novel SB foundation for OWTs under scour conditions and concluded that scour significantly changed the seismic response of this novel SB foundation, but it had a better bearing capacity than the tripod SB foundation. However, in this study, scour depth was not considered as a random quantity. A scour model has been simulated by the deterministic approach. Accordingly, seismic assessments were made under specific scour depths without considering their randomness. Furthermore, the occurrence probability of earthquake events was also not considered. Jiang and his colleagues [9] examined the seismic response of monopile-supported offshore wind turbines in soft clays under scoured conditions. The results of this study also showed that scour significantly changed the seismic responses of the selected OWT structure. Currently, most of the research on the effects of earthquakes and scour considers the scour process as a general scour by assuming several specific scour depths without considering the randomness of scour depth. Prendergast et al. [10] evaluated the scour effect on the shift of the fundamental frequency and calculated variations of the fundamental frequency with general scour depths. Guan et al. [11] investigated the relationship between the scour and foundation vibration where the monopile top was excited by simple harmonic motions. Jia et al. [12] investigated the dynamic responses of the SB foundation under combined effects of general scour and real earthquake. Regarding risk assessment methods, many methods have been proposed and developed. They can be divided into three main methods: qualitative, semi-quantitative, and quantitative methods [13]. Among them, some popular methods can be mentioned, such as the failure method and the effect analysis (FMEA), a type of qualitative method, as well as the numerical simulation method (quantitative method). The FMEA allows for the definition of failure mode and its effect on structural risk [14,15]. Meanwhile, the numerical simulation method allows for the convenient simulation of potential hazards to the structure under specific environmental conditions [16,17,18]. Moreover, the operation management method to control the risk as multi-attribute decision-making (MADM) also attracts many researchers [19,20,21,22,23].
Although many studies have been performed to evaluate the response of OWT-support structures with environmental loads under scoured foundation conditions [24,25,26], the risk assessment of OWT support structure exposed to several multi-hazard sources, which considers the occurrence of hazards as an uncertain quantity, is still a relatively new topic. Kim et al. [27] evaluated the scour risk of the suction bucket support structure for OWTs. In this paper, a probabilistic distribution of scour depth was obtained considering the uncertainty of related variables. Additionally, then, scour risk was obtained by combining the scour hazard and the fragility.
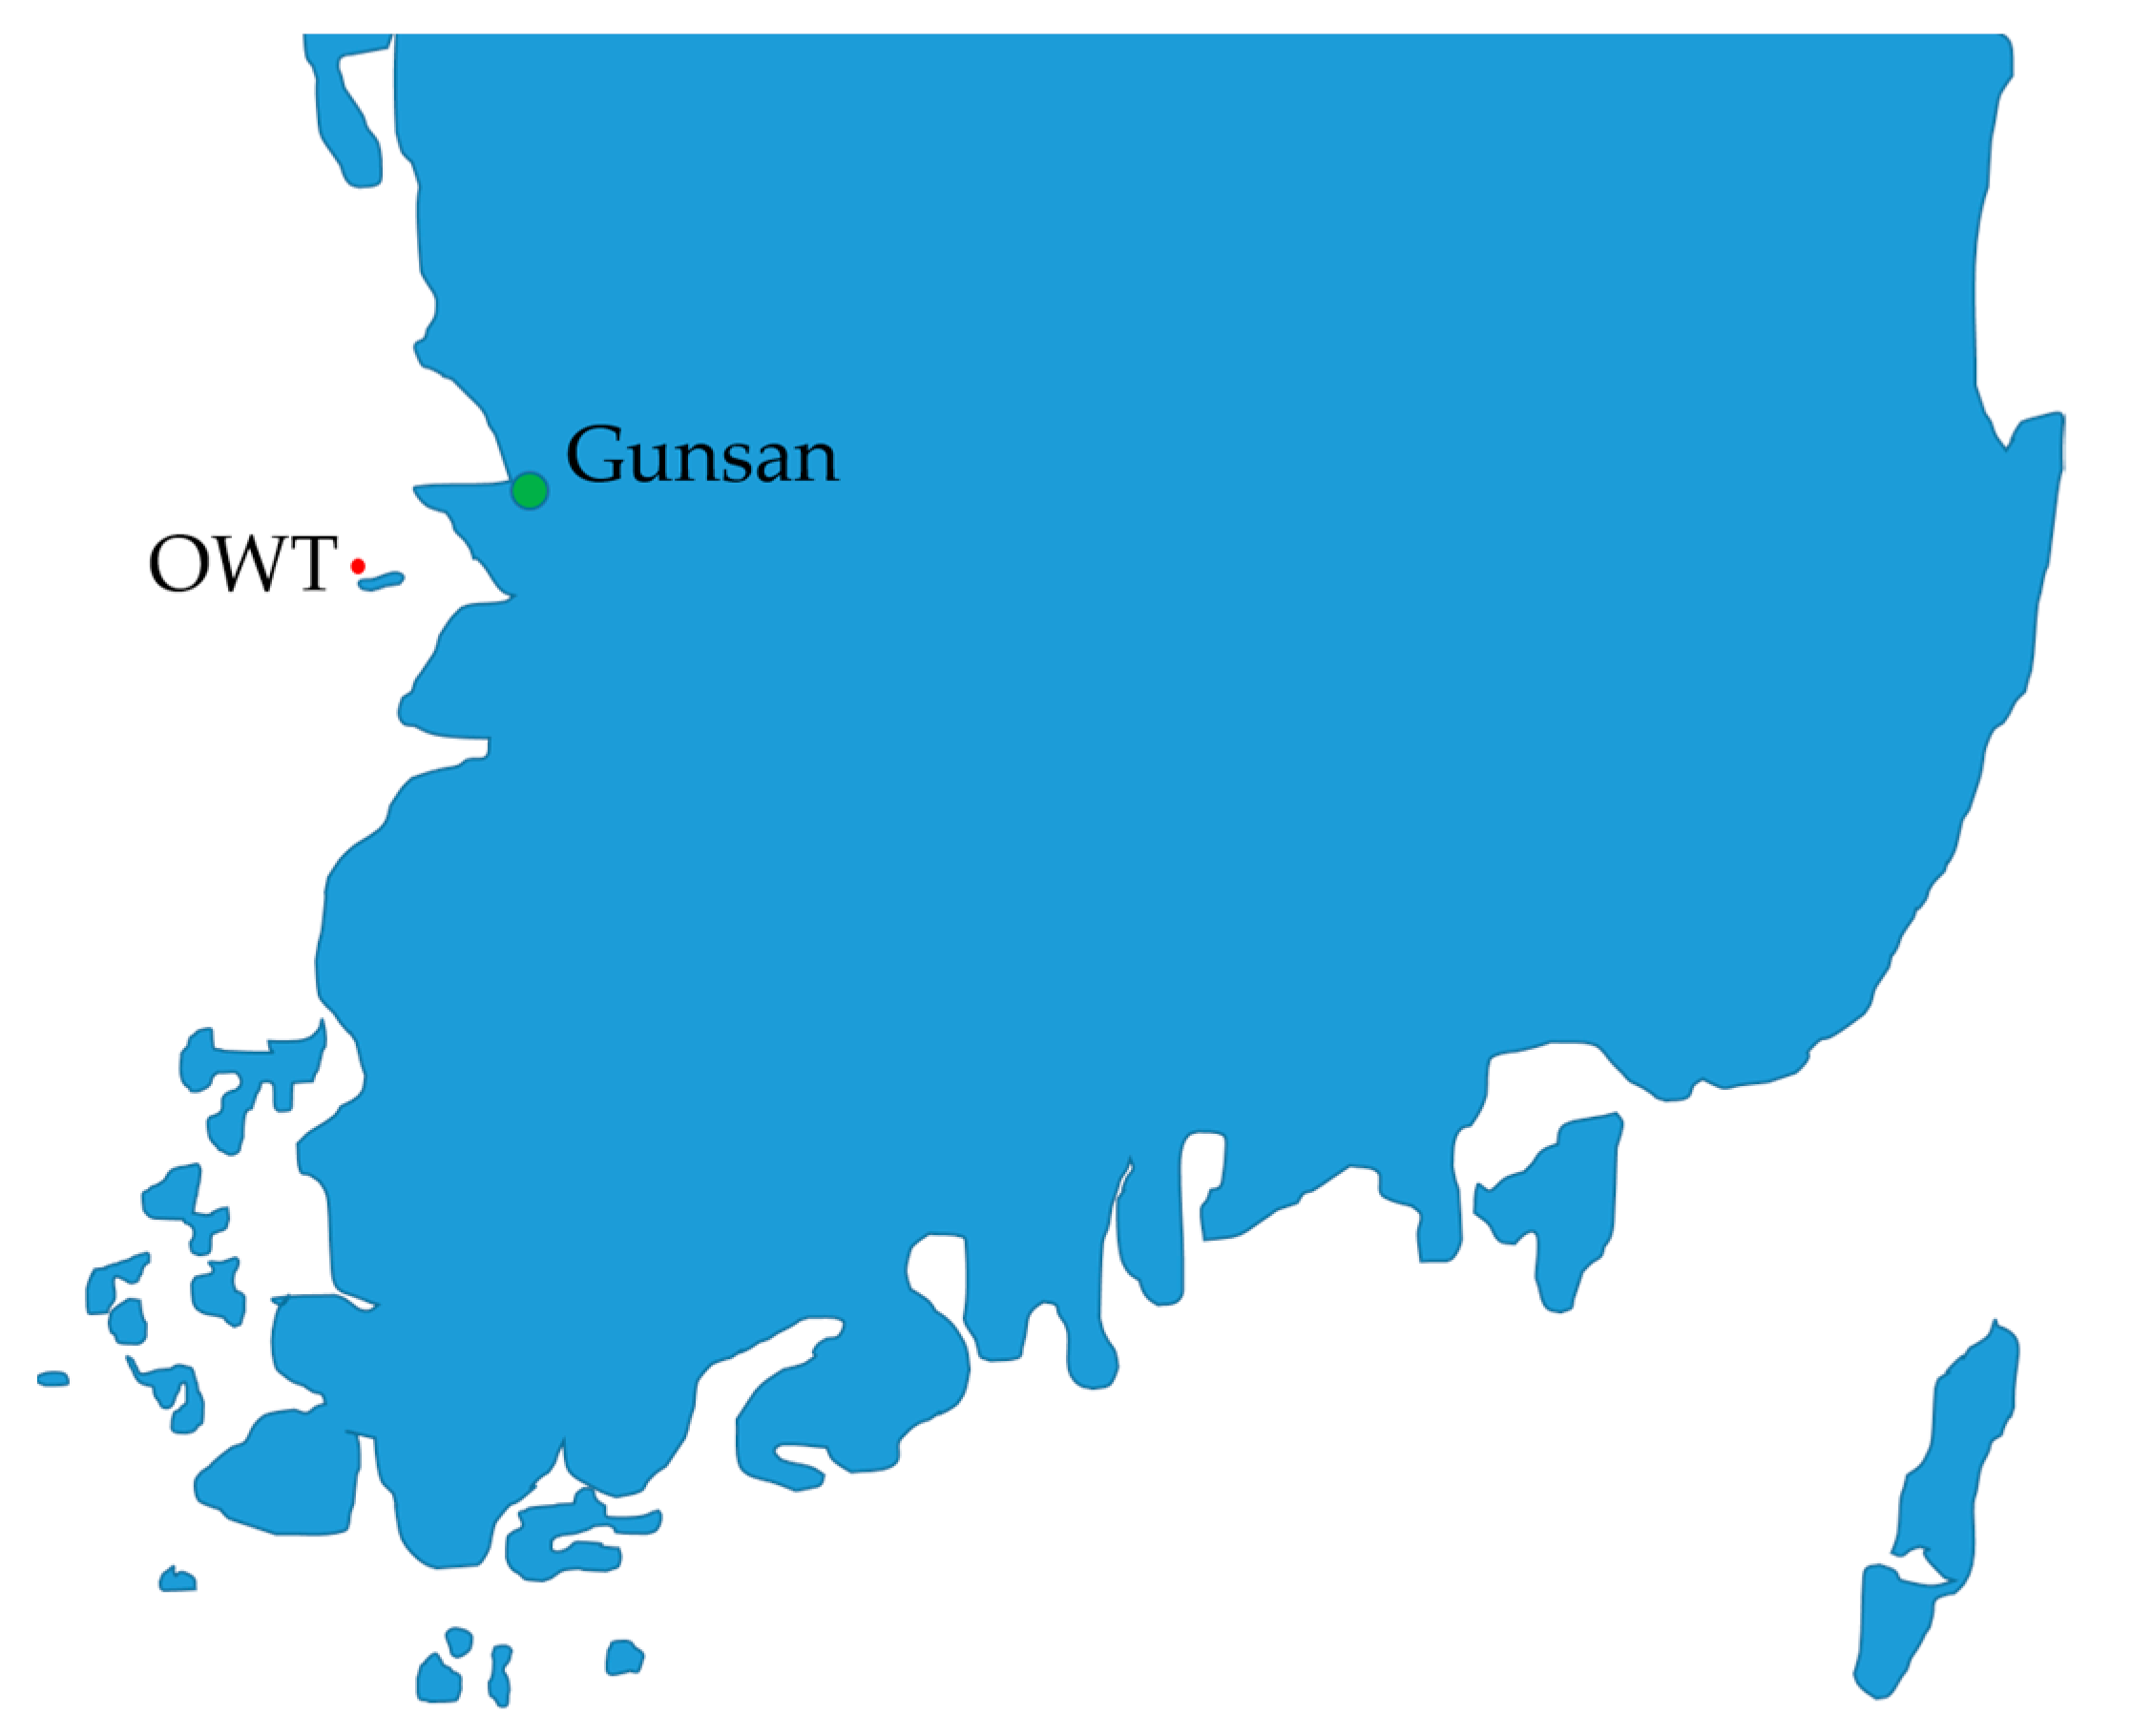
For the offshore wind turbines (OWTs) located in a seismically active region, the occurrence of earthquakes combined with scour is a highly possible multi-hazard event. Earthquakes and scour are therefore potential multi-hazard events for the design and construction of offshore wind turbines in such areas. In this study, in order to evaluate the failure probability of the suction bucket foundation under the combined action of post-scour and earthquake, a reliability-based framework has been proposed in which the probabilistic approach was applied to calculate the occurrence probability of scour depth (SD) and earthquake events. For the reliability assessment of scoured foundation under earthquake, a 5.5 MW OWT with an SB foundation was used as a case study. It was located on the Gunsan coast of Korea. The probability of failure of the SB foundation was finally calculated by integrating the results of both scour and earthquake hazard as well as fragility curve and then compared with a target failure probability.
2. Probabilistic Methodology
2.1. Probability Distribution of Scour Depth (SD)
Depending on the seabed and wave characteristics, the foundation of OWTs experiences local scour and general scour (global scour). Experimental studies and previous studies [28,29,30] showed that local scour causes the most significant degradation to the foundation of marine structures and adversely affects the stability of the structure. As a result, this study considered local scour for foundation vulnerability evaluation under multiple hazards. The design formula recommended by Sumer and Fredsoe [31] is an empirical formula based on a set of experimental tests and calculates the scour depth by using a number of parameters, such as the undisturbed current velocity () at the distance from the bed, the maximum value of the undisturbed orbital velocity at the bed (), and peak period wave (). This equation can be expressed as follows:
where : SD; : SD in the case of steady current alone; :pile diameter; ; ; ; . It can be seen that Equation (1) included some uncertain parameters. For the reliability analysis of an SB foundation under scouring effects, the probability distribution functions of these parameters need to be used to consider their variability.
It was evident that the scour depth mainly depends on the KC parameter, which is governed by peak period wave (). Therefore, only the uncertainty of KC was considered in this study. Consequently, the SD probability distribution can be obtained by considering the variability of the KC parameter, whereas the variability of KC is governed by the peak period wave ().
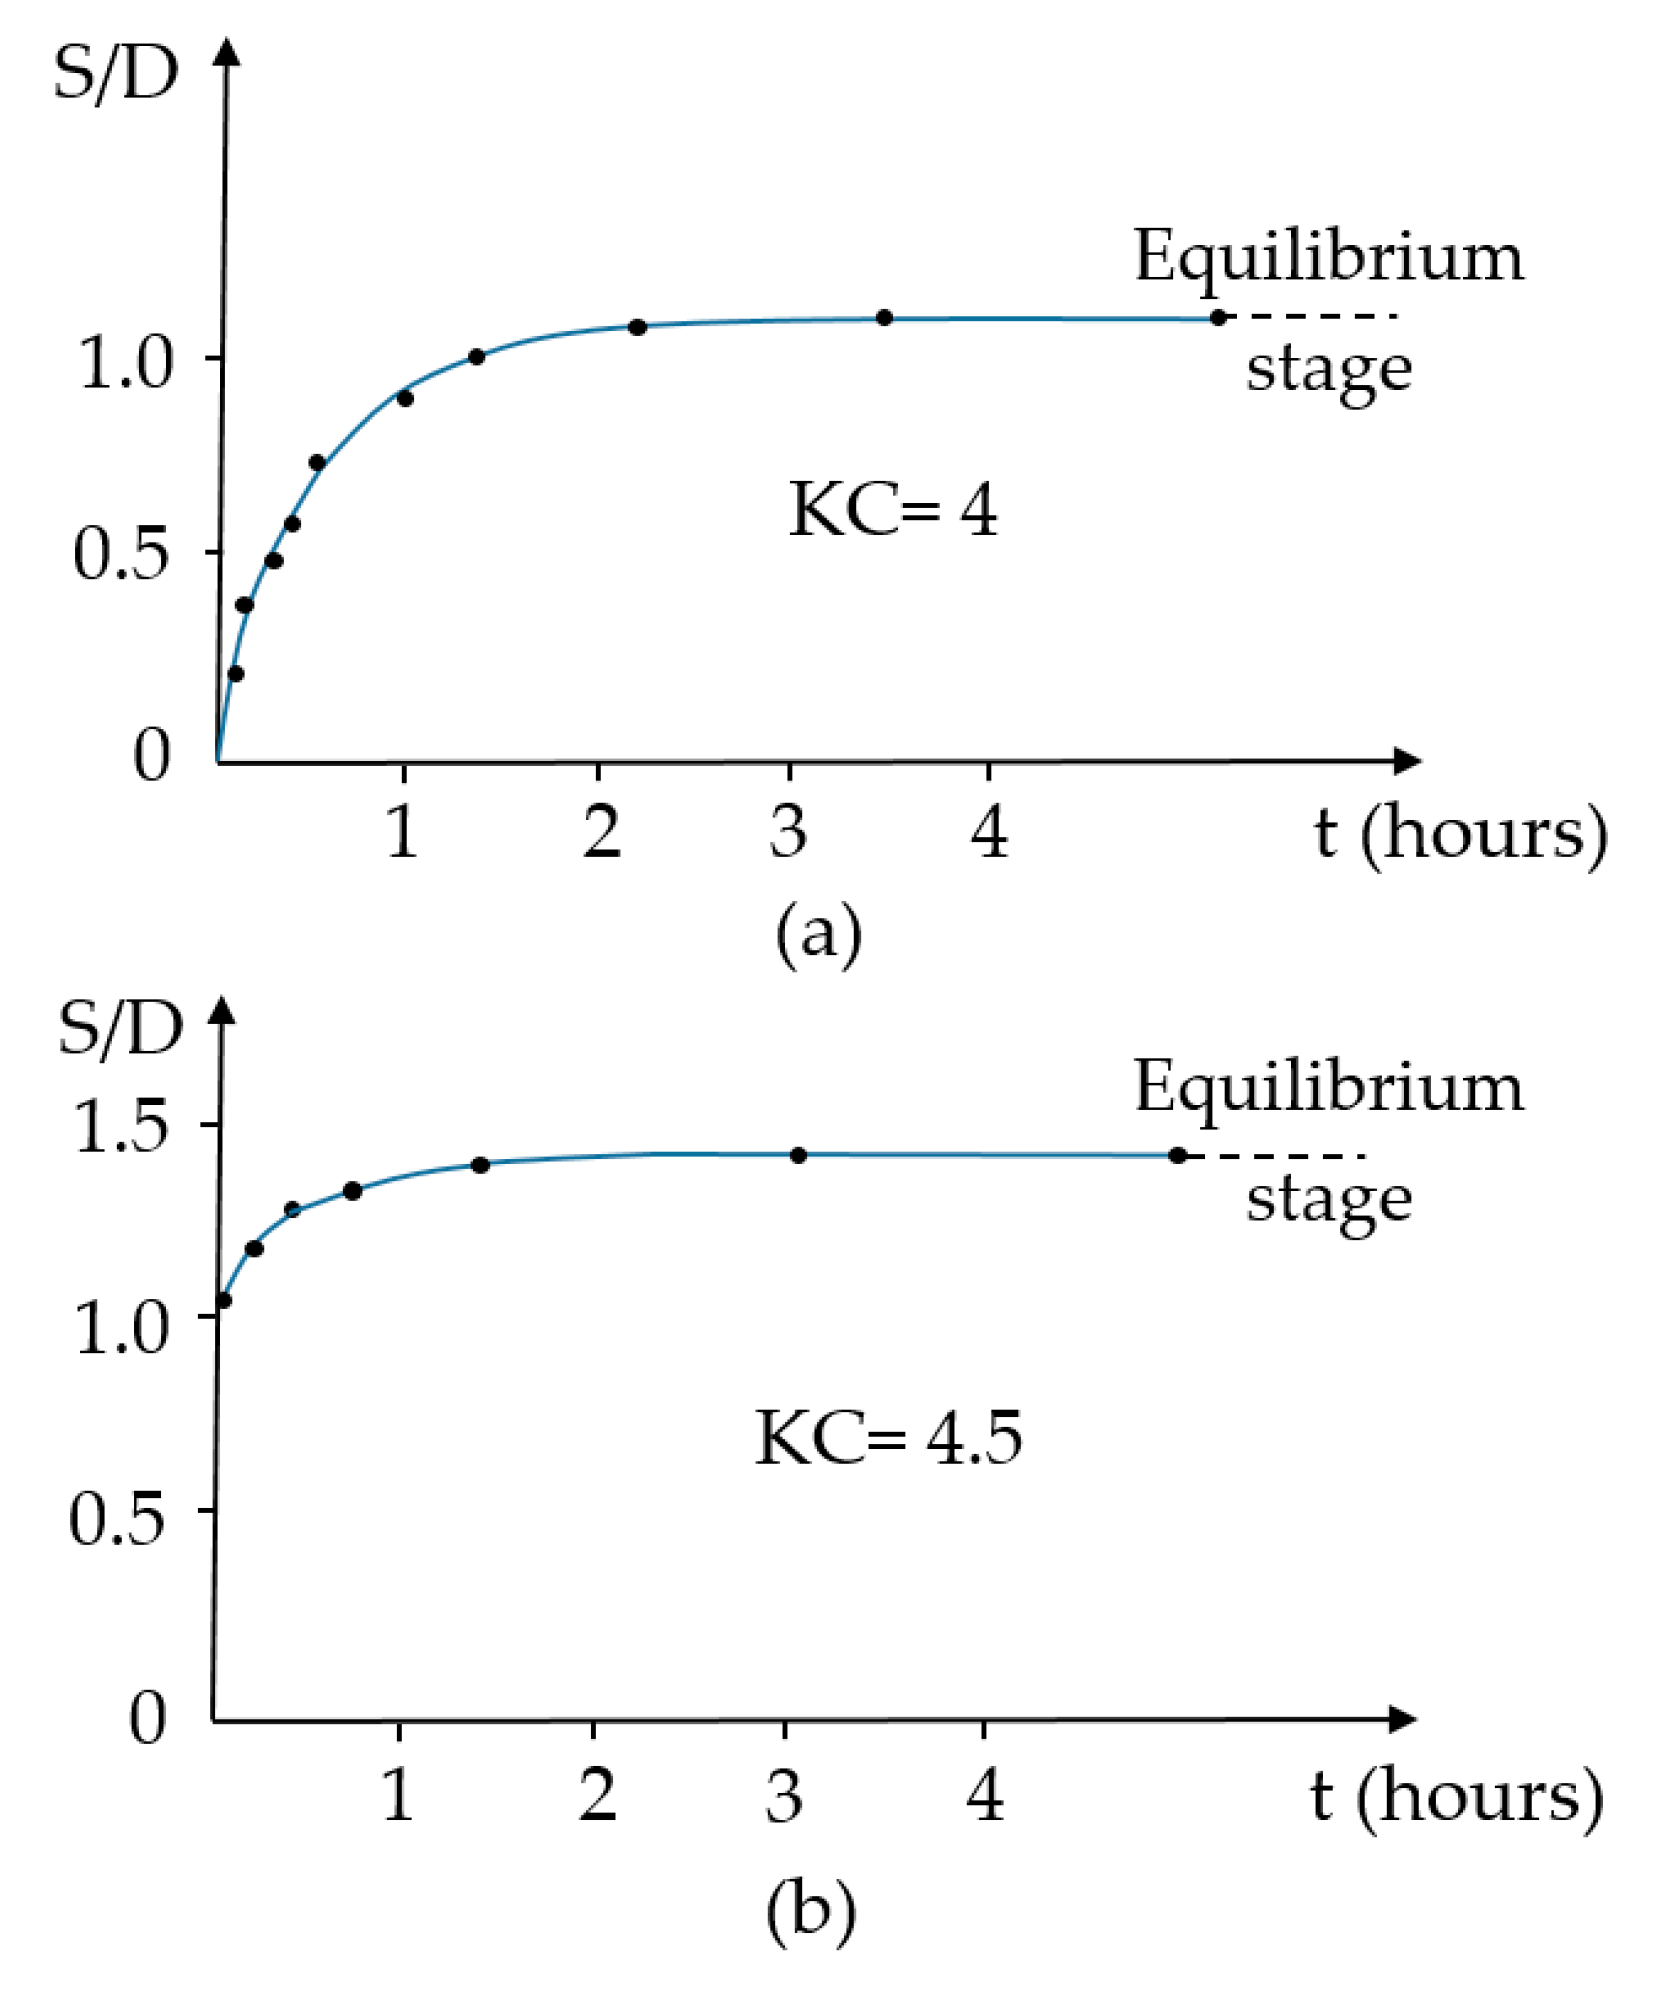
Evidently, it can be seen from Equation (1) that scour depth is a function independent of time. In fact, the scour depth develops toward the equilibrium stage after a certain time, as illustrated in Figure 1. Hence, the depth corresponding to the fully developed stage calculated by Equation (1) is not always achieved. For example, the scour condition corresponding to KC = 4.5 does not always cause the scour depth to reach the equilibrium stage due to its short time occurrence. Therefore, in this study, it is assumed that the scour conditions occur long enough for the scour depth to fully develop. Considering the safety assessment, this assumption is acceptable.
2.2. Probability Distribution of Earthquake
The probability distribution of earthquakes at a specific site is effective to define the probability of occurrence for a specific earthquake intensity. In practice, seismic hazard models can be obtained from the seismic hazard map of Korea for a given site in Korea. Normally, peak ground acceleration (PGA) and spectral acceleration at a certain return period are commonly used. In this paper, the seismic hazard model in terms of PGA is adopted.
2.3. Fragility Analysis
In this study, the allowable horizontal displacement of an SB foundation was used to find the fragility curves, and it was set to 38 mm as described in the AASHTO LRFD Bridge Design Specification for bridge foundation. The form of two-parameter log-normal distribution functions is usually used to define the seismic fragility curves:
where is the fragility which ranges from 0 to 1.0 according to the probability of failure. is the standard normal cumulative distribution function (CDF), and are damage level and the standard deviation, respectively. With the aid of the maximum likelihood method, and can be estimated. It was performed by the function below:
under the influence of an external force with intensity , if the structure becomes damaged, will be assigned, otherwise, it will be set to 0. In this study, is the earthquake intensity (peak ground acceleration, PGA) and is the total number of used earthquake records. Π is the product over i values form 1 to n.
2.4. Estimation of Failure Probability
The conditional failure probability of an SB foundation under the combination of earthquake and scour can be calculated as follows:
where is the maximum possible scour depth and is the maximum intensity of earthquake events (i.e., peak ground acceleration, PGA). The maximum here means that the scour depth (or the earthquake intensity) has a near-zero probability of occurrence. is the occurrence probability of specific scour depth. This probability can be obtained from the PDF of scour depth. Additionally, is the occurrence probability of specific earthquake intensity which can be obtained from the PDF of the earthquake.
The remaining parameter in Equation (5) is the failure probability of structure under the defined damage state . This probability was estimated from the seismic fragility curves of the scoured SB foundation. Fragility curves provide the probability that an intensity measure of an earthquake event will cause the scoured SB foundation to exceed a damage state (). As a result, by integrating the results of scour and earthquake hazard, as well as fragility curves, the SB failure probability was obtained and assessed. During the lifetime of the structure, at the time T-year, the structural failure probability can be calculated by the difference between the total probability and the probability that no damage occurs. Accordingly, the failure probability for T-years was expressed as follows:
where is the annual earthquake occurrence rate at a site of interest. Considering that an earthquake intensity (PGA ≥ , is the minimum PGA) occurs at a rate of per year, the correlation between the probability distribution of the annual maximum PGA, , and the probability of the PGA of one seismic event, , can be expressed:
When is considered, = 0, and Equation (7) becomes:
The probability distribution of the annual maximum PGA, , can be estimased from the data at the field sites. For example, let us assume that the estimated PDF of here is the Type-2 Gumbel distribution with two parameters and as Equation (9). By combining Equations (8) and (9), the annual occurrence rate, , is calculated as Equation (10).
Mathematically, using the infinite series of the exponential function, Equation (6) can be expressed simply as follows:
3. Numerical Analysis
3.1. Example OWT and Modeling
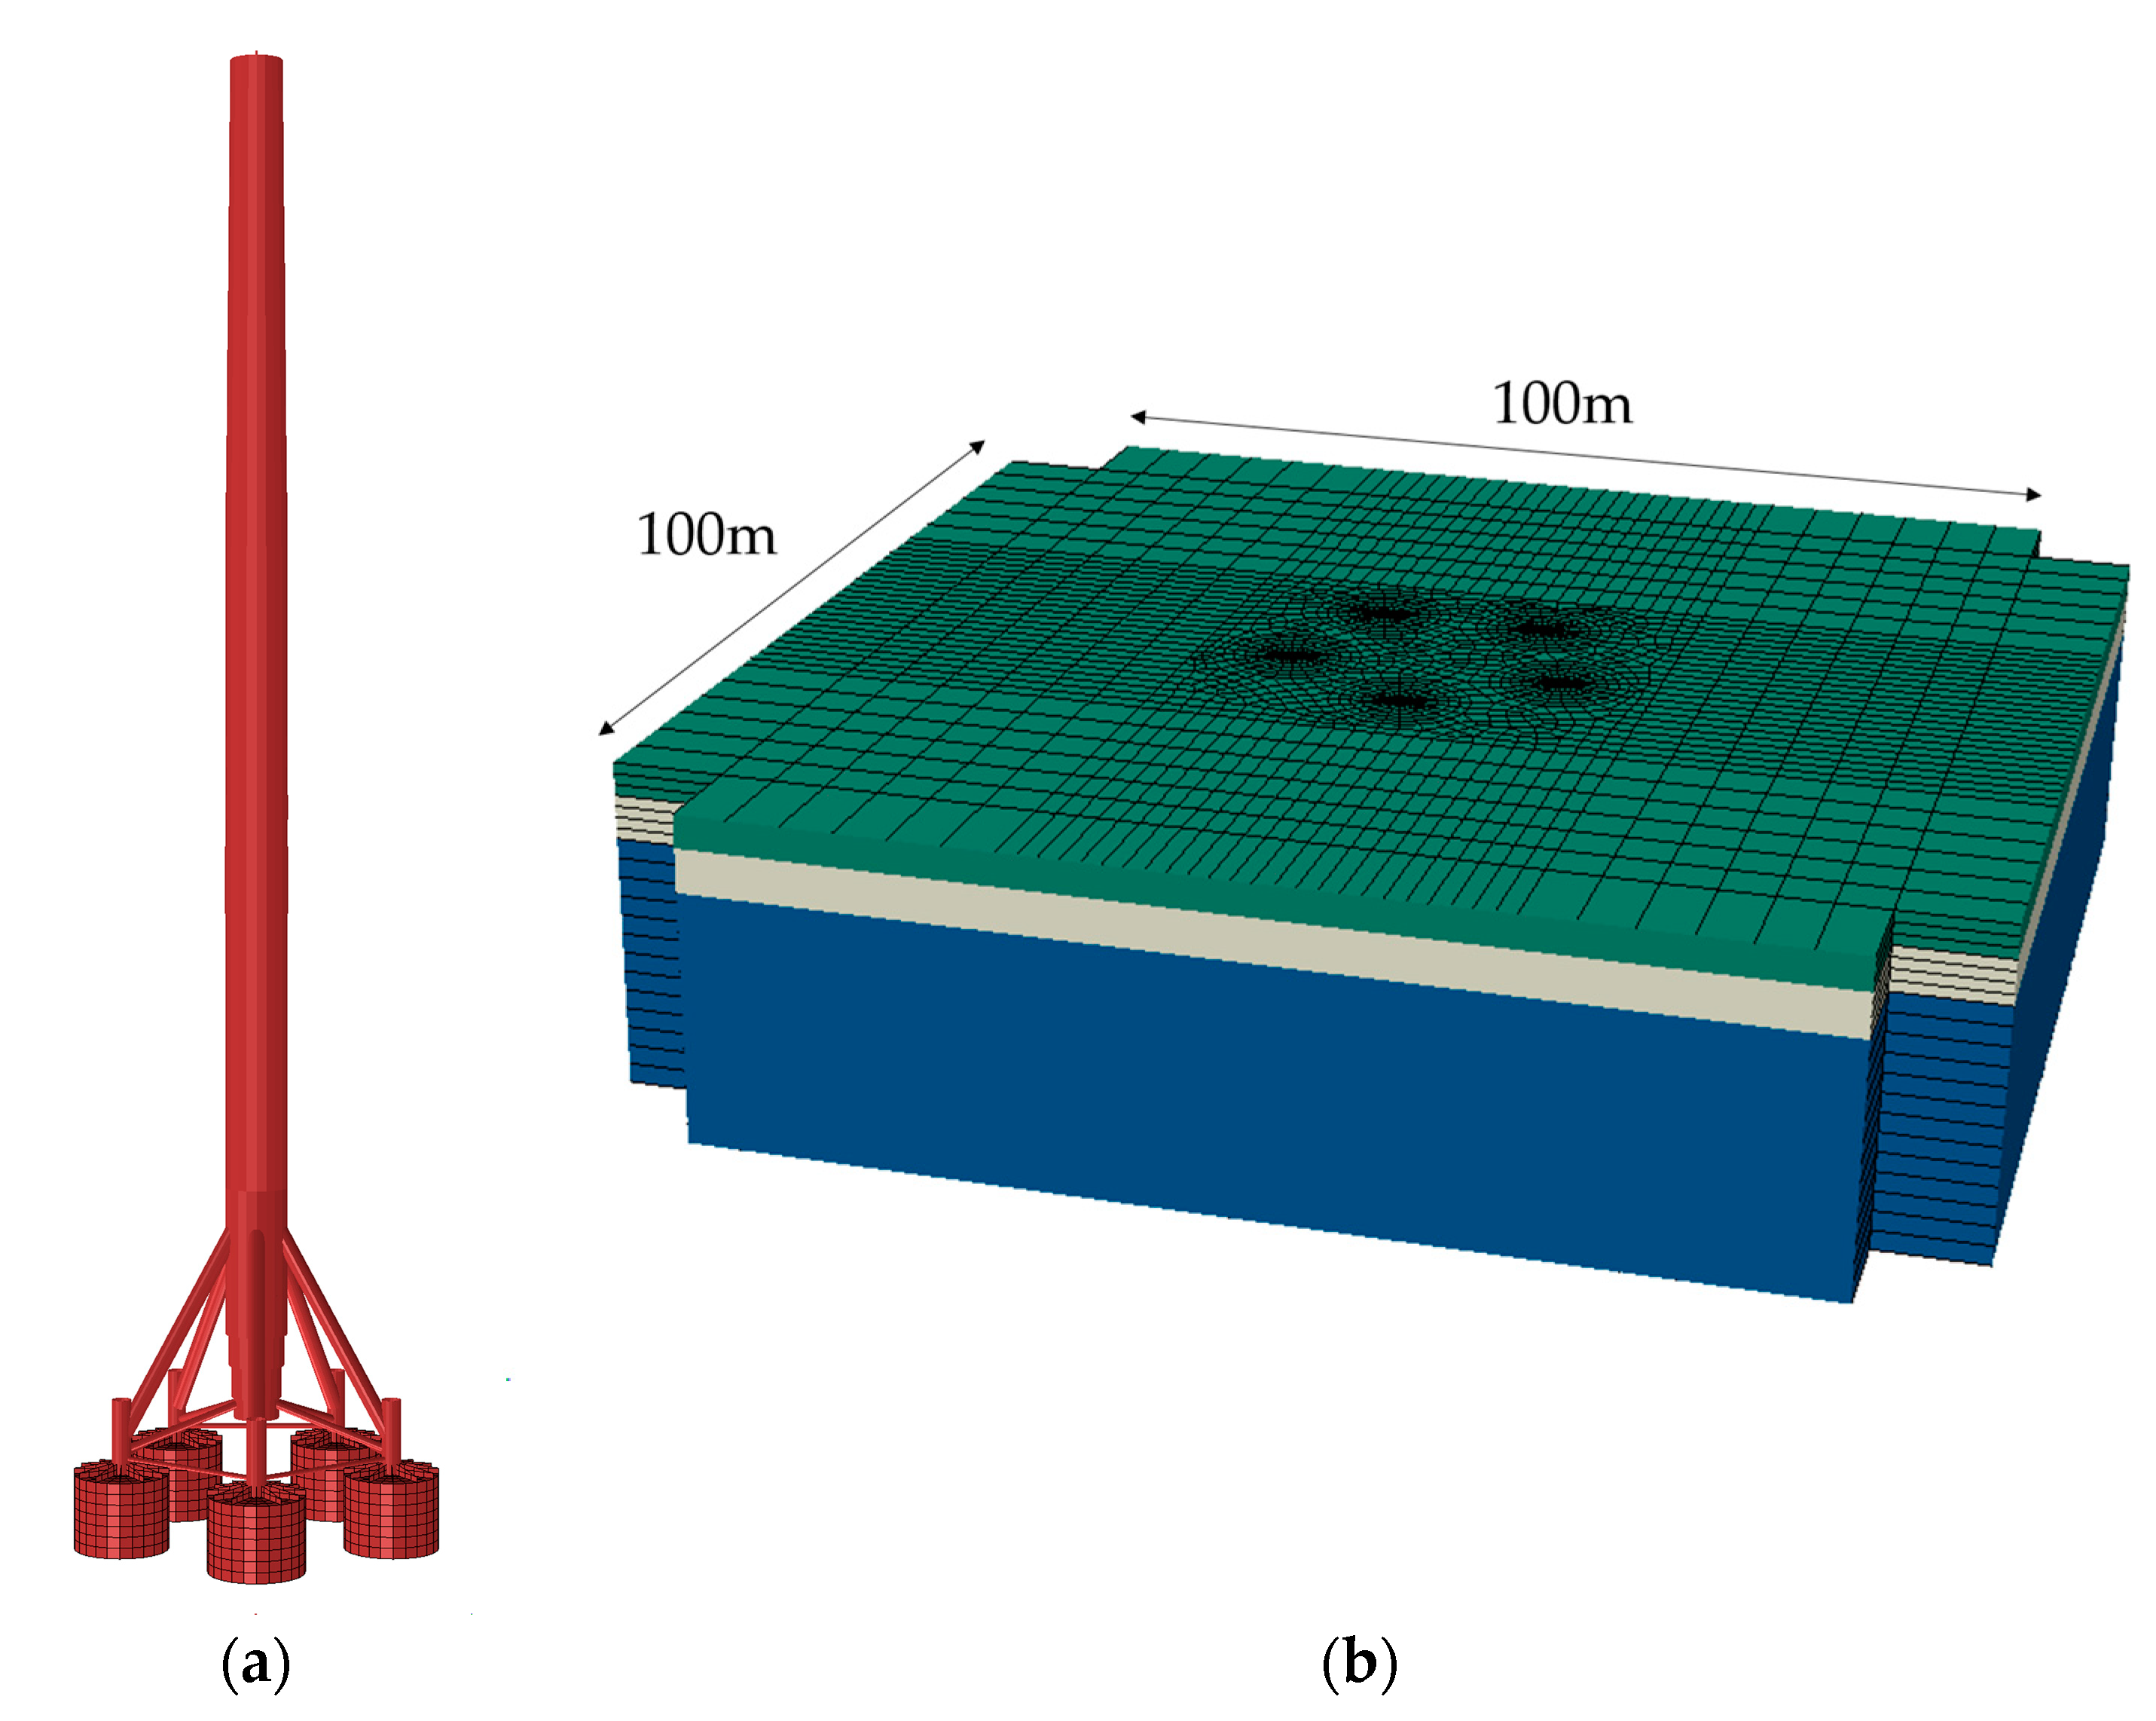
In this study, the FE model of a pentapod SB supporting a 5.5 MW OWT installed on the Gunsan coast in Korea is established in Abaqus [32]. The geographic location of the OWT is shown in Figure 2. The modeling was divided into two main parts, upper structure (OWT) and soil model, as shown in Figure 3. The suction bucket was modeled by shell elements with the parameters of diameter, skirt length, and thickness of 9 m, 7 m, and 0.025 m, respectively. The upper frame structure and the tower were modeled by the beam element. The soil medium is 100 m in length and 30 m in height width, in which the boundary elements are modeled using infinite elements to illustrate the infinity of the soil environment in the fact. The hub–blade–nacelle assembly is minimalistic using an alternative centralized mass and is placed at the top of the tower. To model the interaction between bucket and soil, contact pairs surface-to-surface were used for outer and inner interaction where the normal and tangential behavior must be specified in Abaqus/CAE. Although various uncertainty theories have been established in this study to estimate the sour depth and seismic demand, the unpredictability of structural material has not been investigated. Accordingly, the steel properties used for the tower and substructure were described in Table 1 while masses of tower components are given in Table 2.
Soil properties at the survey site are shown in Table 3. Due to the fact that the suction bucket length (L) is 7 m, the buckets were only embedded in the first two soil layers. To model the scoured seabed, the soil layer within the scour depth was simply removed. Hence, factors related to local scour formation are not considered. The maximum possible sour depth in this study is 3 m. The scour depth is modeled with an interval of 0.5 m. Combined with 40 earthquake records ranging from a PGA of 0.01 to 0.5 g, a total of 3000 analyses were performed to find the seismic fragility curve in this study.
3.2. Occurrence Probability of Scour Depth
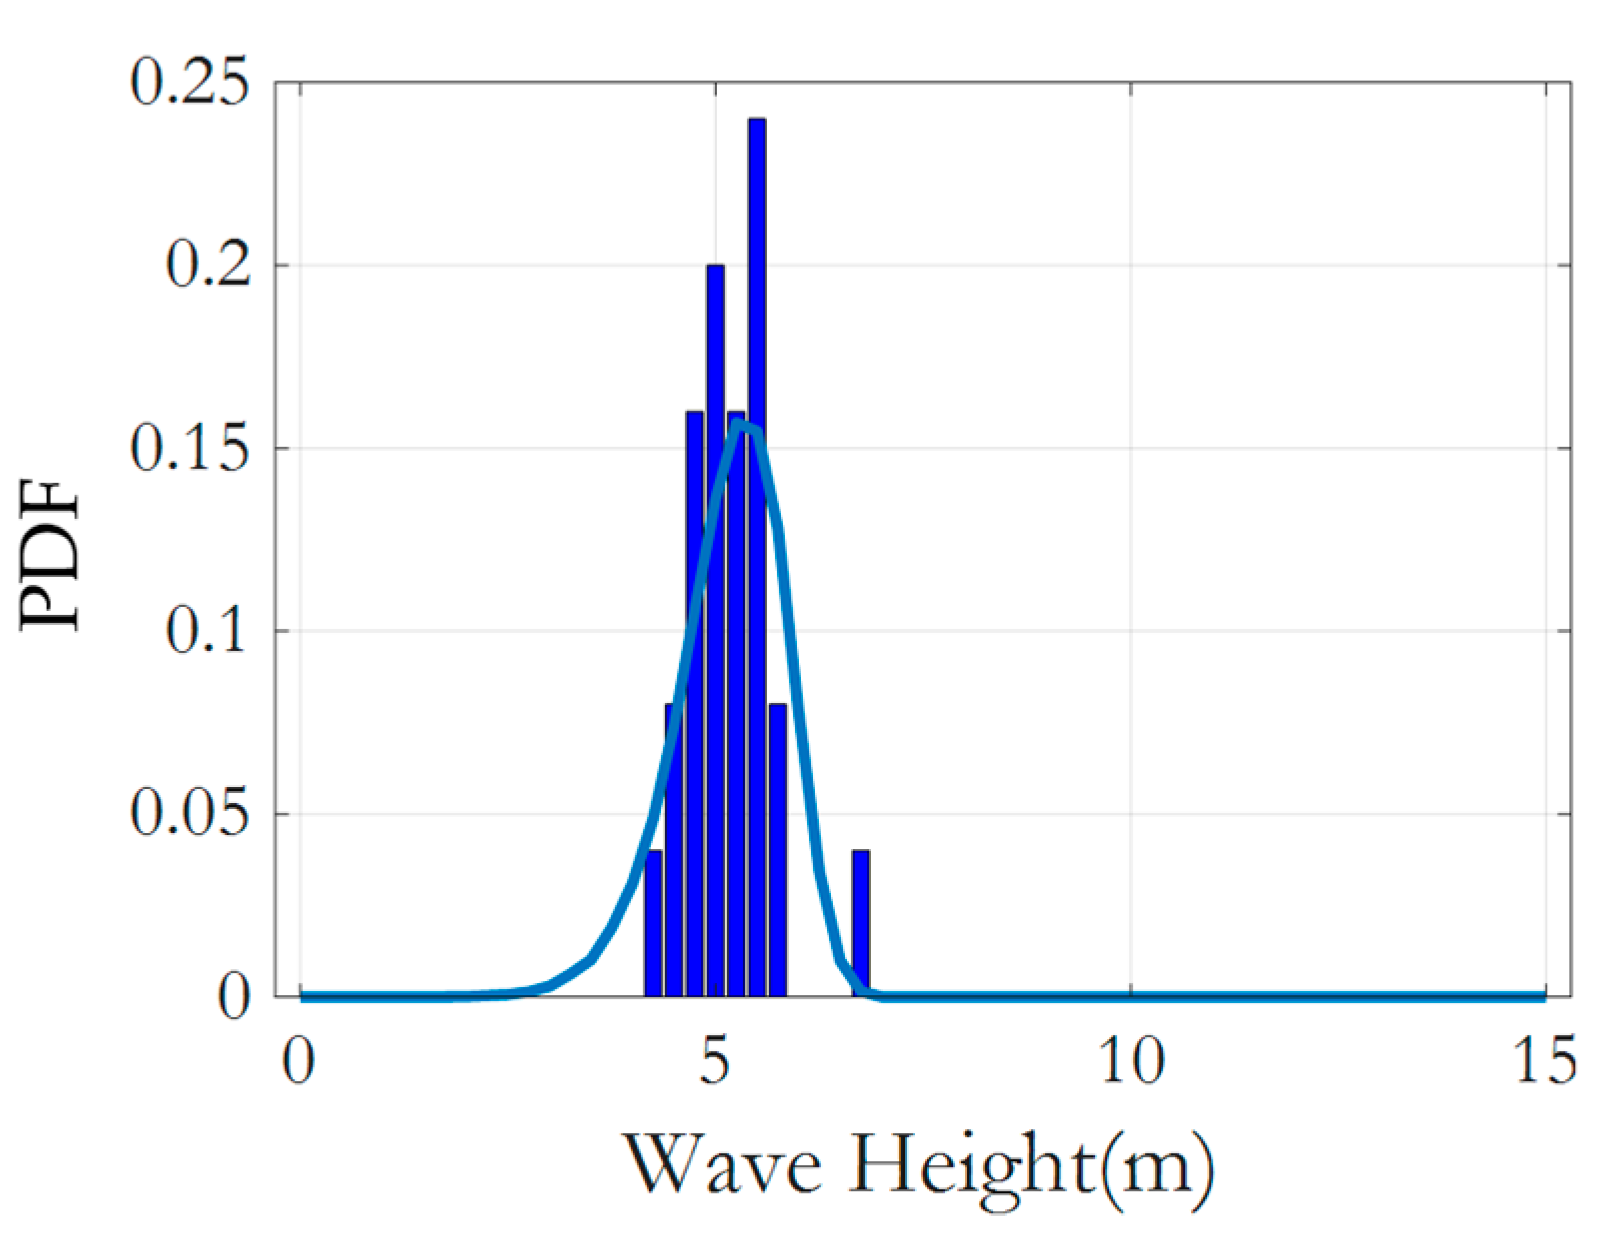
The occurrence probability of scour depth can be conveniently obtained from its probability distribution. As demonstrated in Section 2.1, it is first necessary to determine the distribution of KC’s important parameter. For this purpose, annual significant wave height () data obtained from the HYPA model of the Korea Oceanic Research and Development Institute [33] from 1979 to 2003 were used in this study. In order to find the probability distribution function of the annual significant wave height, different distribution functions, such as Normal, Lognormal, and Weibull, are examined, and their confidence intervals are calculated. The best fit for the available data was the Weibull distribution with mean scale and shape parameters of 5.56 and 9.66, respectively. The probability distribution of () was shown in Figure 4.
As discussed, to calculate the scour depth, it is necessary to know the KC parameter, which is dependent on the peak period wave (). The () parameter can be calculated by using Bretschneider’s wave spectrum with significant wave height (), period (), as follows:
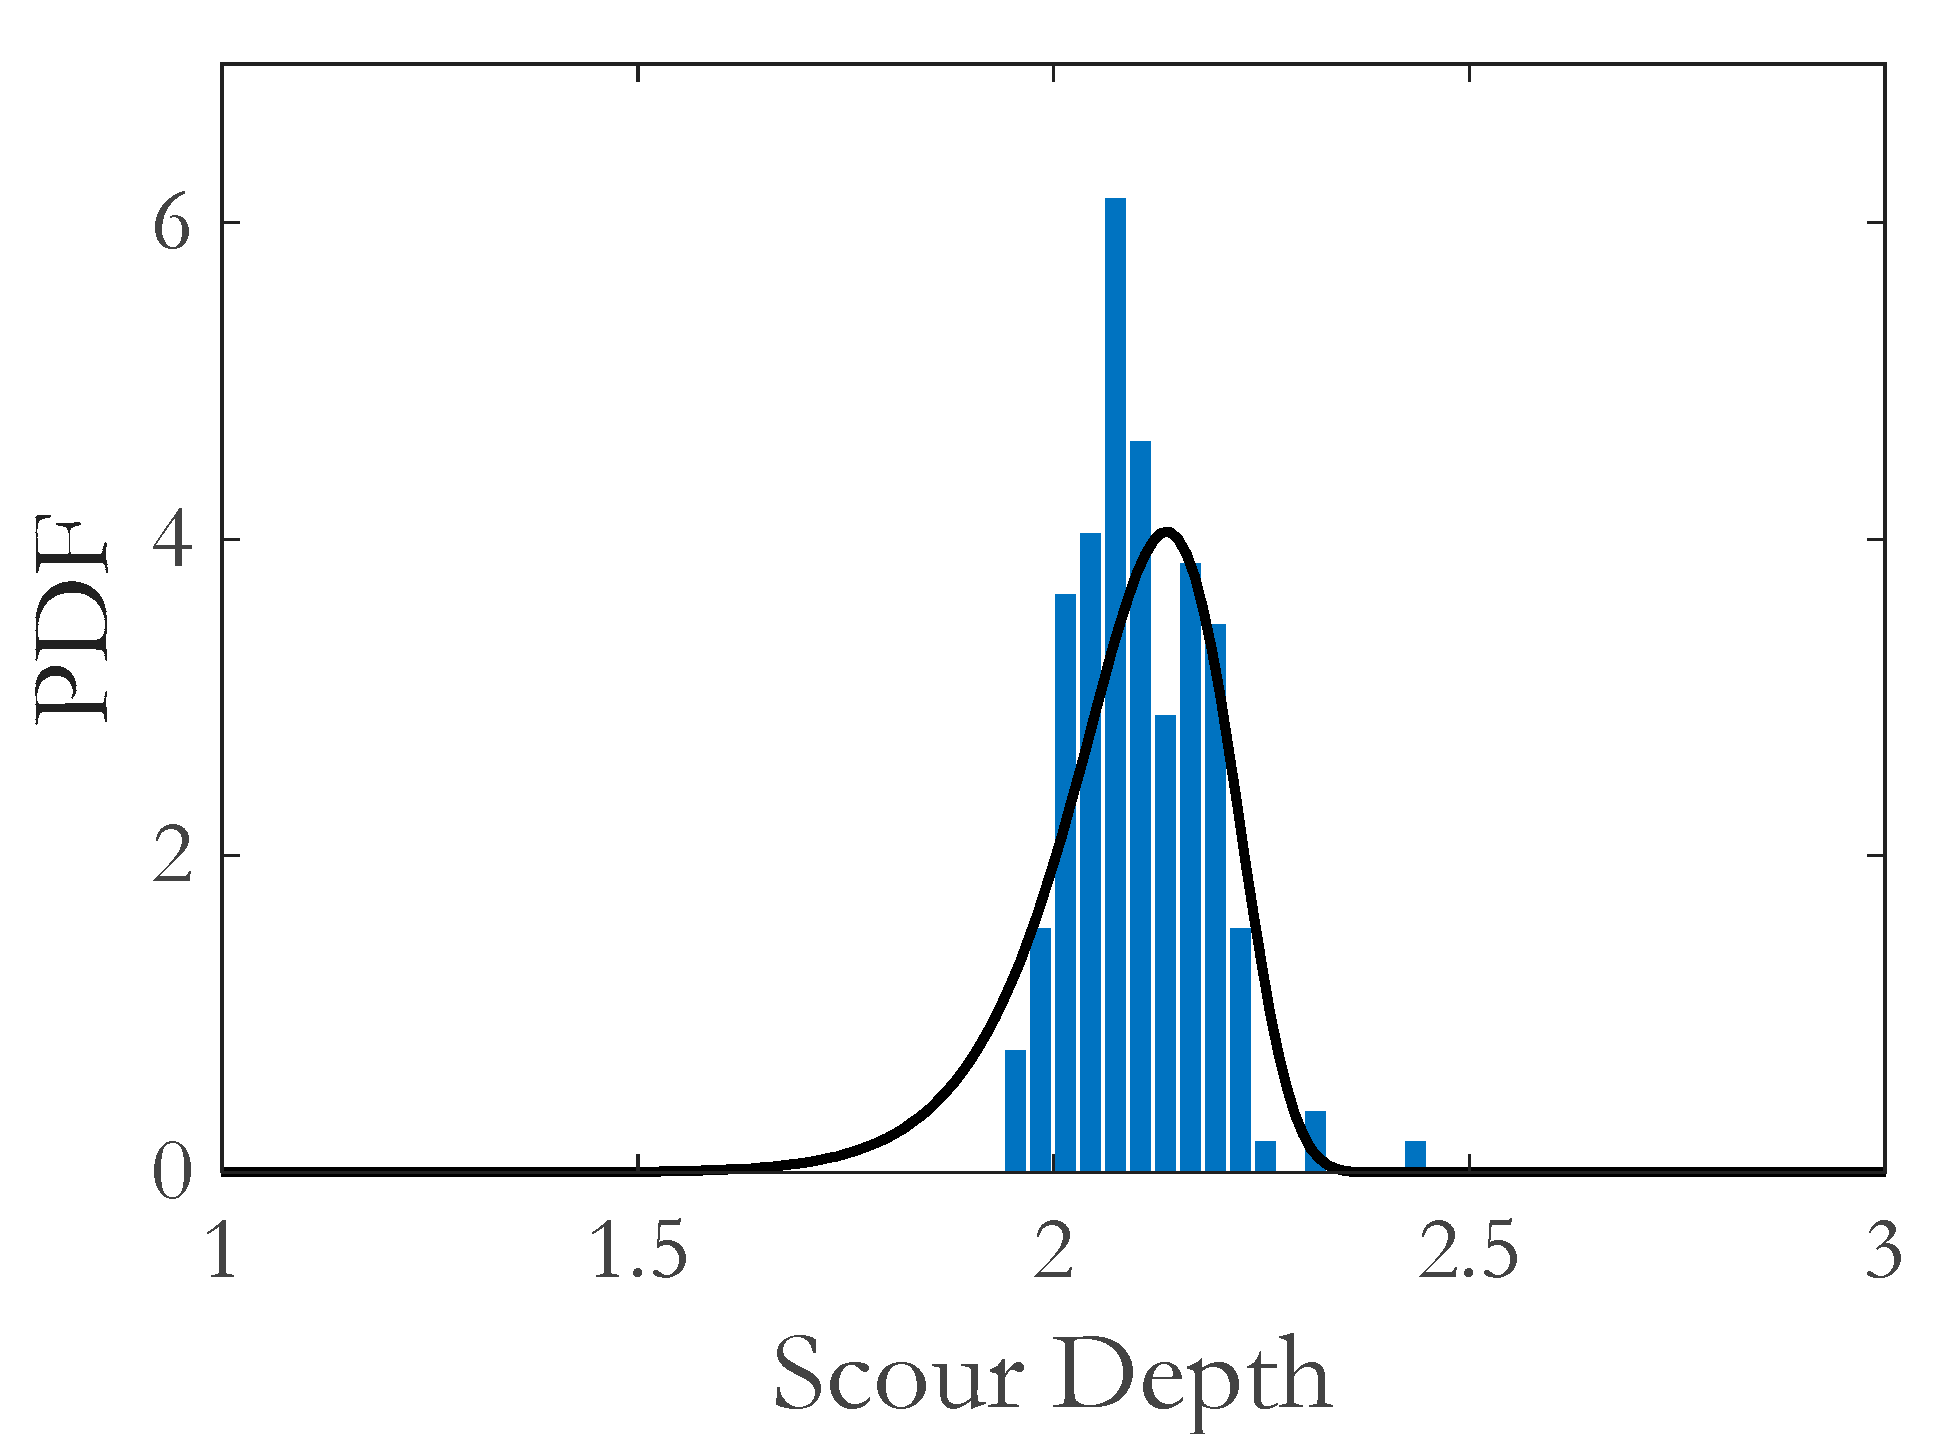
In which . Then, scour depth can be calculated. As per the results, KC was calculated and its probability distribution was presented as Figure 5. Equation (1) shows that only KC values greater than 4 are valid, and the distribution of scour depth was obtained as shown in Figure 6. It was found that a log-normal distribution fits well with two parameters λ and ζ of 0.75 and 0.55, respectively [27].
3.3. Occurrence Probability of Earthquake
Additionally to potential scour hazards, the effects of seismic hazards on the scoured foundation should be taken into account in the risk assessment process. Seismic hazards here are the occurrence probability of the specific earthquake intensity
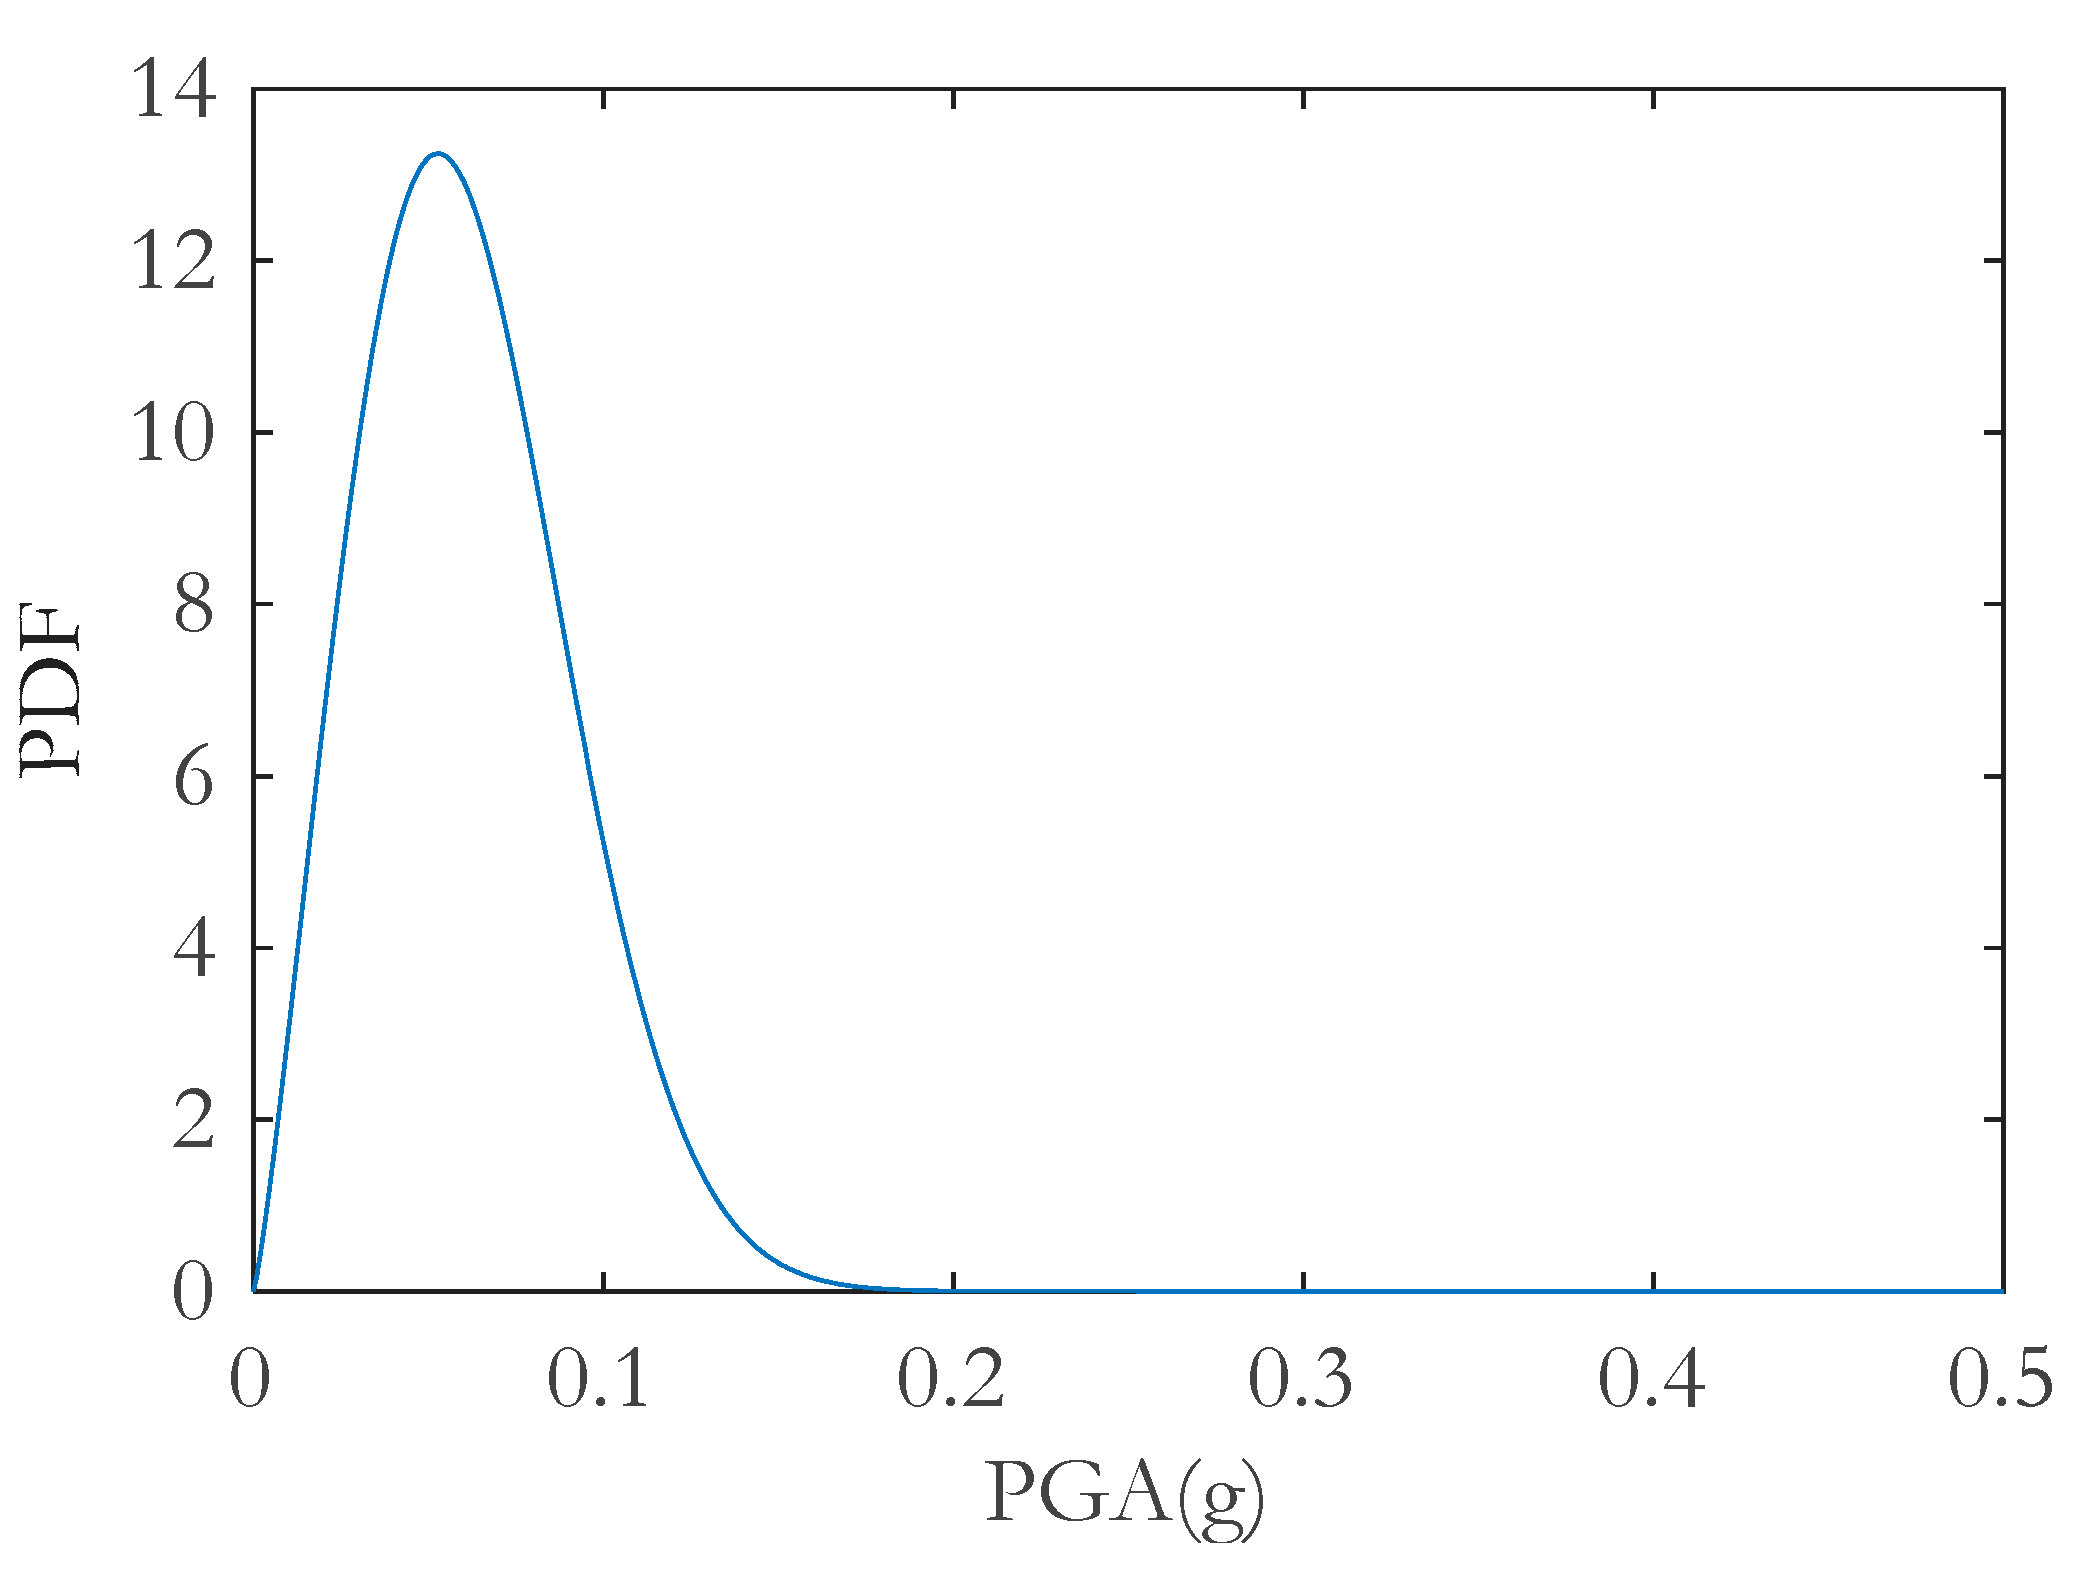
, denoted by , of a specific area (herein, the coast of Gunsan, Korea). This probability can be estimated from the demand probability distribution of the earthquake. Based on the seismic hazard map of Korea, the earthquake probability distribution of Gunsan was presented as Figure 7. It is a Weibull distribution with the shape (k) and scale parameter (b) of 2.2071 and 0.0693, respectively. Its probability density function (PDF) and cumulative distribution function (CDF) were presented by the following equations:
3.4. Fragility Analysis of Scoured SB Foundation
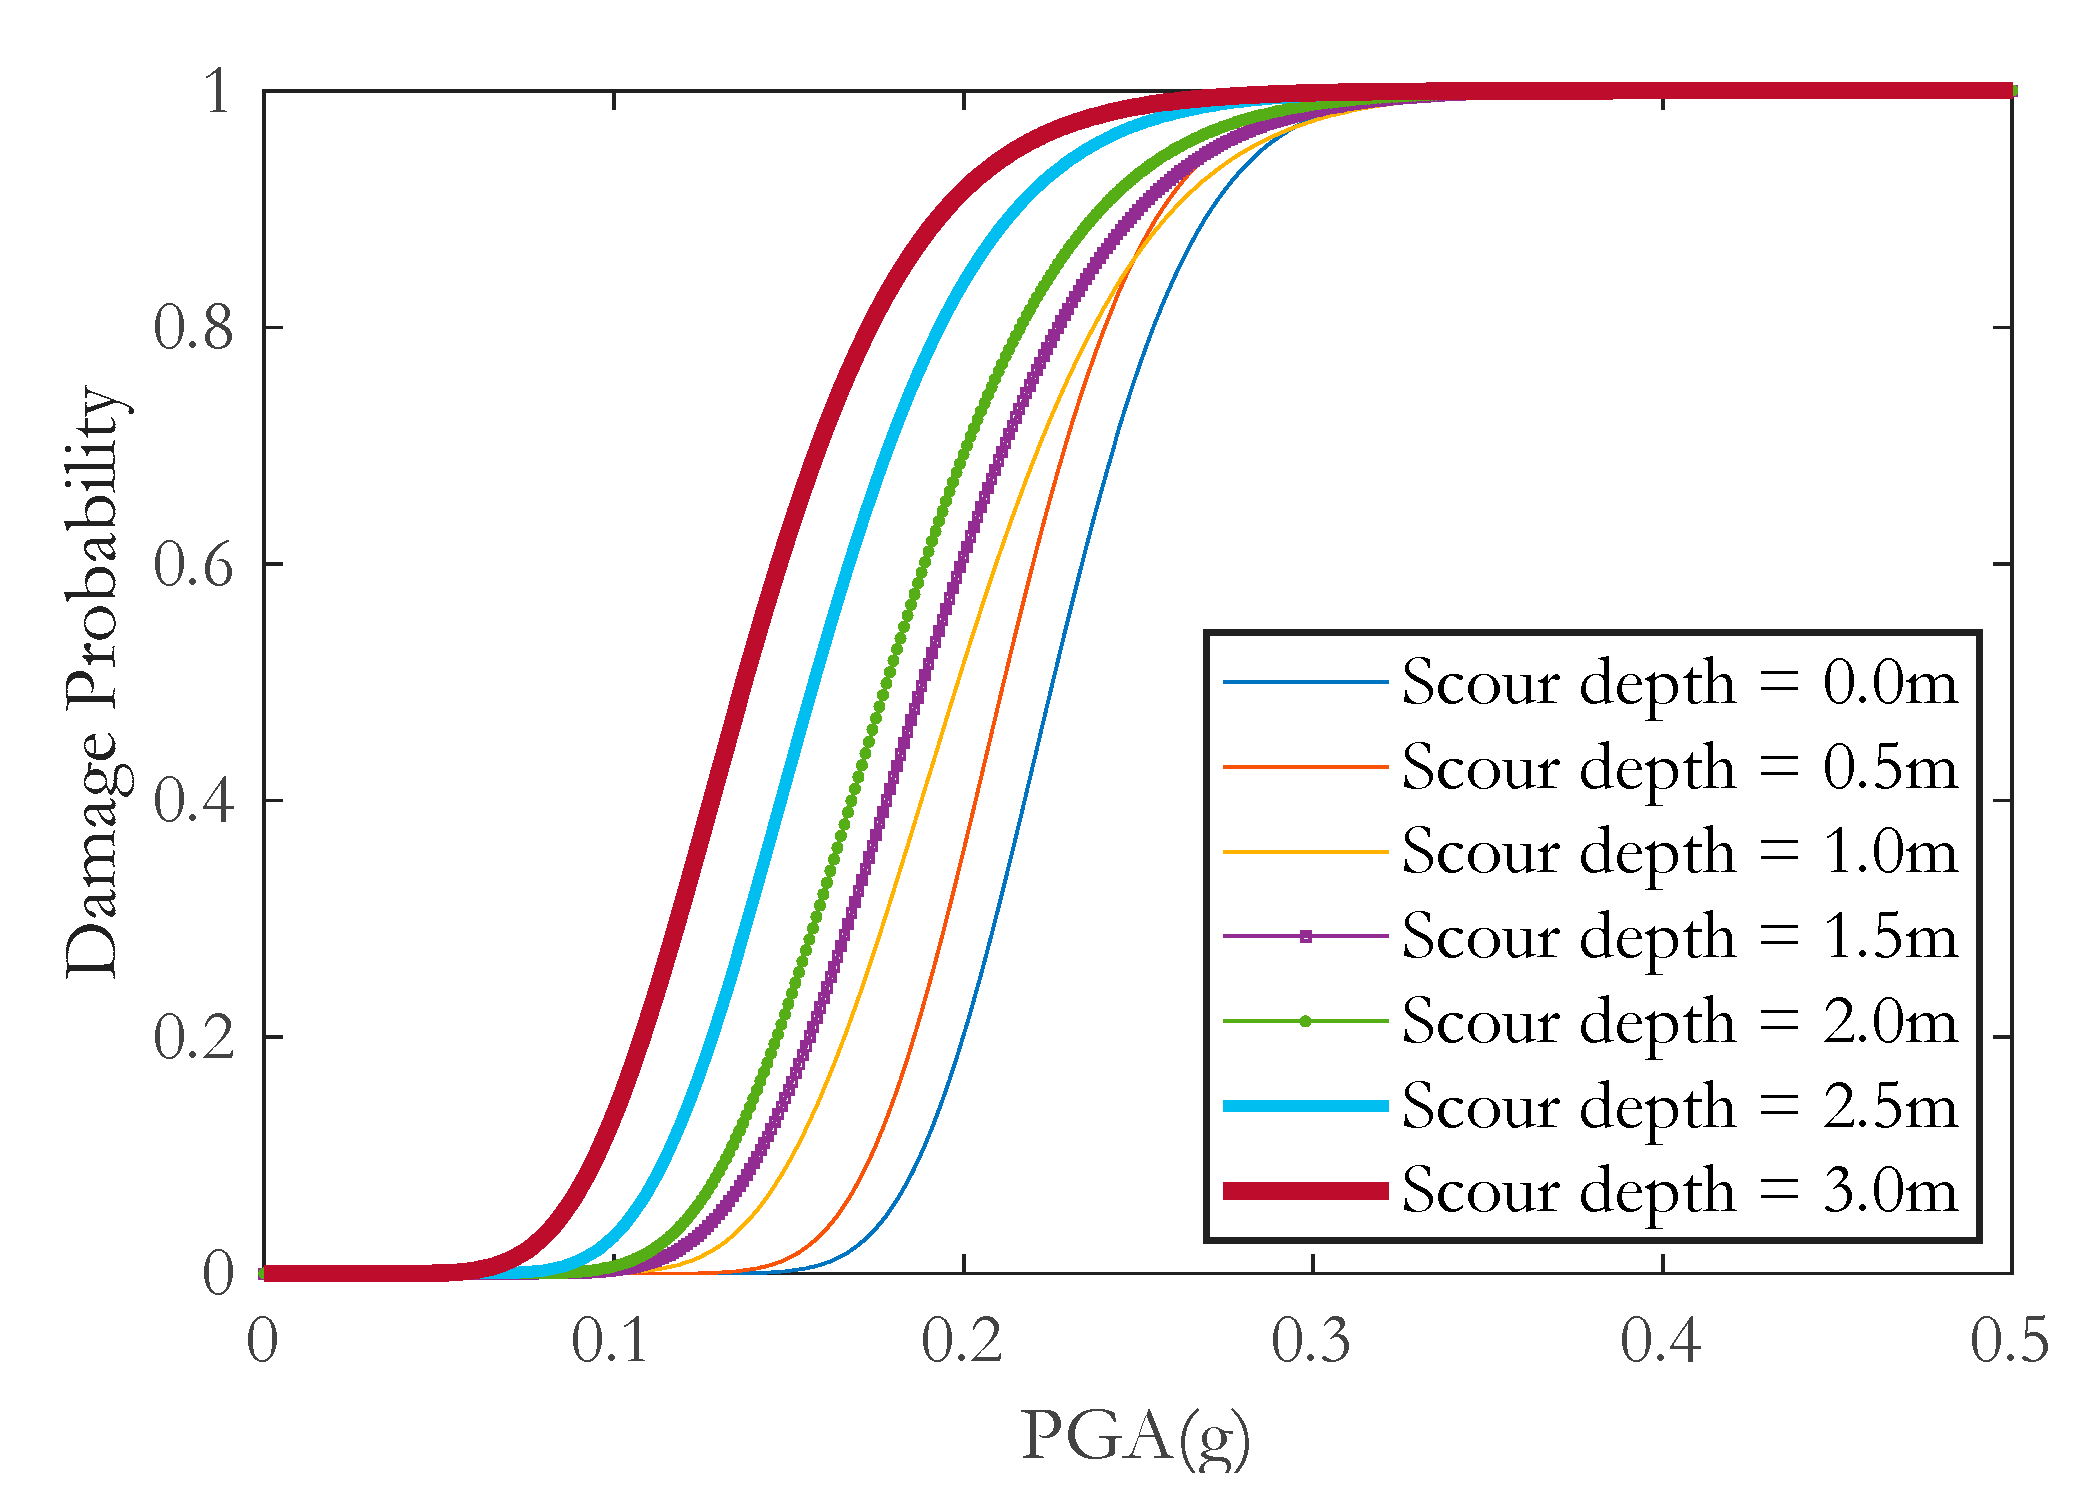
Fragility curves were established in this study as the relationship between earthquake intensity (PGA) and the probability of exceeding the allowable horizontal displacement of the SB foundation. To find the fragility curves, a series of nonlinear time–history analyses were performed on the OWT model with and without scour conditions. By using the selected earthquake records, the seismic responses are then evaluated. For each analysis, the probable damage state of the SB foundation is determined if its maximum horizontal displacement exceeds the allowable displacement. The definition of damage state has been derived into four levels as severe, considerable, moderate, and small corresponding to 100%, 90%, 80%, and 70% of the allowable displacement, respectively. The fragility curves are shown in Figure 8 prior to any scour event. Figure 8 indicates that, at the small damage state, the probability of damage rapidly approaches a high probability (>50%) when the PGA becomes greater than 0.2115 g, whereas this parameter at a moderate, considerable, and severe damage state is 0.2255 g, 0.2545 g, and 0.3040 g, respectively. Considering the scour effects, Figure 9 shows the fragility curves of the SB foundation at the moderate damage state. As it can be seen from this figure, the exceeding probability of a specific damage state is proportional to the scour depth. This trend is similar for all earthquake intensities and it was explained that the removal of more soil increases the extent of degradation of the foundation.
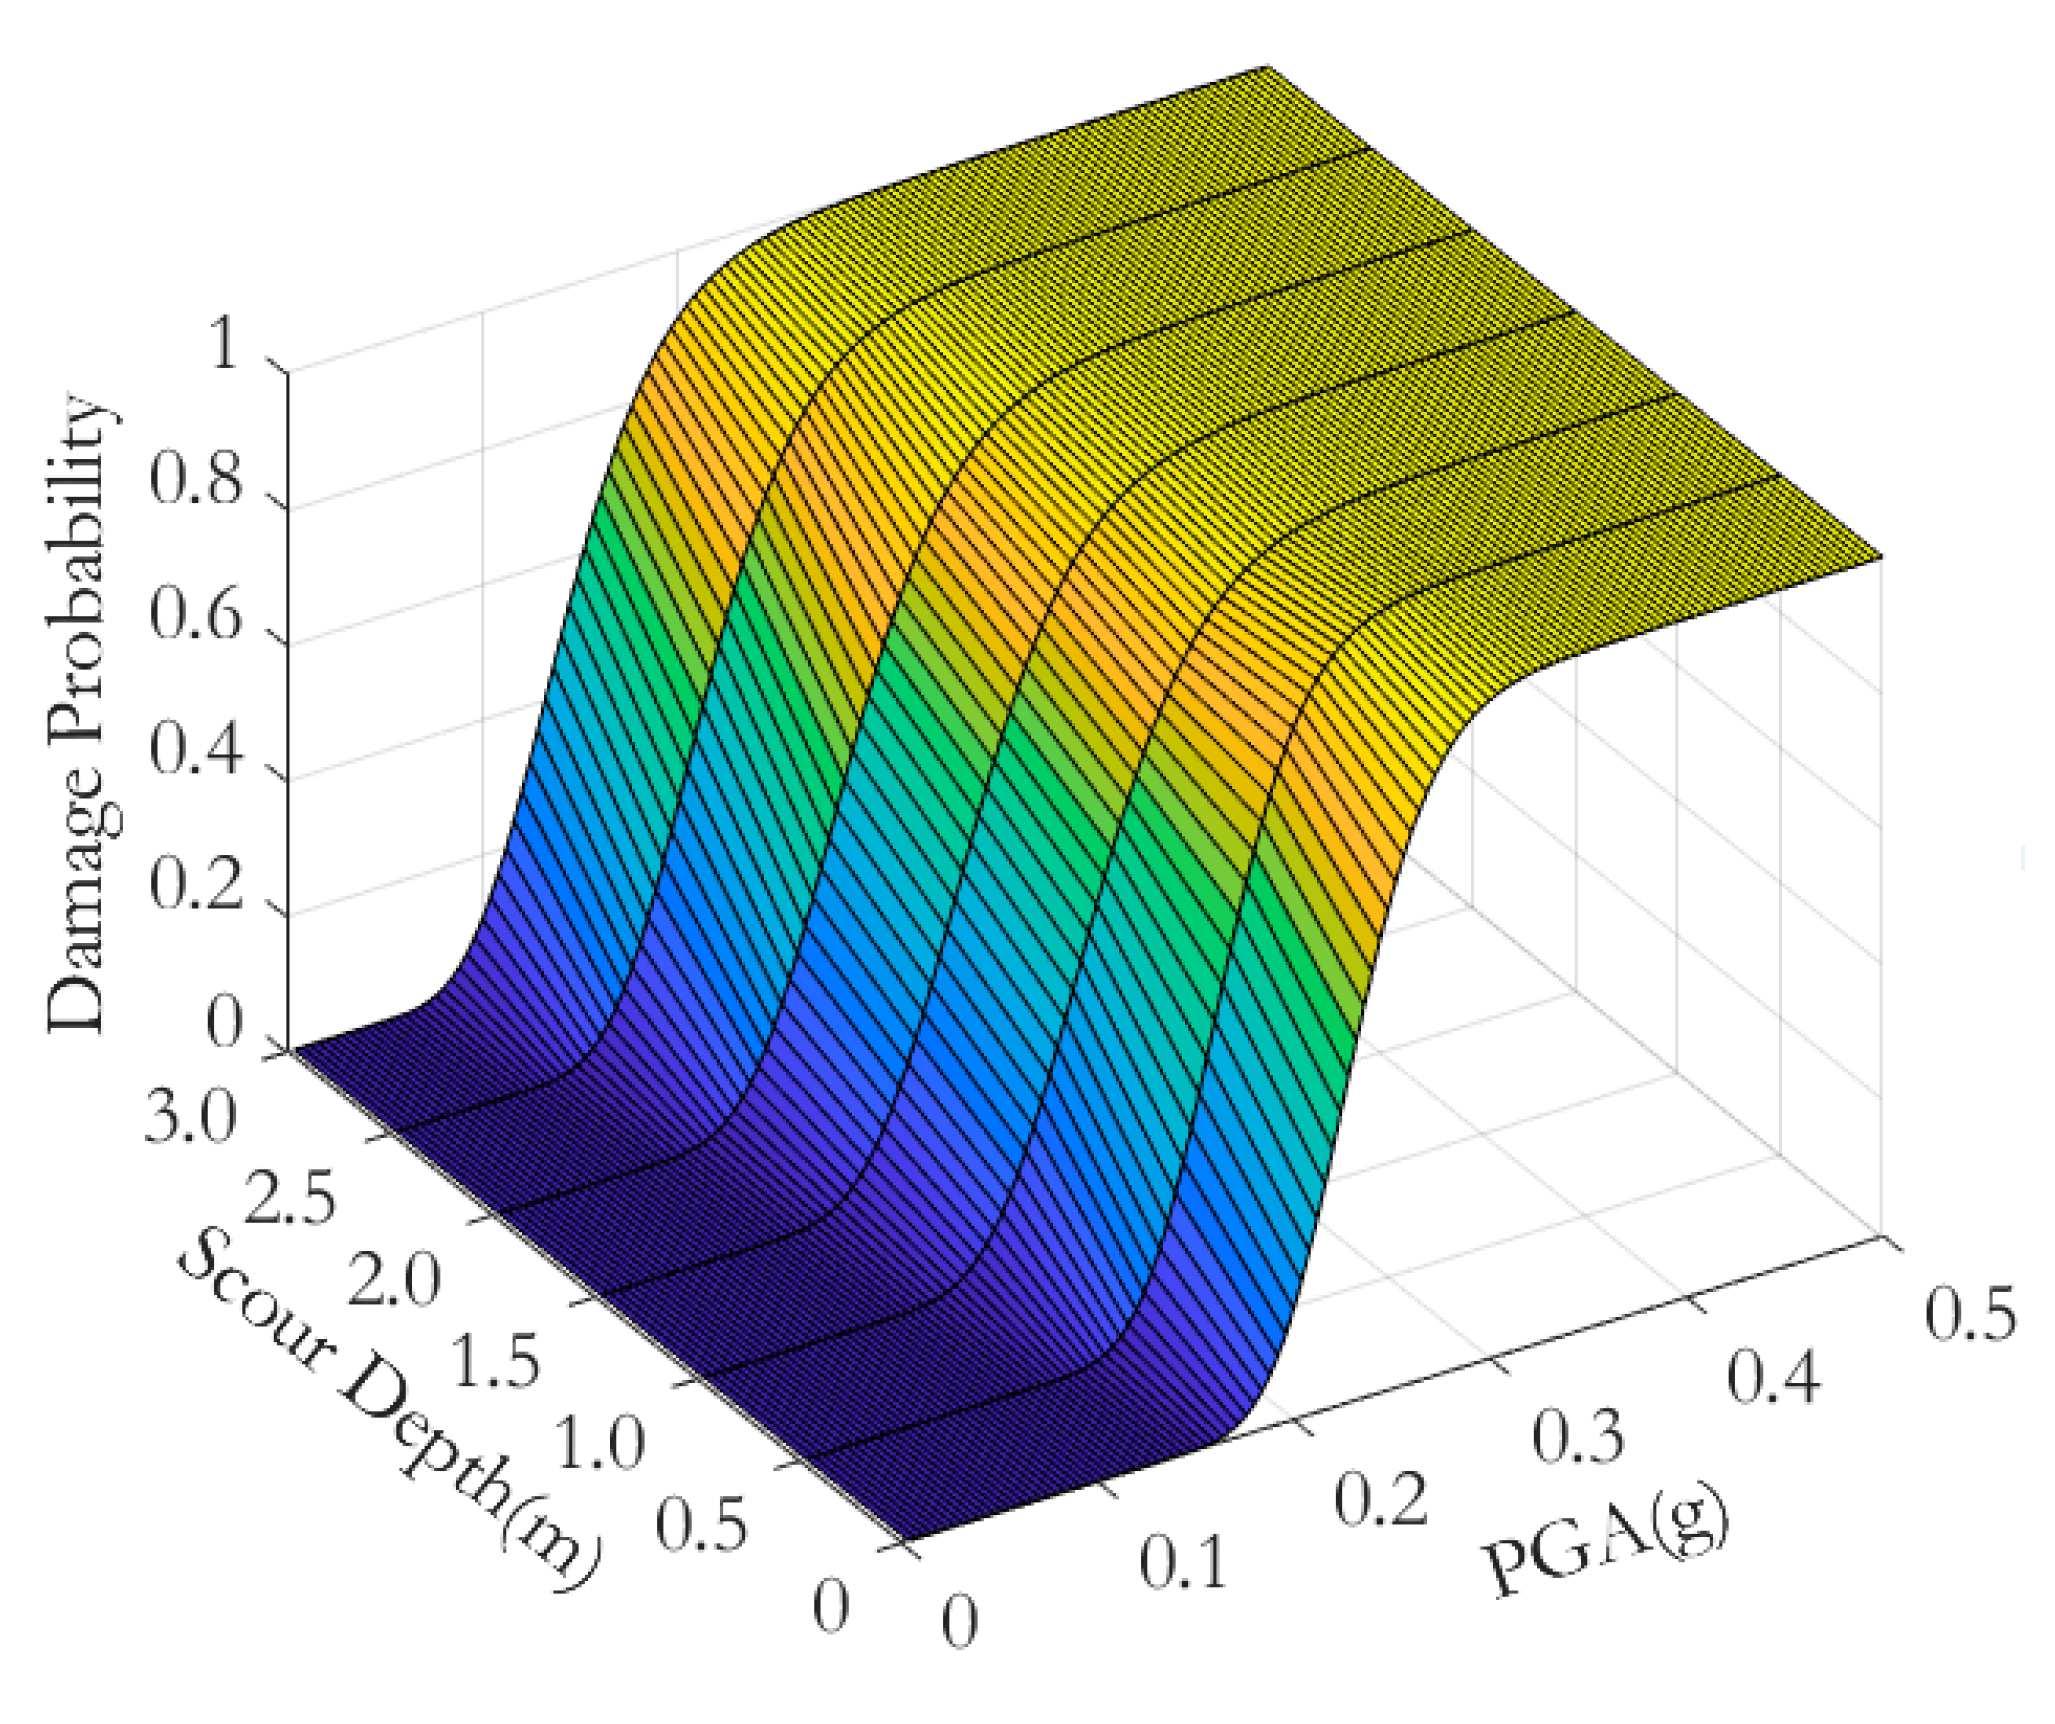
For further illustration, the vulnerability of a scoured OWT foundation to earthquakes in terms of PGA was also present by the fragility surface, as shown in Figure 10. It is evident from Figure 10 that, when the PGA is 0.2255 g, the probability of damage increases from 0.5 to 0.966 with the increase in scour depth. With a PGA = 0.0614 g (equivalently corresponding to an occurrence probability of 50%), the probability of damage is still insignificant (around 0.0036) even if the scour depth reaches the maximum possible depth (3 m).
3.5. Failure Probability Results
Fragility curves, the product of scour, and earthquake hazard are here to be combined to calculate the failure probability. In this study, the failure occurs when the horizontal displacement of the SB foundation exceeds the allowed displacement (0.038 m). The occurrence probability of a specific earthquake intensity on the specific site where an OWT is located can be efficiently evaluated using the PDF of the earthquake, which can be obtained from seismic hazard maps in Korea. Then, the failure probability is calculated by Equation (5), whereas its values for several service years can be obtained by using Equation (11). Table 4 summarizes the results of failure probability for a one-time occurrence of a hazard event, and several service years (in this study, 20, 50, 100, and 200 years are considered) at the moderate and severe damage states. The calculated failure probabilities were compared with the target probability of failure or its equivalent reliability index for assessment. The probability of failure can be converted into a reliability index as in Equation (15) and the results are shown in Table 5. The annual target reliability index can be referred to from some design standards. DNV GL [3] and IEC 61400-1 [34] propose the annual target reliability index of 3.719 and 3.3, respectively. The results of the analyses presented in Table 4 and Table 5 evidence that the probability of causing moderate-to-severe structural damage under the effect of scour and earthquakes is relatively small. Specifically, the reliability indices for one occurrence of a hazard event are 3.324 and 4.523 at a moderate and severe damage state, respectively. Compared to the annual target reliability index mentioned in IEC, these values both exceeded the target reliability index. However, the reliability index for one occurrence of a hazard event at the moderate damage state is less than the acceptable level in the DNV standard (3.324 < 3.719). Even though the risk for 200 years of both damage stages is 0.217 and 0.0013, respectively, it can still be considered as a relatively small damage.
4. Conclusions
This study proposed a multi-hazard reliability-based framework to evaluate the performance of an SB foundation supporting OWTs under the combination of scour and earthquake. First, the seismic vulnerability of a structure is evaluated in the form of fragility curves by using the range of possible combinations of earthquake intensity and scour depth. The maximum possible values of earthquake intensity and scour depth were determined based on their PDF. Finally, the failure probability of the structure was calculated by integrating the results of scour, earthquake hazard, and fragility curves. The proposed framework finally provided the single failure probability value of the structure on the specific site with the specific scour and earthquake conditions. In the current study, several highlighted conclusions are summarized as follows:
- -
- In the survey area, the earthquake intensity (PGA) with a 50% occurrence probability of occurrence is 0.0614 g, and the damage probability of the SB foundation, in this case, is 0.0036 when scour depth reaches the maximum possible depth (3 m).
- -
- The reliability indices for one occurrence of a hazard event at moderate and severe damage states are 3.342 and 4.523, respectively. Both values are greater than the target reliability index mentioned in IEC standards. Compared to the target reliability index proposed by DNV GL standards, one occurrence of a hazard event can be caused moderate damage. The final results of the OWT model case study indicate that, with the condition of scour and earthquake on the Gunsan coast, the SB foundation located here has a reliability index accepted by some design codes (DNV and IEC).
Although the authors believe that there are still other aspects of the environment that affect the randomness of the scour depth that should be considered to illuminate the regional effect, such as the randomness of wave velocity and seabed properties, etc., this paper still provides a suitable approach to evaluate the structural risk under multi-hazard events and can be applied to other extreme events in its entirety.
Author Contributions
Conceptualization, D.-V.N. and D.-H.K.; methodology, D.-V.N. and D.-H.K.; software, D.-V.N. and Y.-J.K.; validation, D.-H.K.; formal analysis, D.-V.N.; data curation, D.-V.N.; writing—original draft preparation, D.-V.N.; writing—review and editing, D.-V.N. and D.-H.K.; supervision, D.-H.K. All authors have read and agreed to the published version of the manuscript.
Funding
This work was supported by the Human Resources Development of the Korea Institute of Energy Technology Evaluation and Planning (KETEP) grant funded by the Korea government Ministry of Trade, Industry, and Energy (No. 20214000000180) and by the Korea Institute of Energy Technology Evaluation and Planning (KETEP) grant funded by the Korea government (MOTIE) (No. 20224000000220, Jeonbuk Regional Energy Cluster Training of human resources).
Data Availability Statement
Not applicable.
Conflicts of Interest
The authors declare no conflict of interest.
References
- Offshore Wind Farms in South Korea. Available online: https://www.4coffshore.com/windfarms/south-korea/ (accessed on 20 October 2022).
- Offshore Wind Market Analysis: South Korea Raises Capacity Target to 18–20 GW for 2030. Available online: https://www.infolink-group.com/energy-article/Offshore-wind-market-analysis-South-Korea-raises-capacity-target-to-18-20-GW-For-2030 (accessed on 25 October 2022).
- DNV-OS-J101-Design of Offshore Wind Turbine Structures; DET NORSKE VERITAS 2014; DNV: Copenhagen, Denmark, 2014.
- Melling, G.J. Hydrodynamic and Geotechnical Controls of Scour around Offshore Monopiles. Ph.D. Thesis, University of Southampton, Southampton, UK, 15 June 2015. [Google Scholar]
- Tempel, J.V.D.; Zaaijer, M.B.; Subroto, H. The Effects of Scour on the Design of Offshore Wind Turbines; The East of England Energy Group (EEEGR): Newcastle, UK, 2004. [Google Scholar]
- Li, J.; Guo, Y.; Lian, J.; Wang, H. Scour effects on the bearing capacity of multi-bucket jacket foundation for offshore wind turbines. Ocean Eng. 2022, 259, 111848. [Google Scholar] [CrossRef]
- Zhao, X.; Zhang, P.; Lv, Y.; Ding, H. Scour effects on bearing capacity of composite bucket foundation for offshore wind turbines. Mar. Georesour. Geotechnol. 2020, 38, 223–237. [Google Scholar] [CrossRef]
- Ngo, D.-V.; Kim, Y.-J.; Kim, D.-H. Seismic Fragility Assessment of a Novel Suction Bucket Foundation for Offshore Wind Turbine under Scour Condition. Energies 2022, 15, 499. [Google Scholar] [CrossRef]
- Jiang, W.; Lin, C.; Sun, m. Seismic responses of monopile-supported offshore wind turbines in soft clays under scoured conditions. Soil Dyn. Earthq. Eng. 2021, 142, 106549. [Google Scholar] [CrossRef]
- Prendergast, L.J.; Gavin, K.; Doherty, P. An investigation into the effect of scour on the natural frequency of an offshore wind turbine. Ocean Eng. 2015, 101, 1–11. [Google Scholar] [CrossRef] [Green Version]
- Guan, D.; Chiew, Y.M.; Melville, B.W.; Zheng, J. Current-induced scour at monopile foundations subjected to lateral vibrations. Coast. Eng. 2019, 144, 15–21. [Google Scholar] [CrossRef]
- Jia, N.; Ding, H.; Zhang, P.; Liu, J. The seismic response of composite bucket foundation for offshore wind turbines under scour conditions. In Proceedings of the 27th International Ocean Polar Engineering Conference, International Society of Offshore and Polar Engineers, San Francisco, CA, USA, 25–30 June 2017. [Google Scholar]
- Hou, G.; Xu, K.; Lian, J. A review on recent risk assessment methodologies of offshore wind turbine foundations. Ocean Eng. 2022, 264, 112469. [Google Scholar] [CrossRef]
- Ngo, D.-V.; Lim, J.-K.; Kim, D.-H. Reliability Analysis and Life Prediction of Aging LNG Unloading Arms Based on Non-Destructive Test Data. Energies 2022, 15, 9408. [Google Scholar] [CrossRef]
- Lian, J.; Wang, P.; Le, C.; Dong, X.; Yang, X.; Jiang, Q.; Yang, Y.; Jiang, J. Reliability Analysis on One-Step Overall Transportation of Composite Bucket Foundation for Offshore Wind Turbine. Energies 2020, 13, 23. [Google Scholar] [CrossRef] [Green Version]
- Kim, D.-H.; Lee, S.G.; Lee, K.I. Seismic fragility analysis of 5 MW offshore wind turbine. Renew. Energy 2014, 65, 250–256. [Google Scholar] [CrossRef]
- Kim, D.-H.; Kim, Y.-J. Scour risk assessment of offshore wind turbine suction bucket foundation. J. Coast. Res. 2020, 95, 237–241. [Google Scholar] [CrossRef]
- Kim, D.-H.; Lee, S.G. Reliability analysis of offshore wind turbine support structures under extreme ocean environmental loads. Renew. Energy 2015, 79, 161–166. [Google Scholar] [CrossRef]
- Yari, M.; Monjezi, M.; Bagherpour, R. A novel investigation in blasting operation management using decision-making methods. Rud.-Geol.-Naft. Zb. 2014, 29, 69–79. [Google Scholar]
- Yu, X.; Suntrayuth, S.; Su, J. A Comprehensive Evaluation Method for Industrial Sewage Treatment Projects Based on the Improved Entropy-TOPSIS. Sustainability 2020, 12, 6734. [Google Scholar] [CrossRef]
- Yari, M.; Bagherpour, R.; Khoshouei, M.; Pedram, H. Investigating a comprehensive model for evaluating occupational and environmental risks of dimensional stone mining. Rud.-Geol.-Naft. Zb. 2020, 35, 48. [Google Scholar] [CrossRef]
- Ekmekcioğlu, Ö.; Koc, K.; Özger, M. Stakeholder perceptions in flood risk assessment: A hybrid fuzzy AHP-TOPSIS approach for Istanbul, Turkey. Int. J. Disaster Risk Reduct. 2021, 60, 102327. [Google Scholar] [CrossRef]
- Yari, M.; Bagherpour, R.; Almasi, N. An Approach to the Evaluation and Classification of Dimensional Stone Quarries with an Emphasis on Safety Parameters. Rud.-Geol.-Naft. Zb. 2016, 31, 15–26. [Google Scholar] [CrossRef] [Green Version]
- Harris, J.M.; Whitehouse, R.J.S. Scour development around large-diameter monopiles in cohesive soils: Evidence from the field. Coast. Ocean Eng. 2017, 143, 04017022. [Google Scholar] [CrossRef] [Green Version]
- Abhinav, K.A.; Saha, N. Effect of scouring in sand on monopile-supported offshore wind turbines. Mar. Georesour. Geotechnol. 2016, 35, 817–828. [Google Scholar] [CrossRef] [Green Version]
- Ma, H.W.; Yang, J.; Chen, L. Effect of scour on the structural response of an offshore wind turbine supported on tripod foundation. Appl. Ocean Res. 2018, 73, 179–189. [Google Scholar] [CrossRef]
- Kim, Y.-J.; Ngo, D.-V.; Lee, J.-H.; Kim, D.-H. Ultimate Limit State Scour Risk Assessment of a Pentapod Suction Bucket Support Structure for Offshore Wind Turbine. Energies 2022, 15, 2056. [Google Scholar] [CrossRef]
- Shin, Y.; Sivasithamparam, N.; Jung, T.; Wang, H.; Song, S.; Park, S.; Sim, J. Scour effect around suction bucket foundations and monopile in clay. In Proceedings of the 8th International Conference-Offshore Site Investigation and Geotechnics, Royal Geographical Society, London, UK, 1 January 2017. [Google Scholar] [CrossRef]
- Zhao, M.; Zhu, X.; Cheng, L.; Teng, B. Experimental study of local scour around subsea caissons in steady currents. Coast. Eng. 2012, 60, 30–40. [Google Scholar] [CrossRef]
- Yu, T.; Lian, J.; Shi, Z.; Wang, H. Experimental investigation of current-induced local scour around composite bucket foundation in silty sand. Ocean Eng. 2016, 117, 311–320. [Google Scholar] [CrossRef]
- Sumer, B.M.; Fredsøe, J. The Mechanics of Scour in the Marine Environment; World Scientific: Singapore, 2002. [Google Scholar] [CrossRef]
- Abaqus; Dassault Systemes Simulia Corporation: Providence, RI, USA, 2020.
- Report on the Estimation of Deep Sea Design Wave in All Seas II; Korea Ocean Research & Development Institute: Busan, Republic of Korea, 2005.
- Wind Turbines Part I: Design Requirements, 3rd ed.; International Standards IEC 61400-1; International Electrotechnical Commission: Geneva, Switzerland, 2005.
Figure 1.
Illustration of time development of SD: (a) KC = 4; (b) KC = 4.5.

Figure 2.
The geographic location of OWT in Korea.

Figure 3.
Illustration of analysis models (a) OWT model and (b) soil model.

Figure 4.
PDF of annual significant wave height () [27].
Figure 4.
PDF of annual significant wave height () [27].

Figure 5.
Probability distribution of KC [27].
Figure 5.
Probability distribution of KC [27].

Figure 6.
Probability distribution of SD [22].
Figure 6.
Probability distribution of SD [22].

Figure 7.
Probability distribution of earthquake.

Figure 8.
Fragility curves of four levels of damage state without any scour effects.

Figure 9.
Change in the fragility curves caused by scour effects at moderate damage state.

Figure 10.
Fragility surface of scoured foundation at the moderate damage state: darker color denoted low damage probability and brighter color denoted high damage probability.
Figure 10.
Fragility surface of scoured foundation at the moderate damage state: darker color denoted low damage probability and brighter color denoted high damage probability.


Table 1.
Steel properties.
| Density | 7850 kg/m3 |
| Young’s modulus | 210 GPa |
| Poisson’s ratio | 0.3 |
Table 2.
Mass of tower components (kg).
| Main tubular steel of tower | 299,983 |
| Concentrated mass | 71,972 |
| Nacelle | 247,900 |
| Hub + Blade | 143,521 |
Table 3.
Soil profile of survey site.
| Soil Layer | Depth (m) | Unit Weight (kN/m3) | Modulus of Deformation (MPa) | Internal Friction Angle (deg) | Cohesion Yield Stress (kPa) | Poisson’s Ratio |
|---|---|---|---|---|---|---|
| Upper sand | 0.0~3.0 | 17.5 | 35.56 | 32.3 | 5 | 0.400 |
| Lower sand | 3.0~7.0 | 17.5 | 67.48 | 37.0 | 5 | 0.400 |
| Weathered rock | 7.0~ | 20.0 | 76.00 | 32.0 | - | 0.450 |
Table 4.
Failure probability results.
| Damage State | One Time | 20 | 50 | 100 | 200 |
|---|---|---|---|---|---|
| Moderate | 4.336 × 10⁻⁴ | 0.0241 | 0.0592 | 0.115 | 0.217 |
| Severe | 3.056 × 10⁻⁶ | 1.257 × 10⁻⁴ | 3.143 × 10⁻⁴ | 0.0006 | 0.0013 |
Table 5.
Equivalent reliability index results.
| Damage State | One Time | 20 | 50 | 100 | 200 |
|---|---|---|---|---|---|
| Moderate | 3.324 | 1.976 | 1.561 | 1.201 | 0.782 |
| Severe | 4.523 | 3.661 | 3.419 | 3.239 | 3.0115 |
Disclaimer/Publisher’s Note: The statements, opinions and data contained in all publications are solely those of the individual author(s) and contributor(s) and not of MDPI and/or the editor(s). MDPI and/or the editor(s) disclaim responsibility for any injury to people or property resulting from any ideas, methods, instructions or products referred to in the content. |
© 2023 by the authors. Licensee MDPI, Basel, Switzerland. This article is an open access article distributed under the terms and conditions of the Creative Commons Attribution (CC BY) license (https://creativecommons.org/licenses/by/4.0/).
Share and Cite
MDPI and ACS Style
Ngo, D.-V.; Kim, Y.-J.; Kim, D.-H. Risk Assessment of Offshore Wind Turbines Suction Bucket Foundation Subject to Multi-Hazard Events. Energies 2023, 16, 2184. https://doi.org/10.3390/en16052184
AMA Style
Ngo D-V, Kim Y-J, Kim D-H. Risk Assessment of Offshore Wind Turbines Suction Bucket Foundation Subject to Multi-Hazard Events. Energies. 2023; 16(5):2184. https://doi.org/10.3390/en16052184
Chicago/Turabian StyleNgo, Duc-Vu, Young-Jin Kim, and Dong-Hyawn Kim. 2023. "Risk Assessment of Offshore Wind Turbines Suction Bucket Foundation Subject to Multi-Hazard Events" Energies 16, no. 5: 2184. https://doi.org/10.3390/en16052184
Note that from the first issue of 2016, this journal uses article numbers instead of page numbers. See further details here.