Article

Environmental Impact Assessment of PEM Fuel Cell Combined Heat and Power Generation System for Residential Application Considering Cathode Catalyst Layer Degradation

1
Department of Industrial Administration, Graduate School of Science and Technology, Tokyo University of Science, 2641 Yamazaki, Noda 278-8510, Japan
2
Department of Industrial Administration, Faculty of Science and Technology, Tokyo University of Science, 2641 Yamazaki, Noda 278-8510, Japan
*
Authors to whom correspondence should be addressed.
Energies 2023, 16(4), 1985; https://doi.org/10.3390/en16041985
Submission received: 17 January 2023 / Revised: 10 February 2023 / Accepted: 14 February 2023 / Published: 16 February 2023
(This article belongs to the Special Issue Life Cycle Assessment of Energy and Environment)

Abstract

:
Recently, fuel cell combined heat and power systems (FC-CGSs) for residential applications have received increasing attention. The International Electrotechnical Commission has issued a technical specification (TS 62282-9-101) for environmental impact assessment procedures of FC-CGSs based on the life cycle assessment, which considers global warming during the utilization stage and abiotic depletion during the manufacturing stage. In proton exchange membrane fuel cells (PEMFCs), platinum (Pt) used in the catalyst layer is a major contributor to abiotic depletion, and Pt loading affects power generation performance. In the present study, based on TS 62282-9-101, we evaluated the environmental impact of a 700 W scale PEMFC-CGS considering cathode catalyst degradation. Through Pt dissolution and Ostwald ripening modeling, the electrochemical surface area transition of the Pt catalyst was calculated. As a result of the 10-year evaluation, the daily power generation of the PEMFC-CGS decreased by 11% to 26%, and the annual global warming value increased by 5% due to the increased use of grid electricity. In addition, when Pt loading was varied between 0.2 mg/cm2 and 0.4 mg/cm2, the 10-year global warming values were reduced by 6.5% to 7.8% compared to the case without a FC-CGS.

1. Introduction

Recently, the use of fuel cell combined heat and power systems (FC-CGSs) for residential applications has received increasing interest. In Japan, this system is known as “ENE-FARM”. As of fiscal year 2021, the cumulative sales of ENE-FARM reached 0.4 million units [1]. A FC-CGS is a fuel cell system that generates electricity and supplies hot water using exhaust heat from electricity generation [2]. Compared to conventional electrical supply grids, FC-CGSs have the potential to reduce the use of fossil resources and are expected to help reduce greenhouse gas emissions [3]. Although renewable energy sources such as solar/wind energy can reduce greenhouse gas emissions as well, they are unstable and intermittent during generation, and thus the valuable electric energies generated are hard to apply continuously and stably [4]. In comparison, as for FC-CGS for residential, for example in Japan, the mainstream type is the 700 W town gas reforming proton exchange membrane fuel cell (PEMFC)-CGS, which reforms town gas (mainly hydrocarbons) to supply hydrogen to the fuel cell [5]. This type of FC-CGS utilizes the existing gas infrastructure and can operate stable. Therefore, as one of the progressive approaches to take advantage of the stability, using multiple FC-CGSs coordinated via the Internet as a virtual power plant with connected solar cells and storage batteries is being considered [6,7]. Moreover, as a new model, PEMFC-CGS fueled by pure hydrogen has been marketed in recent years [8]. Pure hydrogen PEMFC-CGSs can be used as a destination for green hydrogen generated from surplus renewable energy [9]. Therefore, FC-CGSs will be important in building a sustainable system in terms of greenhouse gas reduction and stable electricity supply.
With the increased use of these systems, the International Electrotechnical Commission (IEC) released a technical specification (TS) of the environmental impact assessment procedure for small-scale FC-CGSs: IEC TS 62282-9-101 [10,11]. This impact assessment procedure was based on the life cycle assessment (LCA) methodology. One of the purposes of developing the TS is to help manufacturers pursue environmentally conscious designs about FC-CGS by taking a life cycle perspective. In the assessment procedure, energy demand profiles based on seasonality and 10 years of evaluation are required to consider the practical use of FC-CGSs. This procedure is a simplified evaluation method that focuses on global warming potential (GWP) and abiotic depletion potential (ADP), which are attributed to the operating performance and component elements, respectively. Regarding the PEMFC type currently sold in general, Sato et al. [12] reported that using platinum (Pt) as a catalyst in the cells had the most significant impact on ADP during the manufacturing stage. In addition, the New Energy and Industrial Technology Development Organization (NEDO) reported the environmental impact assessment of PEMFC-CGS in their annual report [13]. The results showed that, in the manufacturing stage, 38% of the GWP was related to fuel cell stack production, which was largely impacted by the catalyst manufacturing process that included the Pt mining, treatment, and transport. In addition, a large proportion in other impact categories was also caused by the Pt catalyst production process. Therefore, the amount of Pt and abiotic depletion (elements), an indicator that most remarkably reflects the environmental impact of Pt content, were emphasized in the manufacturing stage. In the utilization stage, almost all environmental impacts in any impact category depend on the consumption of fossil resources that emit greenhouse gases. Hence, abiotic depletion (fossil fuels) and global warming are representative indicators of the environmental impacts of the PEMFC-CGS in the utilization stage.
Because the PEMFC-CGS is characterized by abiotic depletion and global warming, factors other than the Pt catalyst were also investigated for abiotic depletion in the production stage of the PEMFC-CGS [14]. The results showed that the impact of gold on connectors and integrated circuits on circuit boards was also significant. However, when attempting to improve the environmental performance of a product, component specifications that directly affect product performance are considered to be a key factor in product differentiation. In addition, it was revealed that the inventory of gold in circuit boards varies greatly depending on the literature, making it difficult to quantify the environmental impact and link it to the power generation performance and durability of the FC-CGS. In this regard, the amount of Pt used in the catalyst layer is related to the durability and power generation performance [15]. In other words, because the amount of fossil resources used depends on the electrical efficiency of fuel cells, the amount of Pt catalyst is a factor related to global warming. Therefore, to evaluate the environmental impact over the life cycle and improve PEMFC applications, it is necessary to consider the relationship between Pt consumption and durability, including performance degradation.
Several studies have assessed the environmental impact of FC-CGSs. For example, Bachmann et al. [16] performed an LCA considering heating demands, total load hours, and electricity replacement mixes for residential fuel cell micro-combined heat and power (CHP). However, energy demand patterns by time of day during the utilization stage were not considered. Therefore, changes in the FC-CGS power output, electrical efficiency, and heat generation by the time of day were excluded from the evaluation. Ozawa and Kudoh [17] focused on the relationship between different energy profiles and FC-CHP in other houses and examined the impact of varying PEMFC and solid oxide fuel cell outputs on 10-year lifecycle greenhouse gas emissions. In this case, fuel cell degradation was not considered, and the performance degradation of the fuel cells over 10 years was not examined. Alternatively, Mlakar et al. [18] developed a semi-empirical model using PEMFC performance degradation data to perform a new lifecycle inventory analysis and impact assessment of the PEMFC manufacturing and operational stage, considering a dynamic operation, which assumed the voltage decreased at a rate of 0.88% per 1000 h. Consequently, compared to when degradation was not considered, the environmental impacts when degradation was considered were 7% and 66% greater when hydrogen derived from natural gas steam reforming process and hydrogen derived from wind power were used, respectively. They also performed sensitivity analyses to reduce Pt loading and improve environmental impacts, considering the 0.75 g/kW, 0.4 g/kW, and 0.125 g/kW cases. However, environmental impact assessments for practical FC-CGSs require an energy demand profile followed by a fuel cell because degradation and electrical efficiency differ depending on the operating output.
In different discussions, other issues have not been considered in the environmental impact assessments of the FC-CGS conducted in these previous studies. First, the fuel cell performance degradation effects were not reflected in the FC-CGS output and grid electricity usage. In addition, this was not reflected in the environmental impact values, even though the impacts of PEMFC degradation existed during its extended use. Another is whether environmental performance, including degradation, can be sustained when parameters related to power generation performance and durability, such as Pt loading and PEM characteristics, are changed. Therefore, it was challenging to justify proposals to improve environmental impacts.
Previous studies have not yet evaluated the environmental impacts of FC-CGS considering fuel cell degradation. Hence, in the present study, a comprehensive evaluation was conducted that included PEMFC degradation and an environmental impact assessment based on IEC TS 62282-9-101 of the abovementioned impact assessment procedure. Then, by combining parameters related to fuel cell degradation into the environmental impact assessment, the improvement can be studied through sensitivity analysis.
The Pt present in the catalyst layer is one of the important factors to consider in the power generation performance and degradation of PEMFCs. The loss of electrochemical surface area (ECSA) of the Pt catalyst is a serious issue in PEMFC durability [15]. The durability test protocols of electrocatalysts suggested by the Fuel Cell Commercialization Conference of Japan (FCCJ) include several durability evaluation protocols [19]. For the start/stop cycle durability tests, a triangular-wave potential cycle of 1.0–1.5 V vs. reversible hydrogen electrode (RHE) was chosen. Carbon corrosion and the ensuing Pt agglomeration and detachment are the primary degradation processes. This evaluates the carbon support corrosion under a high voltage associated with the start/stop of the PEMFC. Conversely, a square-wave potential cycle of 0.6–1.0 V vs. RHE was used to simulate the load cycle tests, and Pt degradation induced by carbon corrosion was minor in this case. However, Ostwald ripening and Pt dissolution, followed by re-precipitation, can lead to accelerated degradation. This load cycle simulates the continuous operation of the PEMFC and considers the long-term operation of the PEMFC-CGS. From a life cycle perspective, the impact of continuous operation can be particularly important.
In addition, for the degradation issue, the degradation of PEM is also serious, such as chemical, mechanical, and thermal degradation, which leads to membrane cracking, pinhole formation, membrane thinning, gas crossover, and local hotspot [20]. This is caused due to the fluorine element in perfluorinated sulfonic acid PEMs, which covers the most widely and commercially used membranes Nafion® [21]. However, given the importance of life cycle perspective in the technical specification of the environmental impact assessment procedure (IEC TS 62282-9-101), ADP (elements), which has a remarkable impact at the manufacturing stage, is also important. In this regard, since the amount of Pt is related to the ADP (elements) at the manufacturing stage and affects the power generation performance, we considered that the analysis on the Pt loading and Pt degradation were the priority to improve the environmental performance of PEMFC-CGS. In the present study, we focused on Pt catalyst degradation as one of the factors to express differences and incorporating the PEM degradation into environmental impact assessment was excluded as a future work.
Therefore, we first calculated the decrease in the ECSA of Pt particles resulting from Pt dissolution and Ostwald ripening [22], and the power output drop with such degradation using existing PEMFC models [22,23]. Next, an environmental impact assessment was conducted to evaluate the increase in the use of grid electricity due to the decrease in PEMFC-CGS output and the effects on GWP. Finally, a sensitivity analysis of the amount of Pt was conducted, and the relationship between the amount of Pt and the environmental impact values was calculated. The aims of the present study were to:
  • Conduct an environmental impact assessment of PEMFC-CGS considering catalyst degradation.
  • Show the relationship between the amount of Pt and the environmental impact, and to enable consideration for improvement.
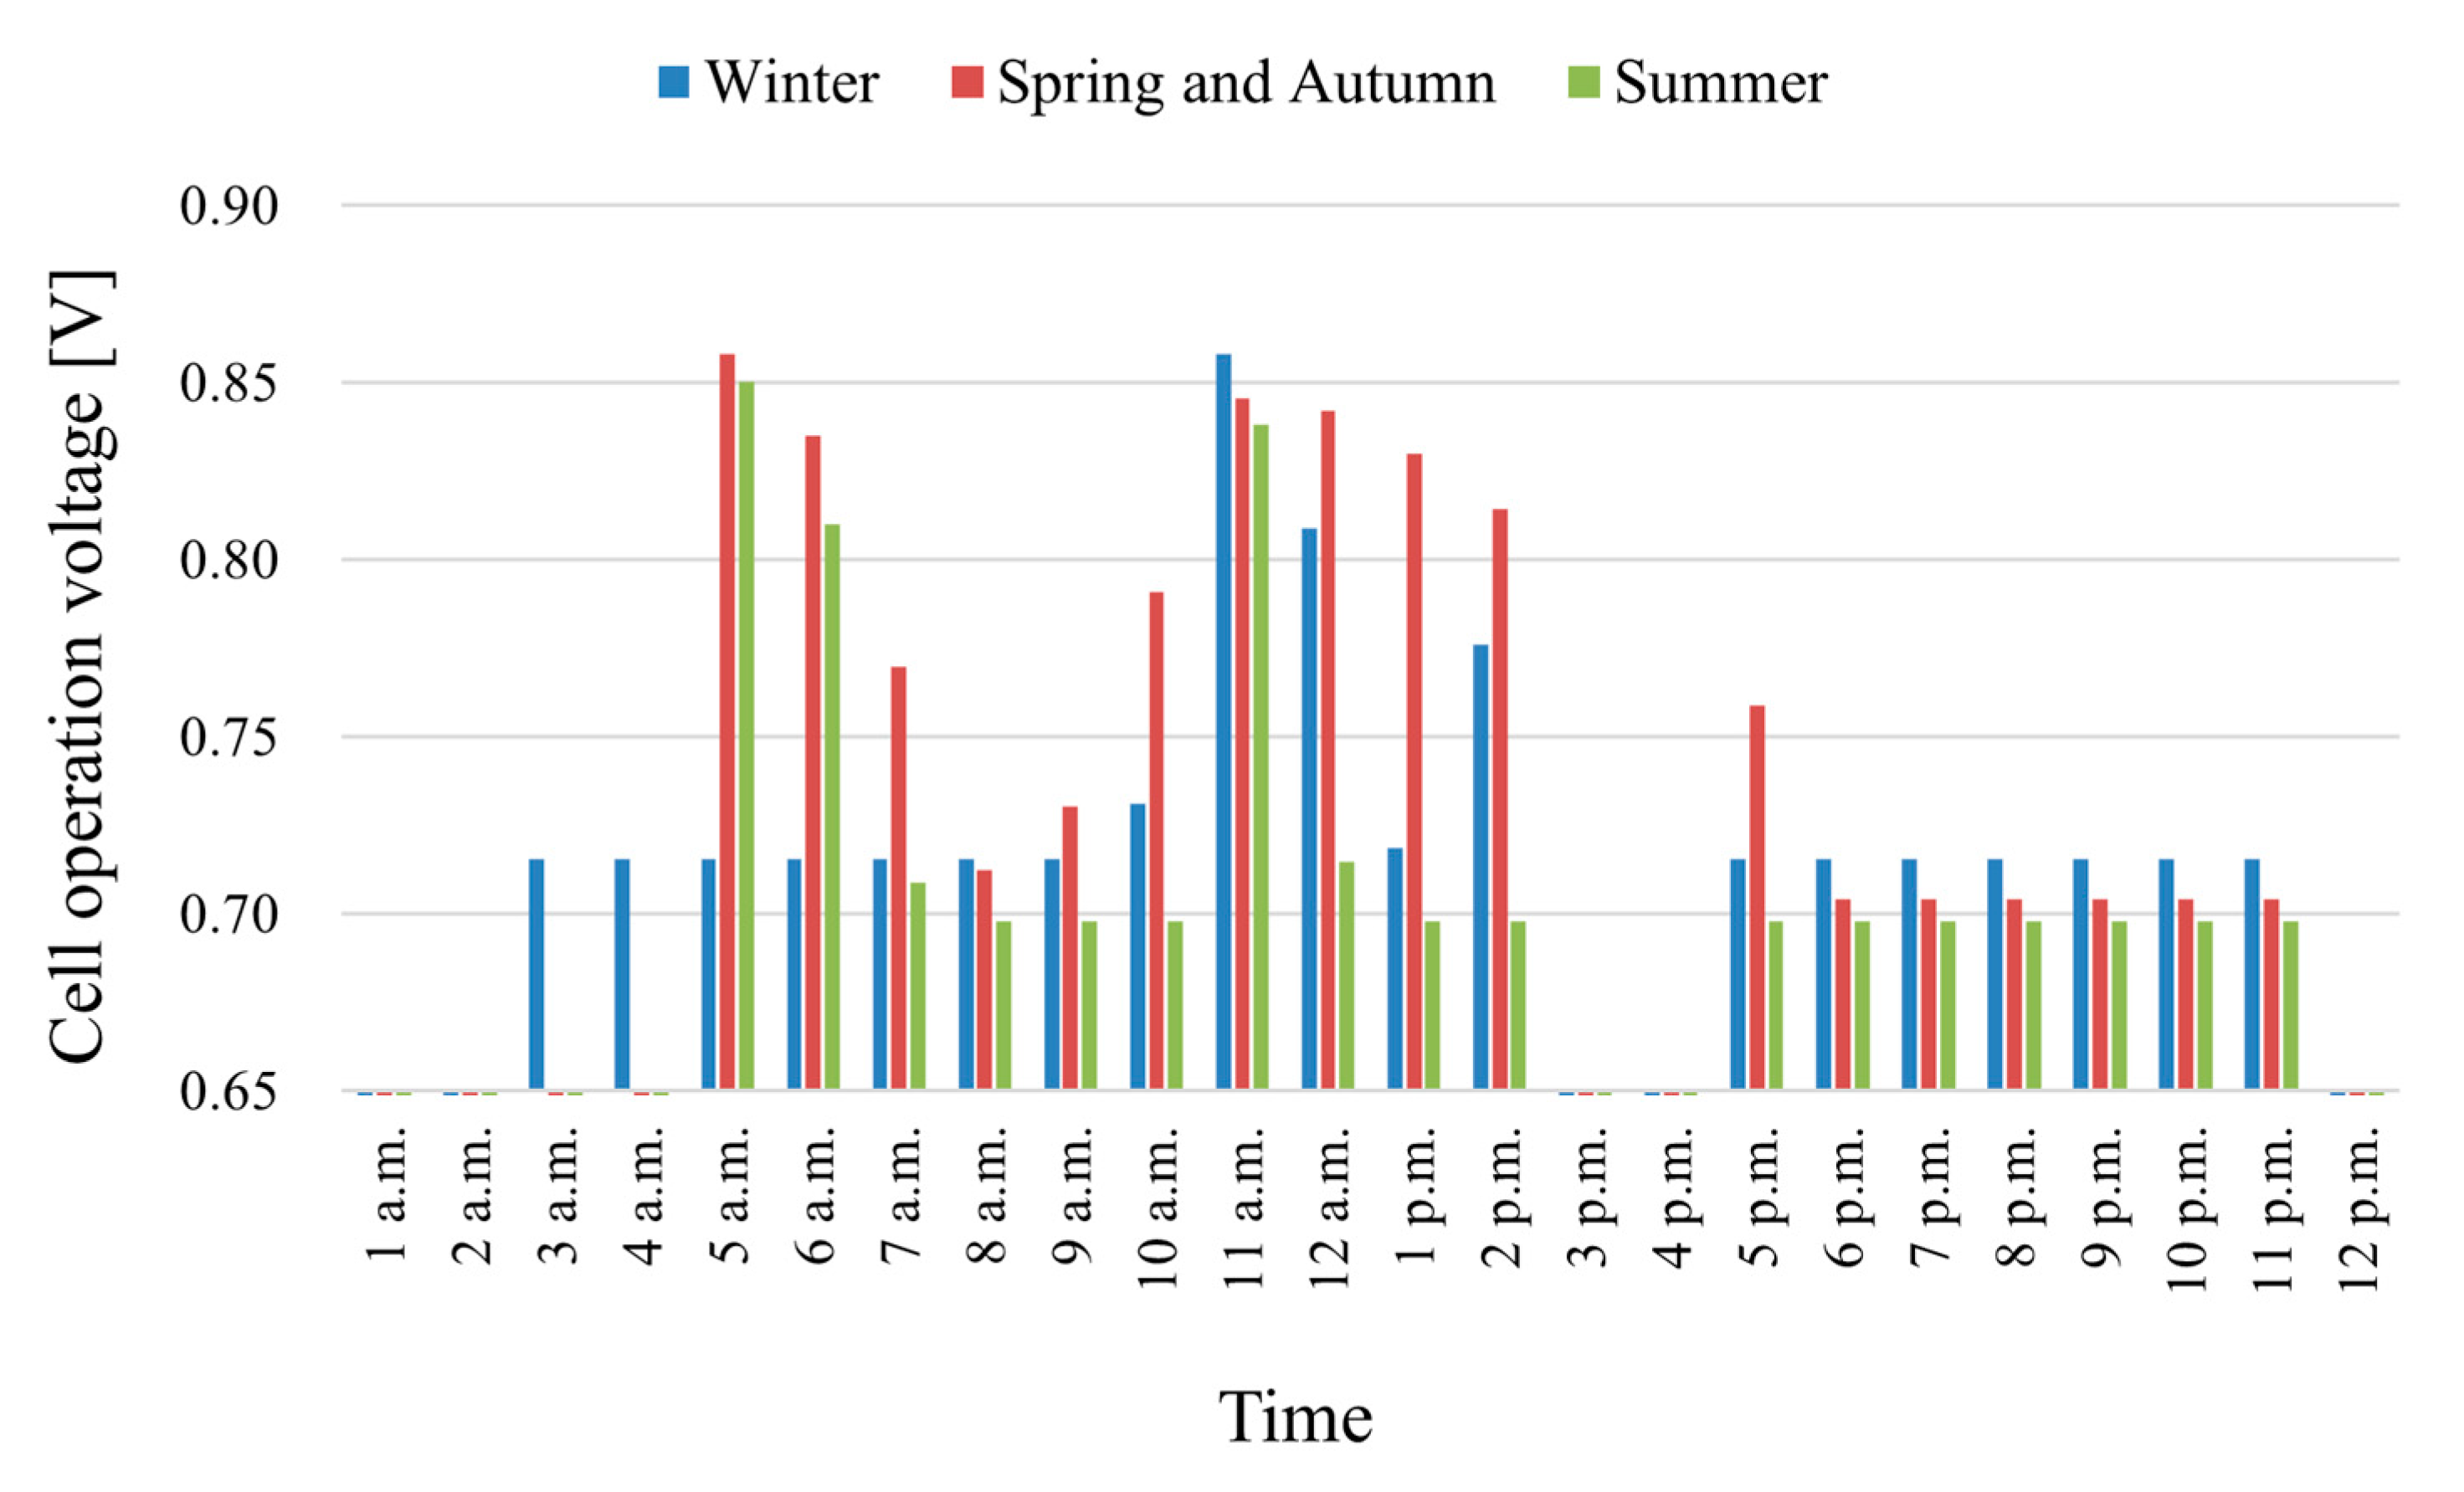
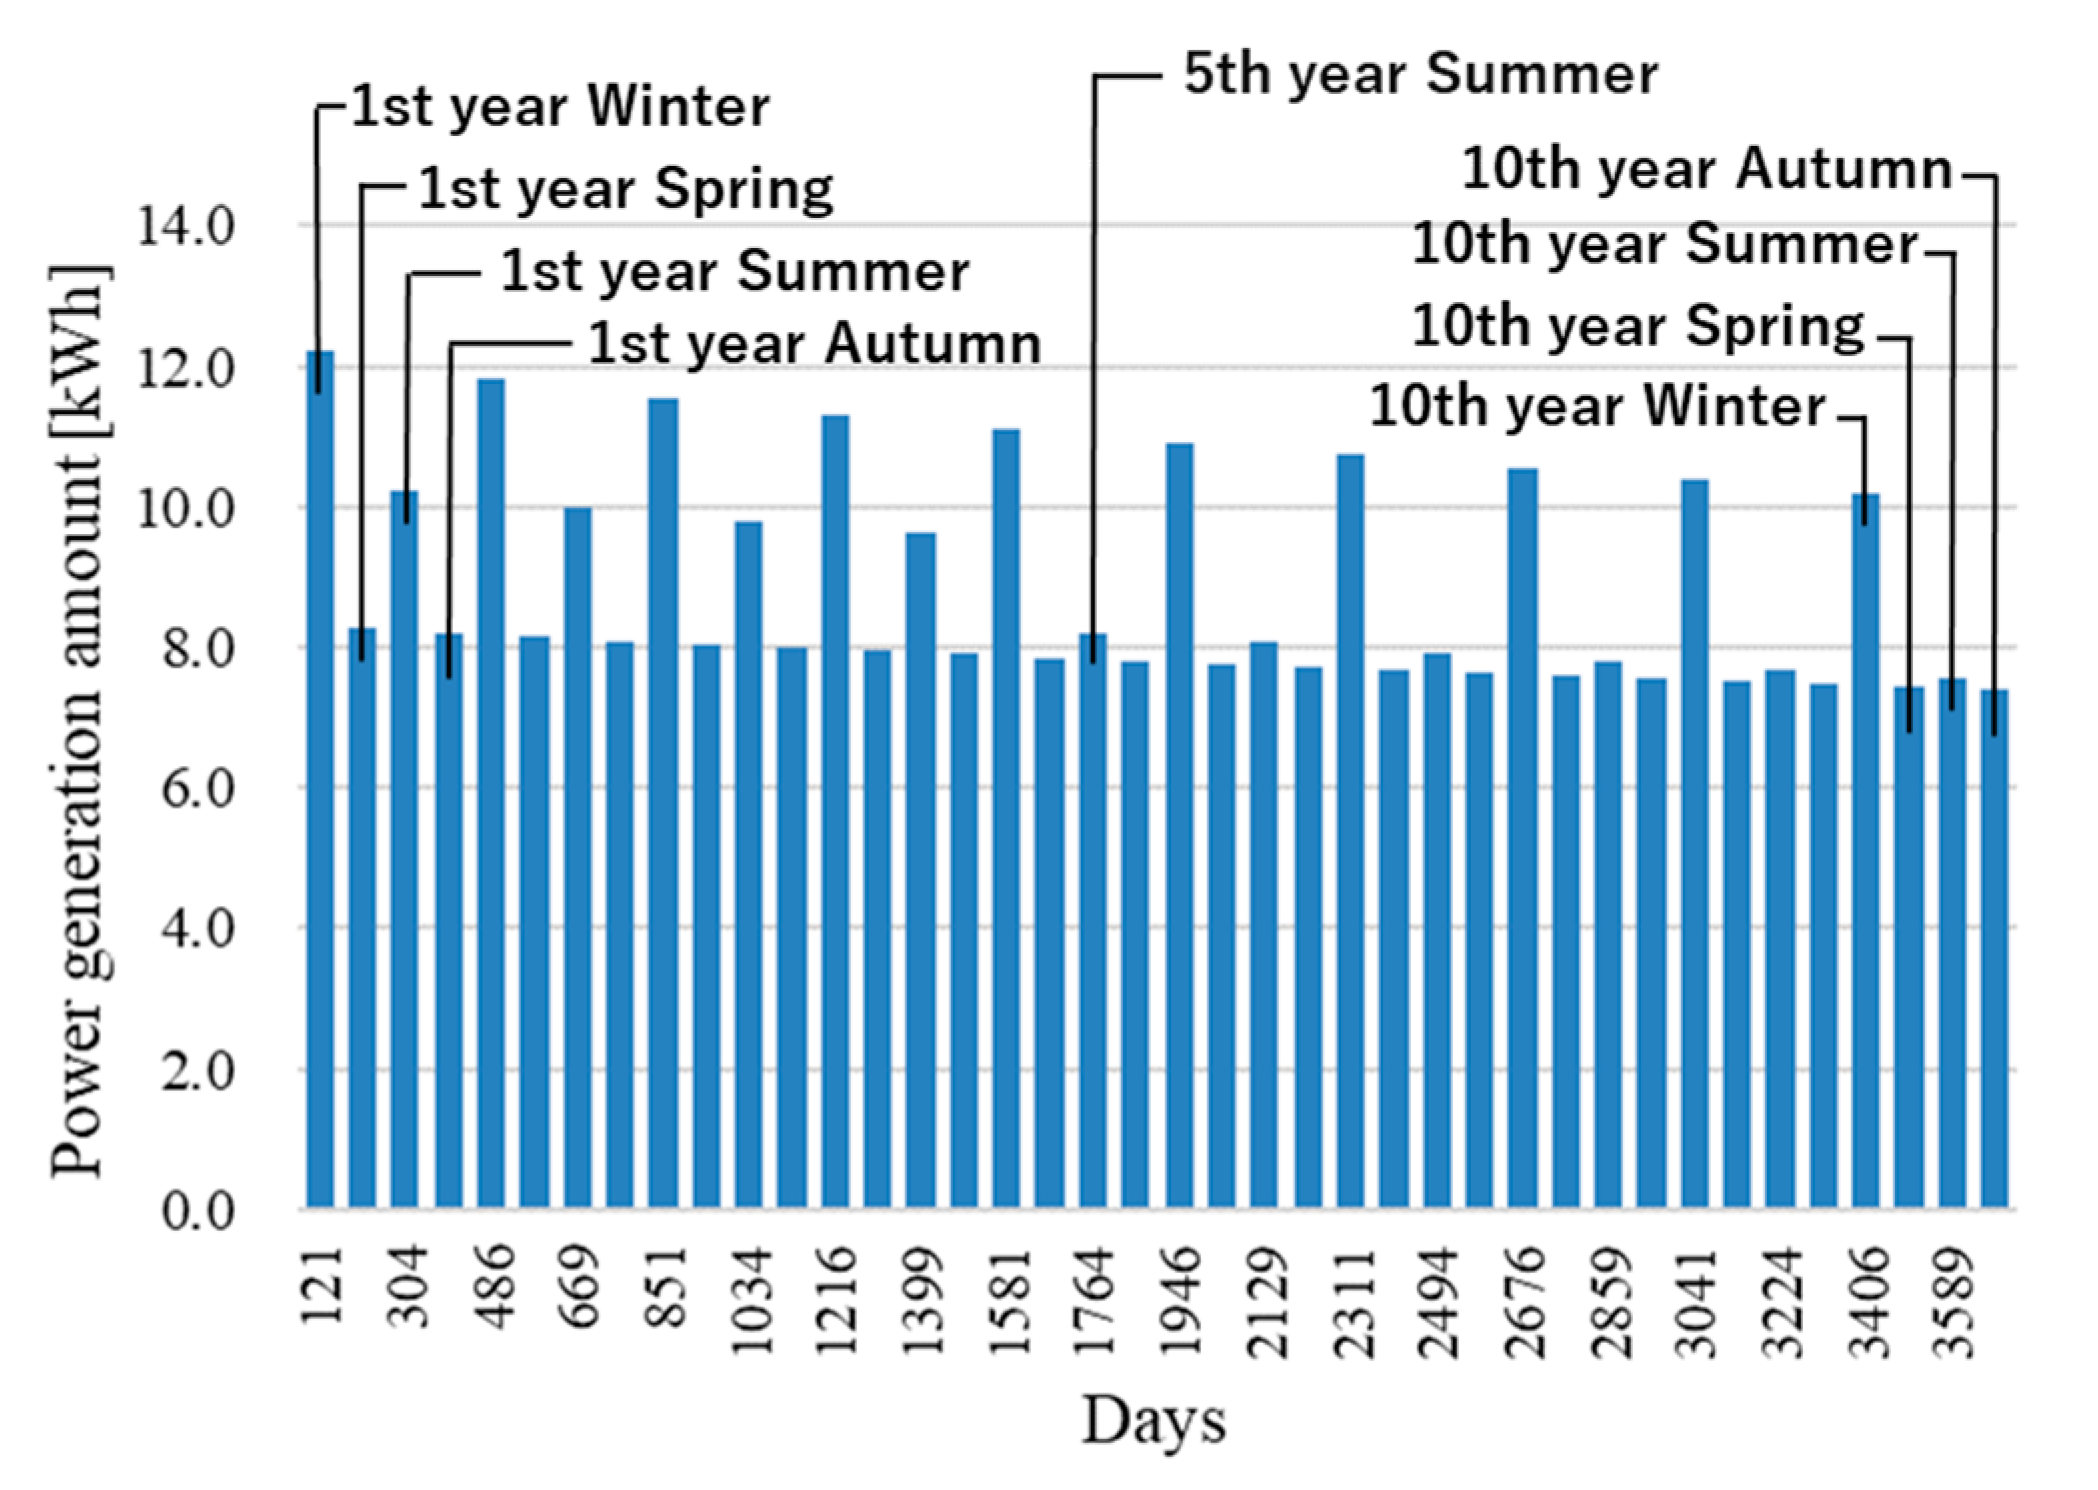
  • Perform a practical evaluation based on IEC TS 62282-9-101, including demand patterns considering 10 years of use and seasonal changes.
The present study was conducted to develop an environmental impact assessment platform for PEMFC-CGS over a lifetime.

2. Materials and Methods

2.1. Approach to Degradation Modeling

The IEC TS 62282-9-101 considers GWP, ADP (elements), and ADP (fossil fuels) as environmental impact assessments for small-scale FC-CGS. A typical household small-scale FC-CGS is a PEMFC type, and the critical parameter related to GWP and ADP (elements) is the Pt catalyst. Therefore, the present study focuses on the catalyst layer of the PEMFC-CGS.
Considering the long-term relationship between the Pt catalyst and fuel cell degradation, carbon monoxide (CO) poisoning exists on the anode side [24]. In the case of the city gas-reforming type, this phenomenon is assumed to occur because the reformed gas, which contains CO, is supplied to the fuel cell. However, the CO concentration in the reformed gas was maintained below 10 ppm [25], and the effect of poisoning can be reduced by adding ruthenium to the Pt catalyst [26]. Therefore, catalyst degradation on the cathode side of the fuel cell was considered in the present study.
As for the most common factors causing Pt degradation on the cathode side of the fuel cell, four processes have been outlined as the possible Pt degradation mechanisms [15]: (i) Ostwald ripening on the carbon support [22,27]; (ii) Pt crystal migration and coalescence [28]; (iii) detachment and agglomeration of Pt nanoparticles induced by carbon corrosion [29]; and (iv) Pt dissolution, Pt ion transport in the ionomer phase, and subsequent re-precipitation by hydrogen crossover through the membrane [15,30]. Although the dominant degradation mechanisms under various PEMFC operating conditions are still under debate, the durability test protocols of electrocatalysts suggested by the FCCJ can provide some basic insight into the degradation mechanisms [19]. The FCCJ protocol considers start/stop cycle and load cycle tests. The start/stop cycle test focuses on carbon corrosion, the ensuing Pt agglomeration, and Pt detachment, while the load cycle test investigates Ostwald ripening and Pt dissolution, followed by re-precipitation. Pt re-precipitation leads to coarsening of the Pt particles, which reduces the ECSA of the catalyst [31]. Considering the long-term PEMFC-CGS operation, degradation under a continuous load is important.
Therefore, in the present study, a simulation was performed in which the decrease in ECSA due to Pt dissolution and Ostwald ripening in the cathode catalyst layer caused a drop in the power output of the PEMFC at the same operating voltage. The electrochemical reactions for Pt dissolution can be written as [22]:
Pt k 1 Pt 2 + + 2 e
Pt + H 2 O k 2 PtO + 2 H + + 2 e
PtO + 2 H + k 3 Pt 2 + + H 2 O
Moreover, in terms of oxygen transport resistance, the area of ECSA affects the oxygen concentration on the Pt surface, which influences the cathode overpotential [23].
PEMFC simulations were conducted considering these phenomena to evaluate the environmental impact of the PEMFC-CGS. This section describes the models used in the present study.

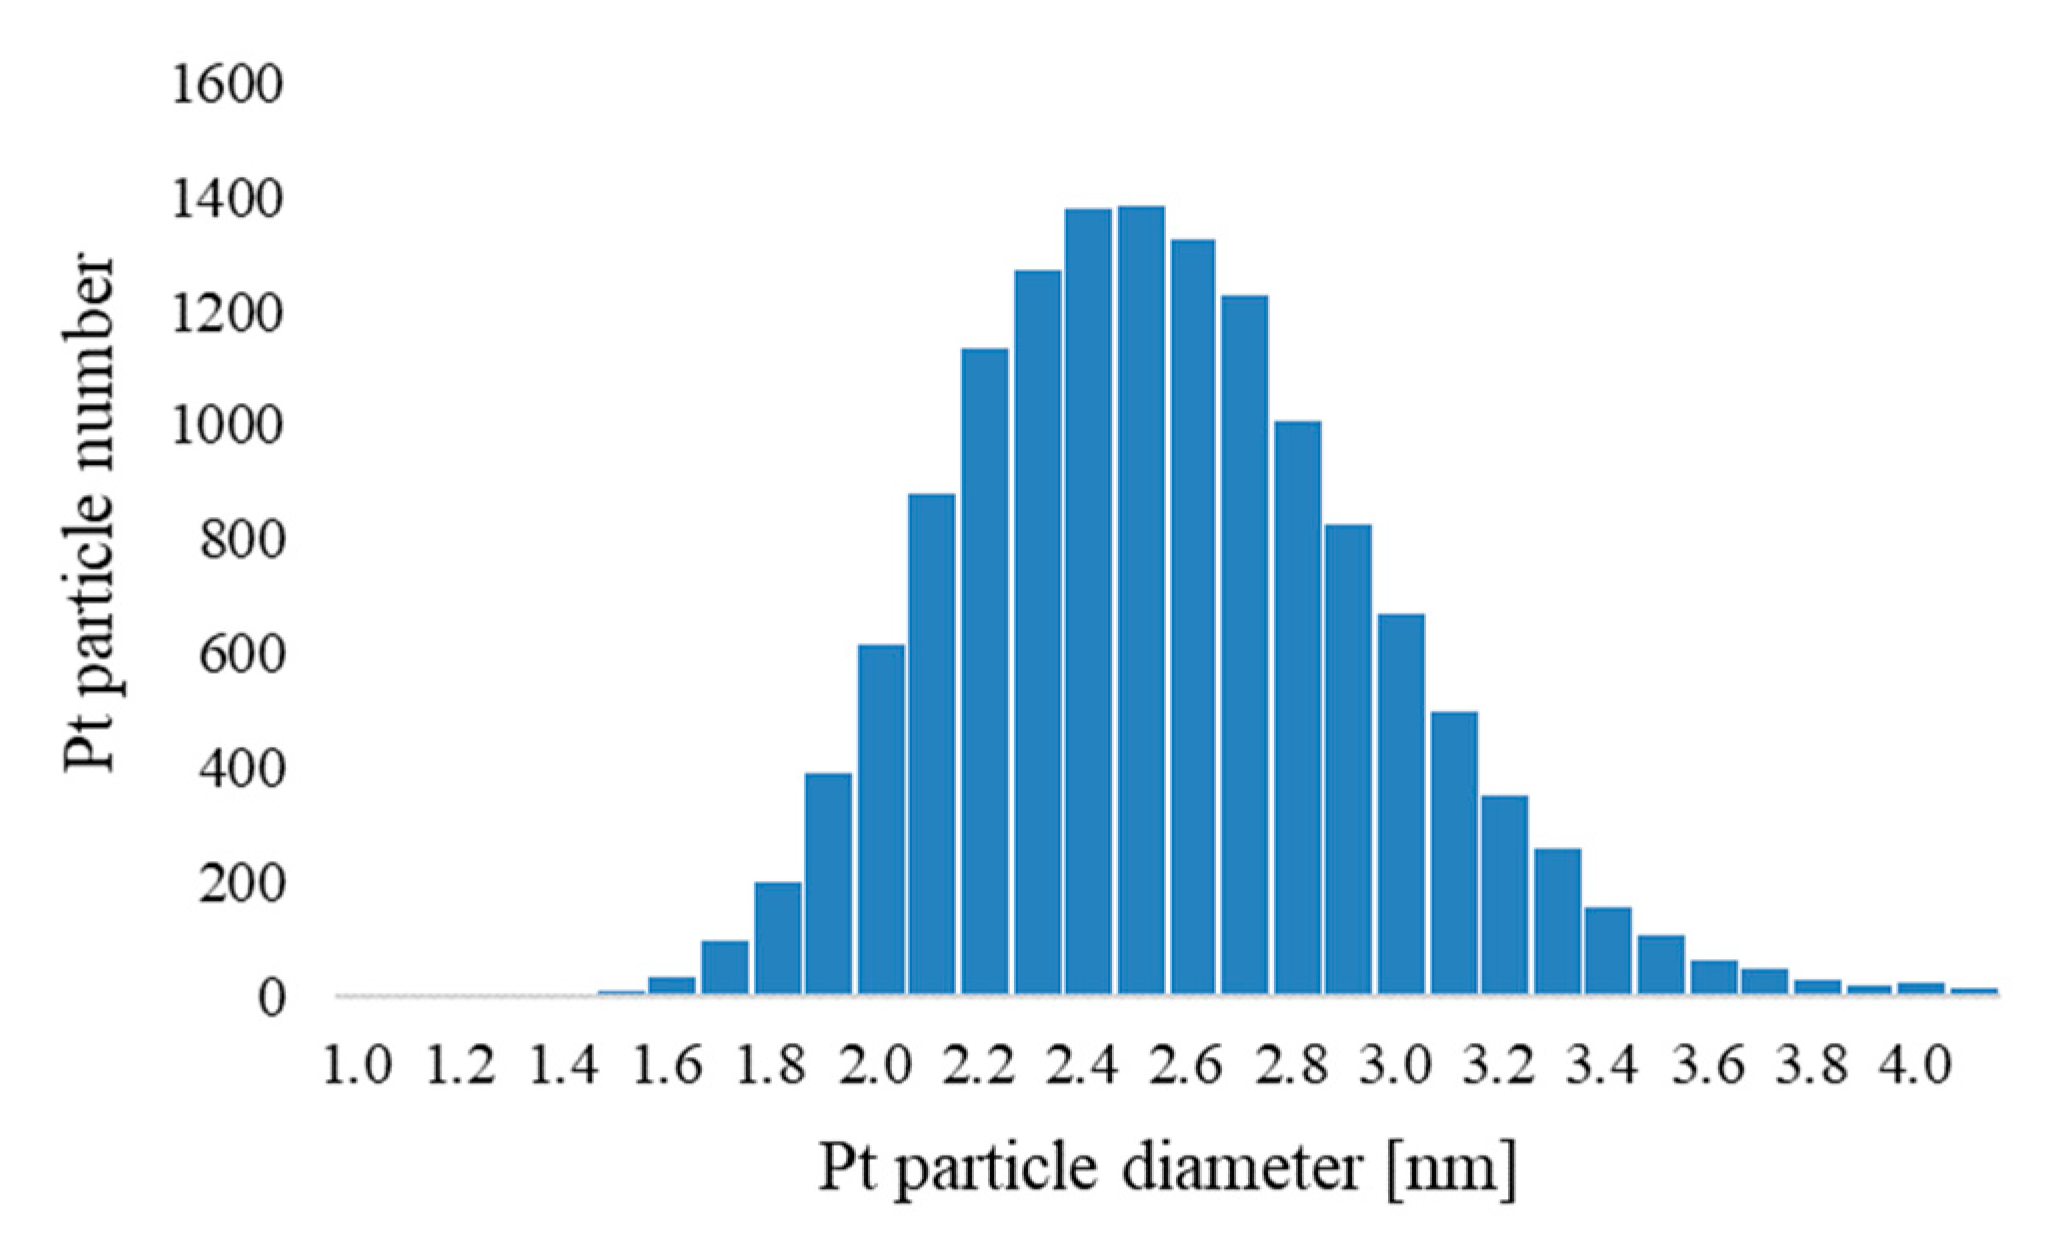
2.2. Pt Catalyst Degradation Model

Based on Ao et al. [22] regarding the degradation of Pt catalysts, we focused on individual Pt particles to calculate the dissolution and coarsening. It was assumed that the cathode catalyst layer had a number of Pt particles and each particle i has n i ,   0 Pt atoms in their initial state. The particle radius was r i ,   0 following a lognormal distribution [32]. In the present study, the number of Pt particles was set to 1400 owing to its computational complexity and accuracy. At time step j , the Pt particle i releases or accepts n i ,   j Pt atoms, and the reaction follows Equation (4) [22]:
n i ,   j = n i ,   j 1 + t ( v 1 ( r i ,   j ) v 2 ( r i ,   j ) + v o r ( r i ,   j ) )
where   t is the time step interval and 1 s was assumed. v 1 ,   v 2 ,   and   v 3 correspond to the reaction rates in Equations (1)–(3), respectively. The electrochemical reactions of Pt particles also involve the formation of platinum oxide (PtO) molecules   m i ,   j , which are calculated using Equation (5) [22].
m i ,   j   = m i ,   j 1 + t ( v 2 ( r i ,   j ) v 3 ( r i ,   j ) )
The reaction rates v 1 ,   v 2 , and v 3 for Pt particle dissolution were calculated using Equations (6)–(8), respectively [22]:
v 1 ( r i ,   j ) = ( 1 θ i ,   j 1 ) k 1 ( r i ,   j 1 ) exp ( F ( E E 1 ( r i ,   j 1 ) ) 2 R T )
v 2 ( r i ,   j ) = ( 1 θ i ,   j 1 ) k 2 ( r i ,   j 1 ) exp ( F ( E E 2 ( r i ,   j 1 ) ) 2 R T )
v 3 ( r i ,   j ) = θ i ,   j 1 k 3 ( r i ,   j 1 ) exp c H + c H + r e f
where θ i ,   j 1 is the PtO coverage calculated at each time step and E is the electric potential imposed on the cathode. The equations for calculating the equilibrium reaction rate constant k ( r i ,   j 1 )   and the equilibrium potential E ( r i ,   j 1 ) in Equations (6)–(8) are described in Equations (9)–(13) [22]:
k 1 ( r i ,   j 1 ) = k 1 exp ( β γ V p t R T r i ,   j 1 )  
E 1 ( r i ,   j 1 ) = E 1 2 β γ V p t F r i ,   j 1  
k 2 ( r i ,   j 1 ) = k 2 exp ( β γ V p t R T r i ,   j 1 )  
E 2 ( r i ,   j 1 ) = E 2 2 β γ V p t F r i ,   j 1  
k 3 ( r i ,   j 1 ) = k 3 exp ( β γ V p t R T r i ,   j 1 )  
Table 1 summarizes the parameters used in the Pt-catalyst degradation model. In addition, β is a proportionality constant between 0 and 1, γ is the interfacial surface tension of Pt, and β γ is the effective surface tension set as 1.2 J/m2 according to the calculation by [22].
In addition to the dissolution of Pt particles, Ostwald ripening causes coarsening of Pt particles. This phenomenon causes the Pt particles to move from minor to larger particles, as calculated using Equation (14) [22]:
v o r ( r i ,   j ) = 4 π D m c P t α m ( r i ,   j r j ¯ 1 )
where v o r ( r i ,   j ) is the reaction rate due to Ostwald ripening of the Pt particle i at time step j . r j ¯ is the average radius of all Pt particles calculated for each time step.
The size distribution of the Pt particles assumed in the present study is shown in Figure 1. The particle diameters were supposed to follow a lognormal distribution with a mean of 2.5 nm and a standard deviation of 0.4 nm [32,34] (i.e., the logarithm of the particle diameter follows a normal distribution, with μ as the mean and σ 2 as the variance, satisfying   log μ = 0.90 and log σ 2 = 0.16 ). The 10-year simulation was performed considering these degradation modeling conditions.

2.3. Oxygen Transport Resistance Model

The ECSA decrease and subsequent higher oxygen fluxes through the ionomer film to the catalyst sites could increase oxygen transport resistance [23,35]. Considering the Pt loading effect, the transport resistance can be written as [23]:
R T = ( k 2 + 1 ) δ i o n D O 2 ,     i o n 1 ( 1 θ P t O ) a E C S A L P t + [ k 1 δ i o n D O 2 ,     i o n + ( k 3 + 1 ) δ w D O 2 ,     w ] 1 δ C L a c m
where the Pt-oxide coverage θ P t O is based on the experimental data and can be calculated by Hao et al. [23]:
θ P t O = 1 / { 1 + exp [ 22.4 ( 0.818 V ) ] }
In the oxygen reduction reaction (ORR), the oxygen balance equation in a single Pt/C catalyst particle can be calculated by considering the oxygen flux across the water and ionomer films to the local ORR rate. For example, this can be written as follows [35]:
C O 2 g C O 2 P t = R T I 4 F = R T j c δ C L 4 F    
From Equation (17), the oxygen concentration on the Pt surface, C O 2 P t , is obtained. The cathode transfer current density for the ORR can be expressed based on the Butler–Volmer equation by Gwak et al. [35]:
j c = a P t i 0 , c r e f ( C O 2 P t C O 2 r e f ) γ c exp [ E c R ( 1 T 1 353.15 ) ] exp ( α c R T F η c )
From Equation (18), the cathode overpotential is calculated, and the voltage drop due to the decreasing ECSA and lower oxygen concentration on the Pt surface can be described using the oxygen transport resistance model in Section 2.2. The parameters of the oxygen transport resistance model are listed in Table 2.

2.4. PEMFC Model

2.4.1. Mathematical Model of PEMFC

A PEMFC simulation assuming a single cell was performed for the water content in the membrane and the ionomer, the ohmic loss through the membrane, and the oxygen transport resistance model in Section 2.2. PEMFC model was calculated to simulate the current–voltage (I-V) characteristics of the cell. The membrane resistance should be calculated to obtain the ohmic loss caused by the increase in current density. In addition, to calculate how catalyst degradation affects power generation performance, the oxygen concentration in the gas channel of the cell is necessary, which is determined by the gas composition, including water or vapor, in the gas channel. Therefore, the concentrations of hydrogen, water, vapor, and oxygen in the gas channel of the cell were calculated. Here, the x direction represents the direction parallel to the electrolyte membrane in the gas channel and x = 0 at the channel inlet. The mass balances at the anode and cathode are described as follows [37,38]:
Anode;
M H 2 ( x ) x = d I ( x ) 2 F
M H 2 O , l , a n ( x ) x = h d R { T a n ( x ) + 273.15 } { M H 2 O , g , a n ( x ) M H 2 O , g , a n ( x ) + M H 2 ( x ) p a p H 2 O , a n s a t ( x ) }
M H 2 O , g , a n ( x ) x = M H 2 O , l , a n ( x ) x d α ( x ) F I ( x )
Cathode;
M O 2 ( x ) x = d I ( x ) 4 F    
M H 2 O , l , c ( x ) x = h d R { T c ( x ) + 273.15 } { M H 2 O , g , c ( x ) M H 2 O , g , c ( x ) + M H 2 ( x ) + M C O 2 ( x ) p c p H 2 O , c s a t ( x ) } + d 2 F I ( x )
M H 2 O , g , c ( x ) x = M H 2 O , l , c ( x ) x + d α ( x ) F I ( x )
where h and d are the gas flow channel height, 1.0 mm, and the gas flow channel width, 1.0 mm, respectively [39]. α ( x ) is the net water molecule (vapor) fraction that can pass through the membrane per proton, and α ( x ) can be calculated by introducing electro-osmotic drag coefficient (number of water molecules carried per proton) n d , water content to the membrane λ , and the activity of water a . Here, n d , λ , and a were calculated as follows [37,40]:
n d = 2.5 λ 22
{ λ = 0.043 + 17.81 a 39.85 a 2 + 36.0 a 3 ,                       a < 1 λ = 14.0 + 1.4 ( a 1 ) ,                 1 a 3                                                 λ = 16.8 ,           3 < a                                                                                                                    
a = m w p H 2 O p H 2 O s a t
Then, α ( x ) was calculated as follows [34]:
α ( x ) = n d ( x ) F I ( x ) D w c w y
where D w and c w are the diffusion coefficient of water and concentration of water in the membrane, respectively. The y direction represents the membrane depth direction. D w and c w were calculated as follows [37]:
D w = { 3.1 × 10 7 λ { exp ( 0.28 λ ) 1 } e x p ( 2346 T a n ) ,         0 < λ 3 4.17 × 10 8 λ { 1 + 161 exp ( λ ) } e x p ( 2346 T a n ) ,         3 < λ
c w = ρ m ,   dry W m ,   dry λ
where ρ m ,   dry and W m ,   dry are the density of a dry membrane, 1.9 g/cm3, and the equivalent weight of a dry membrane, 950 g/mol, respectively [23].
The membrane resistance R m e m was calculated by introducing the membrane conductivity σ T and integrating its reciprocal in the direction of the membrane thickness. The membrane resistance can be written as in the study conducted by Ge and Yi [40]:
R m e m = 0 δ m 1 σ T d y    
where
σ T = exp [ 1268 ( 1 303 1 T ) ] × ( 0.5139 λ 0.326 ) ,             for   λ > 1
while λ was <1, the membrane conductivity was assumed to be constant.
The cell voltage was calculated using the Nernst Equation, membrane resistance, and cathode overpotential:
V = V 0 R T 2 F ln p H 2 ( p O 2 ) 0.5 p H 2 O R m e m I η c    
Note, in the present study, the operating voltage of a single cell was approximately 0.7 V or more, and the current density was relatively low. Therefore, the fuel cell is not considered to generate power near the limited current density, and concentration overpotential was not included because the effect of that was negligible [41].

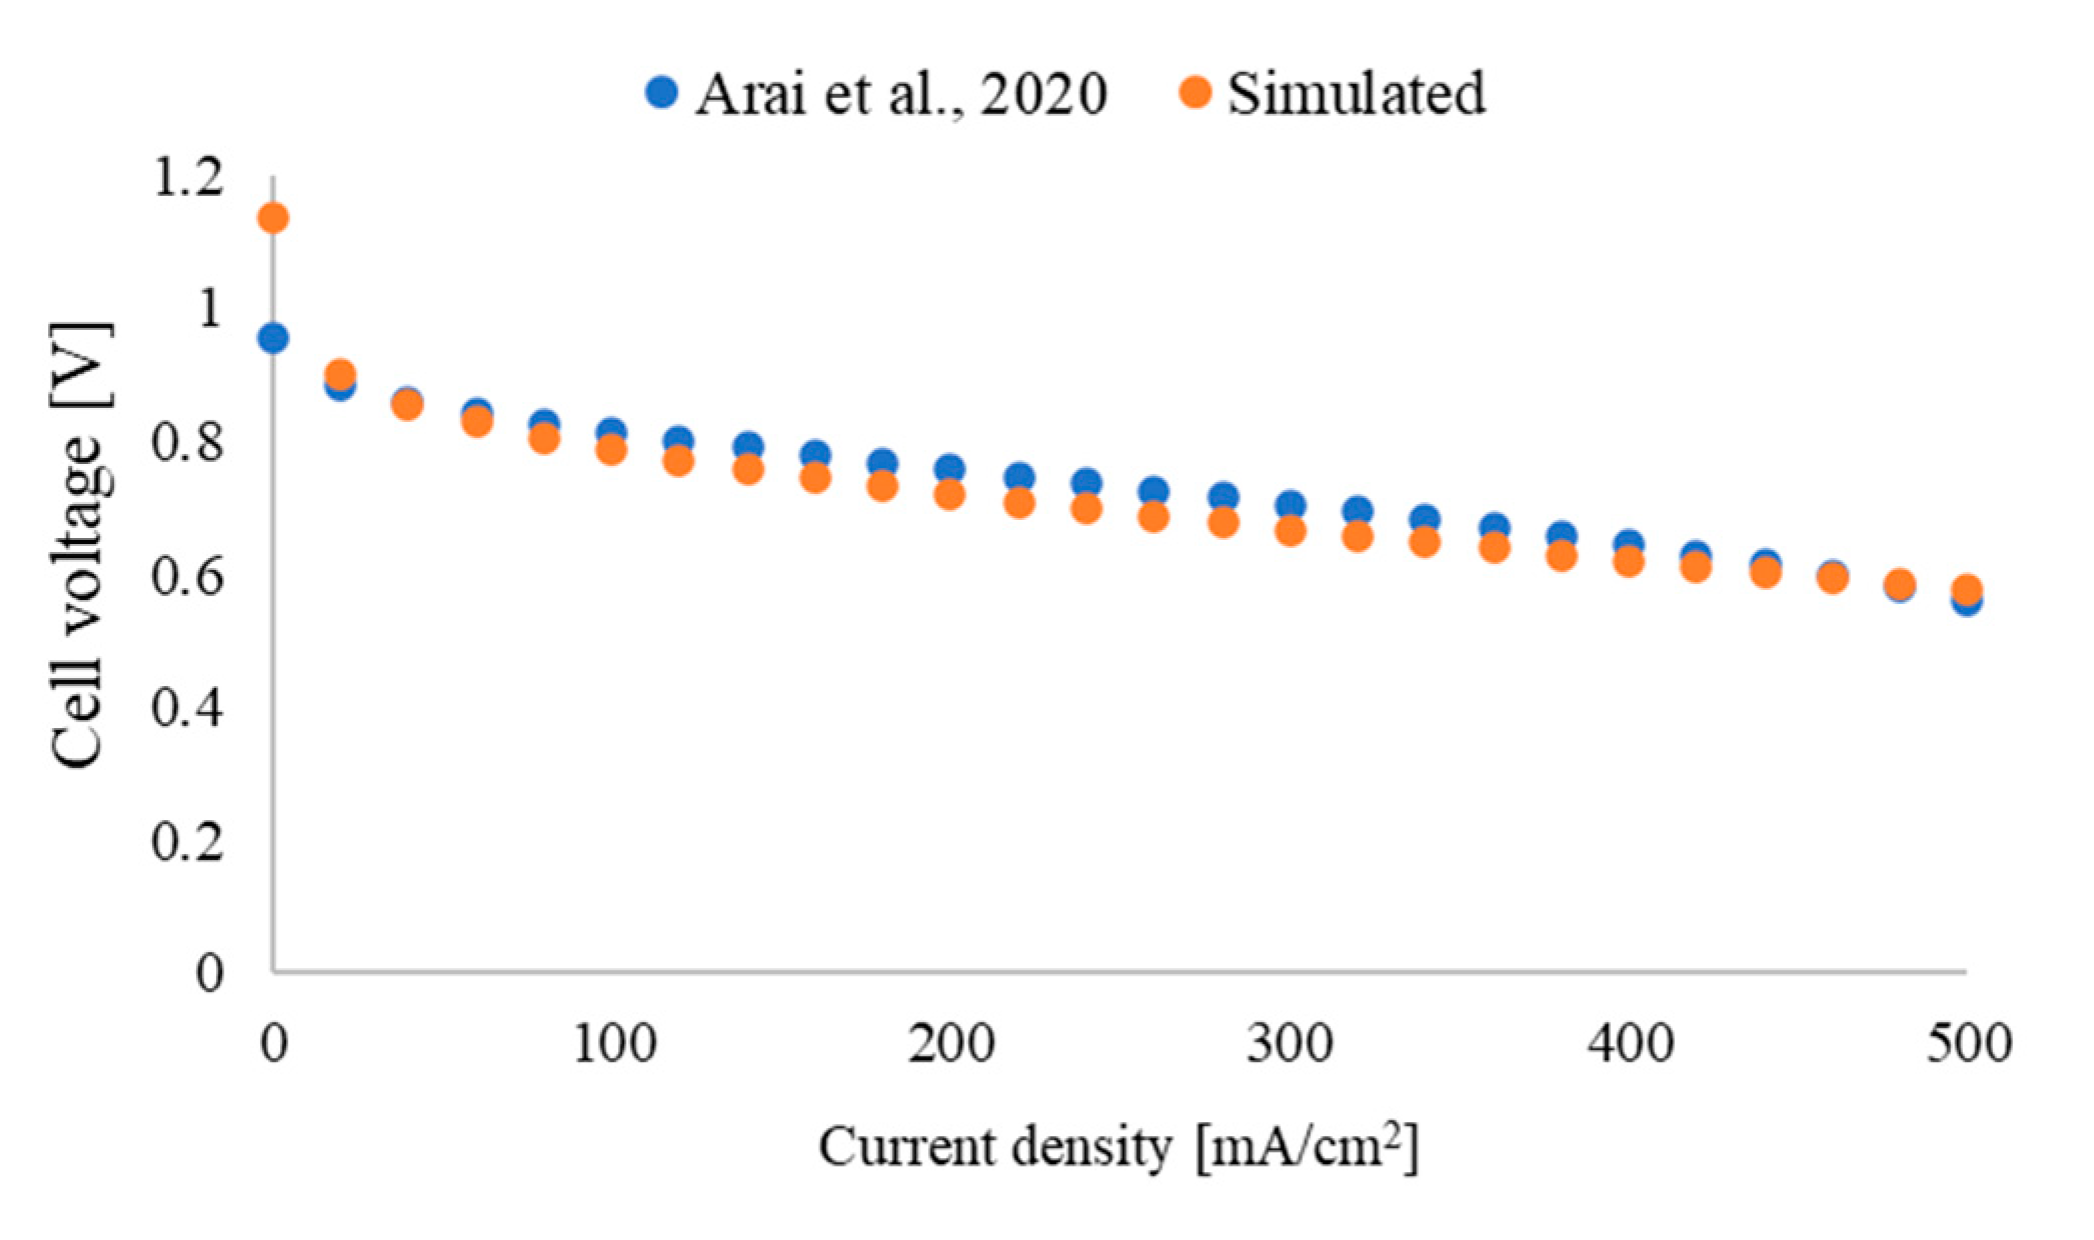
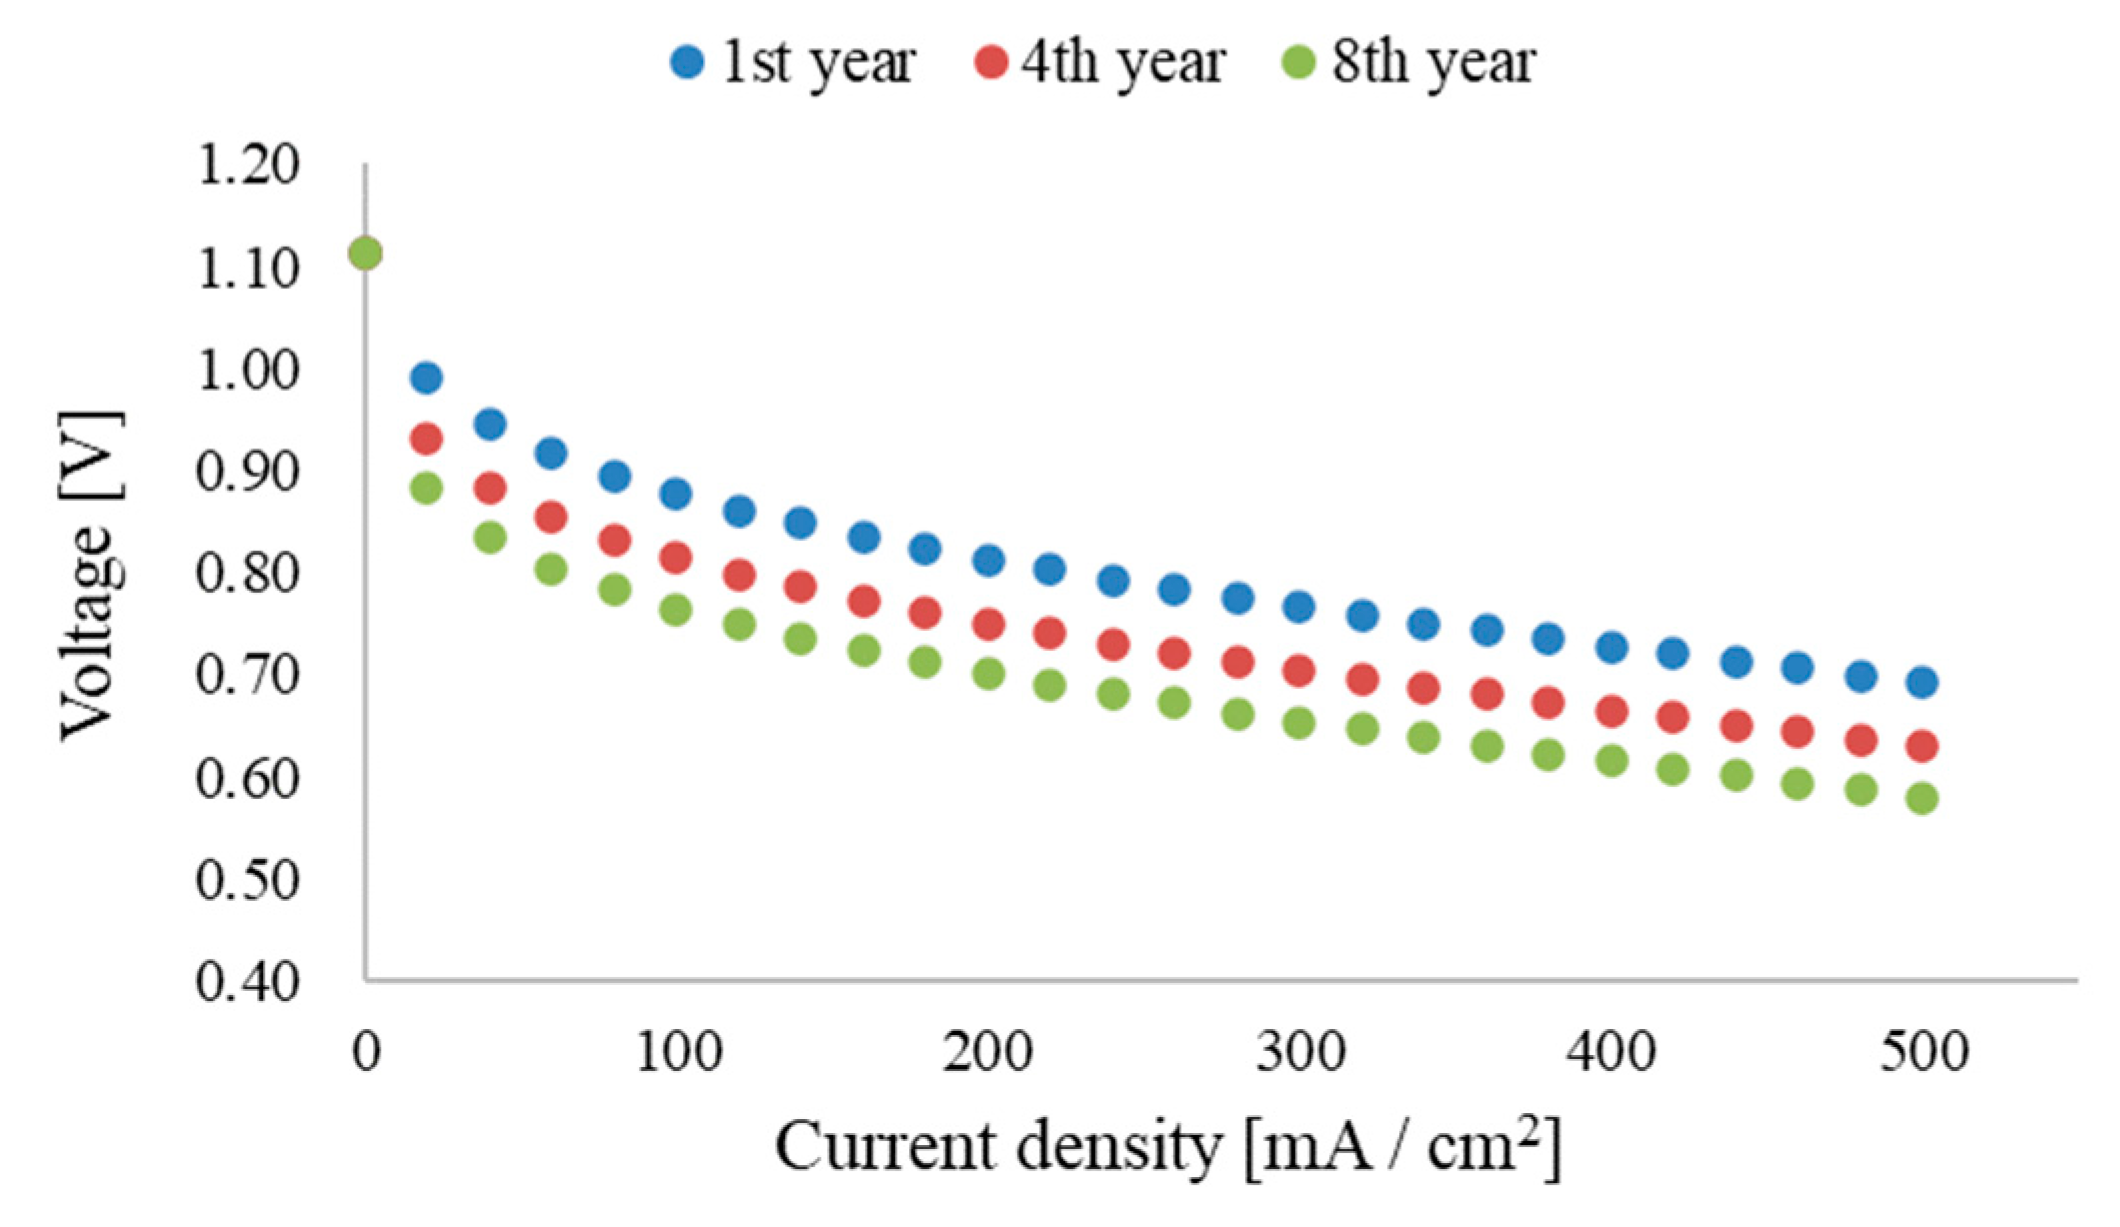
2.4.2. Comparison of the I-V Characteristics at Initial State

In the PEMFC model, the average cell current density is first set, and then the concentration of the species in each grid of the cell is obtained from the reaction volume. Using PEMFC and oxygen transport resistance models, mass balance in the gas channel in the cell, membrane resistance, and cathode overpotential were calculated, and initial values of I-V characteristics for single cells were simulated based on Equation (33). Next, the simulated I-V characteristics of the initial state using present study models were compared with Arai et al. [36] experimental data under 50 °C and 100% relative humidity (RH) conditions. The temperature in the present study model was also set at 50 °C and 100% RH. Good agreement with the experimental results was obtained in the operating voltage range of the stationary fuel cell (Figure 2). Therefore, the oxygen transport resistance and PEMFC models for calculating I-V characteristics were used to reflect Pt degradation.
In the present study, the upper limit of the cell current density was assumed to be the current density at the rated output (700 W at the sending end) in the initial state. Therefore, when the electrical efficiency of the fuel cell decreased, the fuel cell output decreased. Pt degradation, oxygen transport resistance, and PEMFC models were calculated with Visual Basic for Applications in Excel. First, using PEMFC and oxygen transport resistance models, mass balance in the gas channel in the cell, membrane resistance, and cathode overpotential were calculated, and initial values of I-V characteristics for single cells were simulated based on Equation (33). Then, Pt degradation was calculated according to the operational profile determined by household energy demand data using Pt degradation model, and the a E C S A in Equation (15) was updated. Based on the updated a E C S A , the cathode activation overvoltage was obtained from Equation (18), and together with the membrane resistance in the PEMFC model, the I-V characteristics after degradation were recalculated based on Equation (33). This update was repeated to simulate degradation and calculate I-V characteristics for 10 years. Note that the operating temperature of the fuel cell in the actual PEMFC-CGS (ENE-FARM) sold in the market is approximately 60~80 °C [42]. Considering this, in the 10-year simulation, the fuel cell operating temperature was assumed to be 80 °C with some assumptions, which are explained in the next section.

2.5. PEMFC-CGS Specification

The present study evaluated a 700 W power output town-gas reforming-type PEMFC-CGS. Table 3 lists the specifications of the PEMFC-CGS assessed in this study. The fuel cell stack specification was set based on Panasonic “ENE-FARM” rated electrical efficiency (lower heated value) at the sending end, which is 0.40 [43], and a PEMFC cell’s polarization curve data from Arai et al. [36].
In calculating the degradation and PEMFC models, several assumptions were made regarding humidity and temperature. First, Jeon et al. [44] reported that cell performance improves with increasing humidity through a computational fluid dynamics model of a 300 cm2 PEM fuel cell in different relative humidity of cathode from 0% (dry) to 100%. Wang et al. [45] showed that when the cell is sufficiently humidified, the power generation performance improves as the operating temperature increases. Therefore, considering that the operating temperature of ENEFARM is between 60 °C and 80 °C [42], the operating conditions of the PEMFC were assumed to be 80 °C and 100% RH. In addition, although flooding can cause a significant reduction in power generation performance when humidity is high, ENE-FARM currently on the market has shown a power generation durability of 90,000 h [42]. Therefore, it was assumed that flooding would not cause a significant reduction in power generation and was not included in the analysis. The electrical and thermal efficiencies of the PEMFC-CGS were calculated using Equations (34) and (35), respectively.
η e l e c t r i c i t y = r e f o r m e d   H 2 C a l o r i f i c   v a l u e i n p u t   C H 4 C a l o r i f i c   v a l u e ÷ H 2   s t o i c h i o m e t r i c × G H × V V 0 × η i n v
η h e a t = r e f o r m e d   H 2 C a l o r i f i c   v a l u e i n p u t   C H 4 C a l o r i f i c   v a l u e ÷ H 2   s t o i c h i o m e t r i c × G H × ( 1 V V 0 × η i n v )
The hydrogen supplied to the fuel cell was produced by reforming the town gas. input   CH 4 Calorific   value is the calorific value of the supplied town gas and reformed   H 2 Calorific   value is the calorific value of hydrogen obtained for input   CH 4 Calorific   value . Notably, the calorific value of the reformed town gas was almost the same as that of methane to simplify the analysis of the material balance and heat balance, because the main component of the town gas is methane. The value of reformed   H 2   Calorific   value / input   CH 4 Calorific   value was calculated as 0.98, considering the equilibrium condition. In addition, the stoichiometric value of hydrogen ( H 2   stoichiometric ) was set to 1.1, so that the heat required for the reforming reaction could be covered by unreacted gas in the fuel cell. G and H are the Gibbs free energy change and enthalpy change when water is formed from hydrogen and oxygen (80 °C), and these values are −228 kJ/mol and −282 kJ/mol, respectively.   V 0 is the theoretical electromotive force of the fuel cell (80 °C), with a value of 1.18 V. η i n v is the inverter efficiency that was set at 0.90.

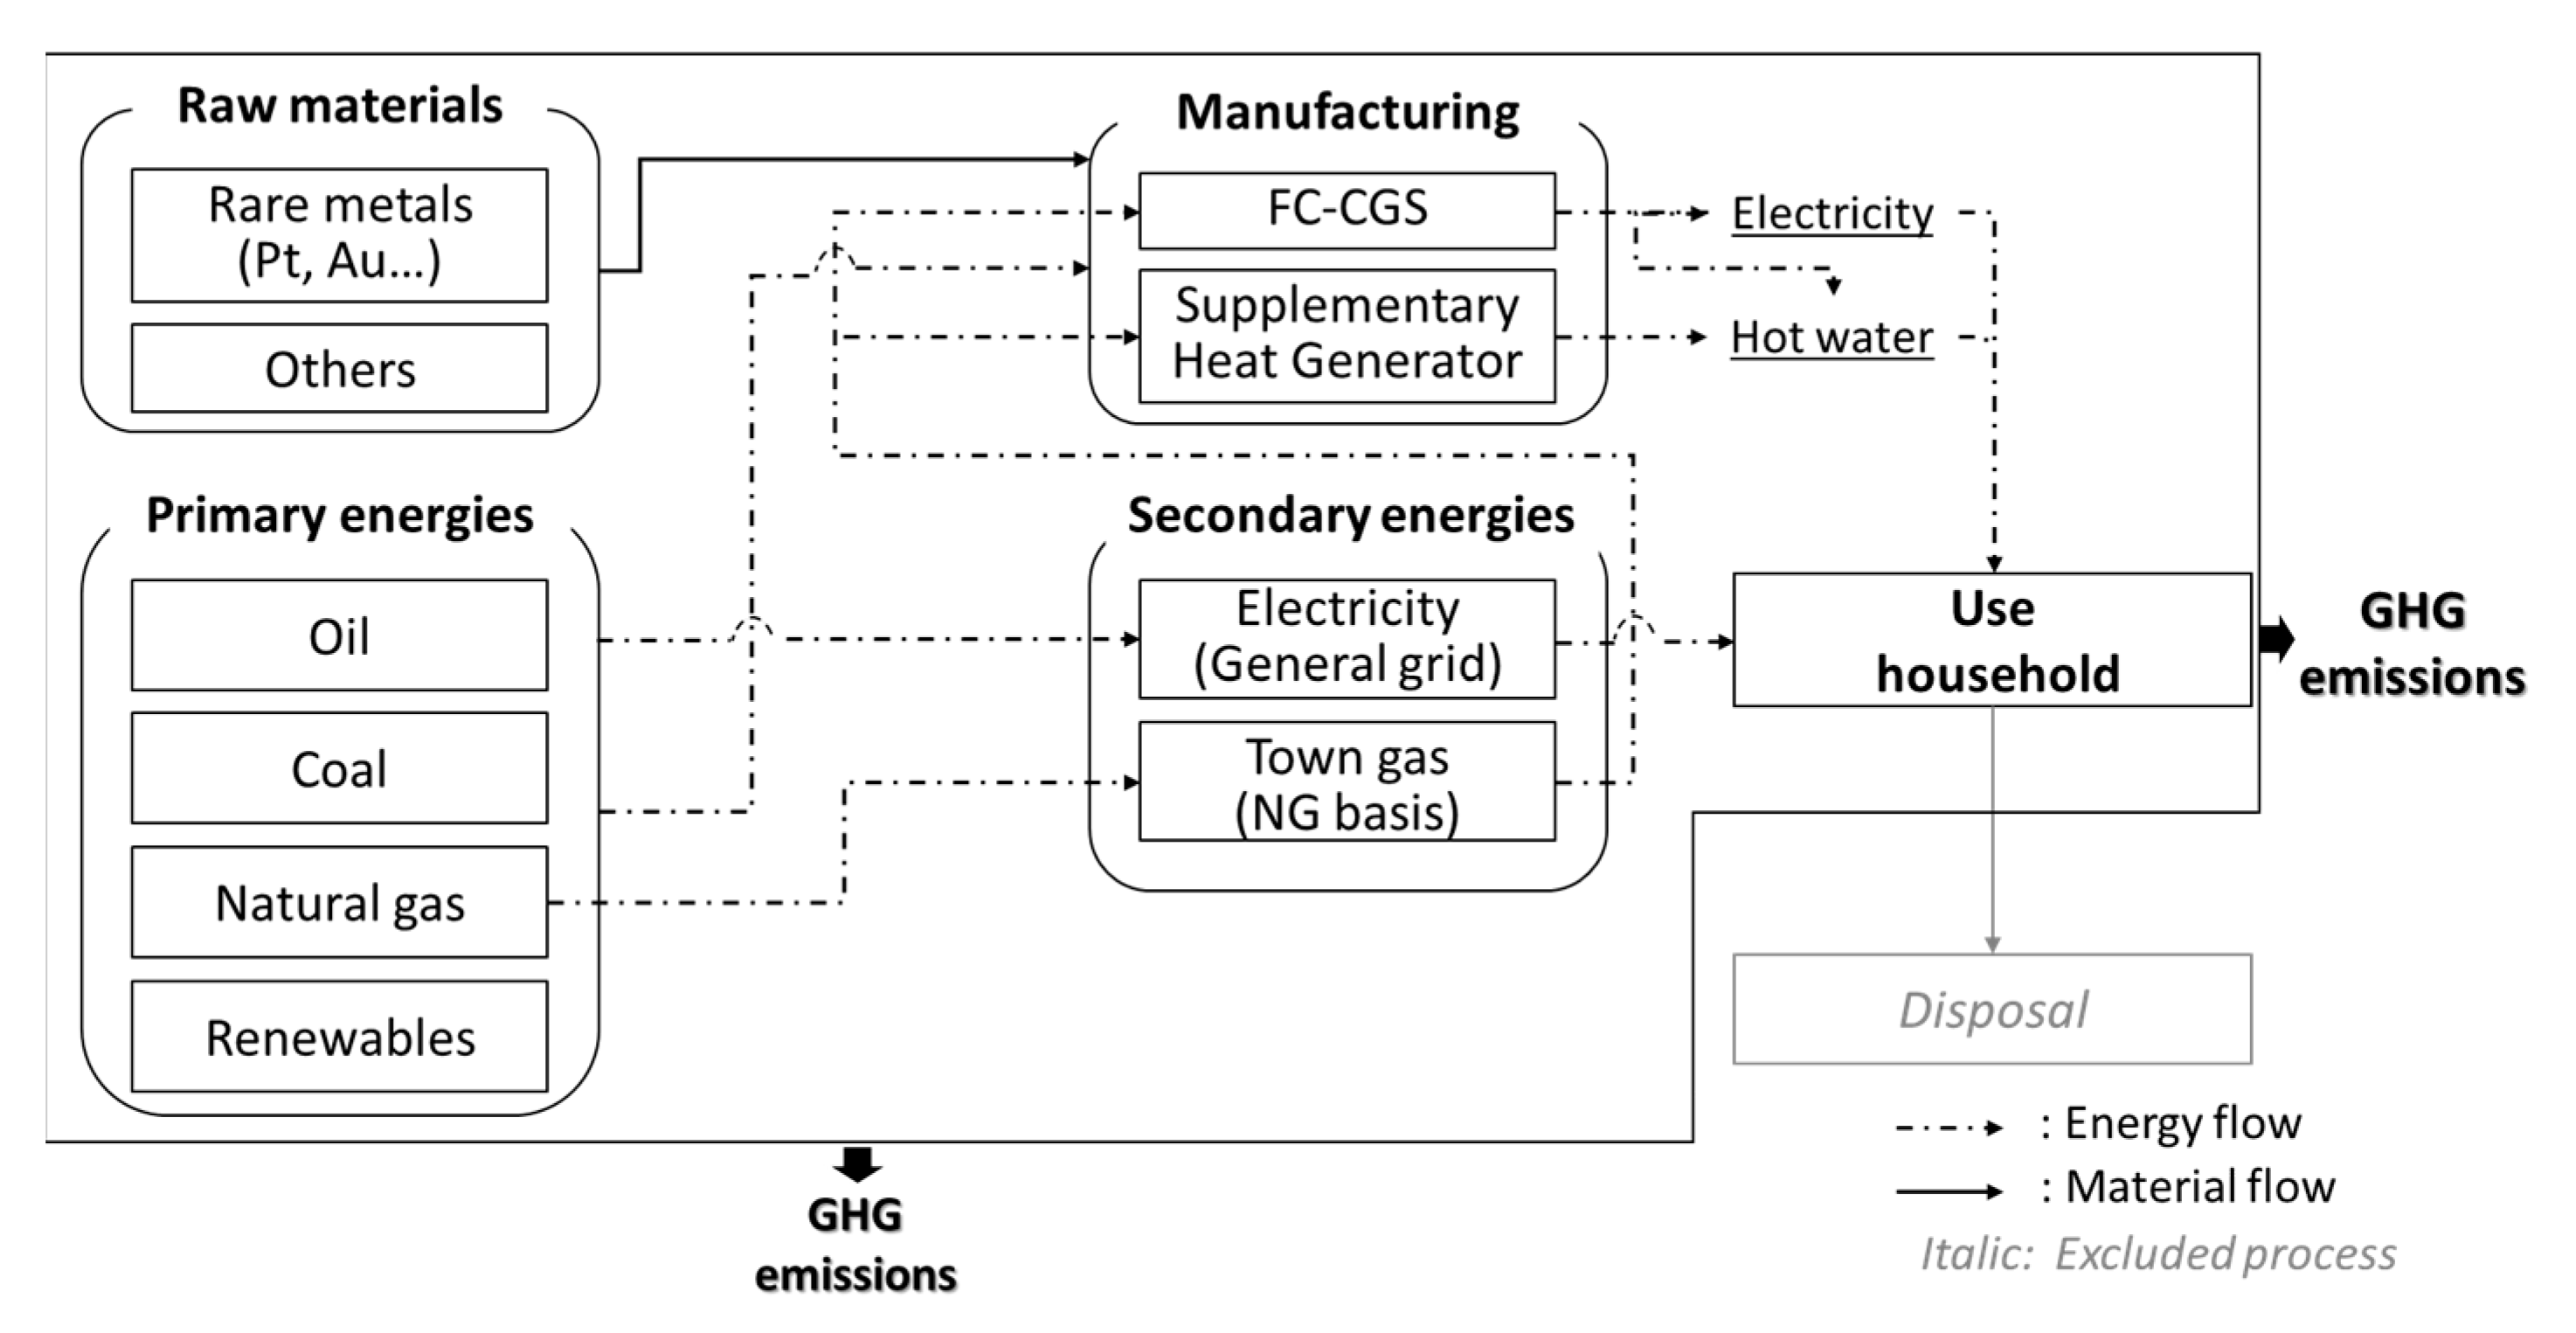
2.6. Environmental Impact Assessment Methodology

The IEC TS 62282-9-101 introduces a simplified evaluation method for the life cycle environmental performance of FC-CGS for household use, with the aim of enhancing the environmental performance of products and communicating this to consumers to meet corporate requirements for environmental management in response to the recent escalation of global environmental problems [10]. To achieve this goal, an environmentally friendly design is needed in the development of new and improved products, and their efforts should be evaluated from a life cycle perspective. The procedure requires the FC-CGS evaluation period to be ten years and is based on energy demand profiles that consider seasonal variations. This section sets the conditions for conducting an environmental impact assessment including these requirements.

2.6.1. Environmental Impact Assessment Scope and PEMFC-CGS Operating Conditions

In the present study, the environmental impact of the 700 W-scale PEMFC-CGS was estimated. Figure 3 shows the system boundaries. The scope of the environmental impact assessment was the manufacturing and utilization stages. The functional unit is defined as the total demand for electricity and heat in a typical household for 10 years, including seasonal variations. The environmental impact indicators were GWP, ADP (elements), and ADP (fossil fuels). For the electricity and hot water demand data, we referred to JISC 8851 [47] (Figure 4). These data target a standard Japanese household (a family of four) for 121 days in winter, 152 days in spring and autumn, and 92 days in summer. The PEMFC-CGS operates according to the power demand and stops operation when the hot water storage tank is full. Once the system is shut down, it takes at least two hours to restart [48]. The operating temperature of the fuel cell was 80 °C and the hot water temperature was 60 °C [49]. The amount of hot water generated from waste heat was calculated using the following values: temperature of tap water, 9 °C in winter, 17 °C in spring and autumn, 24 °C in summer [47]; specific heat of water, 4.2 J/gK; density of water, 1.0 g/cm3. Shortages against the demands were compensated for by the grid electricity and supplementary boiler (fueled by the town gas).
The voltage per cell during power generation, corresponding to the demand data, is shown in Figure 5. The operating voltage is related to the reaction of Pt dissolution and is substituted into E in Equations (6) and (7). Notably, the cell voltage when not generating power was assumed to be the open circuit voltage [50]. As for voltage cycle, the catalyst layer degradation measurement protocol specified by the FCCJ includes carbon corrosion tests using startup/shutdown cycles and Pt catalyst degradation tests using continuous operation cycles [19]. Because present study focused on Pt catalyst degradation caused by long term utilization, startup/shutdown was not included, and Pt catalyst degradation due to continuous operation was considered.

2.6.2. Inventory Analysis

The inventory data for the PEMFC-CGS were based on the annual project report of NEDO [13]. A summary of the manufacturing-stage inventory data is presented in Table 4. Secondary data were based on Ecoinvent 3.7.1 [51], and the CML-IA baseline V3.06 was used as the impact assessment method. The LCA software SimaPro 9.2.0.1 [52] was used in the present study. The GWPs of grid power and city gas are 0.618 kg-CO2 eq/kWh and 0.0765 kg-CO2 eq/MJ, respectively, and they were calculated using the LCA software.

3. Results

In the present study, the manufacturing of a 700 W town gas reforming-type PEMFC-CGS and its use for 10 years were evaluated. The operating conditions of the PEMFC were 80 °C and 100% RH. First, we described the results of the degradation model of the cathode catalyst layer and showed the effect of degradation on power generation performance. Next, we indicated the value of environmental impact per functional unit (the total demand for electricity and heat in a typical household for 10 years, including seasonal variations) calculated based on the degradation model results.

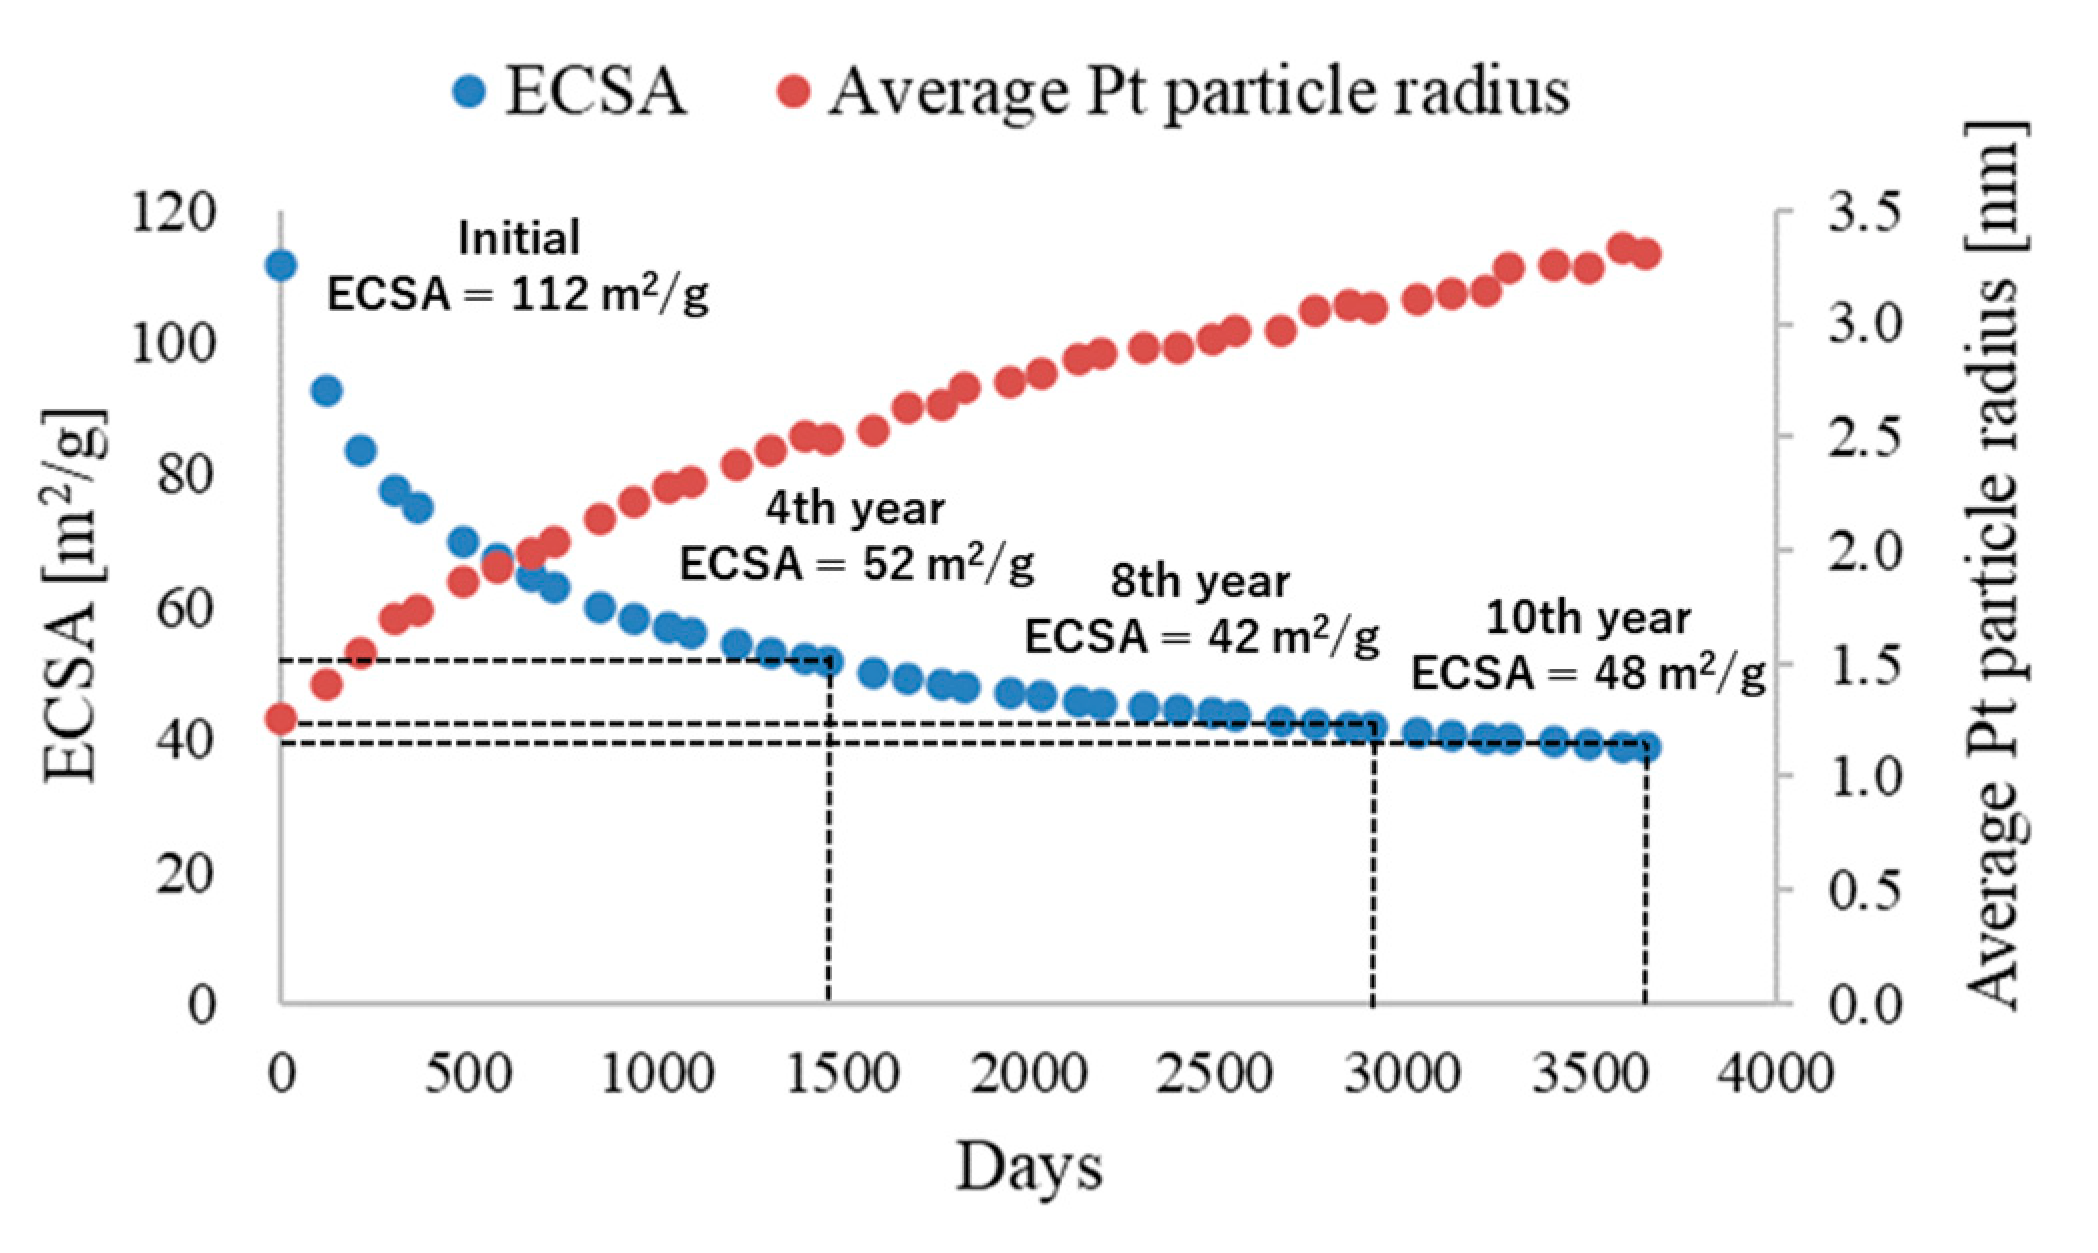
3.1. ECSA Decreasing Simulation

The simulation results of the ECSA reduction and Pt particle coarsening are shown in Figure 6. Consequently, the ECSA decreased by 33% after a year and by 65% after 10 years. In the simulation, the decrease in the ECSA depended on the Pt particle diameter and operating voltage as Equations (6), (7), and (14) indicated. Figure 7 shows the degradation of the I-V characteristics owing to the reduction in ECSA. The decline was 54% in year 4 and 63% in year 8. For instance, the decrease in year 8 corresponded with approximately 0.12 V at a maximum current density. This phenomenon is based on the reduction in the ECSA, and the decline in the I-V characteristics is not linear. Figure 8 shows the relationship between the ECSA drop rate and PEMFC output power drop rate. The output power drop rate is the ratio of the power at the maximum current density each time to the initial rated power (the current cell density is maximum). In addition, Figure 8 shows the results of durability evaluation tests conducted by Hashimasa et al. [53] using the FCCJ load cycle tests protocol, which showed a power degradation rate of approximately 20% at an ECSA degradation rate of 50–60% for the Pt catalysts. By contrast, in the present study, the output degradation rate was 13% for an ECSA degradation rate of 58%. Therefore, although the power reduction effect in the present study was about 7 percentage points smaller than the results of the previous research, these results were in general agreement.
Figure 9 shows the decrease in the power generation efficiency and thermal efficiency of the PEMFC, calculated from the changes in the I-V characteristics shown in Figure 7 and Equations (34) and (35), respectively. The power generation efficiency at 600 W was 41% in year 1 and decreased by approximately 8% to 33% in the year 8. In contrast, the thermal efficiency at 600 W was 31% in year 1 and increased by approximately 8% to 39% in year 8. These efficiency changes affect the power generation of the PEMFC-CGS per day. Figure 10 shows the transition of the power generation amount of the PEMFC-CGS in one day. The amount of power generated per day decreased with PEMFC degradation. When comparing year 1 to year 10, the power generation decreased by 17%, 11%, and 26% in winter, spring and autumn, and summer, respectively. In particular, for the power generation amount in the summer, after year 5, the thermal efficiency increased owing to degradation, and the hot water supply increased. Hence, the hot water storage tank was full at 6 p.m., and power generation stopped for two hours. The amount of electricity that should have been generated during these two hours was approximately 1.2 kWh, which resulted in a more significant decrease in electricity generation than that in other seasons.

3.2. Results of Environmental Impact Assessment

Finally, the results of the environmental impact assessment are presented in this subsection. Based on the decrease in the ECSA, electrical efficiency, and power generation amount per day over 10 years, an environmental impact assessment at the utilization stage was conducted. Figure 11 and Figure 12a,b show ADP (elements) in the manufacturing stage and GWP and ADP (fossil fuels) in the manufacturing and utilization stage. In the ADP (elements) during the manufacturing stage, the proportion of the PEMFC stack was 34%, and that of the supplementary boiler was 50%. The significant impact of the PEMFC stack is due to the use of a Pt catalyst. However, the impact of the supplementary boiler was substantial because the gold contained in the circuit board had a significant impact [13].
The results of GWP and ADP (fossil fuels) during the manufacturing and utilization stages showed that the utilization stage impact accounted for a larger proportion than the manufacturing stage impact. For example, the manufacturing impact was 2% for GWP, which was negligible impact, and 15% for ADP (fossil fuels) and GWP. Alternatively, regarding GWP, town gas for the fuel cell contributed 50% and grid electricity contributed 39%. For ADP (fossil fuels), the influence of town gas on the fuel cell was 47%, and that of grid electricity was 31%. Therefore, reducing the impacts during the utilization phase is important to minimize the overall life-cycle impacts of these categories.
Figure 13 shows the results of the GWP transition in the use stage. As shown in Figure 10, the daily power generation of the PEMFC-CGS gradually decreased. Therefore, the grid power usage was increased to meet the power demand. GWP from the grid power increased by 22% in year 10 compared to year 1. Simultaneously, increased thermal efficiency leads to an increased hot water supply and reduced supplementary boiler usage. GWP from the supplementary boiler usage decreased by 36% in year 10 compared to year 1. In total, the impact of the increased use of grid electricity outweighed the benefits of the improved thermal efficiency and increased GWP by 5% in year 10 compared to year 1.
Consequently, this implies that a model of catalyst deterioration of the cathode catalyst layer is highly significant for incorporation into the environmental impact assessment of the PEMFC-CGS. Moreover, the results of Figure 6, Figure 7, Figure 8, Figure 9, Figure 10, Figure 11, Figure 12 and Figure 13 show that the degradation effects of the PEMFC could be reflected in the environmental impact assessment.

4. Discussion

In the Results section, by incorporating the Pt catalyst degradation model of the cathode catalyst layer into the environmental impact assessment of the PEMFC-CGS, scaling was performed from the level of a mathematical model of the PEMFC to the environmental impact assessment over the life cycle. Here, a sensitivity analysis of the Pt loading amount was performed because this is an important parameter for both ADP (elements) in the manufacturing stage and GWP in the entire life cycle. The baseline Pt loading amount on the cathode side of the fuel cell was 0.3 mg/cm2, while environmental impact assessments were conducted for 0.2 mg/cm2 and 0.4 mg/cm2. Simultaneously, a comparison was made with the case without introducing PEMFC-CGS.
Figure 14 shows the results of the sensitivity analysis of the amount of Pt. At the baseline value (0.3 mg/cm2), the GWP was reduced by 7.3% compared to that in the case without FC-CGS. In contrast, the reduction rates were 6.5% and 7.8% when the Pt loading was 0.2 mg/cm2 and 0.4 mg/cm2, respectively.
Because the supported amount of the Pt catalyst was changed, the value of L P t in Equation (15) changed, and the results of the changes in the oxygen transport resistance and the cathode activation overpotential were reflected. When the amount of Pt was reduced from the baseline value to 0.2 mg/cm2, the oxygen transport resistance increased according to Equation (15). Then, according to Equation (17), the oxygen concentration on the Pt particle surface decreased. Therefore, according to Equation (18), the cathode activation overpotential increased, leading to a decrease in the PEMFC electrical efficiency, an increase in grid electricity consumption, and a decrease in the reduction of GWP. Such an analysis can show the relationship between Pt and environmental impact value. Therefore, it will be useful for proposing the optimum amount of Pt that matches the requirements for environmental problems.

5. Conclusions

In the present study, the comprehensive evaluation was conducted, including PEMFC degradation and environmental impact assessment of the 700 W-scale PEMFC-CGS based on the technical specifications (IEC TS 62282-9-101) released by the IEC. Through the Ostwald ripening and Pt dissolution model, the ECSA value decreased by 33% after a year and by 65% after 10 years because of the degradation simulation. Based on this simulation, the electrical efficiency and power output amount per day of the PEMFC-CGS were calculated based on the assumption of 10 years of operation. Then, the catalyst degradation model of the cathode catalyst layer was incorporated into the environmental impact assessment of the PEMFC-CGS for 10 years of operation. Consequently, the environmental impact assessment was more detailed than before. Based on these results, from the level of mathematical models, it became possible to reveal that the degradation of fuel cells increases the GWP and amount of grid electricity used. In addition, the sensitivity analysis indicated the relationship between the Pt loading amount and GWP. It was revealed that this evaluation methodology would help enhance the environmental performance of PEMFC-CGS for appropriate environmentally conscious design to deal with environmental problems. In other words, incorporating parameters that determine the environmental characteristics of PEMFC-CGS, such as Pt loading and operating profiles, into environmental impact assessment, as present study, would provide a practical assessment platform that contributes to environmentally conscious design. Furthermore, the present study’s evaluation methodology can be extended to outputs other than 700 W by setting up power and hot water demand profiles, designing fuel cell characteristics and stack size, and developing the inventory in the manufacturing stage. Hence, the evaluation for PEMFC-CGS beyond residential use will be also considered achievable.

Author Contributions

Supervision, K.D.; writing—original draft, S.T. and S.T. performed theoretical analysis; K.D. collaborated and supervised article writing. All authors have read and agreed to the published version of the manuscript.

Funding

This research received no external funding.

Data Availability Statement

Not applicable.

Acknowledgments

The present study was supported by the Japan Electrical Manufacturers’ Association (JEMA).

Conflicts of Interest

The authors declare no conflict of interest.

Glossary

A Area of CCL, cm2
a Activity of water
a c Volumetric surface area of ionomer, cm2/cm3
a P t Active volumetric surface area of Pt, cm2/cm3
C k Molar concentration of species k, mol/cm3
d Channel width, cm
r Pt particle radius, nm
F Faraday’s constant, 96,485 C/mol
h Channel height, cm
I Operating current density, A/cm2
j c Volumetric current density, A/cm3
m Number fraction of Pt/C particles
M k Mole flow of species k, mol/s
m w Mole fraction of water
p Pressure, Pa
p H 2 O s a t Saturated water vapor pressure, Pa
R Universal gas constant, 8.314 J/(mol K)
R m e m Membrane resistance, Ωcm2
R T Oxygen transport resistance, S/cm2
TTemperature, K
V Cell operation voltage, V
V 0 Standard electromotive force of fuel cell, V
α Net water molecule (vapor) fraction that can pass through the membrane per proton
δkThickness of k, cm
η c Cathode overpotential, V
θPtOPt-oxide coverage
λ Water content in the membrane
a n Anode
c Cathode
C L Catalyst layer
i o n Ionomer
g Gas
l Liquid
m e m Membrane
w Water
P t Pt surface
r e f Reference value
s a t Saturated vapor

References

  1. ENE-FARM Partners. ENE-FARM Manufacturer Sales Volume. Available online: https://www.ace.or.jp/web/works/works_0090.html (accessed on 27 December 2022). (In Japanese).
  2. Challenge Zero. Residential Fuel Cell ENE-FARM. Available online: https://www.challenge-zero.jp/en/casestudy/469 (accessed on 4 January 2023).
  3. EU-Japan Centre for Industrial Cooperation. Hydrogen And Fuel Cellsin Japan. Available online: https://www.eu-japan.eu/sites/default/files/publications/docs/hydrogen_and_fuel_cells_in_japan.pdf (accessed on 4 January 2023).
  4. Sun, C.; Zhang, H. Review of the development of first-generation redox flow batteries: Iron-chromium system. ChemSusChem 2022, 15, e202101798. [Google Scholar] [CrossRef]
  5. Simader, G.; Vidovic, P. Success factors for demonstration projects of small-scale stationary fuel cells in residential buildings. In E3S Web of Conferences; EDP Sciences: Les Ulis, France, 2022; Volume 334, p. 04007. [Google Scholar]
  6. TOKYO GAS. Integration of Gas and Electricity with Residential Fuel Cell. Available online: http://staging.igu.make.technology/app/uploads/2019/08/8.1-Kentaro-Ito-20.02-1.pdf (accessed on 4 January 2023).
  7. Osaka Gas. Demonstration of Energy Management Using Three Types of Batteries. Available online: https://www.osakagas.co.jp/en/whatsnew/__icsFiles/afieldfile/2022/03/30/220325.pdf (accessed on 4 January 2023).
  8. Panasonic Group. A Society that Creates More Energy than It Uses. Available online: https://news.panasonic.com/global/stories/914 (accessed on 4 January 2023).
  9. Widera, B. Renewable hydrogen implementations for combined energy storage, transportation and stationary applications. Therm. Sci. Eng. Prog. 2020, 16, 100460. [Google Scholar] [CrossRef]
  10. International Electrotechnical Commission. Evaluation methodology for the environmental performance of fuel cell power systems based on life cycle thinking–Streamlined life-cycle considered environmental performance characterization of stationary fuel cell combined heat and power systems for residential applications. In IEC/TS 62282-9-101; IEC: Geneva, Switzerland, 2020. [Google Scholar]
  11. Hydrogen Tools. IEC/TS 62282-9-101. Available online: https://h2tools.org/fuel-cell-codes-and-standards/iects-62282-9-101-evaluation-methodology-environmental-performance (accessed on 22 December 2022).
  12. Sato, K.; Seo, Y.; Dowaki, K. A Proposal of Indicator for Stationary Fuel Cell Cogeneration System Using LCA Consideration and DEA (FCDEA). J. Life Cycle Assess. 2018, 14, 36–45. [Google Scholar] [CrossRef] [Green Version]
  13. New Energy and Industrial Technology Development Organization. Investigation for the Requirements on the Specification of Fuel Cell Systems from the Viewpoint of Fuel Cell Market Expansion. Available online: https://www.nedo.go.jp/content/100925942.pdf (accessed on 7 January 2023). (In Japanese).
  14. Tochigi, S.; Dowaki, K. Environmental Impacts Analysis of Stationary Fuel Cell Combined Heat and Power Generation Systems. J. Jpn. Inst. Energy 2021, 100, 200–205. [Google Scholar] [CrossRef]
  15. Li, Y.; Moriyama, K.; Gu, W.; Arisetty, S.; Wang, C.Y. A one-dimensional Pt degradation model for polymer electrolyte fuel cells. J. Electrochem. Soc. 2015, 162, F834. [Google Scholar] [CrossRef] [Green Version]
  16. Bachmann, T.M.; Carnicelli, F.; Preiss, P. Life cycle assessment of domestic fuel cell micro combined heat and power generation: Exploring influential factors. Int. J. Hydrogen Energy 2019, 44, 3891–3905. [Google Scholar] [CrossRef]
  17. Ozawa, A.; Kudoh, Y. Performance of residential fuel-cell-combined heat and power systems for various household types in Japan. Int. J. Hydrogen Energy 2018, 43, 15412–15422. [Google Scholar] [CrossRef]
  18. Mlakar, N.; Lotrič, A.; Sekavčnik, M.; Mori, M. The influence of degradation effects in proton exchange membrane fuel cells on life cycle assessment modelling and environmental impact indicators. Int. J. Hydrogen Energy 2022, 47, 24223–24241. [Google Scholar]
  19. Ohma, A.; Shinohara, K.; Iiyama, A.; Yoshida, T.; Daimaru, A. Membrane and catalyst performance targets for automotive fuel cells by FCCJ membrane, catalyst, MEA WG. ECS Trans. 2011, 41, 775. [Google Scholar] [CrossRef]
  20. de Bruijn, F.A.; Dam VA, T.; Janssen, G.J.M. Durability and degradation issues of PEM fuel cell components. Fuel Cells 2008, 8, 3–22. [Google Scholar] [CrossRef]
  21. Sun, C.; Negro, E.; Nale, A.; Pagot, G.; Vezzu, K.; Zawodzinski, T.A.; Di Noto, V. An efficient barrier toward vanadium crossover in redox flow batteries: The bilayer [Nafion/(WO3)x] hybrid inorganic-organic membrane. Electrochim. Acta 2021, 378, 138133. [Google Scholar] [CrossRef]
  22. Ao, Y.; Chen, K.; Laghrouche, S.; Depernet, D. Proton exchange membrane fuel cell degradation model based on catalyst transformation theory. Fuel Cells 2021, 21, 254–268. [Google Scholar] [CrossRef]
  23. Hao, L.; Moriyama, K.; Gu, W.; Wang, C.Y. Modeling and experimental validation of Pt loading and electrode composition effects in PEM fuel cells. J. Electrochem. Soc. 2015, 162, F854. [Google Scholar] [CrossRef]
  24. Fasmin, F.; Ramanathan, S. Effect of CO poisoning of PEM fuel cell anode on impedance spectra-simulations. ECS Trans. 2015, 66, 1. [Google Scholar] [CrossRef]
  25. Panasonic. What Are Fuel Cells? Available online: https://panasonic.biz/appliance/FC/enefarm/about_fuelcells.html (accessed on 6 January 2023). (In Japanese).
  26. Narusawa, K.; Hayashida, M.; Kurashima, D.; Wakabayashi, K.; Kamiya, Y. Analyses on Declining Performance of PEMFC with Fuel Containing Impurities (Proposal of Analytical Methods Adopting Poisoning Prediction Formulas and Poisoning Estimation Coefficient). JSME Int. J. Ser. B Fluids Therm. Eng. 2003, 46, 643–649. [Google Scholar] [CrossRef] [Green Version]
  27. Kregar, A.; Kravos, A.; Katrašnik, T. Methodology for evaluation of contributions of Ostwald ripening and particle agglomeration to growth of catalyst particles in PEM fuel cells. Fuel Cells 2020, 20, 487–498. [Google Scholar] [CrossRef]
  28. Martens, I.; Chattot, R.; Drnec, J. Decoupling catalyst aggregation, ripening, and coalescence processes inside operating fuel cells. J. Power Sources 2022, 521, 230851. [Google Scholar] [CrossRef]
  29. Li, Y.; Chen, X.; Liu, Y.; Xiong, D.; Li, J.; Yin, S.; Xu, J. Analytical modeling framework for performance degradation of PEM fuel cells during startup–shutdown cycles. RSC Adv. 2020, 10, 2216–2226. [Google Scholar] [CrossRef] [Green Version]
  30. Holby, E.F.; Morgan, D. Application of Pt nanoparticle dissolution and oxidation modeling to understanding degradation in PEM fuel cells. J. Electrochem. Soc. 2012, 159, B578. [Google Scholar] [CrossRef]
  31. Borup, R.L.; Mukundan, R. PEM fuel cell degradation. ECS Trans. 2010, 33, 17. [Google Scholar] [CrossRef]
  32. Kohsakowski, S.; Streubel, R.; Radev, I.; Peinecke, V.; Barcikowski, S.; Marzun, G.; Reichenberger, S. First PEM fuel cell based on ligand-free, laser-generated platinum nanoparticles. Appl. Surf. Sci. 2019, 467, 486–492. [Google Scholar] [CrossRef]
  33. Ferreira, P.J.; Shao-Horn, Y.; Morgan, D.; Makharia, R.; Kocha, S.; Gasteiger, H.A. Instability of Pt/C electrocatalysts in proton exchange membrane fuel cells: A mechanistic investigation. J. Electrochem. Soc. 2005, 152, A2256. [Google Scholar] [CrossRef] [Green Version]
  34. Shao, M.; Peles, A.; Shoemaker, K. Electrocatalysis on platinum nanoparticles: Particle size effect on oxygen reduction reaction activity. Nano Lett. 2011, 11, 3714–3719. [Google Scholar] [CrossRef]
  35. Gwak, G.; Lee, J.; Ghasemi, M.; Choi, J.; Lee, S.W.; Jang, S.S.; Ju, H. Analyzing oxygen transport resistance and Pt particle growth effect in the cathode catalyst layer of polymer electrolyte fuel cells. Int. J. Hydrogen Energy 2020, 45, 13414–13427. [Google Scholar] [CrossRef]
  36. Arai, H.; Irita, M.; Katayama, N. Investigation of multilayered catalyst layers for polymer electrolyte fuel cells by electrospray deposition. ECS Trans. 2020, 98, 333. [Google Scholar] [CrossRef]
  37. Nguyen, T.V.; White, R.E. A water and heat management model for proton-exchange-membrane fuel cells. J. Electrochem. Soc. 1993, 140, 2178. [Google Scholar] [CrossRef]
  38. Jung, S.Y.; Nguyen, T.V. An along-the-channel model for proton exchange membrane fuel cells. J. Electrochem. Soc. 1998, 145, 1149. [Google Scholar]
  39. Chowdhury, M.Z.; Genc, O.; Toros, S. Numerical optimization of channel to land width ratio for PEM fuel cell. Int. J. Hydrogen Energy 2018, 43, 10798–10809. [Google Scholar] [CrossRef]
  40. Ge, S.H.; Yi, B.L. A mathematical model for PEMFC in different flow modes. J. Power Sources 2003, 124, 1–11. [Google Scholar] [CrossRef]
  41. Al-Baghdadi, M.A.S. Three-dimensional computational fluid dynamics model of a tubular-shaped PEM fuel cell. Renew. Energy 2008, 33, 1334–1345. [Google Scholar] [CrossRef]
  42. Panasonic. Ene-Farm Development Story 1. Available online: https://holdings.panasonic/jp/corporate/about/history/panasonic-museum/pdf/ism20210917_04_ef-story.pdf (accessed on 16 January 2023). (In Japanese).
  43. Panasonic. ENE-FARM for Detached Houses for General Use. Available online: https://panasonic.biz/appliance/FC/lineup/house01.html (accessed on 6 January 2023). (In Japanese).
  44. Jeon, D.H.; Kim, K.N.; Baek, S.M.; Nam, J.H. The effect of relative humidity of the cathode on the performance and the uniformity of PEM fuel cells. Int. J. Hydrogen Energy 2011, 36, 12499–12511. [Google Scholar] [CrossRef]
  45. Wang, L.; Husar, A.; Zhou, T.; Liu, H. A parametric study of PEM fuel cell performances. Int. J. Hydrogen Energy 2003, 28, 1263–1272. [Google Scholar] [CrossRef]
  46. Hirotsu, M.; Hamada, T.; Kimura, S. Development and Technology Trends of Latent Heat Recovery Gas Water Heater for Residential Use. Flow 2011, 25, 102–108. (In Japanese) [Google Scholar]
  47. Japanese Industrial Standards, kikakurui.com Homepage. Available online: https://kikakurui.com/c8/C8851-2013-01.html (accessed on 27 December 2022). (In Japanese).
  48. Keiyo GAS. Panasonic ENE-FARM Q&A. Available online: https://www.keiyogas.co.jp/product/enefarm/panasonic/qa.html (accessed on 6 January 2023). (In Japanese).
  49. Saibu Gas. ENE-FARM Panasonic. Available online: https://www.saibugas.co.jp/home/product/enefarm/list/panasonic.htm (accessed on 6 January 2023). (In Japanese).
  50. Tang, Y.; Yuan, W.; Pan, M.; Li, Z.; Chen, G.; Li, Y. Experimental investigation of dynamic performance and transient responses of a kW-class PEM fuel cell stack under various load changes. Appl. Energy 2010, 87, 1410–1417. [Google Scholar] [CrossRef]
  51. Moreno Ruiz, E.; Valsasina, L.; FitzGerald, D.; Symeonidis, A.; Turner, D.; Müller, J.; Minas, N.; Bourgault, G.; Vadenbo, C.; Ioannidou, D.; et al. Documentation of Changes Implemented in Ecoinvent Database v3. 7 & v3. 7.1; Ecoinvent Association: Zürich, Switzerland, 2020. [Google Scholar]
  52. SimaPro. LCA Software for Informed Change-Makers. Available online: https://simapro.com/ (accessed on 10 January 2023).
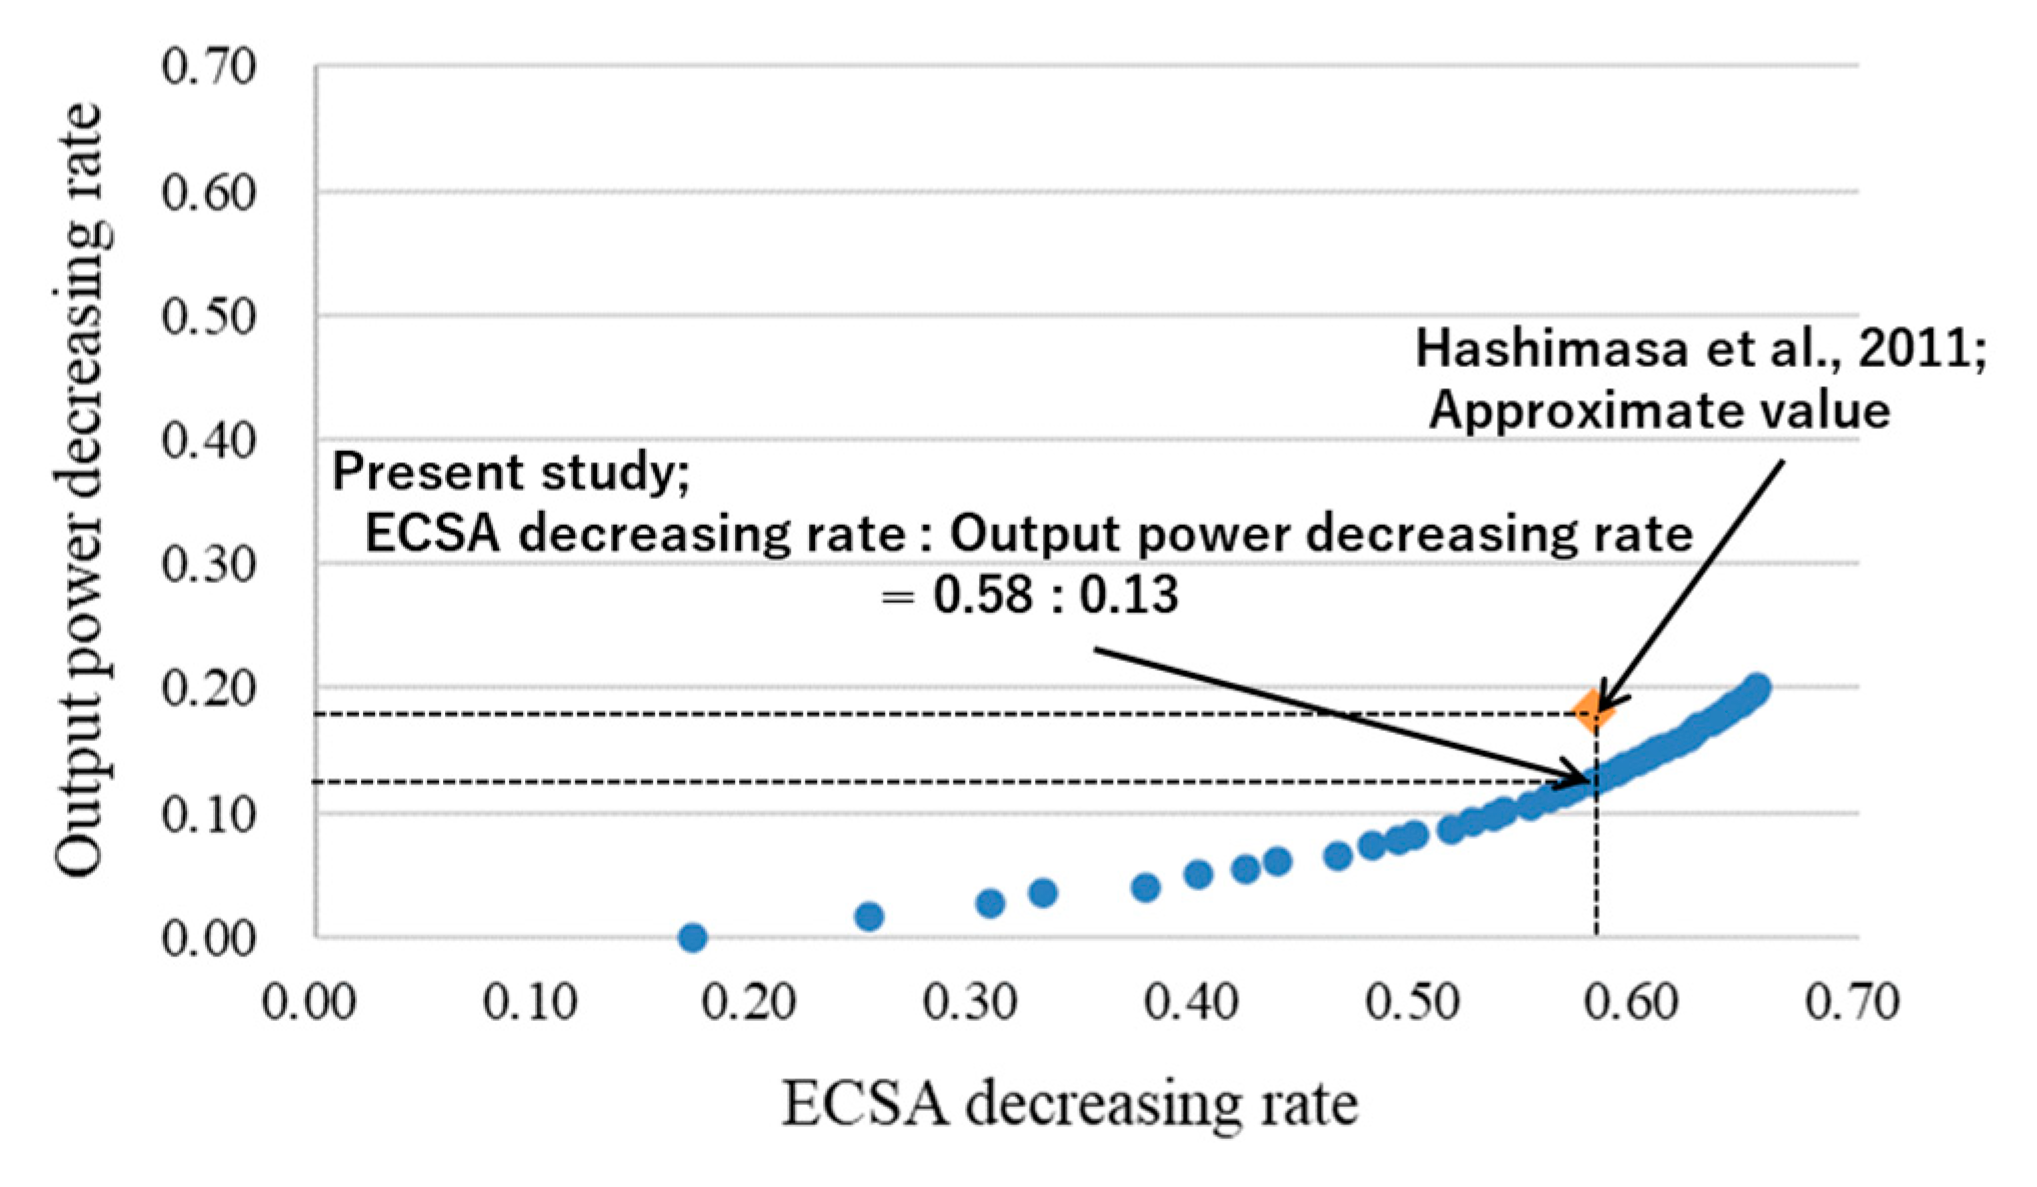
  53. Hashimasa, Y.; Matsuda, Y.; Imamura, D.; Akai, M.; Sasaki, M. Evaluation of MEA Durability Test Protocols. Nihon Kikai Gakkai Rombunshuu. B Hen 2011, 77, 147–159. (In Japanese) [Google Scholar] [CrossRef] [Green Version]
Figure 1. Log-normal platinum particle radius distribution.
Energies 16 01985 g001
Figure 2. The comparison of I-V characteristics of initial state between simulated value using present study models and experimental value conducted by Arai et al. [36], under 50 °C and 100% RH conditions.
Energies 16 01985 g002
Figure 3. System boundary.
Energies 16 01985 g003
Figure 4. Energy demand considering seasonal variation [40].
Energies 16 01985 g004
Figure 5. Operating single-cell voltage for the demand (initial).
Energies 16 01985 g005
Figure 6. Simulated ECSA and average Pt particle radius transitions.
Energies 16 01985 g006
Figure 7. The I-V characteristics transition due to Pt catalyst degradation.
Energies 16 01985 g007
Figure 8. Effects of ECSA decrease rate on output power decrease rate [51].
Energies 16 01985 g008
Figure 9. Electrical and heat efficiency transition of the PEMFC-CGS.
Energies 16 01985 g009
Figure 10. Transition of the PEMFC’s power generation amount per day.
Energies 16 01985 g010
Figure 11. Results of ADP (elements) during the manufacturing stage.
Energies 16 01985 g011
Figure 12. (a) Results of GWP in the manufacturing and utilization stage; (b) results of ADP (fossil fuels) in the manufacturing and utilization stage.
Energies 16 01985 g012
Figure 13. GWP transition per year in the utilization stage.
Energies 16 01985 g013
Figure 14. Relationship between GWP and Pt loading amount.
Energies 16 01985 g014
Table 1. The parameters used in the Pt degradation model.
SymbolValueUnitsReferenceDescription
k 1 10 9 1/s[22]Equilibrium rate constant of Equation (1) for Pt bulk; tuning parameter
k 2 10 10 1/s[22]Equilibrium rate constant of Equation (2) for Pt bulk; tuning parameter
k 3 10 4 1/s[22]Equilibrium rate constant of Equation (3) for Pt bulk; tuning parameter
E 1 1.188V[22]Equilibrium potential of Equation (1) for Pt bulk
E 2 0.98V[22]Equilibrium potential of Equation (2) for Pt bulk
α m 1-[22]Material-dependent parameter (“capillary length”) typical of the order of 1 nm
V p t 9.09 × 10 6 m3/mol[22]Molar volume of Pt
Dm 1.5 × 10 2 mol/L[22]Diffusion coefficient of Pt; tuning parameter
cpt 1.0 × 10 7 mol/L[33]Concentration of Pt atoms
c H + 1mol/L[22]Concentration of H+ in the solution
c H + r e f 1mol/L[22]Reference value of c H +
Table 2. Parameter values of the oxygen transport resistance model.
SymbolValueUnitsReferenceDescription
k 1 8.5-[23]Transport resistance coefficient at the ionomer film surface
k 2 5.4-[23]Transport resistance coefficient at the Pt particle surface
k 3 6.5-[35]Transport resistance coefficient at the water film surface
D O 2 , i o n 5.8 × 10 11 m2/s[35]O2 diffusivities through the ionomer film
D O 2 , w 5.8 × 10 11 m2/g[35]O2 diffusivities through the water film
a E C S A 112m2/g-The electrochemical surface area of Pt (initial)
L P t 0.30mg/cm2[36]Pt loading
I 0 , c r e f 3.0 × 10 5 A/cm2[35]Reference exchange current density of oxygen reduction reaction
C O 2 r e f 4.0 × 10 5 mol/cm3[35]Reference O2 molar concentration
γ c 0.75-[35]Reaction order for cathode
E c 70kJ/mol[35]The activation energy in an oxygen reduction reaction
α c 0.5-[23]Transfer coefficient of an oxygen reduction reaction
Table 3. The specifications of the PEMFC-CGS and the stack.
ParameterValueUnitsReference
Rated output700W[13]
Rated shutdown output 210W[13]
Heat recovery efficiency of the supplementary heat generator 0.95-[46]
Inverter efficiency0.90--
Minimum cell voltage0.72V-
Maximum cell current density435mA/cm2-
Number of cells in the stack20--
Pt loading (cathode)0.30mg/cm2[36]
Table 4. The summary of the manufacturing stage inventory data of PEMFC-CGS [13].
ComponentsWeight (kg)
Fuel cell unitsFuel cell stack16.1
Reforming units13.7
OtherInverter5.1
Pumps, blower7.67
Heat exchanger6.46
Heat recovery unit6.46
Cables8.07
Casing24.2
Water treatment unit2.91
Hot water storage unitHot water tank50.0
Supplementary boiler38.0
Total mass178.67
Disclaimer/Publisher’s Note: The statements, opinions and data contained in all publications are solely those of the individual author(s) and contributor(s) and not of MDPI and/or the editor(s). MDPI and/or the editor(s) disclaim responsibility for any injury to people or property resulting from any ideas, methods, instructions or products referred to in the content.

