
Technoeconomic Feasibility of Bioenergy Production from Wood Sawdust


1
Department of Chemical and Biological Engineering, University of Saskatchewan, Saskatoon, SK S7N 5A9, Canada
2
Saskatoon Research and Development Centre, Agriculture and Agri-Food Canada, 107 Science Place, Saskatoon, SK S7N 0X2, Canada
3
Department of Mechanical Engineering, University of Saskatchewan, 57 Campus Drive, Saskatoon, SK S7N 5A9, Canada
*
Author to whom correspondence should be addressed.
Energies 2023, 16(4), 1914; https://doi.org/10.3390/en16041914
Submission received: 23 January 2023
/
Revised: 6 February 2023
/
Accepted: 13 February 2023
/
Published: 15 February 2023
(This article belongs to the Topic Energy Economics and Sustainable Development)
Abstract
:In this study, the technoeconomic feasibility of bioenergy production from sawdust under four different case scenarios is simulated and compared. These scenarios include: (1) heat and electricity generation from raw sawdust; (2) pellet production from sawdust; (3) and (4) integrated biorefinery approach for the simultaneous manufacturing of multiple products (steam-exploded and torrefied pellets) and co-products (furfural, hydroxy methyl furfural (HMF), acetic acid), along with heat and electricity generation. Economic assessments such as cost analysis, payback time (PBT), net present value (NPV) and internal rate of return (IRR) were determined for these scenarios. The results showed that the approach of producing torrefied pellets, furfural, and acetic acid, along with co-generated heat and electricity, in terms of multiproducts and profitability (NPV (at 7%): USD 38.29 M) was preferable over other alternatives. In terms of simplified technology and other economic indices (PBT: 2.49 year, IRR: 51.33%, and return on investment (ROI): 40.1%), the scenario for producing pellets from wood sawdust was more promising than others. If plant capacity was not a limiting factor, the optimal size for the combined heat and power (CHP) plant was between 250–300 kt for the main product. Additionally, untreated and treated pellet plants equipped with CHP had an optimal size of 150–200 kt of wood pellets per year.
1. Introduction
There is substantial woodland in Canada, the United States, Sweden, Norway, Finland, and certain South American nations where wood can be harvested and used in industrial procedures [1]. A number of by-products with no or low market value, such as sawdust and bark, are produced during the manufacturing of wood products [2]. In a comparative study based on several countries (Canada, Brazil, Argentina and China, among other countries, 2017 baseline), the average cost of wood waste at the mill was projected to be in the range of 18–36 USD/t [3]. Pelletization is one of the options for improving the usage of wood waste. Pellets, compared to wood residue, are dry, dense and simple to handle. Additionally, they can be used for heat and electricity generation [4]. Producing pellets without any kind of pretreatment can be referred to as regular pellet production. In order to co-fire pellets with coal, their calorific value needs to be enhanced remarkably [5,6]. Hence pretreatment is necessary for the manufacturing of pellets. One of the novel pretreatment methods for upgrading biomass to biofuel is torrefaction [7]. According to a sensitivity analysis by Agar [8], the biggest obstacles to the economic feasibility of torrefied pellets are their low calorific value and high capital investment costs. The same study’s calculations showed that the annual cost of producing torrefied pellets (EUR 6.11 M) is less than producing non-treated pellets (EUR 7.05 M) [8]. For example, feedstock cost, loan amortization, depreciation, labor, utilities, and transportation costs for the 64 kt torrefied pellet plant were EUR 0.85, 0.63, 0.56, 0.25, 1.24, and 2.58 M, respectively, while the figures for regular pellets were EUR 0.85, 0.44, 0.39, 0.25, 0.88, and 4.23 M, respectively, with a capacity of 80 kt/year [8].
There are other studies addressing the economic analysis of pretreated biomass, such as steam exploded and torrefied versus non-treated material. A case study focusing on steam-treated pellets for producing electricity in Ontario reported a higher production cost for steam-exploded pellets ((USD 10.2/GJ) compared to regular pellets (USD 9.9/GJ) [9]. A technoeconomic analysis (TEA) was conducted by Valdez [10] on the microwave torrefaction of oat hull; it showed that using microwave power contributed to 50% of pellet production cost. Additionally, microwave systems have high capital costs, and their profitability relies on other co-products, such as liquid smoke, in order to be commercialized. Another study by Shahrukh et al. [11] reported that the cost, from harvesting to the co-firing facility, was estimated between 95 and 105 USD/t for regular pellets (made from forest, agricultural waste and energy crops), while the cost for steam-exploded pellets were from 146 to 156 USD/t. For these two types of pellets, the economic optimum size was 190 and 250 kt/year, respectively. Yun et al. [12], in their comparative economic assessment of torrefied and regular pellets, showed that heat can be recovered from flue gas combustion, and production cost, therefore, can be reduced by 10%.
The development of products such as cellulosic ethanol, steam and power from biomass is the basis of a standard large-scale biorefinery scenario. In order to have competitive manufacturing costs, it is essential to produce a wide variety of products [13,14]. A study by Trømborg et al. [15] analyzing the profitability of combined heat and power systems in the Norway market revealed that in order for CHP investments to be profitable (2007 base prices), investment costs should be reduced by 50%, and on the other side, electricity prices must be increased by 100%. Furthermore, fuel expenses are the most crucial factor for improving the economics of cogeneration plants. The cost of producing electricity might be decreased by 40% when using straw pellets instead of wood pellets (assuming a pellet price of roughly 15 EUR/MWh) [16].
Hemicellulose-based chemicals could replace products made from oil in the chemical industry; for example, furan derivatives (e.g., furfural, hydroxy methyl furfural (HMF)) and acids (e.g., formic, levulinic and acetic acids) can be extracted from the liquors of pretreated lignocellulosic materials [2,17,18]. In order to compete with the petrochemical process, the large-scale manufacture of levulinic acid (LA) from biomass needs a low-cost feedstock such as wood wastes (wood chips, sawdust, and other residues) [19,20,21,22]. About 9% of the original raw material is turned into sawdust in sawmills; thus, its value addition could create new value chains for the global forest sector. A small-scale biorefinery with an annual capacity of 4.4 kt steam-treated pellets was designed by Clauser et al. [2], in which black liquor from the pretreated pine sawdust was collected and used for separation. The yields of the products were 747 kg of pellets, 57 kg of levulinic acid, 23 kg of formic acid (FA), 22 kg of furfural, and 18 kg of acetic acid per tonne of dry sawdust. Steam usage was reduced during levulinic acid production when the heat was integrated into the system [2]. The majority of biorefinery technologies are being developed at demonstration and pilot scales; therefore, data on commercial facilities are not accessible. Economic, technological, and environmental studies are all required for the design of these processes and systems. In a technoeconomic assessment, the process, along with an input–output model, is taken into account [2].
In order to assess the viability of a particular set of processing technology, the cost and availability of the feedstocks in the area, the existing and upcoming technologies that may be utilized to create the desired products, and their mass and energy balance models can all be used. This helps to estimate both capital and operational expenses. The plant’s capacity affects revenues and profitability. A credible indicator for an initial profitability calculation is the internal rate of return (IRR) [23]. Since investments with higher IRR are more profitable than others, the internal rate of return is an economic factor for choosing the most worthwhile project between two or more capital investment projects [8]. In order to define unit sizes and their operating conditions, as well as identify auto-thermal operating conditions, a technoeconomic analysis relies on process modeling and integration [12]. In studies that were reviewed, there was no TEA to compare possible bioenergy production scenarios from wood sawdust and analyze the best-case scenario in terms of costs and revenues. Thus, this study reports capital and operational expenditures as well as other economic analyses of bioenergy production from sawdust. This is in addition to the simulation of four scenarios of bioenergy production.
2. Methodology
An effective way to determine process feasibility at scales larger than laboratory, such as demo, pilot, and industrial scales, is process simulation by applying software-based tools [24,25,26]. SuperPro Designer V.10.0 (Intelligen, Cambridge, MA, USA) was used to analyze all the economic indices and create the flowsheets. The analytical cost models were developed to estimate the cost of producing pretreated wood pellets and the cost of producing electricity from wood sawdust and pellets. Direct fixed capital costs, operating expenses, and financial indices were measured. Taxes and profit margins have been included in the analysis.
Assumptions of this study are:
- (a)
- The location of the pretreatment plant and pellet mill, along with the CHP plant, is in Meadow Lake, SK, in the vicinity of the NorSask Forest Products sawmill and the MLTC Bioenergy Centre. Being an established bioenergy project, both private and public investor perspectives are taken into account in this analysis.
- (b)
- Operating hours: 7920 h/year (330 days of facility operation).
- (c)
- The plant size is 72 kt/year based on available sawdust and shavings from the NorSask Forest Products sawmill [27].
- (d)
- Sawdust, except for shavings, did not need a size reduction step before pretreatment; they are delivered to the pellet plant directly from the lumber processing company, which is located on-site; hence, there is no need for transportation over long distances.
- (e)
- The flowsheets of bioenergy routes are prepared based on continuous operations.
- (f)
- Before running mass and energy balance for each flowsheet in SuperPro Designer, every unit needs to be initiated at least once. Hence, depending on the unit operation and the process (batch/continuous), the defined parameters (e.g., thermodynamic properties, energy consumption, process efficiency, and yields) are inserted to condition each unit operation [28].
- (g)
- According to experimental data in published works [29,30], optimized conditions for the steam explosion are at a temperature of 215 °C, a residence time of 9 min, and a pressure of 1000 kPa; however, steam explosion-treated pellets at 180 °C (for 9 min) are the preferred conditions in our design due to less energy consumption. For torrefaction, the preferred thermal conditions are 230 °C and a residence time of 45 min.
- (h)
- The pellet plant and combined heat and power plant are integrated.
- (i)
- The chemical composition of mixed wood sawdust is as follows: cellulose: 46.5%, lignin: 23.2 %, hemicellulose: 13.3 %, water: 7.74%, and other solids: 8.9%.
- (j)
- This study excludes the feedstock price as it is already freely available at the bioenergy plant.
- (k)
- The operating plant capacity for each year is assumed to be 80% and 90% for the second and third years and 100% thereafter [31]. There is no operation for the first year.
After entering these data into SuperPro Designer, the results of the financial analysis were generated.
2.1. Cost Analysis
Two types of costs were included in the analysis, namely, total capital investment (TCI) and operational expenditure (OPEX). TCI is determined as the total of all fixed capital expenses, start-up costs, and working capital expenses. OPEX is the cost that a business pays each year to perform the production process and other supporting tasks [32]. The pellet production cost includes capital depreciation, employee salaries, utilities, and consumable costs, along with transportation costs [33]. In SuperPro Designer, annual operating costs are divided by the pellet production rate to yield the unit pellet production cost. It is worth noting that to achieve the optimal size of a bioenergy plant, the transportation cost of feedstock needs to be taken into account. However, in this study, it was assumed that the extra feedstock demands for increasing the plant size can be met by already available wood residue piles (2.9 Mt) and forest waste (700 kt, annually) in the north of the province of Saskatchewan [27,34].
The cost presented in this study is based on 2020 US dollars. According to the Bank of Canada, for the year 2020, the exchange rate for the Canadian dollar versus the US dollar is considered to be 1.34. The project life is assumed to be 20 years, and the construction period is 12 months. The depreciation period is 10 years, and the salvage value is 5% of the direct fixed capital cost (DFC). The revenue tax rate is 40% and the electricity price is 0.10 USD/kWh. The cost of water supply and wastewater treatment is expected to be 0.97 and 0.78 USD/m3 based on the rate in the Saskatchewan market [10]. The capital investment is provided via a loan for a period of 10 years, and its interest is 9%.
2.2. Net Present Value
The net present value (NPV) is defined as the total of the present value for the projected return on an investment, which is offset by its up-front expenses. It is used to ascertain initiatives or projects that will produce the greatest return throughout the relevant time frame. Additionally, it is used for checking if a business choice will last for a defined amount of time by fulfilling its objective benchmark and demonstrating more viability in competition with alternatives. In order to determine the NPV, the business’ cumulative profits over the course of a specified number of years are discounted using a marginal rate of return [35]. The NPV is calculated based on Equation (1):
where β is the initial investment and T is the project lifetime (in years). ∅j is the cash flow in each year (j). The discount rate or cost of capital is shown by R in the above equation.
2.3. Internal Rate of Return
The internal rate of return (IRR) is a measure that is widely employed in financial budgeting and used for assessing the profitability of possible investments. Discounting all of the cashbacks results in the NPV for the specified time frame of the company becoming zero. It is estimated using Equation (2):
where IRR is the discount rate that balances discounted cash flows and costs. If a project creates a larger IRR than the others, it is more attractive to venture into. Even while various forms of company investments occasionally provide identical IRR, this measure may be used to rate a variety of possible initiatives that a business might choose as its best option(s) [32].
2.4. Payback Time
The payback time (PBT) is the time (in years) it takes for the capital invested in an asset to be repaid by the net cash flow it produces [35]. A shorter PBT is preferable since it offers the investor a clear idea of the time that the initial outlay will be at risk. PBT corresponds to the number of years it takes for a project to pay back its original investment (δ) through earnings after interest and tax (μ). The equation for estimating PBT, which was developed by Kong et al. [36], is presented below:
2.5. Scenario Analysis
There are four case scenarios defined in this study as potential bioenergy initiatives: (1) as the base case scenario, the cogeneration of heat and electricity from wood sawdust in a CHP plant; (2) wood pellet production from raw sawdust in a pellet mill; (3) integrated steam-treated pellet mill in a cogeneration plant that produces several products (pellets, furfural, HMF) and utilities (heat and electricity); and (4) integrated torrefied pellet mill in a cogeneration plant that produces several products (pellets, furfural, acetic acid) and utilities (heat and electricity). These scenarios were first well defined in terms of technical considerations such as selected unit operations, procedures, and their mechanisms; then, the costs (TCI and OPEX), profitability, PBT, IRR, and NPV were determined based on the software estimated prices as well as local and international market prices. Finally, the best-case scenario in terms of profitability and other economic indices was selected as the preferable bioenergy project.
3. Results and Discussion
The results of technical drawings (flowsheets) and economic analysis for various scenarios are comprehensively presented in this section.
3.1. Technical Results of Scenarios Simulation
3.1.1. Scenario 1: Direct CHP Generation from Wood Sawdust and Shavings
The bioenergy plant is strategically located on-site to ensure proximity and constant feedstock availability. The plant is designed to use 72 kt of wood sawdust per year, equalling 100% of the sawdust generated on-site. The process starts with the grinding of wood shavings (P-8/GR-1) until their size is identical to sawdust. Subsequently, the two substrates are mixed together (P-7/MX-102) (see Figure S1). Then, utilizing a pneumatic conveyor, sawdust is introduced to a heat exchanger that has a shell line (hot), and hence, feedstock temperature increases before entering the burner. The maximized efficient design for producing high-temperature steam can generate a higher electricity rate and steam (high and low pressure), which is comparable with similar CHP designs. As a result of closing the loop, almost zero water effluent is generated, and there is no need for water treatment. While flue gas had a turnback via the system (heat exchanger), the resultant particles would undergo electrostatic precipitation to separate dry ash from particles and precipitate some amount of CO2 before its release to the environment.
The CHP system is specified to cover the basic load. A CHP unit is installed and used for producing heat and electricity. This CHP unit sets a limit of running times of more than 7920 h/year. The power class of this generating system is usually around 1161 kW of electrical power. The CHP generator, which transforms thermal energy (coming from the boiler) into mechanical energy, is used to generate electricity from biomass. The steam turbine, according to the software simulation, can reach an efficiency of 90% for electricity generation by its shaft power, which is highly productive. The remaining energy will be exhausted as heat. The producible electricity energy is 1161 kWh. The generated heat (in the form of high- and low-pressure steam) is 19.17 MWh.
Compared to fossil fuels, biomass is substantially less expensive. However, in comparison with conventional boilers, the expenditure required to achieve clean biomass combustion is more considerable. Electricity-generating costs for small, decentralized units are not reasonable; hence, a CHP plant is essential to maintain investment profitability. Therefore, biomass CHP facilities are often driven by the heat demand instead of the power demand in order to attain high energy conversion efficiency [37]. According to Quoilin et al. [38], there is a threshold for the cogeneration of heat and electricity at CHP plants; they can only generate 6–10 MW of heat, along with 1–2 MW of electricity. This is due to the relative difficulty of distributing heat over long distances. Traditional steam cycles are not included since they are not economical at this power level [38].
An electrostatic precipitator is a particle-control system that sends particles from the moving gas stream to collection plates using electrical forces. The particles become electrically charged by making them go through an area called the corona, where gaseous ions circulate. Electrodes kept at high voltage in the flow lane’s center create the electrical field that pushes the charged particles against the walls. After the particles have accumulated on the plates, they must be cleared off the plates without being re-entrapped in the gas stream. The typical method for doing this is to knock them free from the plates, which then allows the gathered layer of particles to flow down into a hopper, where they are expelled. Alternatively, some precipitators wash the particles with water to eliminate them [39].
3.1.2. Scenario 2: Wood Pellet Production without CHP
Scenario 2 is designed to produce only wood pellets without CHP. Wood pellets are produced from ground shavings and sawdust (see Figure S2). The loop is closed; hence, the remaining pellets crumble, and fines after screening return to the pellet mill before cooling. The process design is simple as the number and units of equipment are small and easy to comprehend. The last step is conveying pellets to the storage silo.
Heat exchangers play an important part in the avoidance of pollution and the decrease in the environmental effect of industrial operations by lowering energy usage or recovering energy from operations they are utilized in [40]. Their uses are: (1) in systems that reduce contaminants in industrial effluents, the quantity of the release, and thermal pollution; (2) in pollution control or prevention measures that lower emissions of volatile organic compounds (VOCs) and other air pollutants; and (3) utilization in sites that burn municipal solid wastes and some industrial toxic waste to recover energy. In many additional processes connected to pollution prevention or control, heat exchangers are also utilized in the cooling, heating, and concentrating of process streams. In this design, a heat exchanger is used for cooling pellets.
3.1.3. Scenario 3: Production of Pellets and CHP from Steam-Exploded Wood
One of the best pretreatment methods for removing hemicelluloses from lignocellulosic materials is steam explosion [41]; under the right circumstances, steam explosion enables the removal of the hemicellulosic fraction from sawdust with a low decomposition rate [42]. Some of the by-products of the steam explosion pretreatment in a biorefinery plant are levulinic acid, formic acid, furfural, and HMF. FA, LA, and furfural are projected to have a combined annual growth rate (CAGR) of 4.9%, 5.7%, and 11.6%, respectively, in the global market [2,43]. Acetyl furane, furoic acid, furfuryl alcohol, methyl furane, tetrahydro furfuryl alcohol, and tetrahydrofuran (THF) are all derivatives of furfural, which can be used to make adhesive polymers and lubricants.
Scenario 3 is designed to include the production of steam-explosion-treated wood pellets as the main process line as well as heat and electricity generation from a portion (25%) of the produced wood pellets. The production of steam-treated pellets is designed using a red line (pellets as the final product) and a black line for producing heat and electricity along with other by-products (see Figure S3). The ratio of steam-treated pellets at flow splitting is preferred at 75% since, after the technoeconomic assessment, this was more favorable in terms of revenue and ROI. Some of the unit operations are similar to the above-mentioned scenarios; thus, they are skipped here. For the pretreatment step, generated steam via the process is injected into a plug flow reactor (PFR) to submerge the feedstock (wood particles). Inside the PFR, the pressure increases to 1000 kPa (equivalent to 180 °C) for a duration of 9 min. Utilizing the flash unit, the evaporated water and water-soluble components are separated and returned to the system. In a flash drum at a specific temperature and pressure, a liquid stream with many components partly vaporizes. Two phases are created as a result: a liquid phase that is enriched in the less volatile compounds and a vapor phase that is concentrated with more volatile compounds. A regulating nozzle directs the heated and pressured fluid into the flash drum. A proportion of the fluid vaporizes as a result of the considerable pressure reduction. The liquid sinks to the bottom of the drum, where it is collected, while the vapor is removed from above. Due to the system’s fast vaporization after introducing the feed into the drum, it is called “flash” distillation. The mixture in the flash drum is extremely near to equilibrium since the liquid and vapor are in close contact with one another [44]. Next, via component splitting (such as distillatory equipment), furfural and hydroxy methyl furfural are acquired as by-products of the steam explosion pretreatment; they have commercial value and can be sold on the market. The other steps include conditioning with water (10% wt), pelletizing, and using a 25% ratio of pellets for electricity and heat production.
In order to become environmentally and economically viable, numerous studies have shown that these small-scale biorefineries must always valorize all existing effluents (waste waters, waste solids, gas emissions, etc.) to create added-value products and decrease the consumption of external energy resources [24,45,46,47]. The economic benefits obtained by utilizing effluents produced inside a biorefinery plant are a decrease in extra expenses in waste treatment equipment costs, obtaining highly energy efficient returns from the collection and reuse of raw materials, decreased operating cost, and reduced logistical expenses by adopting a small-scale biorefinery concept [48]. In the study reported by Shahrukh et al. [49], it was observed from the findings of steam pretreatment simulations that the drying process utilizes a huge amount of natural gas, which considerably raises the energy demand. However, in our design, we used a flash evaporator instead of a dryer to remove water and other volatiles. Additionally, in this study, the scenario designs are based on minimizing effluents and waste streams (water, ash, and other wastes), closing the loops, decreasing gas leakage to the environment and its treatment before release, utilizing high-pressure steam to decrease utility needs, using a heat exchanger to recover waste heat energy, and, finally, reusing electricity for fulfilling plant needs before sending it to the grids.
3.1.4. Scenario 4: Production of Pellets and CHP from Torrefied Wood
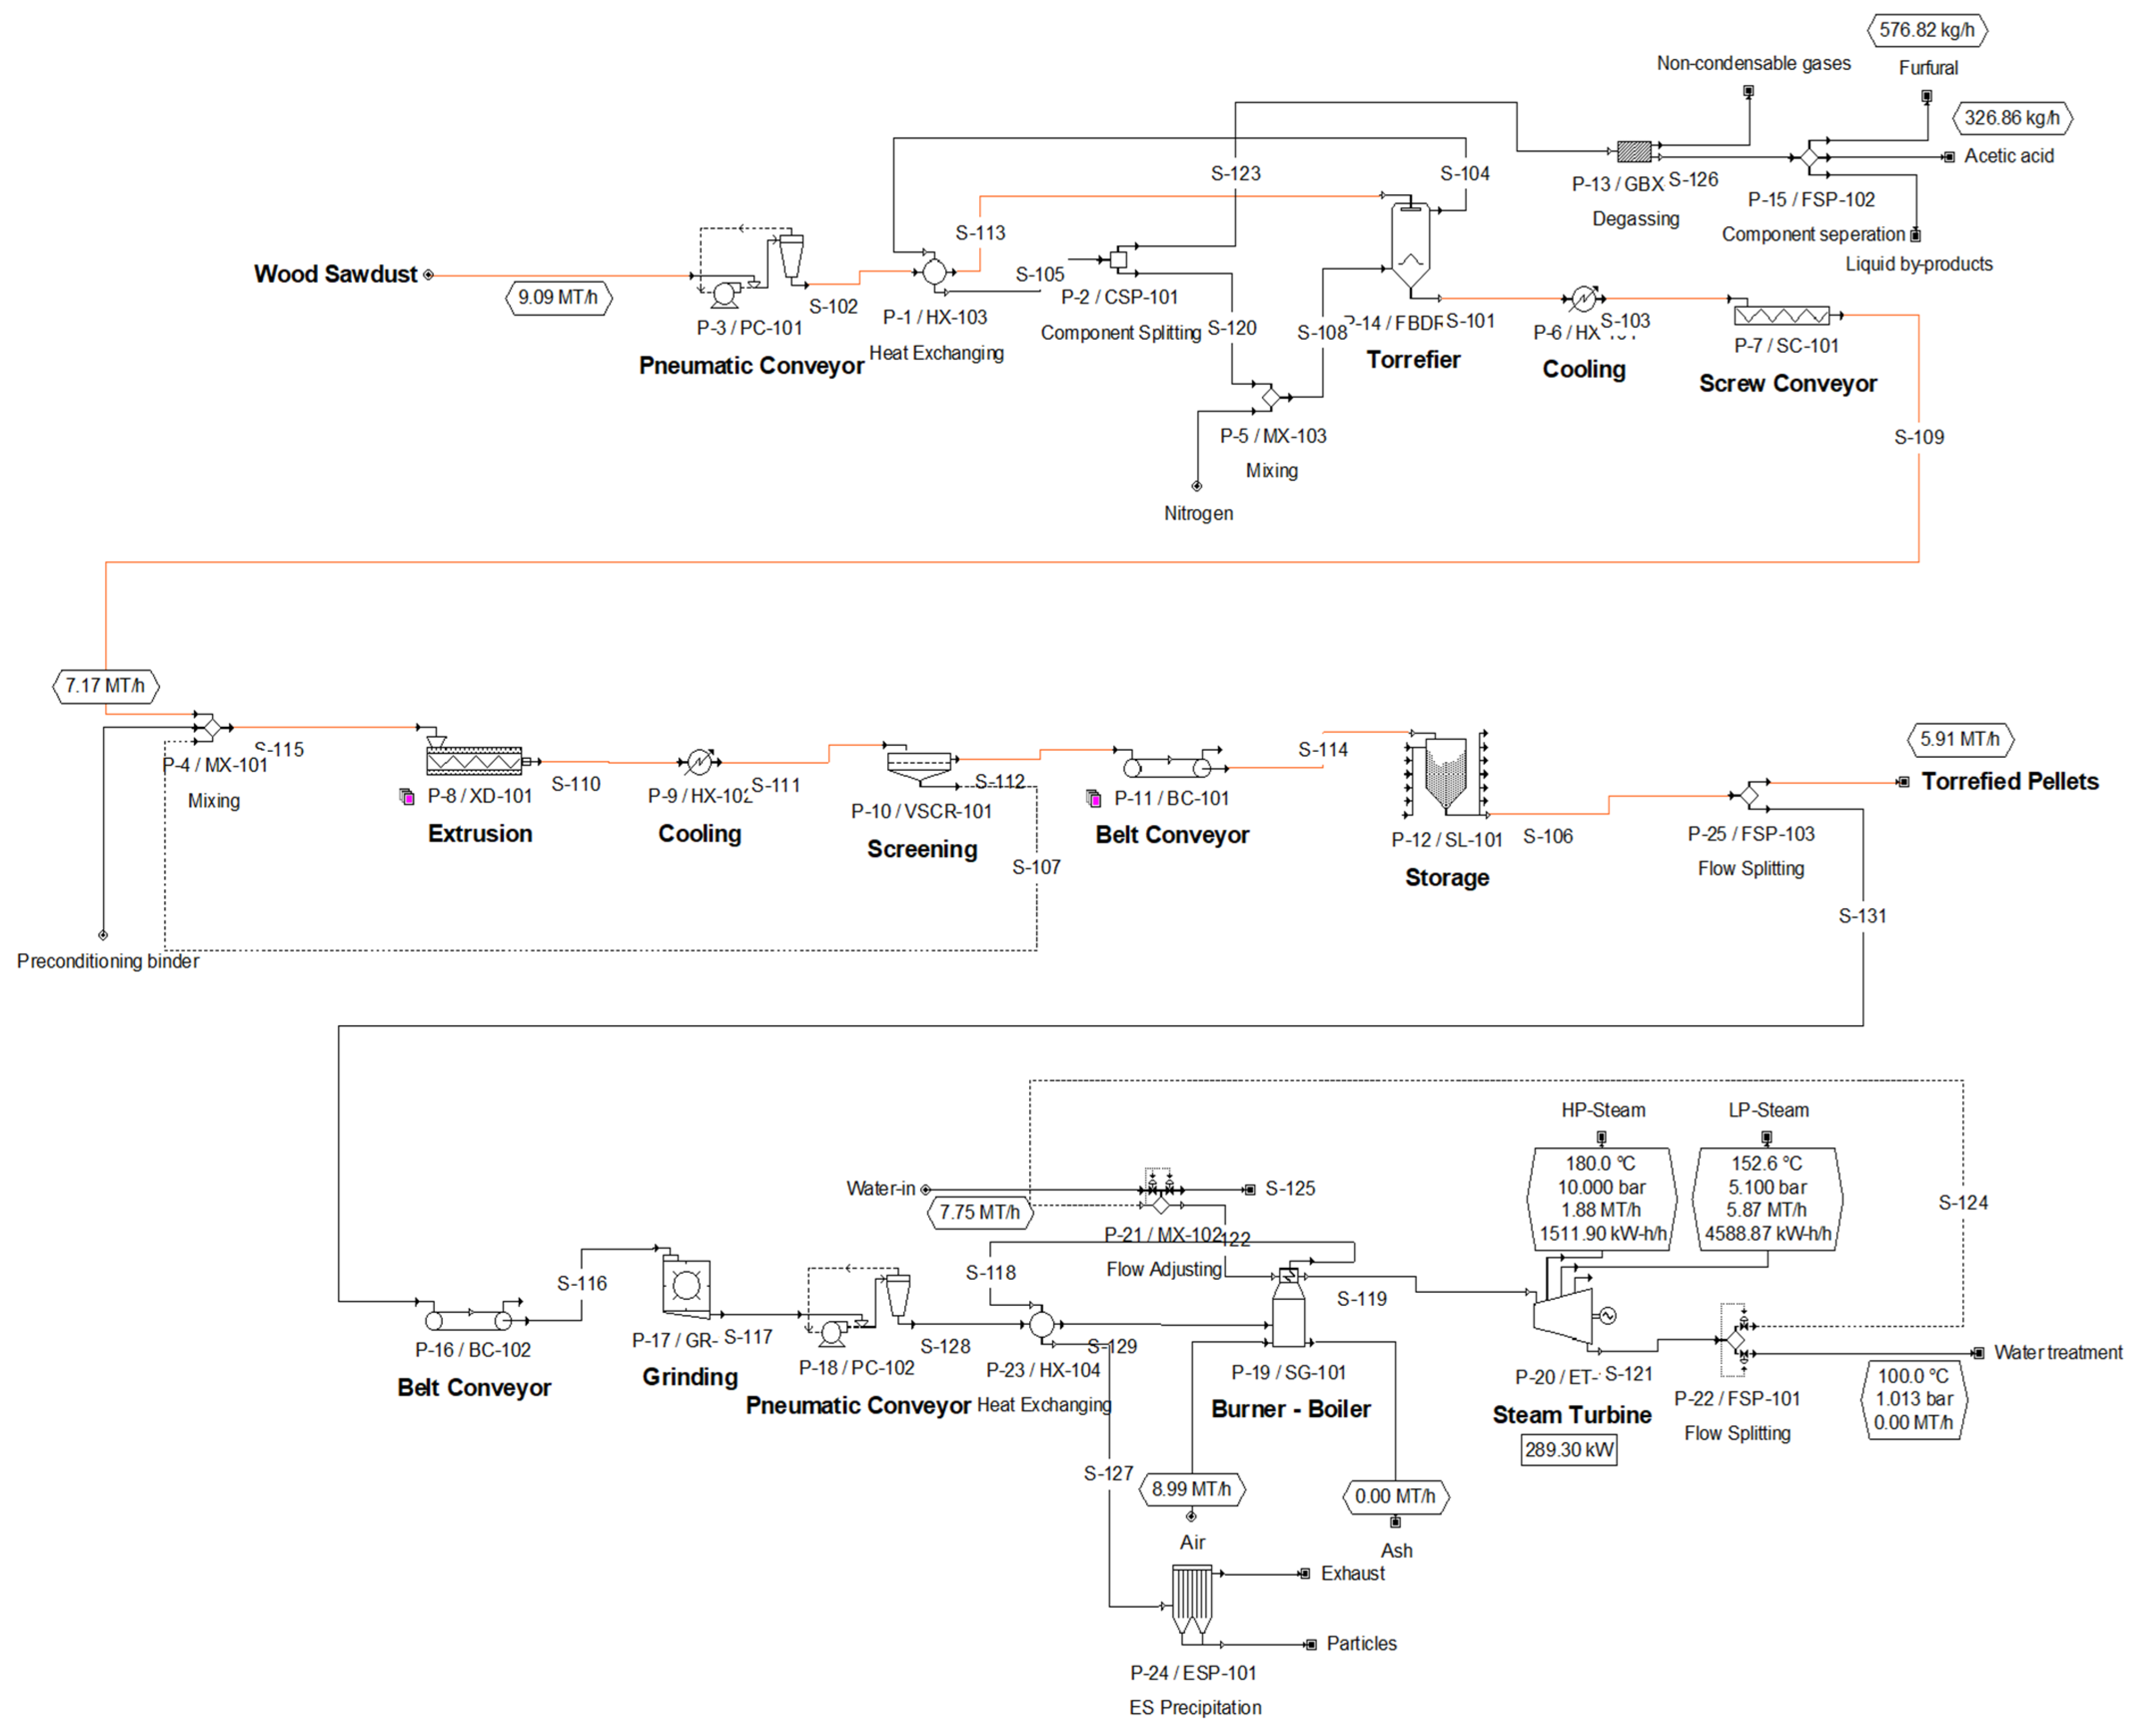
Compared to Scenario 3, the torrefied wood pellet is the main product in Scenario 4, along with the heat and electricity produced from the pellets. The primary design factors for the thermal systems include torrefaction temperature, feedstock weight loss, the flue gas recycling ratio, and process parameters or conditions. The organizations that design torrefaction technologies have a great deal of experience in biomass processing technologies, such as drying and carbonization [50]. The majority of the developed reactors are well-known and proven technologies that industries have been improving for torrefaction applications. Currently, there is not one torrefaction method that is uniformly better than the others because each one has benefits and drawbacks [51,52,53,54]. Beekes and Cremers [53] explored various torrefaction technologies for preprocessing biomass before its co-firing with coal. Kleinschmidt [52] and Melin [54] similarly addressed the challenges associated with the up-scaling and optimization of torrefaction technologies for woody biomass and agricultural residues. In another study, Chew and Doshi [51] emphasized the complexity of the lignocellulosic material, and its role in defining the parameters for the torrefaction process was specified; additionally, the commercialization of torrefiers such as moving bed, fixed bed, and fluidized bed reactors was discussed. A sensible selection of the reactor is crucial as each reactor has distinct qualities and is ideally adapted to handle particular types of biomass [55,56]. A fluidized bed reactor has been chosen because it has good heat transfer and is a scalable technology; it is also most suitable for fine particles of sawdust. Its disadvantages are slow temperature response, excessive biomass attrition, loss of fines, and separation of bed solids and biomass [50]. The torrefaction process as a pretreatment method for increasing calorific value, along with many useful applications, is demonstrated in Figure 1. Apart from similar operations to the previous diagrams, this one illustrates a fluidized bed torrefier (specialized for fine particles of wood sawdust) and degasser for separating gases, such as nitrogen, following the components splitting. The non-condensable gases are still released into the environment in a very low proportion (<5%). The valuable components, which are separated via a distillatory, include acetic acid, furfural, and others. The other units are quite similar to Scenario 3, except for torrefied pellets, which are produced as the main product of the current process. The red lines in the flowsheet are indicators for the main product stream. In a biorefinery platform, apart from torrefied pellets (biofuel) as the main product, some by-products, such as furfural and acetic acid, among others, can be separated and sold on the market. In Figure 1, four heat exchangers are employed: one for exchanging heat from the flue gas coming from the fluidized bed torrefier and the second one for entrapping heat from the boiler gas output. The other two are installed for cooling purposes. Two major obstacles, which may be avoided by converting all biomass into biofuels, are market dependency and extra effluents (in the form of liquids, gases, or solids) that need to be treated. The first one fluctuates exceedingly and has a declining pattern towards the price of biofuels; the second one has extra detrimental environmental effects and greater TCI and OPEX for waste processing. For addressing these downsides, it is crucial to valorize all biomass components to decrease the discharge streams and also undertake mass and heat integration [48].
The best way to deal with issues related to wood waste is to use wood fuel to produce energy. Nevertheless, burning results in a reduction in the mass and volume of the wood waste, but it also produces wood ash or sawdust ash, a major waste product. Approximately 3 million tonnes of wood ash are generated annually in the USA alone [57]. Typically, the wood industry has its boiler that burns the produced wood waste as fuel to provide heat for other operations, such as drying the final products. Sawdust ash has been investigated as a potential cement substitute in a concrete mixture. Results show that sawdust ash may be successfully utilized as a cement substitute material in concrete with sufficient strength and durability [58]. In our study, one suggestion is to use the ash (coming from the boiler) as a soil amendment because it is rich in nutrients (such as potassium and calcium).
3.2. Capital Cost
Table 1 and Table 2 list the purchase costs of major equipment for various case scenarios. Scenarios 1 and 2 are the most economical in terms of total equipment costs compared to Scenarios 3 and 4, which use more pieces of machinery in their process design. The most expensive piece of equipment in Scenario 1 is the electrostatic precipitator (USD 801,000) and the cheapest one is the heat exchanger (USD 58,000); in comparison, these costs for Scenario 2 correspond to the pelletizer and heat exchanger (cooler) (USD 249,000 and USD 21,000, respectively). Unlisted equipment given in Table 1 include flow splitter, pumps, mixers, and other secondary units, which may not be shown in the flowsheets (Figures S1 and S2) [59]. The total cost of equipment for producing 72 kt of wood pellets per year is $1.7 M, which is comparable with the findings of Wolbers [60], who estimated USD 1.5 M for the equipment costs with a production capacity of 87 kt of wood pellets in 2018.
According to Table 2, the cost of purchasing equipment for producing steam-exploded pellets and electricity (Case 3) and for producing torrefied pellets and electricity (Case 4) are almost in the same range (USD 3.3 and 3.6 M, respectively); in addition, the production capacities for these scenarios are 53 kt steam-exploded pellets and 46 kt torrefied wood pellets, respectively. In Wolbers’ study [60], the total equipment costs for producing 84 kt steam-exploded pellets per year was estimated at around USD 2.3 M. Mobini Dehkordi [61] reported that an investment of USD 19.5 M was required for torrefaction equipment with a 137 kt annual capacity of torrefied wood pellets.
Table S1 lists the total capital investment for the four bioenergy cases in this study. TCI for producing electricity from sawdust (Scenario 1) was around USD 14.5 M, which was higher than the capital cost (USD 10.5 M) for producing wood pellets from untreated sawdust. Peng [62] projected a TCI of USD 9.1 M for a capacity of 80 kt of wood pellets per year. Incorporating CHP into pellet production, along with pretreatment equipment, caused a double increase in DFC. For example, capital investment for a plant integrating CHP and torrefied wood pellets were around USD 22.5 M. Yun et al. [12] reported a capital investment of USD 12.2 M for producing 80 kt of torrefied wood pellets per year in British Colombia. In another economic analysis study, Peng [62] estimated a TCI of USD 32.16 M for a plant with a capacity of 138 kt of torrefied wood pellet production. In this study, a TCI of USD 20.8 M for a plant that includes CHP and steam-exploded wood pellets is estimated.
3.3. Operating Cost
For each case scenario, the operating expenditures are estimated and charted (see Figure S4). Annual plant operating costs include raw materials, labor-dependent and facility-dependent costs, laboratory, utilities, and waste treatment. The major contributor to the OPEX in all scenarios is facility-dependent cost (56–61%). This matched the findings of Valdez [10], who conducted an economic analysis of pellet production from untreated and torrefied oat hull. Facility-dependent costs include depreciation, maintenance, and miscellaneous costs [10]. After facility expenses, the labor cost is the second major contributor to the OPEX of Scenarios 1, 3, and 4 (20%, 29%, and 29%, respectively). However, the second biggest expense for pellet production from sawdust (Scenario 2) is the cost of utilities (22%). The utilities for the second scenario include power, chilled water, and hot water.
3.4. Profitability Analysis
Most of the case scenarios produce multiple products, but only one is considered to be the main product. For example, in Scenario 1, low-pressure steam with a production rate of 146 kt/year is considered the main product, whereas high-pressure steam is considered a co-product. The yearly production rate for different products in Scenarios 1–4 is listed in Table 3. Maximum pellet capacity is achieved in Scenario 2 with 72 kt of wood pellets, which is equal to the original feedstock (zero waste). As a result of pretreatment (steam explosion and torrefaction), some material loss in the forms of liquid and gas occurs, which can mostly be separated into co-products such as furfural, HMF, and acetic acid. This justifies the lower capacity for steam-exploded and torrefied pellets compared to regular pellets. The maximum electricity production is in Case 1, which is around 4,896,453 kWh/year. The electricity selling price is assumed to be the same as its cost (0.1 USD/kWh). High- and low-pressure steams are other sources of revenue, and their price is assumed to be 20 and 12 USD/tonne, respectively.
The cost of producing regular wood pellets in Scenario 2 is estimated at 44.33 USD/tonne, while Shahrukh et al. [11], in their study, reported that this cost for producing pellets originating from forest residue was around 91.35 USD/tonne. Additionally, Yun et al. [12] determined 70 USD/tonne for wood pellet production cost in the province of British Colombia. The selling price for regular wood pellets was set at 120 USD/tonne according to the projected value for biofuel pellets in the Canadian market [12].
Due to the capital expenses associated with boilers and steam pretreatment facilities, steam explosion dramatically raises the cost of producing pellets [11]. In this study, the cost of steam-treated pellets is determined to be 131.61 USD/tonne. In contrast, in Shahrukh and co-workers’ study, the cost of pellet production with steam pretreatment was around 144.2 USD/tonne. Based on the literature and flexibility of the market in Canada, a selling price of 144 USD/tonne for steam-exploded pellets was assumed [11]. The margin between expenses and revenue from the steam-treated pellets (as the main product for Case 3) is very thin and needs to be justified by selling other by-products, such as furfural and HMF. In this study, following the analysis of the market, furfural is priced at 800 USD/tonne (average international price), while HMF, as another source of revenue, is priced at 1000 USD/tonne. The total yearly revenue, considering savings and credits for Scenario 3, is USD 9.17 M, which covers the yearly expenses (operating cost) of USD 7.05 M and results in a 25% gross margin (see Table 4). This study assumes a selling price of 140 USD/tonne (average selling price in Canada) for torrefied wood pellets in Scenario 4 [12]. Although the cost to produce torrefied pellets is high (149.03 USD/tonne), it cannot be sold higher than the upper limit of the market; hence, the valorization of added-value products such as acetic acid and furfural is critical to making the bioenergy process economically feasible. In this study, based on local and international market values, acetic acid and furfural are priced at 1200 and 800 USD/tonne, respectively.
To determine whether each bioenergy process is economically feasible, a profitability analysis was carried out. The summary of these analyses and comparison between case scenarios is presented in Table 4.
As a result of a comparison between different scenarios, from the prospect of revenues, Case 4 is the most profitable bioenergy process for yielding multiple products (total revenue: USD 14 M). On the other hand, Cases 2 and 3 are economically feasible too, but in terms of a simplified process, Scenario 2 is prioritized, and the payback time for such a project is even less than Case 4 (around 2.5 years). Additionally, Scenario 2 has higher ROI and IRR relative to Scenario 4. Finally, Case 1—which is not profitable in terms of output—can only be justifiable if environmental indices improve during the process and government subsidies are employed to make it happen. One of the most useful economic indices is the NPV, which is more emphasized than the other indicators in this study. Higher NPVs correspond to greater economic profits. Apart from Scenario 1, which has a negative NPV, the NPVs of Scenarios 4, 2, and 3 are estimated at USD 38.2, 30.9, and 9.1 M, respectively. Therefore, based on NPVs, Scenario 4 is the most promising in terms of technoeconomic assessment, yet it needs to be environmentally analyzed for being undertaken as the top bioenergy process. The detailed profitability analyses are shown in the supplementary materials (Tables S2, S4, S6, and S8). Additionally, the cash flow values are presented in the supplementary materials (Tables S3, S5, S7, and S9). According to the cash flow analysis, the capital investment is paid off after year 4 for all case scenarios except Case 2, which is compensated after year 3.
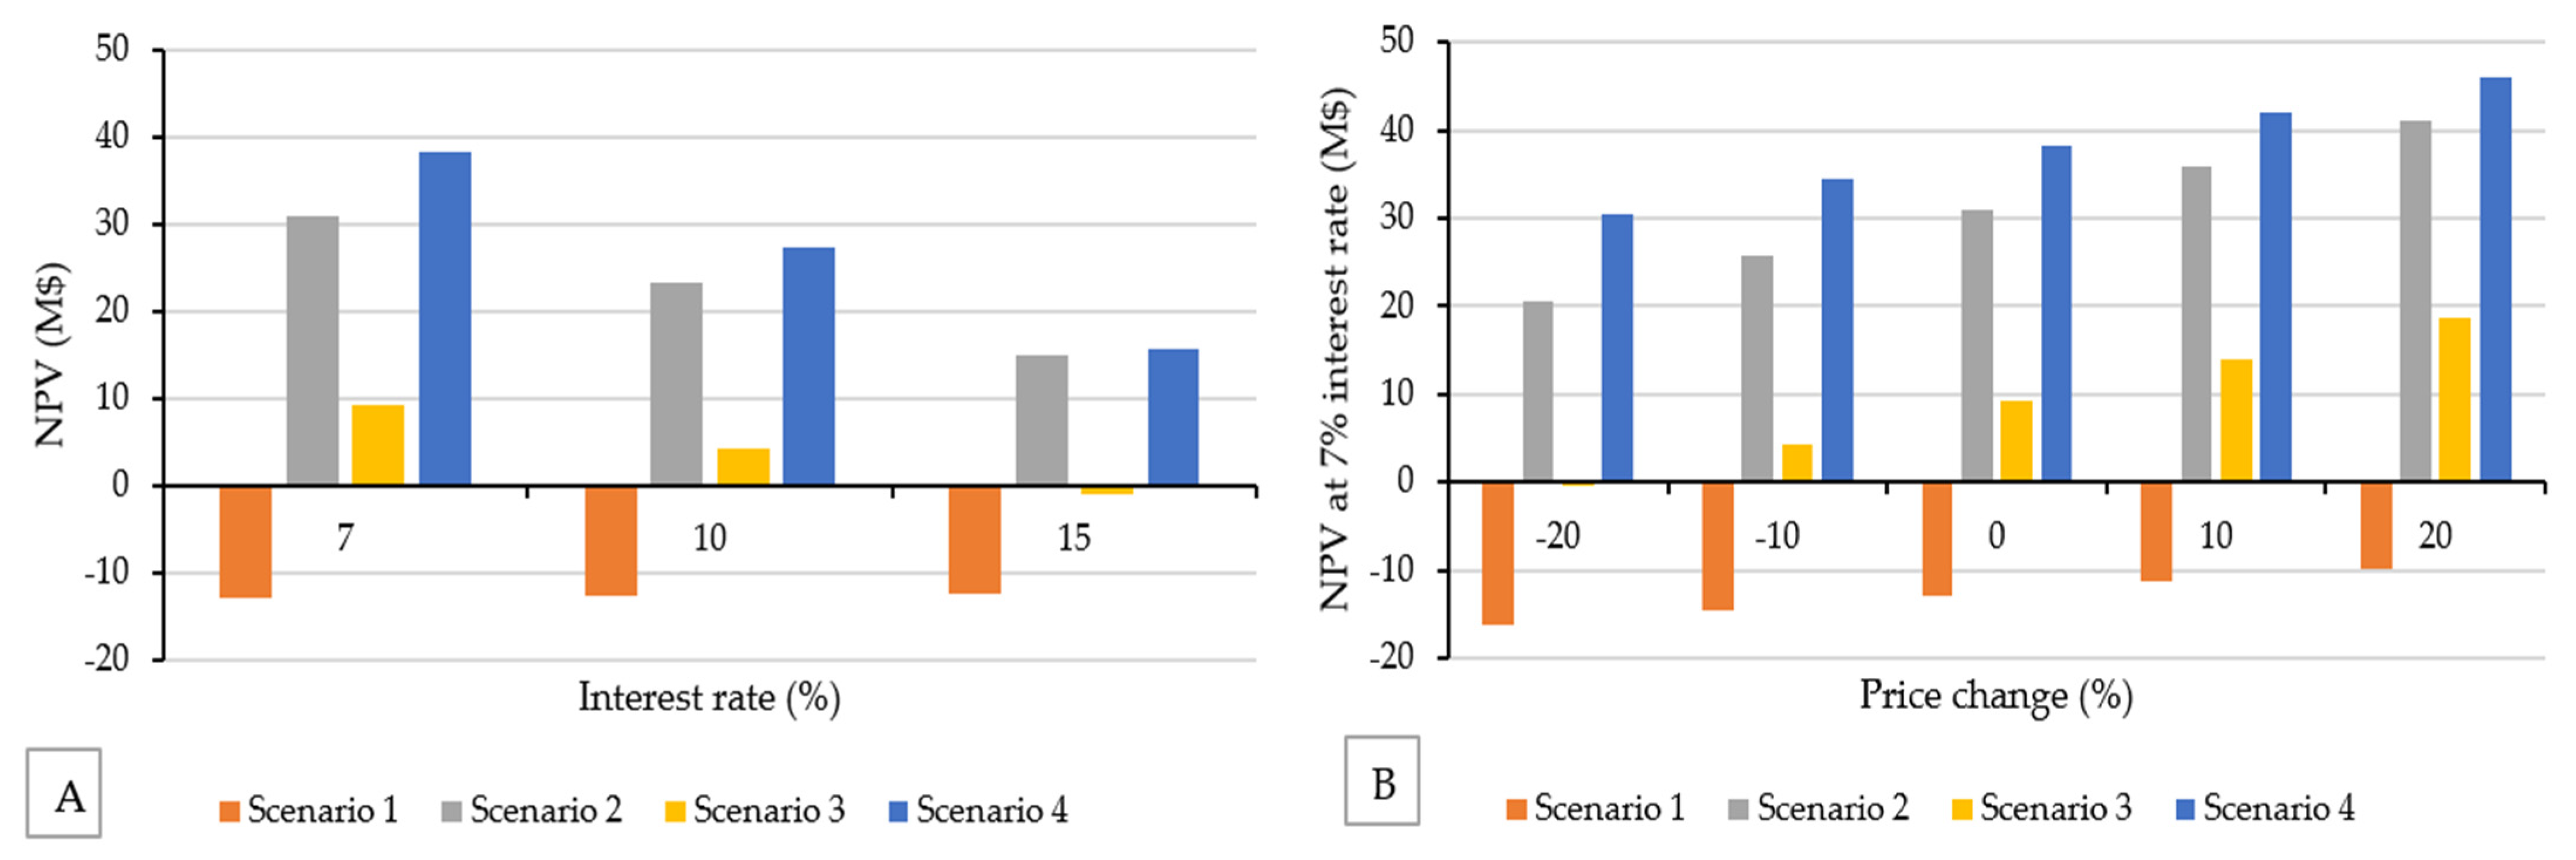
Net present value can be a function of various factors (e.g., interest rates or prices of products). The main products of various scenarios are listed in Table 4. For each case scenario, the NPVs at different interest rates (7%, 10%, and 15%) are displayed in Figure 2A. The results show that with increasing interest (discount) rates, the NPV decreases in most cases. For instance, by raising the interest rate to 15% for Scenario 3, the NPV becomes negative (USD −1.08 M). However, Scenario 1 consistently generates a negative NPV regardless of the change in the interest rate. This is evident from Figure 2B as well; even with an increase of 20% in the price of the main product (low-pressure steam), the feasibility of Scenario 1 does not improve. Furthermore, a huge difference amongst the NPVs in each scenario is observed at all interest rates. However, this difference becomes narrower at higher interest rates (e.g., 15%). Dropping the price of steam-treated pellets by −20% causes a huge reduction in the profitability of Scenario 3, in that its NPV is no longer positive (Figure 2B).
3.5. Plant Optimal Size
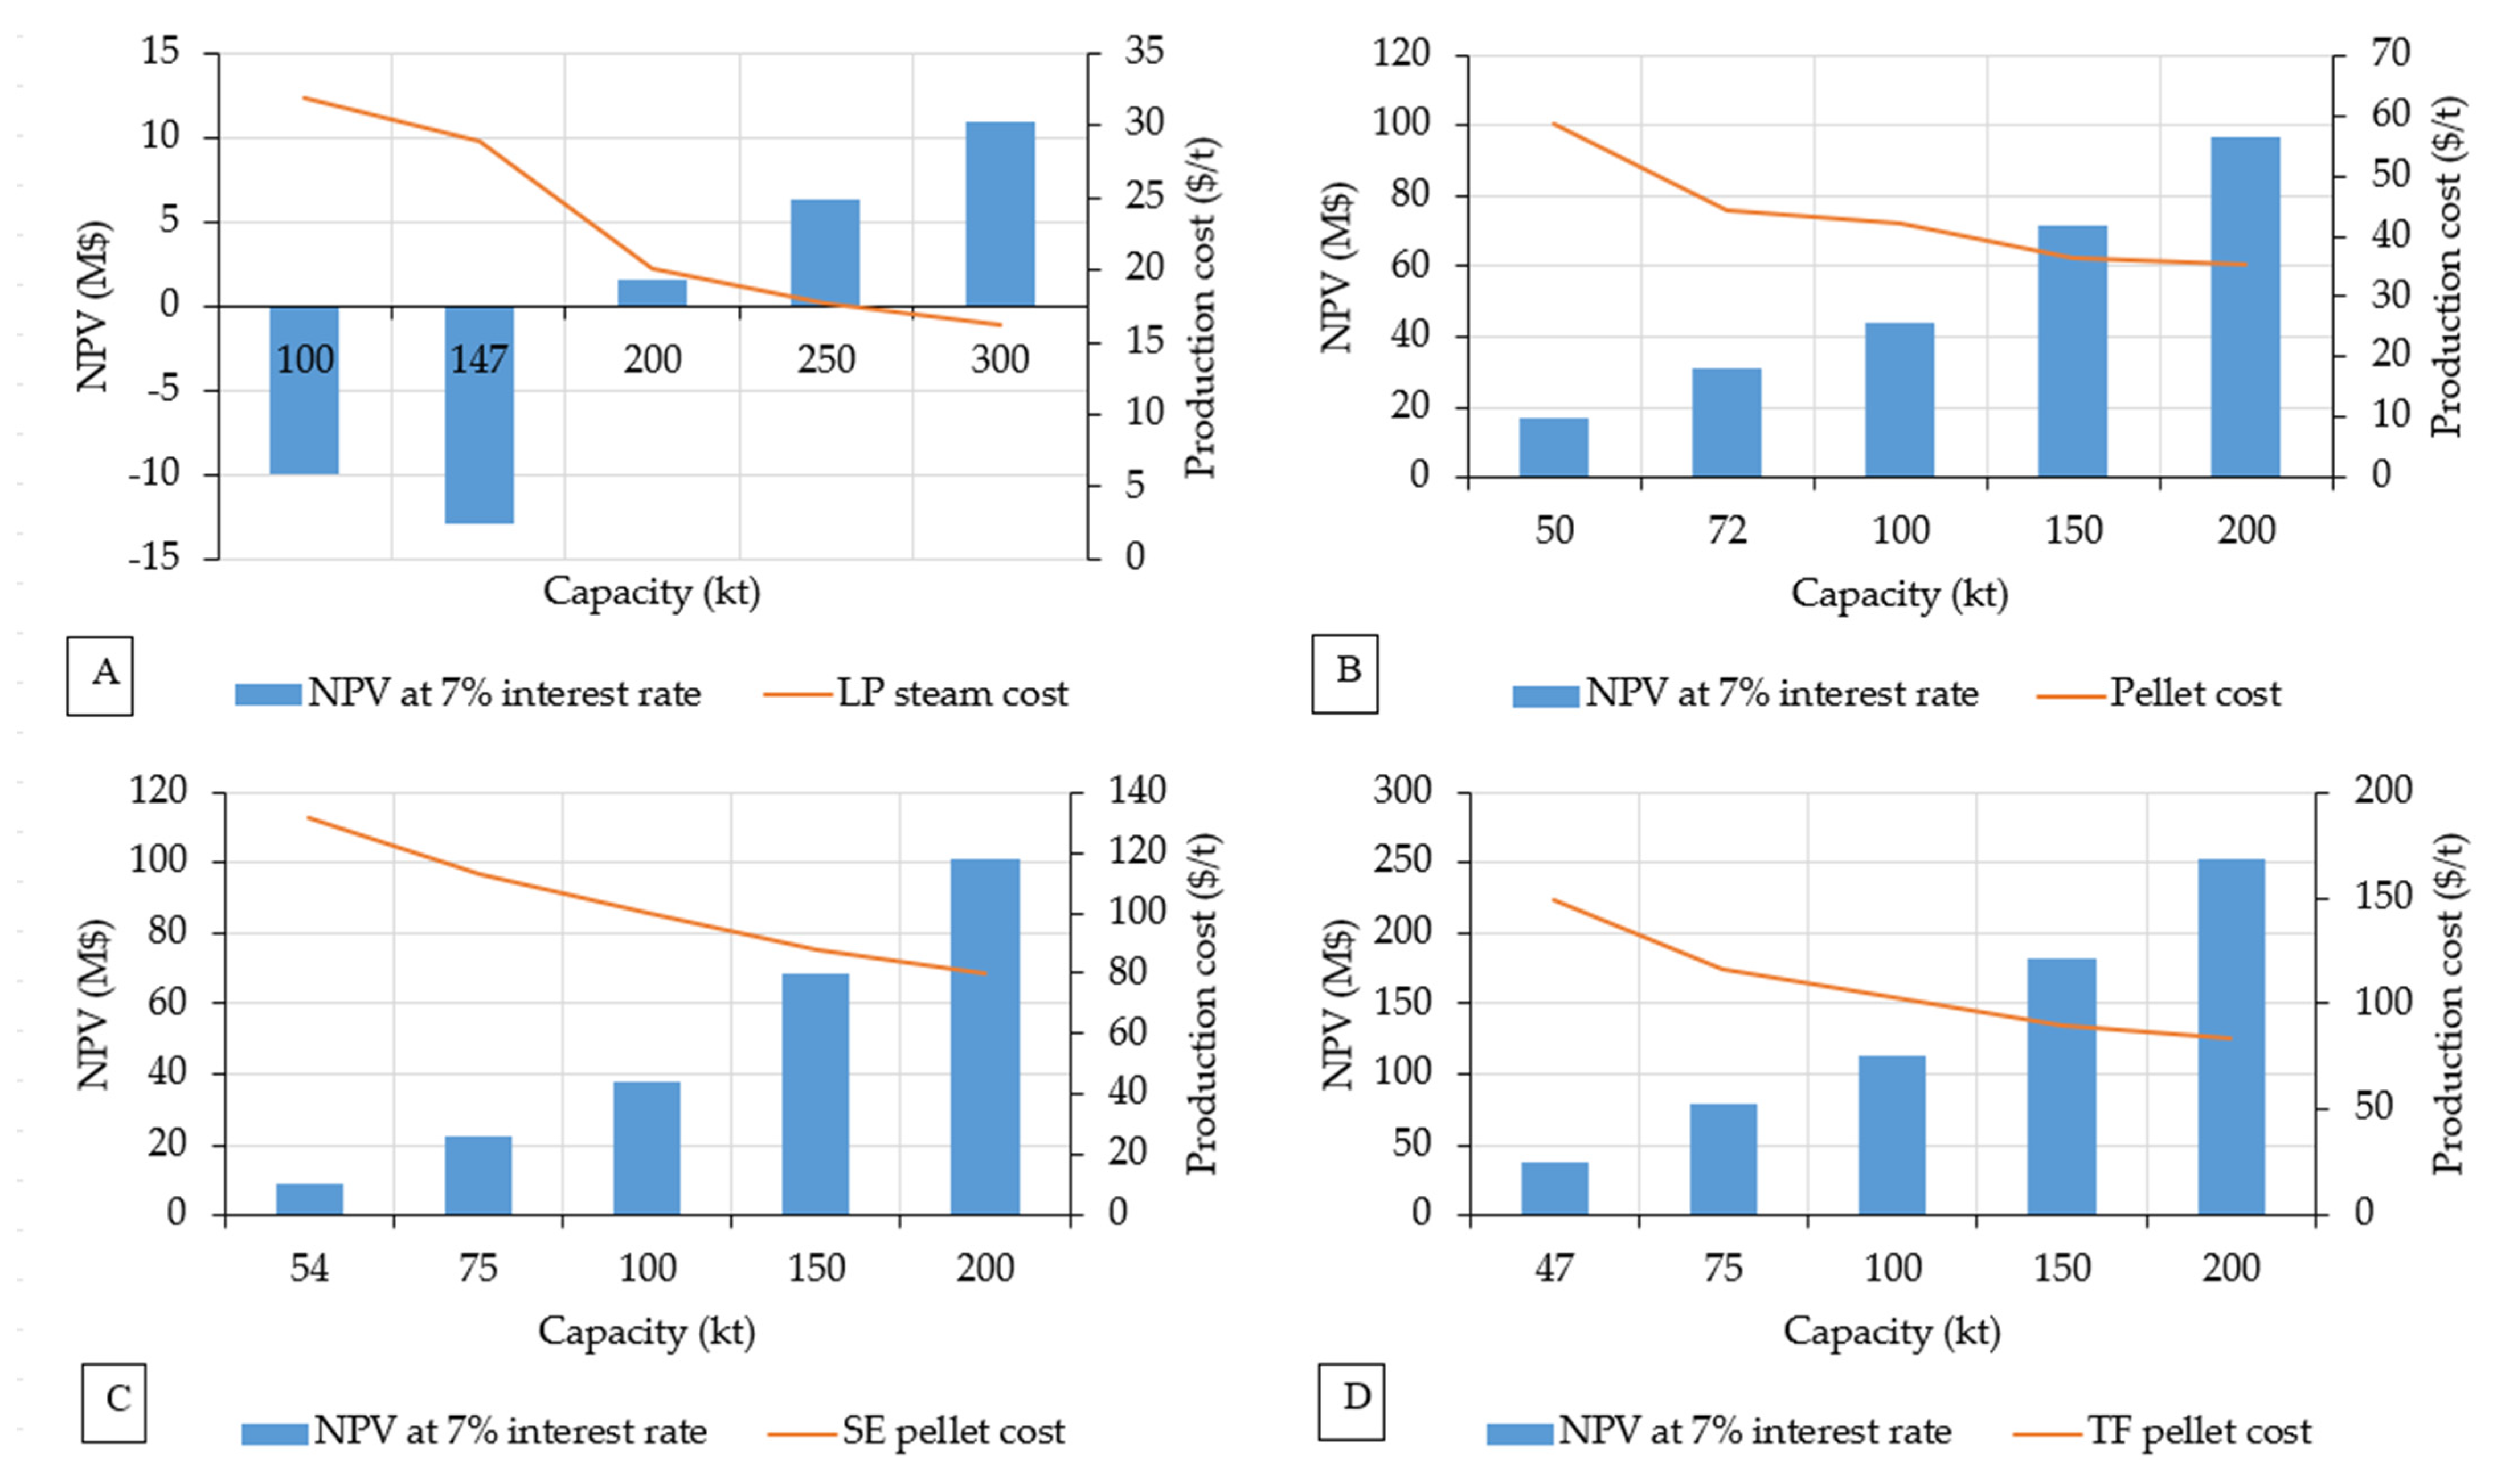
The optimal size for a pellet plant is the capacity at which the unit production cost is the lowest [11]. After broadening the above statement to include the CHP plant, according to Figure 3A (Scenario 1), the minimum unit cost (15 USD/tonne low-pressure steam) occurs at the highest capacity (300 kt/year). Additionally, the largest NPV results from the highest production capacity as well. The production cost is a function of transportation, operating, and capital costs per unit production rate. In this study, the cost of transportation is not considered as the woody biomass is already available in the area; hence, the capacity of the plant can be increased up to a point where the capital cost per unit is at the lowest. However, beyond this point, the economy of scale is not cost-effective [11]. Since the unit production cost flattens after 250 kt HP steam, a capacity between 250 to 300 kt is considered the optimum size for the CHP plant in Case 1.
The optimal size and economies of scale are constrained by the pellet plant’s maximum capacity [63]. The largest single-unit pellet mill described in the literature has a capacity of 50 kt/year [33]. Up to a plant capacity of 50 kt/year, as the plant size grows, the capital cost per unit capacity reduces. As capacity grows for capacities greater than 50 kt/year, the capital cost per unit of the product rises as well. This will affect the optimal and economic size of the production plant [11]. On the other hand, the production capacity of pellet plants is influenced by transportation distance [63]. Therefore, every biomass-based plant has an economically optimal size. This idea has already been investigated for several biomass conversion processes [64,65,66,67,68,69,70].
The optimum size for a wood pellet plant in Figure 3B (Scenario 2) is between 150–200 kt/year. The reduction rate in pellet production cost becomes steady after 150 kt/year capacity [11]. This is comparable with the results of Shahrukh et al. [11], who reported that the optimum plant size for producing regular pellets was 150–190 kt/year. Based on the results illustrated in Figure 3C,D (Scenarios 3 and 4, respectively), an optimal size for steam-treated and torrefied pellet mills, including power generation (CHP), is in the range of 150–200 kt of pretreated pellets per year, although Shahrukh et al. [11] discovered that the optimal size for a steam pretreatment pellet plant was greater than for a conventional pellet mill (230–270 kt/year). This economic optimum size is changeable based on the feedstock and the severity of the pretreatment because, during steam explosion, there are material losses. As high-pressure steam separates the biomass and lowers the solid content of the biomass, material losses occur during the steam explosion. According to the literature, the material losses of switchgrass are higher than straw and forest waste [71,72].
4. Conclusions
A technoeconomic analysis of four case scenarios of bioenergy production from wood sawdust was carried out in this study. The scenarios include pellet production from raw sawdust, heat and electricity generation from wood sawdust, producing heat and electricity and other co-products (furfural and HMF) from steam-treated pellets, and, finally, producing heat and electricity and other co-products (furfural and acetic acid) from torrefied pellets. The most economical scenario in terms of NPV and total revenues is the case scenario of torrefied pellet and bioenergy production, along with co-products. The generated revenue of this project is USD 14.174 M, which is the highest among the alternatives. The second-best project is the case scenario of producing regular pellets from raw sawdust. This project generates the highest IRR and ROI (49.6% and 40.1%, respectively) and has the lowest payback time (2.5 year) among possible options. The worst-case scenario in terms of economic indices (payback time, IRR, and NPV) is the process of producing heat and electricity (CHP) from raw sawdust. The optimal plant size for the CHP plant is in the range of 250–300 kt LP steam as the main product, while for untreated and pretreated pellet plants equipped with CHP, it is in the range of 150–200 kt of pellets per year. Overall, the valorization of waste streams into by-products can compensate for the costs of heavy capital investment and enhance the feasibility of the bioenergy processes.
Supplementary Materials
The following supporting information can be downloaded at: https://www.mdpi.com/article/10.3390/en16041914/s1, Figure S1: Process flow diagram for heat and electricity production from wood sawdust (Scenario 1); Figure S2: Process flow diagram for producing wood pellets from sawdust (Scenario 2); Figure S3: Process flow diagram for heat and electricity production from steam-treated wood pellets (Scenario 3); Figure S4: Contribution of each item to the annual operating cost (2020 prices (USD)). A: Scenario 1, B: Scenario 2, C: Scenario 3, D: Scenario 4; Table S1: Fixed capital estimate summary (2020 prices in USD); Table S2: Profitability analysis (2020 prices (USD)) for Scenario 1; Table S3: Cash flow analysis (USD 000) for Scenario 1; Table S4: Profitability analysis (2020 prices (USD)) for Scenario 2; Table S5: Cash flow analysis (USD 000) for Scenario 2; Table S6: Profitability analysis (2020 prices (USD)) for Scenario 3; Table S7: Cash flow analysis (USD 000) for Scenario 3; Table S8: Profitability analysis (2020 prices (USD)) for Scenario 4; Table S9: Cash flow analysis (USD 000) for Scenario 4.
Author Contributions
Conceptualization, L.G.T. and P.A.; methodology, P.A. and L.G.T.; software, P.A.; validation, P.A. and X.L.; formal analysis, P.A.; investigation, P.A. and L.G.T.; resources, L.G.T.; data curation, P.A. and E.M.; writing—original draft preparation, P.A.; writing—review and editing, L.G.T., D.C., E.M. and X.L.; visualization, P.A.; supervision, L.G.T. and E.M.; project administration, L.G.T. and D.C.; funding acquisition, L.G.T., D.C. and E.M. All authors have read and agreed to the published version of the manuscript.
Funding
This research was funded by the Biofuel Network (BFN) (ASC-16) and the Natural Sciences and Engineering Research Council of Canada (NSERC) (RGPIN-2017-05287).
Data Availability Statement
The data presented in this study are available in the Supplementary Materials.
Acknowledgments
The authors appreciate the editorial assistance and technical guidance of Tim Dumonceaux of the Saskatoon Research and Development Centre, Agriculture and Agri-Food Canada.
Conflicts of Interest
The authors declare no conflict of interest.
Abbreviations
| NPV | Net Present Value |
| PBT | Payback Time |
| IRR | Internal Rate of Return |
| ROI | Return on Investment |
| CHP | Combined Heat and Power |
| HMF | Hydroxy Methyl Furfural |
| TEA | Technoeconomic Analysis |
| DFC | Direct Fixed Capital Cost |
| TCI | Total Capital Investment |
| CAGR | Combined Annual Growth Rate |
| LA | Levulinic Acid |
| FA | Formic Acid |
| THF | Tetrahydrofuran |
| OPEX | Operational Expenditure |
| VOC | Volatile Organic Compound |
| PFR | Plug Flow Reactor |
| HP | High Pressure |
| LP | Low Pressure |
| PFD | Process Flow Diagram |
| SE | Steam-Exploded |
| TF | Torrefied |
| $ | USD |
References
- Lamberg, J.; Ojala, J.; Peltoniemi, M.; Särkkä, T. The Evolution of Global Paper Industry 1800–2050, 1st ed.; Springer: Dordrecht, The Netherlands; Aalto, Finland, 2012. [Google Scholar] [CrossRef]
- Clauser, N.M.; Gutiérrez, S.; Area, M.C.; Felissia, F.E.; Vallejos, M.E. Techno-Economic Assessment of Carboxylic Acids, Furfural, and Pellet Production in a Pine Sawdust Biorefinery. Biofuels Bioprod. Biorefining 2018, 12, 997–1012. [Google Scholar] [CrossRef]
- Kline, K.L.; Wolfe, A.K.; Perlack, R.D.; Dale, V.H.; Mcmahon, M. Biofuel Feedstock Assessment for Selected Countries; Oak Ridge National Laboratory: Oak Ridge, TN, USA, 2007. [Google Scholar] [CrossRef] [Green Version]
- Moreno-Lopez, M.; Alarcón-Herrera, M.T.; Martin-Dominguez, I.R. Feasibility of Pelletizing Forest Residues in Northern Mexico. Waste Biomass Valorization 2017, 8, 923–932. [Google Scholar] [CrossRef]
- Lam, P.S. Steam Explosion of Biomass to Produce Durable Wood Pellets. Ph.D. Thesis, University of British Columbia, Vancouver, BC, Canada, 2011. [Google Scholar]
- Tooyserkani, Z. Hydrothermal Pretreatment of Softwood Biomass and Bark for Pelletization. Ph.D. Thesis, University of British Columbia, Vancouver, BC, Canada, 2011. [Google Scholar]
- Agar, D.; Wihersaari, M. Torrefaction Technology for Solid Fuel Production. GCB Bioenergy 2012, 4, 475–478. [Google Scholar] [CrossRef]
- Agar, D.A. A Comparative Economic Analysis of Torrefied Pellet Production Based on State-of-the-Art Pellets. Biomass Bioenergy 2017, 97, 155–161. [Google Scholar] [CrossRef]
- McKechnie, J.; Saville, B.; MacLean, H.L. Steam-Treated Wood Pellets: Environmental and Financial Implications Relative to Fossil Fuels and Conventional Pellets for Electricity Generation. Appl. Energy 2016, 180, 637–649. [Google Scholar] [CrossRef]
- Valdez Gonzalez, E. Microwave Torrefaction and Densification of Oat Hulls for Heat and Power Production. Master’s Thesis, University of Saskatchewan, Saskatoon, SK, Canada, 2020. [Google Scholar]
- Shahrukh, H.; Oyedun, A.O.; Kumar, A.; Ghiasi, B.; Kumar, L.; Sokhansanj, S. Techno-Economic Assessment of Pellets Produced from Steam Pretreated Biomass Feedstock. Biomass Bioenergy 2016, 87, 131–143. [Google Scholar] [CrossRef]
- Yun, H.; Clift, R.; Bi, X. Process Simulation, Techno-Economic Evaluation and Market Analysis of Supply Chains for Torrefied Wood Pellets from British Columbia: Impacts of Plant Configuration and Distance to Market. Renew. Sustain. Energy Rev. 2020, 127, 109745–109756. [Google Scholar] [CrossRef]
- Ragauskas, A.J.; Williams, C.K.; Davison, B.H.; Britovsek, G.; Cairney, J.; Eckert, C.A.; Frederick, W.J.; Hallett, J.P.; Leak, D.J.; Liotta, C.L.; et al. The Path Forward for Biofuels and Biomaterials. Science 2006, 311, 484–489. [Google Scholar] [CrossRef]
- Zhang, Y.H.P. Reviving the Carbohydrate Economy via Multi-Product Lignocellulose Biorefineries. J. Ind. Microbiol. Biotechnol. 2008, 35, 367–375. [Google Scholar] [CrossRef]
- Trømborg, E.; Bolkesjø, T.F.; Solberg, B. Impacts of Policy Means for Increased Use of Forest-Based Bioenergy in Norway-A Spatial Partial Equilibrium Analysis. Energy Policy 2007, 35, 5980–5990. [Google Scholar] [CrossRef]
- Van Loo, S.; Koppejan, J. The Handbook of Biomass Combustion and Co-Firing, 1st ed.; Taylor & Francis Group: London, UK, 2012. [Google Scholar] [CrossRef]
- Abdulkhani, A.; Alizadeh, P.; Hedjazi, S.; Hamzeh, Y. Potential of Soya as a Raw Material for a Whole Crop Biorefinery. Renew. Sustain. Energy Rev. 2017, 75, 1269–1280. [Google Scholar] [CrossRef]
- Kont, R.; Kurašin, M.; Teugjas, H.; Väljamäe, P. Strong Cellulase Inhibitors from the Hydrothermal Pretreatment of Wheat Straw. Biotechnol. Biofuels 2013, 6, 135. [Google Scholar] [CrossRef] [PubMed] [Green Version]
- Fitzpatrick, S.W. Production of Levulinic Acid from Carbohydrate-Containing Materials. U.S. Patent 5,608,105, 4 March 1997. [Google Scholar]
- Dumesic, J.; Alonso, D.; Gürbüz, E.; Wettstein, S. Production of Levulinic Acid, Furfural, and Gamma Valerolactone from C5 and C6 Carbohydrates in Monoand Biphasic Systems Using Gamma-Valerolactone as a Solvent. Wisconsin Alumni Research Foundation. U.S. Patent 8,399,688, 19 March 2013. [Google Scholar]
- Klingler, F.D.; Ebertz, W. Oxocarboxylic Acids, in Ullmann’s Encyclopedia of Industrial Chemistry; Wiley-VCH: Weinheim, Germany, 2012; Volume 25. [Google Scholar] [CrossRef]
- Tanskanen, J.; Rousu, E.; Anttila, J.; Rousu, P. Preparation of Levulinic Acid. FI Patent 20125274A, 31 October 2013. [Google Scholar]
- Sadhukhan, J.; Ng, K.S.; Hernandez, E.M. Biorefineries and Chemical Processes: Design, Integration and Sustainability Analysis. Green Process. Synth. 2014, 4, 163. [Google Scholar] [CrossRef]
- Mussatto, S.I.; Moncada, J.; Roberto, I.C.; Cardona, C.A. Techno-Economic Analysis for Brewer’s Spent Grains Use on a Biorefinery Concept: The Brazilian Case. Bioresour. Technol. 2013, 148, 302–310. [Google Scholar] [CrossRef] [PubMed]
- Moncada, J.; El-Halwagi, M.M.; Cardona, C.A. Techno-Economic Analysis for a Sugarcane Biorefinery: Colombian Case. Bioresour. Technol. 2013, 135, 533–543. [Google Scholar] [CrossRef]
- Quintero, J.A.; Moncada, J.; Cardona, C.A. Techno-Economic Analysis of Bioethanol Production from Lignocellulosic Residues in Colombia: A Process Simulation Approach. Bioresour. Technol. 2013, 139, 300–307. [Google Scholar] [CrossRef]
- Government of Saskatchewan. Wood Biomass in Saskatchewan. 2021. Available online: https://pubsaskdev.blob.core.windows.net/pubsask-prod/121001/SK%252BWood%252BBiomass%252BOverview%252BNov%252B2021-FINAL.pdf (accessed on 4 February 2023).
- Meramo, S.; González-Delgado, Á.D.; Sukumara, S.; Fajardo, W.S.; León-Pulido, J. Sustainable Design Approach for Modeling Bioprocesses from Laboratory toward Commercialization: Optimizing Chitosan Production. Polymers 2022, 14, 25. [Google Scholar] [CrossRef]
- Alizadeh, P.; Dumonceaux, T.; Tabil, L.G.; Mupondwa, E.; Soleimani, M.; Cree, D. Steam Explosion Pre-Treatment of Sawdust for Biofuel Pellets. Clean Technol. 2022, 4, 1175–1192. [Google Scholar] [CrossRef]
- Alizadeh, P.; Tabil, L.G.; Adapa, P.K.; Cree, D.; Mupondwa, E.; Emadi, B. Torrefaction and Densification of Wood Sawdust for Bioenergy Applications. Fuels 2022, 3, 152–175. [Google Scholar] [CrossRef]
- Mupondwa, E.; Li, X.; Boyetchko, S.; Hynes, R.; Geissler, J. Technoeconomic Analysis of Large Scale Production of Pre-Emergent Pseudomonas Fluorescens Microbial Bioherbicide in Canada. Bioresour. Technol. 2015, 175, 517–528. [Google Scholar] [CrossRef] [PubMed]
- Ozonoh, M.; Aniokete, T.C.; Oboirien, B.O.; Daramola, M.O. Techno-Economic Analysis of Electricity and Heat Production by Co-Gasification of Coal, Biomass and Waste Tyre in South Africa. J. Clean. Prod. 2018, 201, 192–206. [Google Scholar] [CrossRef]
- Sultana, A.; Kumar, A.; Harfield, D. Development of Agri-Pellet Production Cost and Optimum Size. Bioresour. Technol. 2010, 101, 5609–5621. [Google Scholar] [CrossRef]
- Bradley, D. Estimated Production, Consumption, and Surplus Mill Wood Residues in Canada–2004. A National Report; BW McCloy & Associates Inc. and Climate Change Solutions for the Canadian Forest Service and the Forest Products Association of Canada: Ottawa, ON, Canada, 2005. [Google Scholar]
- Malek, A.B.M.A.; Hasanuzzaman, M.; Rahim, N.A.; Al Turki, Y.A. Techno-Economic Analysis and Environmental Impact Assessment of a 10 MW Biomass-Based Power Plant in Malaysia. J. Clean. Prod. 2017, 141, 502–513. [Google Scholar] [CrossRef]
- Kong, X.Q.; Wang, R.Z.; Huang, X.H. Energy Efficiency and Economic Feasibility of CCHP Driven by Stirling Engine. Energy Convers. Manag. 2004, 45, 433–1442. [Google Scholar] [CrossRef]
- Moro, R.; Pinamonti, P.; Reini, M. ORC Technology for Waste-Wood to Energy Conversion in the Furniture Manufacturing Industry. Therm. Sci. 2008, 12, 61–73. [Google Scholar] [CrossRef]
- Quoilin, S.; Van Den Broek, M.; Declaye, S.; Dewallef, P.; Lemort, V. Techno-Economic Survey of Organic Rankine Cycle (ORC) Systems. Renew. Sustain. Energy Rev. 2013, 22, 168–186. [Google Scholar] [CrossRef]
- Turner, J.H.; Lawless, P.A.; Yamamoto, T.; Coy, D.W.; Mckenna, J.D.; Mycock, J.C.; Nunn, A.B.; Greiner, G.P.; Vatavuk, W.M. Electrostatic Precipitators. Particulate Matter ControlsEPA/452/B-02-001 Chapter 3. 1999. Available online: https://www3.epa.gov/ttncatc1/dir1/cs6ch3.pdf (accessed on 14 February 2023).
- Shah, R.K.; Thonon, B.; Benforado, D.M. Opportunities for Heat Exchanger Applications in Environmental Systems. Appl. Therm. Eng. 2000, 20, 631–650. [Google Scholar] [CrossRef]
- Pereira Ramos, L. The Chemistry Involved in the Steam Treatment of Lignocellulosic Materials. Quim. Nova 2003, 26, 863–871. [Google Scholar] [CrossRef] [Green Version]
- Stoffel, R.B.; Neves, P.V.; Felissia, F.E.; Ramos, L.P.; Gassa, L.M.; Area, M.C. Hemicellulose Extraction from Slash Pine Sawdust by Steam Explosion with Sulfuric Acid. Biomass Bioenergy 2017, 107, 93–101. [Google Scholar] [CrossRef]
- Datta, D.; Marti, M.E.; Pal, D.; Kumar, S. Equilibrium Study on the Extraction of Levulinic Acid from Aqueous Solution with Aliquat 336 Dissolved in Different Diluents: Solvent’s Polarity Effect and Column Design. J. Chem. Eng. Data 2017, 62, 3–10. [Google Scholar] [CrossRef]
- Iggland, M.; Mazzotti, M. Introduction to Chemical Engineering for Lecture 7: Flash Distillation; ETH Zurich, Institute of Process Engineering: Zurich, Switzerland, 2018. [Google Scholar]
- Lopes, T.F.; Carvalheiro, F.; Duarte, L.C.; Gírio, F.; Quintero, J.A.; Aroca, G. Techno-Economic and Life-Cycle Assessments of Small-Scale Biorefineries for Isobutene and Xylo-Oligosaccharides Production: A Comparative Study in Portugal and Chile. Biofuels Bioprod. Biorefining 2019, 13, 1321–1332. [Google Scholar] [CrossRef]
- Martínez-Ruano, J.A.; Caballero-Galván, A.S.; Restrepo-Serna, D.L.; Cardona, C.A. Techno-Economic and Environmental Assessment of Biogas Production from Banana Peel (Musa Paradisiaca) in a Biorefinery Concept. Environ. Sci. Pollut. Res. 2018, 25, 35971–35980. [Google Scholar] [CrossRef] [PubMed]
- Moncada, J.; Cardona, C.A.; Rincón, L.E. Design and Analysis of a Second and Third Generation Biorefinery: The Case of Castorbean and Microalgae. Bioresour. Technol. 2015, 198, 836–843. [Google Scholar] [CrossRef] [PubMed]
- Lopes, T.F.; Lukasik, R.M. Economic, Social and Environmental Impacts Attained by the Use of the Effluents Generated within a Small-Scale Biorefinery Concept. Acta Innov. 2020, 36, 57–63. [Google Scholar] [CrossRef]
- Shahrukh, H.; Oyedun, A.O.; Kumar, A.; Ghiasi, B.; Kumar, L.; Sokhansanj, S. Net Energy Ratio for the Production of Steam Pretreated Biomass-Based Pellets. Biomass Bioenergy 2015, 80, 286–297. [Google Scholar] [CrossRef]
- Batidzirai, B.; Mignot, A.P.R.; Schakel, W.B.; Junginger, H.M.; Faaij, A.P.C. Biomass Torrefaction Technology: Techno-Economic Status and Future Prospects. Energy 2013, 62, 196–214. [Google Scholar] [CrossRef]
- Chew, J.J.; Doshi, V. Recent Advances in Biomass Pretreatment—Torrefaction Fundamentals and Technology. Renew. Sustain. Energy Rev. 2011, 15, 4212–4222. [Google Scholar] [CrossRef]
- Kleinschmidt, C.P. Overview of International Developments in Torrefaction. In Torrefaction Workshop; IEA Bioenergy: Arnhem, The Netherlands, 2011. [Google Scholar]
- Beekes, M.; Cremers, M. Realising a co-firing dream. Power Eng. Int. 2012, 20, 64–70. [Google Scholar]
- Melin, S. Torrefied Wood: A New Emerging Energy Carrier. Wood Pellets Association of Canada. Presented to: Clean Coal Power Coalition CCPC. 2011. Available online: http://www.pellet.org/linked/2011-03-09%20ccpc%20presentation%20(2).pdf (accessed on 20 December 2022).
- Ciolkosz, D.; Wallace, R. A Review of Torrefaction for Bioenergy Feedstock Production. Biofuels Bioprod. Biorefining 2011, 5, 317–329. [Google Scholar] [CrossRef]
- Dhungana, A. Torrefaction of Biomass. Master’s Thesis, Dalhousie University, Halifax, NS, Canada, 2011. [Google Scholar]
- Cheah, C.B.; Ramli, M. The Engineering Properties of High Performance Concrete with HCWA-DSF Supplementary Binder. Constr. Build. Mater. 2013, 40, 93–103. [Google Scholar] [CrossRef]
- Mangi, S.A.; Jamaluddin, N.; Wan Ibrahim, M.H.; Noridah, M.; Sohu, S. Utilization of Sawdust Ash as Cement Replacement for the Concrete Production: A Review. Eng. Sci. Technol. Int. Res. J. 2017, 1, 11–15. [Google Scholar]
- Pal, N.; Petrides, D.P.; Siletti, C. Superpro Designer: An Interactive Software Tool for Designing and Evaluating Integrated Chemical, Biochemical, and Environmental Processes. 2005. Available online: https://www.aiche.org/conferences/aiche-annual-meeting/2005/proceeding/paper/37i-superpro-designer-interactive-software-tool-designing-and-evaluating-integrated-chemical-0 (accessed on 14 February 2023).
- Wolbers, P.; Cremers, M.; Robinson, T.; Madrali, S.; Tourigny, G. Biomass Pretreatment for Bioenergy–Case Study 4: The Steam Explosion Process Technology. IEA Bioenergy. 2018. Available online: https://www.ieabioenergy.com/blog/publications/biomass-pre-treatment-for-bioenergy-case-study-4-the-steam-explosion-process-technology (accessed on 14 February 2023).
- Mobini Dehkordi, M.M. On the Design and Analysis of Forest Biomass to Biofuel and Bioenergy Supply Chains. Ph.D. Thesis, University of British Columbia, Vancouver, BC, Canada, 2015. [Google Scholar]
- Peng, J.H. A Study of Softwood Torrefaction and Densification for the Production of High Quality Wood Pellets. Ph.D. Thesis, University of British Columbia, Vancouver, BC, Canada, 2012. [Google Scholar]
- Mupondwa, E.; Li, X.; Tabil, L.; Phani, A.; Sokhansanj, S.; Stumborg, M.; Gruber, M.; Laberge, S. Technoeconomic Analysis of Wheat Straw Densification in the Canadian Prairie Province of Manitoba. Bioresour. Technol. 2012, 110, 355–363. [Google Scholar] [CrossRef]
- Kumar, A.; Cameron, J.B.; Flynn, P.C. Biomass Power Cost and Optimum Plant Size in Western Canada. Biomass Bioenergy 2003, 24, 445–464. [Google Scholar] [CrossRef]
- Sarkar, S.; Kumar, A. Biohydrogen Production from Forest and Agricultural Residues for Upgrading of Bitumen from Oil Sands. Energy 2010, 35, 582–591. [Google Scholar] [CrossRef]
- Sarkar, S.; Kumar, A. Large-Scale Biohydrogen Production from Bio-Oil. Bioresour. Technol. 2010, 101, 7350–7736. [Google Scholar] [CrossRef]
- Kumar, A.; Flynn, P.; Sokhansanj, S. Biopower Generation from Mountain Pine Infested Wood in Canada: An Economical Opportunity for Greenhouse Gas Mitigation. Renew. Energy 2008, 33, 1354–1363. [Google Scholar] [CrossRef]
- Mani, S.; Sokhansanj, S.; Bi, X.; Turhollow, A. Economics of Producing Fuel Pellets from Biomass. Appl. Eng. Agric. 2006, 22, 421–426. [Google Scholar] [CrossRef]
- Ruhul Kabir, M.; Kumar, A. Comparison of the Energy and Environmental Performances of Nine Biomass/Coal Co-Firing Pathways. Bioresour. Technol. 2012, 124, 394–405. [Google Scholar] [CrossRef]
- Kabir, M.R.; Kumar, A. Development of Net Energy Ratio and Emission Factor for Biohydrogen Production Pathways. Bioresour. Technol. 2011, 102, 8972–8985. [Google Scholar] [CrossRef]
- Gebreegziabher, T.; Oyedun, A.O.; Hui, C.W. Optimum Biomass Drying for Combustion—A Modeling Approach. Energy 2013, 53, 67–73. [Google Scholar] [CrossRef]
- Luk, H.T.; Lam, T.Y.G.; Oyedun, A.O.; Gebreegziabher, T.; Hui, C.W. Drying of Biomass for Power Generation: A Case Study on Power Generation from Empty Fruit Bunch. Energy 2013, 63, 205–215. [Google Scholar] [CrossRef]
Figure 1.
Process flow diagram (PFD) for heat and electricity production from a portion (25%) of torrefied wood pellets (Scenario 4).
Figure 1.
Process flow diagram (PFD) for heat and electricity production from a portion (25%) of torrefied wood pellets (Scenario 4).

Figure 2.
Relationship between NPV with interest rates (A) and price change of main products (B) for each case scenario. Scenario 1: direct CHP generation from wood sawdust and shavings; Scenario 2: wood pellet production without CHP; Scenario 3: production of pellets and CHP from steam-exploded wood; Scenario 4: production of pellets and CHP from torrefied wood.

Figure 3.
Relationship between net present value and production cost with capacity. SE: steam-exploded, TF: torrefied, LP: low pressure. Scenario 1: direct CHP generation from wood sawdust and shavings (A); Scenario 2: wood pellet production without CHP (B); Scenario 3: production of pellets and CHP from steam-exploded wood (C); Scenario 4: production of pellets and CHP from torrefied wood (D).


Table 1.
Major equipment costs (2020 prices in USD) for Scenarios 1 and 2.
| Description | Cost (USD) (Number of Units in Parentheses) | |
|---|---|---|
| Scenario 1 | Scenario 2 | |
| Steam Generator | 439,000 (1) | |
| Extraction Steam Turbine Generator | 224,000 (1) | |
| Pneumatic Conveyor | 126,000 (1) | 126,000 (1) |
| Heat Exchanger | 58,000 (1) | 21,000 (1) |
| Electrostatic Precipitator | 801,000 (1) | |
| Grinder | 87,000 (1) | 87,000 (1) |
| Pelletizer | 996,000 (4) | |
| Silo/Bin | 67,000 (1) | |
| Vibrating Screen | 13,000 (1) | |
| Belt Conveyor | 55,000 (1) | |
| Unlisted Equipment | 434,000 | 341,000 |
| Total | 2,169,000 | 1,706,000 |
Note: Scenario 1: direct combined heat and power generation from wood sawdust and shavings; Scenario 2: wood pellet production without combined heat and power generation.
Table 2.
Major equipment costs (2020 prices in USD) for Scenarios 3 and 4.
| Description | Cost (USD) (Number of Units in Parentheses) | |
|---|---|---|
| Scenario 3 | Scenario 4 | |
| Pneumatic Conveyor | 213,000 (2) | 213,000 (2) |
| Heat Exchanger | 127,000 (4) | 118,000 (4) |
| Screw Conveyor | 116,000 (2) | 110,000 (2) |
| Pelletizer | 996,000 (4) | 996,000 (4) |
| Vibrating Screen | 12,000 (1) | 12,000 (1) |
| Belt Conveyor | 110,000 (2) | 165,000 (3) |
| Silo/Bin | 67,000 (1) | 67,000 (1) |
| Grinder | 78,000 (1) | 77,000 (1) |
| Steam Generator | 203,000 (1) | 183,000 (1) |
| Extraction Steam Turbine Generator | 57,000 (1) | 56,000 (1) |
| Flash Drum | 8000 (1) | |
| Plug Flow Reactor | 65,000 (1) | |
| Component Splitter | 163,000 (1) | |
| Electrostatic Precipitator | 436,000 (1) | 418,000 (1) |
| Degasser | 10,000 (1) | |
| Flow Splitter | 163,000 (1) | |
| Fluidized Bed Reactor | 303,000 (1) | |
| Unlisted Equipment | 663,000 | 723,000 |
| Total | 3,314,000 | 3,614,000 |
Note: Scenario 3: production of pellets and CHP from steam-exploded wood; Scenario 4: production of pellets and CHP from torrefied wood.
Table 3.
The annual production rate of various products and power savings from each case scenario.
| Product | Scenario | |||
|---|---|---|---|---|
| 1 | 2 | 3 | 4 | |
| Pellets (tonnes) | - | 72,000 | 53,543 | 46,837 |
| HP 1-Steam (tonnes) | 46,957 | - | - | 14,876 |
| LP 2-Steam (tonnes) | 146,741 | - | 53,075 | 546,488 |
| HMF 3 (tonnes) | - | - | 200 | - |
| Acetic acid (tonnes) | - | - | - | 2589 |
| Furfural (tonnes) | - | - | 782 | 4568 |
| Power savings (kWh) | 4,896,453 | - | 2,431,553 | 2,062,124 |
1 High pressure, 2 low pressure, 3 hydroxy methyl furfural. Note: Scenario 1: direct CHP generation from wood sawdust and shavings; Scenario 2: wood pellet production without CHP; Scenario 3: production of pellets and CHP from steam-exploded wood; Scenario 4: production of pellets and CHP from torrefied wood.
Table 4.
Summary of economic indices for profitability analysis between case scenarios.
| Economic Indicator | Scenario | |||
|---|---|---|---|---|
| 1 | 2 | 3 | 4 | |
| Total capital investment (M USD) | 14.493 | 10.478 | 20.845 | 21.531 |
| Operating cost (M USD) | 4.242 | 3.192 | 7.047 | 6.98 |
| Total revenues (M USD) | 3.038 | 8.64 | 9.173 | 14.174 |
| Unit production cost (USD/t) | 28.91 | 44.33 | 131.61 | 149.03 |
| Return on investment (%) | 4.03 | 40.15 | 15.75 | 29.56 |
| Payback time (year) | 24.79 | 2.49 | 6.35 | 3.38 |
| Internal rate of return (after taxes) (%) | N/A | 49.61 | 13.67 | 31.33 |
| NPV (at 7% interest) (M USD) | −12.85 | 30.89 | 9.15 | 38.25 |
| Main product | LP steam | Untreated pellets | Steam-exploded pellets | Torrefied pellets |
Note: Scenario 1: direct CHP generation from wood sawdust and shavings; Scenario 2: wood pellet production without CHP; Scenario 3: production of pellets and CHP from steam-exploded wood; Scenario 4: production of pellets and CHP from torrefied wood.
Disclaimer/Publisher’s Note: The statements, opinions and data contained in all publications are solely those of the individual author(s) and contributor(s) and not of MDPI and/or the editor(s). MDPI and/or the editor(s) disclaim responsibility for any injury to people or property resulting from any ideas, methods, instructions or products referred to in the content. |
© 2023 by the authors. Licensee MDPI, Basel, Switzerland. This article is an open access article distributed under the terms and conditions of the Creative Commons Attribution (CC BY) license (https://creativecommons.org/licenses/by/4.0/).
Share and Cite
MDPI and ACS Style
Alizadeh, P.; Tabil, L.G.; Mupondwa, E.; Li, X.; Cree, D. Technoeconomic Feasibility of Bioenergy Production from Wood Sawdust. Energies 2023, 16, 1914. https://doi.org/10.3390/en16041914
AMA Style
Alizadeh P, Tabil LG, Mupondwa E, Li X, Cree D. Technoeconomic Feasibility of Bioenergy Production from Wood Sawdust. Energies. 2023; 16(4):1914. https://doi.org/10.3390/en16041914
Chicago/Turabian StyleAlizadeh, Peyman, Lope G. Tabil, Edmund Mupondwa, Xue Li, and Duncan Cree. 2023. "Technoeconomic Feasibility of Bioenergy Production from Wood Sawdust" Energies 16, no. 4: 1914. https://doi.org/10.3390/en16041914
Note that from the first issue of 2016, this journal uses article numbers instead of page numbers. See further details here.