
Load Evaluation for Tower Design of Large Floating Offshore Wind Turbine System According to Wave Conditions

Korean Research Institute of Ship & Ocean Engineering, Daejeon 34103, Republic of Korea
*
Author to whom correspondence should be addressed.
Energies 2023, 16(4), 1862; https://doi.org/10.3390/en16041862
Submission received: 13 January 2023
/
Revised: 9 February 2023
/
Accepted: 11 February 2023
/
Published: 13 February 2023
Abstract
:This study entailed a load evaluation for the tower design of a large floating offshore wind turbine system in accordance with the wave conditions. The target model includes the IEA 15 MW reference wind turbine and a semi-submersible VolturnUS-S reference floating offshore wind turbine platform from the University of Maine. The OpenFAST, which is an aero-hydro-servo-elastic fully coupled analysis tool, was used for load analysis. The DLC1.2 and 1.6 were used as the design load cases, and the environmental conditions suitable for the design load cases were cited in the VolturnUS-S platform report. Load evaluation was performed according to time series and FFT results. The findings of the study are as follows: first, in the correlation analysis, the tower-top deflection had the highest correlation, and this further affects nacelle acceleration. Second, the tower-base pitch moment increased with the significant wave height. However, the wave peak period increased until it matched the tower-top deflection frequency and decreased thereafter. Third, the comparison between the normal and severe sea state conditions revealed that the tower-base pitch moments for the two conditions are almost similar, despite the conditions wherein the wave spectral energy differs by a factor of 3.5. Fourth, the tower shape is changed while adjusting the diameter of the tower, and the tower-top and tower-base pitch moments are reviewed using a redesigned tower. Even if the mass is the same, adjusting the diameter of the tower reduces only the pitch moment.
1. Introduction
The global offshore wind energy has scaled by over 50 GW in the past year. Most installed wind turbines are either onshore or offshore fixed types. Commercial floating offshore wind turbines are virtually nonexistent. This is due to the fact that the initial cost is higher compared to that of the fixed type [1]. There has been an increase in research studies on large-scale floating offshore wind turbine systems in recent years due to favorable factors such as highly stable generator power, which further enables applications in deeper waters and yields stable wind energy. They can be easily installed in deep water because they are relatively less dependent on seabed conditions, and this characteristic favors transportation and installation. Therefore, the commercialization of floating offshore wind turbine system in the future is almost inevitable, and it is necessary to reduce the overall costs before full practical use. In fact, publicly available reference wind turbines such as the 5 MW reference wind turbines [2] developed by the National Renewable Energy Laboratory (NREL), have been publicly shared in order to study the complex dynamics of the FOWT. The extensive studies have helped reduce the cost of the entire system.
In 2020, the International Energy Agency (IEA) developed a 15 MW reference wind turbine with a fixed-bottom monopole support structure [3]. In the same year, the University of Maine released a semi-submersible turbine system, which was designed to support the IEA 15 MW reference wind turbine [4]. There has been significant research on large floating offshore wind turbines such as the 15 MW FOWT. Mahfouz et al. [5] investigated the response of a 15 MW floating offshore wind turbine system platform according to different load cases. They revealed that the platform motion was dominated by low-frequency forces under small-wave conditions. Liu [6] and Pollini et al. [7] optimized semi-submersible and spar-type platforms for a 15 MW reference wind turbine. Mendoza et al. [8] implemented control actions and strategies for a 1:70 scale model of a 15 MW reference wind turbine in a wind–wave basin. They compared their results with those of numerical models from three different software tools, and they further demonstrated the ability to effectively represent the aerodynamic response of the wind turbine to the control actions. Loubeyres et al. [9] investigated the response of a 15 MW reference wind turbine blade to extreme wind conditions based on configurations involving severe stall flutter vibrations. They investigated the sensitivity of the stall flutter phenomenon during calculation, and they inferred that it is possible to create a link between the local aeroelastic stability properties of each blade section and the global behavior. Rinker et al. [10] compared the aero-elastic loads calculated using different fidelities of the blade model in OpenFAST and HAWC2 for a 15 MW reference wind turbine. Their results were in good agreement with those of the loads dominated by the aerodynamic thrust and forces, except for the asymmetric loading of the rotor. Papi et al. [11] compared a 5 MW and 15 MW floating offshore wind turbine system under the same sea and inflow conditions with varying degrees of severity. They confirmed that there was no significant difference in the overall performance and rotor loads. However, they stated that these conditions had a significant impact on the tower load during the floating installation. The model used in this study is also a 15 MW reference wind turbine, and the platform integrates a semi-submersible type turbine system. Because turbines with increased hub height and rotor and nacelle assembly (RNA) weight are used, a load assessment on the tower must be performed. The turbine weight, tower-top motion, control complexity, and maximum healing angle were introduced as representative items to analyze the impact of the stability class on turbine design [12]. Because the tower is connected to the platform as well as the RNA, the tower load can be significantly large due to the dynamics and, thus, careful load evaluation is required.
This study entailed an analysis of the significance of wave conditions for the tower design of a large floating offshore wind turbine system. The load analysis was performed for the tower-top and tower-base pitch moments according to various wave conditions with regard to the results of the previous study. The target model includes the IEA 15 MW reference wind turbine and the semi-submersible type VolturnUS-S reference floating offshore wind turbine provided by the University of Maine. The DLC1.1 and 1.6 were used as the design load cases, and the environmental conditions suitable for the design load cases were cited in the VolturnUS-S platform report. It was confirmed that a high tower-base pitch moment occurs despite the wave condition of low wave spectral energy. Thus, when designing a tower, it is necessary to review both the Campbell diagram of the tower and the frequency of the tower-top deflection. If the wave peak period is close to this value, the tower should be designed such that it avoids the high pitch moment.
The remainder of this paper is organized as follows: Section 2 explains the numerical model, validation of the numerical setup, and design load cases, including environmental conditions. Section 3 describes the results of tower-base pitch moment according to various wave conditions as time series and FFT results. The conclusions are presented in Section 4.
2. Numerical Setup
2.1. Target Model
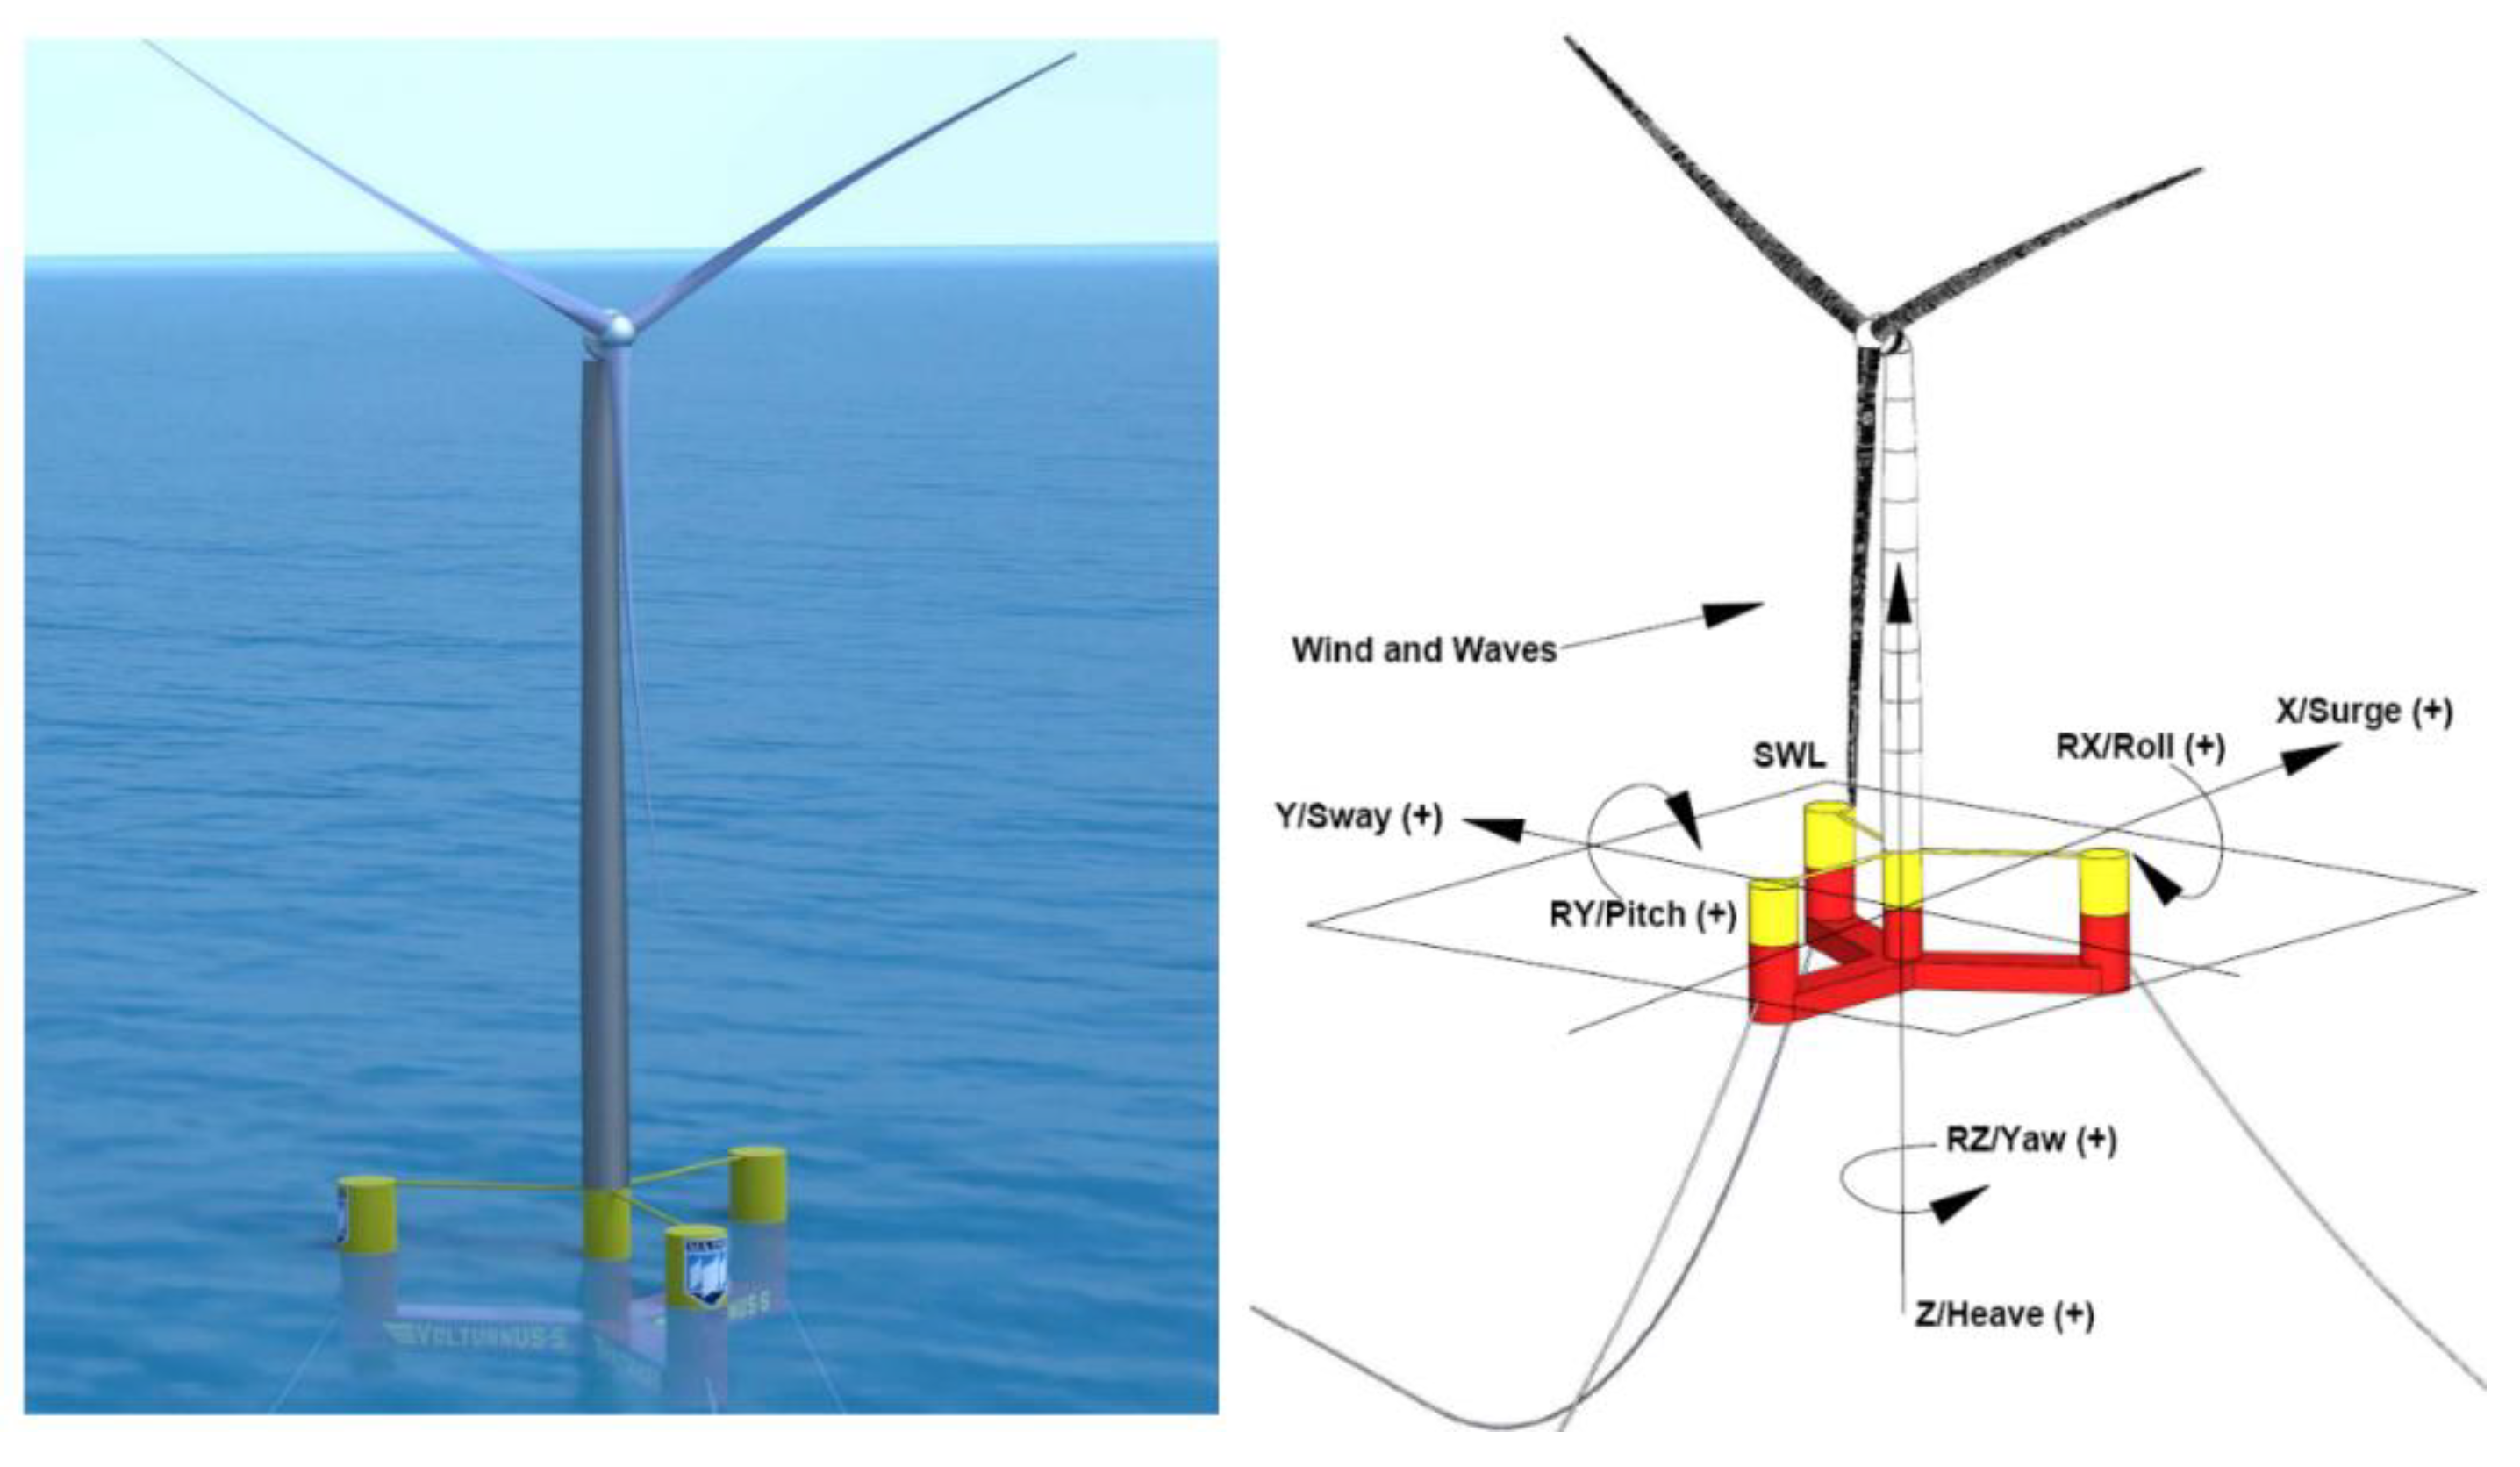
This study integrates the semi-submersible type VolturnUS-S reference floating offshore wind turbine by the University of Maine, which was designed to support the IEA 15 MW reference wind turbine. The IEA 15 MW reference wind turbine is the largest among the existing turbine systems. Figure 1 shows the floating offshore wind turbine system and the reference coordinate system used in this study, and Table 1 summarizes the important characteristics of the system. Although the detailed design process and specifications are not provided here, the same can be obtained by referring to a recent study, which we provided in the references [4].
2.2. Method
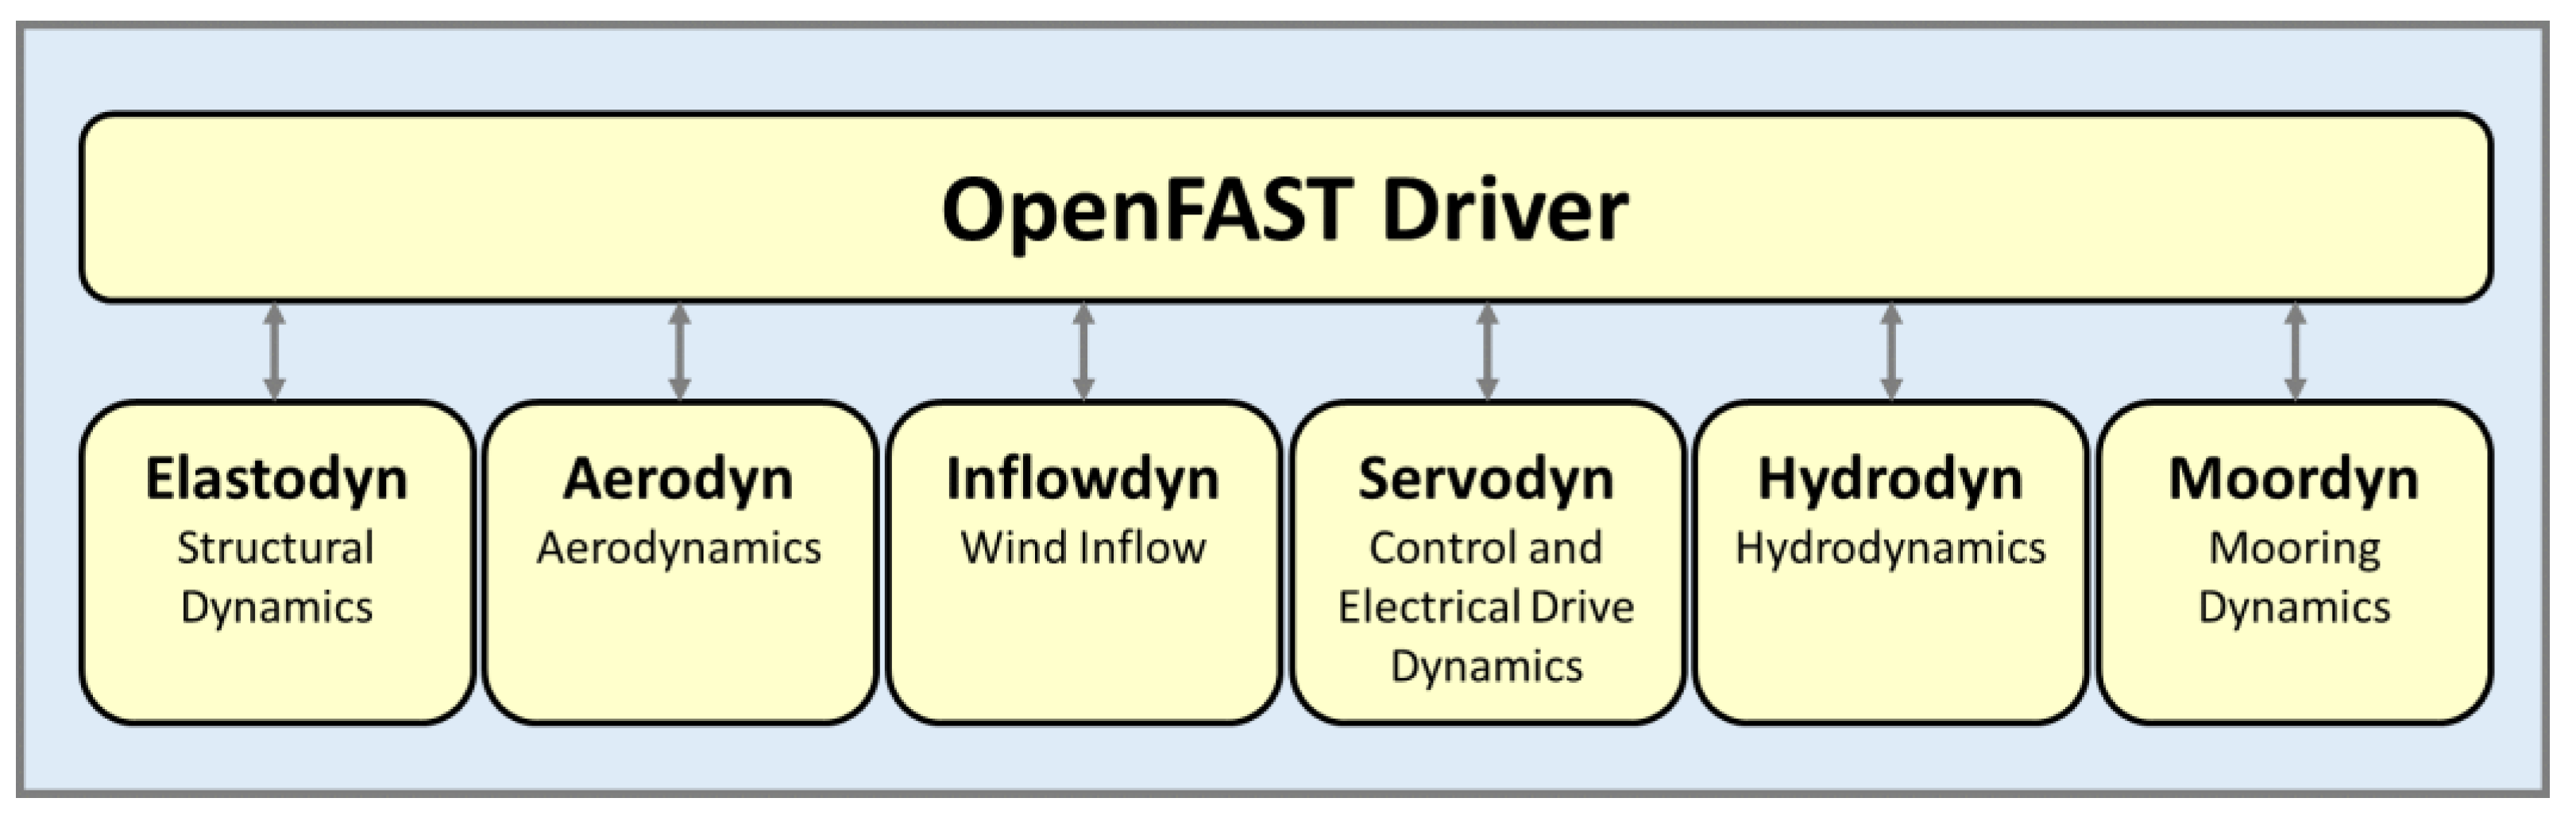
The aerodynamics of a wind turbine were modeled with Turbsim and Aerodyn, part of the OpenFAST [13] software package developed by the National Renewable Energy Laboratory. OpenFAST is required for coupled analysis considering aerodynamic loads and response of wind turbine and platform. This simulation tool considers structural responses such as aerodynamic, hydrodynamic, control, and elastic behavior of the total system. Figure 2 shows the some of the various modules connected by OpenFAST, and for more detailed theory, refer to the user guide or the manual of each package. It has been proven for years that the dynamics of floating offshore wind turbine system can be captured well [14,15].
Elastodyn is a structural dynamics module for wind turbine, solved using modal-bases structures. It can consider the flexibility of blade and tower and platform DOF [17]. Aerodyn [18] is the time domain module that calculates the aerodynamic loads applied to the blades and tower, and it is modelled using Blade–Element–Momentum theory (BEM). The blades are modelled using a set of tabulated lift and drag coefficient [11]. Inflowdyn is a module that processes the inflow of wind generated using a stochastic, full-field, turbulent wind generation module called Turbsim [19]. Servodyn is a control and electrical drive dynamics module for OpenFAST. One of the biggest design differences from land-based wind turbine systems is the control system, and the negative damping phenomenon [20] is the most active among researchers studying floating offshore wind turbine system. The reference open-source controller (ROSCO) has been developed by NREL to provide a modular reference wind turbine controller and included control capabilities such as wind speed estimation, smoothing algorithm, TSR tracking generator torque and minimum pitch saturation [21]. The platform is calculated for it interaction with the sea using Hydrodyn [22], an OpenFAST hydrodynamics module. Hydrodyn requires data such as added mass matrix at frequency and wave excitation loads from the WAMIT files [23] which is an external potential flow solver.
2.3. Validation of Numerical Model
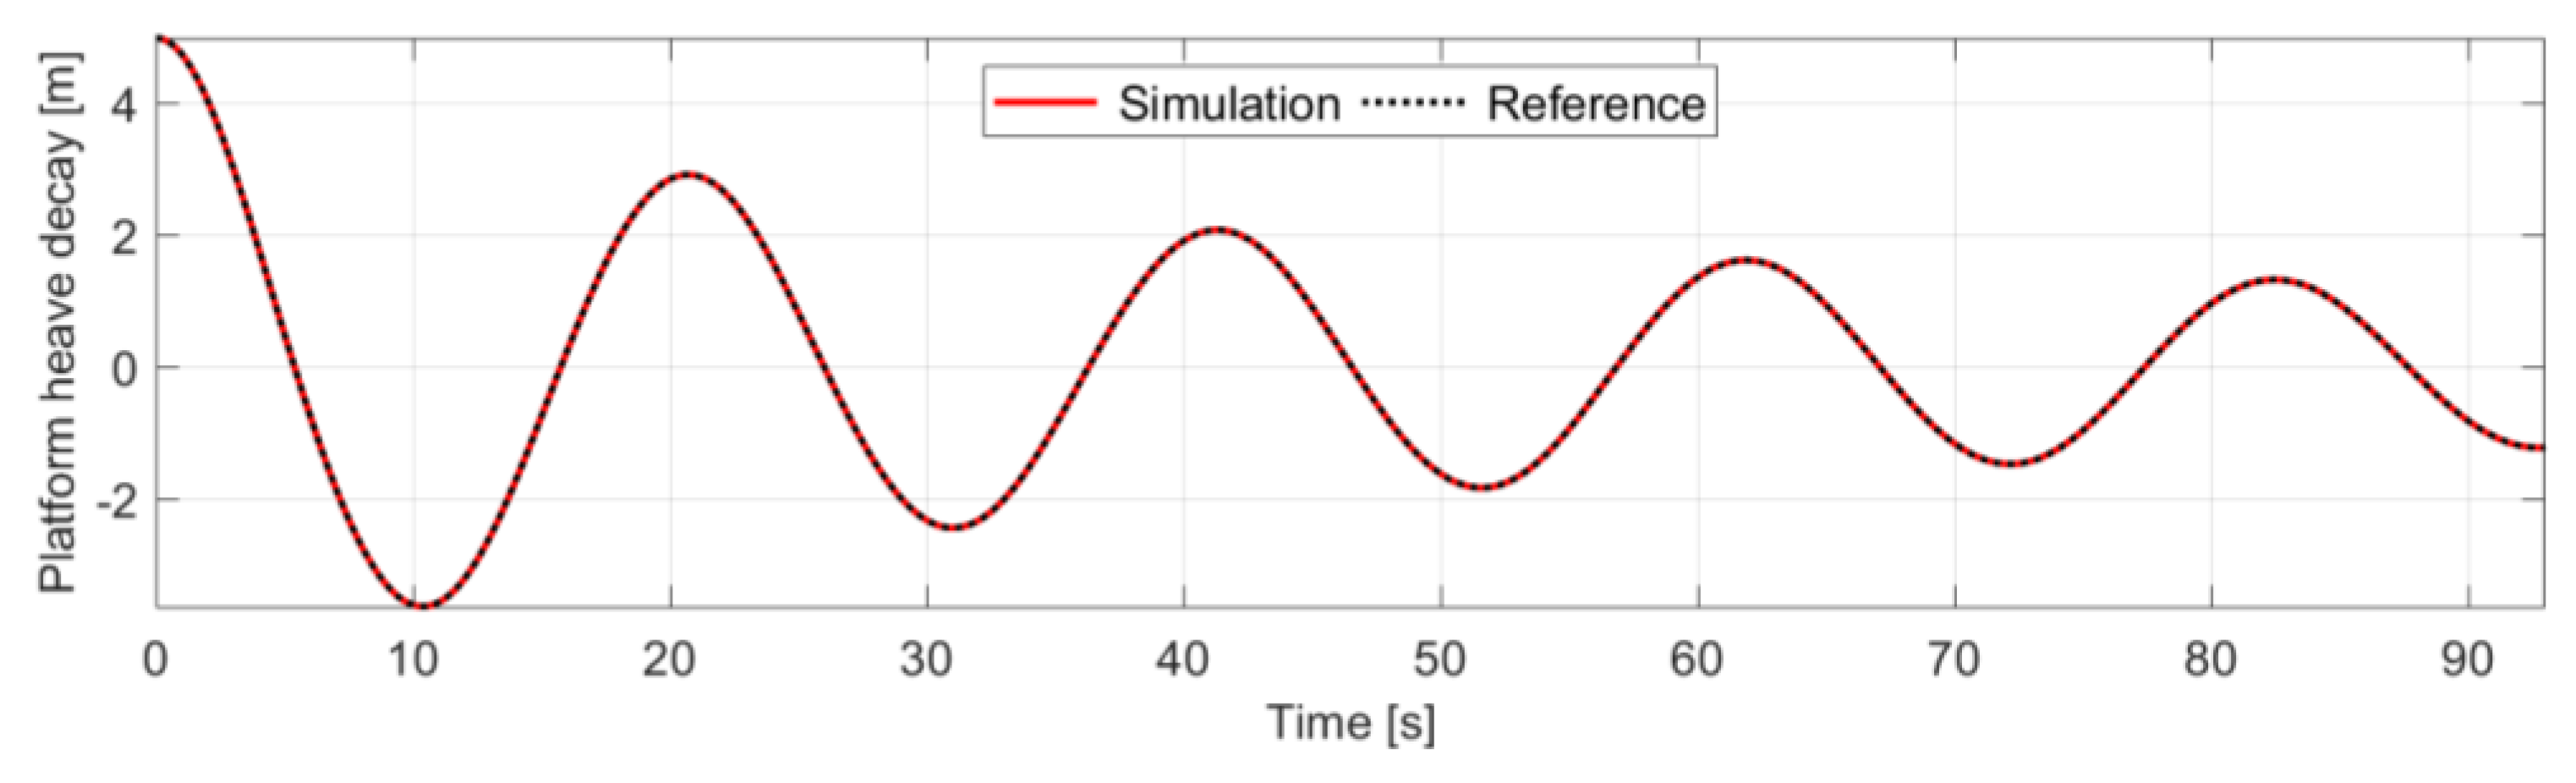
The numerical model of the floating offshore wind turbine system was validated through a free-decay test and steady-state analysis, which further yield detailed insights into the fundamental performance of the platform and wind turbines, respectively. Free-decay tests in OpenFAST were considered for all DOFs, including the blades, tower, and platform. Figure 3 shows the time series of the heave free-decay test, and Table 2 summarizes the natural frequencies of the system, which are obtained as the average oscillation period for the decay results shown in Figure 3.
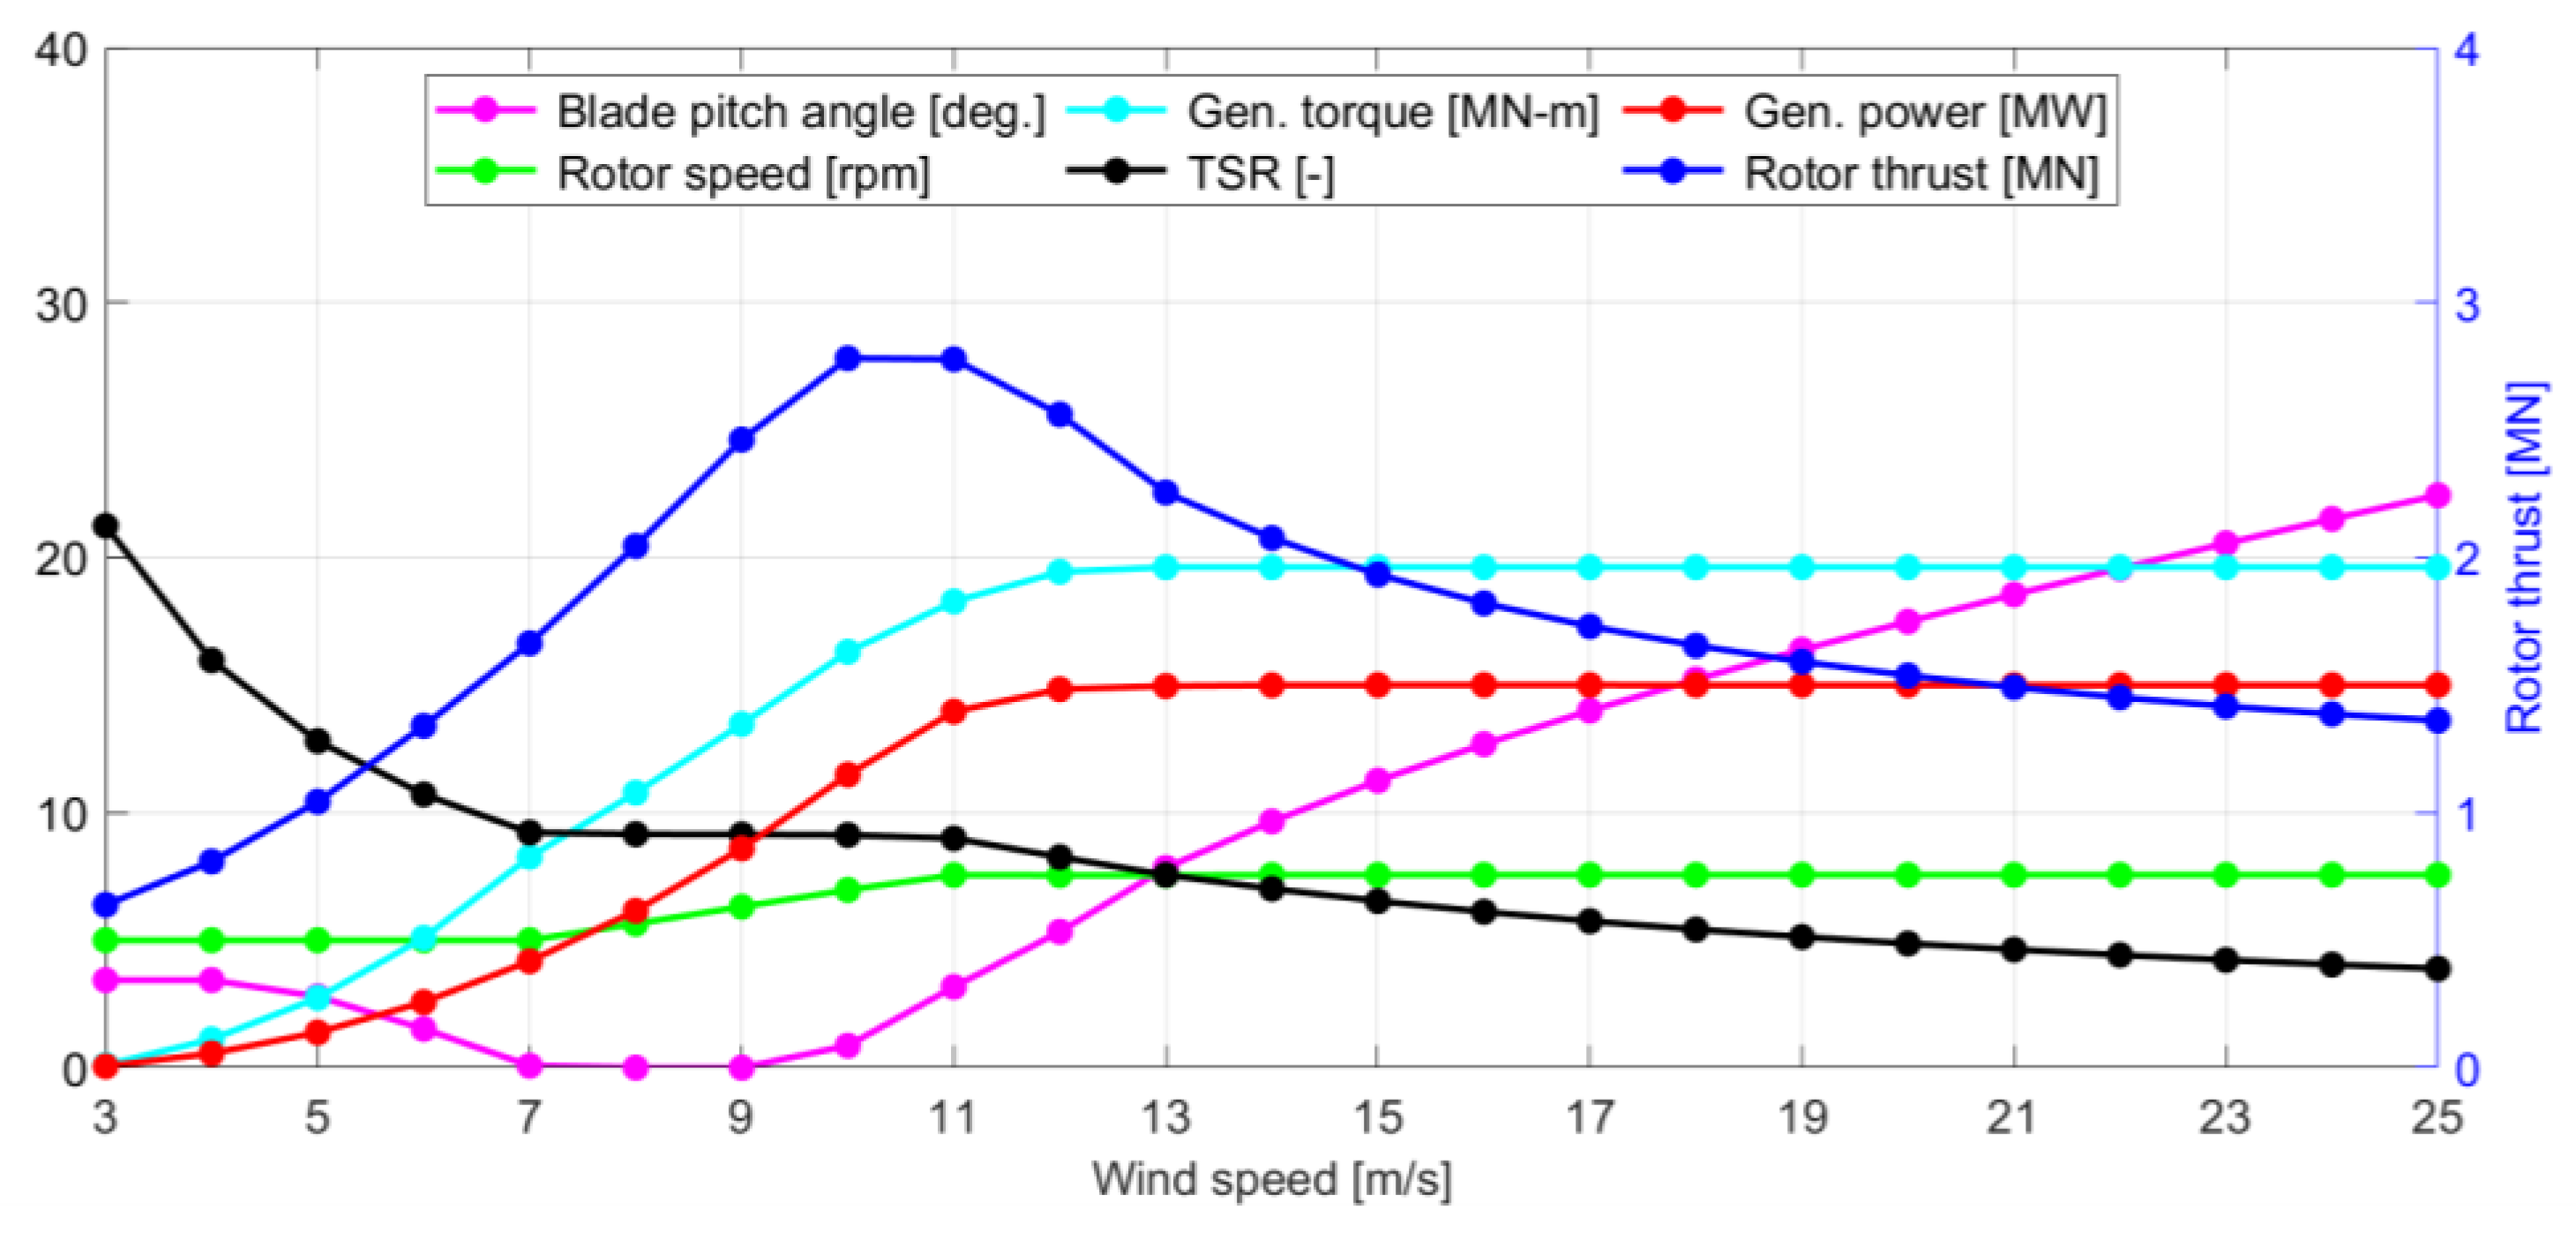
The steady-state analysis is used to analyze the performance of the wind turbine as a function of wind speed using OpenFAST. This further reveals the characteristics of the applied control system; a detailed description of the control system according to the aforementioned analysis can be found in the Definition of the IEA Wind 15 MW Offshore Reference Wind Turbine. Figure 4 shows the result of the steady-state analysis of the floating offshore wind turbine, and it is confirmed that all results are almost the same as those in the technical report.
2.4. Design Load Cases and Environmental Conditions
To analyze the performance of floating offshore wind turbines, IEC61400-3-2 [24] proposed normal and extreme design load cases. Table 3 summarizes the design load cases and environmental conditions, which are described in the Definition of the UMaine VolturnUS-S Reference Platform. The environmental conditions were described by Stewart et al. [25] and Viselli et al. [26], and these conditions are primarily associated with the U.S. East Coast. The analysis conditions used in this study include a wind speed of 12 m/s for the DLC1.6. Next, and the analysis was added by changing the significant wave height and wave peak period, which were mostly similar to the conditions shown in Table 3. All conditions used in this study were aligned with the wind and wave directions at 0°, as shown in Figure 1. The performance of the tower of a floating offshore wind turbine system was analyzed according to the aforementioned design conditions.
3. Results and Discussion
3.1. Comparison of Tower Moment According to Environmental Conditions
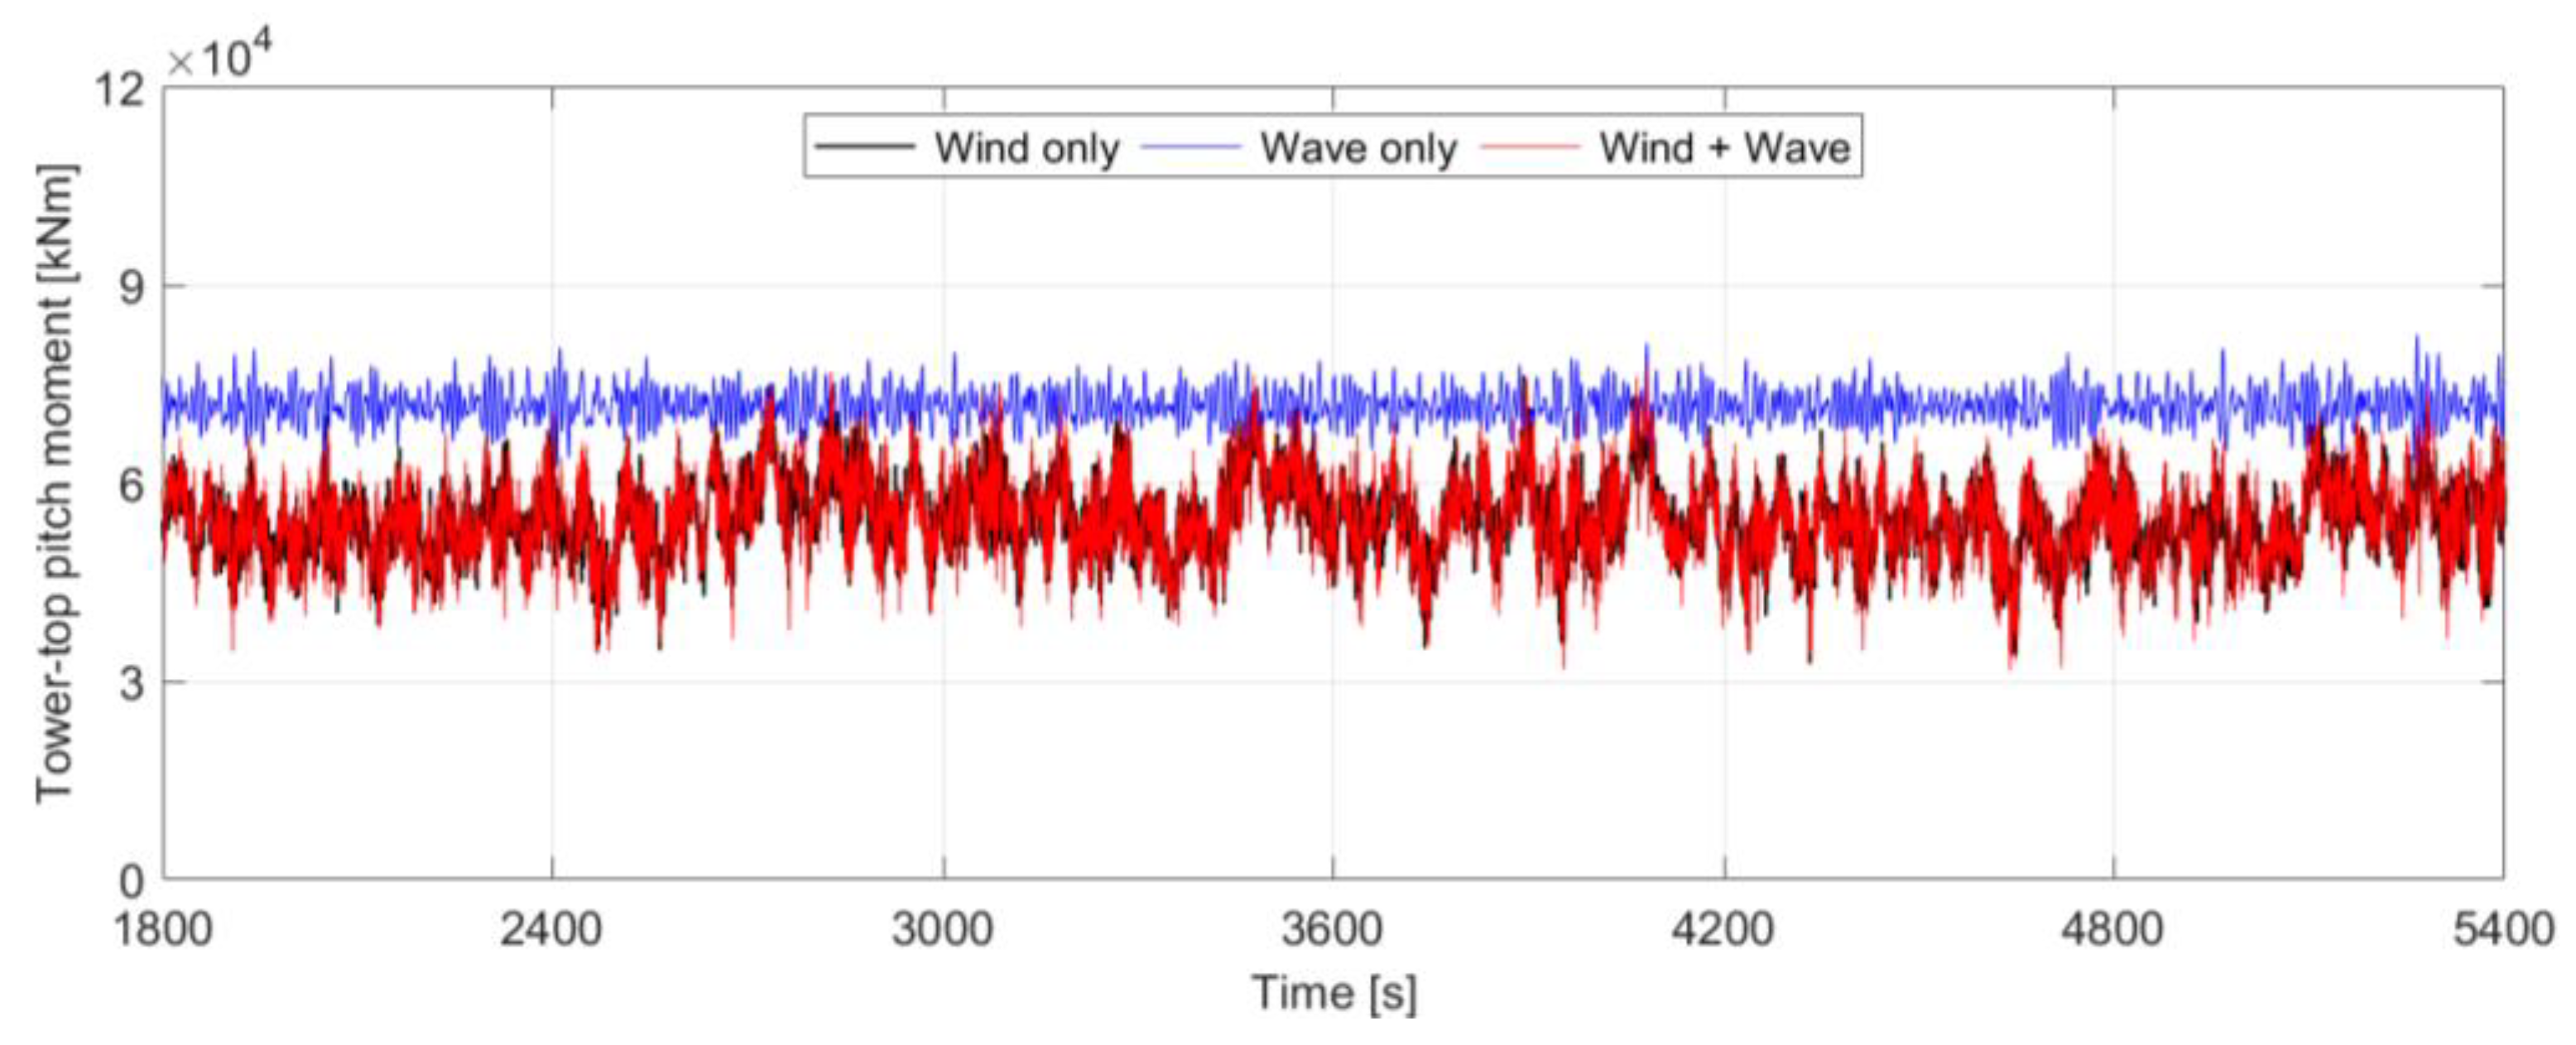
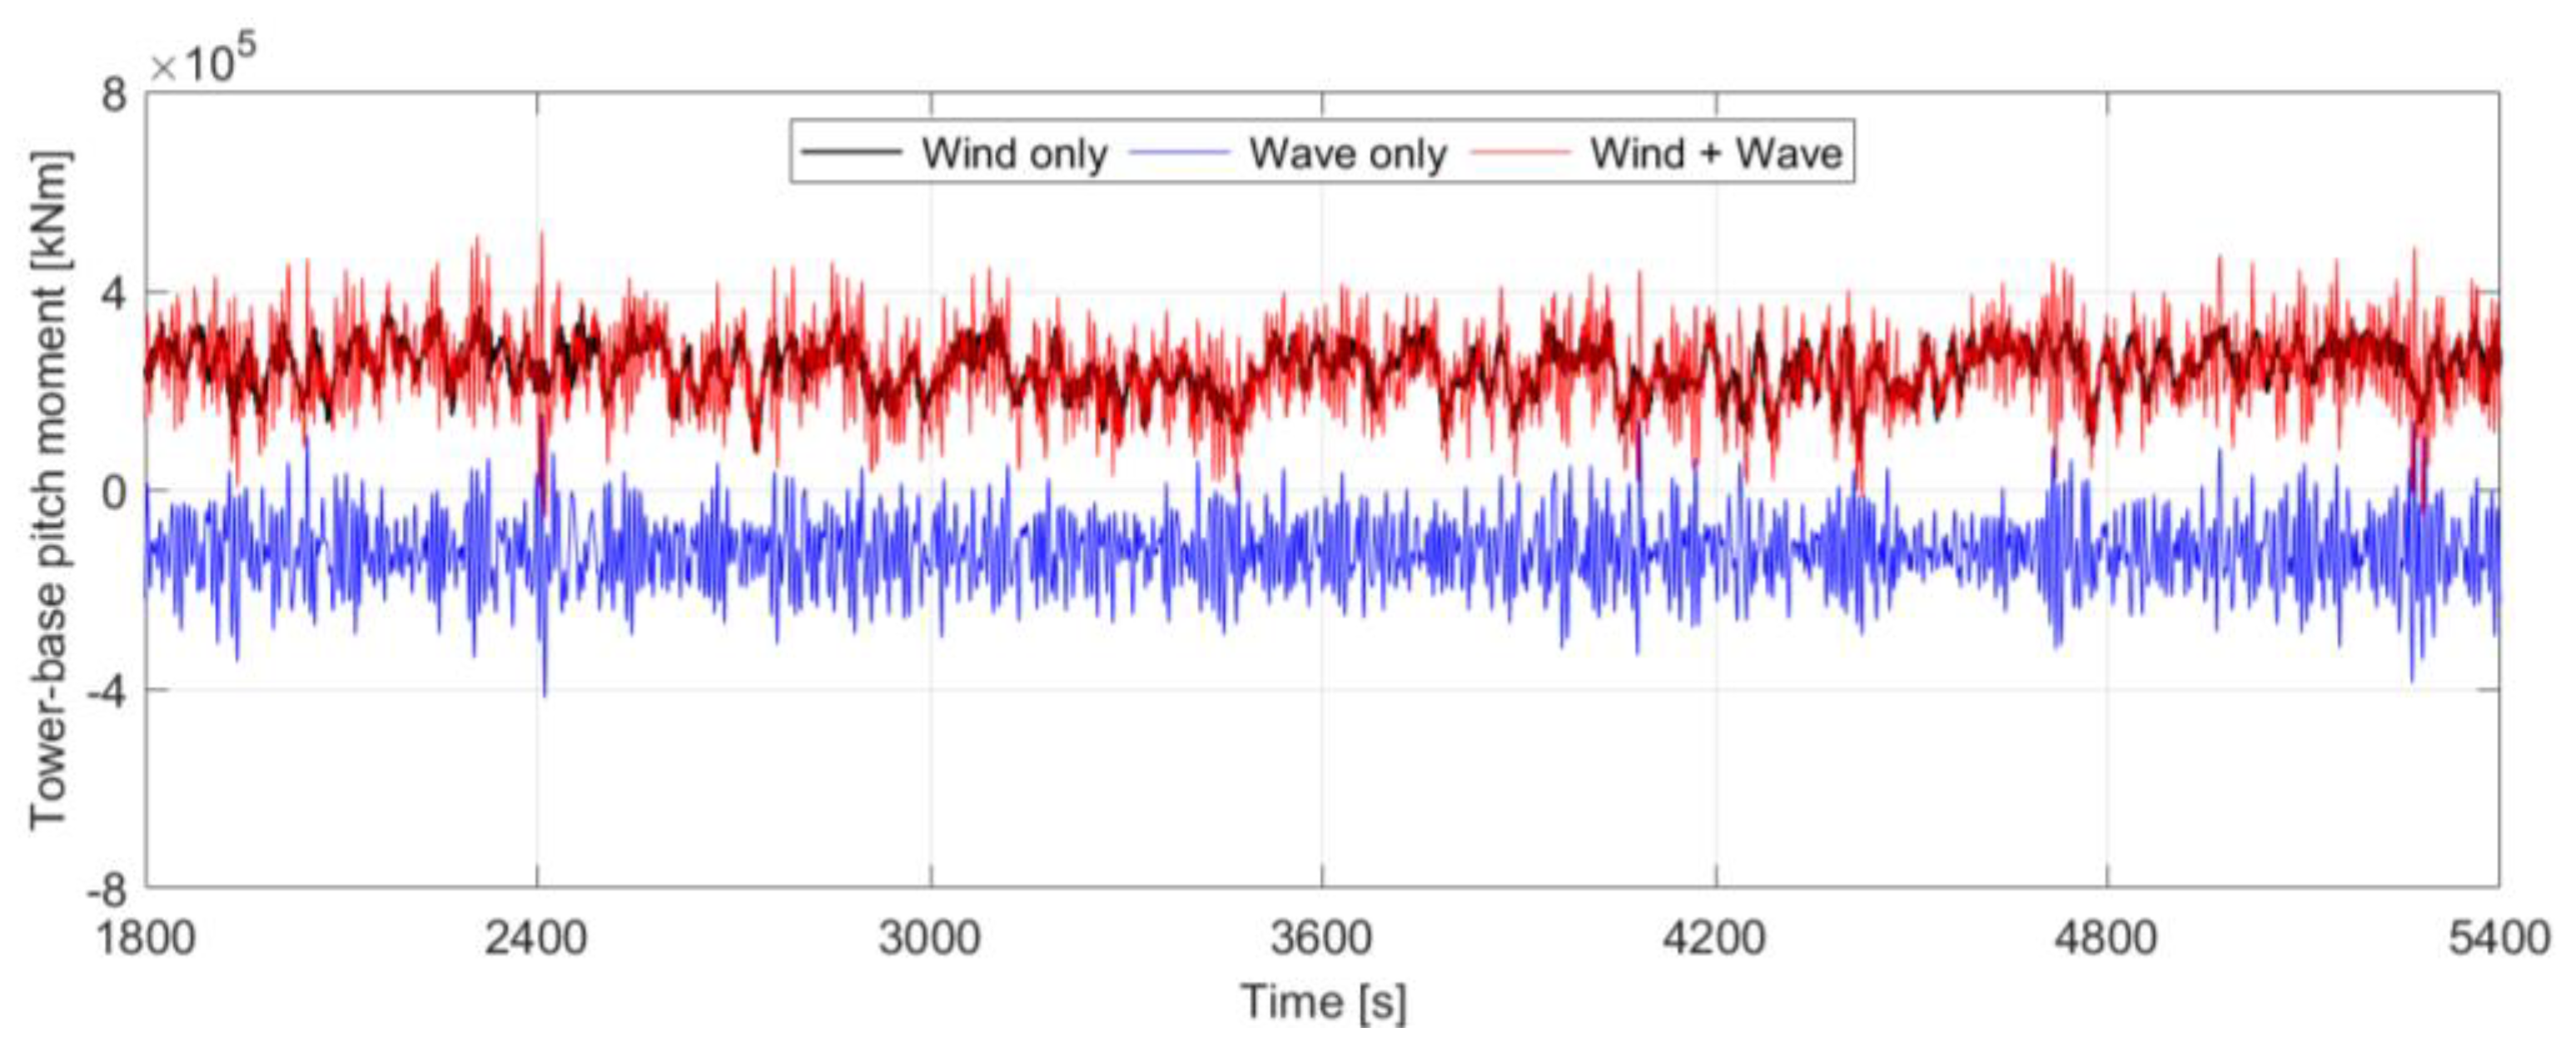
Before analyzing the impact on the wave conditions, the tower-top and tower-base pitch moments when the wind and waves acted individually and when they acted together were compared. Figure 5 and Figure 6 show the time series of the tower-top and tower-base pitch moments for the three specified conditions. The simulation time was 5400 s. The statistical analysis was performed with simulation results of 1 h excluding the transient effect.
In the case of the tower-top pitch moment, the largest moment occurred under the wave-only condition. It shows the smallest moment in the wind and wave conditions mainly due to the aerodynamic damping, which occurs because of the rotor rotation. The mean and standard deviation for the wind-only condition and the wind and wave conditions were similar. This means that the tower-top pitch moment is significantly affected by aerodynamic damping but not by the waves.
In the case of the tower-base pitch moment, the largest moment occurred under the wind and wave conditions. The mean value for the wind-only condition and wind and wave conditions was similar, and that for the standard deviation was different. This means that in contrast to the tower-top pitch moment, the tower-base pitch moment is significantly affected by waves but not by aerodynamic damping. Table 4 summarizes the statistical values of the tower-top and tower-base pitch moments.
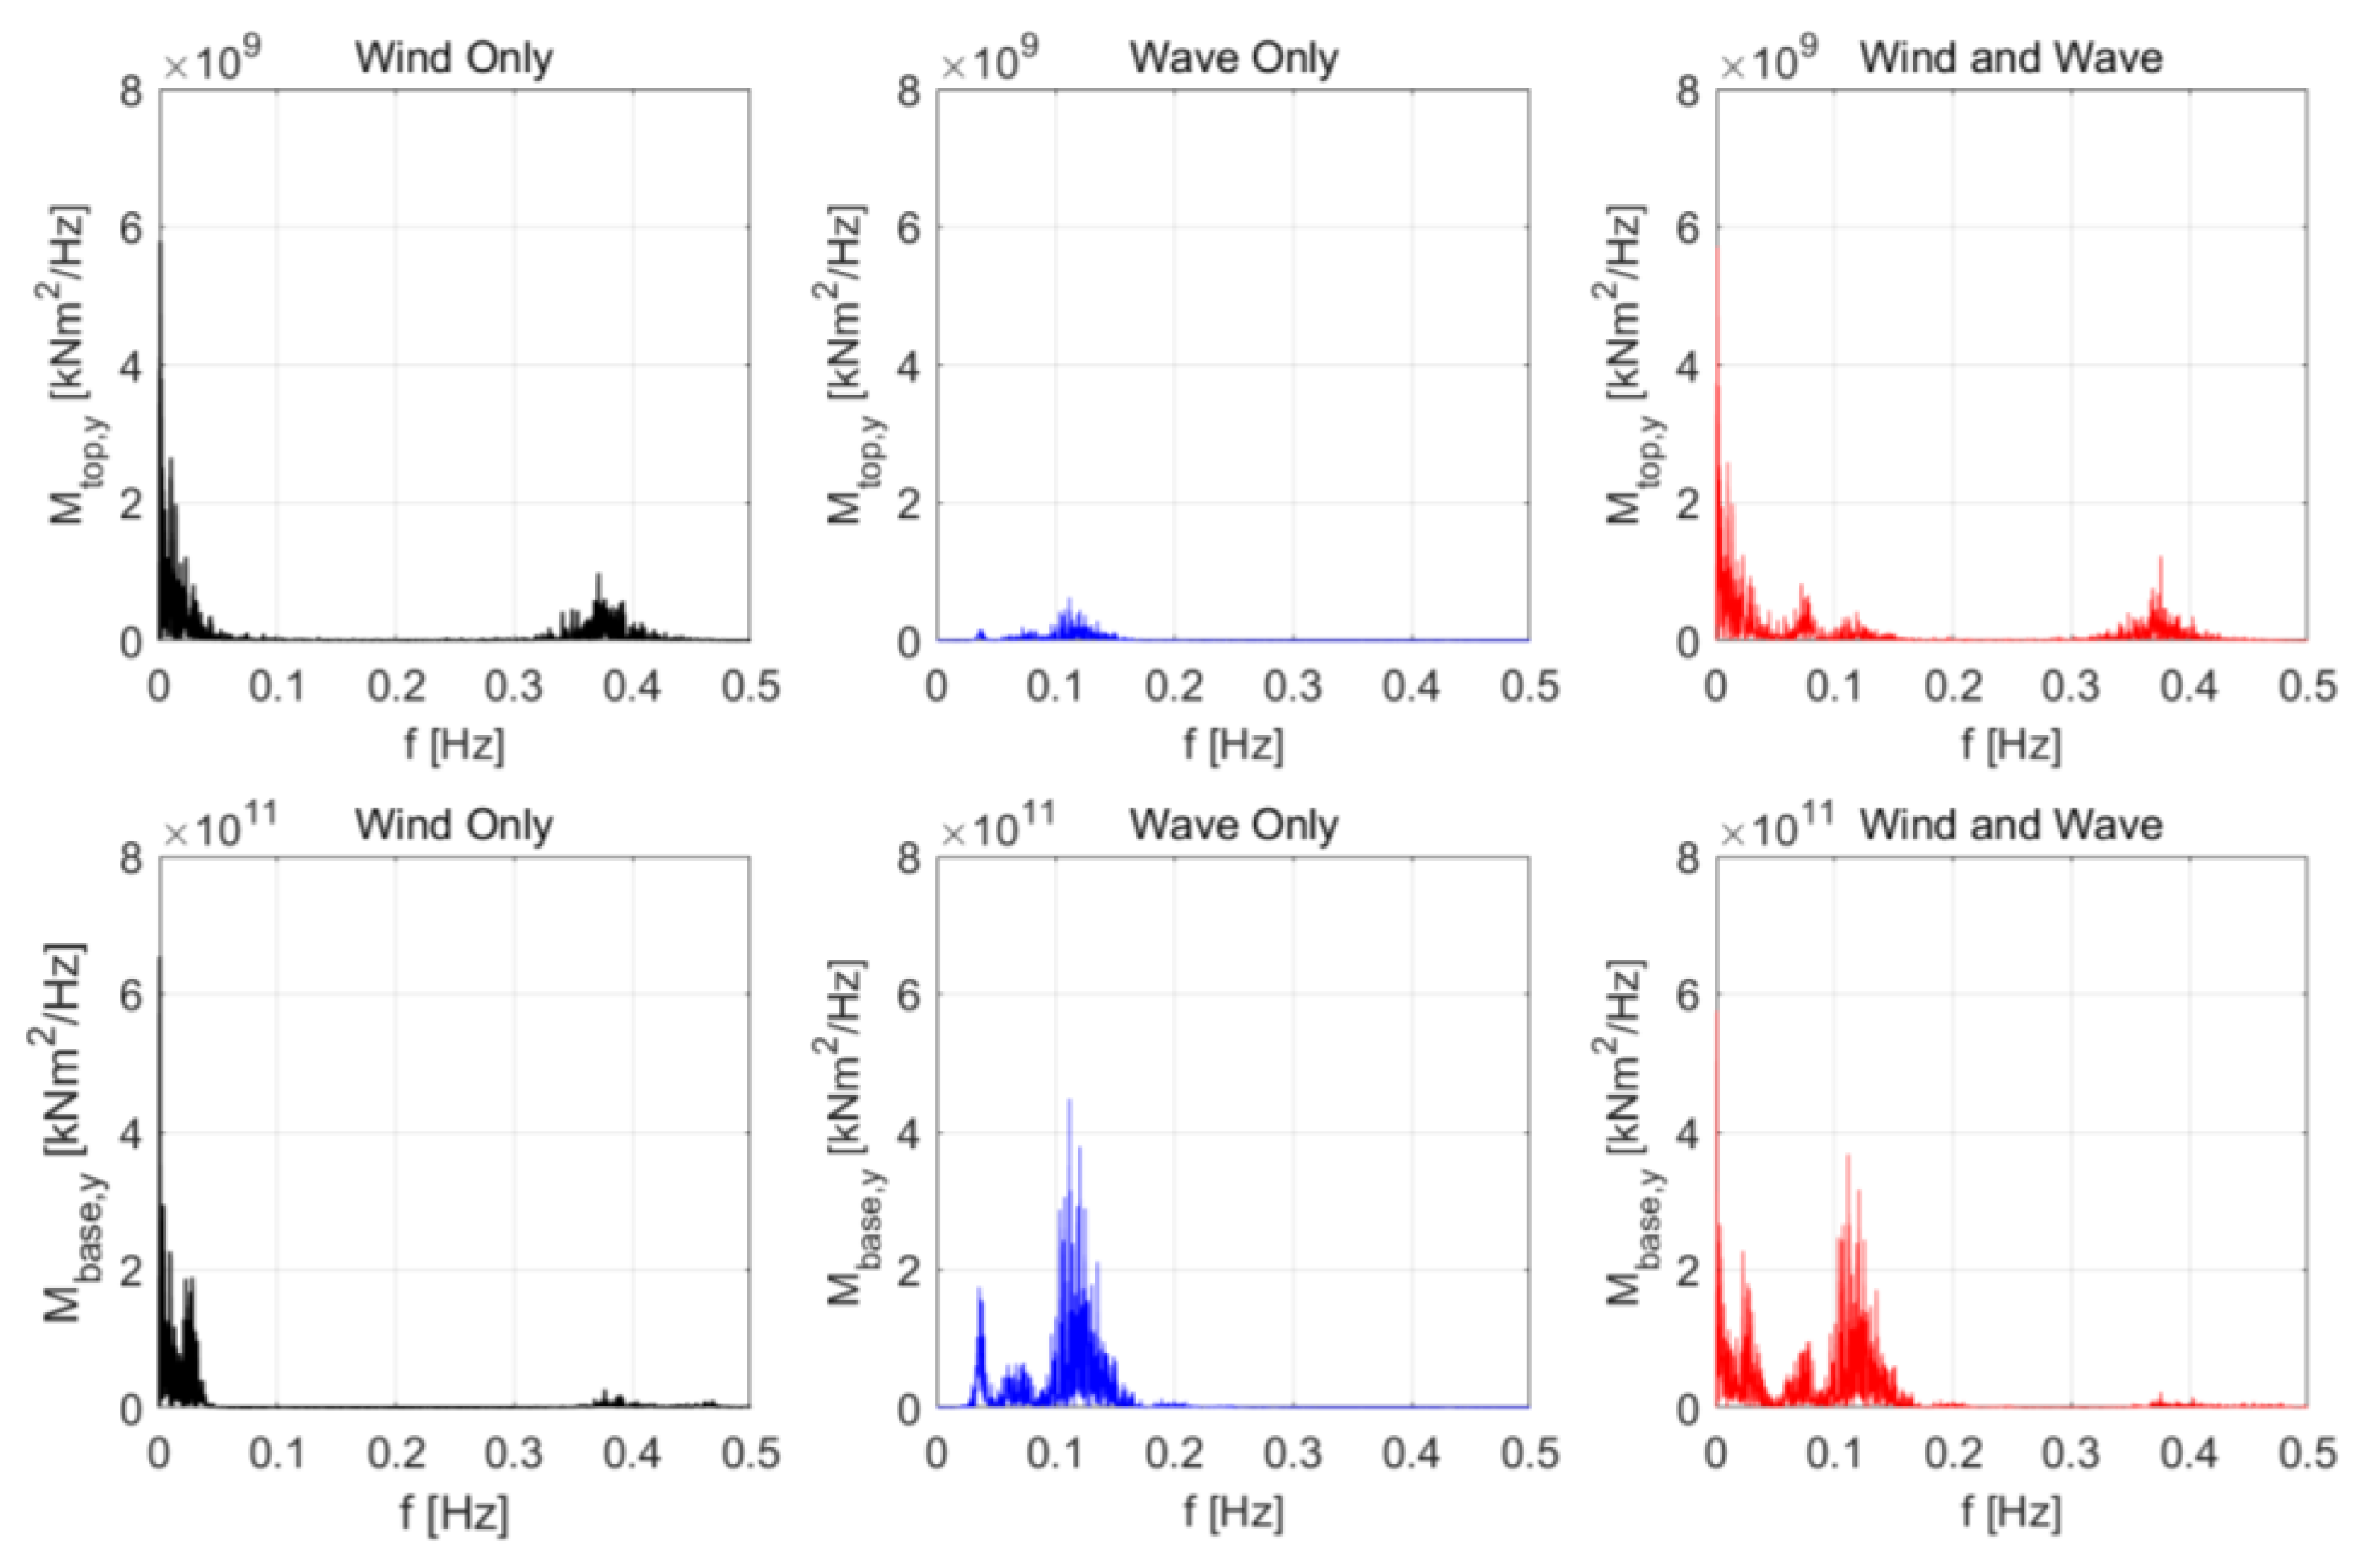
Next, the frequency domain analysis was performed using a fast Fourier transform (FFT). Figure 7 shows the FFT results for the top and base pitch moments of the tower. The impact of waves on the tower-top pitch moment is relatively high, and the impact of waves on the tower-base pitch moment is higher than that of wind. In addition, the wind and wave cases are similar to the sum of the spectra with wind and waves that are applied separately. In particular, a peak occurred near 0.3 to 0.4 Hz at the tower-top pitch moment, and this is the natural frequency of the tower fore–after mode.
3.2. Correlation Analysis
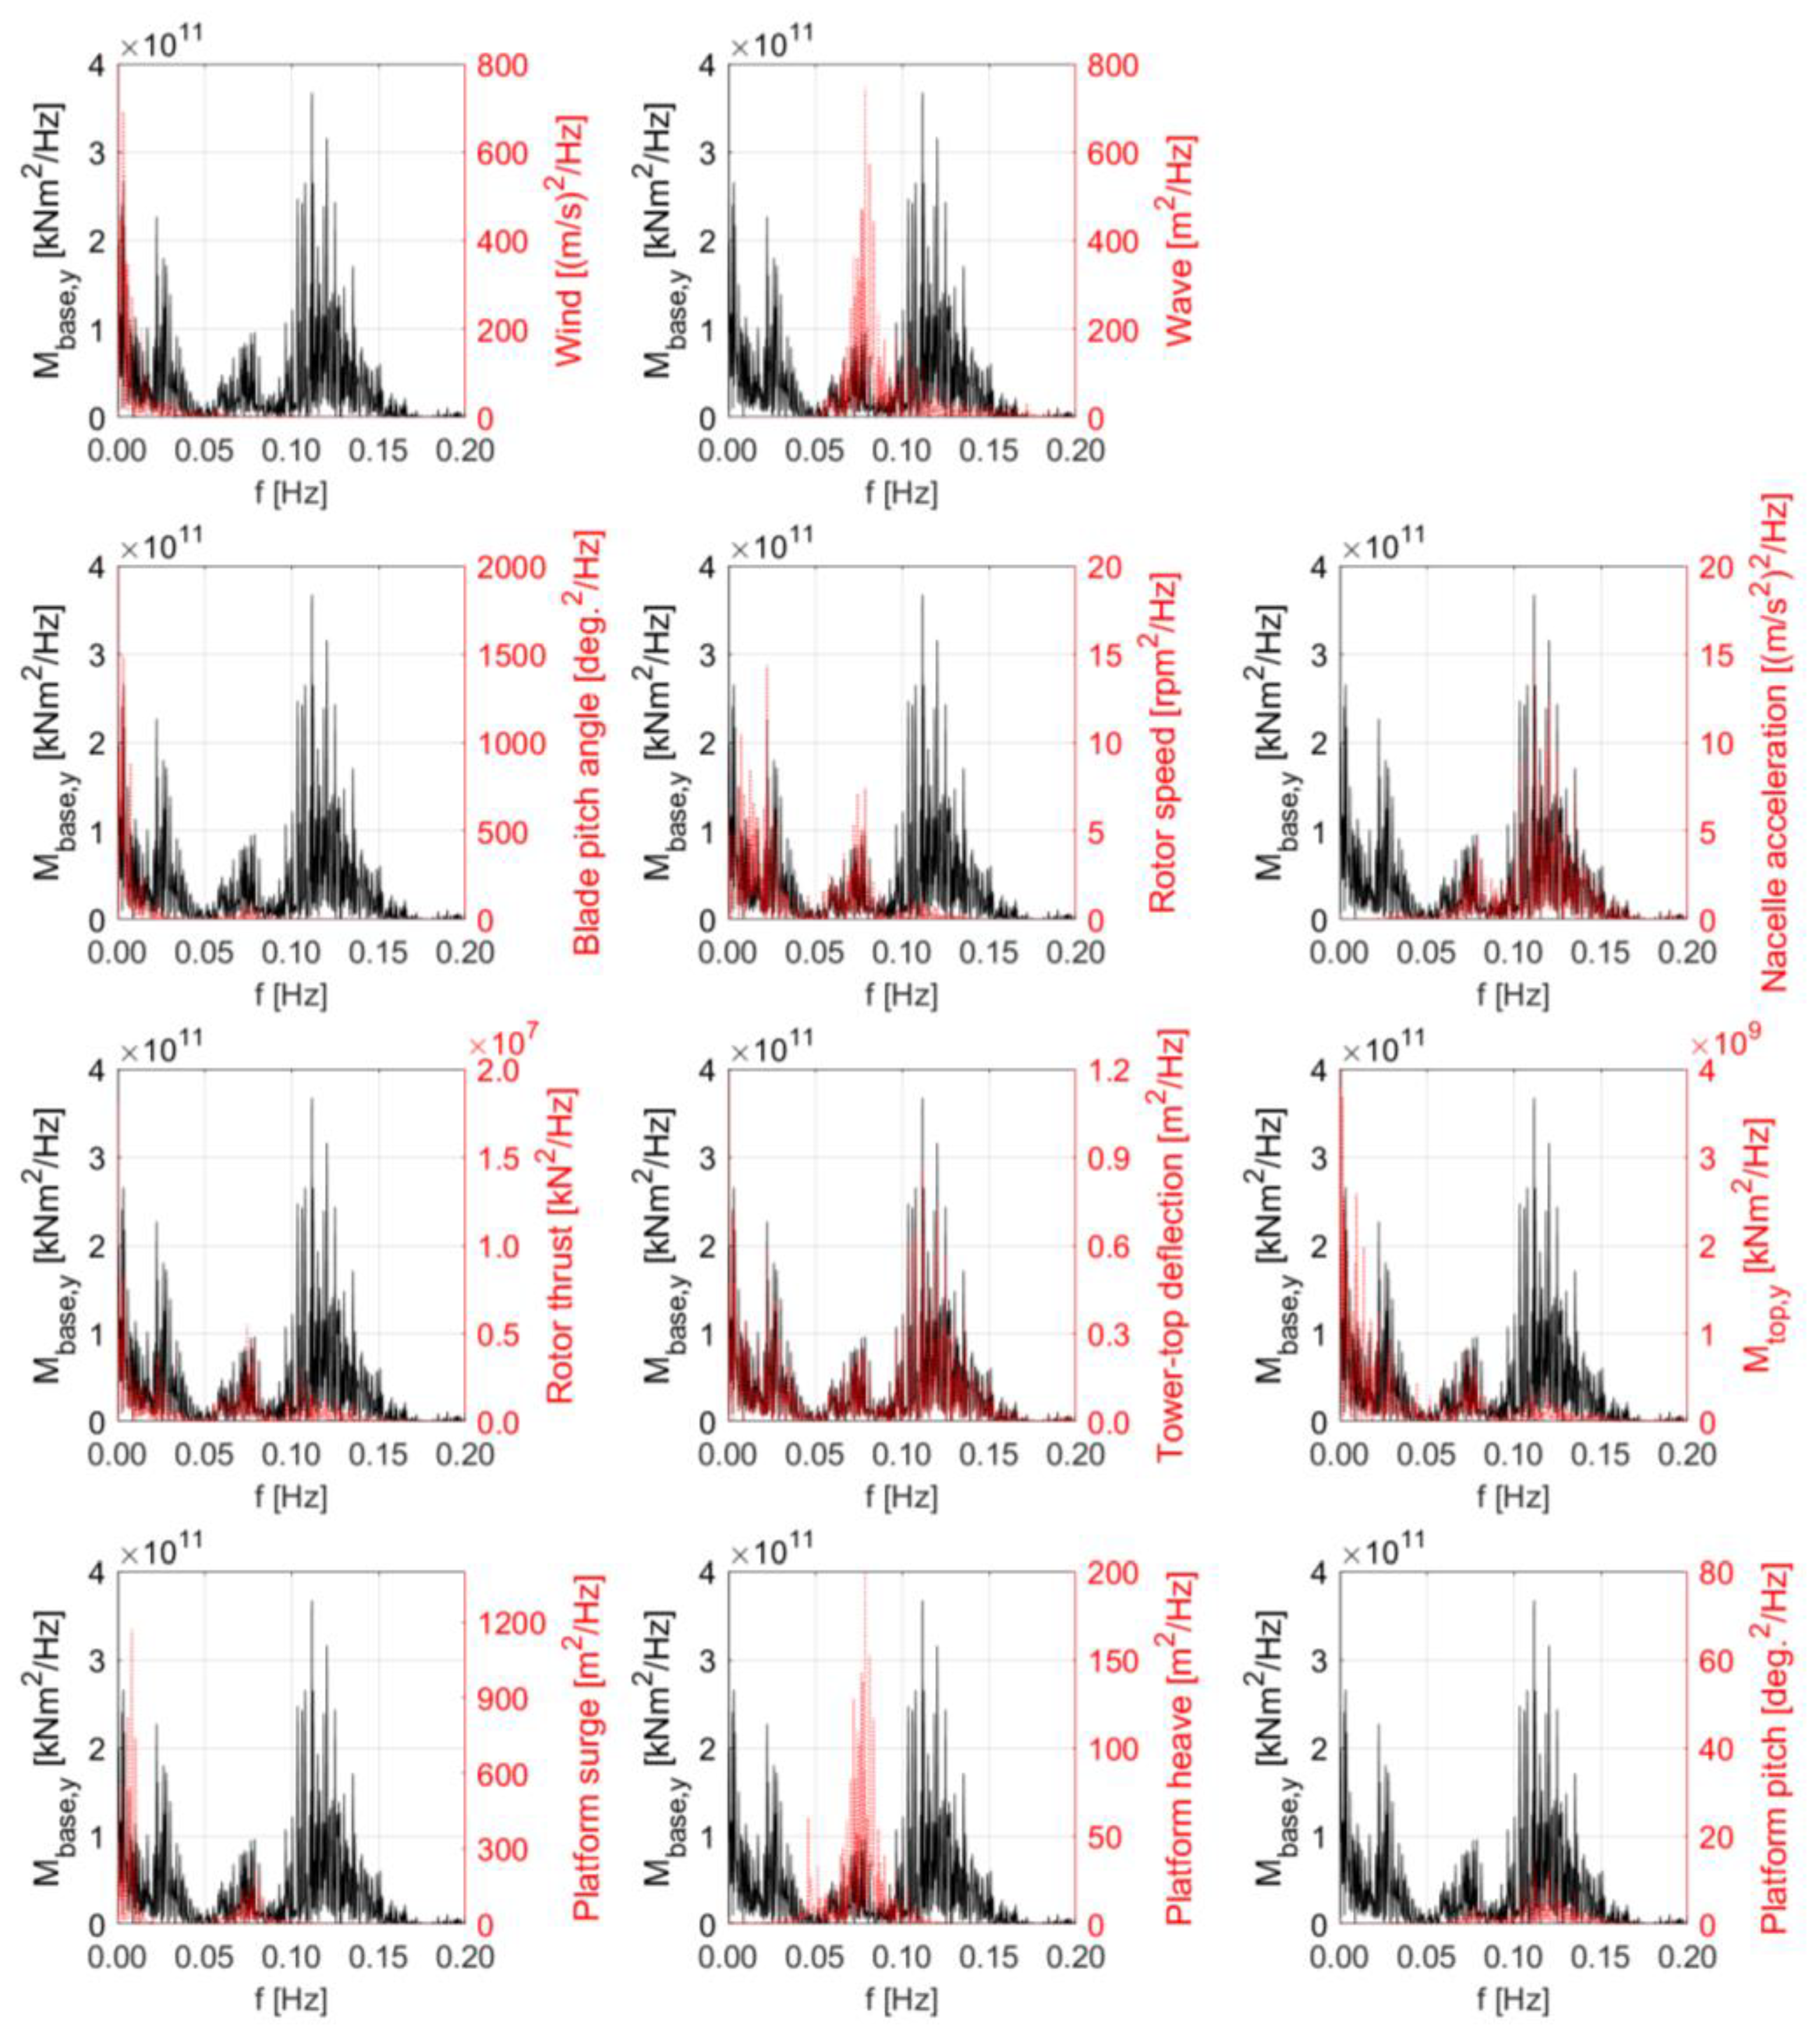
A correlation analysis was performed to determine the parameters with a significant effect on the tower-base pitch moment in the case of both wind and waves. The main parameters mentioned in Section 2.4 are used for the correlation analysis. In this study, because the tower-top and tower-base pitch moments were analyzed according to the wave conditions, a correlation analysis was performed at frequencies less than 0.2 Hz. Figure 8 shows the FFT results between tower-base pitch moment and main output parameters.
Approximately four peaks can be identified in the tower-base pitch moment results at frequencies less than 0.2 Hz. The cause of each peak was identified using the correlation analysis. First, the correlation between external forces, wind and waves, and the tower-base pitch moment was examined. The wind exhibited the highest peak at a low frequency, and waves exhibited the largest peak during the wave peak period (0.076 Hz). Because the tower-base pitch moment also shows a response at the same frequency, the tower-base pitch moment is directly affected by the wind and waves. The blade pitch angle and rotor speed results related to the turbine control system are shown below. Because the control system of the turbine is closely related to the wind, both parameters showed the highest response in the low-frequency region. At the rotor speed, some responses occurred even at the wave frequency. This response appeared because the platform motion caused by the waves was sensed by the nacelle as relative wind speed. Although some responses also occur at wave frequency, the nacelle acceleration shows the largest response around 0.12 Hz. The frequencies around 0.12 Hz also show the largest response even in the tower-base pitch moment, and they do not appear in all main parameter results except for the tower-top deflection result. Equations (1) and (2) show the RNA and tower’s dynamic equilibrium equations and notation. From the equation, it is confirmed that the nacelle acceleration is related to the tower-top deflection, as shown in Equation (1), and that the 0.12 Hz frequency is related to the tower-top deflection.
| Acceleration of the RNA’s CoM (center of mass) | ||
| , | Tower-top and tower-base pitch moments | |
| Time | ||
| Tower length | ||
| RNA’s CoM coordinates w.r.t. tower’s top along the z-axis | ||
| Bending stiffness | ||
| Tower-top acceleration | ||
| Tower-top angular acceleration | ||
| RNA angular acceleration | ||
| , | Tower deflection function, temporal and spatial derivatives |
The results of the rotor thrust and tower-top pitch moment are almost similar, and the response occurs at low frequencies because it is affected by the wind. Further, the response occurs at the wave frequency because of the relative wind speed, and this is similar to the results of the rotor speed. Finally, in the results of the platform motion, the platform surge shows a response at the surge natural frequency and wave frequency, platform heave only at the wave frequency, and platform pitch at a low frequency, pitch natural frequency, and wave frequency. The tower-base is directly connected to the platform. Therefore, the platform motion had a significant impact on the tower-base pitch moments. However, under some wave conditions, the tower-top deflection has a greater impact on the tower-base pitch moment than the platform pitch motion.
3.3. Comparison of Tower-Base Pitch Moment According to Wave Peak Period
The wave conditions in Section 3.1 and Section 3.2 include a significant wave height of 8.0 m and a peak period of 13.1 s. From the results of the frequency analysis of the tower-base pitch moment, it is clear that the impact of the platform pitch motion and tower-top deflection is significant. Therefore, in this section, the tower-base pitch moment is examined according to the change in wave peak period. The wave frequency was divided into equal intervals, and a short wave of approximately 6–28 s, which is the natural period of the platform pitch motion, was analyzed. Because only the wave peak period is compared, the significant wave height is fixed. Table 5 summarizes the wave peak periods and frequencies for difference cases in this section.
Figure 9 shows the FFT results of tower-base pitch moments and waves according to wave peak periods presented in Table 5. For a fair comparison, identical boundaries of the y axis were set.
For wave peak periods longer than 10 s, a small peak is observed in the tower-base pitch moment at the wave frequency. By referring to the results for the period of 13.1 s shown in the previous section, detailed peaks were identified. On the other hand, for a wave peak period of less than 10 s, the peak near 0.12 Hz gradually increases and the total tower-base pitch moment also increases. The total tower-base pitch moment is an area that indicates the integration over the entire frequency range. This is because the frequency of the tower-top deflection and the wave frequency tend to become closer. The period wherein the peak and total tower-base pitch moment are the largest is 8 s, and they decrease again in the wave peak period of less than 8 s. Figure 10 shows the total tower-base pitch moment and normalized value per wave peak frequencies, which are divided by the results for the frequency of 0.076 Hz indicated by the red bar in Figure 10.
The total tower-base pitch moment increased with the wave frequency, and it decreased again below 0.124 Hz. In particular, because 0.036 Hz is the natural period of the platform pitch motion, the total tower-base pitch moment is slightly greater than the result for the frequency of 0.044 Hz. According to the normalized value results, as the wave frequency increases, the total tower-base pitch moment is doubled. However, considering that the significant wave height used in this analysis is 8.5 m, the wave frequency with more than twice the total tower-base pitch moment appears infrequently. However, because this moment does not occur at all thereafter, an analysis of some of the frequencies causing resonance such as the natural frequencies of the platform motion, rotor-passing frequencies (1P and 3P), and tower-top deflection is necessary for the tower design.
3.4. Comparison of the Tower-Base Pitch Moment According to Significant Wave Height
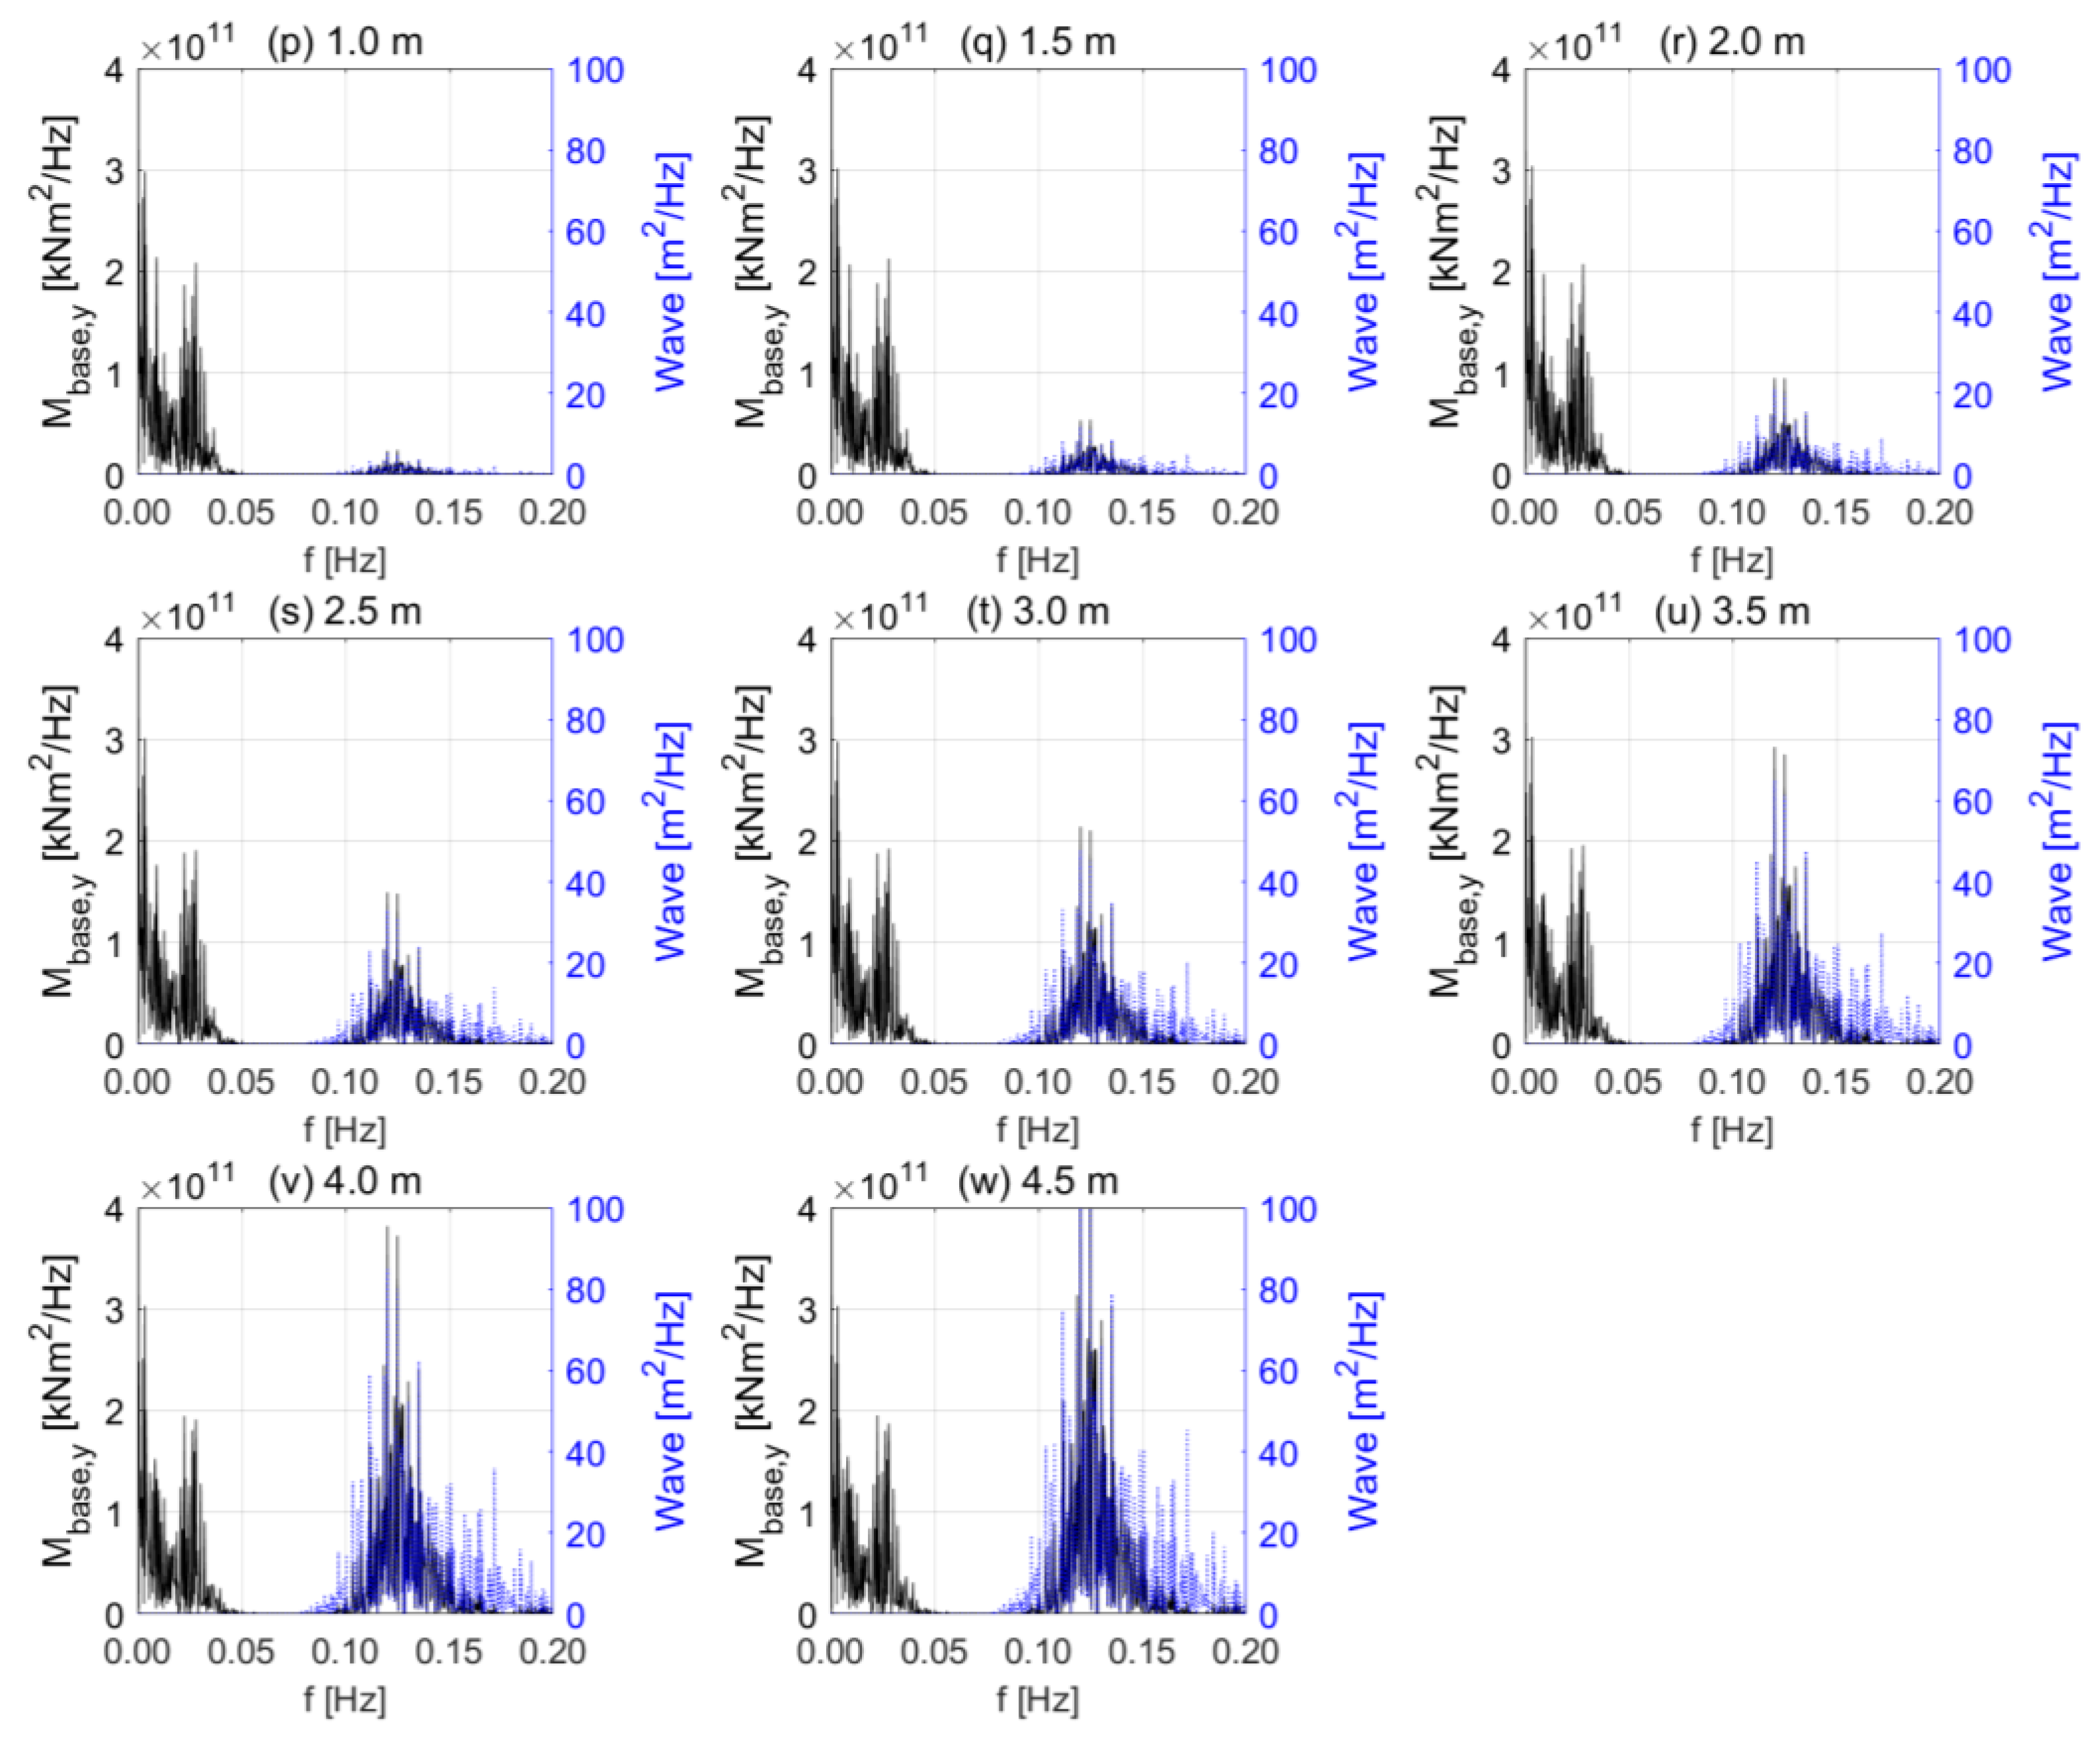
In the previous section, the highest total tower-base pitch moment is generated in the wave condition of 8.07 s with a significant wave height of 8.5 m. Therefore, in this section, the impact of significant wave height is analyzed for the wave peak period where the total tower-base pitch moment is the largest. A wave period of approximately 8 s often occurs, even in real seas. Thus, a detailed review is necessary. Even in the design load cases presented in the Definition of the UMaine VolturnUS-S Reference Platform, a majority of the wave peak periods are 7 to 9 s and the significant wave heights are 1.0 to 4.5 m, used in DLC1.1 and 1.3. Therefore, the significant wave height is divided into equal intervals, and a low wave of about 1.0 m to about 4.5 m is analyzed. Because only the significant wave heights are compared, the wave peak period is fixed for now. Table 6 summarizes the significant wave heights for different cases in this section, and Figure 11 shows the FFT results of tower-base pitch moments and waves according to significant wave height presented in Table 6. For a fair comparison, identical boundaries of y axis were set.
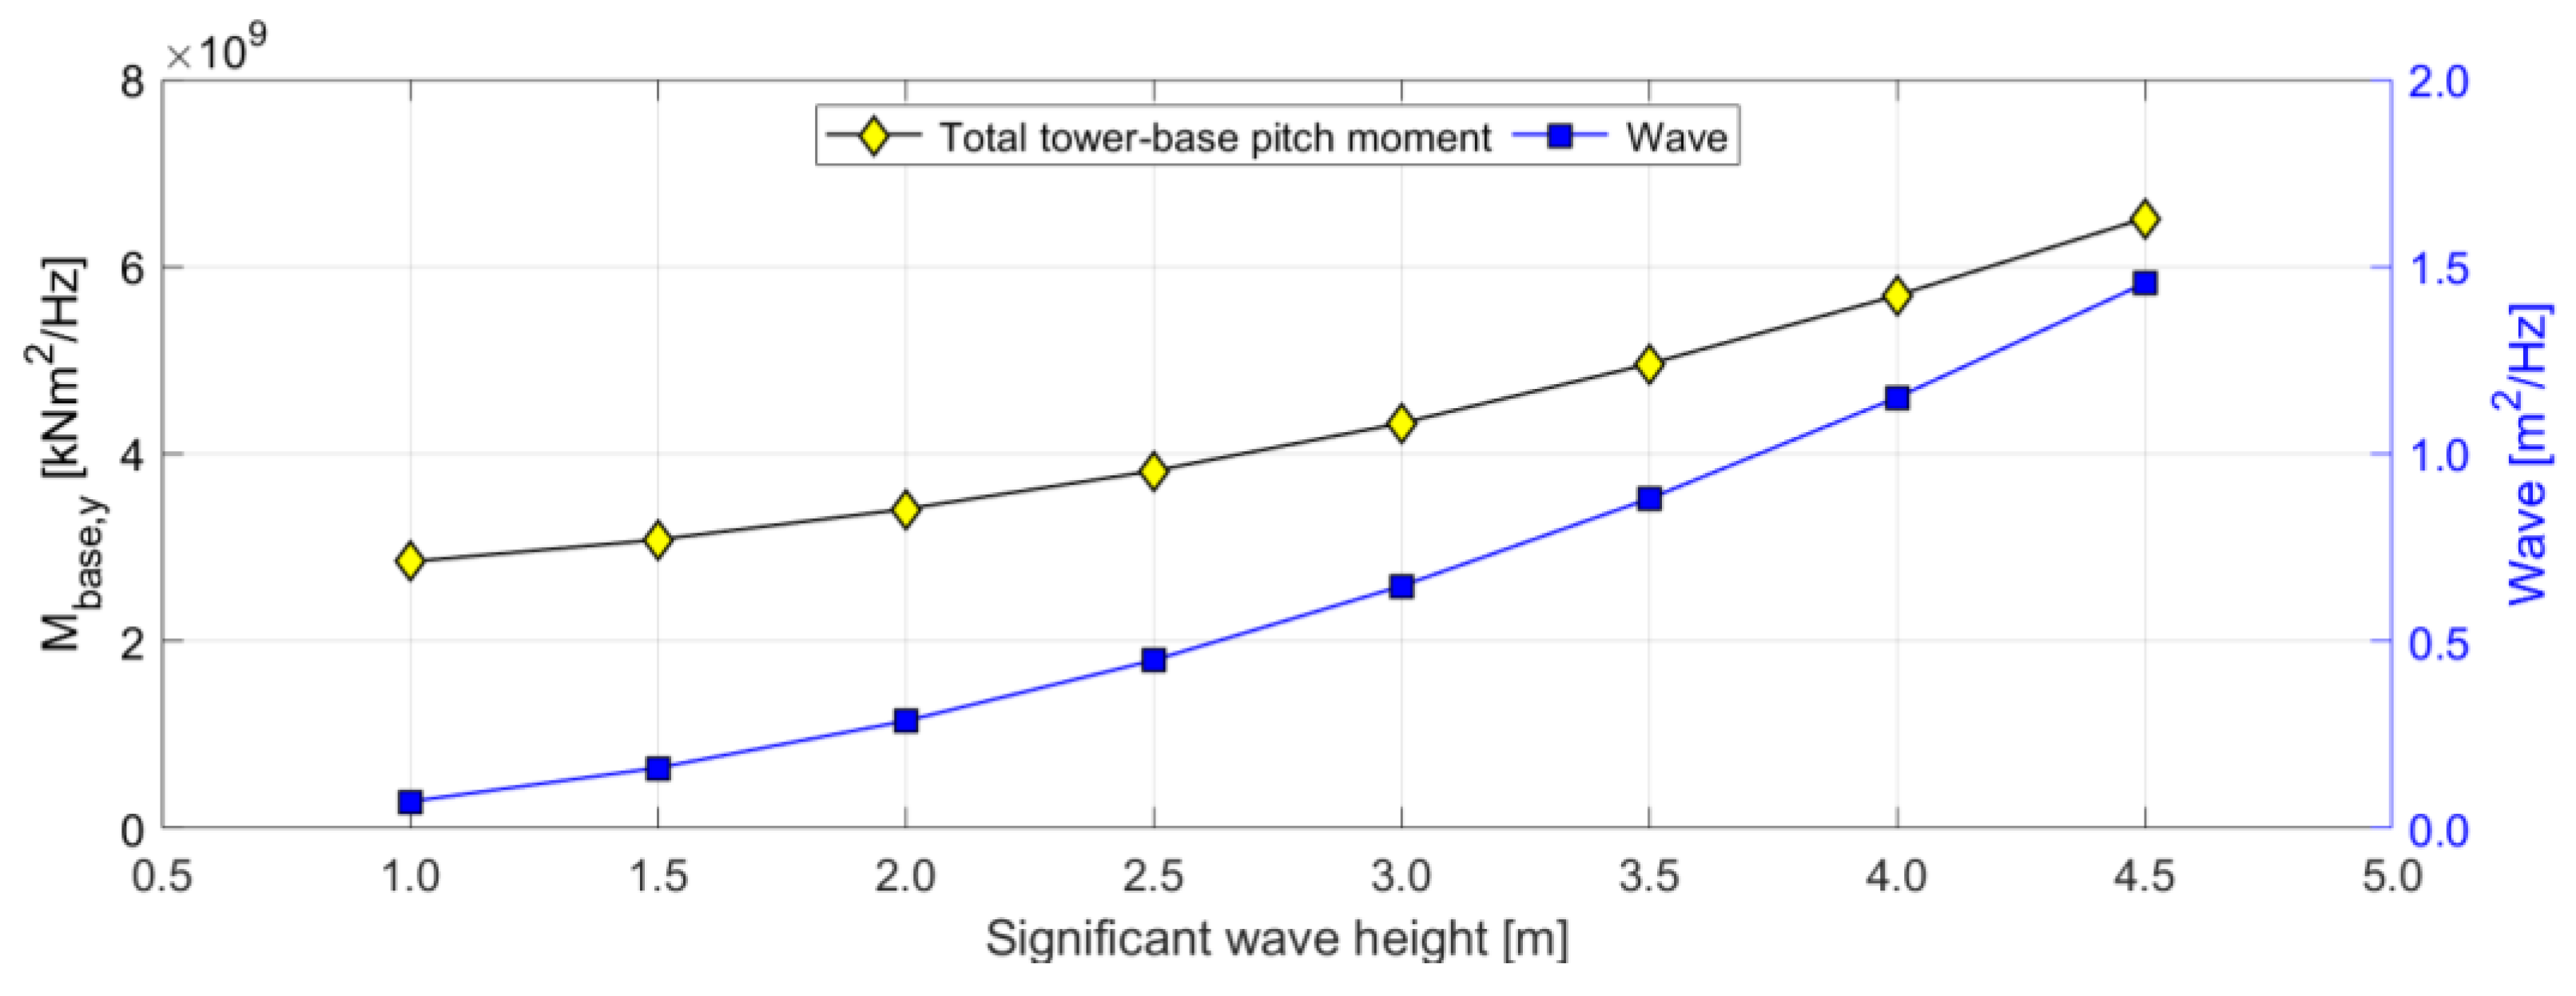
The total tower-base pitch moment and wave spectral energy increased with the significant wave height. In particular, the peak near 0.12 Hz in the tower-base pitch moment is low when the significant wave height is less than 2 m. However, as the significant wave height increases, a large peak occurs at a frequency of approximately 0.12 Hz. On the other hand, at low frequencies, the total tower-base pitch moments were almost the same for all conditions. This means that the significant wave height does not have a significant impact on the low frequency, but it affects the frequency of the tower-top deflection. Figure 12 shows the total tower-base pitch moment and wave spectral energy as values for each significant wave height. As confirmed previously, the total tower-base pitch moment and wave spectral energy increased with the significant wave height. However, because the total tower-base pitch moment in the low-frequency region was almost the same for all conditions, the increase in the tower-base pitch moment was only due to the tower-top deflection around 0.12 Hz.
3.5. Comparison of the Normal Sea State and Severe Sea State
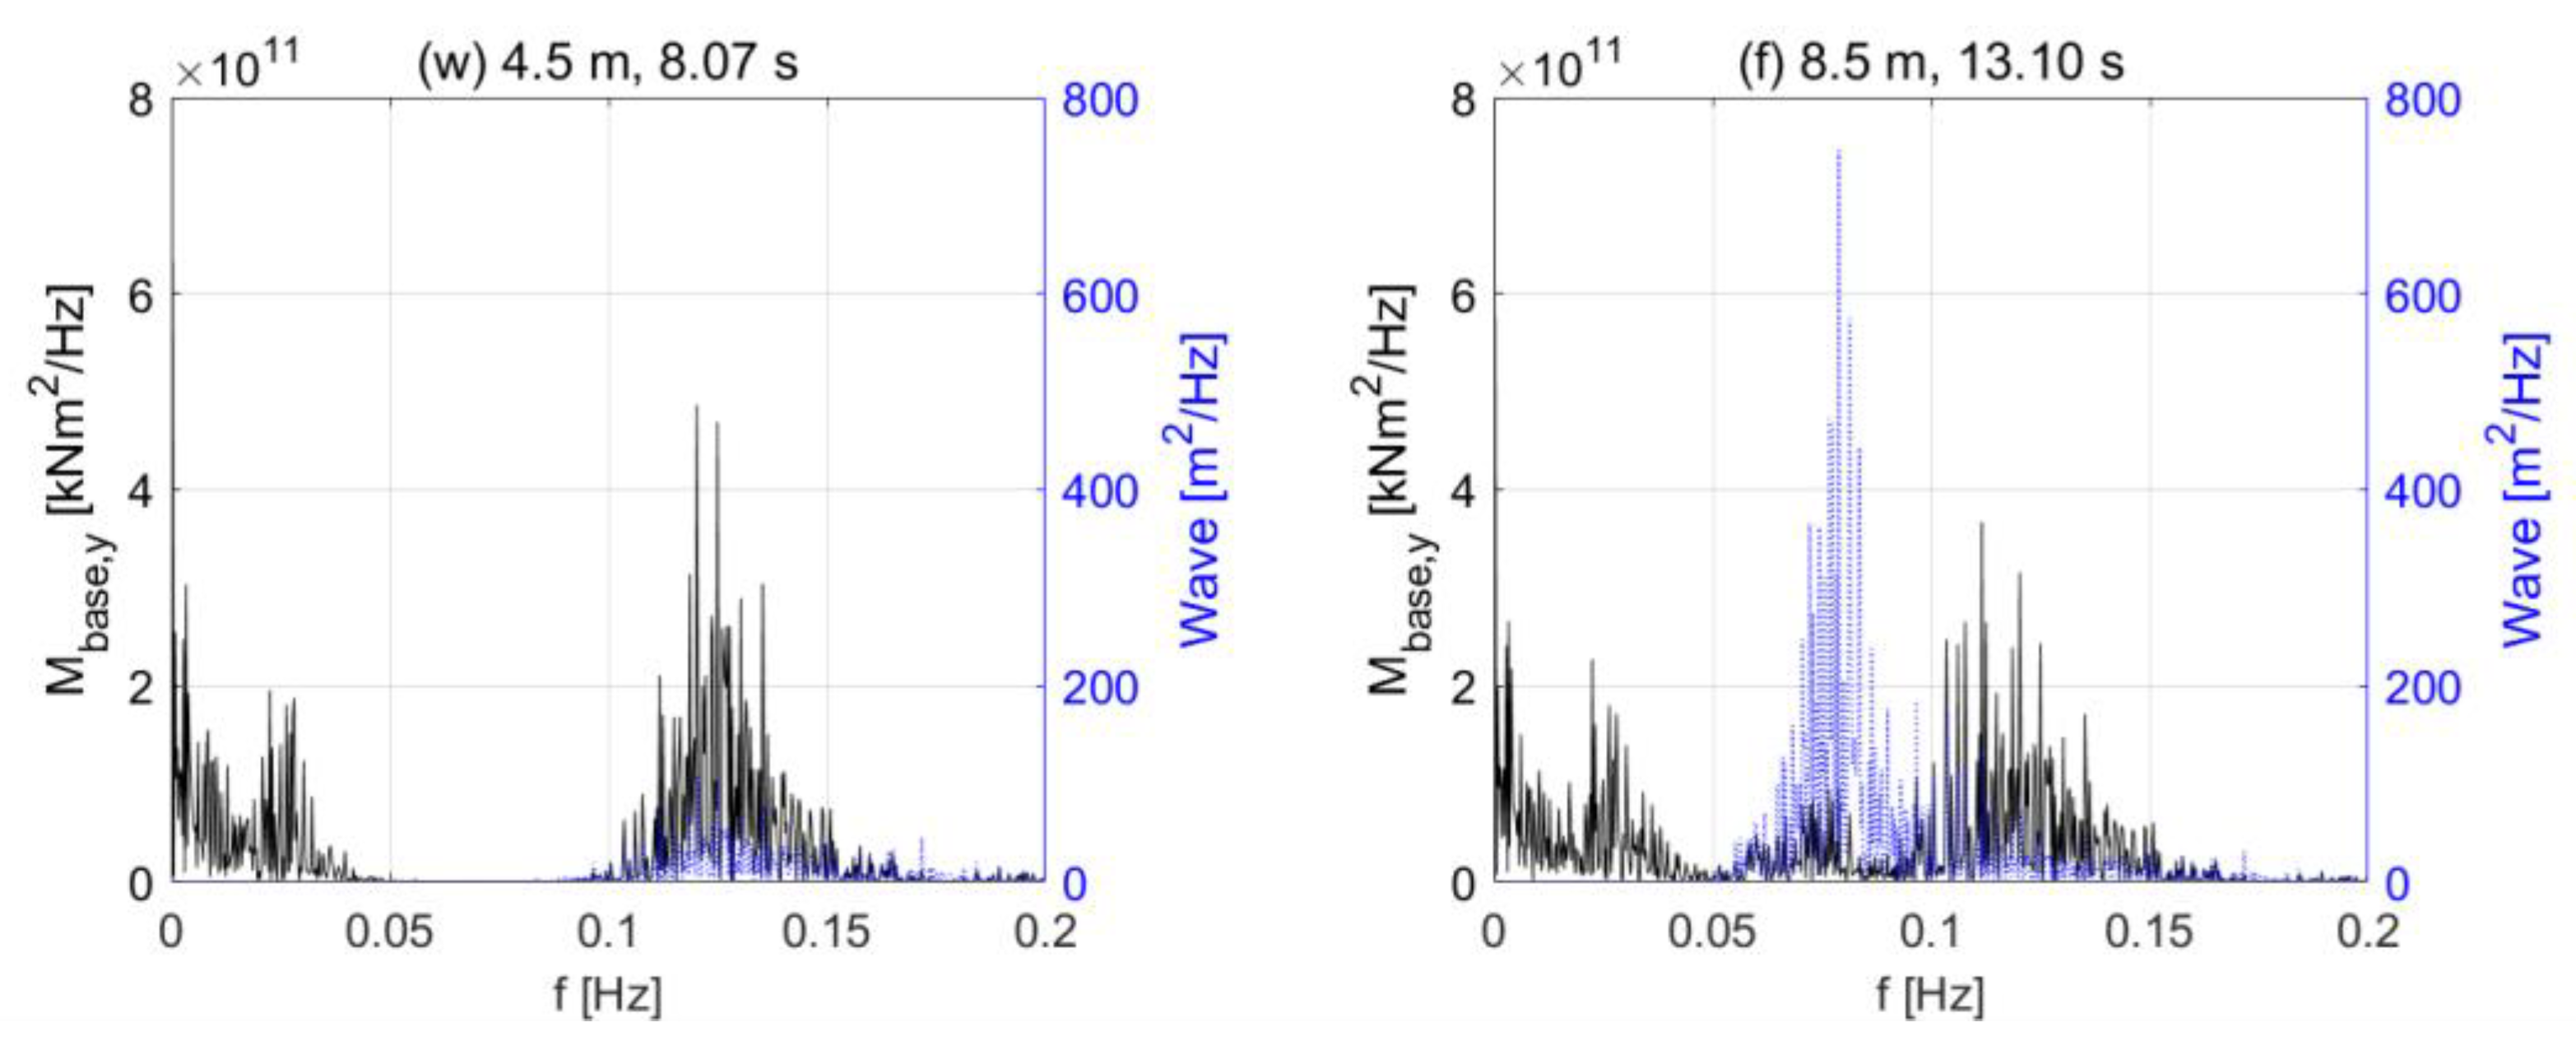
Among the design load cases of IEC61400-3-2, the evaluation using DLC1.1 reveals that the wave condition is a normal sea state (NSS), and that using DLC1.6 revealed that the wave condition is a severe sea state (SSS). In this section, by referring to the Definition of the UMaine VolturnUS-S Reference Platform, the results are compared by applying the NSS and SSS wave conditions to analyze the impact on the tower-base pitch moment. Table 7 summarizes the two sea conditions compared in this section. The two wave conditions are most similar to those in the Definition of the UMaine VolturnUS-S Reference Platform; in other words, they are the valid wave conditions used in the load analysis.
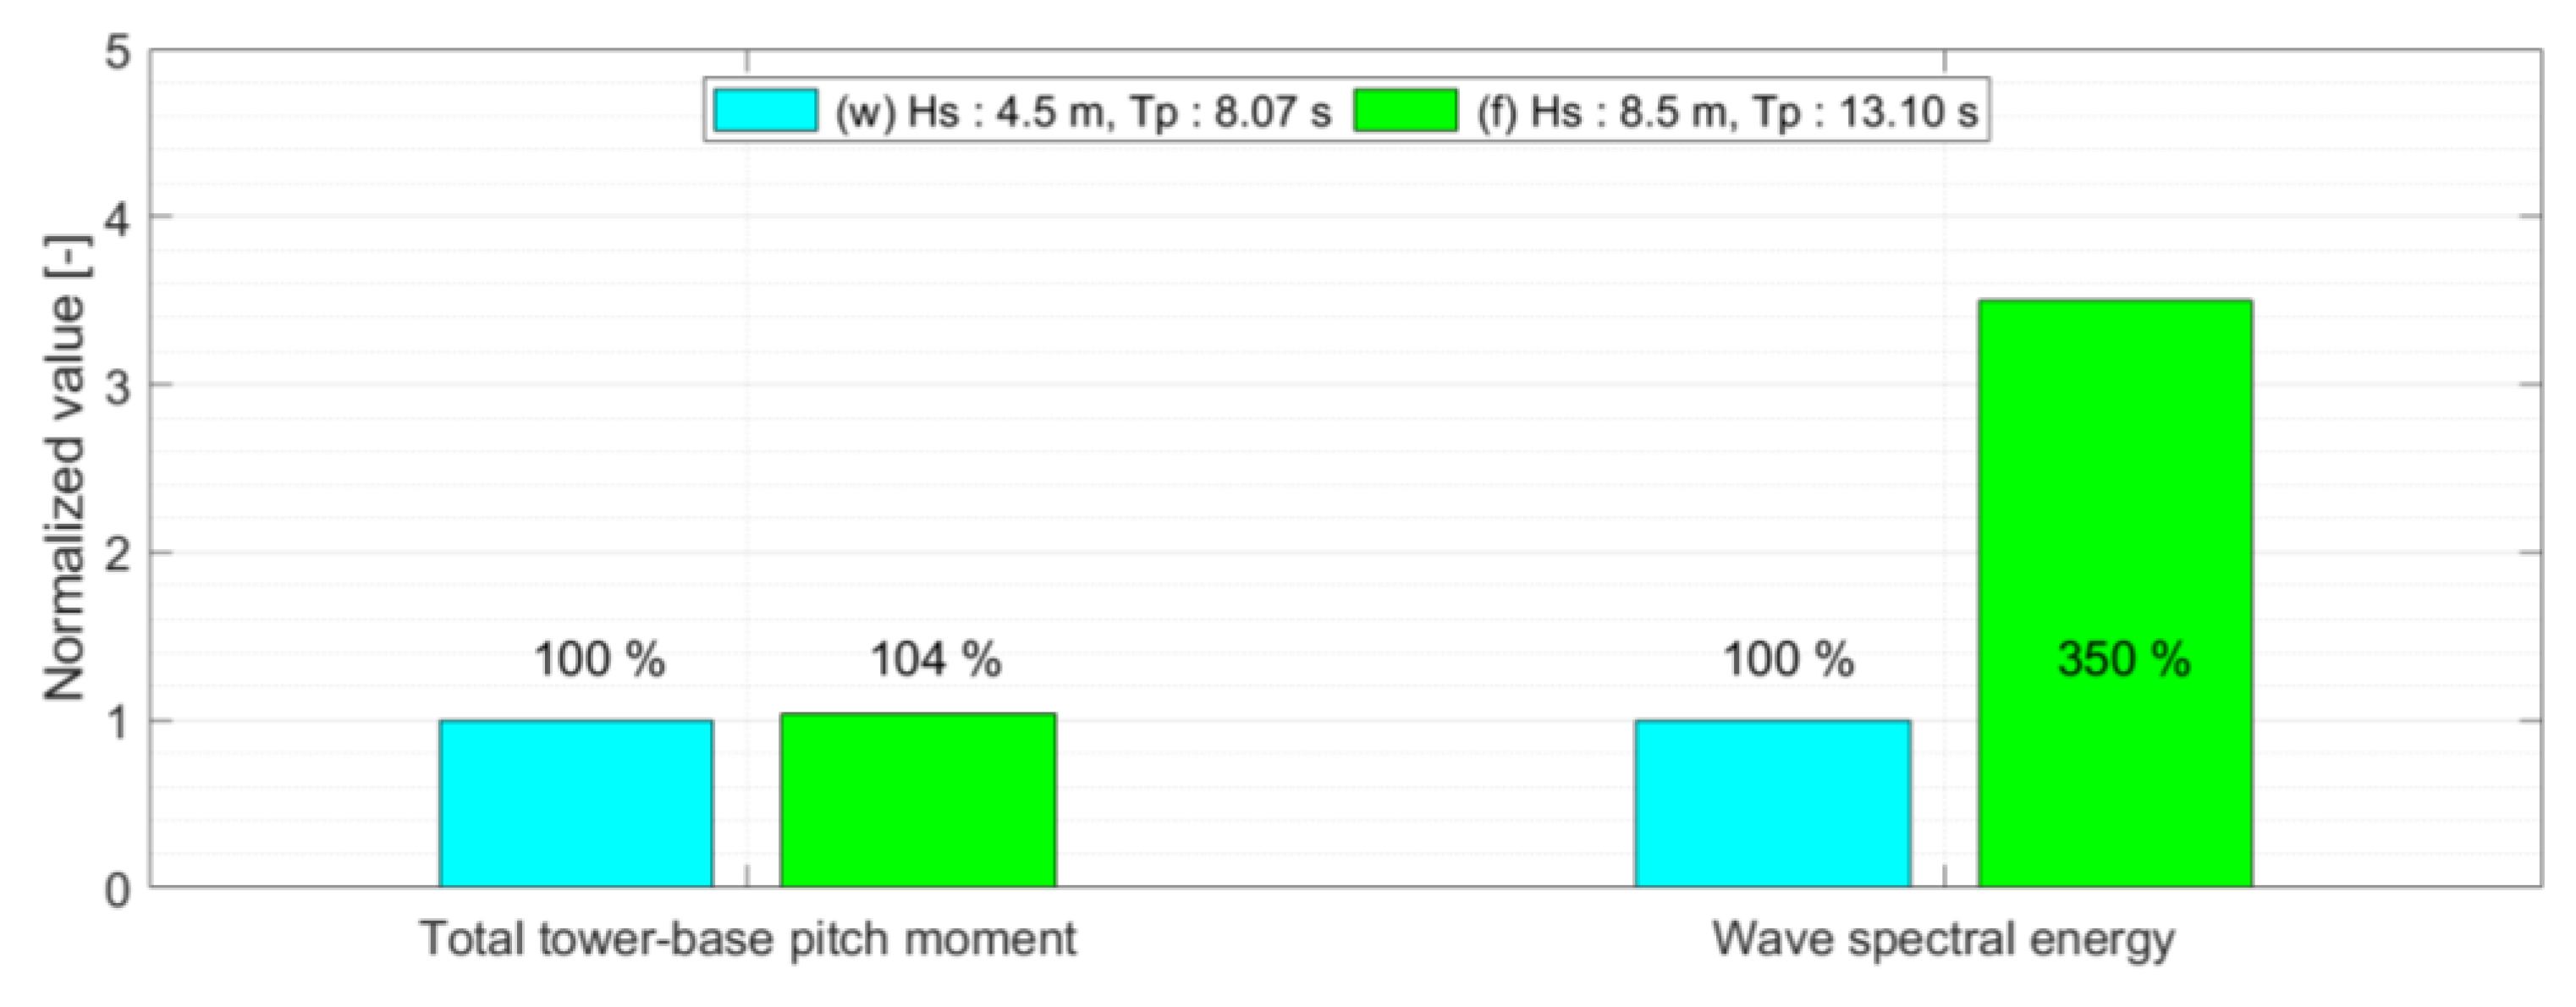
Figure 13 shows FFT results of tower-base pitch moments and waves according to sea conditions summarized in Table 7, and Figure 14 shows the normalized value that is obtained by dividing the total tower-base pitch moment and wave spectral energy under the condition that the significant wave height is 4.5 m for direct comparison of the two conditions. In Figure 13, the total tower-base pitch moment appears almost identical. When the wave peak period was 13.1 s, the response of the tower-base pitch moment appeared even at the wave frequency. Under the condition that the wave peak period is 8.07 s, the tower-top deflection frequency and wave frequency are the same and, thus, the response of the tower-base pitch moment is excited even at a relatively small wave height. The responses of the tower-base pitch moment in the low-frequency region were almost similar for the two conditions. In Figure 14, the wave spectral energy differs by a factor of approximately 2.5 for the two conditions. However, in the case of the total tower-base pitch moment, a mere difference of approximately 4% was observed. In other words, the floating offshore wind turbine system used in the analysis indicates that even under normal sea state conditions with a wave peak period of 8 s, the total tower-base pitch moment is similar to that under severe sea state conditions.
3.6. Tower Redesign by Changing Tower Diameter
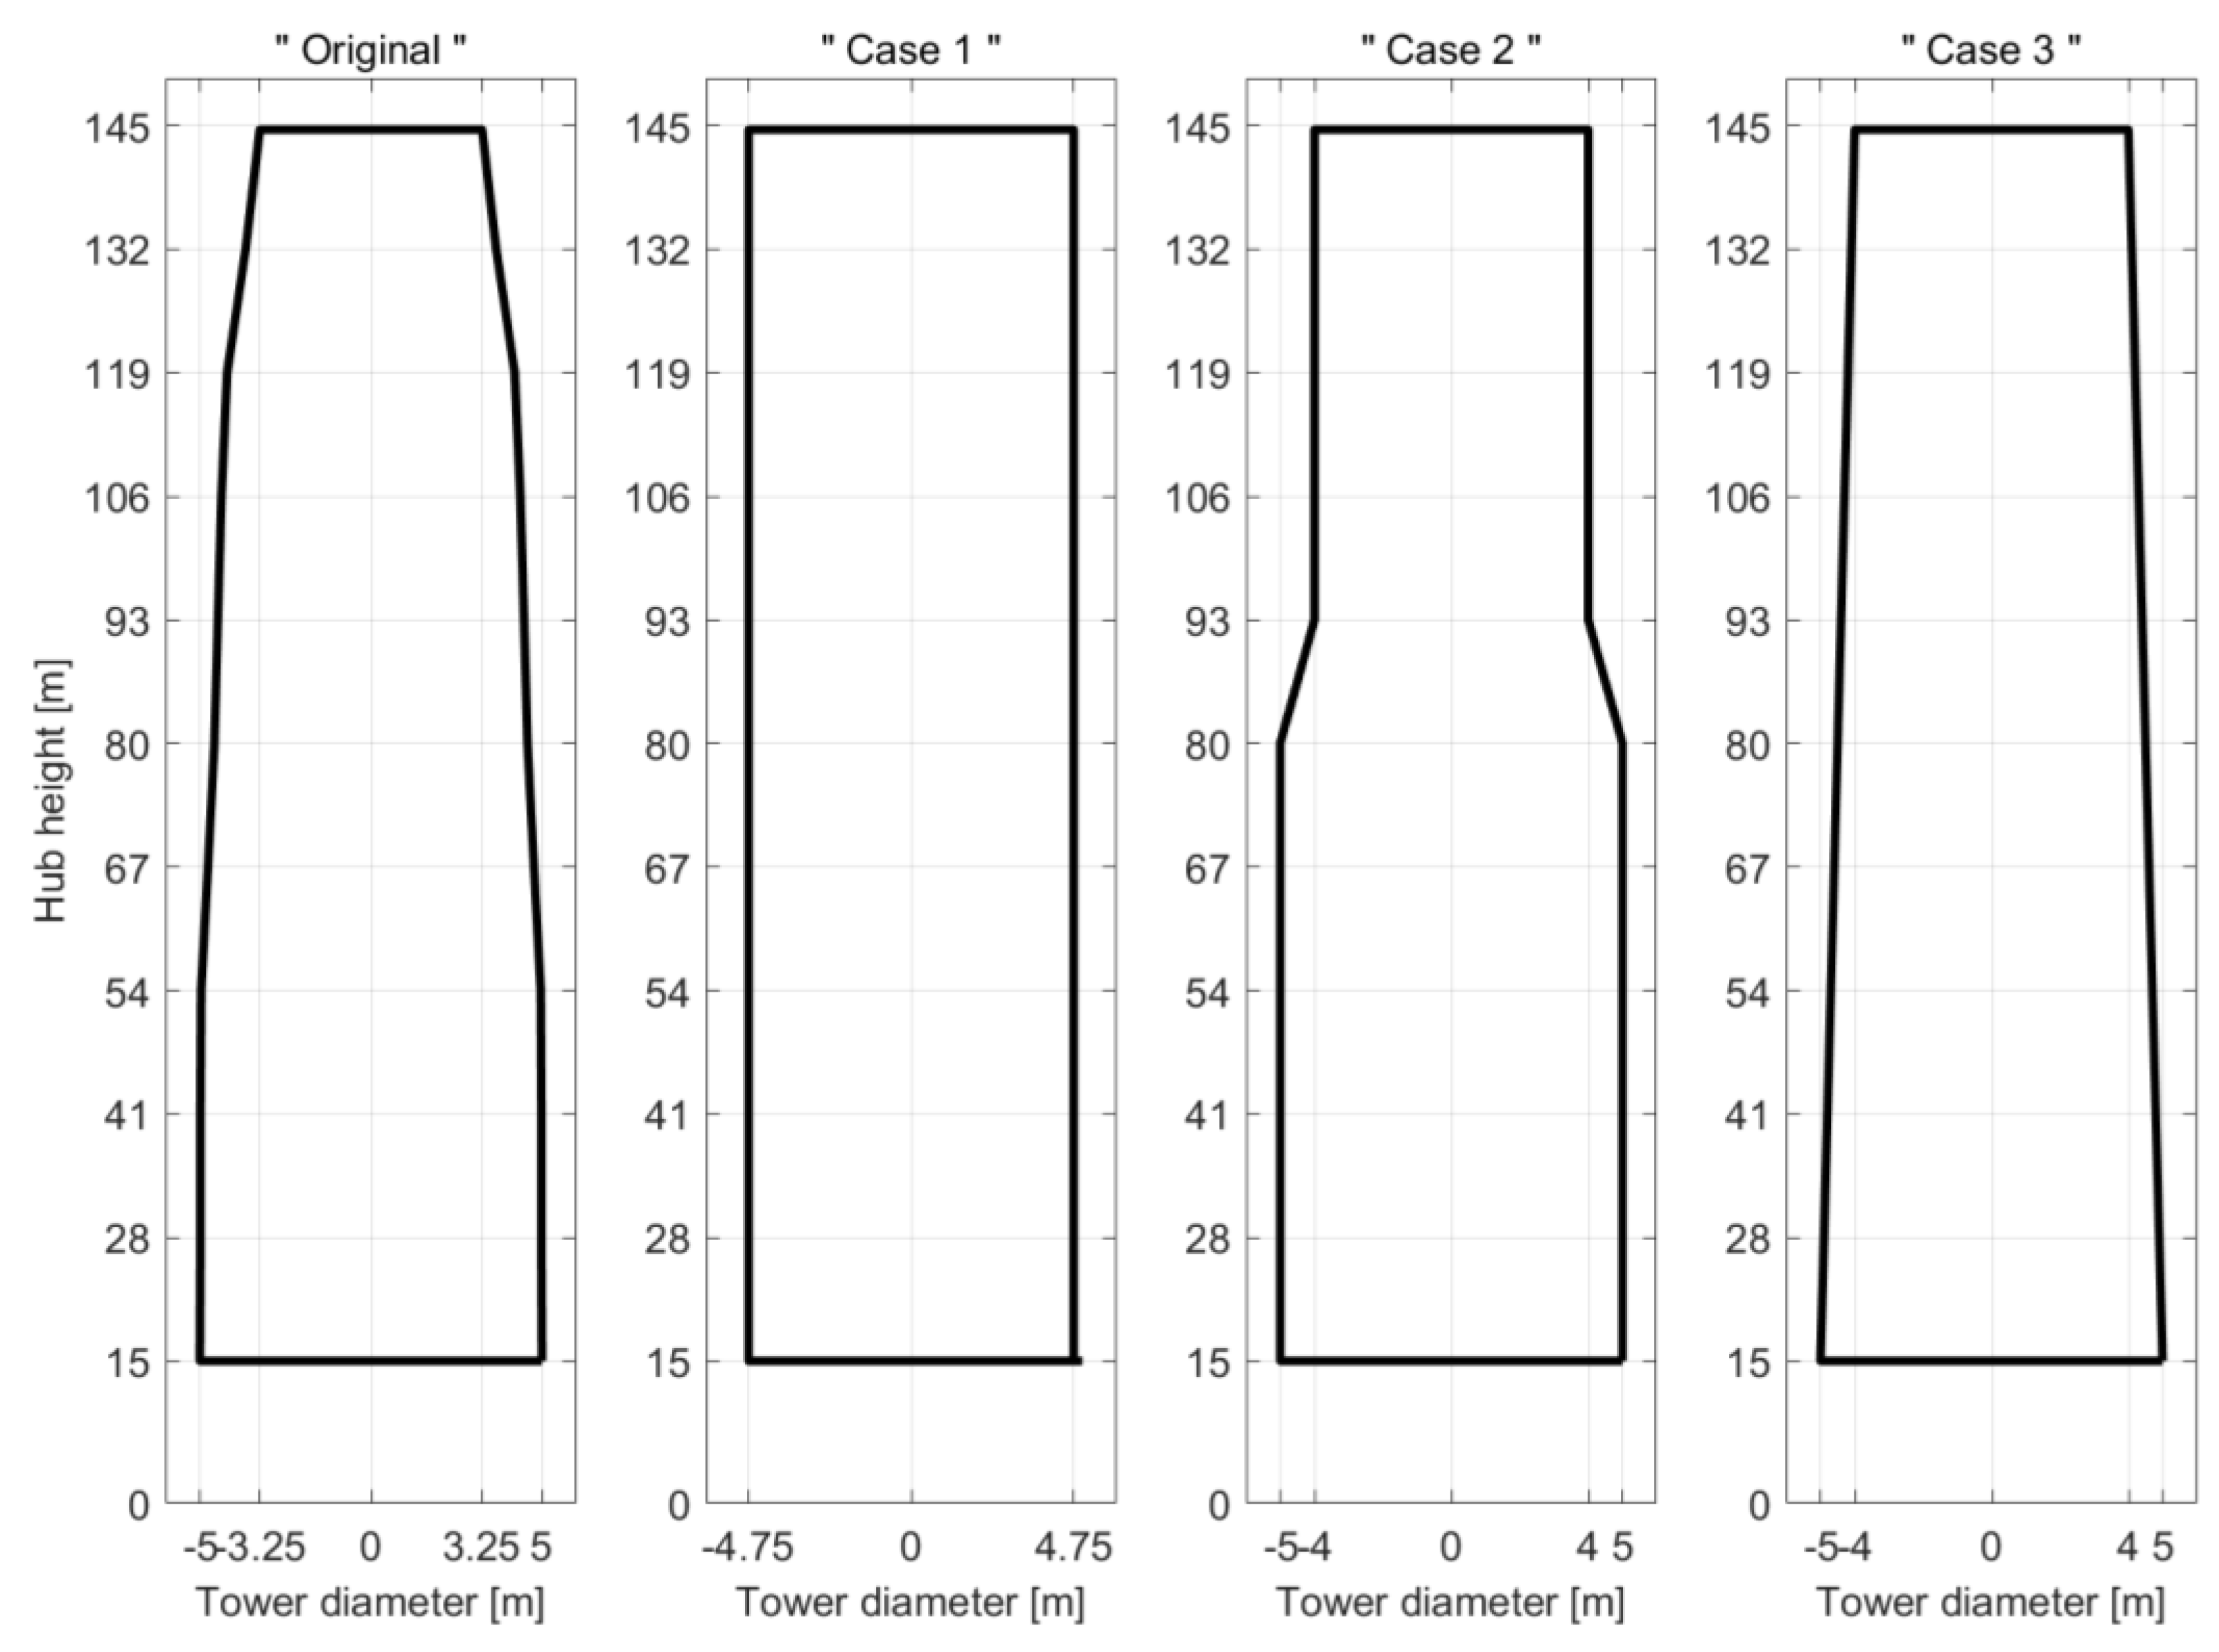
The tower-top and tower-base pitch moments according to the change in the dimensions of the tower are compared. The IEA 15 MW tower was designed by dividing into 10 equal heights, and the diameter and thickness were determined for each section. In this study, dimension analysis was performed by changing the tower diameter of each tower section while the thickness was fixed. The diameter was determined by minimizing the change in mass and center of gravity. In case 1, the diameter of the entire section was 9.5 m. In cases 2 and 3, the tower-top and tower-base diameters are 8 and 10 m, respectively. However, case 2 exhibits a sudden change in diameter in the middle, and case 3 is a tapered type that changes constantly. Table 8 summarizes the tower dimensions as function of height for four cases and Figure 15 show the tower shape for four cases. Figure 16 shows the tower-top and tower-base difference from “Original” case as a time series graph.
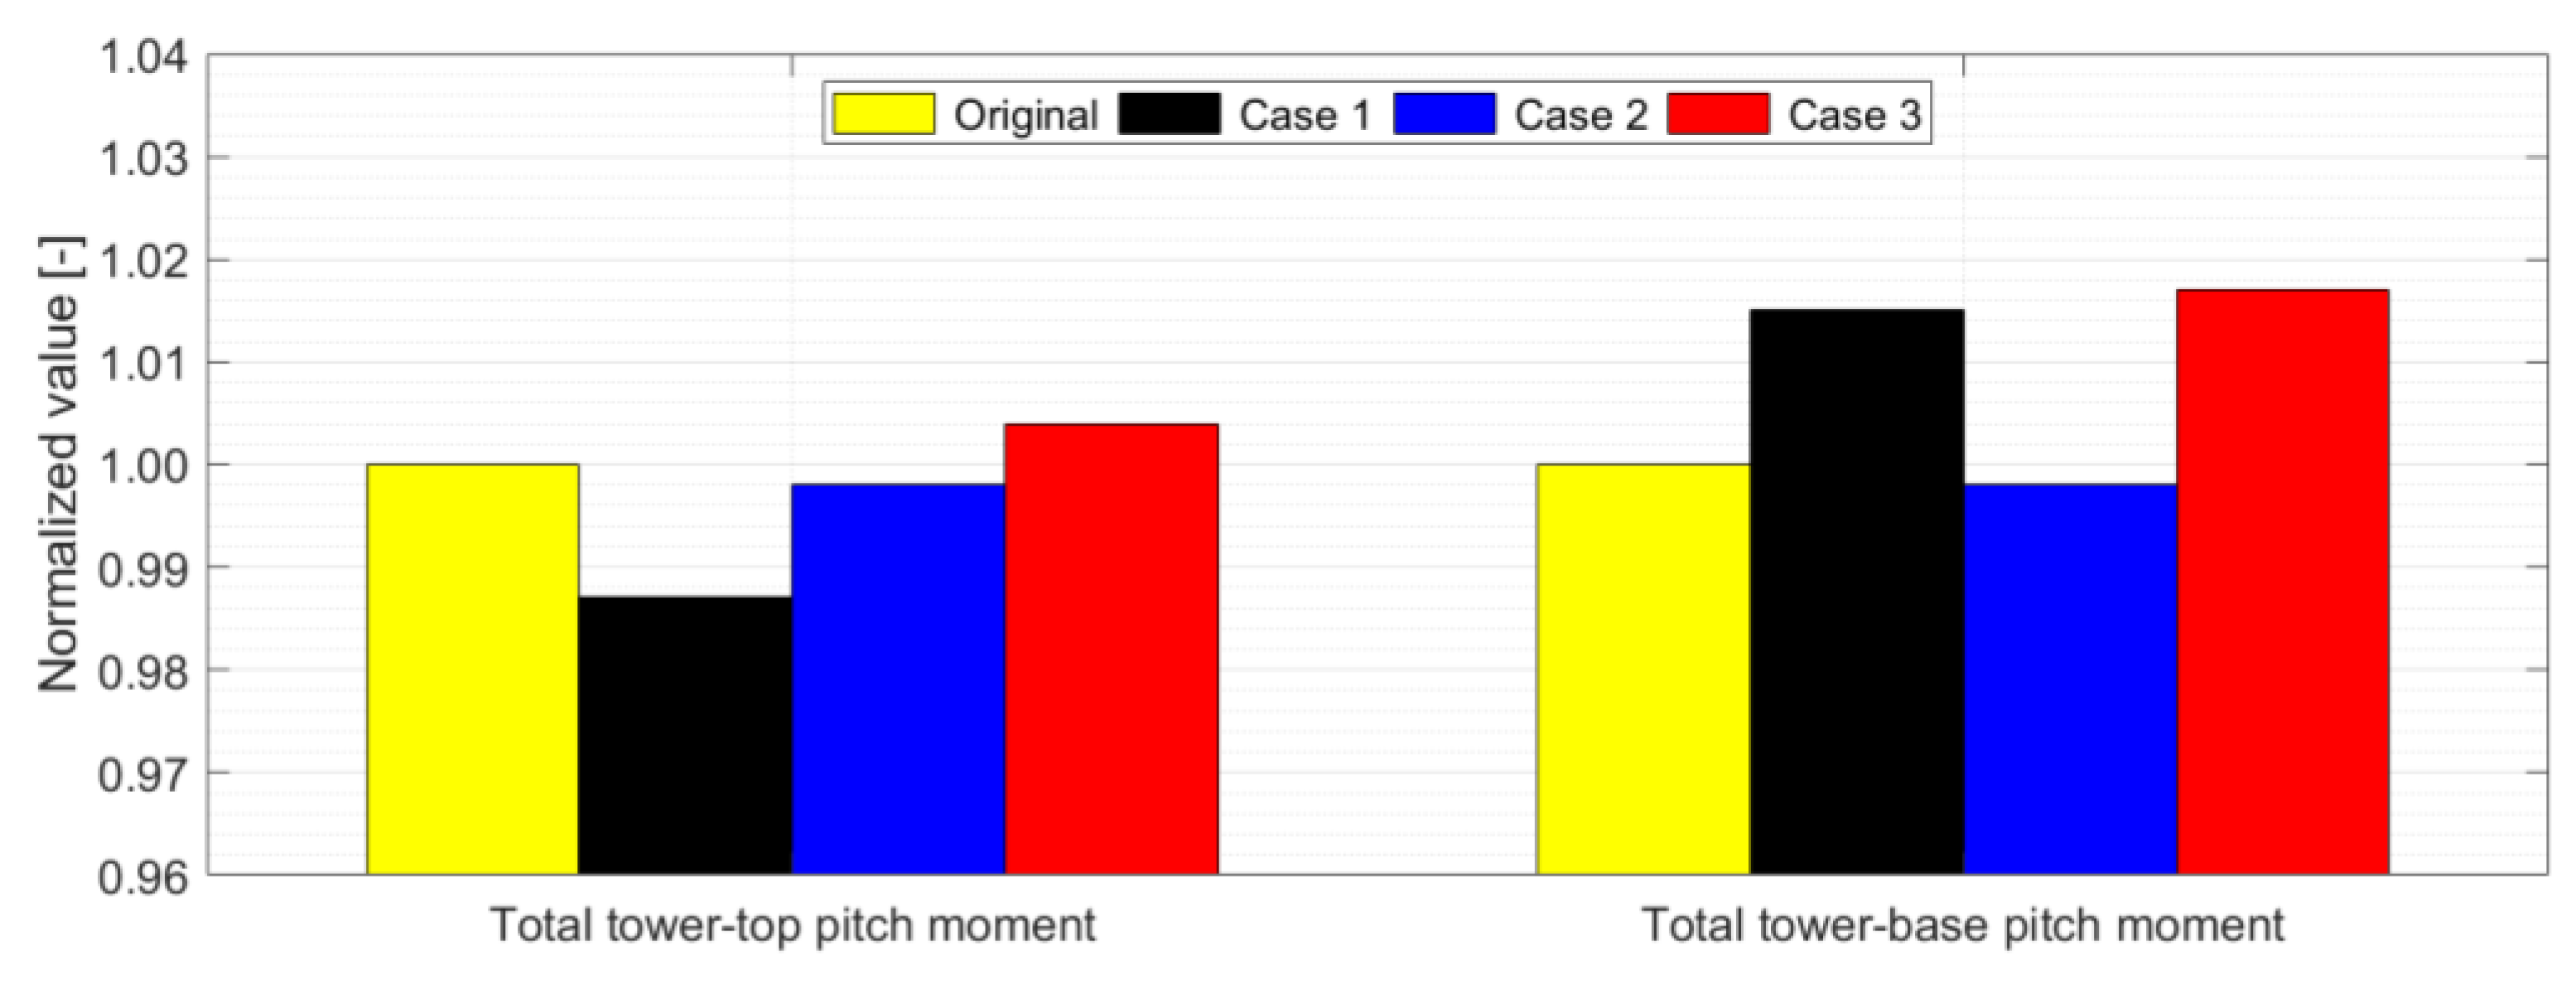
The tower-top pitch moment difference between the original case and cases 2 and 3 is not significant; case 1 shows a maximum difference of approximately 5400 kNm. The average of the four cases is approximately 54,000 kNm, and the maximum tower-top pitch moment difference is approximately 10%. The tower-base pitch moment difference appeared in the order of 1, 3, and 2, and case 1 showed a maximum difference of approximately 26,000 kNm. The average of the four cases is approximately 240,000 kNm, and the maximum tower-base pitch moment difference is approximately 10%. Figure 17 shows the normalized values that were obtained by dividing the total tower-top and tower-base pitch moments of the original case for a direct comparison of the four cases.
In Cases 1, 2, and 3, the differences of the tower-top and tower-base pitch moments were within 2%. Case 1 showed the smallest tower-top pitch moment because its tower-top diameter was the largest. Case 2 shows a lower tower-top and tower-base pitch moments compared to those of the original cases. This is because both the top and base had relatively large diameters. However, the 80–93 m section, wherein the diameter changes rapidly, is structurally weaker than the other sections. Case 3 shows a larger tower-top and tower-base pitch moments compared to those of the original cases. This is due to the steady decrease in diameter from the base to the top compared to other cases.
4. Conclusions
The characteristics of the tower-top and tower-base pitch moments of the floating offshore wind turbine system were confirmed through numerical analysis. From a series of numerical analyses, the following conclusions were drawn.
The correlation analysis was used to analyze the impact of the main parameters related to the tower-base pitch moment. The tower-top deflection frequency has a significant impact on the tower-base pitch moment, which is also related to nacelle acceleration. The other parameters showed a response that was suitable for their respective characteristics, such as a large response in a natural period.
As the wave peak period approached the tower-top deflection frequency, the response was excited, and as it moved away, the response became smaller again. However, as the significant wave height increases, only the wave spectral energy and total tower-base pitch moment increase in tandem, and no other characteristics are observed. This means that when designing the tower of a floating offshore wind turbine, the importance of the wave peak period is higher than the significant wave height.
The conditions of a significant wave height of 4.5 m and a wave peak period of 8.07 s is compared with those of 8.5 m and 13.1 s. The former refers to a normal sea state, and the latter a severe sea state. The wave spectral energy differed by a factor of 3.5. However, the difference in the total tower-base pitch moment was only approximately 4%. As mentioned previously, the impact of the wave peak period is greater than that of the significant wave height.
The shape was changed by adjusting the diameter of each section of the tower, and the tower-top and tower-base pitch moments were examined according to the changed shape. The larger the diameter at the top or base, the smaller the pitch moment. In addition, the pitch moment is lower when the tower-top and tower-base diameters remain the same up to a certain height.
The hub height and blade length increased with the capacity of the floating offshore wind turbine system increased. This implies that the tower height and thrust applied to the blades increased. The beam deflection is often proportional to the force and cube of the tower height. Therefore, the tower-top deflection increases with the capacity of the floating offshore wind turbine system. This is because redesigning the tower is the most economical way to reduce the tower-top deflection rather than reducing the hub height and blade length. Therefore, in future studies, the tower-top and tower-base pitch moments will be reduced when redesigning the tower. The tower mass used in this study is 1263 tons, and there is a need for mass reduction to reduce the cost. The main purpose of optimal tower design is mass reduction and load reduction. Therefore, the tower mass is adjusted using the diameter and thickness per tower height, which are directly related to the tower mass, and the change in the loads on the tower-top and tower-base will be examined accordingly. The optimal solution is founded by specifying the mass and load as two objective functions and using Pareto analysis, which is a method of simultaneously optimizing the two objective functions. However, tower clearance, which is the distance between the blade tip and tower considering blade deflection in extreme conditions, and the natural frequency of the tower fore–after and side–side must be additionally considered in tower design. Future research will design an improved tower that takes all of these points into account.
Author Contributions
Conceptualization, H.A., Y.-J.H. and K.-H.K.; Methodology, H.A., Y.-J.H. and K.-H.K.; Software, H.A.; Validation, H.A.; Formal analysis, H.A., Y.-J.H. and K.-H.K.; Investigation, H.A. and Y.-J.H.; Resources, H.A. and Y.-J.H.; Data curation, H.A.; Writing—original draft, H.A.; Writing—review & editing, H.A., Y.-J.H. and K.-H.K.; Visualization, H.A.; Supervision, K.-H.K.; Project administration, K.-H.K.; Funding acquisition, K.-H.K. All authors have read and agreed to the published version of the manuscript.
Funding
This study was supported by a grant from the endowment project of “Development of core technology for integrated offshore green hydrogen production system” funded by the Korea Research Institute of Ships and Ocean Engineering (PES4801).
Data Availability Statement
Not applicable.
Conflicts of Interest
The authors declare no conflict of interest.
References
- Jonkman, J.M. Dynamics Modeling and Loads Analysis of an Offshore Floating Wind Turbine. Ph.D. Thesis, University of Colorado at Boulder, Boulder, CO, USA, 2007. [Google Scholar]
- Jonkman, J.; Butterfield, S.; Musial, W.; Scott, G. Definition of a 5-MW Reference Wind Turbine for Offshore System Development; (No. NREL/TP-500-38060); National Renewable Energy Laboratory (National Renewable Energy Laboratory, Office of Energy Efficiency and Renewable Energy): Golden, CO, USA, 2009.
- Gaertner, E.; Rinker, J.; Sethuraman, L.; Zahle, F.; Anderson, B.; Barter, G.E.; Abbas, N.; Meng, F.; Bortolotti, P.; Skrzypinski, W.; et al. IEA Wind TCP Task 37: Definition of the IEA 15-Megawatt Offshore Reference Wind Turbine; (No. NREL/TP-5000-75698); National Renewable Energy Laboratory (National Renewable Energy Laboratory, Office of Energy Efficiency and Renewable Energy): Golden, CO, USA, 2020.
- Allen, C.; Viscelli, A.; Dagher, H.; Goupee, A.; Gaertner, E.; Abbas, N.; Matthew, H.; Barter, G. Definition of the UMaine VolturnUS-S Reference Platform Developed for the IEA Wind 15-Megawatt Offshore Reference Wind Turbine; (No. NREL/TP-5000-76773); National Renewable Energy Laboratory (National Renewable Energy Laboratory, Office of Energy Efficiency and Renewable Energy): Golden, CO, USA; University of Maine: Orono, ME, USA, 2020.
- Mahfouz, M.Y.; Molins, C.; Trubat, P.; Hernández, S.; Vigara, F.; Pegalajar-Jurado, A.; Bredmose, H.; Salari, M.; Salari, M. Response of the international energy agency (IEA) Wind 15 MW WindCrete and Activefloat floating wind turbines to wind and second-order waves. Wind. Energy Sci. 2021, 6, 867–883. [Google Scholar] [CrossRef]
- Liu, S.; Chuang, Z.; Wang, K.; Li, X.; Chang, X.; Hou, L. Structural parametric optimization of the VolturnUS-S semi-submersible foundation for a 15 MW floating offshore wind turbine. J. Mar. Sci. Eng. 2022, 10, 1181. [Google Scholar] [CrossRef]
- Pollini, N.; Pegalajar-Jurado, A.; Dou, S.; Bredmose, H.; Stolpe, M. Gradient-based optimization of a 15-MW wind turbine spar floater. J. Phys. Conf. Ser. 2021, 2018, 012032. [Google Scholar] [CrossRef]
- Mendoza, N.; Robertson, A.; Wright, A.; Jonkman, J.; Wang, L.; Bergua, R.; Ngo, T.; Das, T.; Odeh, M.; Mohsin, K.; et al. Verification and validation of model-scale turbine performance and control strategies for the IEA wind 15 MW reference wind turbine. Energies 2022, 15, 7649. [Google Scholar] [CrossRef]
- Loubeyres, J.; Pfister, J.-L.; Blondel, F.; Guy, N. Stall flutter instabilities on the IEA-15 reference wind turbine in idling conditions: Code-to-code comparisons and physical analyses. J. Phys. Conf. Ser. 2022, 2265, 032019. [Google Scholar] [CrossRef]
- Rinker, J.; Gaertner, E.; Zahle, F.; Skrzypiński, W.; Abbas, N.; Bredmose, H.; Barter, G.; Dykes, K.; Barter, G.; Dykes, K. Comparison of loads from HAWC2 and OpenFAST for the IEA Wind 15 MW Reference Wind Turbine. J. Phys. Conf. Ser. 2020, 1618, 052052. [Google Scholar] [CrossRef]
- Papi, F.; Bianchini, A. Technical challenges in floating offshore wind turbine upscaling: A critical analysis based on the NREL 5 MW and IEA 15 MW Reference Turbines. Renew. Sustain. Energy Rev. 2022, 162, 112489. [Google Scholar] [CrossRef]
- Butterfield, S.; Musial, W.; Jonkman, J.; Sclavounos, P. Engineering Challenges for Floating Offshore Wind Turbines; (No. NREL/CP-500-38776); National Renewable Energy Laboratory (National Renewable Energy Laboratory, Office of Energy Efficiency and Renewable Energy): Golden, CO, USA, 2007.
- Jonkman, J.M.; Buhl, M.L. FAST User’s Guide; National Renewable Energy Laboratory: Golden, CO, USA, 2005; Volume 365.
- Robertson, A.; Jonkman, J.; Vorpahl, F.; Popko, W.; Qvist, J.; Frøyd, L.X.; Chen, X.; Azcona, J.; Uzunoglu, E.; Soares, C.G.; et al. Offshore code comparison collaboration continuation within IEA wind task 30: Phase II results regarding a floating semisubmersible wind system. In Proceedings of the International Conference on Offshore Mechanics and Arctic Engineering, 33rd International Conference on Ocean, Offshore and Arctic Engineering, San Francisco, CA, USA, 8–13 June 2013; Volume 45547, p. V09BT09A012. [Google Scholar]
- Robertson, A.N.; Wendt, F.; Jonkman, J.M.; Popko, W.; Dagher, H.; Gueydon, S.; Qvist, J.; Vittori, F.; Azcona, J.; Uzunoglu, E.; et al. OC5 Project Phase II: Validation of Global Loads of the DeepCwind Floating Semisubmersible Wind Turbine. Energy Procedia 2017, 137, 38–57. [Google Scholar] [CrossRef]
- Jonkman, J.; Branlard, E.; Hall, M.; Hayman, G.; Platt, A.; Robertson, A. Implementation of Substructure Flexibility and Member-Level Load Capabilities for Floating Offshore Wind Turbines in OpenFAST; (No. NREL/TP-5000-76822); National Renewable Energy Lab. (NREL): Golden, CO, USA, 2020.
- Jonkman, J.; Jonkman, B.J. FAST modularization framework for wind turbine simulation: Full-system linearization. J. Physics: Conf. Ser. 2016, 753, 082010. [Google Scholar] [CrossRef]
- Jonkman, J.M.; Hayman, G.J.; Jonkman, B.J.; Damiani, R.R.; Murray, R.E. AeroDyn v15 User’s Guide and Theory Manual; NREL Draft Report; NREL: Golden, CO, USA, 2015; p. 46.
- Jonkman, B.J. TurbSim User’s Guide: Version 1.50; (No. NREL/TP-500-46198); National Renewable Energy Lab. (NREL): Golden, CO, USA, 2009.
- Shah, K.A.; Meng, F.; Li, Y.; Nagamune, R.; Zhou, Y.; Ren, Z.; Jiang, Z. A synthesis of feasible control methods for floating offshore wind turbine system dynamics. Renew. Sustain. Energy Rev. 2021, 151, 111525. [Google Scholar] [CrossRef]
- Abbas, N.J.; Zalkind, D.S.; Pao, L.; Wright, A. A reference open-source controller for fixed and floating offshore wind turbines. Wind. Energy Sci. 2022, 7, 53–73. [Google Scholar] [CrossRef]
- Jonkman, J.M.; Robertson, A.N.; Hayman, G.J. HydroDyn User’s Guide and Theory Manual; National Renewable Energy Laboratory: Golden, CO, USA, 2014.
- Lee, C.H. WAMIT Theory Manual; Massachusetts Institute of Technology, Department of Ocean Engineering: Cambridge, MA, USA, 1995. [Google Scholar]
- International Electrotechnical Commission. Wind Energy Generation Systems—Part 3-2: Design Requirements for Floating Offshore Wind Turbines; IEC TS: Geneva, Switzerland, 2019; pp. 61400–61403. [Google Scholar]
- Stewart, G.M.; Robertson, A.; Jonkman, J.; Lackner, M.A. The creation of a comprehensive metocean data set for offshore wind turbine simulations. Wind. Energy 2016, 19, 1151–1159. [Google Scholar] [CrossRef]
- Viselli, A.M.; Forristall, G.Z.; Pearce, B.R.; Dagher, H.J. Estimation of extreme wave and wind design parameters for offshore wind turbines in the Gulf of Maine using a POT method. Ocean Eng. 2015, 104, 649–658. [Google Scholar] [CrossRef] [Green Version]
Figure 1.
15 MW floating offshore wind turbine system and reference coordinate system.

Figure 2.
Various modules connected by OpenFAST (Figure adapted from [16]).
Figure 2.
Various modules connected by OpenFAST (Figure adapted from [16]).

Figure 3.
Time series of the heave free-decay test.

Figure 4.
Steady-state analysis results of the 15 MW floating offshore wind turbine.

Figure 5.
Time series of the tower-top pitch moments for the three specified conditions.

Figure 6.
Time series of tower-base pitch moments for three specified conditions.

Figure 7.
FFT results of tower-top and tower-base pitch moments for three specified conditions.

Figure 8.
FFT results between tower-base pitch moment (black) and main output parameters (red).

Figure 9.
FFT results of tower-base pitch moments (black) and waves (blue) according to wave peak periods.
Figure 9.
FFT results of tower-base pitch moments (black) and waves (blue) according to wave peak periods.

Figure 10.
Total tower-base pitch moment and normalized value per wave peak frequencies.

Figure 11.
FFT results of tower-base pitch moments (black) and waves (blue) according to significant wave height.
Figure 11.
FFT results of tower-base pitch moments (black) and waves (blue) according to significant wave height.

Figure 12.
Total tower-base pitch moment and wave spectral energy per significant wave height.

Figure 13.
FFT results of tower-base pitch moments (black) and waves (blue) according to sea conditions.
Figure 13.
FFT results of tower-base pitch moments (black) and waves (blue) according to sea conditions.

Figure 14.
Normalized values of total tower-base pitch moments and wave spectral energy.

Figure 15.
Tower shape for four cases.

Figure 16.
Tower-top and tower-base pitch moments difference from “Original” case.

Figure 17.
Normalized values of tower-top and tower-base pitch moments.


Table 1.
15 MW floating offshore wind turbine system general properties.
| Parameter | Units | Value |
|---|---|---|
| Turbine rating | MW | 15 |
| Hub height | m | 150 |
| Excursion (Length, Width, Height) | m | 90.1, 102.1, 290.0 |
| Platform type | - | Semisubmersible |
| Freeboard | m | 15 |
| Draft | m | 20 |
| Total system mass | t | 20,093 |
| Platform mass | t | 17,839 |
| Tower mass | t | 1,263 |
| RNR mass | t | 991 |
| Water depth | m | 200 |
| Mooring system | - | Three-line chain catenary |
Table 2.
Rigid-body natural frequencies.
| Rigid-Body Model | Value | Unit |
|---|---|---|
| Surge | 0.007 | Hz |
| Sway | 0.007 | Hz |
| Heave | 0.049 | Hz |
| Roll | 0.036 | Hz |
| Pitch | 0.036 | Hz |
| Yaw | 0.011 | Hz |
Table 3.
IEC design load case matrix.
| DLC | DLC 1.1 | DLC 1.6 | ||||
|---|---|---|---|---|---|---|
| Wind Speed [m/s] | Hs [m] | Tp [s] | γ [-] | Hs [m] | Tp [s] | γ [-] |
| 4.00 | 1.10 | 8.52 | 1.00 | 6.30 | 11.50 | 2.75 |
| 6.00 | 1.18 | 8.31 | 1.00 | 8.00 | 12.70 | 2.75 |
| 8.00 | 1.32 | 8.01 | 1.00 | 8.00 | 12.70 | 2.75 |
| 10.00 | 1.54 | 7.65 | 1.00 | 8.10 | 12.80 | 2.75 |
| 12.00 | 1.84 | 7.44 | 1.00 | 8.50 | 13.10 | 2.75 |
| 14.00 | 2.19 | 7.46 | 1.00 | 8.50 | 13.10 | 2.75 |
| 16.00 | 2.60 | 7.64 | 1.35 | 9.80 | 14.10 | 2.75 |
| 18.00 | 3.06 | 8.05 | 1.59 | 9.80 | 14.10 | 2.75 |
| 20.00 | 3.63 | 8.52 | 1.82 | 9.80 | 14.10 | 2.75 |
| 22.00 | 4.03 | 8.99 | 1.82 | 9.80 | 14.10 | 2.75 |
| 24.00 | 4.52 | 9.45 | 1.89 | 9.80 | 14.10 | 2.75 |
Table 4.
Statistical values of tower-top and tower-base pitch moments.
| Parameter | Conditions | Min. | Mean | Max. | S.D |
|---|---|---|---|---|---|
| Tower-top Pitch moment [kNm] | Wind only | 32,650 | 54,328 | 76,240 | 5753 |
| Wave only | 62,520 | 71,719 | 82,450 | 2580 | |
| Wind and Wave | 31,540 | 54,381 | 78,250 | 6326 | |
| Tower-base Pitch moment [kNm] | Wind only | 59,500 | 245,482 | 377,300 | 48,244 |
| Wave only | −418,700 | −123,044 | 151,900 | 68,494 | |
| Wind and Wave | −55,100 | 241,790 | 520,500 | 77,117 |
Table 5.
Wave peak period and wave peak frequency for different cases (Hs: 8.5 m).
| Cases | (a) | (b) | (c) | (d) | (e) | (f) | (g) | (h) | (i) | (j) | (k) | (l) | (m) | (n) | (o) |
|---|---|---|---|---|---|---|---|---|---|---|---|---|---|---|---|
| Tp [s] | 27.78 | 22.73 | 19.23 | 16.67 | 14.71 | 13.10 | 11.91 | 10.87 | 10.00 | 9.26 | 8.62 | 8.07 | 7.58 | 7.14 | 6.76 |
| 1/Tp [Hz] | 0.036 | 0.044 | 0.052 | 0.060 | 0.068 | 0.076 | 0.084 | 0.092 | 0.100 | 0.108 | 0.116 | 0.124 | 0.132 | 0.140 | 0.148 |
Table 6.
Significant wave heights for different cases (Tp: 8.07, 1/Tp: 0.124).
| Cases | (p) | (q) | (r) | (s) | (t) | (u) | (v) | (w) |
|---|---|---|---|---|---|---|---|---|
| Hs [m] | 1.0 | 1.5 | 2.0 | 2.5 | 3.0 | 3.5 | 4.0 | 4.5 |
Table 7.
Normal sea state and severe sea state conditions.
| Cases | (w) | (f) |
|---|---|---|
| Sea state | Normal sea state | Severe sea state |
| Hs [m] | 4.5 | 8.5 |
| Tp [s] | 8.07 | 13.10 |
| 1/Tp [Hz] | 0.124 | 0.076 |
Table 8.
Tower dimensions as function of height for four cases.
| Height [m] | Thickness [m] | Outer Diameter [m] | |||
|---|---|---|---|---|---|
| Original | Case 1 | Case 2 | Case 3 | ||
| 15.000 | 0.083 | 10.000 | 9.500 | 10.000 | 10.000 |
| 28.000 | 0.083 | 9.964 | 9.500 | 10.000 | 9.799 |
| 28.001 | 0.083 | 9.964 | 9.500 | 10.000 | 9.799 |
| 41.000 | 0.083 | 9.967 | 9.500 | 10.000 | 9.599 |
| 41.001 | 0.083 | 9.967 | 9.500 | 10.000 | 9.599 |
| 54.000 | 0.083 | 9.927 | 9.500 | 10.000 | 9.398 |
| 54.001 | 0.030 | 9.927 | 9.500 | 10.000 | 9.398 |
| 67.000 | 0.030 | 9.528 | 9.500 | 10.000 | 9.197 |
| 67.001 | 0.028 | 9.528 | 9.500 | 10.000 | 9.197 |
| 80.000 | 0.028 | 9.149 | 9.500 | 10.000 | 8.997 |
| 80.001 | 0.026 | 9.149 | 9.500 | 10.000 | 8.997 |
| 93.000 | 0.026 | 8.945 | 9.500 | 8.000 | 8.796 |
| 93.001 | 0.023 | 8.945 | 9.500 | 8.000 | 8.796 |
| 106.000 | 0.023 | 8.735 | 9.500 | 8.000 | 8.595 |
| 106.001 | 0.020 | 8.735 | 9.500 | 8.000 | 8.595 |
| 119.000 | 0.020 | 8.405 | 9.500 | 8.000 | 8.395 |
| 119.001 | 0.018 | 8.405 | 9.500 | 8.000 | 8.395 |
| 132.000 | 0.018 | 7.321 | 9.500 | 8.000 | 8.194 |
| 132.001 | 0.021 | 7.321 | 9.500 | 8.000 | 8.194 |
| 144.582 | 0.021 | 6.500 | 9.500 | 8.000 | 8.000 |
| Mass [t] (ratio) | 1263 (1.00) | 1266 (1.00) | 1272 (1.01) | 1243 (0.98) | |
| C.G. [m] (ratio) | 39.6 (1.00) | 42.5 (1.07) | 39.8 (1.01) | 40.4 (1.02) | |
Disclaimer/Publisher’s Note: The statements, opinions and data contained in all publications are solely those of the individual author(s) and contributor(s) and not of MDPI and/or the editor(s). MDPI and/or the editor(s) disclaim responsibility for any injury to people or property resulting from any ideas, methods, instructions or products referred to in the content. |
© 2023 by the authors. Licensee MDPI, Basel, Switzerland. This article is an open access article distributed under the terms and conditions of the Creative Commons Attribution (CC BY) license (https://creativecommons.org/licenses/by/4.0/).
Share and Cite
MDPI and ACS Style
Ahn, H.; Ha, Y.-J.; Kim, K.-H. Load Evaluation for Tower Design of Large Floating Offshore Wind Turbine System According to Wave Conditions. Energies 2023, 16, 1862. https://doi.org/10.3390/en16041862
AMA Style
Ahn H, Ha Y-J, Kim K-H. Load Evaluation for Tower Design of Large Floating Offshore Wind Turbine System According to Wave Conditions. Energies. 2023; 16(4):1862. https://doi.org/10.3390/en16041862
Chicago/Turabian StyleAhn, Hyeonjeong, Yoon-Jin Ha, and Kyong-Hwan Kim. 2023. "Load Evaluation for Tower Design of Large Floating Offshore Wind Turbine System According to Wave Conditions" Energies 16, no. 4: 1862. https://doi.org/10.3390/en16041862
Note that from the first issue of 2016, this journal uses article numbers instead of page numbers. See further details here.