
Physical Modelling of Tidal Stream Turbine Wake Structures under Yaw Conditions
 ,
,  ,
,
Abstract
:1. Introduction
2. Experimental Setup
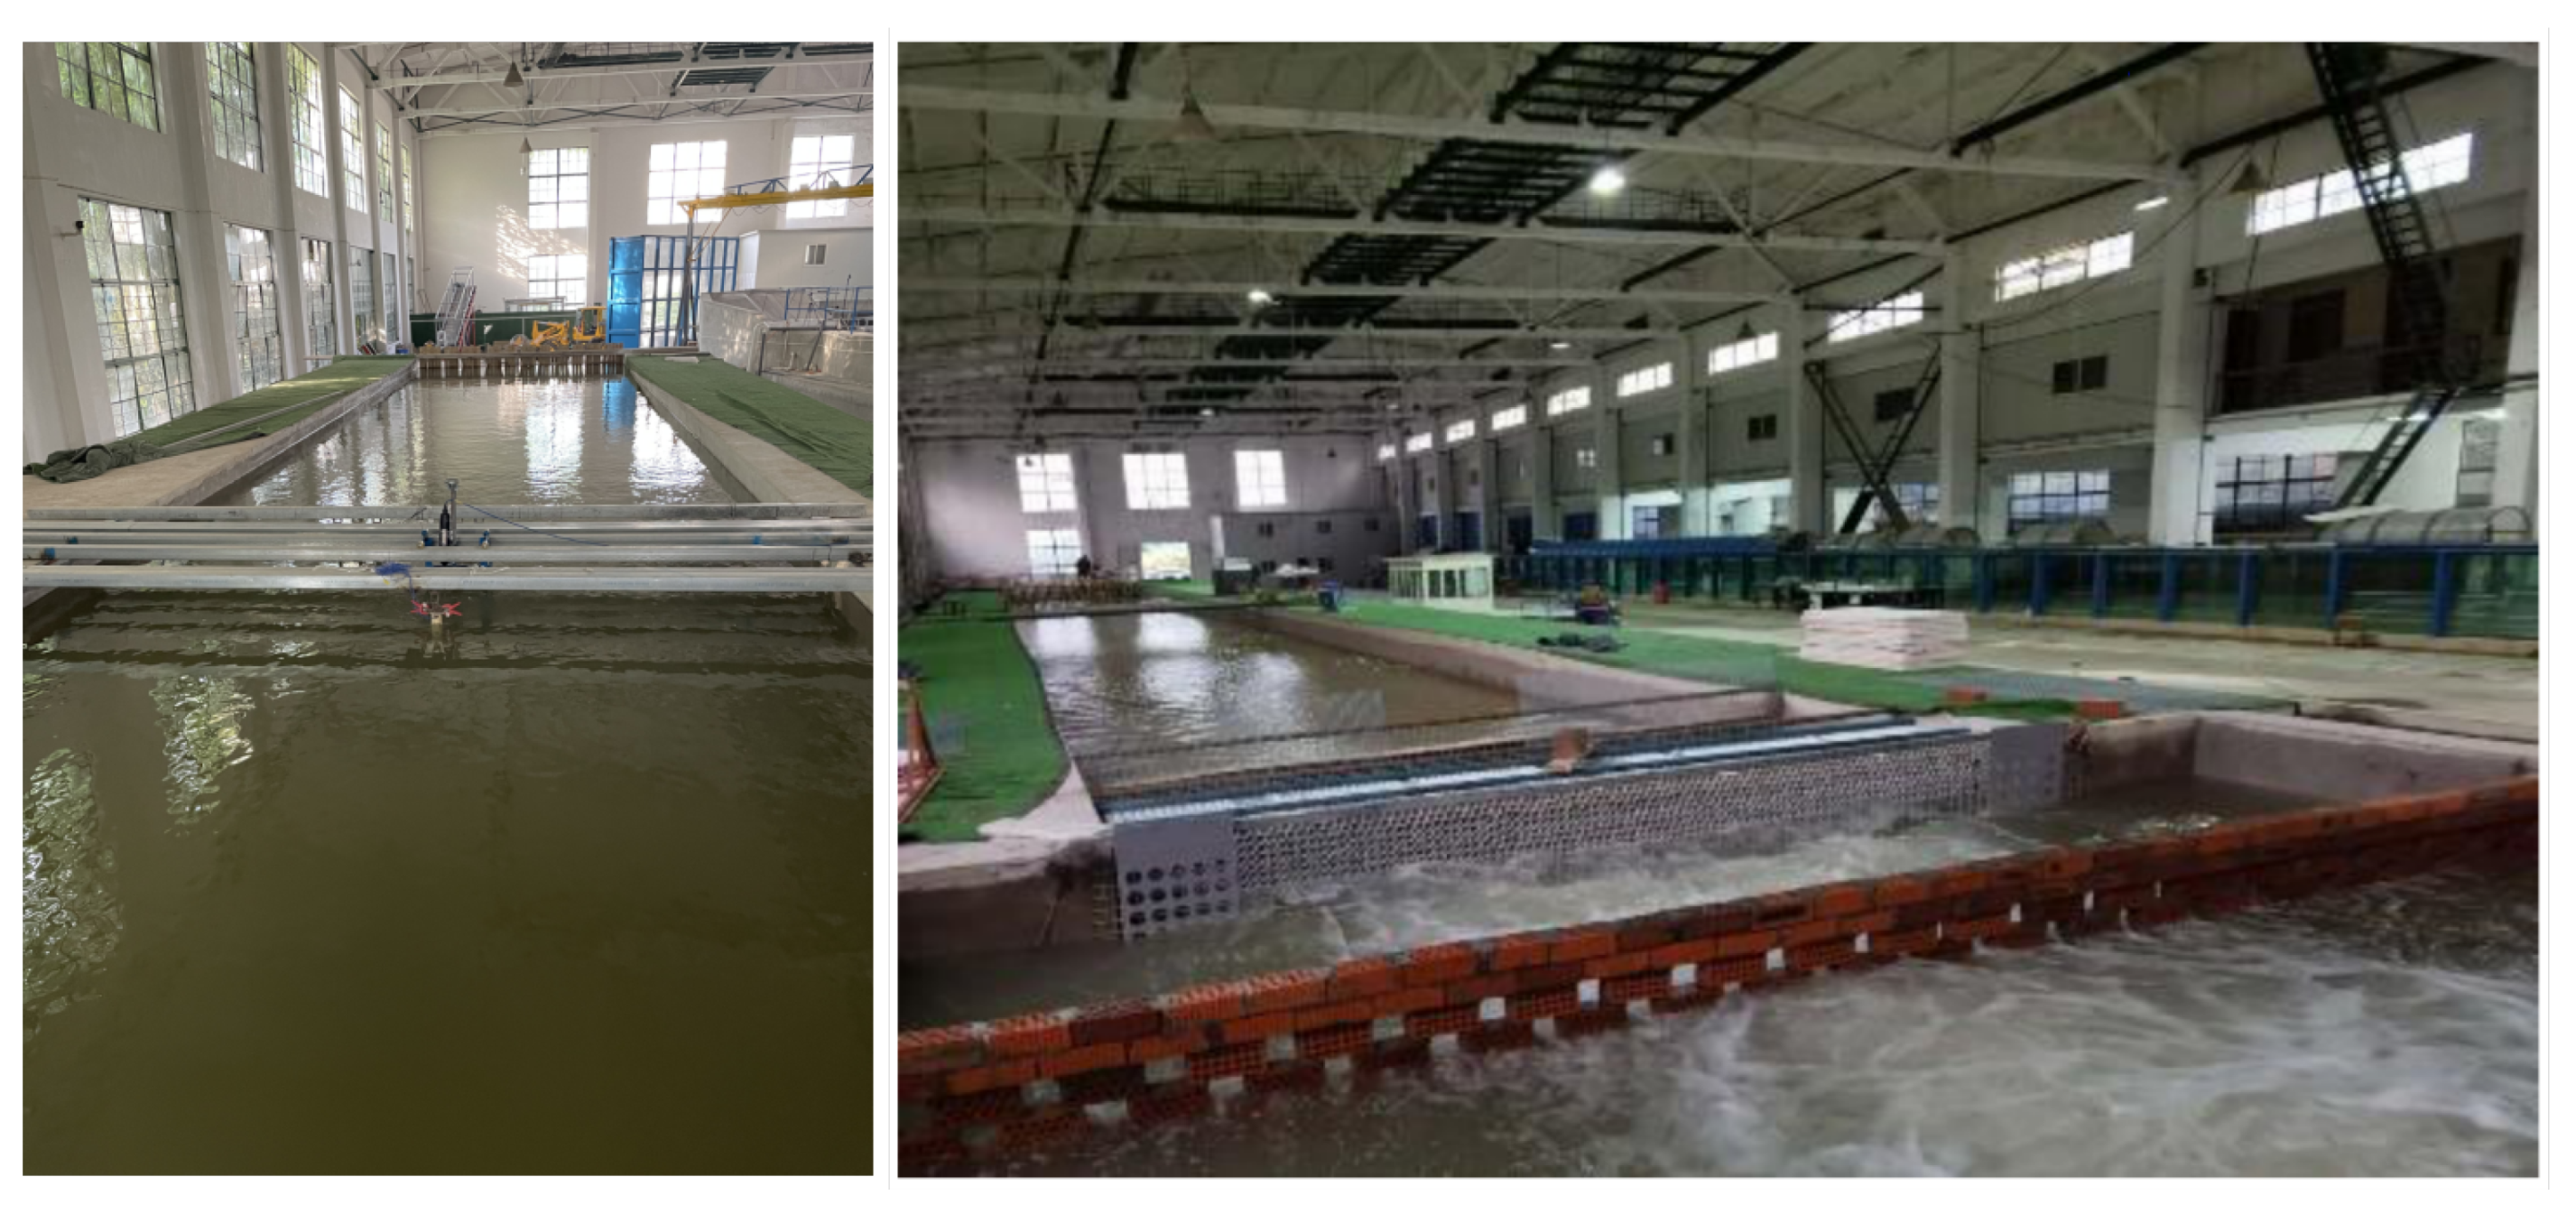
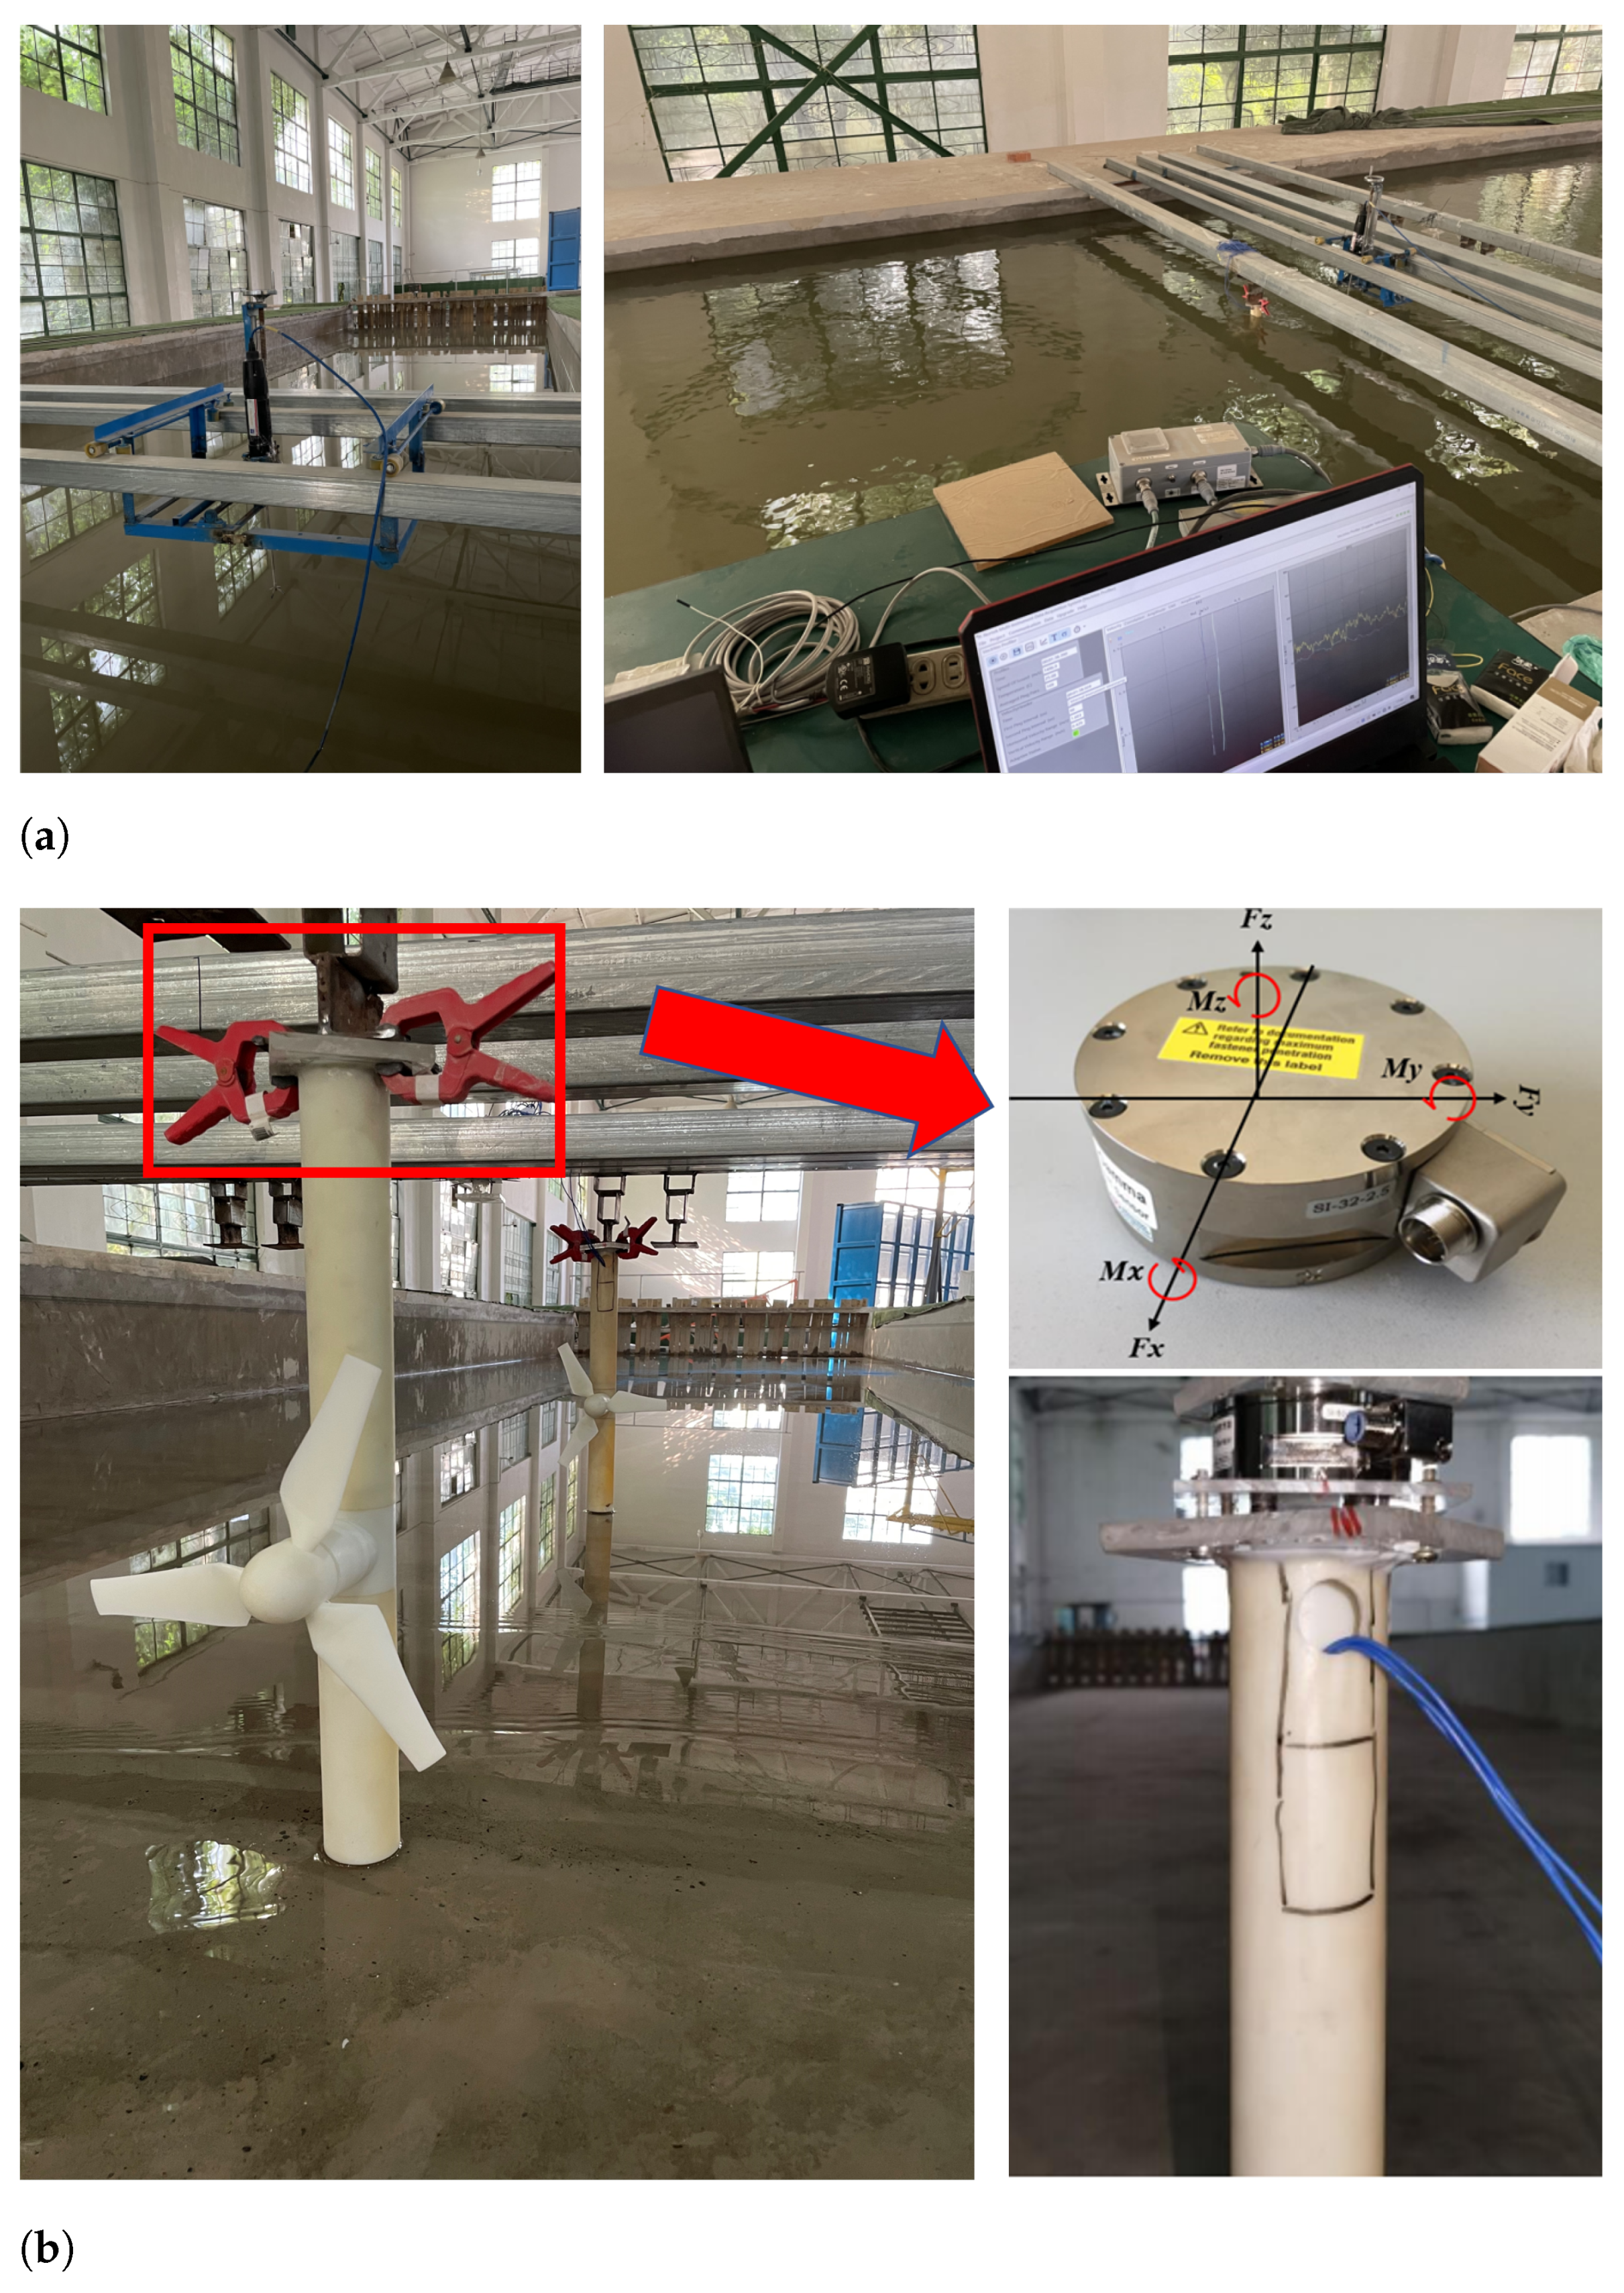
2.1. Flow Flume and the Measurement Device
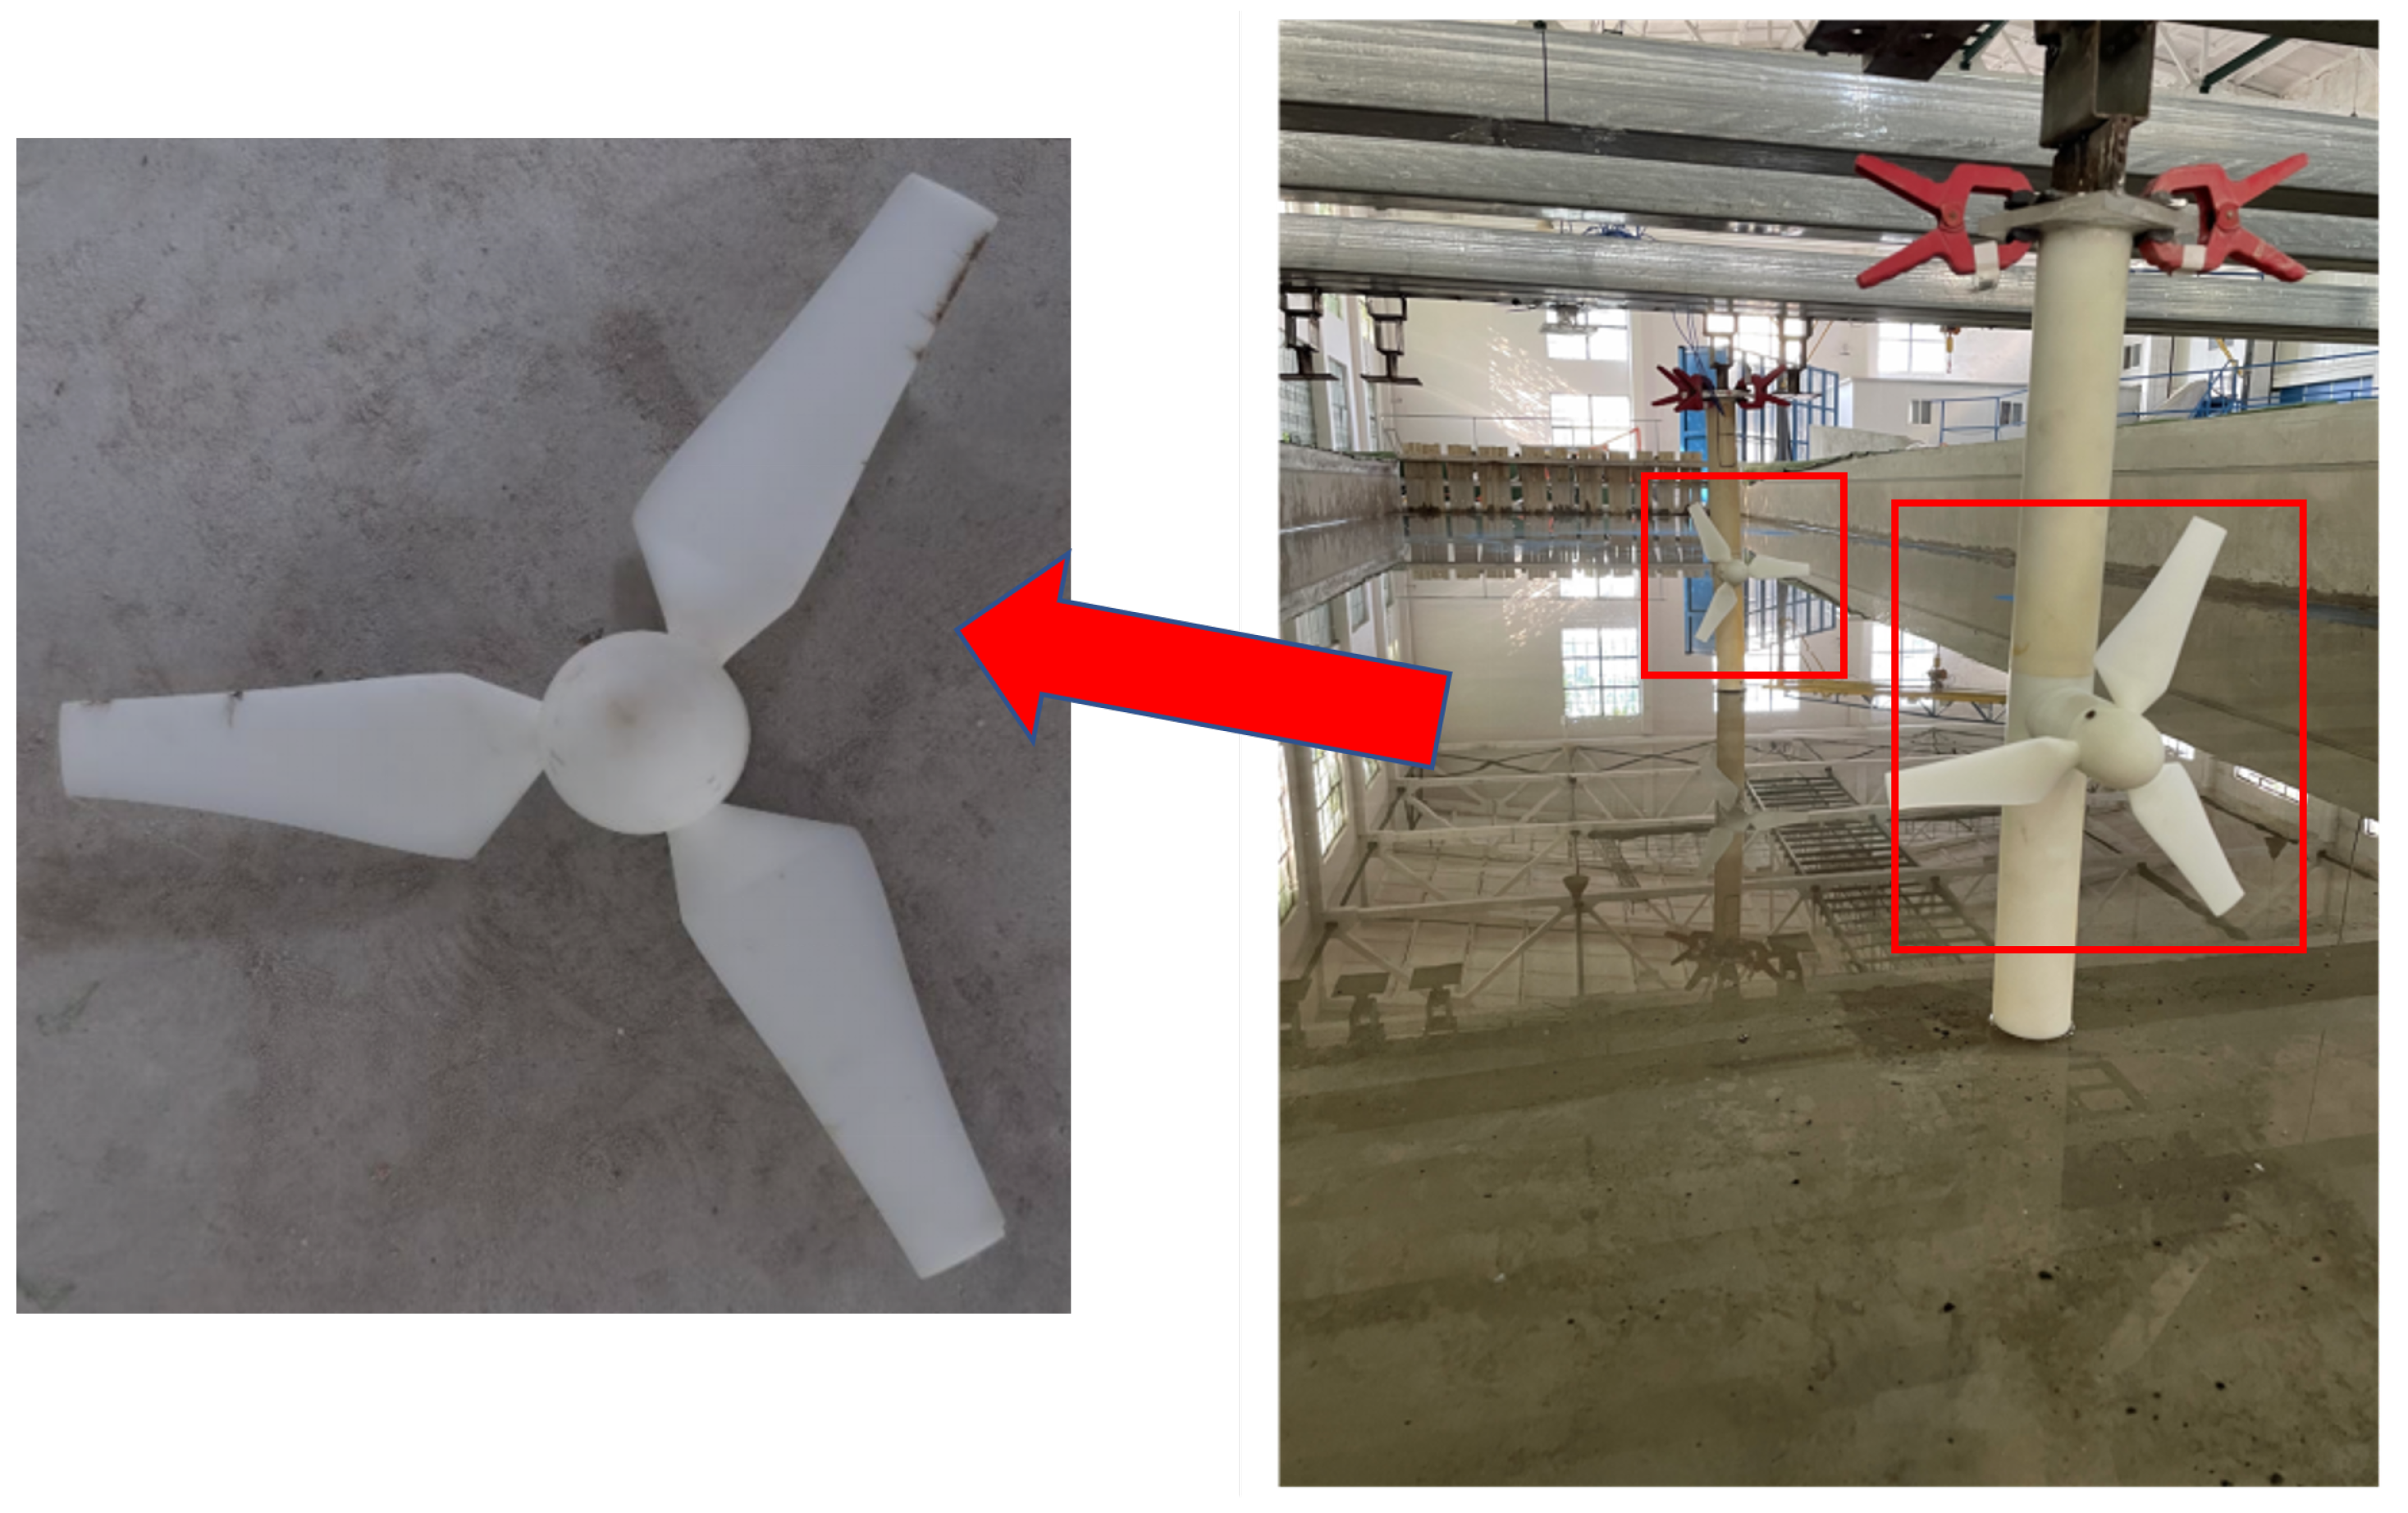
2.2. Turbine Physical Model
2.3. Case Studies
- Scenario 1
- Yaw of a single turbine from to .
- Scenario 2
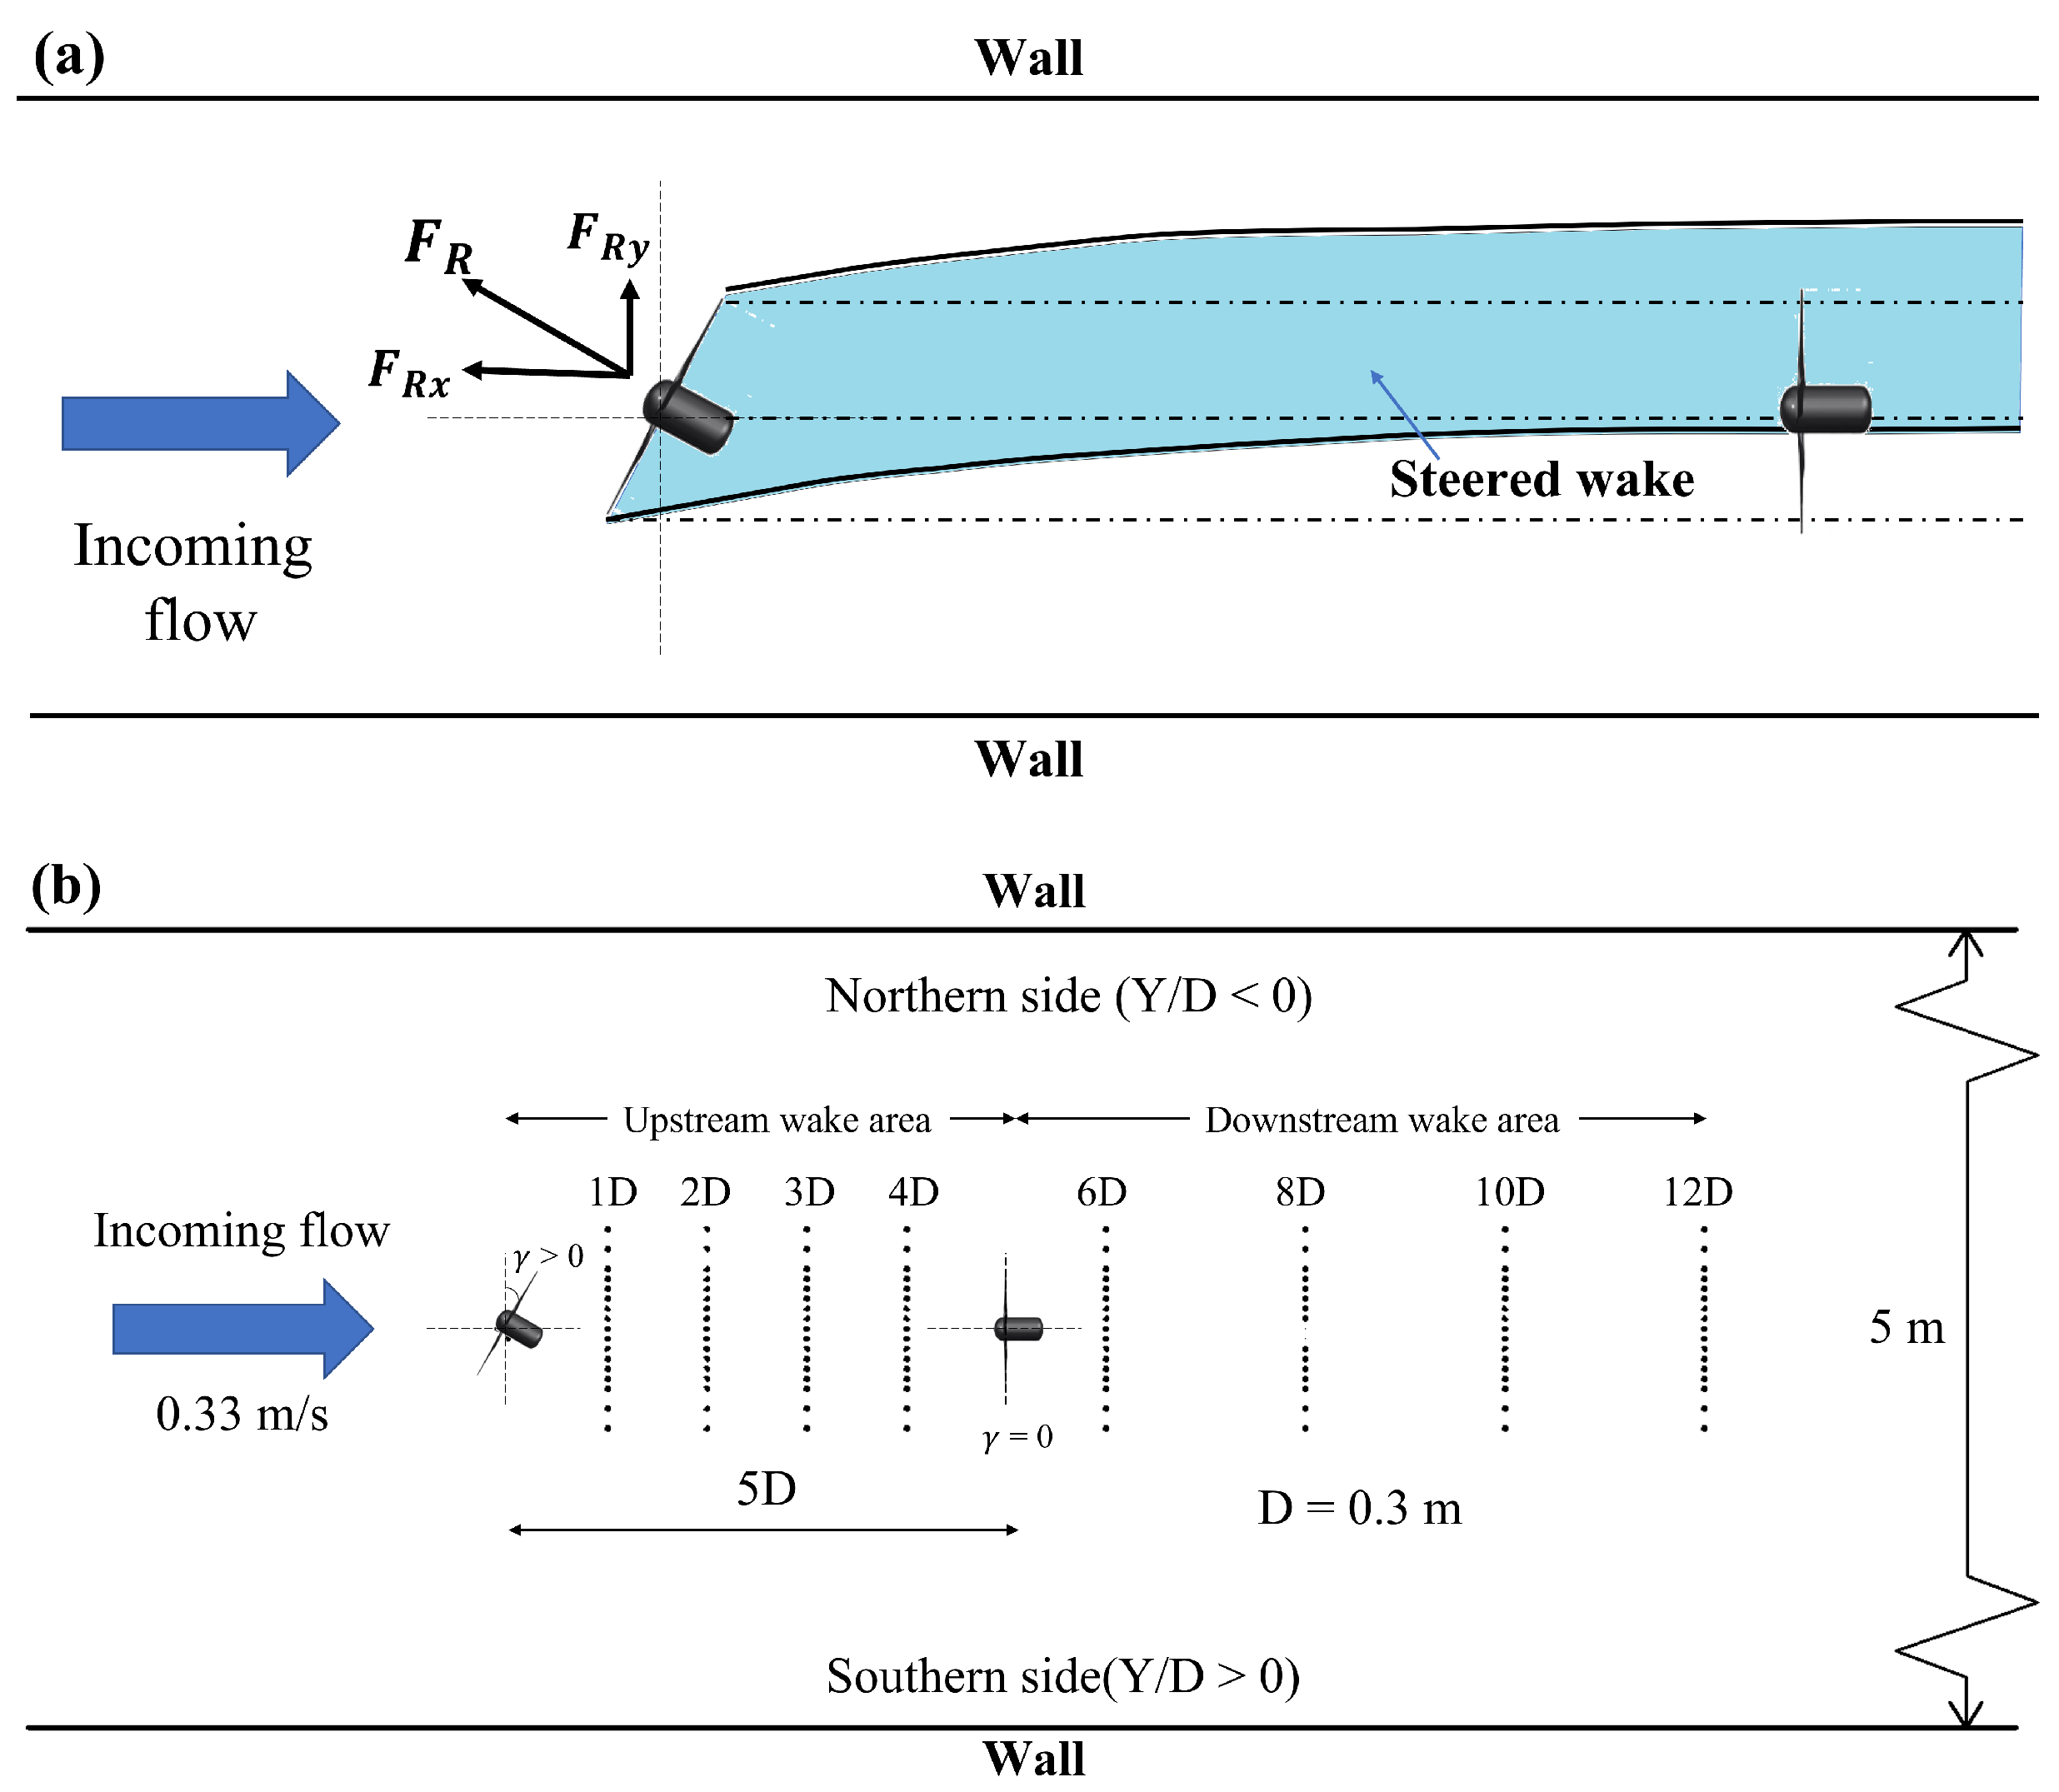
- Yaw of one of two turbines from to while retaining the other turbine in a non-yawed state relative to the flume. The distance between the turbines was fixed at (see Figure 4b).
2.4. Experimental Data Analysis
3. Results and Discussion
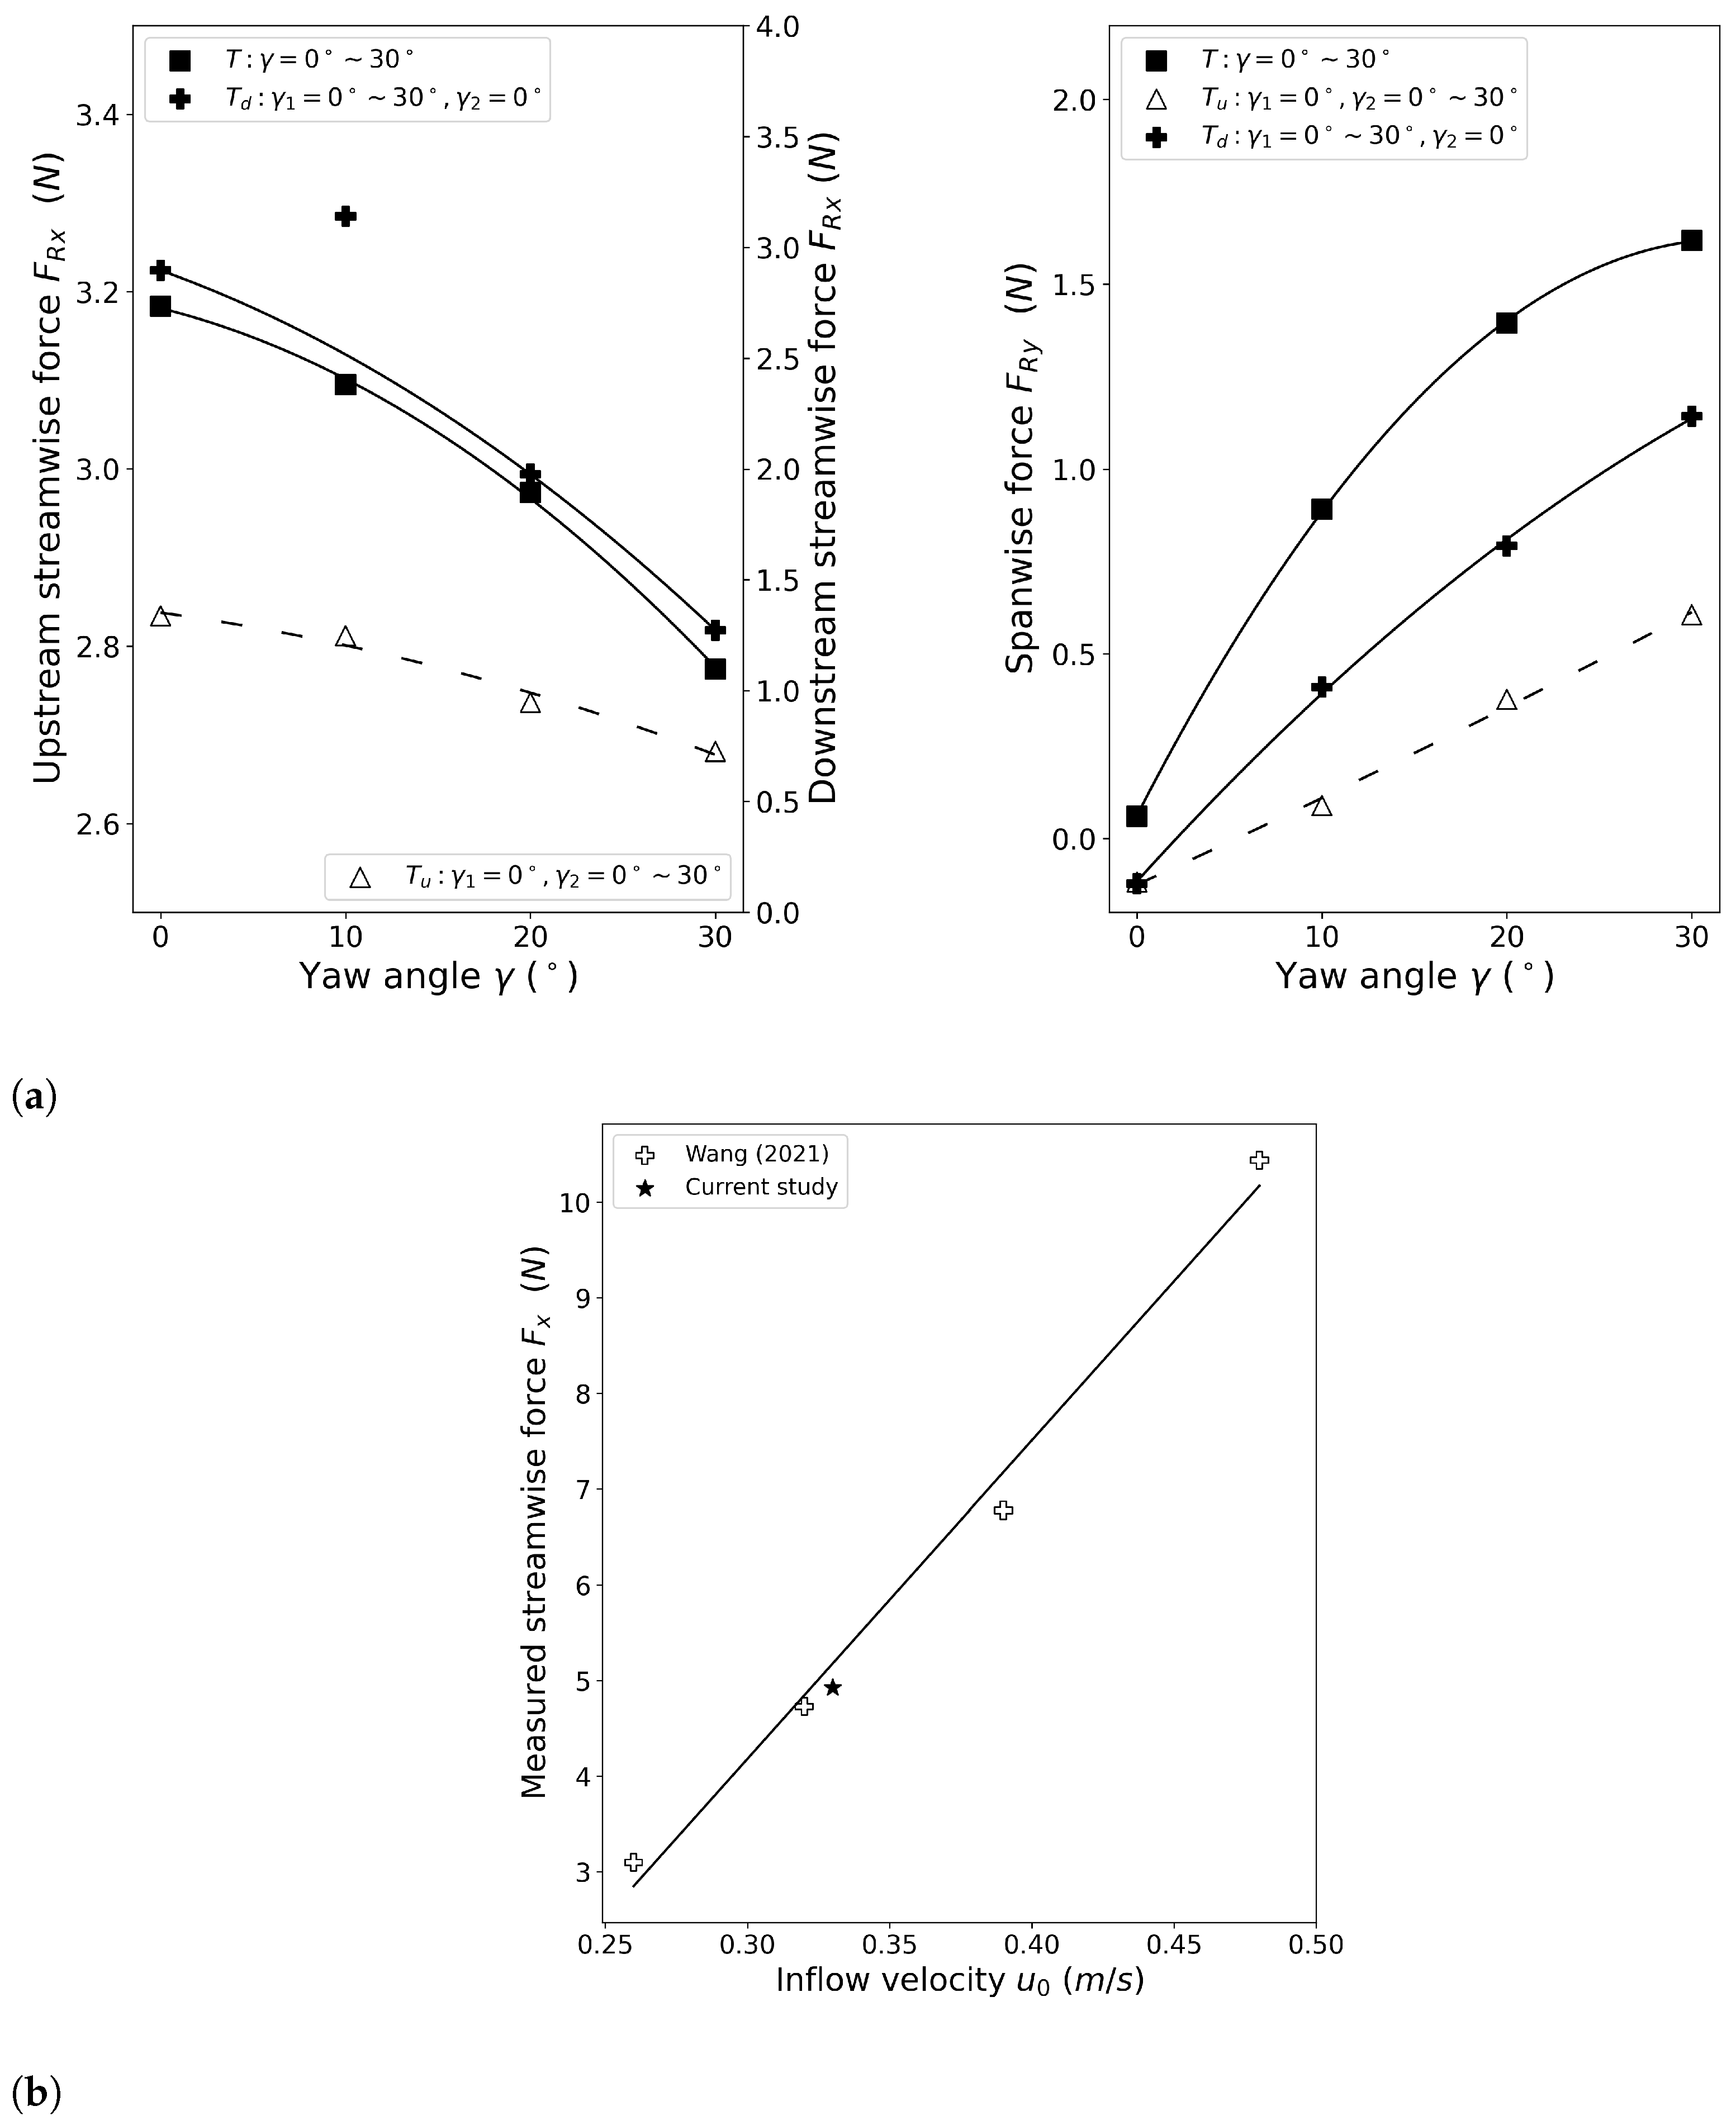
3.1. Thrust Force
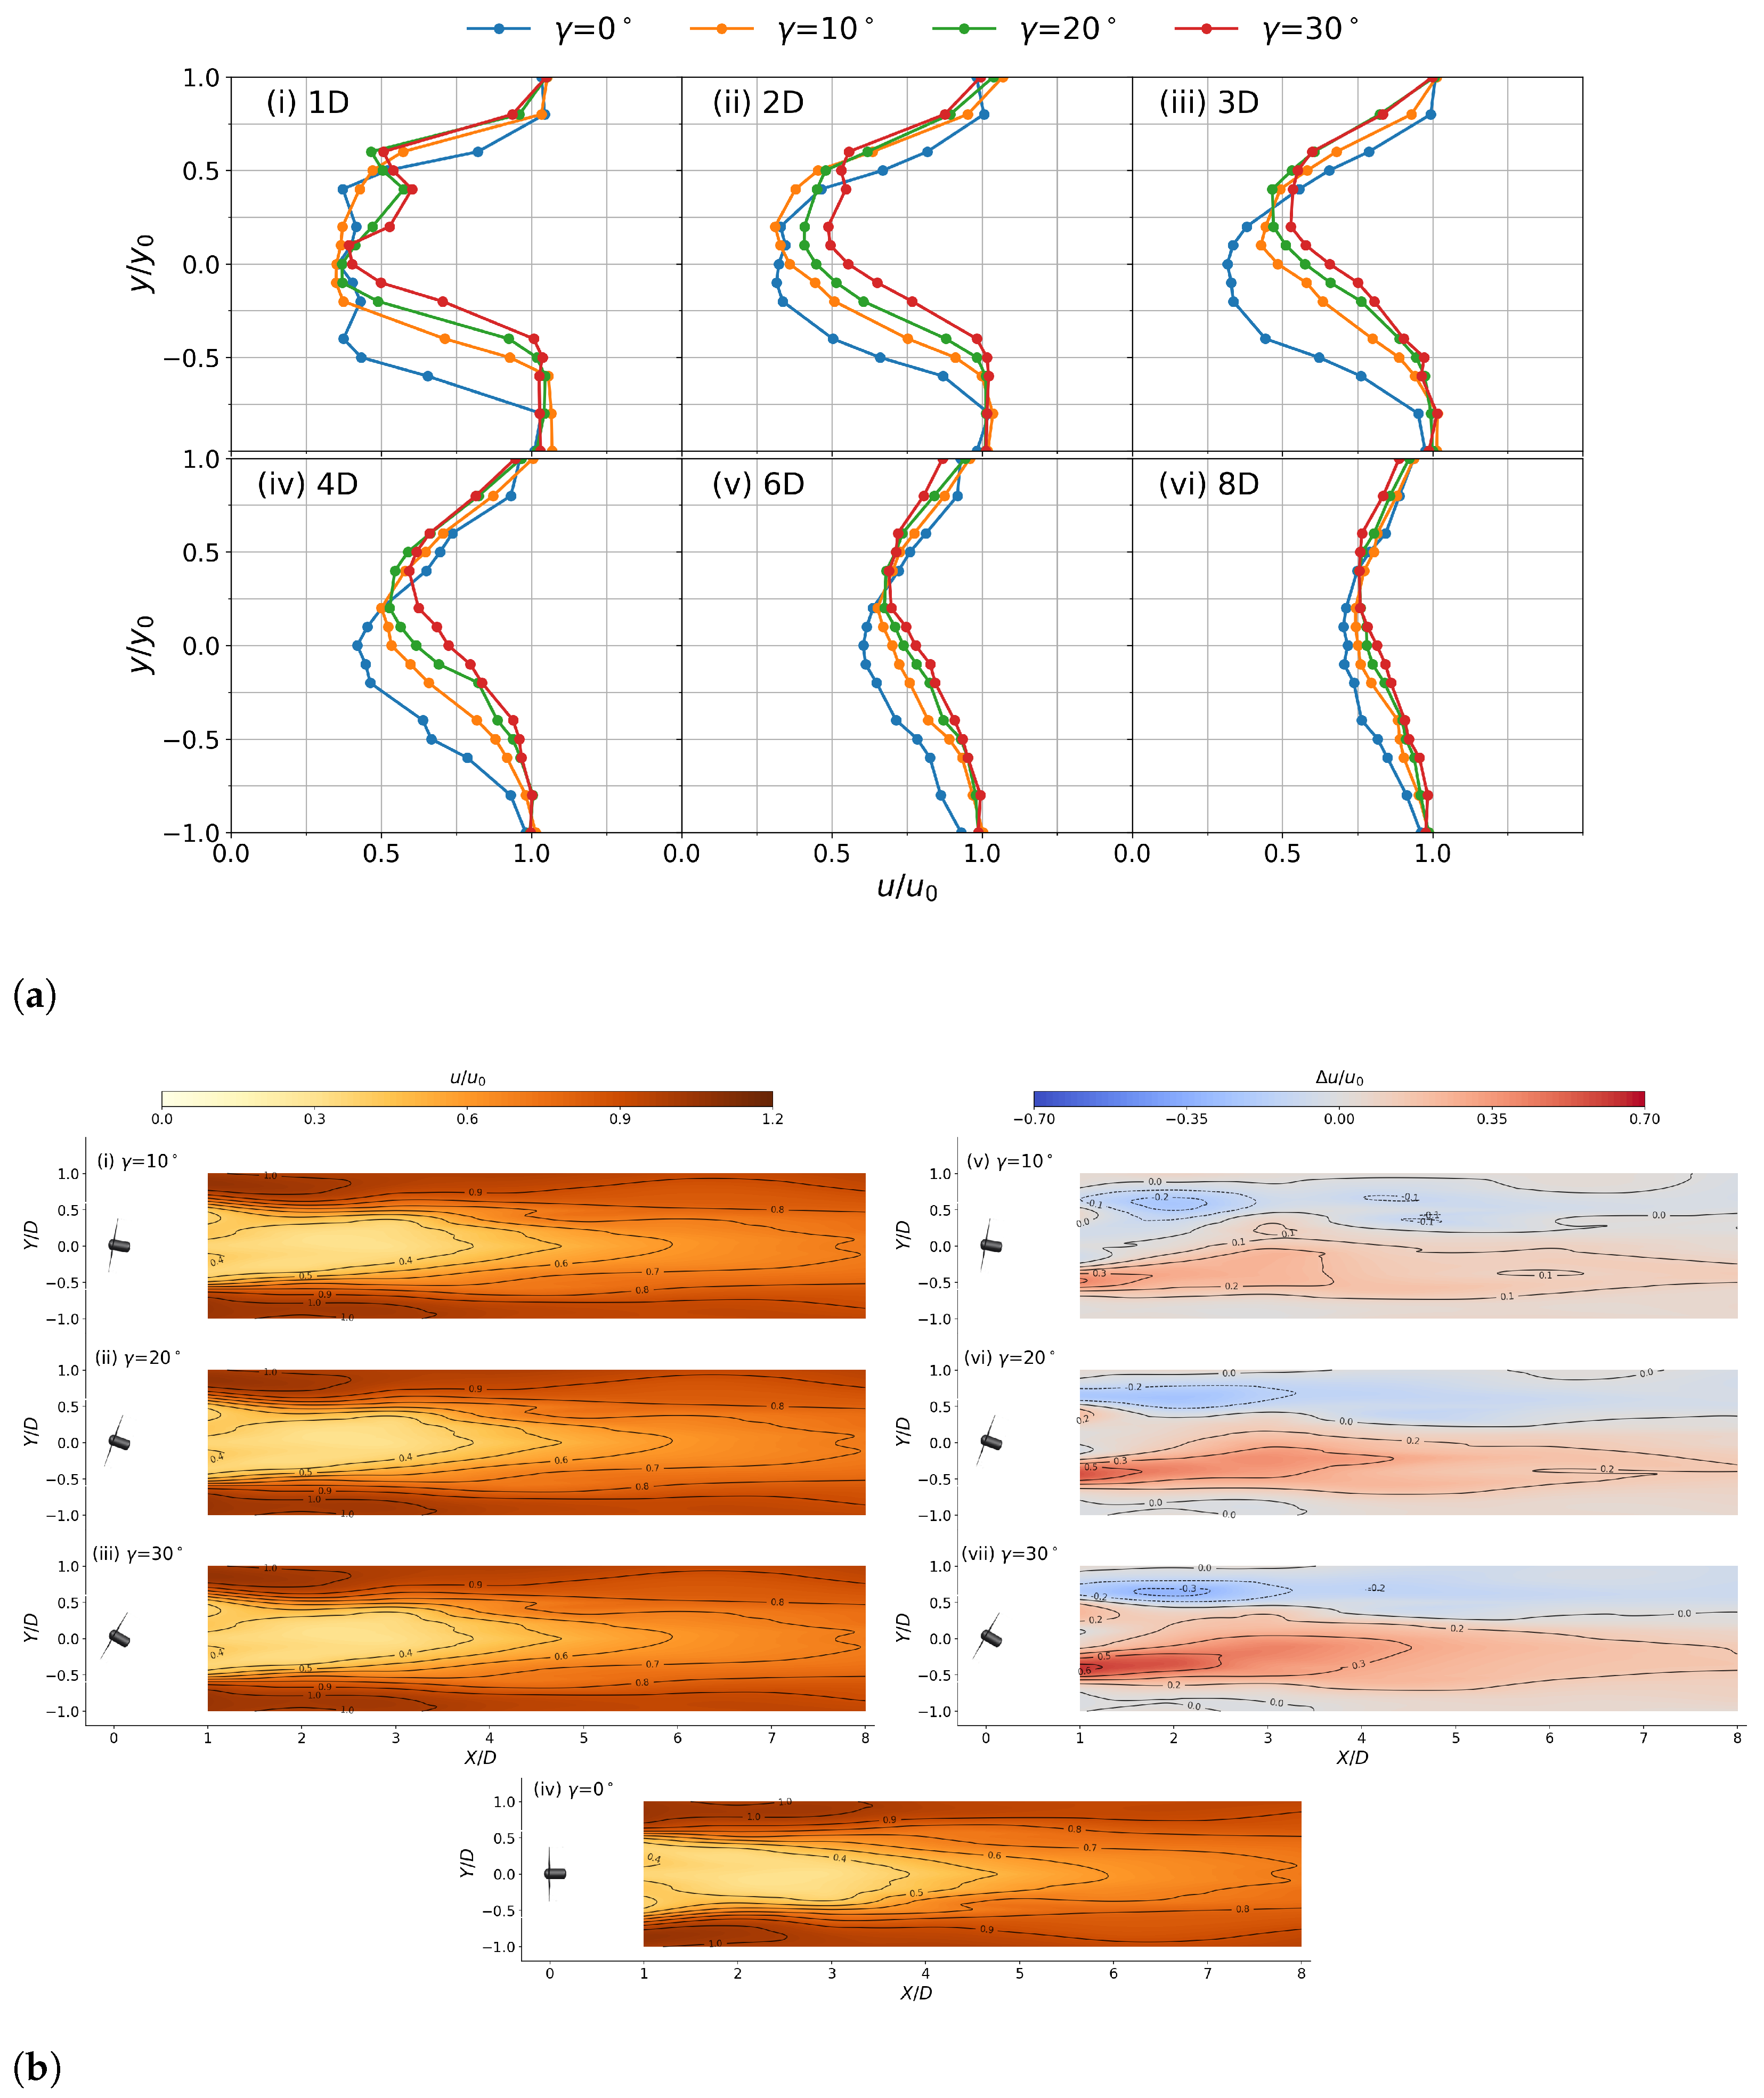
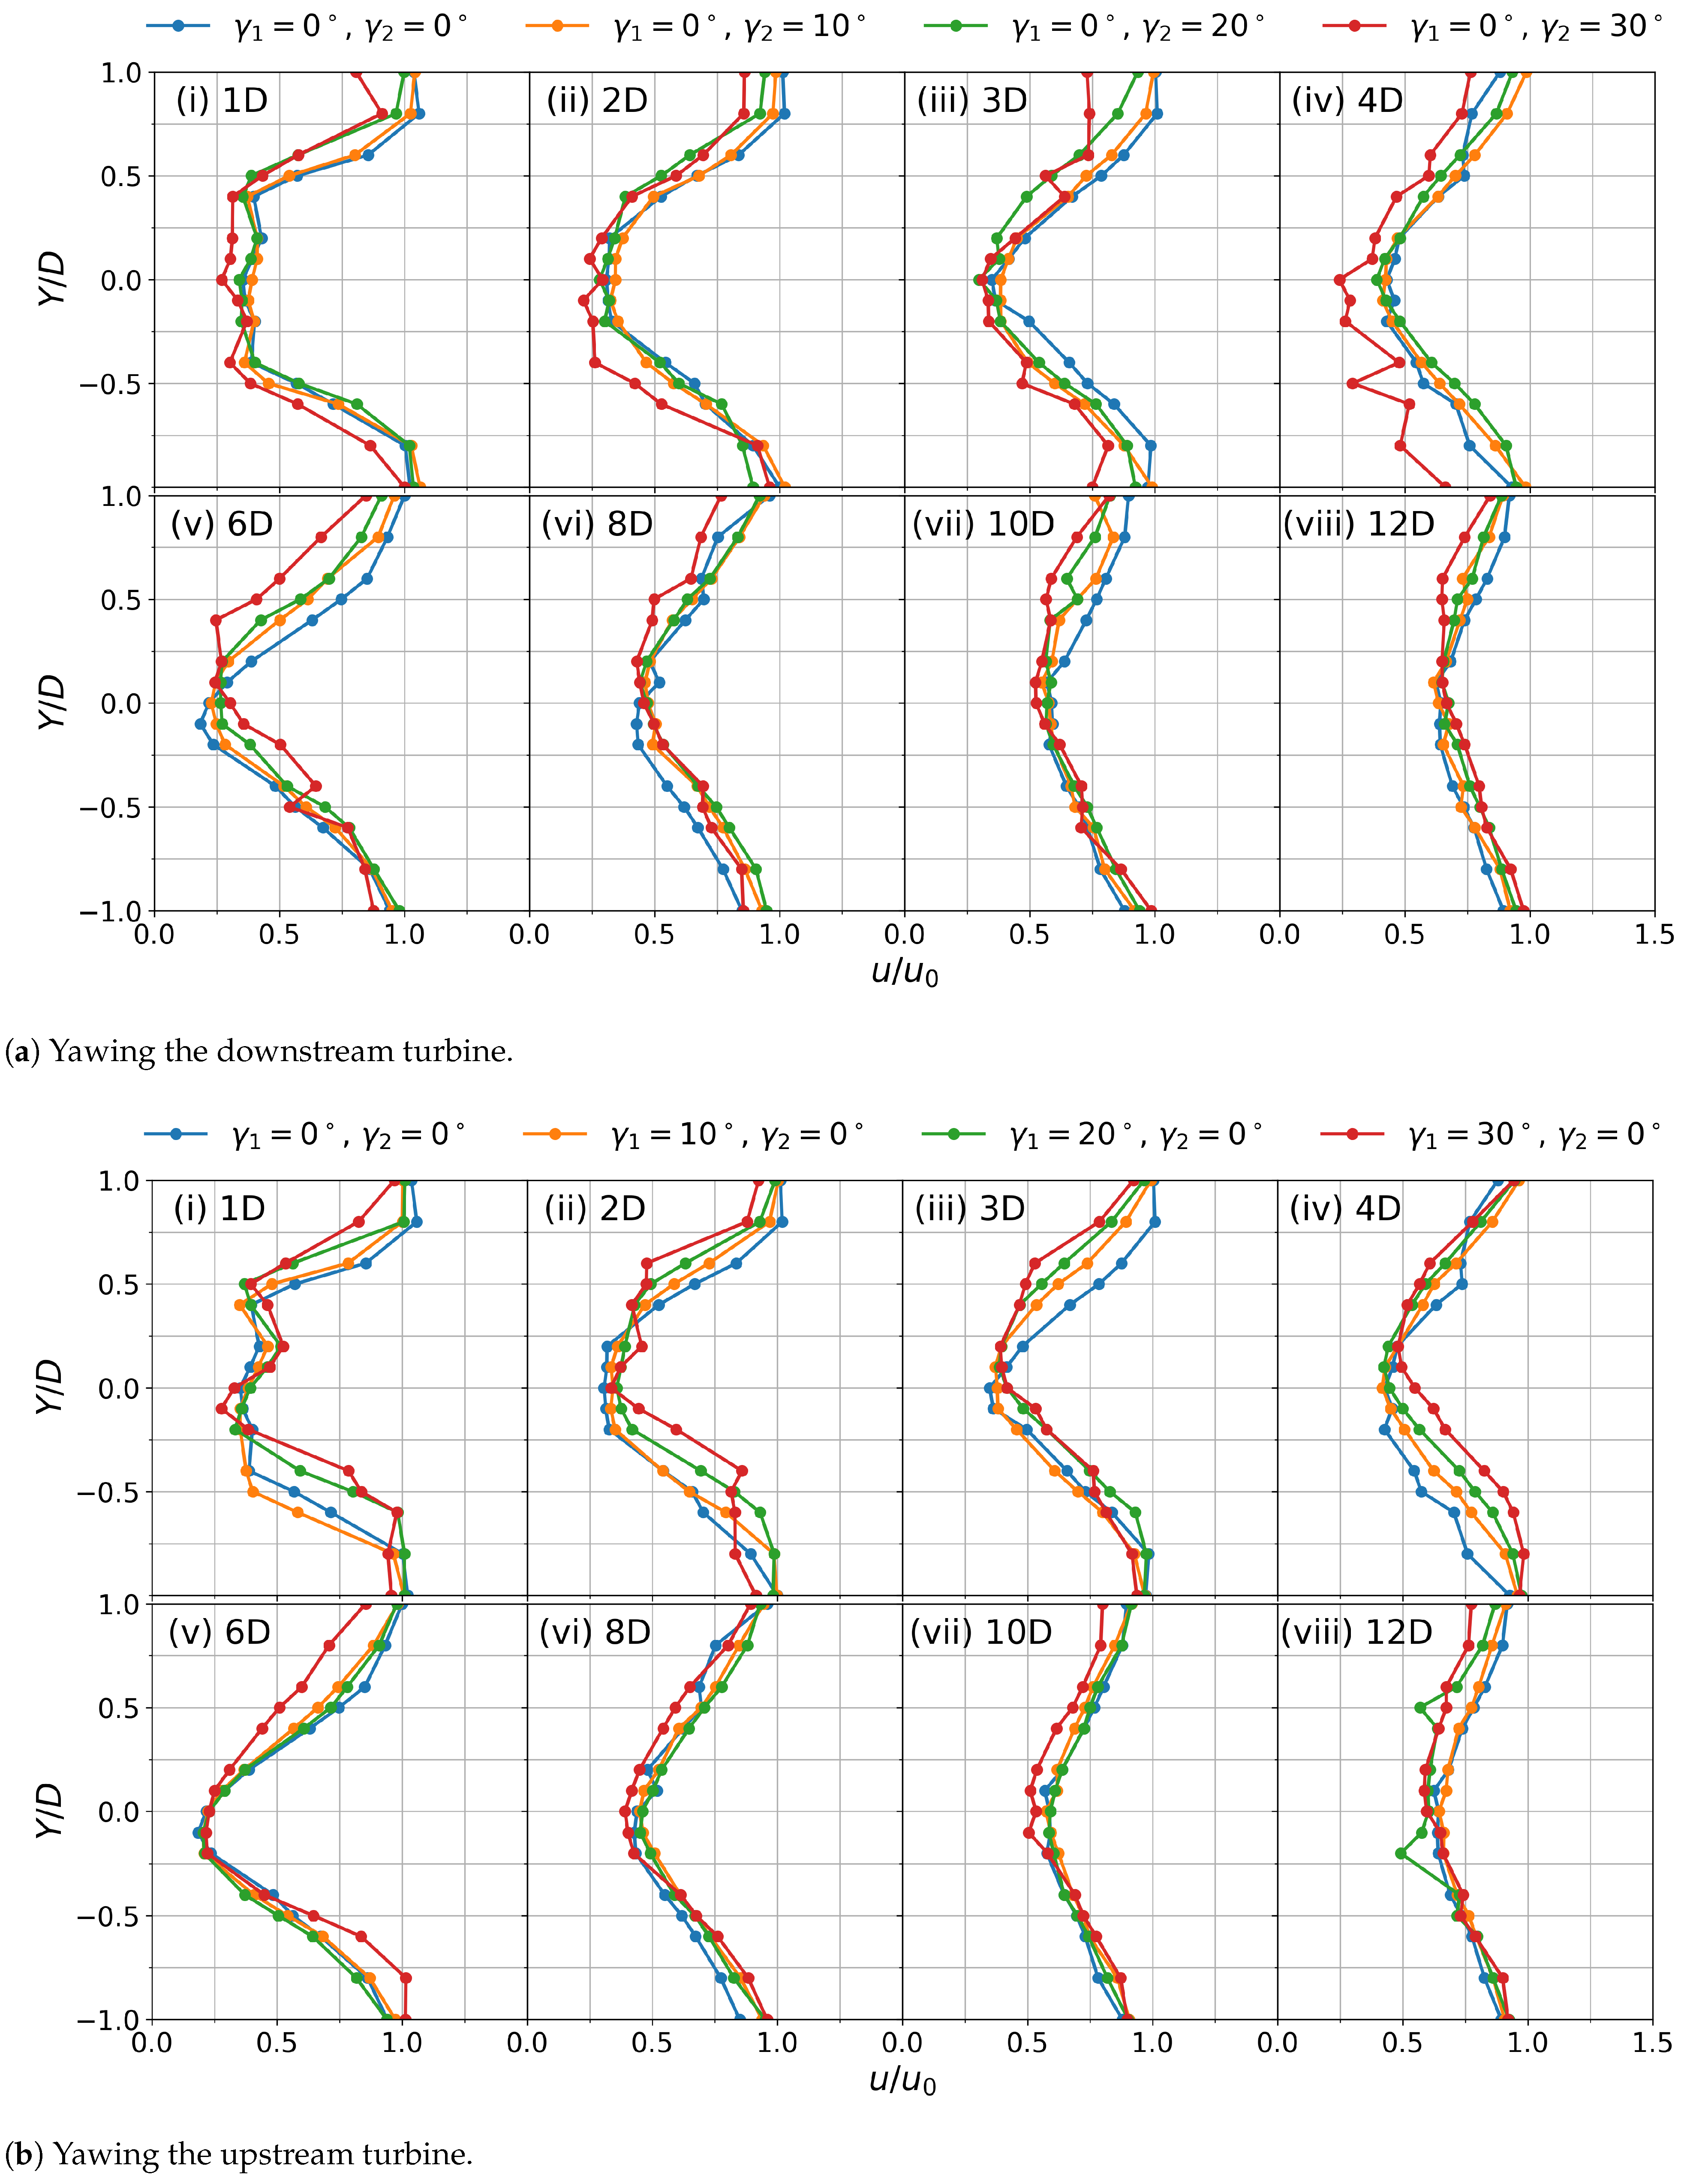
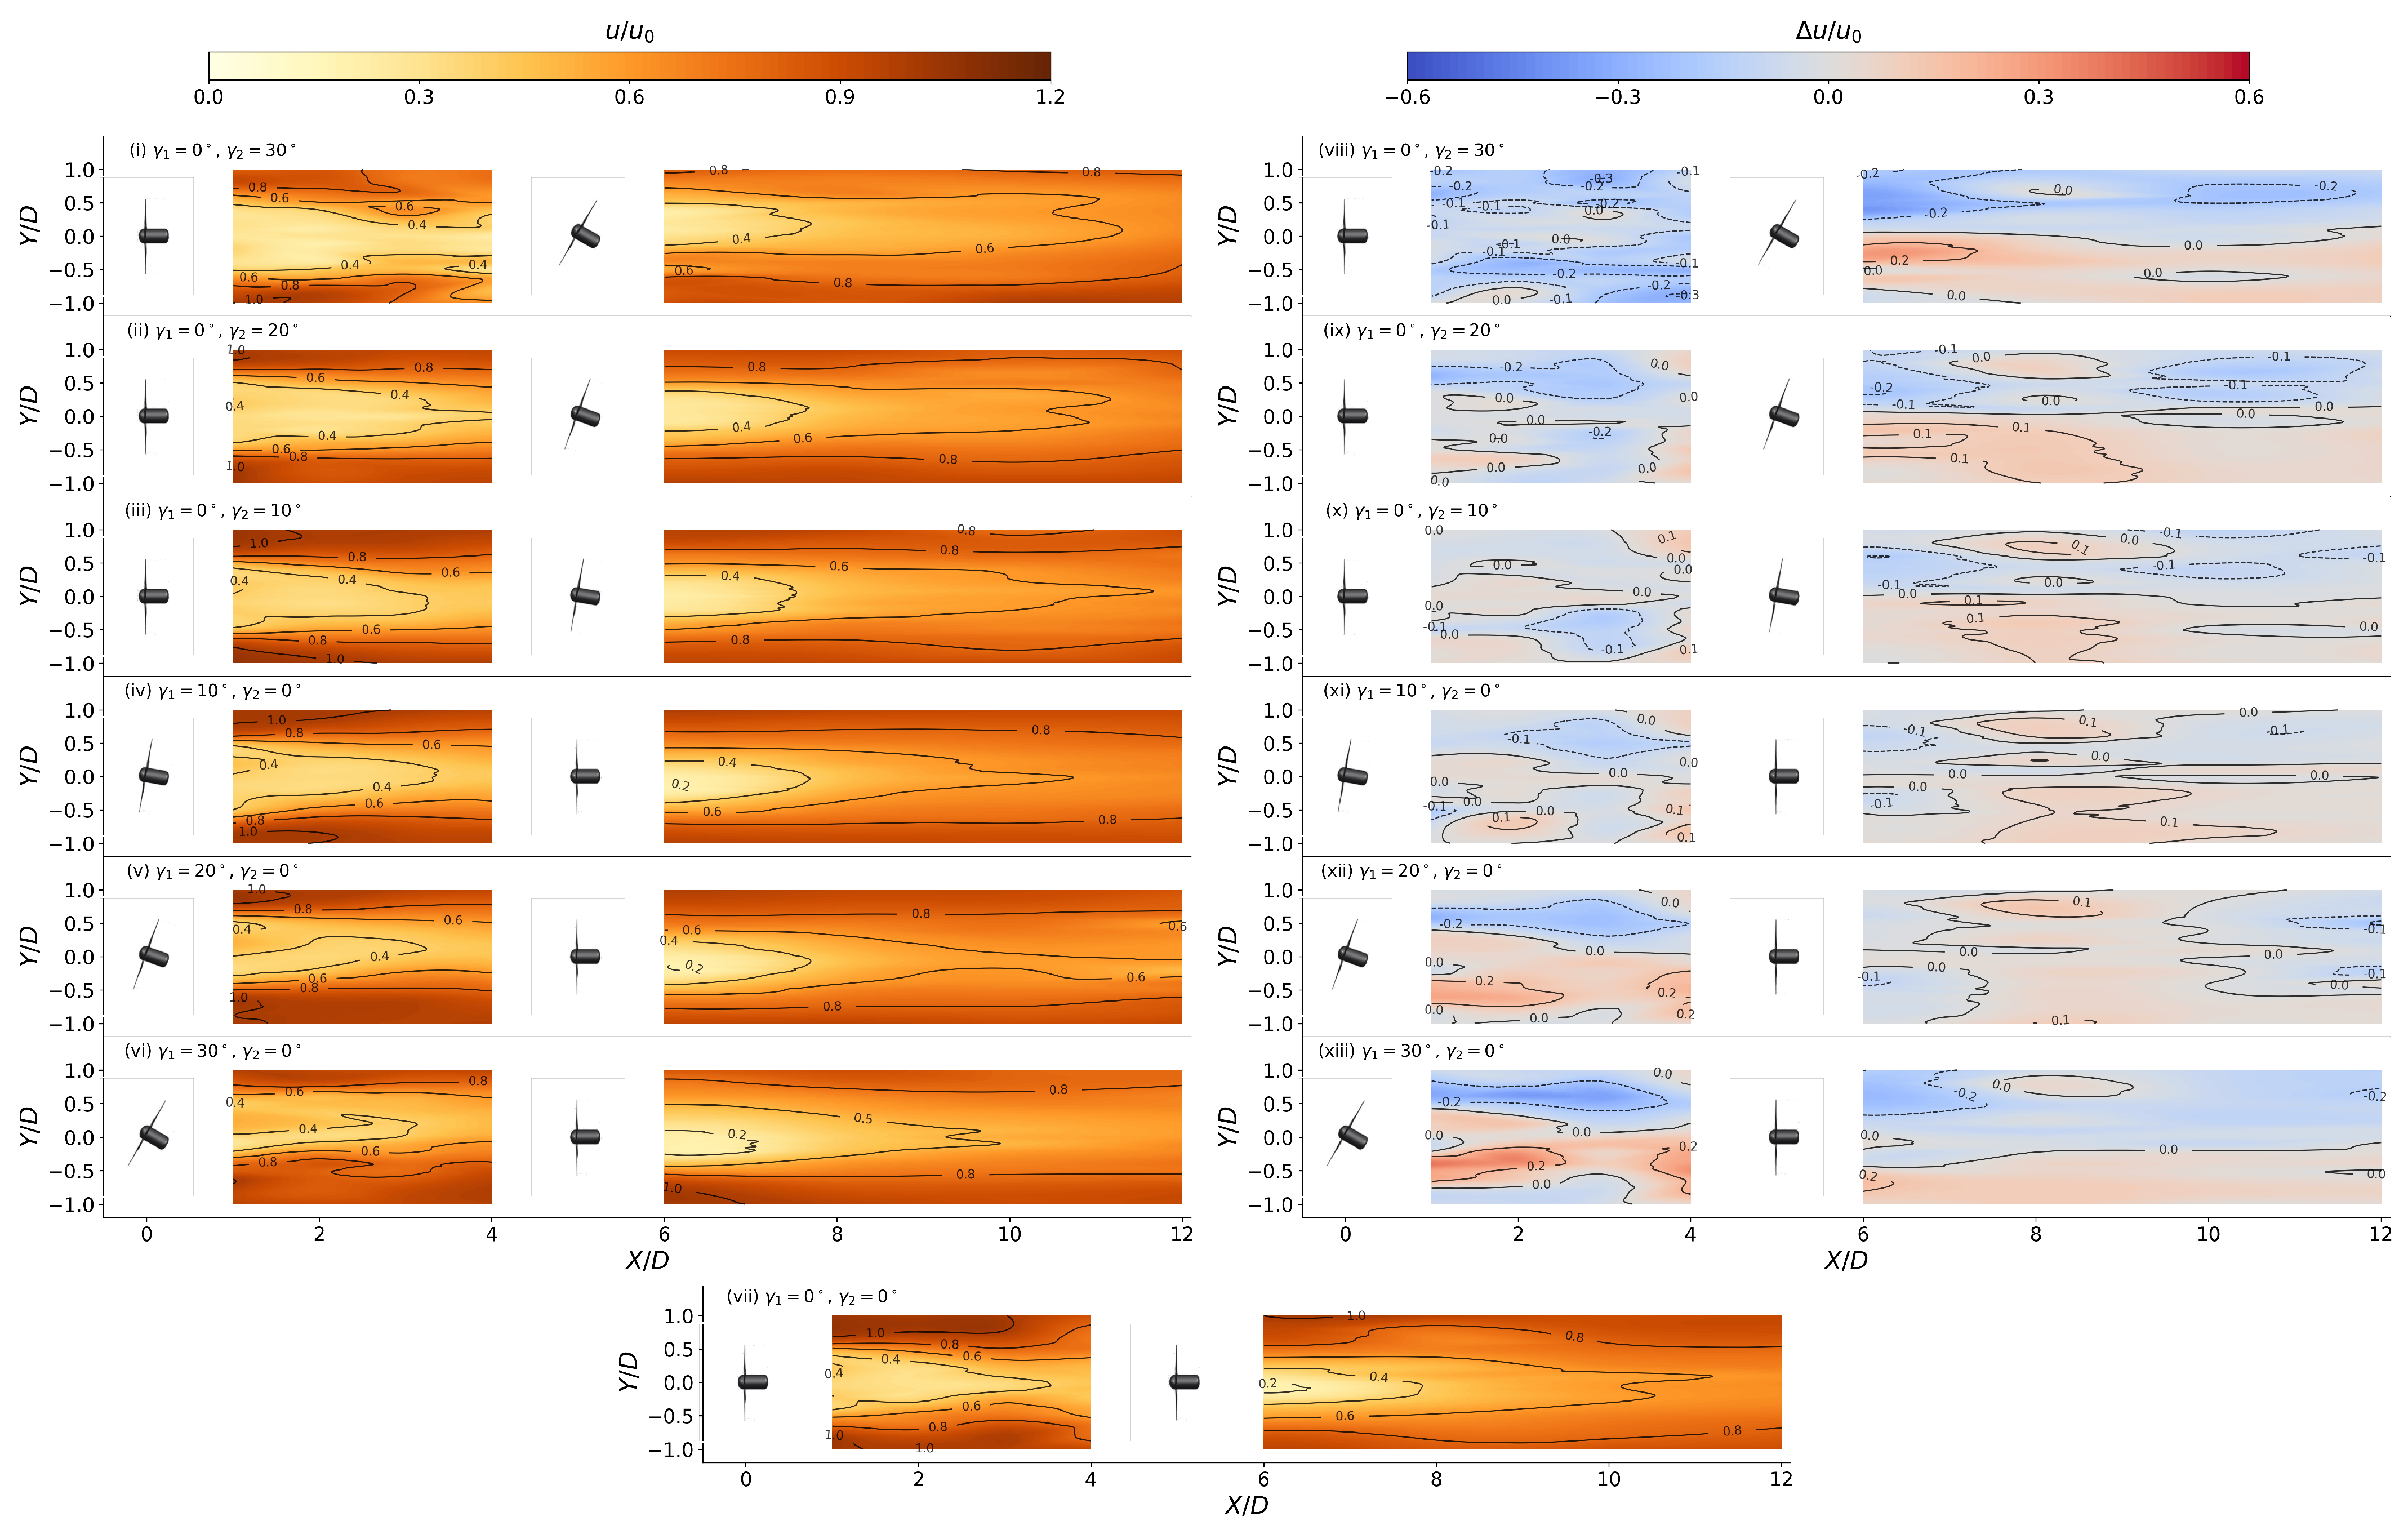
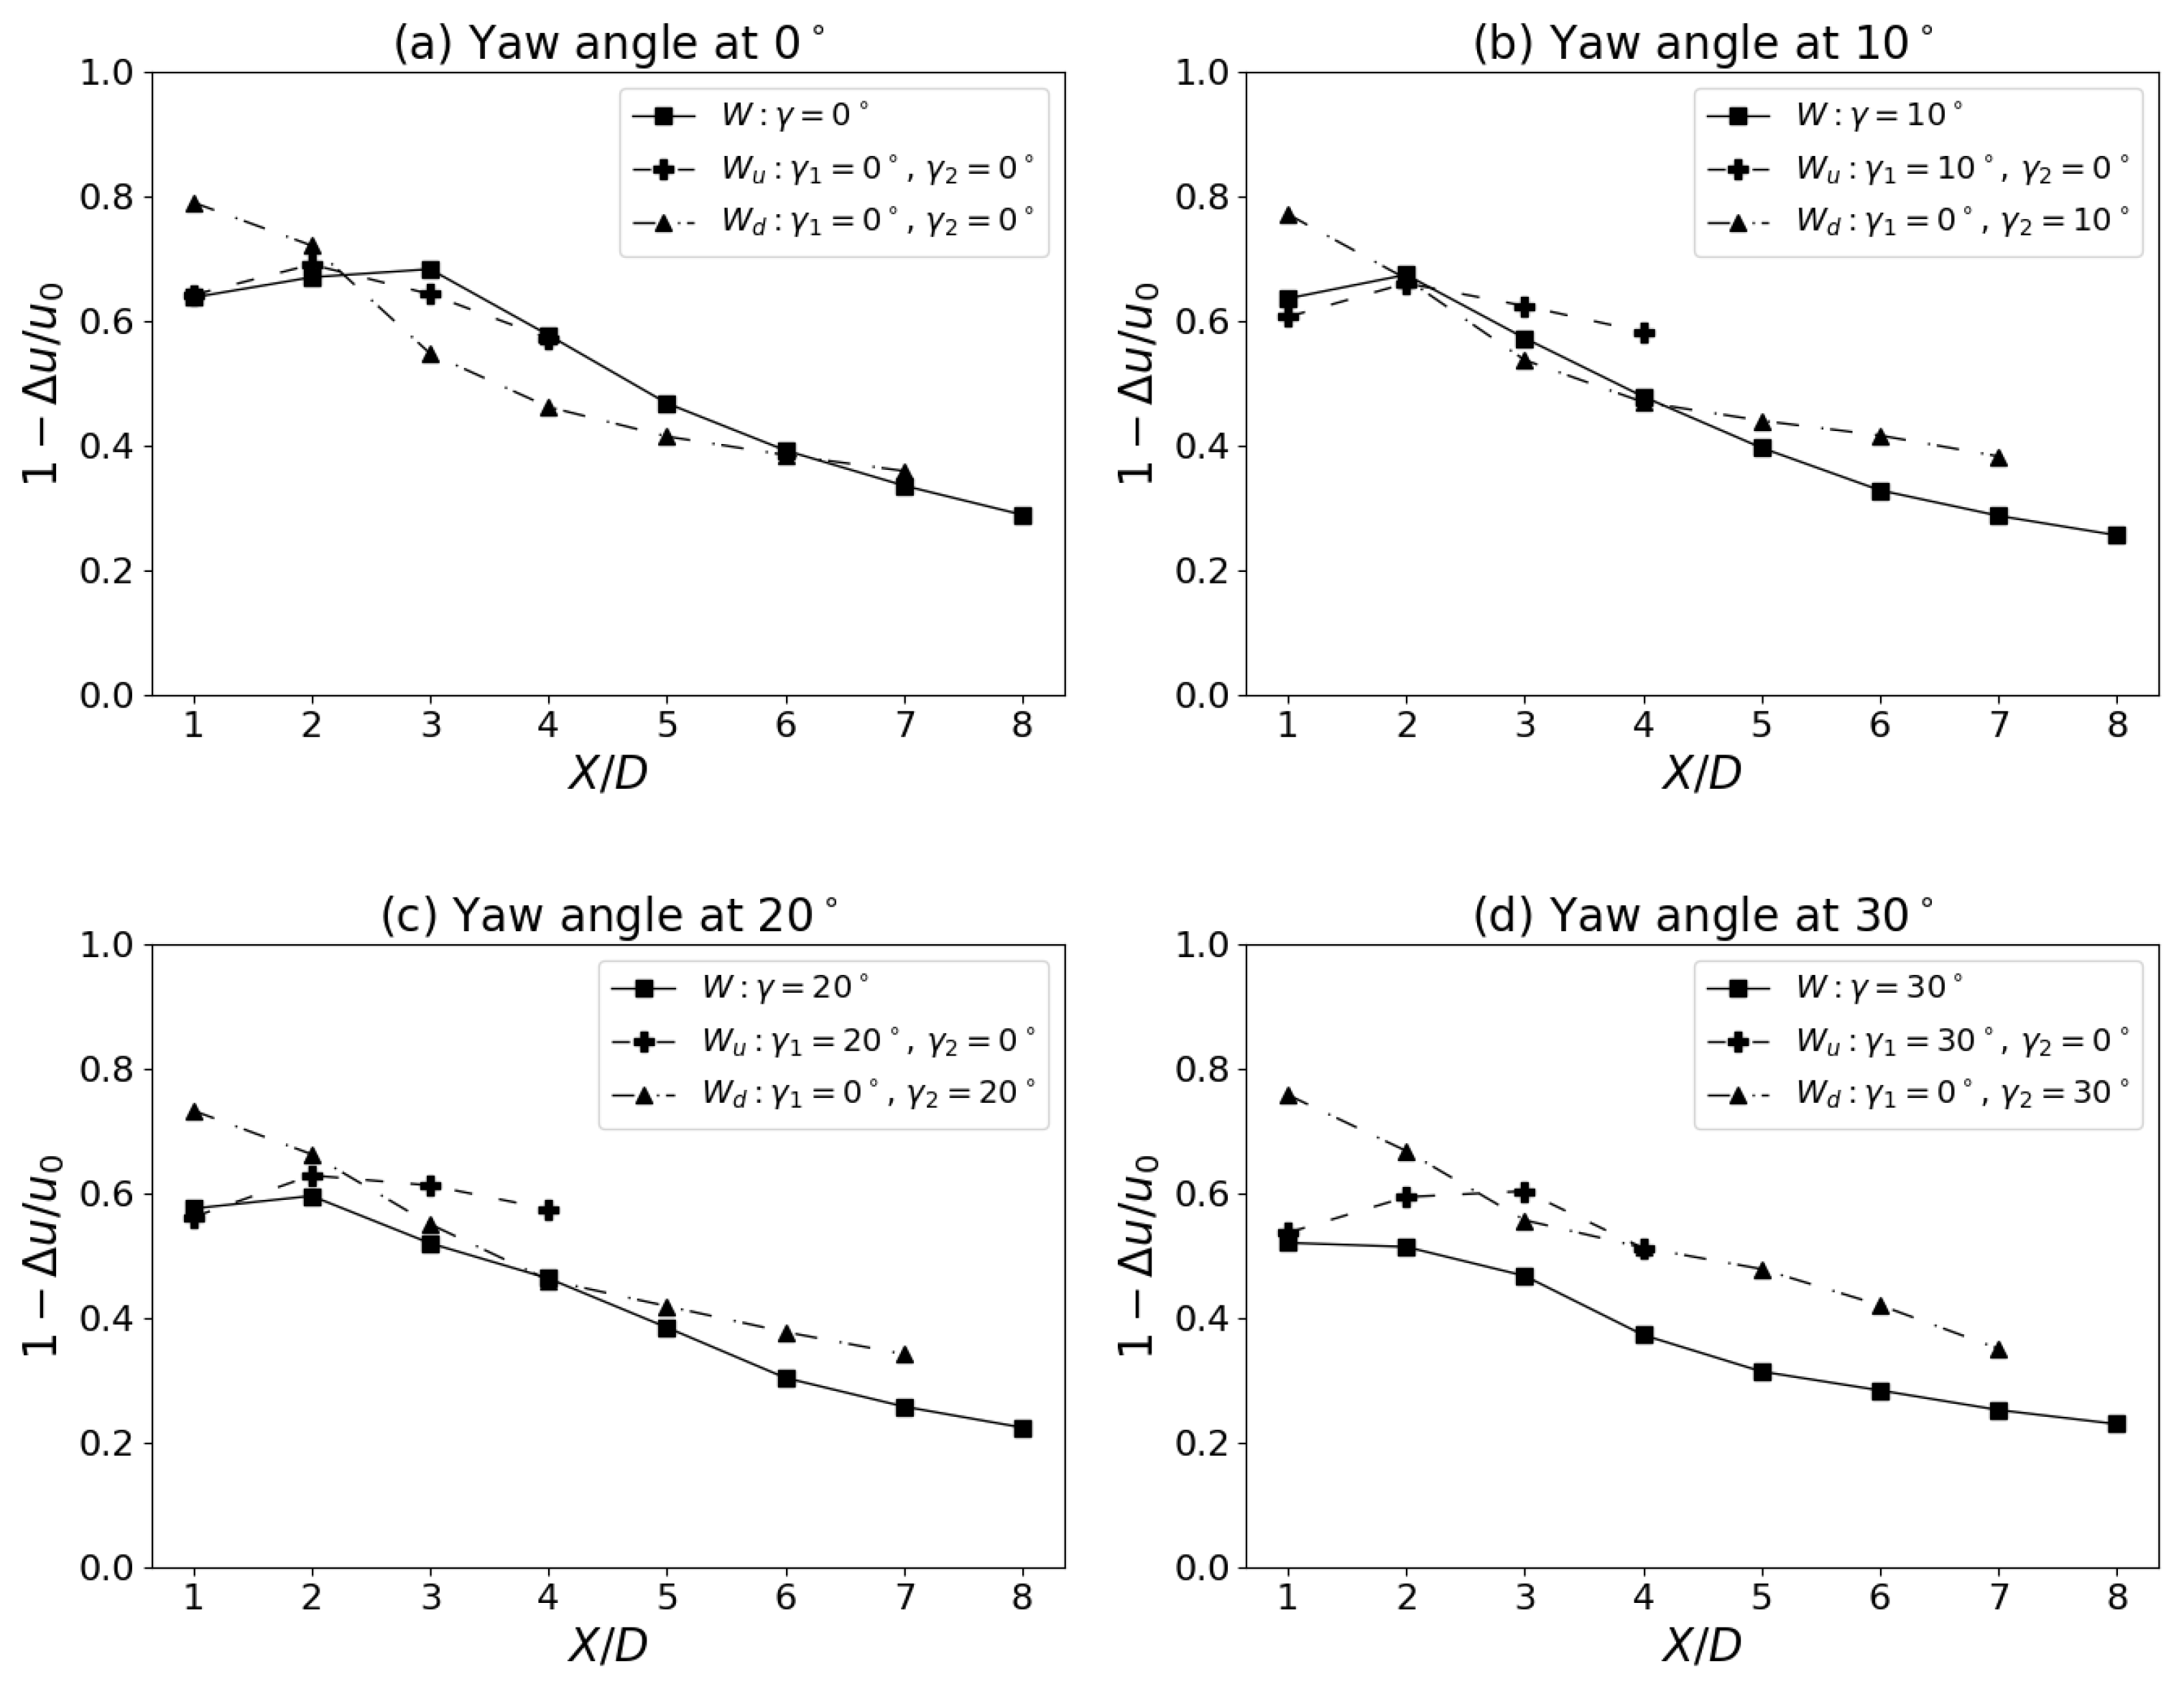
3.2. Wake Velocity Distribution
3.2.1. Scenario 1: Single Turbine
3.2.2. Scenario 2: Yawing One of the Two Turbines
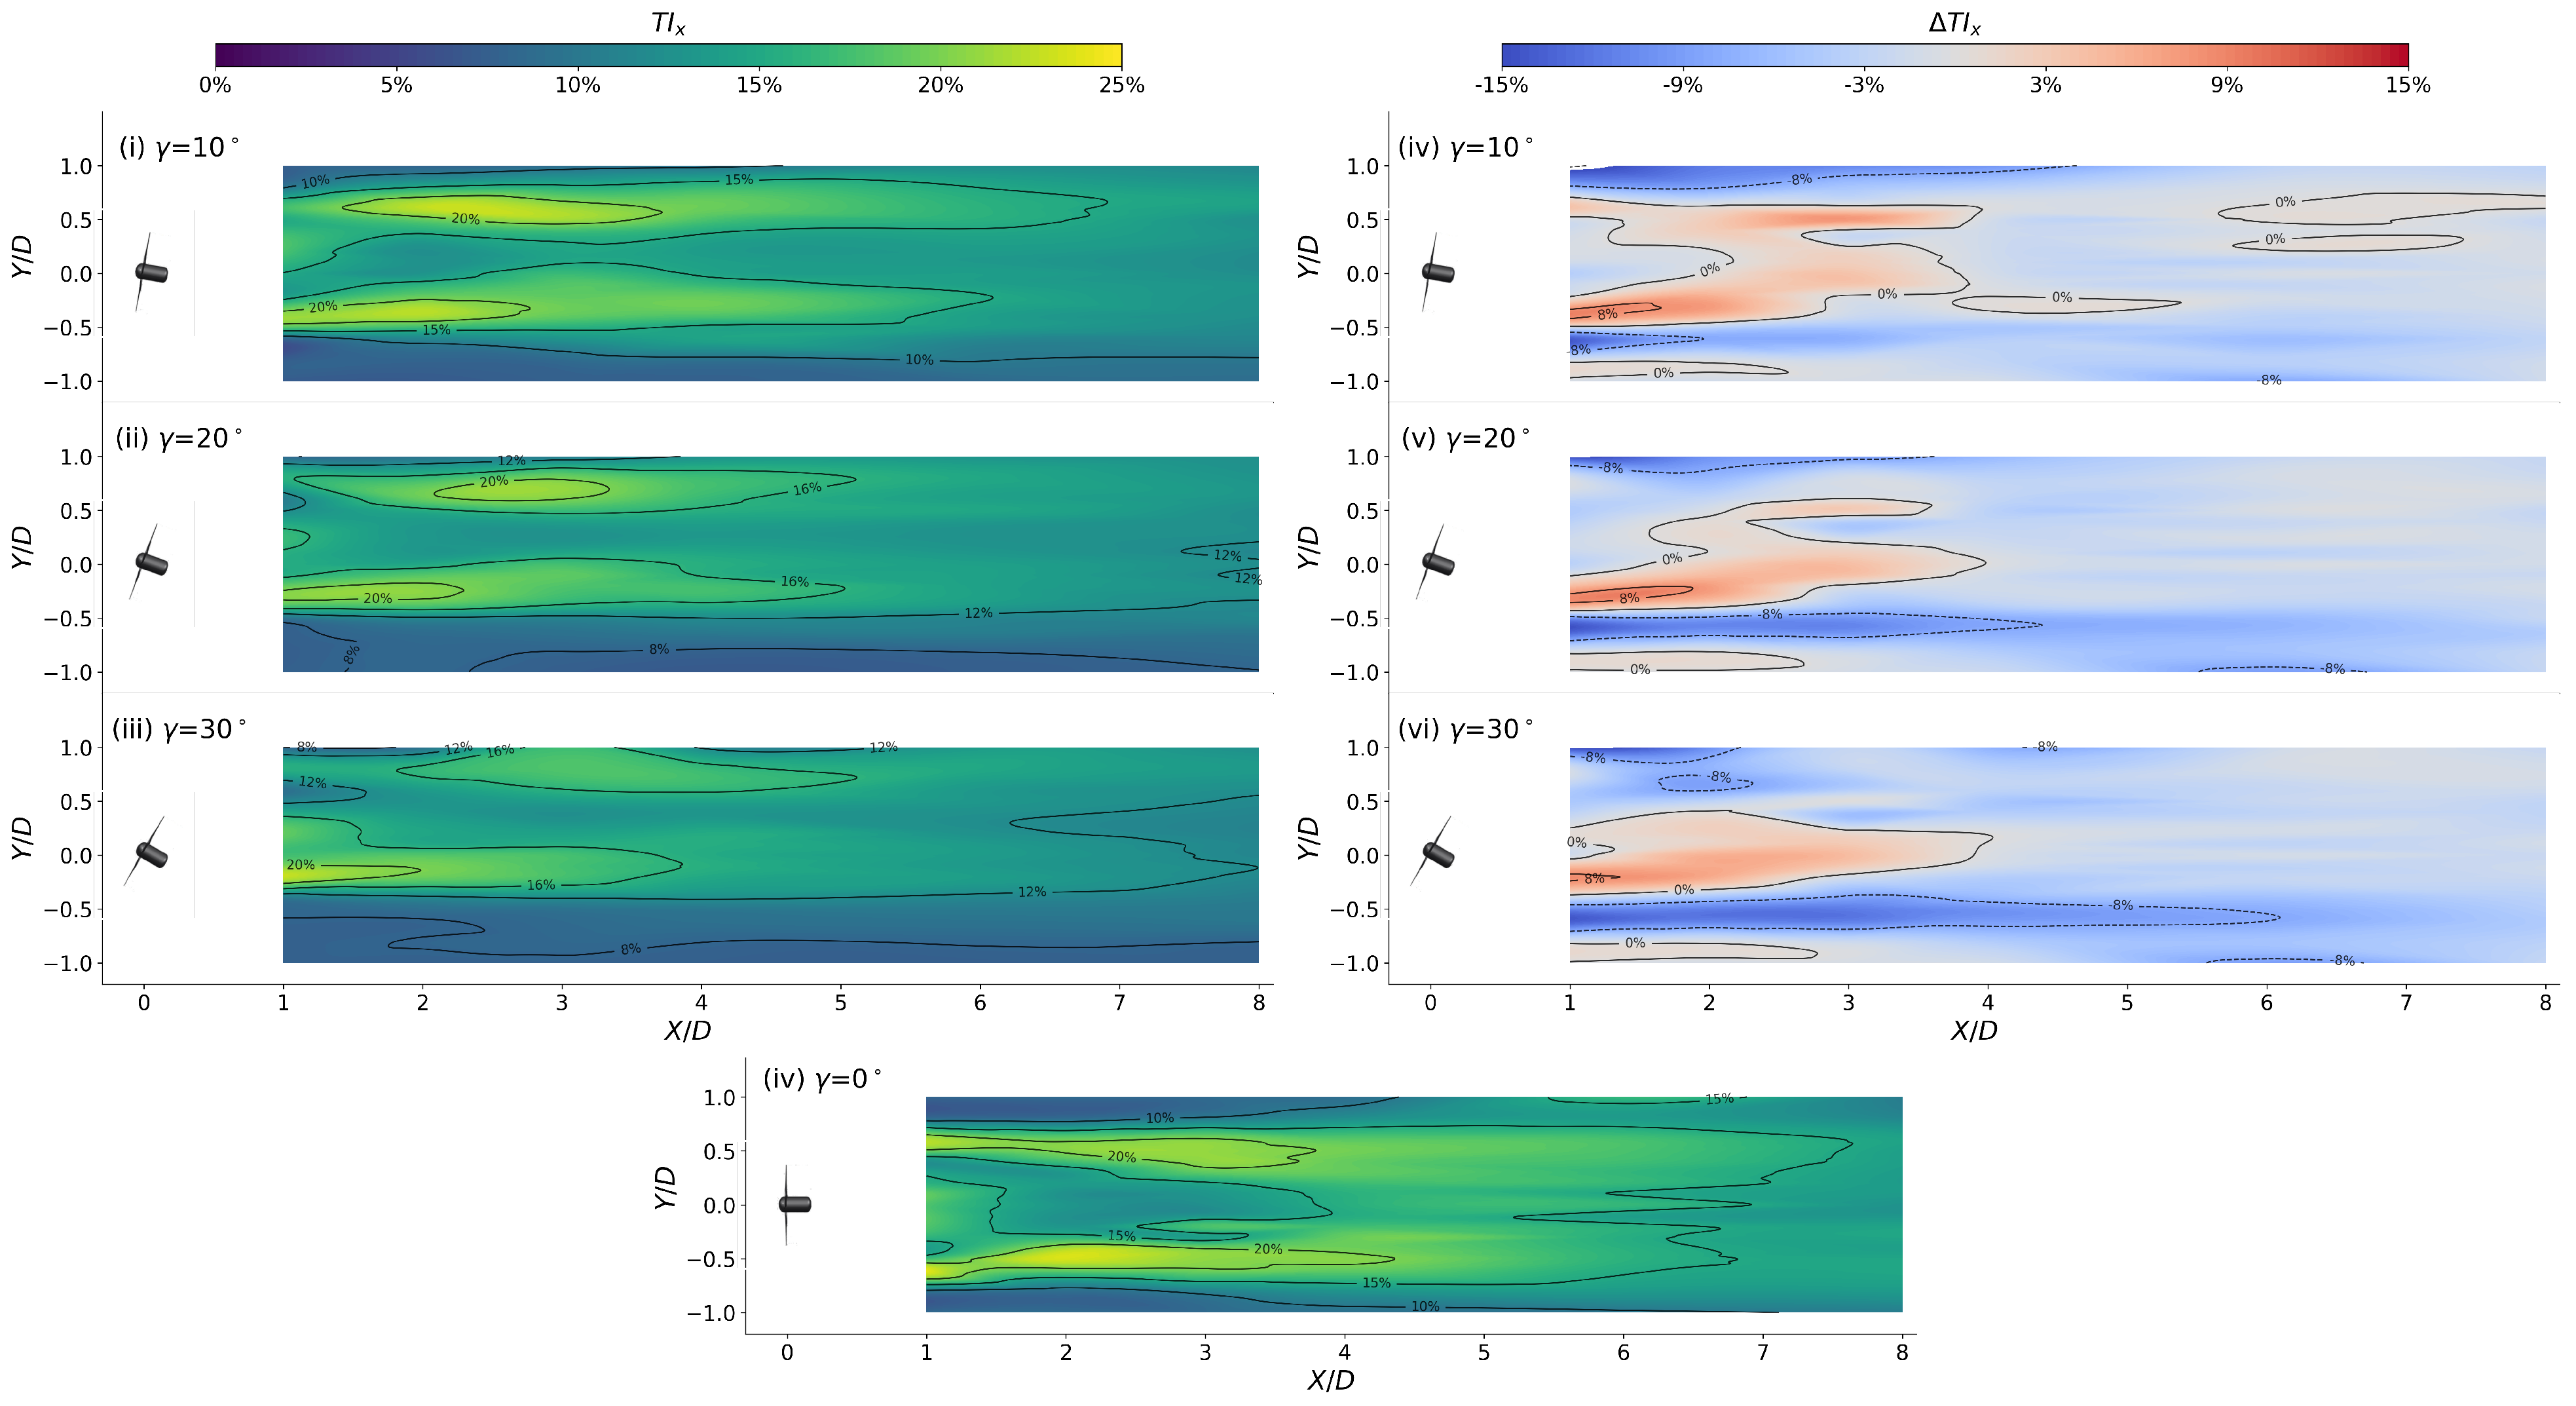
3.3. Turbulence Intensity Distribution
3.3.1. Scenario 1: Single Turbine
3.3.2. Scenario 2: Yawing One of the Two Turbines
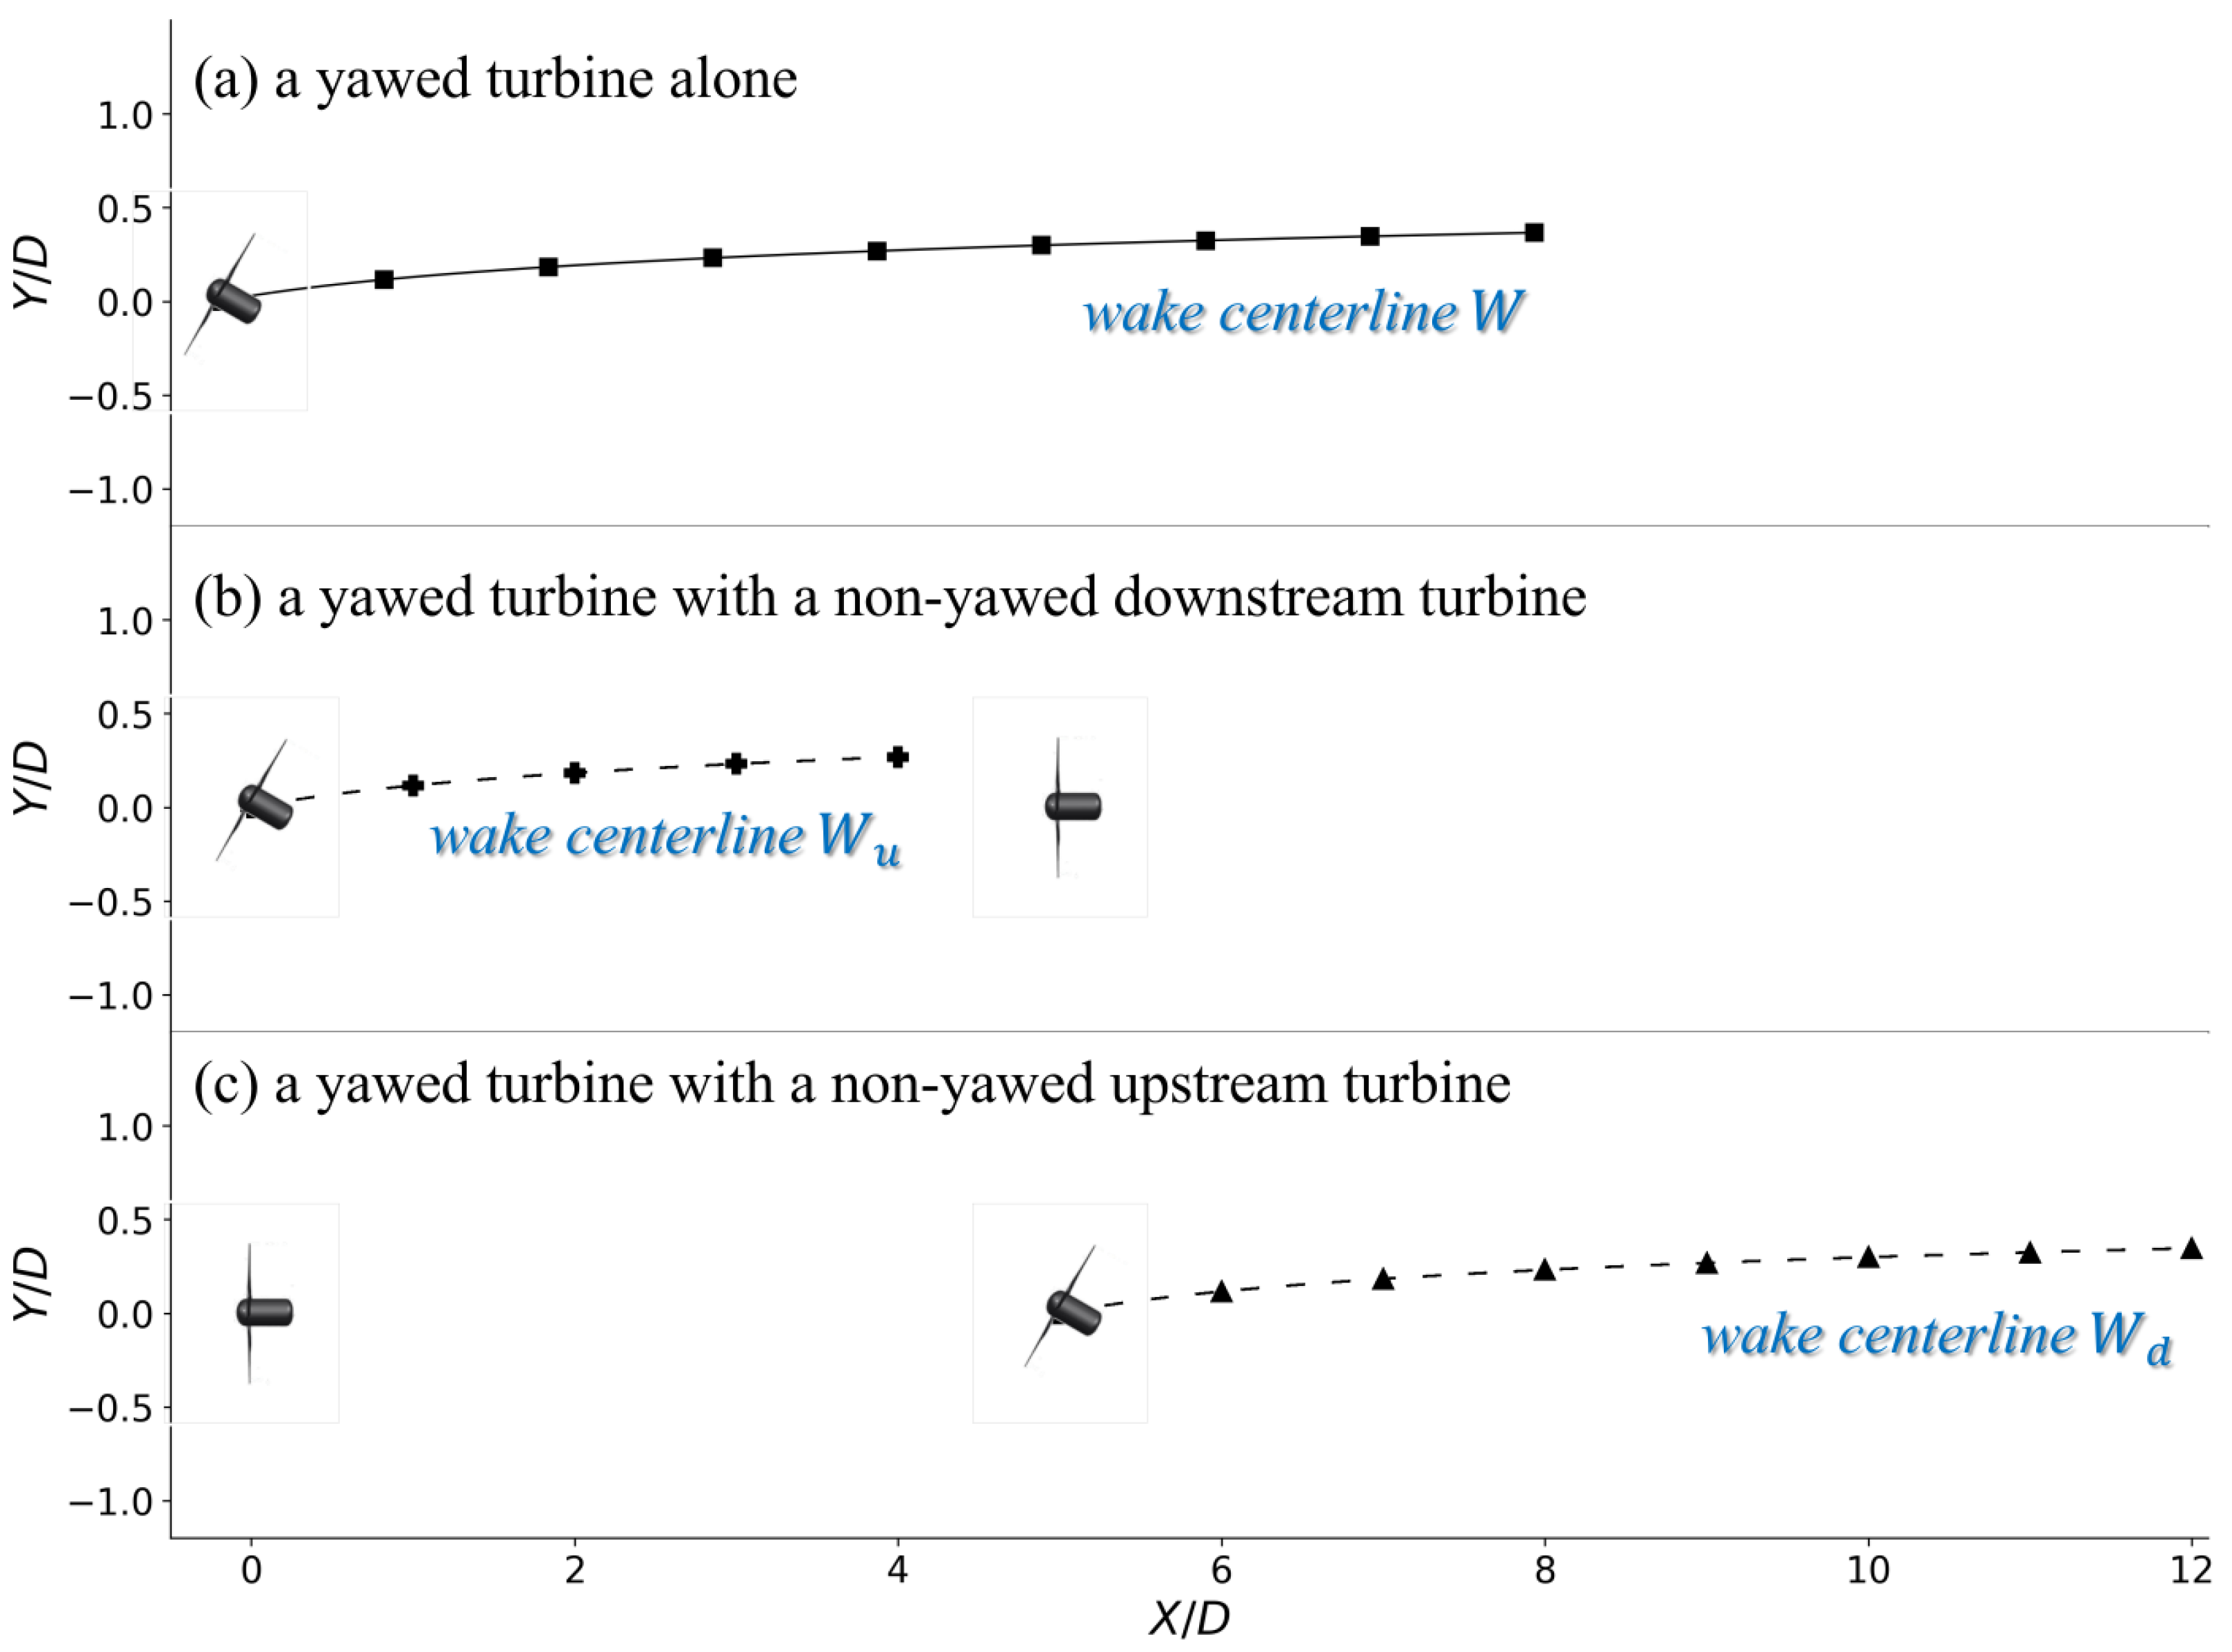
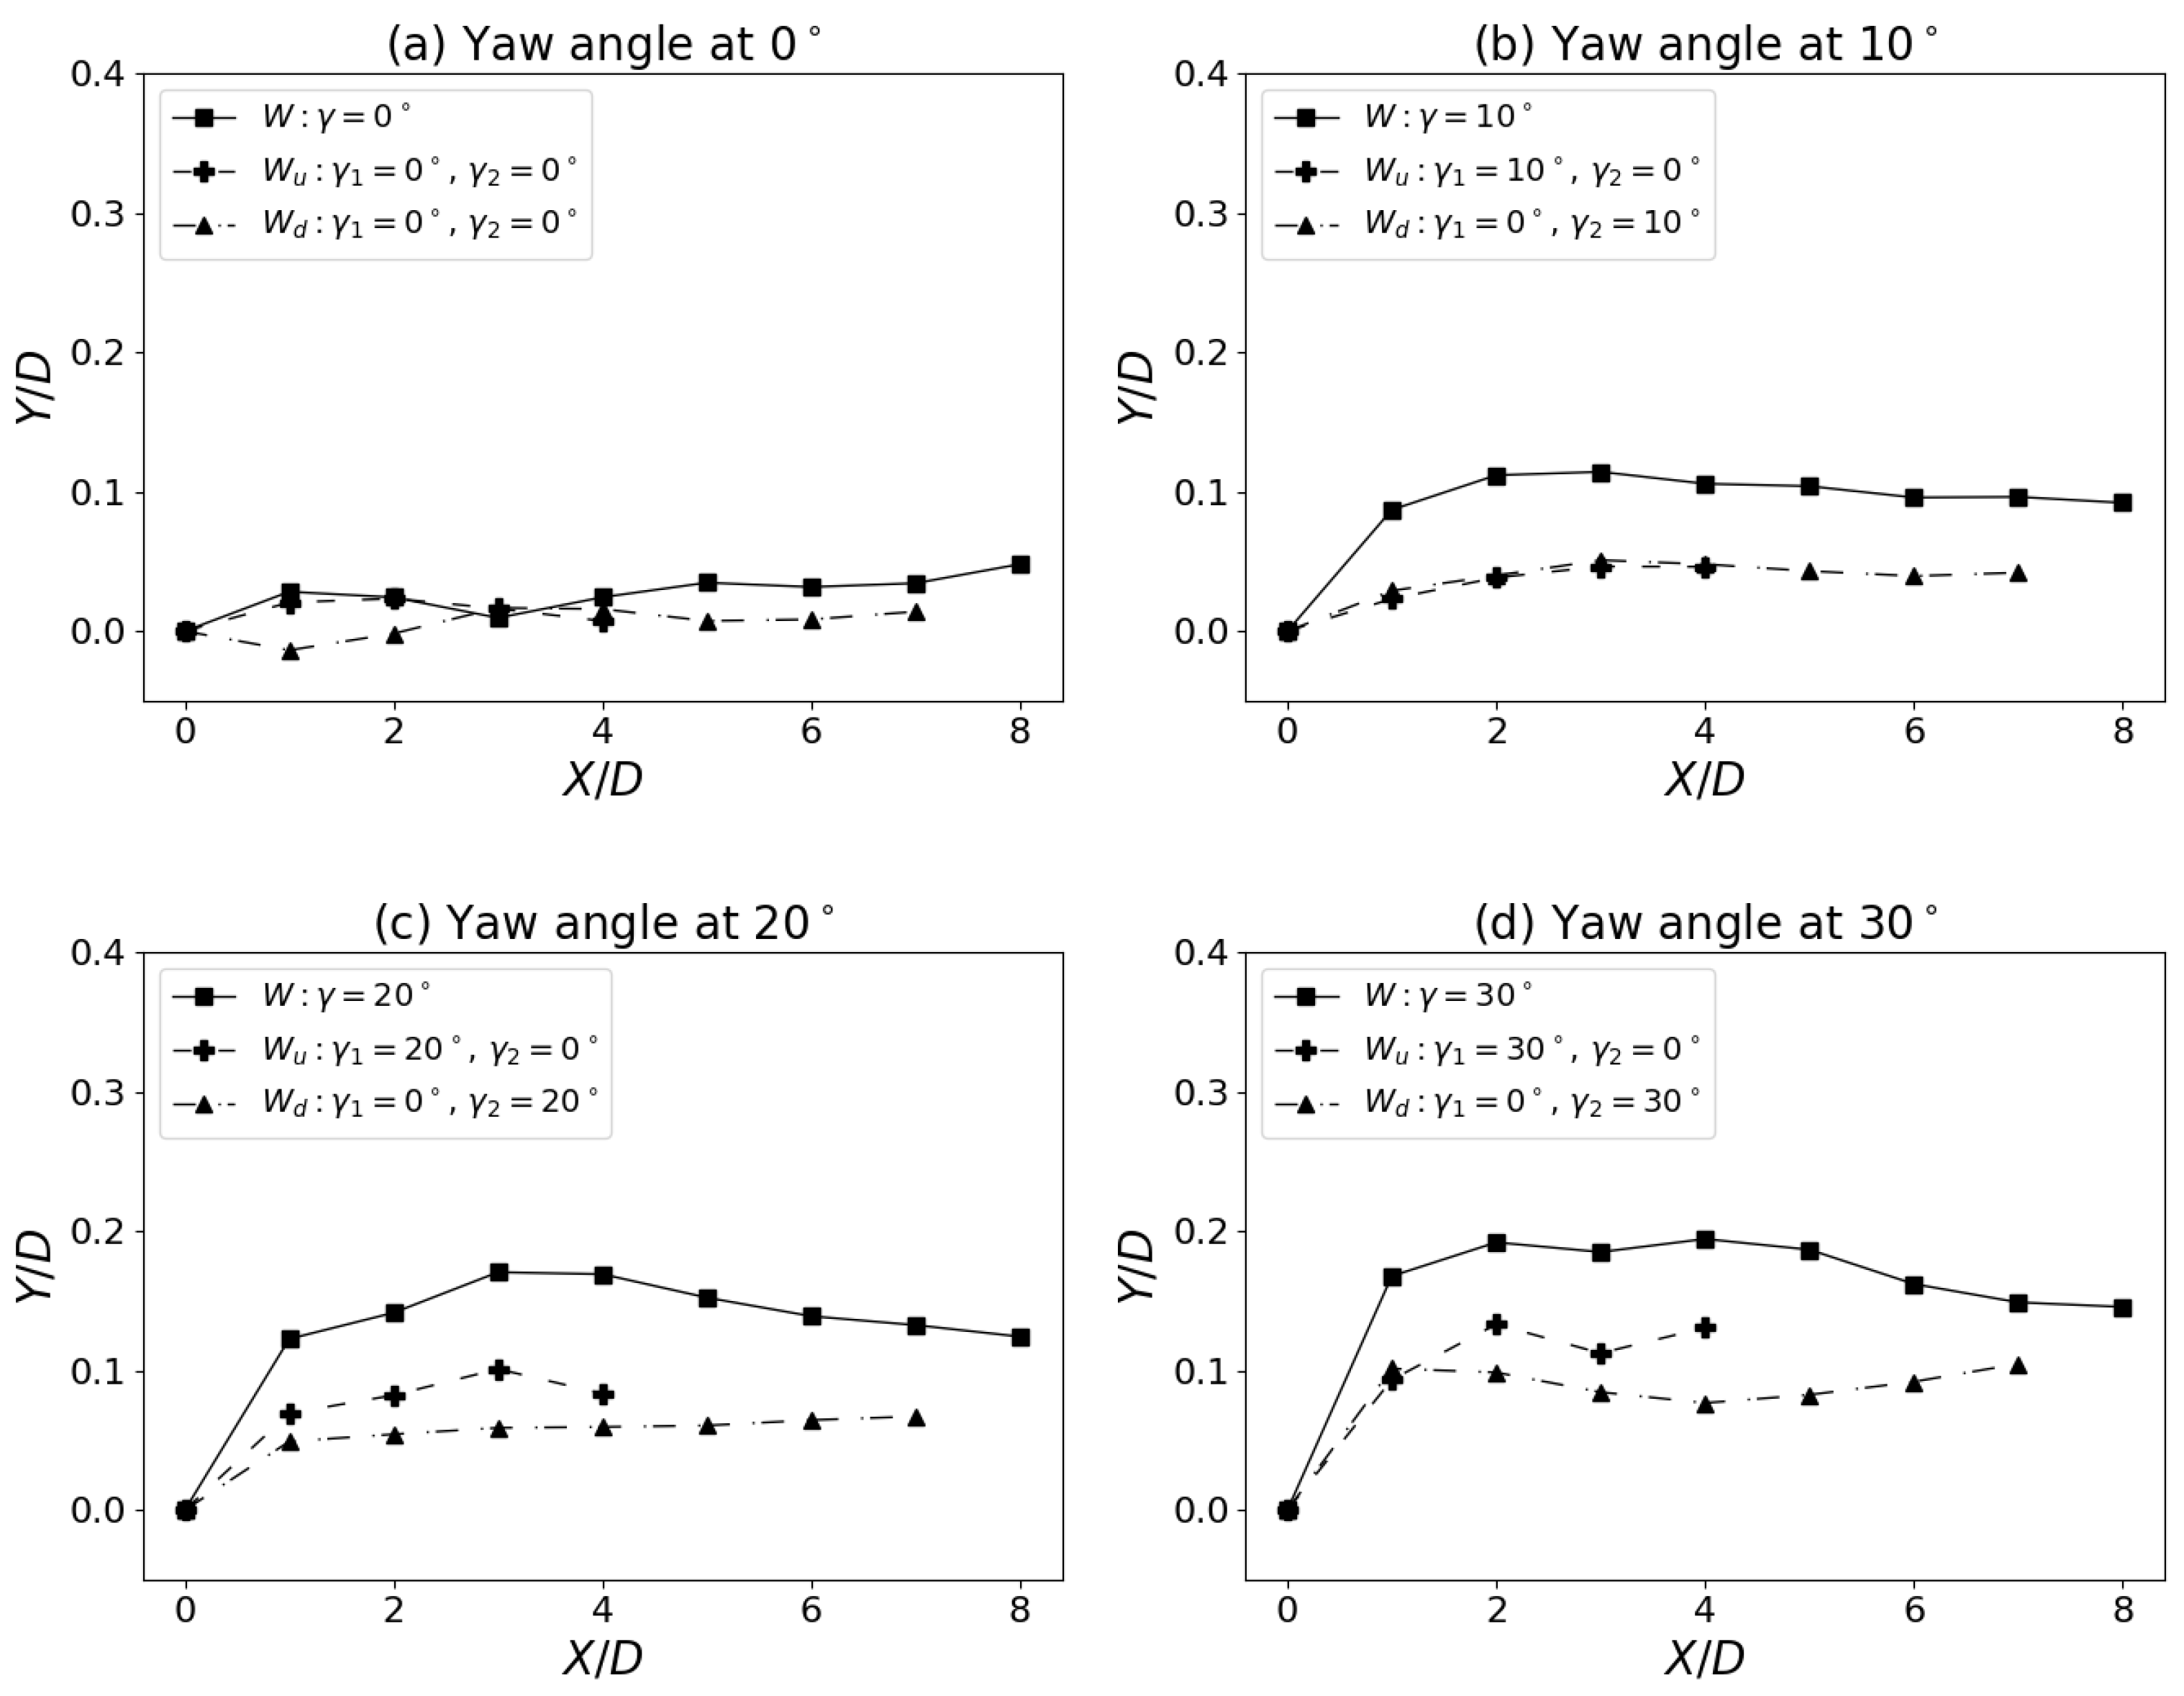
3.4. Deflected Wake Centreline
4. Conclusions
Author Contributions
Funding
Data Availability Statement
Acknowledgments
Conflicts of Interest
References
- Melikoglu, M. Current status and future of ocean energy sources: A global review. Ocean Eng. 2018, 148, 563–573. [Google Scholar] [CrossRef]
- Neill, S.P.; Haas, K.A.; Thiébot, J.; Yang, Z. A review of tidal energy–Resource, feedbacks, and environmental interactions. J. Renew. Sustain. Energy 2021, 13, 062702. [Google Scholar] [CrossRef]
- Coles, D.; Angeloudis, A.; Greaves, D.; Hastie, G.; Lewis, M.; Mackie, L.; McNaughton, J.; Miles, J.; Neill, S.; Piggott, M.; et al. A review of the UK and British Channel Islands practical tidal stream energy resource. Proc. R. Soc. A 2021, 477, 20210469. [Google Scholar] [CrossRef] [PubMed]
- Piggott, M.D.; Kramer, S.C.; Funke, S.W.; Culley, D.M.; Angeloudis, A. Optimization of Marine Renewable Energy Systems. In Comprehensive Renewable Energy, 2nd ed.; Letcher, T.M., Ed.; Elsevier: Oxford, UK, 2022; pp. 176–220. [Google Scholar] [CrossRef]
- Frost, C.; Morris, C.E.; Mason-Jones, A.; O’Doherty, D.M.; O’Doherty, T. The effect of tidal flow directionality on tidal turbine performance characteristics. Renew. Energy 2015, 78, 609–620. [Google Scholar] [CrossRef]
- Frost, C.H.; Evans, P.S.; Harrold, M.J.; Mason-Jones, A.; O’Doherty, T.; O’Doherty, D.M. The impact of axial flow misalignment on a tidal turbine. Renew. Energy 2017, 113, 1333–1344. [Google Scholar] [CrossRef]
- Modali, P.K.; Vinod, A.; Banerjee, A. Towards a better understanding of yawed turbine wake for efficient wake steering in tidal arrays. Renew. Energy 2021, 177, 482–494. [Google Scholar] [CrossRef]
- Burton, T.; Jenkins, N.; Sharpe, D.; Bossanyi, E. Wind Energy Handbook; John Wiley & Sons: Hoboken, NJ, USA, 2011. [Google Scholar]
- Adaramola, M.; Krogstad, P.Å. Experimental investigation of wake effects on wind turbine performance. Renew. Energy 2011, 36, 2078–2086. [Google Scholar] [CrossRef]
- Howland, M.F.; Lele, S.K.; Dabiri, J.O. Wind farm power optimization through wake steering. Proc. Natl. Acad. Sci. USA 2019, 116, 14495–14500. [Google Scholar] [CrossRef]
- Bastankhah, M.; Porté-Agel, F. Experimental and theoretical study of wind turbine wakes in yawed conditions. J. Fluid Mech. 2016, 806, 506–541. [Google Scholar] [CrossRef]
- Gao, Z.; Li, Y.; Wang, T.; Shen, W.; Zheng, X.; Pröbsting, S.; Li, D.; Li, R. Modelling the nacelle wake of a horizontal-axis wind turbine under different yaw conditions. Renew. Energy 2021, 172, 263–275. [Google Scholar] [CrossRef]
- Dijk, M.V.; Wingerden, J.V.; Ashuri, T.; Li, Y. Wind farm multi-objective wake redirection for optimizing power production and loads. Energy 2017, 121, 561–569. [Google Scholar] [CrossRef]
- Bartl, J.; Mühle, F.; Stran, L. Wind tunnel study on power output and yaw moments for two yaw-controlled model wind turbines. Wind Energy Sci. 2018, 3, 489–502. [Google Scholar] [CrossRef]
- Zong, H.; Porté-Agel, F. Experimental investigation and analytical modelling of active yaw control for wind farm power optimization. Renew. Energy 2021, 170, 1228–1244. [Google Scholar] [CrossRef]
- Bastankhah, M.; Porté-Agel, F. Wind farm power optimization via yaw angle control: A wind tunnel study. J. Renew. Sustain. Energy 2019, 11, 023301. [Google Scholar] [CrossRef]
- Bahaj, A.; Molland, A.; Chaplin, J.; Batten, W. Power and thrust measurements of marine current turbines under various hydrodynamic flow conditions in a cavitation tunnel and a towing tank. Renew. Energy 2007, 32, 407–426. [Google Scholar] [CrossRef]
- Galloway, P.W.; Myers, L.E.; Bahaj, A. Quantifying wave and yaw effects on a scale tidal stream turbine. Renew. Energy 2014, 63, 297–307. [Google Scholar] [CrossRef]
- Ke, S.; Wen-Quan, W.; Yan, Y. The hydrodynamic performance of a tidal-stream turbine in shear flow. Ocean Eng. 2020, 199, 107035. [Google Scholar] [CrossRef]
- O’Rourke, F.; Boyle, F.; Reynolds, A.; Kennedy, D.M. Hydrodynamic performance prediction of a tidal current turbine operating in non-uniform inflow conditions. Energy 2015, 93, 2483–2496. [Google Scholar] [CrossRef]
- Baratchi, F.; Jeans, T.L.; Gerber, A.G. Actuator line simulation of a tidal turbine in straight and yawed flows - ScienceDirect. Int. J. Mar. Energy 2017, 19, 235–255. [Google Scholar] [CrossRef]
- Wang, S.J.; Jiang, X.Y.; Yuan, P.; Xian-Cai, S.I.; Xiao-Li, Y.U. Performance and Wake Characteristics Analysis for Tidal Turbine with Yaw Angle. Period. Ocean. Univ. China 2019, 49, 122–128. [Google Scholar]
- Borg, M.G.; Xiao, Q.; Allsop, S.; Incecik, A.; Peyrard, C. A numerical performance analysis of a ducted, high-solidity tidal turbine in yawed flow conditions. Renew. Energy 2022, 193, 179–194. [Google Scholar] [CrossRef]
- Zhang, C.; Kramer, S.; Angeloudis, A.; Zhang, J.; Lin, X.; Piggott, M.D. Improving tidal turbine array performance through the optimisation of layout and yaw angles. In Proceedings of the 14th European Wave and Tidal Energy Conference, EWTEC, Plymouth, UK, 5–9 September 2021; pp. 1–7. [Google Scholar]
- Jordan, C.; Dundovic, D.; Fragkou, A.K.; Deskos, G.; Coles, D.S.; Piggott, M.D.; Angeloudis, A. Combining shallow-water and analytical wake models for tidal array micro-siting. J. Ocean. Eng. Mar. Energy 2022, 8, 193–215. [Google Scholar] [CrossRef]
- Zhou, Y.; Wang, G.; Lin, X.; Zhang, J. Experimental Study of Wake Flow around a Twin-rotor Tidal Stream Turbine. In Proceedings of the The 31st International Ocean and Polar Engineering Conference, Rhodes, Greece, 20–25 June 2021; OnePetro: Richardson, TX, USA, 2021. [Google Scholar]
- Wang, G. Study on Wake Distribution and Force Characteristics of Tidal Current Energy Array. Master’s Thesis, Hohai University, Nanjing, China, 2021. [Google Scholar]
- Coles, D.; Blunden, L.; Bahaj, A. The energy yield potential of a large tidal stream turbine array in the Alderney Race. Philos. Trans. R. Soc. A 2020, 378, 20190502. [Google Scholar] [CrossRef] [PubMed]
- Zhang, J.; Zhou, Y.; Lin, X.; Wang, G.; Guo, Y.; Chen, H. Experimental investigation on wake and thrust characteristics of a twin-rotor horizontal axis tidal stream turbine. Renew. Energy 2022, 195, 701–715. [Google Scholar] [CrossRef]
- Zang, W.; Zheng, Y.; Zhang, Y.; Zhang, J.; Fernandez-Rodriguez, E. Experiments on the mean and integral characteristics of tidal turbine wake in the linear waves propagating with the current. Ocean Eng. 2019, 173, 1–11. [Google Scholar] [CrossRef]
- Chen, Y.; Lin, B.; Lin, J.; Wang, S. Experimental study of wake structure behind a horizontal axis tidal stream turbine. Appl. Energy 2017, 196, 82–96. [Google Scholar] [CrossRef]
- Kang, S.; Kim, Y.; Lee, J.; Khosronejad, A.; Yang, X. Wake interactions of two horizontal axis tidal turbines in tandem. Ocean Eng. 2022, 254, 111331. [Google Scholar] [CrossRef]
- Zhang, Y.; Zhang, J.; Lin, X.; Wang, R.; Zhang, C.; Zhao, J. Experimental investigation into downstream field of a horizontal axis tidal stream turbine supported by a mono pile. Appl. Ocean Res. 2020, 101, 102257. [Google Scholar] [CrossRef]
- Zhang, J.; Lin, X.; Wang, R.; Guo, Y.; Zhang, C.; Zhang, Y. Flow structures in wake of a pile-supported horizontal axis tidal stream turbine. Renew. Energy 2020, 147, 2321–2334. [Google Scholar] [CrossRef]
- Fleming, P.A.; Gebraad, P.M.; Lee, S.; van Wingerden, J.W.; Johnson, K.; Churchfield, M.; Michalakes, J.; Spalart, P.; Moriarty, P. Evaluating techniques for redirecting turbine wakes using SOWFA. Renew. Energy 2014, 70, 211–218. [Google Scholar] [CrossRef]
- Modali, P.K. On Performance and Wake Characteristics of a Tidal Turbine under Yaw. PhD Thesis, Lehigh University, Bethlehem, PA, USA, 2016. [Google Scholar] [CrossRef]
- Howland, M.F.; Bossuyt, J.; Martínez-Tossas, L.A.; Meyers, J.; Meneveau, C. Wake structure in actuator disk models of wind turbines in yaw under uniform inflow conditions. J. Renew. Sustain. Energy 2016, 8, 043301. [Google Scholar] [CrossRef]
- Jiménez, Á.; Crespo, A.; Migoya, E. Application of a LES technique to characterize the wake deflection of a wind turbine in yaw. Wind Energy 2010, 13, 559–572. [Google Scholar] [CrossRef]
- Luo, L.; Srivastava, N.; Ramaprabhu, P. A study of intensified wake deflection by multiple yawed turbines based on large eddy simulations. In Proceedings of the 33rd Wind Energy Symposium, Kissimmee, FL, USA, 5–9 January 2015; p. 0220. [Google Scholar]
- Trujillo, J.J.; Bingöl, F.; Larsen, G.C.; Mann, J.; Kühn, M. Light detection and ranging measurements of wake dynamics. Part II: Two-dimensional scanning. Wind Energy 2011, 14, 61–75. [Google Scholar] [CrossRef]
- Fleming, P.A.; Gebraad, P.M.; Churchfield, M.J.; van Wingerden, J.W.; Scholbrock, A.K.; Moriarty, P.J. Using particle filters to track wind turbine wakes for improved wind plant controls. In Proceedings of the 2014 American Control Conference, Portland, OR, USA, 4–6 June 2014; IEEE: Piscataway, NJ, USA, 2014; pp. 3734–3741. [Google Scholar]
- Modali, P.; Kolekar, N.S.; Banerjee, A. Performance and wake characteristics of a tidal turbine under yaw. Int. Mar. Energy J. 2018, 1, 41–50. [Google Scholar] [CrossRef]
- Kärnä, T.; Kramer, S.C.; Mitchell, L.; Ham, D.A.; Piggott, M.D.; Baptista, A.M. Thetis coastal ocean model: Discontinuous Galerkin discretization for the three-dimensional hydrostatic equations. Geosci. Model Dev. 2018, 11, 4359–4382. [Google Scholar] [CrossRef] [Green Version]


| Scenarios | Case ID | Yaw Angle () | |
|---|---|---|---|
| Upstream Turbine | Downstream Turbine | ||
| Scenario 1 | 1 | 0 | – |
| 2 | 10 | – | |
| 3 | 20 | – | |
| 4 | 30 | – | |
| Scenario 2 | 5 | 0 | 30 |
| 6 | 0 | 20 | |
| 7 | 0 | 10 | |
| 8 | 0 | 0 | |
| 9 | 10 | 0 | |
| 10 | 20 | 0 | |
| 11 | 30 | 0 | |
Disclaimer/Publisher’s Note: The statements, opinions and data contained in all publications are solely those of the individual author(s) and contributor(s) and not of MDPI and/or the editor(s). MDPI and/or the editor(s) disclaim responsibility for any injury to people or property resulting from any ideas, methods, instructions or products referred to in the content. |
© 2023 by the authors. Licensee MDPI, Basel, Switzerland. This article is an open access article distributed under the terms and conditions of the Creative Commons Attribution (CC BY) license (https://creativecommons.org/licenses/by/4.0/).
Share and Cite
Zhang, C.; Zhang, J.; Angeloudis, A.; Zhou, Y.; Kramer, S.C.; Piggott, M.D. Physical Modelling of Tidal Stream Turbine Wake Structures under Yaw Conditions. Energies 2023, 16, 1742. https://doi.org/10.3390/en16041742
Zhang C, Zhang J, Angeloudis A, Zhou Y, Kramer SC, Piggott MD. Physical Modelling of Tidal Stream Turbine Wake Structures under Yaw Conditions. Energies. 2023; 16(4):1742. https://doi.org/10.3390/en16041742
Chicago/Turabian StyleZhang, Can, Jisheng Zhang, Athanasios Angeloudis, Yudi Zhou, Stephan C. Kramer, and Matthew D. Piggott. 2023. "Physical Modelling of Tidal Stream Turbine Wake Structures under Yaw Conditions" Energies 16, no. 4: 1742. https://doi.org/10.3390/en16041742