Article

Strategies of Energy Suppliers and Consumer Awareness in Green Energy Optics

1
Department of Management, General Tadeusz Kościuszko Military University of Land Forces, Piotra Czajkowskiego 109, 51-147 Wrocław, Poland
2
Department of Strategy and Management Methods, Faculty of Management, Wroclaw University of Economics and Business, Komandorska 118/120, 53-345 Wrocław, Poland
*
Author to whom correspondence should be addressed.
Energies 2023, 16(4), 1613; https://doi.org/10.3390/en16041613
Submission received: 16 December 2022 / Revised: 22 January 2023 / Accepted: 26 January 2023 / Published: 6 February 2023
(This article belongs to the Collection Feature Papers in Energy, Environment and Well-Being)

Abstract

:
This research aims to identify (1) whether consumers have an impact on the energy sector, (2) to what extent consumers have an impact on the energy sector, and (3) whether there is so-called energy communism. We understand this phenomenon as the process of energy suppliers imposing energy sources on which the end consumer has zero or very little influence. The research, therefore, focused on a B2C analysis, in five selected countries: the USA, Canada, Australia, the UK, and Poland (N = 500). The research subjects are a homogeneous group in terms of the sources of green energy, and the volume of production of this type of energy and its increments. The investigation was conducted using the procedure appropriate for the triangulation of research methods. Three hypotheses were verified. The first one was rejected, which aimed to determine whether individual consumers are guided by green energy in their choices. The second hypothesis—that energy suppliers do not take into account customer needs/expectations and pursue their strategies—was partially confirmed but was also directed for further exploration. The third hypothesis was whether the consumer is free to make the decision to switch energy suppliers—if so, what is the hierarchy of the most and least decisive factors in the choice of supplier? The verification of this hypothesis indicates that there is no specific pattern that consumers follow when choosing an energy supplier.

1. Introduction

Energy resource issues have taken on particular importance in the context of the energy crisis, which with its relevance has overshadowed the consequences of the crisis caused by the global pandemic [1]. Energy is, after all, a factor that affects the quality and length of people’s lives, and its availability—or rather lack thereof—causes a range of different negative consequences [2]. It is therefore, like water and air, indispensable to life, and as civilisation progresses, demand for it increases [3]. According to R. Brouwer’s team [4]: Climate change has evolved from an “inconvenient hypothesis” to an “inconvenient truth”.
Observing the global energy market, one can identify a wide variety of strategic actions with converging objectives, i.e., focusing on preserving the existing status quo, taking the form of a dramatic struggle, both for new energy sources and for consumers. These actions take the form of mergers and acquisitions [5], but also actions based on diverse competitive activity, resource redundancy, adaptation, cooperation, and networking [6]. The strategic activities of energy organisations can be classified into the following strategic thoughts, i.e., the planning approach, the positional approach, the resource approach, the innovation approach, and the aforementioned network approach [5]. The research conducted in these scopes confirms that organisations mainly focus on classic strategic solutions, using mainly resource-based tools, followed by positional and planning-based tools. The activities with the highest returns on investment, i.e., those using product, process, eco-innovation [7], and others, as well as network arrangements and their benefits, are not central to competitive positioning processes in the case of the energy sector. Energy suppliers and producers are therefore engaged in a variety of market activities, outbidding each other and diversifying energy sources in an attempt to adapt to changing energy standards and regulations. At the end of the energy value chain, however, is the consumer, who should be able to influence these activities. Two main components therefore emerge that strategically determine the functioning and cause the development of the energy market: consumers and suppliers. The authors are aware of the other elements of Porter’s forces that influence the market, but in the context of the analyses carried out so far—their focus will be on these two selected ones.
The aim of the research is to identify (1) whether consumers have an impact on the energy sector, (2) to what extent consumers have an impact on the energy sector, and (3) whether there is a so-called energy communism. We understand this phenomenon as the process of energy suppliers imposing energy sources on which the end consumer has zero or very little influence. The research, therefore, includes B2C analyses, in five selected countries: the USA, Canada, Australia, the UK, and Poland. This is a homogeneous group in terms of green energy sources, as well as green energy production volumes and growth, as presented in the following sections.
The article consists of seven parts. The introduction is the first one. Then, the following three sections constitute a theoretical review of the literature on the topic as follows: (a) introduction to renewable energy sources—derivation of hypothesis 1, (b) dominant strategies of energy companies in the countries selected for analysis, i.e., the USA, Canada, the UK, Australia, and Poland—theoretical foundations of hypothesis 2, and (c) consumers and their expectations towards the energy market—analyses forming the foundation of hypothesis 3. Thus, the theoretical parts identify the research hypotheses. The next three sections are the empirical treatment: (a) a description of the research procedure and the research sample, (b) a presentation of the verification of the hypotheses and the research results, and (c) the conclusions, together with a discussion of the results and limitations of the research.
It should be noted that the article is a continuation of the research presented in the paper “Identification of the Strategy of the Energy & Utilities Sector From the G7 Group Countries, From the Perspective of a Dominant Strategy Approach”. This publication inspired the authors to explore further and change the focus from the organisation to the consumer [5]. Based on previous research in the publication, the authors assume that the companies in question have a defined strategy that is theoretically defined—a planning, positional, RVB, innovative and entrepreneurial, and network approach. The authors also assume that the given strategy directly implies the strategic behaviour of the company, which also affects the customer and its position of relevance in the company’s activities.
The research is also linked to the identification of a research gap which is due, among other things, to the regulatory environment and the need for energy transition around the world [8]. An important element of the new energy arrangements is environmental awareness and community engagement, which in Europe has been termed “prosumer” [9]. There are many studies on willingness to pay for green energy [10], which, however, do not take into account such a diversified research sample. Another element that is worth paying attention to is the clear lack of a strategy for the actions of states, enterprises, and consumers [11]. Topics related to selected areas of the energy sector are discussed, but there is no comprehensive study on the strategies of states and enterprises [12]. The authors of the study focus their considerations on the strategy of energy suppliers and the awareness of recipients about the willingness to pay for green energy.

2. Renewable Energy Sources—Problem Statement Part I

The availability of energy, which means not only its physical usability but also its affordability, is crucial for the development of any country in the world [13,14]. The current energy crisis is the consequence of several different situations that have occurred over the past three years, most notably a pandemic that has paralysed the entire world. In 2019, global diesel production and consumption was 27,801 thousand barrels per day, compared to 25,765 thousand in 2020 [15]. The reduction in demand and the subsequent return to overproduction of energy, combined with the Russian-Ukrainian conflict are the two main reasons that have accelerated the green economy [16,17], thus leading to the need to minimise human activities in the brown economy [18]. This wide range of factors that have guided the actions of the world’s economies also includes the need to reduce the use of fossil fuel, which is a major source of greenhouse gas emissions [19]. The transition to green energy has therefore become a necessity, necessitated by elements of the downstream environment: environmental, political-legal, and economic. As a result, increasing investment by various research and development organisations in the area of renewable energy utilisation can be observed [20], as well as increased global activity in promoting policy cooperation in this field [21]. As it turns out, this is currently one of the most effective ways of minimising the effects of energy and economic crises [22].
The green economy is most often identified with sectors (e.g., energy), general issues (e.g., pollution), principles, and policies in which economic instruments that influence the degree of socio-economic development in the context of the role of the environment are key. The priorities for the creation of a green economy are (a) the development of renewable energy sources; (b) the improvement of energy efficiency in individual economic sectors, production and service establishments, as well as households; (c) the restructuring of industry (primarily traditional industry); and (d) the creation of new, environmentally friendly industries [23]. Related to this category is green energy, which is defined as electricity that is generated through the use of renewable energy sources, including technologies such as photovoltaic panels, windmills, geothermal sources, and the use of biomass [13] (types of green energy are presented in Table 1.
The following countries were selected for the study: the USA, Canada, Australia, the UK, and Poland. Based on the Renewable Capacity Statistics 2022 report (IRENA, 2022) produced by the International Renewable Energy Agency (IRENA), those countries selected have shown more than a doubling of renewable energy use over the past 10 years. A second criterion for the selection of the units analysed was the analyses carried out on the strategies of energy producers [5]. In addition, Poland was added to the group of countries that were analysed from the point of view of the natural interests of the researchers.
The capacity of the different types of renewable energy, in selected countries, additionally broken down by source is presented in Appendix A. Data are presented in megawatts (MW), rounded to the nearest 1 megawatt.
A detailed analysis of the report shows a small share of offshore wind energy as well as concentrated solar power in the portfolio of green energy sources. Geothermal energy is not included [24], due to a lack of data in the key countries included in the analysis, i.e., Canada, the UK, Australia, and Poland. Nevertheless, the analysis shows that the share of green energy in total electricity is gradually increasing, and, in the case of Canada, its initial value demonstrates the high level of awareness of the country’s population, as well as the country’s excellent preparation for the transition to total off-grid, thanks to hydroelectric power, wind farms, and solar power.
Green energy is related to green productivity (GP), which, according to the Asian Productivity Organisation (APO), is defined as [25]: […] a strategy for enhancing productivity and environmental performance simultaneously to achieve overall socio-economic development. Its aim is well-rounded socio-economic development that leads to sustained improvement in the quality of human life. It is the combined application of appropriate productivity and environmental management tools, techniques, and technologies that reduce the environmental impact of an organization’s activities, products, and services while enhancing profitability and competitive advantage. The green productivity model differs from the classical model primarily in that it recognises the relevance of a systems approach to productivity, involving both the nation and organisations. Furthermore, it views production not in terms of units produced, but in terms of the value identified by the company’s customers and stakeholders. This means that a product has no value until it is accepted by its customers, which most often happens through a sales transaction. Outputs (‘outputs’) are also viewed differently in this model—not only in terms of the individual product, but also the emissions and waste that result from the energy consumption of production processes, transport, packaging, etc. [26]. These conclusions are linked to the so-called Porter hypothesis, according to which environmental pollution is always a form of inefficiency [27]. The object of Porter’s and other researchers’ research [28,29,30], have been business organisations. The authors’ attention therefore turned to consumers and, more specifically, their level of awareness [31] in their choice of energy suppliers, with an emphasis on those types of energy that do not generate inefficiency, i.e., green energy suppliers.
The ecological awareness of consumers is growing successively, and it turns out that 80% of Poles feel the need to change their energy system to a greener one. Mainly because they protect the environment (72%), reduce global warming (58.1%), and give energy independence (46.6%). Less than 41% pointed to the cost-effectiveness of RES and almost 24% to their contribution to reducing water losses. When asked whether green energy was important to them, only less than 3% answered in the negative and 6% were unable to give a clear answer to this question. This survey (CAWI) was conducted with a sample of 1000 respondents on behalf of SunSol, in June 2021 [32]. There is a growing awareness of the necessity and importance of making changes towards a green economy and energy, which is further exacerbated by the creation of eco-fashion via social media [33], not only in Poland but also worldwide [34]. Analysing the collected data, the research team decided to verify the following hypothesis:
Hypothesis 1 (H1).
Consumers voluntarily switching energy suppliers are driven by their choice of green energy.
It should be noted that hypothesis 1 focuses on the voluntariness of switching energy suppliers, which in turn may be linked to (a) increased awareness of the relevance of green energy for individual consumers, as well as (b) stimulated by energy suppliers, which leads to consideration and another hypothesis.

3. Dominant Strategy in Companies—USA, Canada, UK, Australia, Poland—Problem Statement Part II

Strategy is etymologically the art of commanding an army or the theory and art of achieving general long-term goals, especially in the military field (theory and art of warfare), business, politics, and other fields, as well as the activities of the art of war involving the preparation and conduct of war and its campaigns and battles. According to game theory, strategy is a plan of action in any possible situation. It defines the moves that a player will make, at each stage of the game, in every possible situation that occurs as a result of both our actions (moves) and the actions of other players. Thus, we can consider the competitive struggle as a game whose participants are the rival companies, but also all the other groups of their “stakeholders” (customers, suppliers, customers, employees, investors, banks financing their activities, government administration, etc.—the participants in the game). In contrast, the classic Porterian definition of strategy states that strategy is the positioning of a business in a given industry sector [35]. It can be said that a strategy is a coherent concept of action based on several key and complementary choices with the overall objective of seizing opportunities, building competitive advantage, and achieving above-average performance [36]. On top of that, “strategy is a set of choices, made by the top management, using the resources of the company and the opportunities of the environment to improve the efficiency of the operation” [37]. It is worth also emphasizing that “strategy is a coherent response to a challenge. A true strategy is neither a document nor a forecast, but rather an overall approach based on a diagnosis of the challenges. The most important element of a strategy is a coherent view of the resources at work, not a plan” [38].
The basis of strategy in the various approaches is a certain consistent and repeatable pattern of behaviour over time that governs a company’s decisions and actions. Sometimes this pattern is called the “strategic framework”, the “dominant thread” or “configuration”, the “entangled choices”, but most often the concept of “dominant logic” is used [39].
Furthermore, according to other proposals, strategy serves to transform one’s business theory into performance. Its purpose is to provide the organisation with the ability to achieve the desired results in a highly unpredictable environment. “Strategy allows an organisation to remain deliberately opportunistic in its actions” [40] A well-formulated strategy allows the organisation to direct and allocate resources, based on its competencies, anticipated changes in the environment and the actions of intelligent opponents [41].
One of the more interesting definitions of strategy is to say that strategy is the dynamics of a company’s relationship with its environment, for which the necessary actions are taken to achieve its objectives and/or to increase efficiency through the rational use of resources. This definition is crucial for further discussion.
Transferring strategies to the field of the countries studied, regulation, and company strategies in a given country, it is worth pointing out that in 2012 the UK presented another reform of its energy sector. A shift can be observed in the UK’s new energy policy away from the market model towards more state interventionism. Diversification of supply and minimising the risks of over-reliance on imports have become priorities for the UK government in its Energy Security Strategy [42].
In contrast, Canada has a vision that Canada can lead and not follow opportunities in energy markets. This strategic approach to energy systems by definition will include transportation, housing, employment, and financial markets This strategy is a fundamental rail on which plans, tactics, and policies can be built. This vision identifies how the provinces can work together using all the tools available to them, maximizing long-term resource development while minimizing environmental damage [43]. From the perspective of the state itself and there are necessary actions it needs to take because the energy market is becoming highly competitive and requires issues such as:
  • increasing dependence on inherently high-cost and remote resources (although natural gas in North America is a perhaps temporary exception to this trend);
  • the need for reinvestment in aging energy infrastructure;
  • the inevitable costs of higher environmental and social standards;
  • and the emerging cost of carbon mitigation.
The State Strategy of Denmark indicates strategic energy planning as key elements that shall secure a future energy system that is both energy efficient and flexible. Strategic energy planning includes all possible elements of municipalities’ energy plans, and coordination with municipal plans, security of supply strategies, and climate strategies. The municipalities should conduct energy planning to create an optimal interplay between the energy demands and energy supplies (heating, cooling, and electricity) in such a way that the energy resources are optimally used. Energy planning encompasses the whole energy chain and differs thereby from heat planning, which solely looks at the choice of heat supply. In summary, it can be said that an energy strategy should have characteristics such as: a flexible system, effective, renewable energy, security of supply, interplay between energy demand and supply, cover the whole energy chain, focus on local energy saving, being built short-term, mid-term, long-term, holistic approach, contain sustainable development, include community goals, national goals, show stakeholder involvement, improving welfare, reliability, show cost structure of energy production, comprehensive energy system, and be more inter-disciplinary [44].
In turn, the European Union indicates that the strategy of action of countries as well as companies should focus on three directions: flexible transformation of the volume and structure of renewable energy sources in accordance with objective social needs for energy; continuous development of the conditions aiming to increase the flexibility and adaptability of needs; and development of technological, institutional, and cultural conditions required for the harmonisation of the two sides [45].
At the same time, companies should ensure that their energy strategy focuses on assessing the firm’s internal and external energy impacts. Among the questions it should consider are: how much energy does our firm use, and what does it cost? What impact does this spending have on key financial indicators such as the cost of goods sold? Are we capitalizing on opportunities to use renewables? What is our carbon footprint and that of our suppliers? How does this align with customer, investor, and employee expectations, and how do we compare with competitors [46]?
In their strategic actions, companies should consider, among other things, two potential market development scenarios—the roller coaster scenario and the stuck on carbon scenario (Table 2), which determine the respective strategic actions of companies.
It is also worth pointing out that companies with already higher environmental ratings present a statistically significantly larger size, belong to more environmentally sensitive industries as compared with firms with lower environmental ratings, and disclose environmental information according to GRI guidelines [48]. This can make it much easier for companies to make strategic changes in terms of regulatory and customer requirements. Companies themselves can also adopt a proactive and reactive strategy. In a proactive attitude, energy is an integrated part of the strategic targets for the firm, and primary as well as secondary production processes are integrated into the saving activities. The energy manager has a central role in the company hierarchy and is able to make important decisions. In a reactive attitude, the focus of energy activity is typically on secondary production processes. Energy savings happen coincidentally through ‘‘end-of-pipe’’ solutions. The energy manager is marginal in the process of decision-making [49]. In all, this approach is about utilizing the energy system differently in order to find alternative revenue that is more profitable than the current solutions. As such, a more profitable and energy optimal solution can be found in combining non-optimal production operations with each other and/or rebuilding a plant with more respect to the laws of thermodynamics [50].
Looking at both the strategy of states and the strategy of companies, where energy is the main driver, one may be tempted to consider their strategy of operation from the point of view of strategic management schools (Table 3). From the point of view of corporate management, we can consider several schools of strategic management: the economy of scale (planning), Porter’s competitive advantage (positional), building value (RBV), innovation (innovative and entrepreneurial), and network effects within the ecosystem (network) schools.
Referring to the research carried out in the article titled “Identification of the Strategy of the Energy and Utilities Sector from the G7 Group Countries, from the Perspective of a Dominant Strategy Approach” (Niemczyk, Borowski, et al., 2022a) and the additional research by the authors extending the research sample to further companies, it can be pointed out that the case in this sector is dominated by classic approaches to strategy. Two schools in particular play a key role in the energy sector. These are:
  • A resource approach, where resources are at the heart of these organizations and build value through the ability to find and exploit unique resources. Competition for access to deposits, in addition to key know-how, knowledge, competencies, and experience of employees in the field of deposit exploitation, as well as access to technology. These are only a few selected examples characterizing the strategies of energy and utilities companies in the field of the resource approach.
  • A positional approach, resulting in a shaping of the competitive position in the sector of differentiating the Chamberlin’s rent. Aggressive competition between entities in the sector is caused by, for example, the homogeneity of the product, building new barriers to entering the sector, as well as ensuring that exit from it is not simple. These are the selected tools for shaping their position by competing energy production companies. Other schools’ innovative-entrepreneurial and network approaches in this sector do not play a significant role.
This may be influenced by the approach to the energy sector, which requires a large investment in the very development of companies in this sector, as well as the high dependence of companies on the strategy of the state. This does not change the fact that this will also determine the approach to the customer and the very strategy of the company.
In summary, among the strategies of states, regulators, as well as companies embedded in the energy sector, it should be noted that the main strategic features of a company will focus on building key organisational assets and their position in the market among competitors, leading to the hypothesis:
Hypothesis 2 (H2).
Energy suppliers do not take into account customer needs/expectations and pursue their own strategies.
If this hypothesis is positively verified, we can speak of energy communism, which will be understood as the process of energy suppliers imposing energy sources on which the end consumer has zero or very little influence.

4. Willingness to Pay for Green Energy—Problem Statement Part III

The positive willingness to pay (WTP) for green energy is highlighted by numerous academic studies [51,52,53,54,55]. This means that this category is widely explored, representing an important point of research. From a theoretical perspective, WTP and the methodologies it uses were designed over a century ago to identify prices for pure public goods and services [56]. However, a number of studies can be found in the literature that use willingness to pay for climate stability, and selected findings are presented in this section of the paper [57]. Willingness to pay refers to the maximum willingness of individuals to pay for the use of a particular service or for the consumption of a particular product [58,59].
Pricing is of great importance not only for individual consumers, especially in times of economic crises, but also for producers, and therefore for business organisations. One of the main challenges for effective pricing is to correctly estimate the value of products to customers, i.e., to determine the WTP [60]. Willingness to pay is estimated in the context of environmental [60,61], as (a) garnering a dollar estimate on the basis of what others actually pay to access environmental goods (travel cost method), (b) determining price differences across otherwise similar assets that vary only in their access to environmental goods (hedonic pricing), and contingent valuation methods (CVM) [62], which use surveys to elicit willingness to pay associated with hypothetical scenarios [57].
The results of the survey indicate that respondents are primarily driven by differentiators of a financial nature, i.e., price and tax benefits, which are linked to the switch to green energy [63,64]. These surveys mostly look at individual regions and individual energy sources versus willingness to pay in context:
(a)
ratio of households to wind power in Sweden [65];
(b)
the impact of green energy projects (wind turbines) on the national landscape and how to reduce this impact as much as possible—Scotland [66];
(c)
identification of factors influencing the growth of the renewable energy market, as well as recommendations for the area in Germany [67]; the authors emphasised the role of state policy, and market liberalisation, which creates a window of opportunity;
(d)
fresh air, which is recognised as a ‘luxury’ good in China [68]; as well as the strong role of outreach activities in shaping demand for green solutions in residential construction [69];
(e)
the use of the CV model to estimate willingness to pay in Korea [70];
(f)
mechanisms for potential investments in renewable energy using green energy tariffs and the Renewable Obligation Certificate (ROC) scheme [71], as well as the use of mixed logit models, which estimate the distribution of utility coefficients in the UK [72]; results from these studies suggest that although the adoption of renewable energy is valued by households, the value is not large enough to cover the individual costs of domestic investment;
(g)
the implementation of bioenergy programmes using biomass in Spain [73], which, according to studies, would result in an increase in the welfare of society;
(h)
identifying willingness to pay for support of increased R&D to replace fossil fuels in the USA [74];
(i)
Green energy prices by three groups of payers: “concerned”, “protest”, and “willing to pay”in Australia [75];
(j)
specific conditions of the downstream environment—a study conducted one year after the Fukushima tragedy, in two groups of consumers in the USA and Japan, in relation to two alternative energy sources: nuclear and renewable energy; for the Japanese population, a significant aversion to nuclear energy was shown [24];
(k)
the social acceptance of green energy in light of the policy implications and health consequences for residents of polluted countries, using the example of Greece [55]; in this research, it is particularly noteworthy to highlight the impact of a prolonged economic recession on the increased motivation of residents to make cost-effective energy choices (solar and wind energy);
(l)
the different demographic characteristics of the Turkish population [76].
From the multitude and variety of studies carried out in the context of willingness to pay, a rather broad set of customer expectations emerges that, in addition to price, determine its choices. Thus, it can be assumed that in the plethora of diverse factors that will guide the consumer in switching energy supplier, it will be price. At the same time, the consumer is able to pay more for green energy. This is evidenced by multivariate analyses and studies in diverse groups in terms of demographic as well as geographical characteristics [24]. Hence, hypothesis 3 takes the following form:
Hypothesis 3 (H3).
The consumer is willing to pay more for green energy.
Interestingly, when carrying out desk research on willingness to pay for green energy, no scientific study was found that linked the following issues:
willingness to pay—green energy—enterprise strategy
The triad of these keywords forms the basis for the identification of the research assumptions, the hypotheses, which were identified as a result of the analysis of the source materials. The research procedure, as well as the sample selection and the research methods coded are presented in the following section.

5. Research Methodology: Description of the Research Procedure and Research Sample
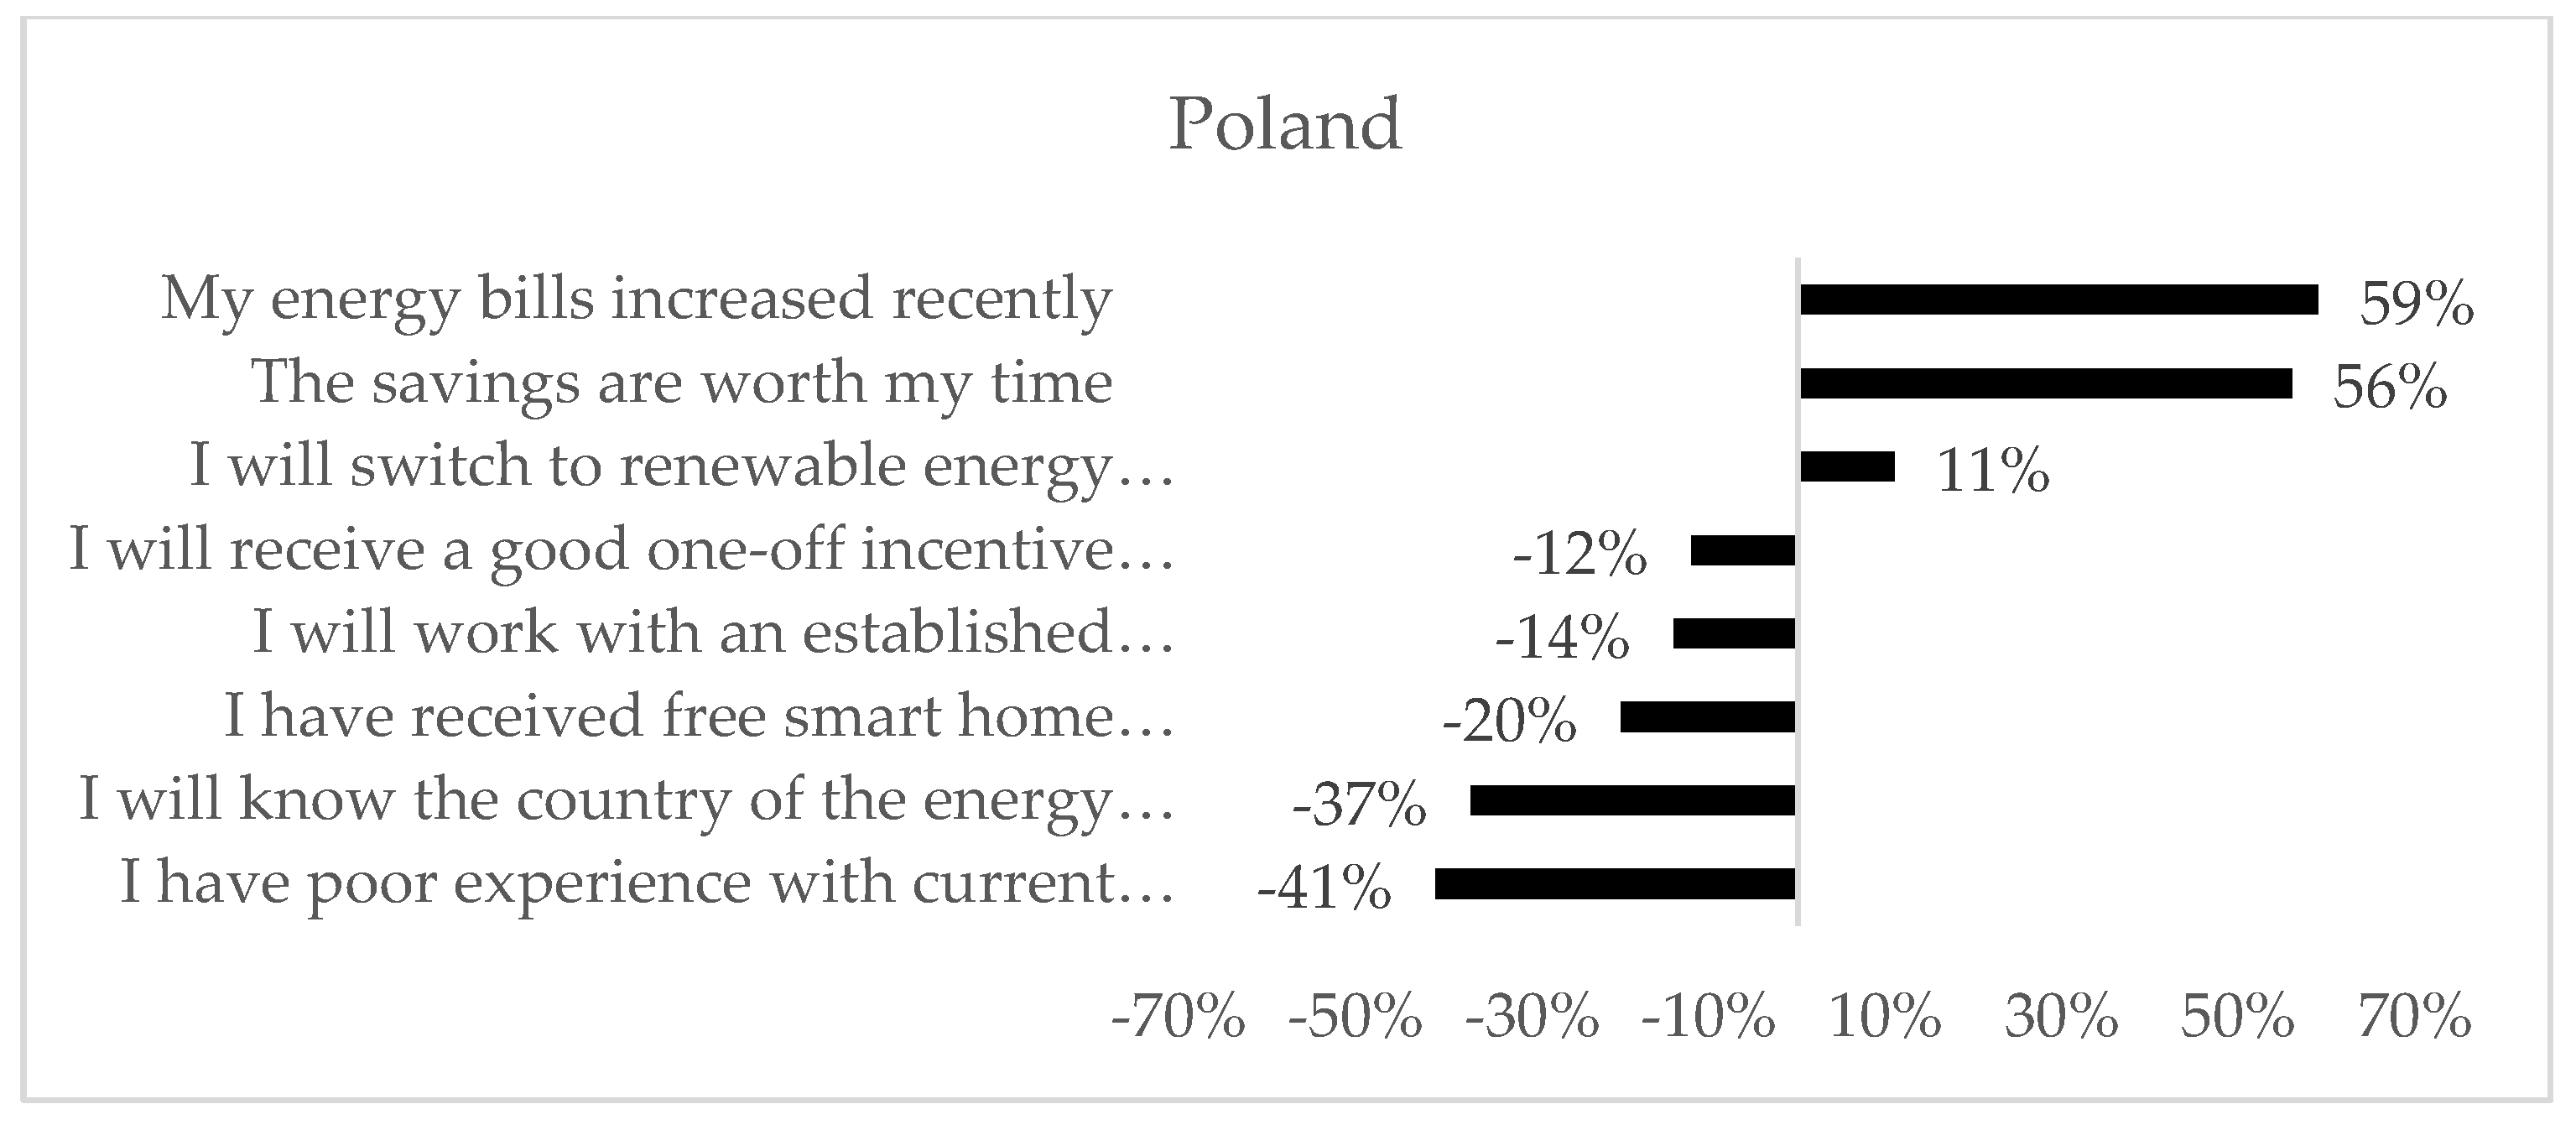
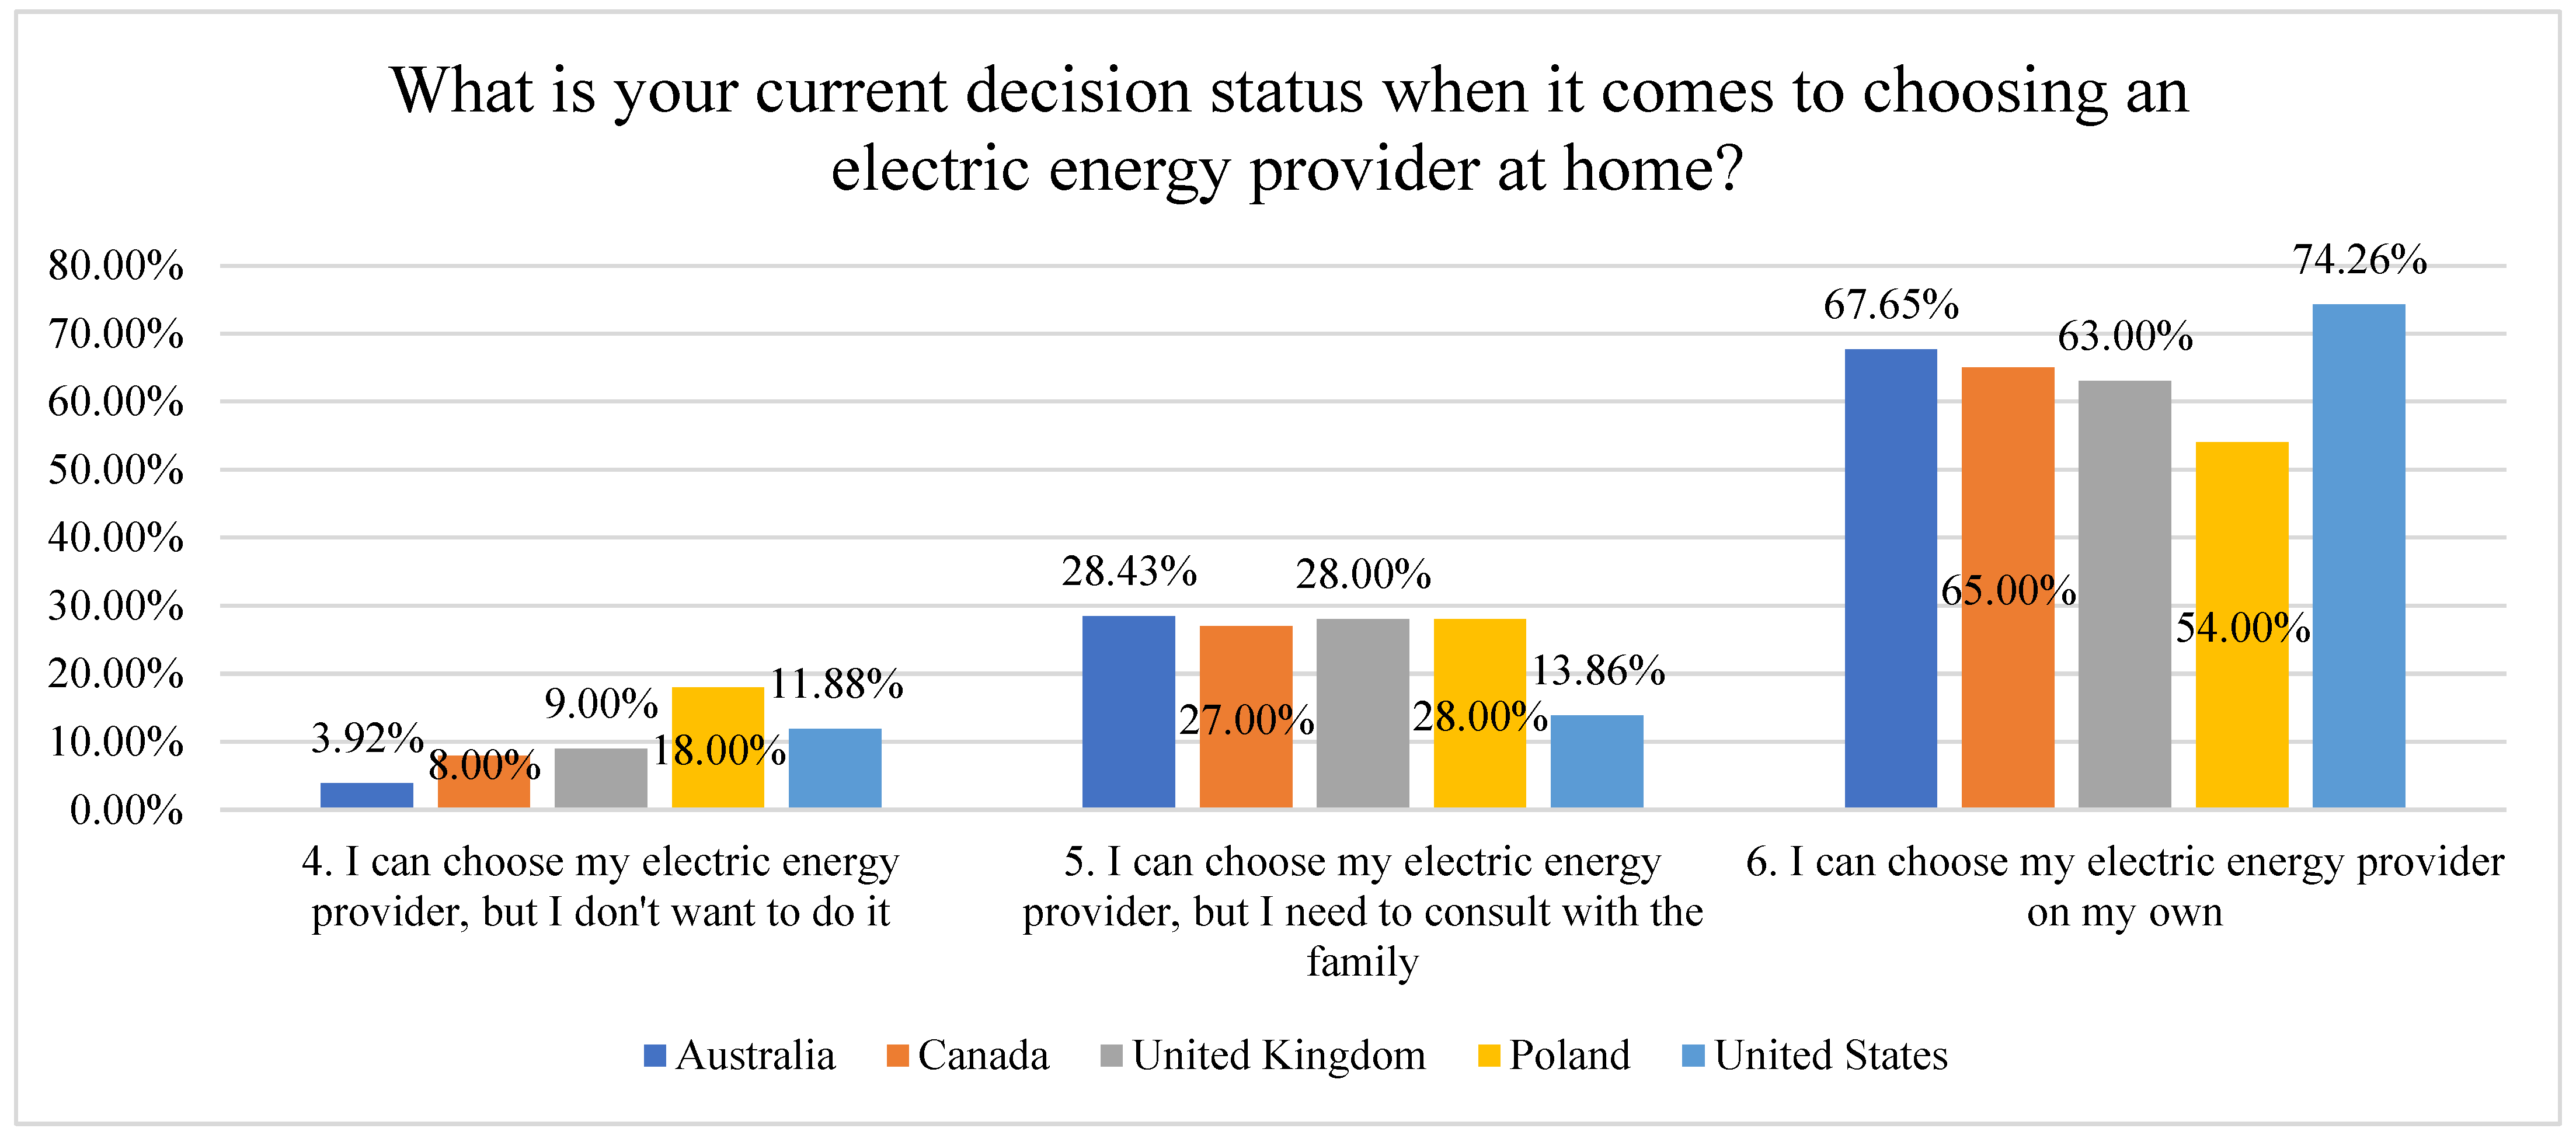
The research was carried out using a procedure appropriate to the triangulation of research methods. The following research methods were used:
(a) desk research—in an exploratory approach,
(b) quasi-quantitative research using a survey questionnaire, CAWI technique (Computer-Assisted Web Interview survey) as the main survey,
(c) qualitative research FGI (Focus Group Interview)—as a deepening of the research results (Figure 1).
The research also included a triangulation of research perspectives, i.e.,
(a) perspective on the scientific output in this area (review);
(b) the perspective of the consumer, making decisions on the choice of energy supplier;
(c) the perspective of energy market experts.
The research is a pilot study in which preliminary testing of the research hypotheses is carried out. Every effort has been made to ensure that the research is representative. Unfortunately, the cost of the research for a representative study would be very high, so the pilot study is quasi-representative.
The research process used desk research analysis to establish the research problems. This was followed by the conceptualisation of variables and indicators and the structuring of research hypotheses. The next step was the selection of the research platform, the construction of the survey questionnaire, and the interview scenario. The surveys were then implemented, the database was verified, and analyses were conducted. The research was carried out using the CAWI technique, on the platform—https://www.pollfish.com/ (accessed on 12 November 2022) among consumers of the following countries: the USA, Canada, Australia, the UK, and Poland. The number of survey units surveyed in each stratum (N = 500, 100 people from each country).
The sampling method precluded the implementation of the study using random sampling techniques, due to the lack of a sampling frame. The selection of the research sample consisted of dividing consumers into strata by country of origin, followed by a random selection within each stratum of research units—people who have the freedom to make decisions about their choice of energy supplier. Within each stratum, the same number of survey units were selected in each country in the pilot study. This is because the main aim of the study was to compare consumer preferences in different countries and to verify statistical hypotheses.
The conceptualisation of the indicators was done taking into account: the main objective of the study, the identified research problems, and factors related to the specificity of consumer decision-making in this area (choice of energy supplier). This is based on the following principle:
Hypothesis 1 (H1).
Consumers voluntarily switching energy suppliers are driven by their choice of green energy.
We identified whether the consumer has the freedom to decide to switch energy suppliers, and if not what limits them? If given the choice, do they choose clean energy (green energy)?
Hypothesis 2 (H2).
Energy suppliers do not take into account customer needs/expectations and pursue their own strategies.
We identified whether the consumer is free to make the decision to switch energy suppliers, and if not what is limiting them—the energy supply company they use. This hypothesis implies the need for in-depth research.
Hypothesis 3 (H3).
The consumer is willing to pay more for green energy.
We identified whether the consumer is free to make the decision to switch energy suppliers. If so, what is the hierarchy of the most and least decisive factors in the choice of supplier? In addition, the level of consumer awareness of the sources of energy that powers their house/apartment was verified.

6. Results

The research sample was drawn from Poland, the USA, Canada, the UK, and Australia. The survey sample size was 500 electricity consumers (Male—43.54%, Female—56.46%). The survey was conducted between September and October 2022. Energy suppliers are the companies present in a given national market (Figure 2).
Hypothesis 1 (H1).
Clean energy vs. customer preferences.
To better understand customer preferences vs. green energy, a MaxDiff analysis was conducted. The analysis allows us to compare various product/offer features against each other and create a utility distribution chart. MaxDiff calculates the utility attributes more realistically. Contrary to most methods, it is less declarative and simulates the actual choice preferences. It allows for the division of utilities into positive ones, which are strong preference differentiators, and negative ones, which detract utility for a customer.
Responders in each country were asked: “Out of the following options, which reasons to switch the energy provider are the most and least convincing for you?” The results are consistent across all countries. Survey responders were asked to determine which reasons are the best and worst for them when switching energy providers.
Figure 3 shows that switching to renewable energy sources provides minor positive differentiation. Still, the reasons are far less preferred than the potential savings or the challenge of increased energy bills.
Similarly, Figure 4 shows that results in the United States present the same narrative. When savings are worth the client’s time and energy bills increase over time, only then do customers have a strong urge to switch energy providers. In other words, rational calculations drive the willingness to change the provider.
Figure 5 for Canada is consistent with Figure 3 and Figure 4 results. Similar to the US, green energy plays an almost marginal role and does not increase the overall value of the energy provider offers.
Figure 6 represents the results for Australia. They are consistent with the previous observations; however, we see a slightly higher tendency to favour clean energy.
We observe the highest clean energy preference in Poland, one of Europe’s most “coal-heavy” countries. Figure 7 results provides an insight into how energy providers’ offers need to be created.
Considering the initial results for five countries, we conclude that customers do not favour green energy over the cost savings factors, and it does not play a significant role in their decisions. Therefore, we cannot confirm Hypothesis 1. We observe a contrary result: when customers freely change their energy provider, they do not consider clean energy factors.
However, as a recommendation for business, we observe that energy providers should communicate clear, rational cost savings benefits, especially considering recent energy cost increases due to the current geopolitical situation. Yet, on top of that, they might also add a clean energy component, which has a positive utility and may play as a “nice to have” feature for some customers.
Hypothesis 2 (H2).
Customer preferences and energy provider switching roadblocks.
During the ideation and desk research stage, the authors have thought of potential explanations for customers’ decisions to switch/not switch to the new provider. One of the reasons we wanted to validate was a lack of knowledge when it came to choosing offers. We have asked responders in various countries to answer the question: “What is your current decision status when choosing an electric energy provider at home?”.
Figure 8 represents the answers across all countries. We observe a generally high awareness of the ability to choose a new energy provider, albeit, at the same time, there is a strong status quo effect in place. The results are observed across all countries’ data.
Moreover, most responders in each country know that they can choose electric energy providers independently. While the results differ from country to country, we observe the same pattern.
Interestingly enough, we observe a typical answer pattern. None of the responders mentioned the following answers:
  • “1. I cannot choose the electric energy provider; my landlord does it for me”
  • “2. I cannot choose the electric energy provider; someone in my family does it for me”
  • “3. I cannot choose the electric energy provider due to contracts I already have”
To conclude, while we still need to validate the research further, energy providers can acquire customers from the other market players and may capitalize on this opportunity. We need to conclude further qualitative research to validate Hypothesis 2, but we see that customer preferences and knowledge do not create a strategic challenge for energy providers.
Triangulating the results with the customer preferences also outlines a clear strategy for energy providers. They must communicate the cost savings and recently increased costs connected with switching to a new vendor with a green energy option.
Willingness to pay for clean energy
When it comes to finding the willingness to pay for clean energy, we had to connect results from two questions:
(a) “If you choose only one type of electric energy you could use in your house, what would it be?”
(b) Standardized items from the Van Westendorp Price Sensitivity Meter survey [77].
The first question (Table 4) was used as a segmentation item, while the second allowed the calculation of the relative differences between the minimal, maximal, and median of answers. While the results are preliminary, gathered on a relatively low sample by country, and not representative of the whole population, we did not conclude full statistical inference as it would not be methodologically correct. However, the initial results create a solid foundation for further research with a higher sample-gathering budget.
Ultimately, our sample vs. preferred energy choice shows that solar energy is the most preferred across most countries. On the other hand, coal energy is the least preferred. On top of that, there are country-level nuances, which we might want to research further in the next publications. For instance, a few additional observations: lower preference for solar energy in Canada (possible reason: latitude of country and less sun throughout a year) or lower preference for nuclear power in Australia (possible reason: nuclear energy ban from 1998).
In our cross-question representation, 0% is a median baseline for the results. Everything above indicates higher willingness-to-pay (WTP), and everything below it lowers it. When there was a N below 5 responders, the results are not shown.
Figure 9 represents a pattern in which some customers are willing to pay more for solar and water energy, while wind energy does not drive substantial differentiation. Nuclear power might also create an additional WTP.
Figure 10 shows the results for the United States. We observe that solar energy has a generally higher preference and drives WTP. Wind and nuclear power also increase it, but they are moderately common in the US, so they are not anything necessarily new.
Figure 11 shows that water and solar energy drives WTP; however, we also see it with coal energy. Therefore, we cannot say in the case of Australia whether the responders prefer green energy and want to pay for it on a higher basis.
Figure 12 represents Canadian customers’ preferences and their WTP by energy type. While a pattern might emerge, we do not see a strong tendency. Overall clean energy drives willingness to pay, but on a much lower multiple than for other countries.
Figure 13 represents Poland. There is a substantial preference increase towards solar and nuclear energy vs. wind; however, if we take medians under consideration, coal energy drives WTP as well. The reason might be the inflation of energy supplies, especially coal. The shortage of supply surges prices and creates an additional willingness to pay for an energy source, which is still used by over 90% of Polish households.
To conclude the results for Hypothesis 3, we believe that clean energy drives willingness to pay for some customers, but that does not change the overall customer perception (Hypothesis 1 results). We observe sample limitations. Therefore, we recommend boosting it for the following publications and running statistical inference tests with a standard distribution assumption to validate the hypothesis fully. As for now, we do not see a clear pattern emerging, and we cannot disprove the results from the literature that clean energy drives the overall willingness to pay.

7. Discussion & Conclusions

Conducting the study in five selected countries is a significant limitation. It is justifiable to carry out explorations in diverse locations, given the unique nature of the region. In this way, it is possible to recognise the factors analysed in the context of all sources of green energy, not just those that are most prevalent. In addition, subsequent studies should take into account the unique characteristics of a region’s population as well as its level of pollution. Furthermore, the conclusions in this study use consumer preferences, so it is not possible to say how their stated intentions differ from the actions they take.
In our quantitative study, Hypothesis 1 was disproved by the research results. Hypothesis 2 requires further qualitative reasoning, but the results show a strong foundation. Hypothesis 3 cannot be disproven with the current sample size and research method; however, we observe the pattern that shows that clean energy does not drive WTP. It stands to the contrary of other publications identified during the literature search.
Nevertheless, the article is a prelude to further considerations of an empirical nature, as it made the authors realise that there are extremely strong links between the strategic development of an organisation and opportunities: increased financial benefits and cost reductions in the context of environmental protection. The already mentioned hypothesis of M.E. Porter and the work of S. Ambec and P. Lanoie open the door to further explorations in the context of green energy and the organisational opportunities studied by the team over the years [78].
It is also worth mentioning that one of the disturbances in the assessment of results may also be government programs that are designed to stimulate the market to move towards green energy. Poland has such a program [79], as do the UK [80], the USA [81], Canada [82], and Australia [83]. In the opinion of the authors, this can cause unnatural market behaviour and changes that confound any research involving green energy sources. However, such stimulation of the market also shows that the topic is important, and the end customer is constantly changing.
An additional limitation of the study may be the characteristics of the countries. The countries presented in terms of economic character have similar economic conditions and economies. The authors are not talking here about the size of GDP, but about the general characteristics and strategies of the countries.
The sample size is also a limitation. The sample includes 500 pilot surveys. The attempt can be extended based on the presented research results; the final study is being prepared.
An important limitation is also the fact that the consumer market consumes far less energy than the business organisation market. The research team therefore set out to identify the research hypotheses analysed (1–3) in the context of the B2B market.
The practical application of the presented study can be translated into the preparation of a strategy of cooperation with the client in the case of offering new power supply options in the area of green energy.
Practical application is also manifested in the possible price-list approach to energy sales. On the basis of the available data, the company with the presented data can offer energy products based on green energy in a very attractive way.
A company building an action strategy for a selected group of customers can address their needs more precisely and can clearly ignore some needs.
The study may be developed in the future with additional countries with different characteristics than those presented in the current study. This will allow you to look at the variety of strategies and approaches to energy strategy.
The study in the future may specify the research groups and their price flexibility in more detail. Which will allow you to define the exact flexibility regarding payments.
It is worth taking into account the impact of state policy on the selected sector and the area of the sector in the next study. The impact of government programs, regional strategy, such as the strategy of the European Union as well as taking into account geopolitical conditions.

Author Contributions

Conceptualization, A.S., R.T., M.W. and J.H.-I.; methodology, M.W., R.T. and J.H.-I.; software, A.S., R.T. and M.W.; validation, R.T., A.S. and M.W.; formal analysis, A.S. and R.T.; investigation, A.S., R.T. and M.W.; resources, A.S., R.T. and M.W.; data curation, M.W.; writing—original draft preparation, A.S., R.T. and M.W.; writing—review and editing, A.S. and R.T.; visu-alization, M.W. and R.T.; supervision, A.S. and R.T.; project administration, A.S. and R.T.; funding acquisition, J.H.-I. All authors contributed equally to the research. All authors have read and agreed to the published version of the manuscript.

Funding

This research was co-funded from the resources of project no. 10/WZ/9/SMON, financed by the Ministry of National Defense 2022 Subsidy, realised at General Tadeusz Kościuszko Military University of Land Forces.

Institutional Review Board Statement

Not applicable.

Informed Consent Statement

Not applicable.

Data Availability Statement

Not applicable.

Conflicts of Interest

The authors declare no conflict of interest.

Appendix A

Table A1. Level of green energy production in selected countries-by source.
CAP (MW)2012201320142015201620172018201920202021
Hydropower
USA101,107101,589102,162102,240102,692102,703102,801102,649105,767101,894
Canada75,53775,51175,47479,40580,30480,83181,39681,39981,40482,740
Australia8271827182718271827182718523852385238523
UK4437445344744677473347704773477347754793
Poland2351235523642370238523902391239724002384
Renewable hydropower (including mixed plants)
USA82,44282,90383,38683,37483,66583,644 o83,72283,62483,797 o79,982 o
Canada75,36375,33775,30079,23180,13080,65781,22281,22281,227 u82,563 u
Australia7461746174617461746174617713 o7713 o7713 o7713 o
UK199320092030207721332170 e21732173 o2175 o2193 o
Poland945949958964972967968974 e977 e1164
Pure pumped storage
USA18,66518,68618,77618,86619,02719,05919,07919,02521,969 o21 912 o
Canada174174174174174 o174 e174 e177177 e177 e
Australia810810810810810810810810 o810 o810 o
UK24442444244426002600260026002600 o2600 o2600 o
Poland14061406140614061413142314231423 e1423 e1220 o
Marine energy
USA-0 u0 e0 u0 u0 o----
Canada20202020202020 e20 e20 e20 e
Australia111111 e1 e1 o1 e1 e
UK9899913182022 o22 o
Poland----------
Wind energy 1
USA59,07559,97364,23272,57381,28687,59794,516104,052118,732132,738
Canada62017801969411,21411,97312,25012,81613,41313,62714,304
Australia2561322137974181432448125442627986038951
UK903011,28213,07414,30616,12619,58521,76724,09524,48527,130
Poland2564342938364886574757595766583762986958
Onshore wind energy
USA59,07559,97364,23272,57381,25787,56894,487104,023 o118,703 o132,696 o
Canada62017801969411,21411,97312,25012,816 u13,413 u13,62714,304
Australia256132213797418143244812544262798603 o8951 o
UK603575868573921210,83312,59713,55114,12514,102 o14,430 u
Poland2564342938364886574757595766583762986958 u
Offshore wind energy
USA--0 u 0 u 29 29 29 o 29 o 29 o 42 o
Canada----------
Australia----------
UK----------
Poland----------
Solar energy 2
USA8613 13,045 17,651 23,442 34,716 43,115 51,570 60,826 75,562 95,209
Canada766 1210 1843 2519 2665 2932 3095 3327 3342 3630
Australia3799 4568 5287 5946 6689 7354 8625 12,969 17,344 19,076
UK1753 2937 5528 9601 11,914 12,760 13,073 13,346 13,462 13,689
Poland1 2 27 108 187 287 562 1539 3955 6257
Solar photovoltaic
USA8137 11,759 15,984 21,684 32,958 41,357 49,812 59,068 73,814 o 93,713 o
Canada766 1210 1843 2519 2665 2932 3095 3327 3342 3630
Australia3796 4565 5284 5943 6686 7352 8623 12,967 17,342 o 19,074 o
UK1753 2937 5528 9601 11,914 12,760 13,073 13,346 13,462 o13,689 o
Poland1 2 27 108 187 287 562 1539 3955 6257
Concentrated solar power
USA476 1286 1667 1758 1758 1758 o 1758 o 1758 o 1748 o 1496 o
Canada----------
Australia33333222 o2 e2 e
UK----------
Poland----------
Bioenergy
USA11,321 12,392 12,526 13,115 13,049 12,985 12,774 12,267 12,271 13,574
Canada2013 2041 2497 2473 2540 2642 2654 2410 2416 2416
Australia827 817 824 826 864 864 864 864 875 876
UK3117 3791 4254 4808 5251 5514 6997 7165 7243 7259
Poland583 735 816 961 974 968 1004 1010 1045 1045
Solid biofuels and renewable waste
USA9015 o 9966 o 9977 o 10,590 o 10,519 o 10,404 o 10,159 o 9841 o 9840 o 11,140 o
Canada1897 1925 2381 2357 2424 2503 2515 e 2271 e 2271 e 2271 e
Australia597 597 598 598 674 o 674 e 674 e 674 e 678 e 678 e
UK1742 2377 2723 3180 3477 3695 5161 5333 5405 o 5418 o
Poland455 582 629 745 749 738 778 777 784 784 e
Renewable municipal waste
USA1205 o 1222 o 1222 o 1270 o 1270 o 1270 o 1270 o 1270 o 1270 o 1270 o
Canada39393939393838 e38 e38 e38 e
Australia---------0 o
UK257 273 340 465 514 545 568 661 723 o 733 o
Poland---8 22 30 43 45 50 50 e
Biogas
USA2102 2271 2394 2370 2375 2416 2379 2303 2308 o 2310 o
Canada116 116 116 116 116 139 139 e 139 145 u 145 u
Australia230 220 226 228 190 o 190 o 190 o 190 197 o 198 o
UK1375 o 1414 o 1531 o 1628 o 1774 o 1819 o 1836 o 1832 o 1838 o 1841 o
Poland128 o 153 o 187 o 216 o 225 o 229 e 225 e 233 e 261 e 261 e
Renewable energy share of electricity capacity
USA15.4 16.0 16.8 18.2 19.8 20.9 21.9 23.3 25.3 27.5
Canada63.3 64.6 65.5 66.3 66.4 66.8 67.1 67.1 66.8 68.3
Australia22.5 24.3 25.5 26.9 28.8 30.8 32.9 37.8 42.2 42.8
UK16.6 21.4 25.8 32.0 35.9 38.2 40.7 44.6 45.1 46.5
Poland11.6 14.3 15.7 18.5 20.7 18.6 19.3 21.5 24.9 29.9
Source: IRENA, International Renewable Energy Agency, Report titled: Renewable Capacity Statistics 2022. Numbers followed by the letter “o” are figures that have been obtained from official sources such as national statistical offices, government departments, regulators, and power companies. The letter “u” follows figures that have been obtained from unofficial sources, such as industry associations and news articles. The letter “e” follows figures that have been estimated by IRENA from a variety of different data sources. All data from the IRENA questionnaire is presented without any indicator. 1 Rotational kinetic energy generated from windmill rotation (which also relates to offshore wind energy) is transmitted to power plants and converted to electricity. The conversion of airflow into energy results has no environmental impact. Production varies depending on wind levels, but 24-h output is possible [24]. 2 Light energy from the sun is converted into electricity by solar panels. Solar energy has no environmental impact. The output varies depending on the amount of solar radiation (e.g., during cloudy and rainy weather) [24].

References

  1. Aktar, M.A.; Alam, M.M.; Al-Amin, A.Q. Global Economic Crisis, Energy Use, CO2 Emissions, and Policy Roadmap amid COVID-19. Sustain. Prod. Consum. 2021, 26, 770–781. [Google Scholar] [CrossRef] [PubMed]
  2. Hojnik, J.; Ruzzier, M.; Fabri, S.; Klopčič, A.L. What You Give Is What You Get: Willingness to Pay for Green Energy. Renew. Energy 2021, 174, 733–746. [Google Scholar] [CrossRef]
  3. Halkos, G.E.; Gkampoura, E.-C. Evaluating the Effect of Economic Crisis on Energy Poverty in Europe. Renew. Sustain. Energy Rev. 2021, 144, 110981. [Google Scholar] [CrossRef]
  4. Brouwer, R.; Brander, L.; van Beukering, P. A Convenient Truth: Air Travel Passengers’ Willingness to Pay to Offset Their CO2 Emissions. Clim. Chang. 2008, 90, 299–313. [Google Scholar] [CrossRef]
  5. Niemczyk, J.; Borowski, K.; Trzaska, R.; Trzaska, M.; Sus, A.; Matuszewski, M. Identification of the Strategy of the Energy and Utilities Sector from the G7 Group Countries, from the Perspective of a Dominant Strategy Approach. Energies 2022, 15, 8562. [Google Scholar] [CrossRef]
  6. Sulich, A.; Sołoducho-Pelc, L. Renewable Energy Producers’ Strategies in the Visegrád Group Countries. Energies 2021, 14, 3048. [Google Scholar] [CrossRef]
  7. Loučanová, E.; Olšiaková, M.; Štofková, J. Open Business Model of Eco-Innovation for Sustainability Development: Implications for the Open-Innovation Dynamics of Slovakia. J. Open Innov. Technol. Mark. Complex. 2022, 8, 98. [Google Scholar] [CrossRef]
  8. Senkus, P.; Glabiszewski, W.; Wysokińska-Senkus, A.; Cyfert, S.; Batko, R. The Potential of Ecological Distributed Energy Generation Systems, Situation, and Perspective for Poland. Energies 2021, 14, 7966. [Google Scholar] [CrossRef]
  9. Tomaszewski, K.; Sekściński, A. Odnawialne Źródła Energii w Polsce—Perspektywa Lokalna i Regionalna. Rynek Energii 2020, 4, 10–19. [Google Scholar]
  10. Streimikiene, D.; Balezentis, T.; Alisauskaite-Seskiene, I.; Stankuniene, G.; Simanaviciene, Z. A Review of Willingness to Pay Studies for Climate Change Mitigation in the Energy Sector. Energies 2019, 12, 1481. [Google Scholar] [CrossRef]
  11. Rohdin, P.; Thollander, P. Barriers to and Driving Forces for Energy Efficiency in the Non-Energy Intensive Manufacturing Industry in Sweden. Energy 2006, 31, 1836–1844. [Google Scholar] [CrossRef] [Green Version]
  12. Bertoldi, P.; Rezessy, S.; Vine, E. Energy Service Companies in European Countries: Current Status and a Strategy to Foster Their Development. Energy Policy 2006, 34, 1818–1832. [Google Scholar] [CrossRef]
  13. Qin, Y.; Xu, Z.; Wang, X.; Škare, M. Green Energy Adoption and Its Determinants: A Bibliometric Analysis. Renew. Sustain. Energy Rev. 2022, 153, 111780. [Google Scholar] [CrossRef]
  14. Kahouli, B.; Hamdi, B.; Nafla, A.; Chabaane, N. Investigating the Relationship between ICT, Green Energy, Total Factor Productivity, and Ecological Footprint: Empirical Evidence from Saudi Arabia. Energy Strategy Rev. 2022, 42, 100871. [Google Scholar] [CrossRef]
  15. Pawłowski D Kryzys Energetyczny 2022–Przyczyny, Wzrost Cen. Jak Sobie Poradzić? Available online: https://magazynprzedsiebiorcy.pl/kryzys-energetyczny (accessed on 21 October 2022).
  16. Dietz, T.; Ostrom, E.; Stern, P.C. The Struggle to Govern the Commons. Science 2003, 302, 1907–1912. [Google Scholar] [CrossRef]
  17. Kosoy, N.; Brown, P.G.; Bosselmann, K.; Duraiappah, A.; Mackey, B.; Martinez-Alier, J.; Rogers, D.; Thomson, R. Pillars for a Flourishing Earth: Planetary Boundaries, Economic Growth Delusion and Green Economy. Curr. Opin. Environ. Sustain. 2012, 4, 74–79. [Google Scholar] [CrossRef]
  18. Niemczyk, J.; Sus, A.; Borowski, K.; Jasiński, B.; Jasińska, K. The Dominant Motives of Mergers and Acquisitions in the Energy Sector in Western Europe from the Perspective of Green Economy. Energies 2022, 15, 1065. [Google Scholar] [CrossRef]
  19. Daniel Tang, K.H. Climate Change Policies of the Four Largest Global Emitters of Greenhouse Gases: Their Similarities, Differences and Way Forward. J. Energy Res. Rev. 2022, 10, 19–35. [Google Scholar] [CrossRef]
  20. Kulkarni, S.S.; Wang, L.; Venetsanos, D. Managing Technology Transfer Challenges in the Renewable Energy Sector within the European Union. Wind 2022, 2, 150–174. [Google Scholar] [CrossRef]
  21. Del Río, P.; Peñasco, C.; Mir-Artigues, P. An Overview of Drivers and Barriers to Concentrated Solar Power in the European Union. Renew. Sustain. Energy Rev. 2018, 81, 1019–1029. [Google Scholar] [CrossRef]
  22. Cheng, D.; Shi, X.; Yu, J. The Impact of the Green Energy Infrastructure on Firm Productivity: Evidence from the Three Gorges Project in the People’s Republic of China; Asian Development Bank Institute: Tokyo, Japan, 2020. [Google Scholar] [CrossRef]
  23. Michalak, D.; Rosiek, K.; Szyja, P. Gospodarka Niskoemisyjna–Gospodarka Cyrkularna–Zielona Gospodarka; Uwarunkowania i Wzajemne Powiazania; Wydawnictwo Uniwersytetu Łódzkiego: Łódź, Poland, 2020. [Google Scholar]
  24. Murakami, K.; Ida, T.; Tanaka, M.; Friedman, L. Consumers’ Willingness to Pay for Renewable and Nuclear Energy: A Comparative Analysis between the US and Japan. Energy Econ. 2015, 50, 178–189. [Google Scholar] [CrossRef]
  25. Green productivity: An Approach to Sustainable Development Green Productivity. Available online: https://www.apo-tokyo.org/wp-content/uploads/2014/07/ind_gp_aasd-2002.pdf (accessed on 21 November 2022).
  26. Tuttle, T.; Heap, J. Green Productivity: Moving the Agenda. Int. J. Prod. Perform. Manag. 2008, 57, 93–106. [Google Scholar] [CrossRef]
  27. Porter, M.E.; der Linde, C. Toward a New Conception of the Environment-Competitiveness Relationship. J. Econ. Perspect. 1995, 9, 97–118. [Google Scholar] [CrossRef]
  28. Rexhäuser, S.; Rammer, C. Environmental Innovations and Firm Profitability: Unmasking the Porter Hypothesis. Environ. Resour. Econ. 2014, 57, 145–167. [Google Scholar] [CrossRef]
  29. Zhang, D. Green Credit Regulation, Induced R&D and Green Productivity: Revisiting the Porter Hypothesis. Int. Rev. Financ. Anal. 2021, 75, 101723. [Google Scholar]
  30. Wu, W.; Huang, M.; Lv, H.; Wang, W.; Zhang, M. Does the Air Pollution Joint Prevention and Control Policy Possess the Porter Effect in China-Evidence from Two Perspectives. Environ. Impact Assess. Rev. 2021, 91, 106678. [Google Scholar] [CrossRef]
  31. Cudmore, B.A. Sustainable Energy: The Importance of Consumer Awareness, Acceptance, and Action. Int. J. Sustain. Dev. 2011, 14, 154–174. [Google Scholar] [CrossRef]
  32. Rośnie Świadomość Ekologiczna Polaków. Available online: https://biznes.newseria.pl/biuro-prasowe/energetyka/rosnie-swiadomosc,b1038027711 (accessed on 2 January 2023).
  33. Czarnecka, M.; Kinelski, G.; Stefańska, M.; Grzesiak, M.; Budka, B. Social Media Engagement in Shaping Green Energy Business Models. Energies 2022, 15, 1727. [Google Scholar] [CrossRef]
  34. Chomać-Pierzecka, E.; Sobczak, A.; Urbańczyk, E. RES Market Development and Public Awareness of the Economic and Environmental Dimension of the Energy Transformation in Poland and Lithuania. Energies 2022, 15, 5461. [Google Scholar] [CrossRef]
  35. Porter, M.E. Competitive Strategy: Techniques for Analyzing Industries and Competitors. Rev. Inteligência Compet. 2012, 2, 47–77. [Google Scholar]
  36. Obłój, K. O Definicji Strategii Raz Jeszcze. Prz. Organ. 2009, 5, 3–5. [Google Scholar] [CrossRef]
  37. Nag, R.; Hambrick, D.C.; Chen, M.-J. What Is Strategic Management, Really? Inductive Derivation of a Consensus Definition of the Field. Strateg. Manag. J. 2007, 28, 935–955. [Google Scholar] [CrossRef]
  38. Rumelt, R.P. Strategy in a Structural Break. McKinsey Q. 2009, 1, 35–42. [Google Scholar]
  39. Obłój, K.; Obłój, T. Dominujaca Logika Skutecznych Strategii–Wyniki Badań Jakościowych. Koncepcja Dominujacej Logiki. Prz. Organ. 2006, 4, 9–12. [Google Scholar]
  40. Drucker, P.F. Zarzadzanie XXI Wieku-Wyzwania; New Media Srl Aliberti Editore: Warsaw, Poland, 2010. [Google Scholar]
  41. Ludwicki, T. Świat Strategii. Prz. Organ. 1995, 4, 13–16. [Google Scholar] [CrossRef]
  42. Szczerbowski, R. Polityka Energetyczna Wybranych Krajów Europejskich a Strategia Energetyczna Polski. Polityka Energetyczna 2015, 18, 5–14. [Google Scholar]
  43. Moore, M. An Energy Strategy for Canada; Canadian Global Affairs Institute: Ottawa, ON, Canada, 2015. [Google Scholar]
  44. Krog, L.; Sperling, K. A Comprehensive Framework for Strategic Energy Planning Based on Danish and International Insights. Energy Strategy Rev. 2019, 24, 83–93. [Google Scholar] [CrossRef]
  45. Nagy, K.; Körmendi, K. Use of Renewable Energy Sources in Light of the “New Energy Strategy for Europe 2011–2020”. Appl. Energy 2012, 96, 393–399. [Google Scholar] [CrossRef]
  46. Winston, A.; Favaloro, G.; Healy, T. Energy Strategy for the C-Suite. Harv. Bus. Rev. 2017, 95, 139–146. [Google Scholar]
  47. Ralston, B. How to Develop a Customized Corporate Energy Strategy. Strategy Leadersh. 2008, 36, 30–39. [Google Scholar] [CrossRef]
  48. Galani, D.; Gravas, E.; Stavropoulos, A. Company Characteristics and Environmental Policy. Bus. Strategy Environ. 2012, 21, 236–247. [Google Scholar] [CrossRef]
  49. Christoffersen, L.B.; Larsen, A.; Togeby, M. Empirical Analysis of Energy Management in Danish Industry. J. Clean Prod. 2006, 14, 516–526. [Google Scholar] [CrossRef]
  50. Rudberg, M.; Waldemarsson, M.; Lidestam, H. Strategic Perspectives on Energy Management: A Case Study in the Process Industry. Appl Energy 2013, 104, 487–496. [Google Scholar] [CrossRef]
  51. Borchers, A.M.; Duke, J.M.; Parsons, G.R. Does Willingness to Pay for Green Energy Differ by Source? Energy Policy 2007, 35, 3327–3334. [Google Scholar] [CrossRef]
  52. Zografakis, N.; Sifaki, E.; Pagalou, M.; Nikitaki, G.; Psarakis, V.; Tsagarakis, K.P. Assessment of Public Acceptance and Willingness to Pay for Renewable Energy Sources in Crete. Renew. Sustain. Energy Rev. 2010, 14, 1088–1095. [Google Scholar] [CrossRef]
  53. Kostakis, I.; Sardianou, E. Which Factors Affect the Willingness of Tourists to Pay for Renewable Energy? Renew Energy 2012, 38, 169–172. [Google Scholar] [CrossRef]
  54. Ma, C.; Rogers, A.A.; Kragt, M.E.; Zhang, F.; Polyakov, M.; Gibson, F.; Chalak, M.; Pandit, R.; Tapsuwan, S. Consumers’ Willingness to Pay for Renewable Energy: A Meta-Regression Analysis. Resour. Energy Econ. 2015, 42, 93–109. [Google Scholar] [CrossRef]
  55. Ntanos, S.; Kyriakopoulos, G.; Chalikias, M.; Arabatzis, G.; Skordoulis, M. Public Perceptions and Willingness to Pay for Renewable Energy: A Case Study from Greece. Sustainability 2018, 10, 687. [Google Scholar] [CrossRef]
  56. le Gall-Ely, M. Definition, Measurement and Determinants of the Consumer’s Willingness to Pay: A Critical Synthesis and Avenues for Further Research. Rech. Et Appl. En Mark. 2009, 24, 91–112. [Google Scholar] [CrossRef]
  57. Nemet, G.F.; Johnson, E. Willingness to Pay for Climate Policy: A Review of Estimates; Working Paper Series, La Follette School Working Paper No. 2010-011; University of Wisconsin-Madison: Madison, WI, USA, 2010. [Google Scholar]
  58. Reynolds, T.; Kolodinsky, J.; Murray, B. Consumer Preferences and Willingness to Pay for Compact Fluorescent Lighting: Policy Implications for Energy Efficiency Promotion in Saint Lucia. Energy Policy 2012, 41, 712–722. [Google Scholar] [CrossRef]
  59. Biswas, A.; Roy, M. A Study of Consumers’ Willingness to Pay for Green Products. J. Adv. Manag. Sci. 2016, 4, 211–215. [Google Scholar] [CrossRef]
  60. Miller, K.; Hofstetter, R.; Krohmer, H.; Zhang, J. Measuring Consumers’ Willingness to Pay. Which Method Fits Best? GfK Mark. Intell. Rev. 2012, 4, 42–49. [Google Scholar] [CrossRef]
  61. Breidert, C.; Hahsler, M.; Reutterer, T. A Review of Methods for Measuring Willingness-to-Pay. Innov. Mark. 2006, 2, 8–32. [Google Scholar]
  62. Soliño, M.; Farizo, B.A.; Campos, P. The Influence of Home-Site Factors on Residents’ Willingness to Pay: An Application for Power Generation from Scrubland in Galicia, Spain. Energy Policy 2009, 37, 4055–4065. [Google Scholar] [CrossRef]
  63. Sardianou, E.; Genoudi, P. Which Factors Affect the Willingness of Consumers to Adopt Renewable Energies? Renew Energy 2013, 57, 1–4. [Google Scholar] [CrossRef]
  64. Bollino, C.A. The Willingness to Pay for Renewable Energy Sources: The Case of Italy with Socio-Demographic Determinants. Energy J. 2009, 30, 81–96. [Google Scholar]
  65. Ek, K. Public and Private Attitudes towards “Green” Electricity: The Case of Swedish Wind Power. Energy Policy 2005, 33, 1677–1689. [Google Scholar] [CrossRef]
  66. Bergmann, A.; Hanley, N.; Wright, R. Valuing the Attributes of Renewable Energy Investments. Energy Policy 2006, 34, 1004–1014. [Google Scholar] [CrossRef]
  67. Wüstenhagen, R.; Bilharz, M. Green Energy Market Development in Germany: Effective Public Policy and Emerging Customer Demand. Energy Policy 2006, 34, 1681–1696. [Google Scholar] [CrossRef]
  68. Wang, H.; Mullahy, J. Willingness to Pay for Reducing Fatal Risk by Improving Air Quality: A Contingent Valuation Study in Chongqing, China. Sci. Total Environ. 2006, 367, 50–57. [Google Scholar] [CrossRef] [PubMed]
  69. Zhang, L.; Sun, C.; Liu, H.; Zheng, S. The Role of Public Information in Increasing Homebuyers’ Willingness-to-Pay for Green Housing: Evidence from Beijing. Ecol. Econ. 2016, 129, 40–49. [Google Scholar] [CrossRef]
  70. Yoo, S.-H.; Kwak, S.-Y. Willingness to Pay for Green Electricity in Korea: A Contingent Valuation Study. Energy Policy 2009, 37, 5408–5416. [Google Scholar] [CrossRef]
  71. Diaz-Rainey, I.; Ashton, J.K. Stuck between a ROC and a Hard Place? Barriers to the Take up of Green Energy in the UK. Energy Policy 2008, 36, 3053–3061. [Google Scholar] [CrossRef]
  72. Scarpa, R.; Willis, K. Willingness-to-Pay for Renewable Energy: Primary and Discretionary Choice of British Households’ for Micro-Generation Technologies. Energy Econ. 2010, 32, 129–136. [Google Scholar] [CrossRef]
  73. Solino, M.; Vazquez, M.X.; Prada, A. Social Demand for Electricity from Forest Biomass in Spain: Does Payment Periodicity Affect the Willingness to Pay? Energy Policy 2009, 37, 531–540. [Google Scholar] [CrossRef]
  74. Li, H.; Jenkins-Smith, H.C.; Silva, C.L.; Berrens, R.P.; Herron, K.G. Public Support for Reducing US Reliance on Fossil Fuels: Investigating Household Willingness-to-Pay for Energy Research and Development. Ecol. Econ. 2009, 68, 731–742. [Google Scholar] [CrossRef]
  75. Ivanova, G.A. Consumers’ Willingness to Pay for Electricity from Renewable Energy Sources, Queensland, Australia. Int. J. Renew. Energy Res. 2013, 2, 758–766. [Google Scholar]
  76. Muhammad, I.; Shabbir, M.S.; Saleem, S.; Bilal, K.; Ulucak, R. Nexus between Willingness to Pay for Renewable Energy Sources: Evidence from Turkey. Environ. Sci. Pollut. Res. 2021, 28, 2972–2986. [Google Scholar] [CrossRef]
  77. van Westendorp, P.H. NSS Price Sensitivity Meter (PSM)—A New Approach to Study Consumer Perception of Prices. In Proceedings of the 29th ESOMAR Congress, Venice, Italy, 5–9 September 1976; Volume 139167. [Google Scholar]
  78. Stefan, A.; Paul, L. Does It Pay to Be Green? A Systematic Overview. Acad. Manag. Perspect. 2008, 22, 45–62. [Google Scholar] [CrossRef] [Green Version]
  79. KPRM Czysta Energia, Czyste Powietrze. Available online: https://www.gov.pl/web/polski-lad/czysta-energia-czyste-powietrze (accessed on 21 January 2023).
  80. Mitchell, C.; Connor, P. Renewable Energy Policy in the UK 1990–2003. Energy Policy 2004, 32, 1935–1947. [Google Scholar] [CrossRef]
  81. Mundaca, L.; Richter, J.L. Assessing ‘Green Energy Economy’Stimulus Packages: Evidence from the US Programs Targeting Renewable Energy. Renew. Sustain. Energy Rev. 2015, 42, 1174–1186. [Google Scholar] [CrossRef]
  82. Liming, H.; Haque, E.; Barg, S. Public Policy Discourse, Planning and Measures toward Sustainable Energy Strategies in Canada. Renew. Sustain. Energy Rev. 2008, 12, 91–115. [Google Scholar] [CrossRef]
  83. Zahedi, A. Australian Renewable Energy Progress. Renew. Sustain. Energy Rev. 2010, 14, 2208–2213. [Google Scholar] [CrossRef]
Figure 1. Research process for the presented study. Source: own study.
Energies 16 01613 g001
Figure 2. Frequency of the name of the company supplying electricity to B2C. Source: own study.
Energies 16 01613 g002
Figure 3. Utility attributes for various energy provider reasons in Great Britain. Source: own study.
Energies 16 01613 g003
Figure 4. Utility attributes for various energy provider reasons in the United States. Source: own study.
Energies 16 01613 g004
Figure 5. Utility attributes for various energy provider reasons in Canada. Source: own study.
Energies 16 01613 g005
Figure 6. Utility attributes for various energy provider reasons in Australia. Source: own study.
Energies 16 01613 g006
Figure 7. Utility attributes for various energy provider reasons in Poland. Source: own study.
Energies 16 01613 g007
Figure 8. Choosing energy provider status by country. Source: own study.
Energies 16 01613 g008
Figure 9. Willingness to pay for various types of electric energy in Great Britain. Source: own study.
Energies 16 01613 g009
Figure 10. Willingness to pay for various types of electric energy in the United States. Source: own study.
Energies 16 01613 g010
Figure 11. Willingness to pay for various types of electric energy in Australia. Source: own study.
Energies 16 01613 g011
Figure 12. Willingness to pay for various types of electric energy in Canada. Source: own study.
Energies 16 01613 g012
Figure 13. Willingness to pay for various types of electric energy in Poland. Source: own study.
Energies 16 01613 g013
Table 1. Total renewable energy in the countries selected for analysis.
CAP (MW)2012201320142015201620172018201920202021
USA263,279272,622 286,380 308,002331,723348,336367,056388,933419,978457,857
Canada84,36386,40989,35495,45797,32898,50199,807100,392100,632102,932
Australia14,64916,06817,37018,41519,33920,49222,64527,82634,53636,617
UK15,90220,02724,89530,80035,43340,04344,02846,80047,38750,293
Poland4094511656386919788179828301936012,27515,424
Source: Renewable Capacity Statistics 2022.
Table 2. Two alternate energy/environment scenarios of the future.
ScenarioScenario 1: Roller CoasterScenario 2: Stuck on Carbon
Future Energy Markets:Shift to AlternativesAbundant Hydrocarbons
Global Climate Changes:Abrupt EffectsIncremental Effects
Global Environmental Values and Priorities:Global Agreement; National DiscordsGlobal Disagreement; National Accords
World Economic Growth:Developing Global EconomyEconomic Nationalism
Source: [47].
Table 3. Cognitive premises of approaches to strategy selected for the research.
Selected Approaches to StrategyName of the Strategy ApproachBasic Cognitive Assumptions of Selected Approaches to the StrategyKeywords for Selected Approaches to the Strategy
Classic approaches to strategy
(1950–2008)
planningThe implementation of the Ricardian rent. The guideline for action is to focus on the economies of scale and scope.economy scale, Ansoff
positionalThe implementation of the Chamberlin’s rent. The guideline for action is to build the structure of market shares in order to take a privileged competitive position.industry analysis, Porter, portfolio, matrix, value chain
resourceThe implementation of the Ricardian rent. The guideline for action is to build value for shareholders based on the RBV on the basis of a bundle of key competences.Resources Based View, core competences, competences
Modern approaches to strategyinnovativeRealization of the Schumpeter’s rent. The guideline for action is to focus on breakthrough innovations also achieved in open innovation systems.Schumpeter, disruptive innovation, open innovation
(2008–2020)networkThe realization of the rent resulting from the network effect. The guideline for action is to build a network of dependencies in a way that allows for synergy.network, network effect
Source: [5].
Table 4. Electric energy preferences when given only one choice, N by country.
Wind EnergySolar EnergyWater EnergyNuclear EnergyCoal EnergySum
GB23555161100
US8714117101
AU876556100
PL9621141197
CA10392816497
Sum58303436229495
Source: own study.
Disclaimer/Publisher’s Note: The statements, opinions and data contained in all publications are solely those of the individual author(s) and contributor(s) and not of MDPI and/or the editor(s). MDPI and/or the editor(s) disclaim responsibility for any injury to people or property resulting from any ideas, methods, instructions or products referred to in the content.

