Article

Efficiency Assessment of Five Types of Photovoltaic Modules Installed on a Fixed and on a Dual-Axis Solar-Tracked Platform

Renewable Energy Systems and Recycling Research Centre, Transilvania University of Brasov, 500036 Brasov, Romania
*
Author to whom correspondence should be addressed.
Energies 2023, 16(3), 1229; https://doi.org/10.3390/en16031229
Submission received: 21 December 2022 / Revised: 14 January 2023 / Accepted: 17 January 2023 / Published: 23 January 2023
(This article belongs to the Special Issue Analysis and Numerical Modeling in Solar Photovoltaic Systems)

Abstract

:
A solution to increase the electrical output of the photovoltaic systems relies on solar tracking mechanisms that increase the amount of received solar energy. The experimental results obtained during a monitoring period of one year are comparatively presented in the paper for five types of photovoltaic modules installed on a fixed platform (as reference) and on a dual-axis solar tracking platform in the Renewable Energy Systems and Recycling R&D Centre of the Transilvania University of Brasov, Romania. The influence of the solar-tracking mechanism and the meteorological conditions specific to the four seasons during the monitoring period on the output of the analysed photovoltaic technologies are discussed in the paper. The solar tracking increases by 28% the amount of the yearly received solar energy and by 29.6% the electrical energy output of the entire PV platform. The solar conversion efficiency of the tracked PV platform is slightly increased (14.34%) when compared with the fixed one (14.17%). When assessing the influence of solar tracking on each type of PV, the results show that the CIGS PV module has the highest relative energy gain (34%) followed by CIS (30.8%), m-Si (30.6%), p-Si (27.3%) and CdTe (23.4%) PV modules.

1. Introduction

The buildings and the communities of the future will have to meet increased energy consumption standards defined by the nZEB (nearly Zero Energy Building) concept [1]. This concept recommends that at least 50% of the energy required by a building/community be locally produced with renewable energy systems (RES) installed on or in the vicinity of the building/community [2,3].
The development of such high-efficiency buildings has become even more important considering the current context of very high energy prices [4,5].
In order to meet such high energy standards, two steps are required: reducing of losses and the choosing of an optimal renewable energy system mix according to the different local restrictions related to the architecture, construction and the renewable energy potential of an area [6].
Any type of building mainly requires two forms of energy in order to function properly and ensure a general level of comfort for its inhabitants: electrical energy and thermal energy. The current paper only focuses on the production of electrical energy in the built environment.
Among the renewable energy systems producing electrical energy, the ones used in the built environment are mainly photovoltaic (PV) systems and wind turbines [7]. For the latter, different problems occur when functioning in the built environment, related to low wind speeds and vortices, noise and other risks related to high-speed moving blades.
A very important issue related to PV systems installed in the built environment is their performance in real-life conditions compared to the specifications provided in the product datasheets. PV module type [8], installation location and climate, PV system age and the ability to follow the Sun’s apparent movement ([9,10,11]) can substantially influence the electrical energy production of a PV system.
There are many papers available in literature which analyse the energy production of PV systems but most of them consider only crystalline silicon (c-Si)-type modules from different producers (e.g., [12,13]), giving information about their reliability.
Fewer papers study the performance of thin-film modules. For example, the research in [14] indicates an unexpectedly improved performance with increasing age for CIGS modules of –0.92%/year, [15] revalidates the low embodied energy of CdTe PV technology and [16] studies only the cost/m2 of CIGS solar PV modules, which are comparable to c-Si modules.
Even fewer papers can be found in the literature which compare the performance of c-Si with thin-film PV modules. Moreover, the PV systems analysed in these papers are spread across the entire globe, with most of them in the other three climates than the continental climate which is considered in the current paper.
As such, in the tropical climate: [17] identifies in Ghana an early performance degradation after 14 production months of 13.8% for a-Si modules, 9.3% for CIS modules and 7.9% … 9% for c-Si ones; [18] indicates a much lower price for PV energy compared to the subsidised price of energy generated in Malaysia from fossil fuels; [19] shows a similar performance of c-Si, CIS and CdTe modules regardless of the BIPV or BAPV mounting; and [20] demonstrates that p-Si systems have better electricity unit costs in Lahore, Pakistan.
Further, in the arid Saharan climate, characterised by hot and dusty conditions, Ref. [21] shows that Heterojunction Intrinsic Thin-Layer (HIT) and a-Si/μc-Si modules performed best out of five technologies tested in Algeria, while [22] demonstrates the best energy performance for a-Si and CdTe PV plants. The authors of [23], on the other hand, although located in a similar climate—Kuwait—indicate that m-Si, p-Si and HIT modules showed superior performance during high irradiance, while a-Si and CdTe modules performed much worse.
In the temperate climate, [24] indicates in Morocco the best Levelised Cost of Energy (LCOE) for p-Si modules, followed by m-Si and a-Si modules; [25] shows normal, rather equal performance ratios, in the range between 81% and 82% for the p-Si, a-Si and CdTe modules tested. Opposite this, [26] concludes that the PV modules tested in Shanghai, China have an average annual uncalibrated PR in the following order: bifacial HIT > CIGS > n-type multi-busbar module > monofacial HIT > sc-Si PERC > mc-Si PERC > CdTe.
In the continental climate, [27] indicates very high degradation rates of −5.55%/year for the CdTe modules for at least 25 months of exposure to the solar irradiance available in the city of Prague, Czech Republic. Additionally, a stable operation was identified for the c-Si modules.
Even fewer papers discuss the comparison between c-Si and thin-film modules installed on fixed and tracked surfaces targeting the nZEB standard in the built environment. To the best of our knowledge, only [28,29,30] analyse the influence of meteorological parameters like humidity, temperature and rain-/snowfall on the performance and formation of thin water/ice/snow surfaces on the transparent glass layer of five types of PV modules (m-Si, p-Si, CIGS, CdTe and CIS) which are installed on fixed and dual-axis tracked platforms.
As observed above and in Table 1, the conclusions of the papers indicate different and also contradictory results for the different PV technologies, mainly due to the climate of the implementation site.
In addition, no reference was found related to the influence of solar-tracking mechanisms on the conversion efficiency of PV modules of different technologies and on their functioning in continental climate conditions.
The aim of the present paper is to assess the effect of solar tracking on five different PV module technologies (m-Si, p-Si, CIS, CIGS and CdTe) after 10 years of deployment. The five types of PV modules were installed on both a fixed tilted and a dual-axis tracked platform in the continental mountain climate of Brasov, Romania [31]. The analysed time interval ranges from September 2021 to August 2022.
This paper is organised in five sections. Section 1 (the current section) provides the introduction, the background and the aim of the paper. It highlights the importance of PV performance studies for all four major climates existing throughout the globe and especially for the continental climate, where a large volume of such analyses is missing. A description of the methodology and of the computational methods used for analysing the monitored solar and electrical energy data is presented in Section 2. The Section 3 presents the experimental outdoor infrastructure with all the details related to the equipment used during the experiment. Section 4 presents and discusses the obtained results and is divided into five subsections related to the solar energy potential (Section 4.1), the electrical energy output of the fixed and tracked photovoltaic platforms (Section 4.2), the energy yield of both platforms (Section 4.3), their experimental solar conversion efficiency (Section 4.4) and the experimental solar conversion efficiency of the fixed and tracked photovoltaic modules (Section 4.5). Finally, the general conclusion section (Section 5) summarises the key findings of the paper in the context of other papers from similar climate conditions.
The findings can be useful for designers/installers of PV systems in order to size the systems according to the requirements of the beneficiaries, for off-grid end-users in order to adjust their consumption with the PV production and for large grid-connected power plants in order to accurately predict their hourly/monthly/yearly or even lifetime energy production.

2. Methodology

To evaluate the advantages of a tracked PV module vs. a fixed one installed at a yearly tilt angle (χ), the following relevant indicators are defined and assessed.
The available (EG) and the received (EGn) global solar energy are calculated using:
E G = t 1 t 2 G 60 ,   [ Wh / m 2 ] ,                                   E G n = t 1 t 2 G n 60 ,   [ Wh / m 2 ]
where:
t1 and t2 are the sunrise and sunset times of the day;
G and Gn are the available and the received global solar irradiance calculated each minute using:
G = B + D ,   [ W / m 2 ]                               G n = B n + D n ,   [ W / m 2 ]
where:
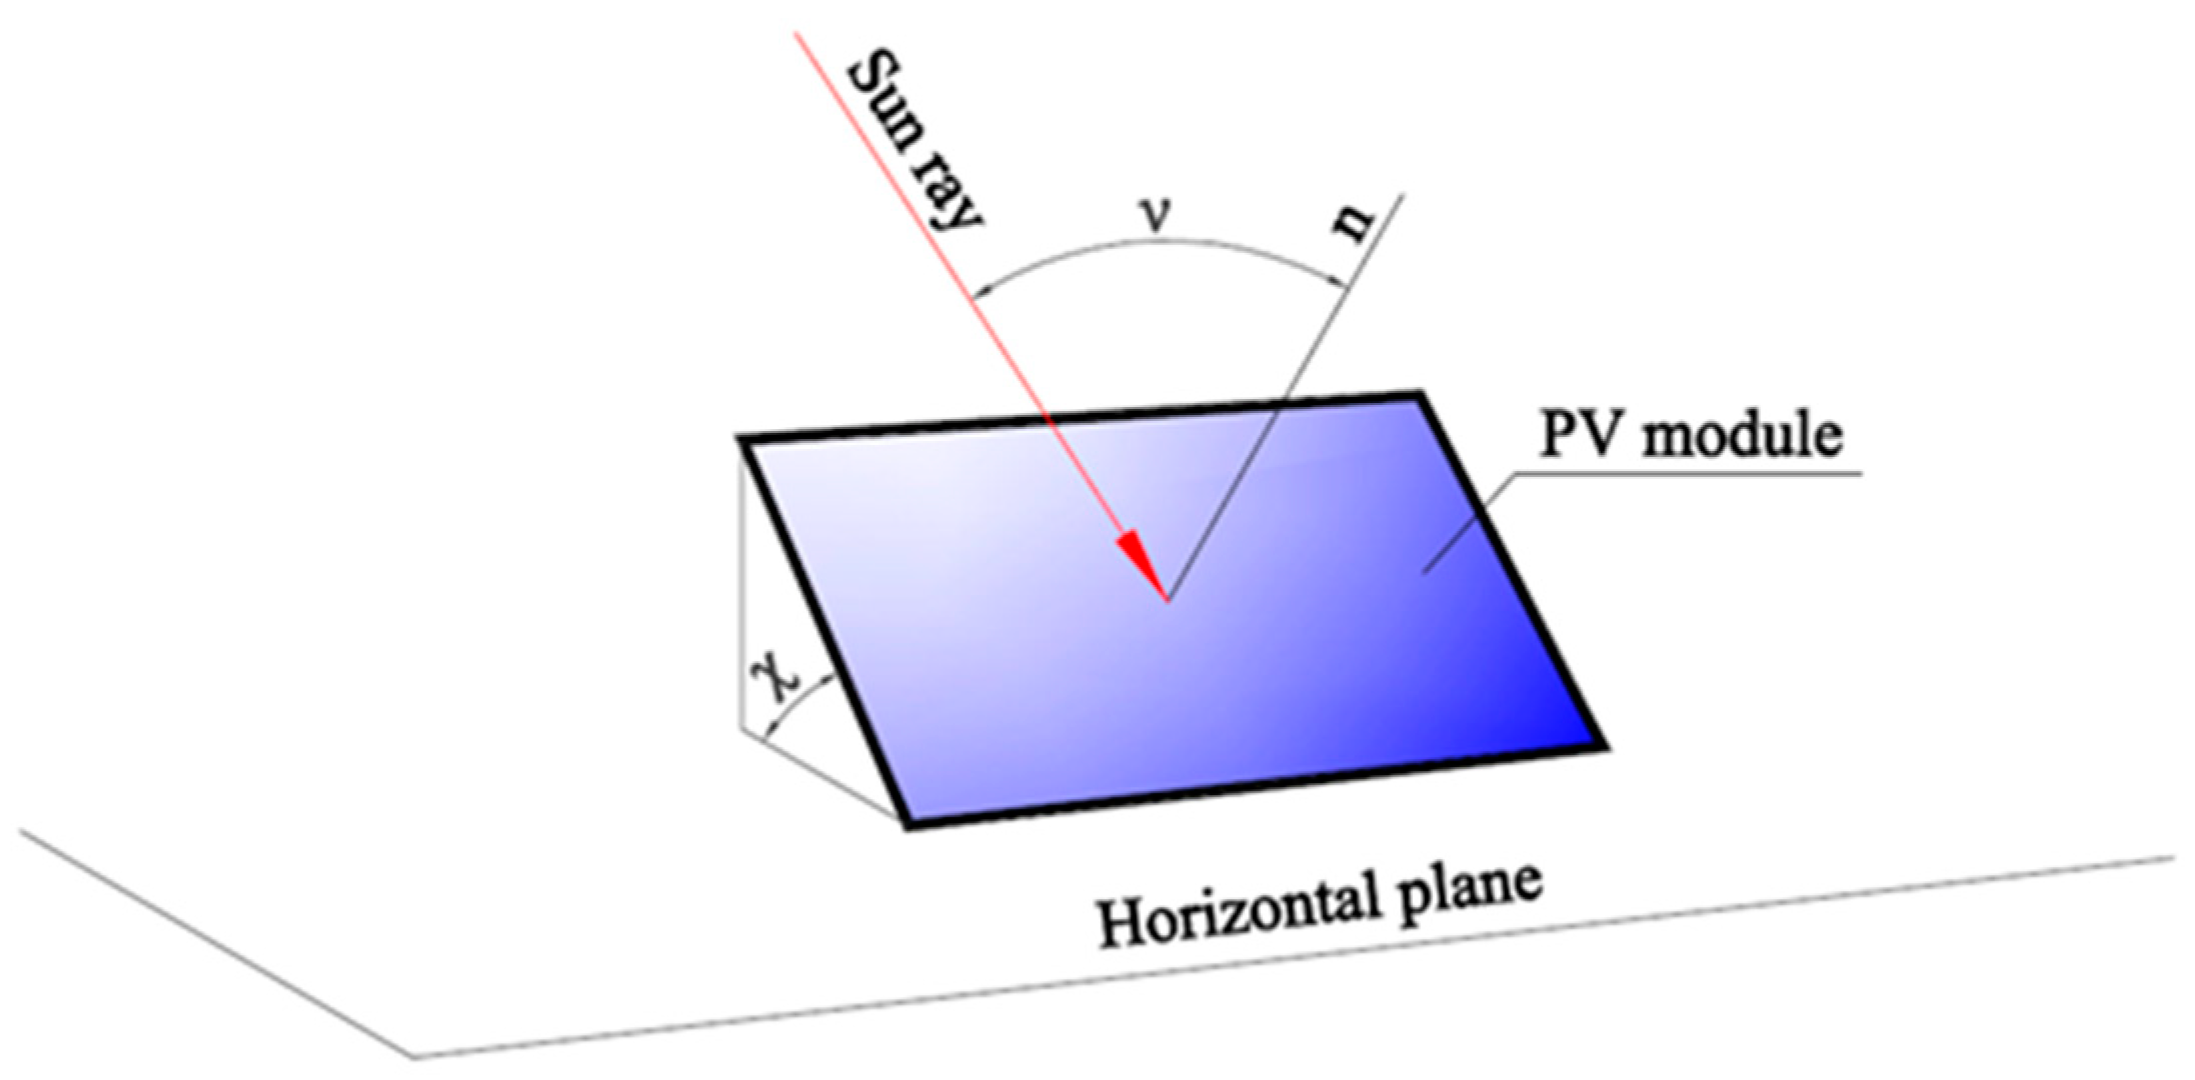
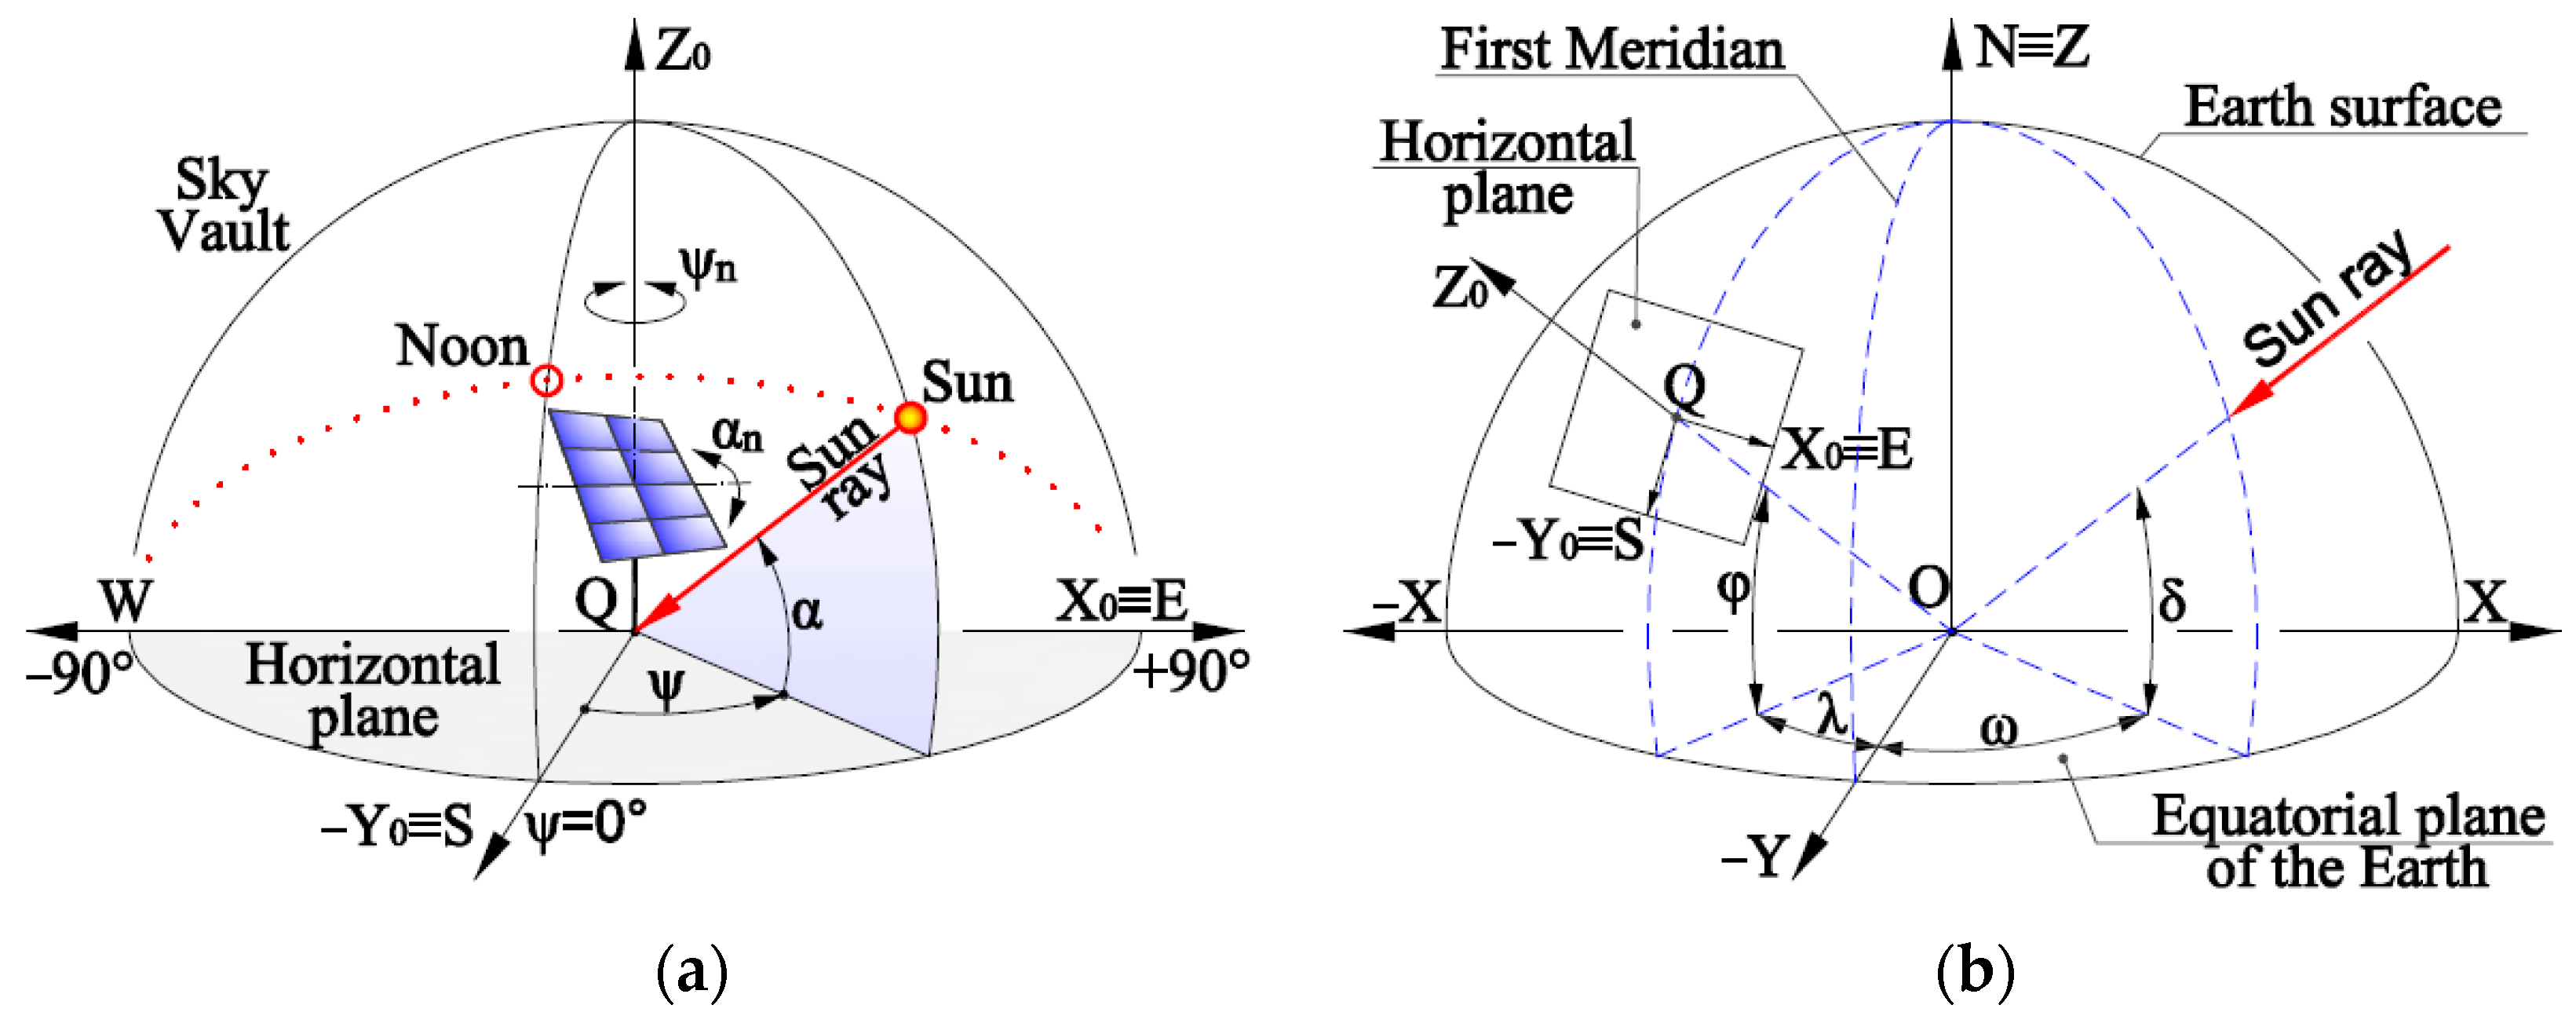
B and Bn are the available and the received direct solar irradiance, the available being measured each minute and the received being calculated based on the incidence angle (ν), defined as the angle between the sunray and the normal (n) of the PV module (Figure 1) using:
B n = B cos ν ,   [ W / m 2 ]
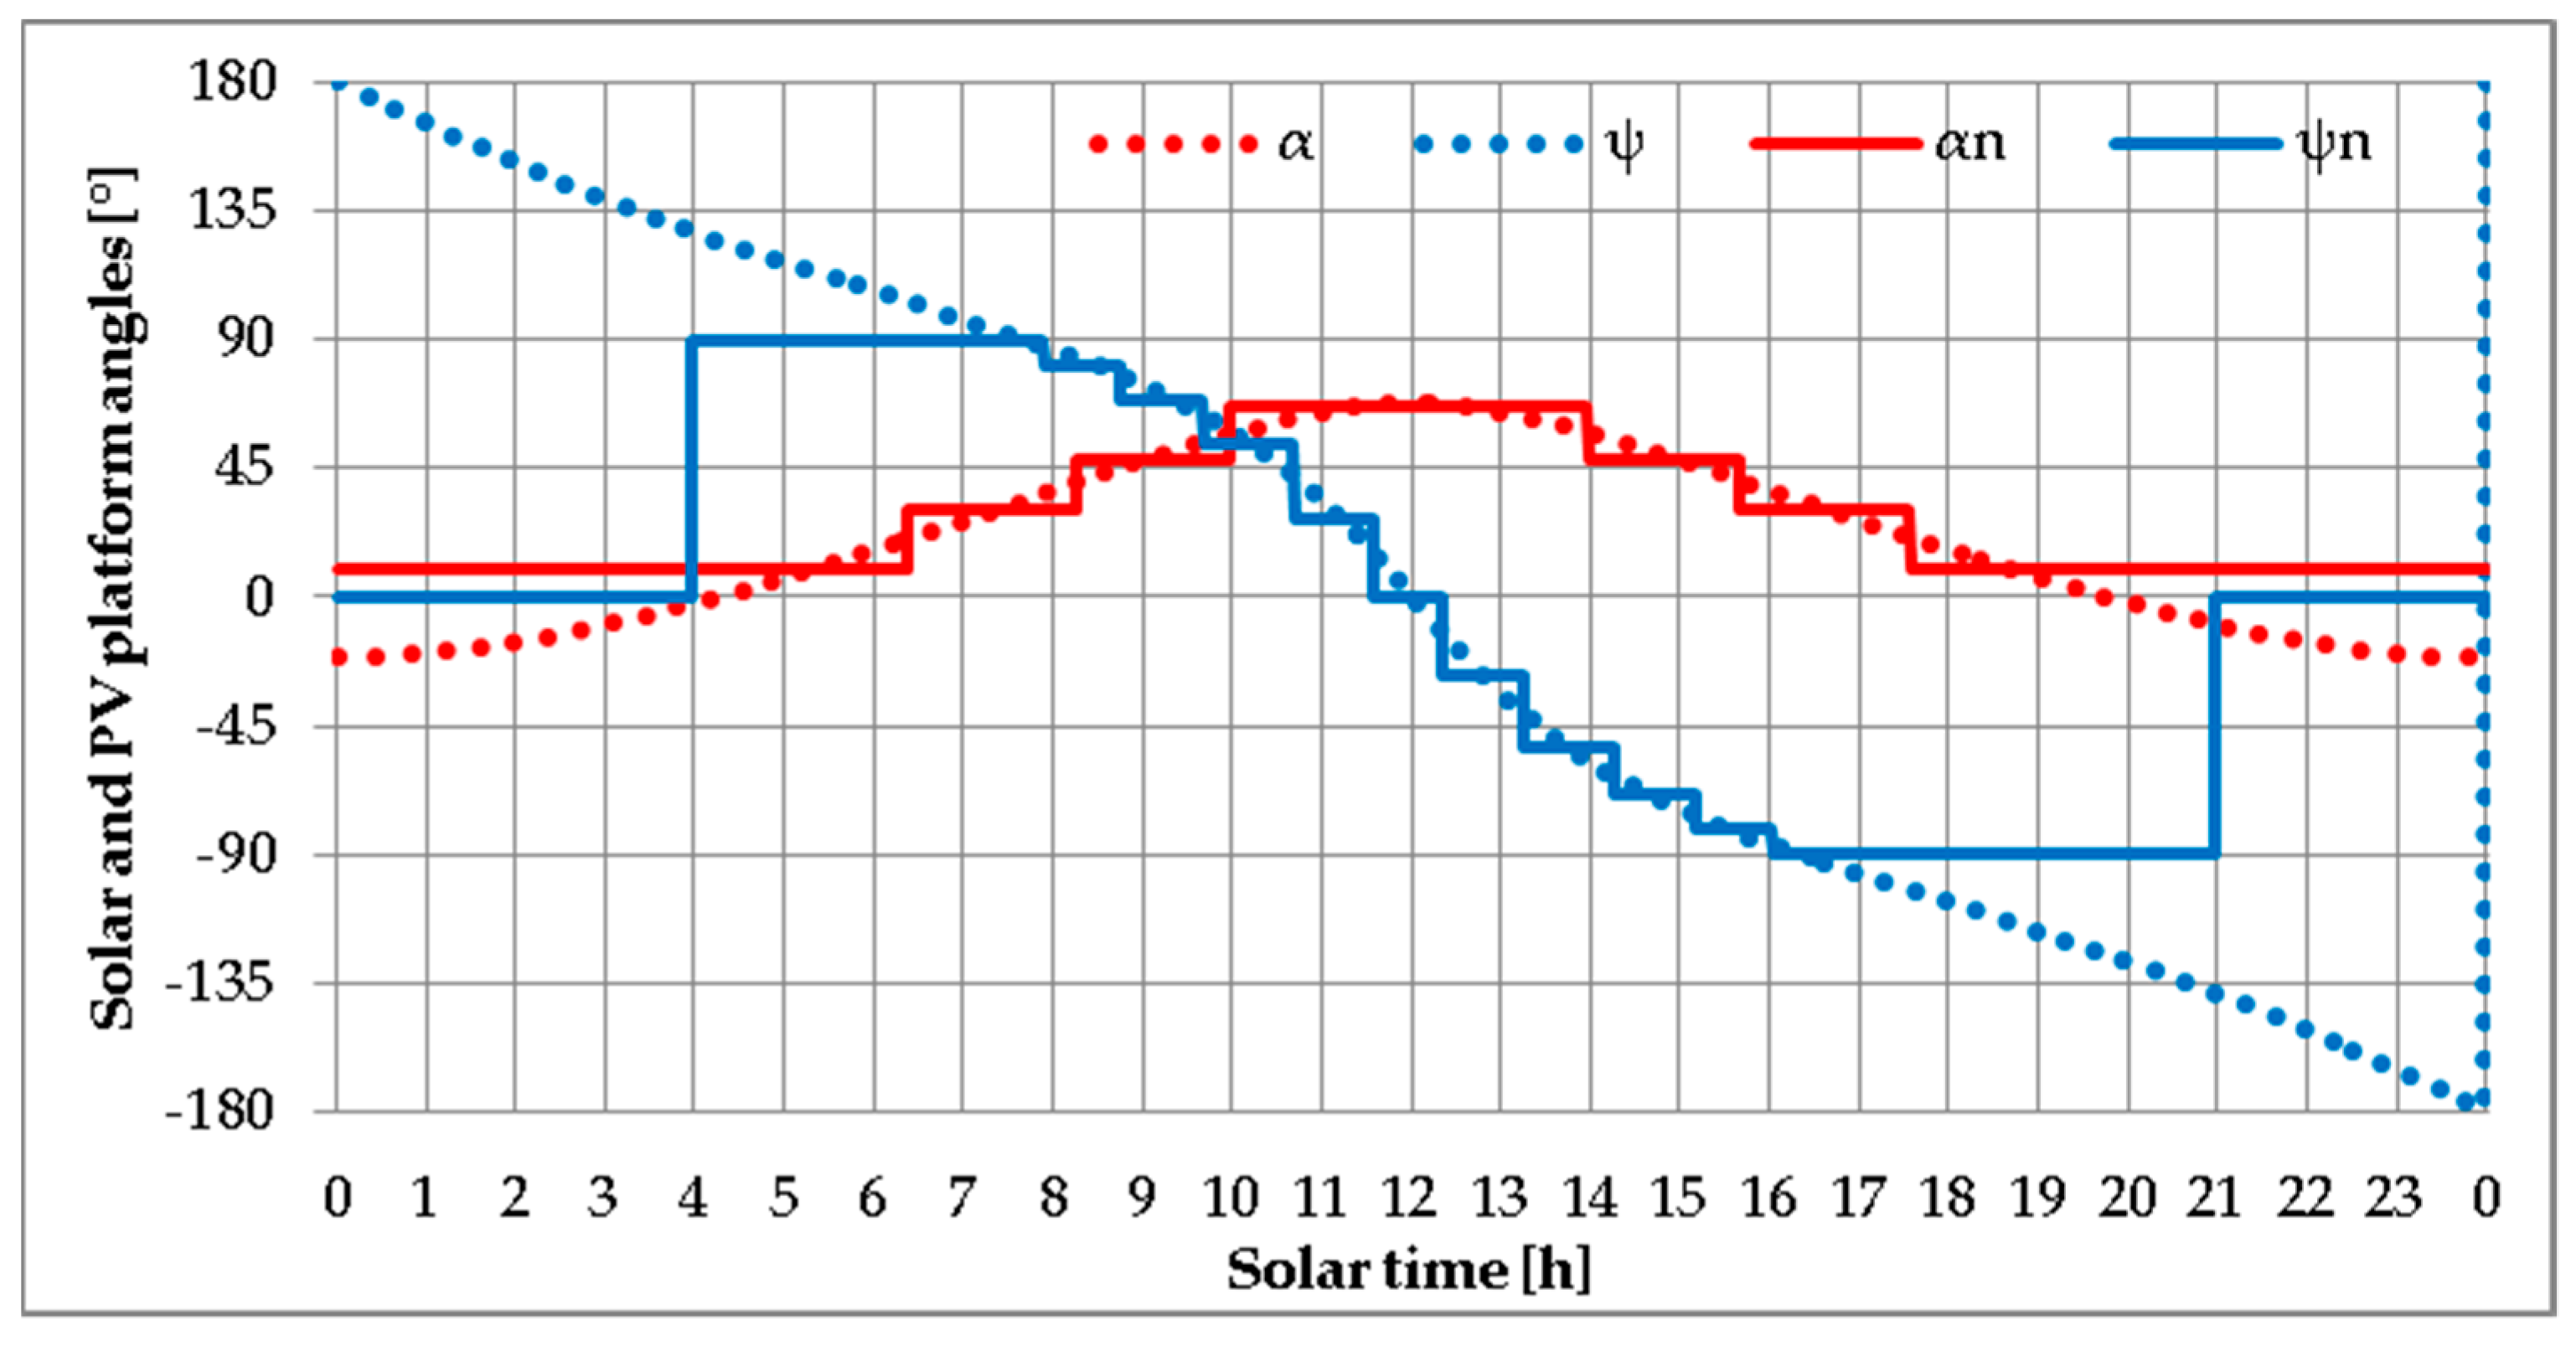
the incidence angle is calculated based on two pairs of angles defined in the horizontal plane of the observer (Figure 2a), using:
ν = arccos cos α cos α n cos ψ ψ n + sin α sin α n ,   [ ° ]
where:
αn is the altitude angle of the PV platform (Figure 2a) defined as the angle between the horizontal plane and the normal (n) of the PV platform;
ψn is the azimuthal angle of the PV platform (Figure 2a) defined as the angle between the south direction and the projection in the horizontal plane of the normal (n) of the PV platform;
α and ψ are the solar altitude angle and the solar azimuthal angle calculated based on the declination angle (δ), hour angle (ω) and site latitude (φ) (Figure 2b) using:
α = arcsin (sin δ ∙ sin φ + cos δ ∙ cos φ ∙ cos ω), [°]
ψ = sin   ω   arccos   cos   δ   ·   cos   ω   ·   sin   φ     sin   δ   ·   cos   φ cos α ,   [ ° ]
The declination angle (Figure 2b) depends only on the number of the day (N) in the year and is calculated based on [32] using:
δ = 23.45 ∙ sin (360 ∙ (N – 80)/365), [°].
The hour angle (Figure 2b) is a linear function of the solar time (ts) expressed in hours and is calculated using:
ω = 15 ∙ (12 − ts), [°].
D and Dn are the available and the received diffuse solar irradiance calculated based on the diffuse solar irradiance measured each minute in the horizontal plane (Dh), on the solar altitude angle (α) [32] and on the PV tilt angle (χ) using:
D = D h · 1 + sin α 2 ,   [ W / m 2 ]                       D n = D h · 1 + cos χ 2 ,   [ W / m 2 ]
The relative solar energy gain of the tracked vs. the fixed PV module indicates the benefits brought by tracking and is calculated using:
R S = E G n t E G n f · 100 ,   [ % ]
where:
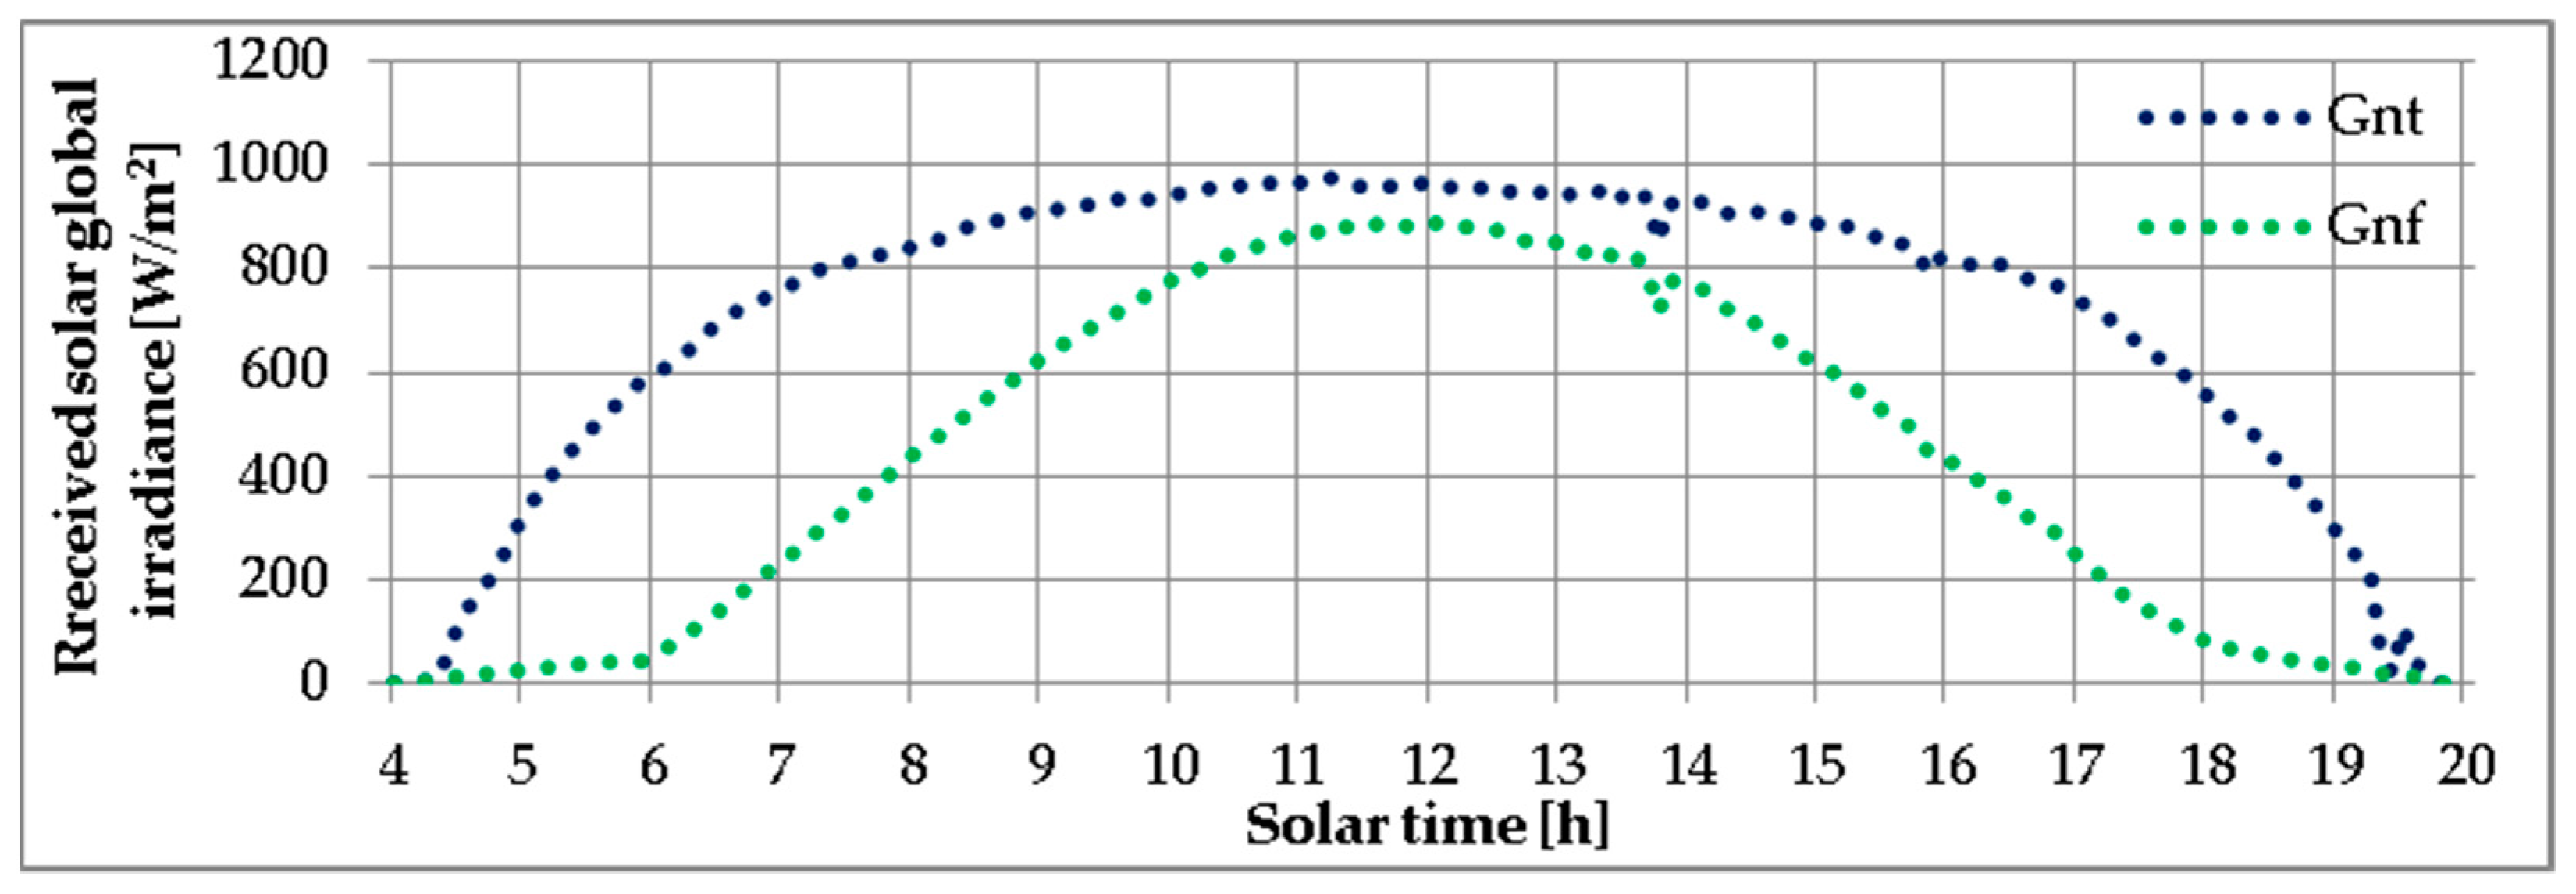
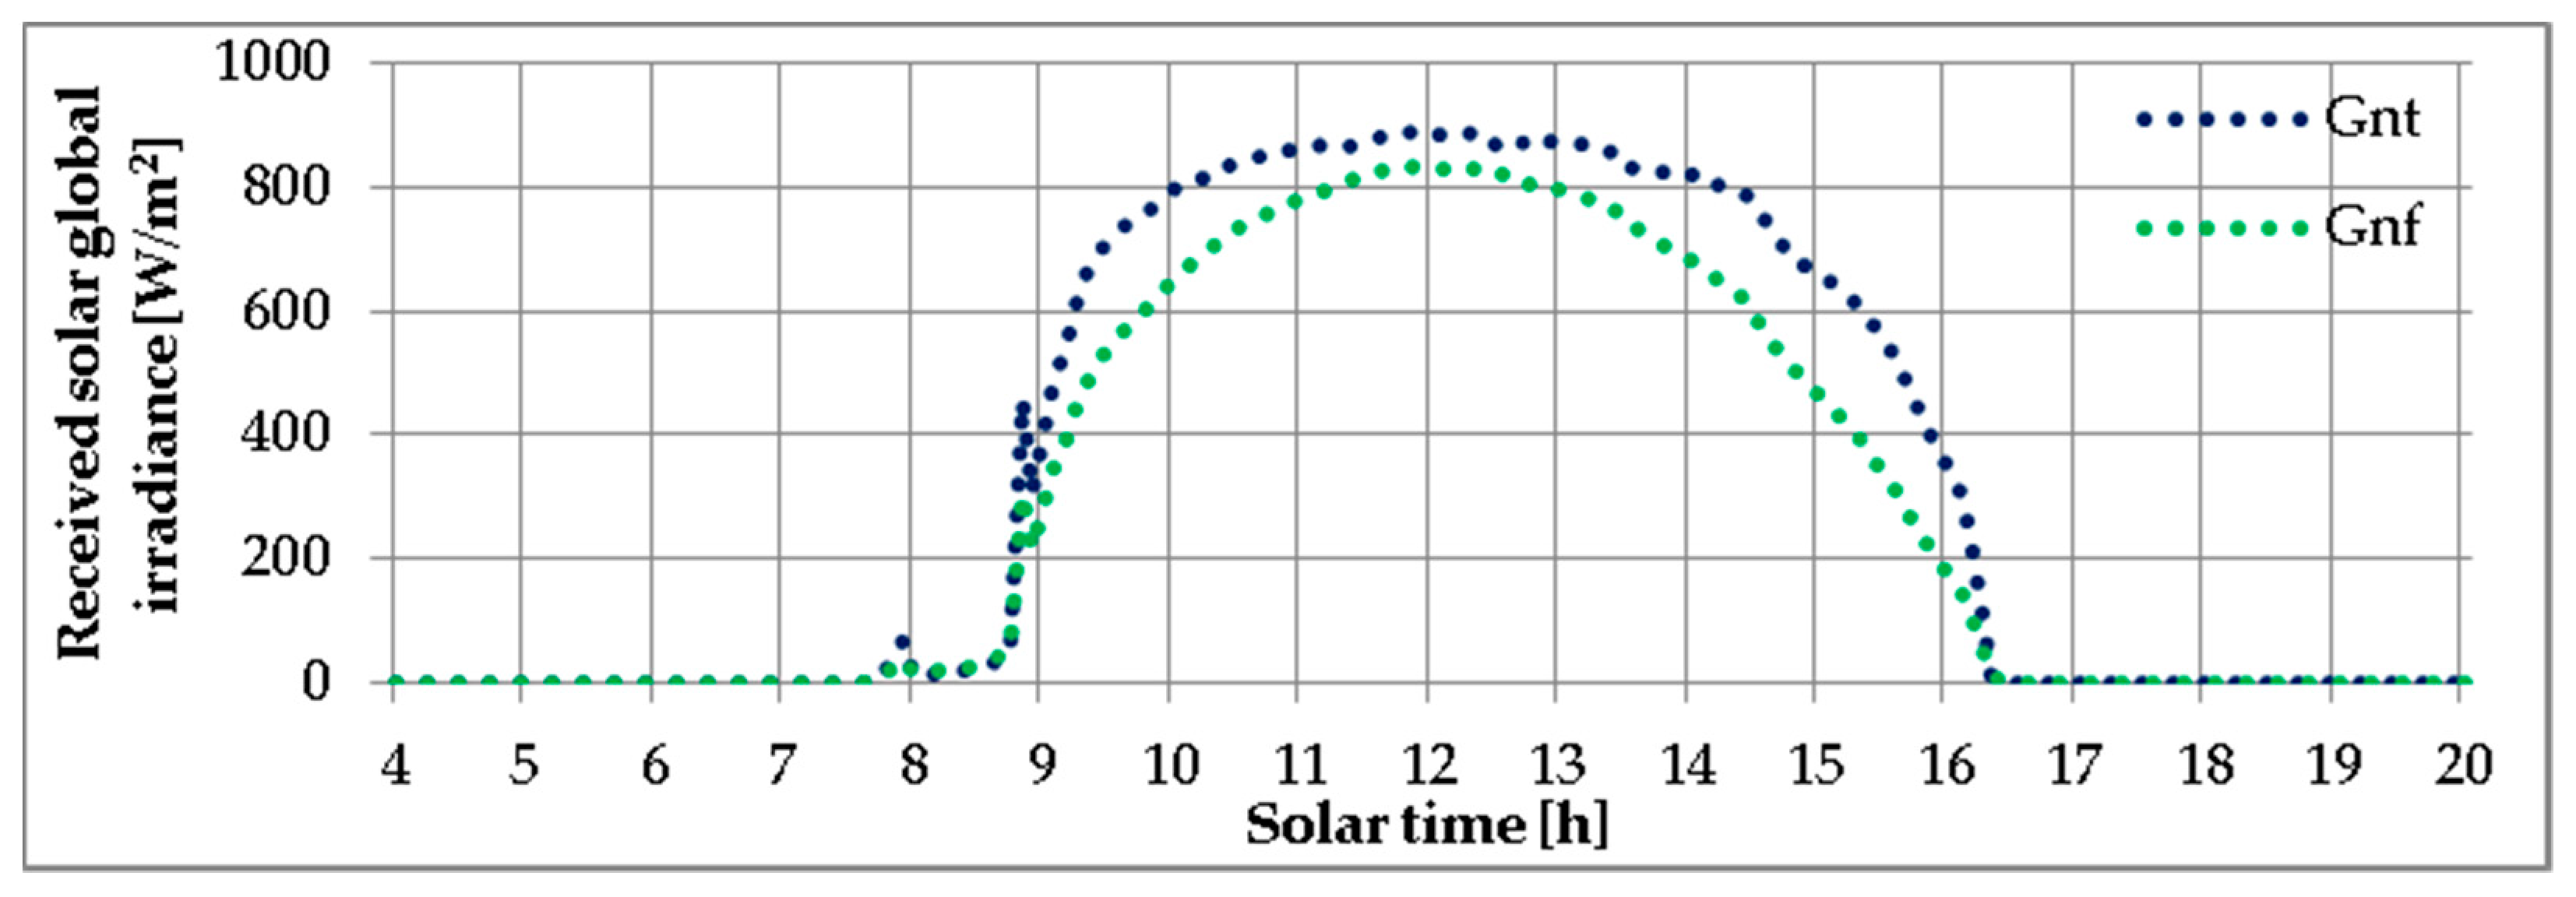
EGnt is the solar energy received in the plane of the tracked PV module
EGnf is the solar energy received in the plane of the fixed PV module
The absolute electrical energy gain of the tracked vs. the fixed PV modules is calculated using:
Δ E = E t E f ,   [ Wh ]
where:
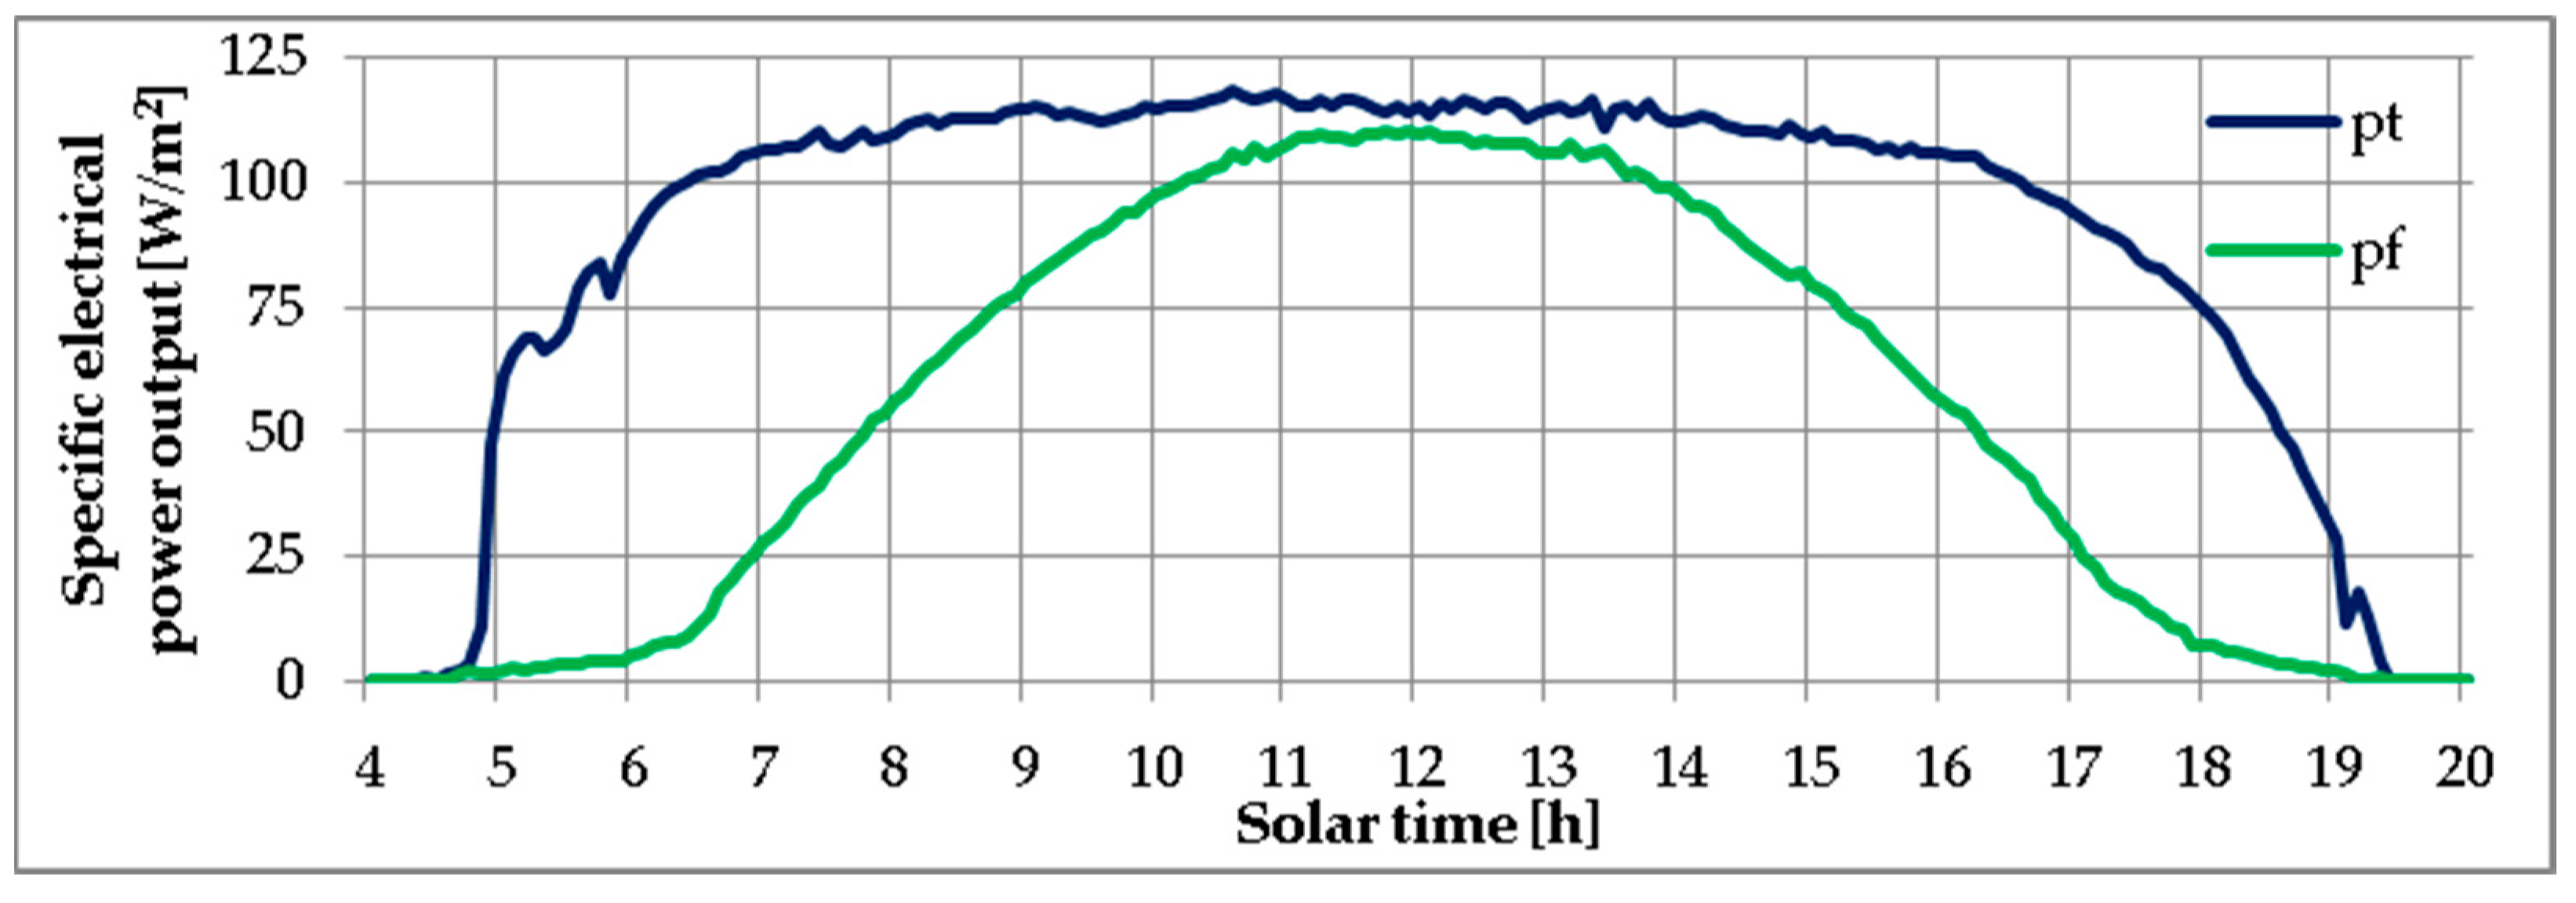
Et and Ef is the electrical energy output of the tracked and fixed PV modules, recorded daily, monthly or yearly by the monitoring system of the PV platform.
The electrical energy output of the tracked and fixed PV module is calculated using:
E t = t 1 t 2 P t 60 ,   [ Wh ]                       E f = t 1 t 2 P f 60 ,   [ Wh ]
where:
t1 and t2 are the sunrise and sunset times of the day;
Pt is the electrical power output of the tracked PV module measured each minute through the power optimizers and stored on the SolarEdge monitoring platform;
Pf is the electrical power output of the fixed PV module measured each minute through the power optimizers and stored on the SolarEdge monitoring platform.
The relative electrical energy gain defined as the ratio between electrical energy produced by the tracked and fixed PV modules indicates the benefits brought by tracking and is calculated using:
R E = E t E f · 100 ,   [ % ]
The energy yield of a photovoltaic module indicates the number of hours that the PV module may operate at its nominal power, and is calculated using:
Y = E P ,   [ kWh / kW ]
where:
E [Wh] is the energy produced by the PV module during a specific time interval;
P [W] is the nominal power of the analysed PV module in Standard Test Condition (STC).
The solar conversion efficiency, showing how much of the solar energy is transformed in electricity, is calculated using:
η = E E G n   ·   S P V   · 100 ,   [ % ]
where:
E [Wh] is the electrical energy produced by the PV module or platform during a specific time interval;
EGn [Wh/m2] is the global solar energy received during a specific time interval;
SPV [m2] is the surface of the photovoltaic module or platform.

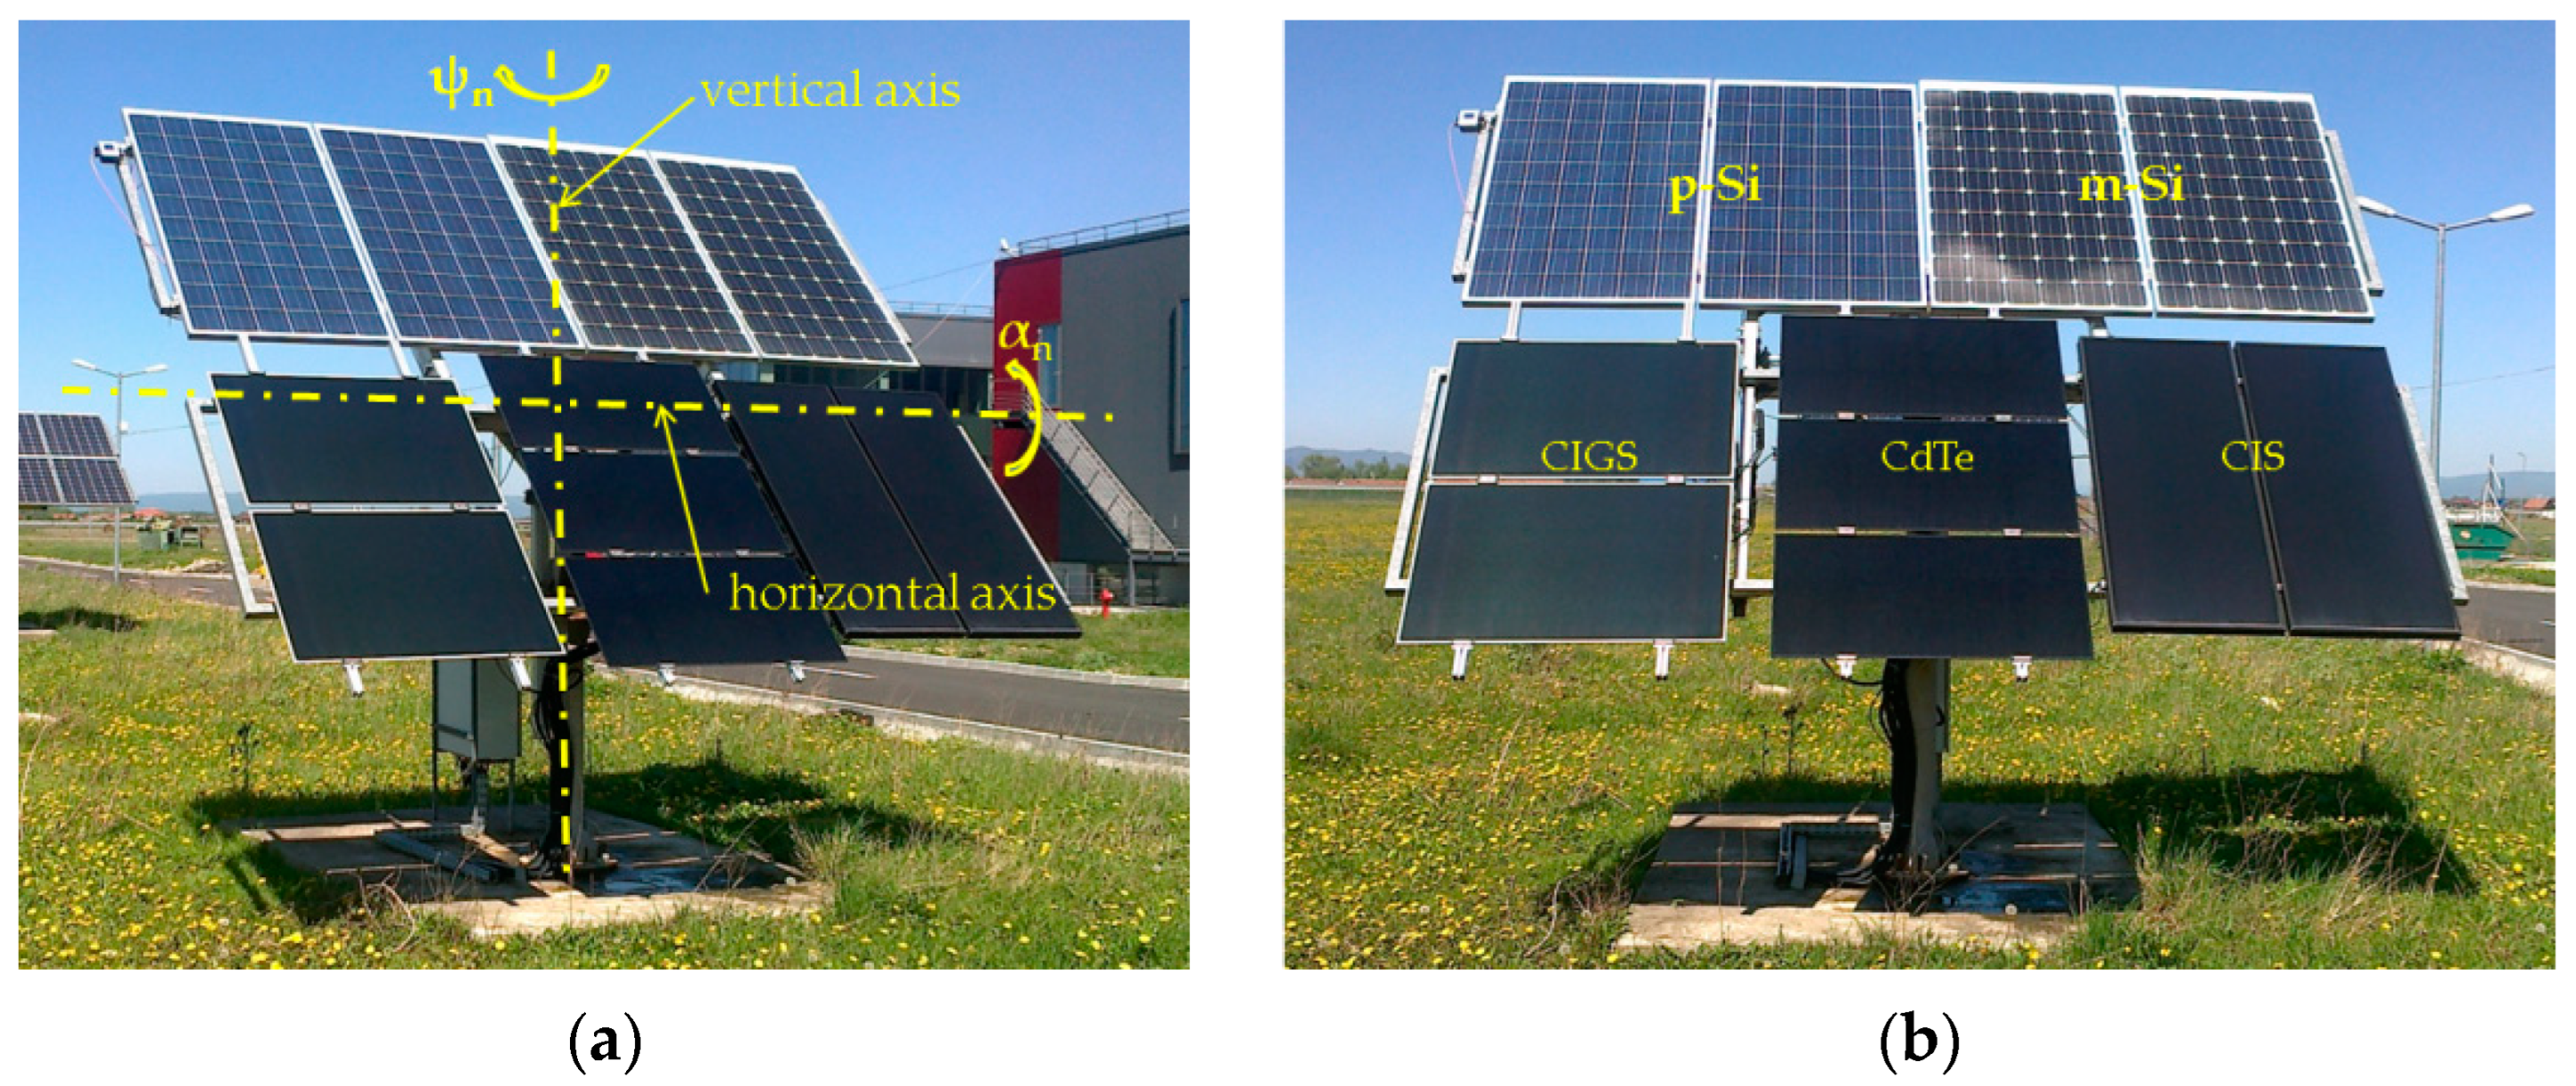
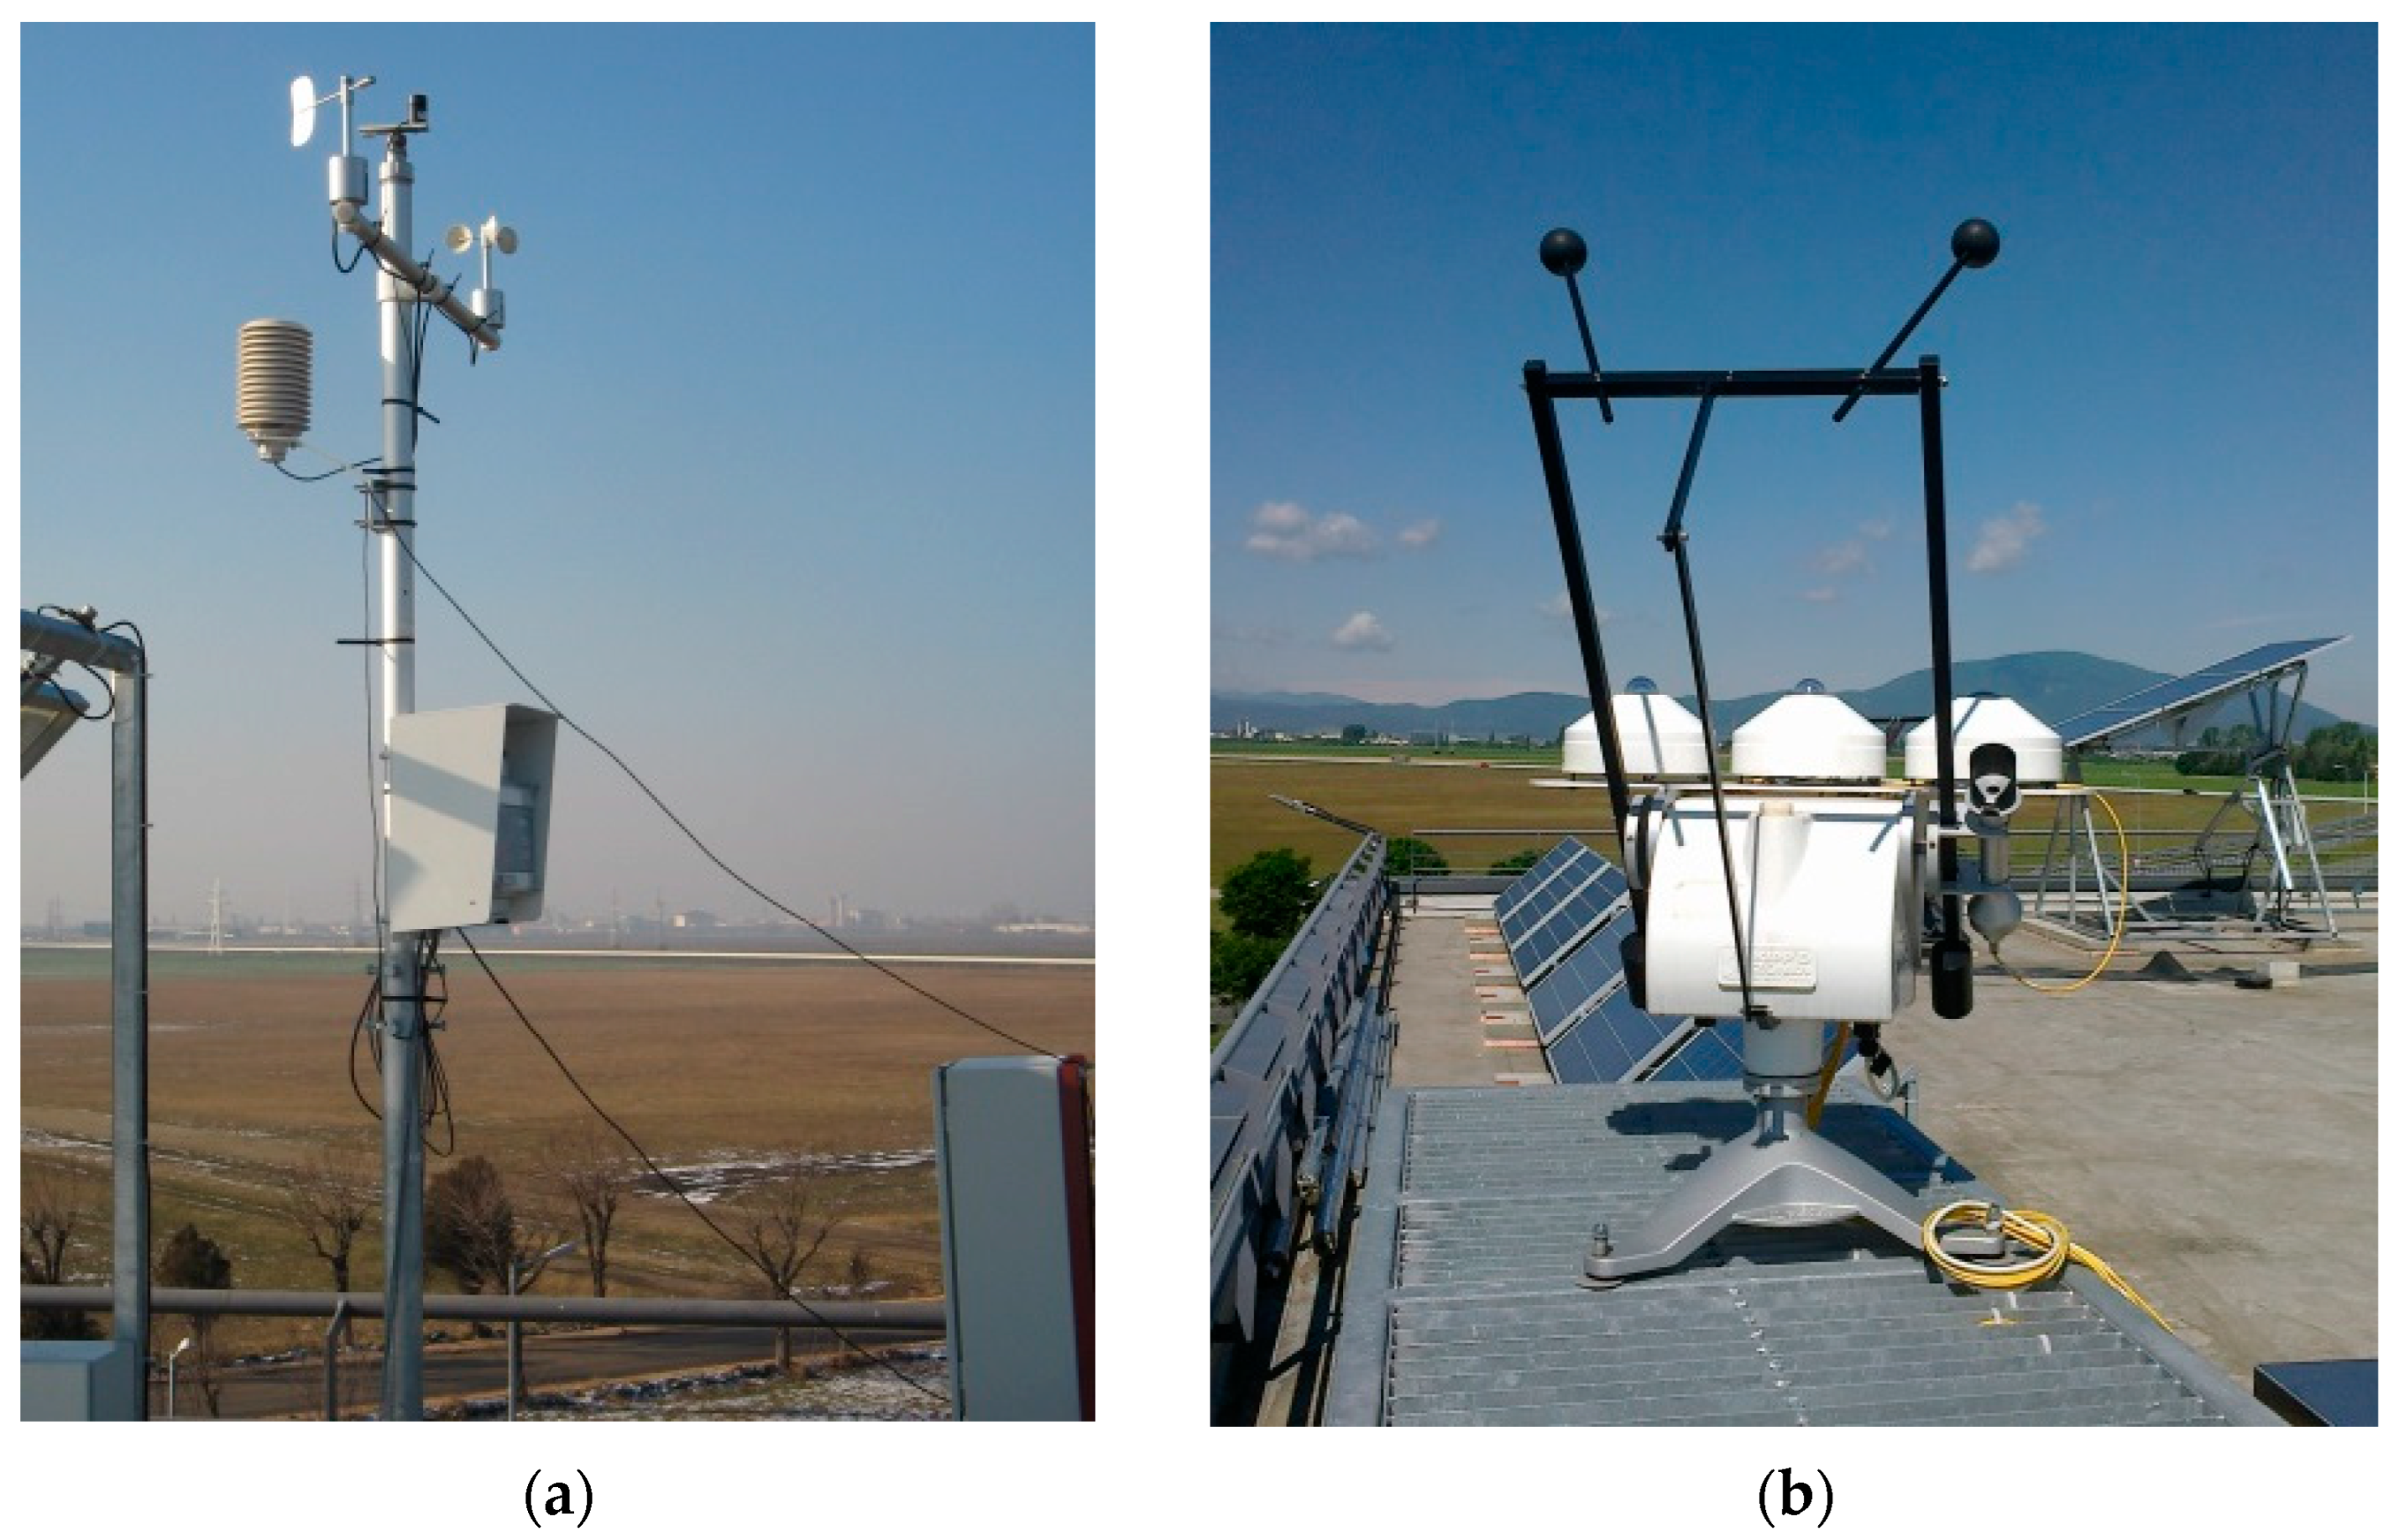
3. Experimental Infrastructure

A dual-axis solar-tracked platform for five types of PV modules (Figure 3a) and a fixed PV platform with five similarly arranged types of PV modules (Figure 3b) are installed on the ground near the buildings of the Research and Development Institute of the Transilvania University of Brasov, Romania, in the Renewable Energy Systems and Recycling R&D Centre (latitude ϕ = 45.67°; longitude λ = 25.55°). The solar-tracking system consists of a mobile frame that is rotated about the vertical axis by a rotary actuator and about the horizontal axis by a linear actuator. The solar-tracking mechanisms allow for change in the platforms azimuthal angle (ψn) between +125° and −125° (with 0°, +90° and −90° corresponding to south, east and west directions, respectively) and adjustment of the PV platform elevation angle (αn) between 90° (horizontal position) and 10° (almost vertical position). The two movements are controlled by a PLC where the required angles are compared with data received from encoders and adjusted accordingly.
Two polycrystalline and two monocrystalline silicon PV modules, each with identical maximum power (250 Wp), are installed in the upper part of both tracked and fixed platforms, as well as three types of thin-film PV module in the lower part: two 120 Wp CIGS, three 80 Wp CdTe and two 125 Wp CIS PV modules. The thin-film PV modules are grouped to have a maximum power equal or close to that of the silicon PV modules. The technical characteristics under Standard Test Conditions (STC) of the five types of photovoltaic modules are presented in Table 2.
Each PV module is serially connected to a single-phase SolarEdge inverter (SE2200) through individual power optimizers (P405) that monitor the voltage, current, power and energy for each PV module and transmit these parameters to the inverter. The inverter manages the data and transmits it to a web server where it is stored and can be downloaded for processing. The operation principle of the SolarEdge monitoring system in the case of modules with different amounts of produced power is schematically described in Figure 4.
During the monitoring period, the fixed photovoltaic platform was south-oriented (0° azimuth angle) with a tilt angle θ = 43° (considering the horizontal plane as reference); this tilt angle is in the recommended range for our location’s latitude in order to capture a high portion of the available solar irradiance [34,35,36,37]. The position of the tracked photovoltaic platform was adjusted stepwise about the vertical axis to change its azimuthal angle (ψ) and about the horizontal axis to change its elevation angle (α). An example of the solar-tracking programme is presented in Figure 5 through the variation of the solar angles (α and ψ) and of the PV platform (αn and ψn) during the summer solstice (21 June). The continuous variation of the solar elevation angle is followed by the PV platform in six steps starting at 6:32 in the morning until 17:44 in the afternoon; outside this period the PV platform is kept at an elevation angle of 10°. The azimuthal angle of the PV platform (ψn) is changed twelve times between 4:08 in the morning and 21:08 in the evening. At 4:08, the azimuthal angle of the platform is changed from 0° (south direction) to 90° (east direction) and kept in this position until 7:53. Between 7:53 and 16:01 the azimuth angle of the platform is changed each hour. At 16:02 the azimuthal angle reaches the value of −90° (west direction) and is maintained at this value until 20:58 when it is changed back to 0° (south direction).
The meteorological parameters are locally measured using a Delta-T weather station (Figure 6a). The temperature and the relative humidity of the outdoor air are measured using a RHT2 sensor with ±0.1 °C precision for the temperature and 2% accuracy for the relative humidity. The wind speed and direction are measured with an AN4 anemometer (±0.5 m/s accuracy) and a WD4 wind vane (±2% accuracy), respectively. The precipitable water amount is monitored using an RG2 rain gauge with an accuracy of ±2%. The continuously monitored data is temporarily saved in a DL2e data logger (every minute for solar irradiance and every 10 minutes for the other parameters) and further stored in a database on a local computer. The direct solar irradiance (B) and horizontal diffuse solar irradiance (Dh) are measured each minute with a CHP1 pyrheliometer and a CMP22 pyranometer installed on a Kipp & Zonen Solys 2 sun tracker (Figure 6b).

4. Results and Discussions

The solar energy potential, electrical energy output and solar conversion efficiency of the fixed and dual-axis tracked PV platforms/modules are presented and discussed for a monitoring period of one year (September 2021–August 2022).
The two platforms are globally assessed in Section 4.1, Section 4.2, Section 4.3 and Section 4.4, considering all 11 PV modules (seven power optimizers) as described at the beginning of Section 3.

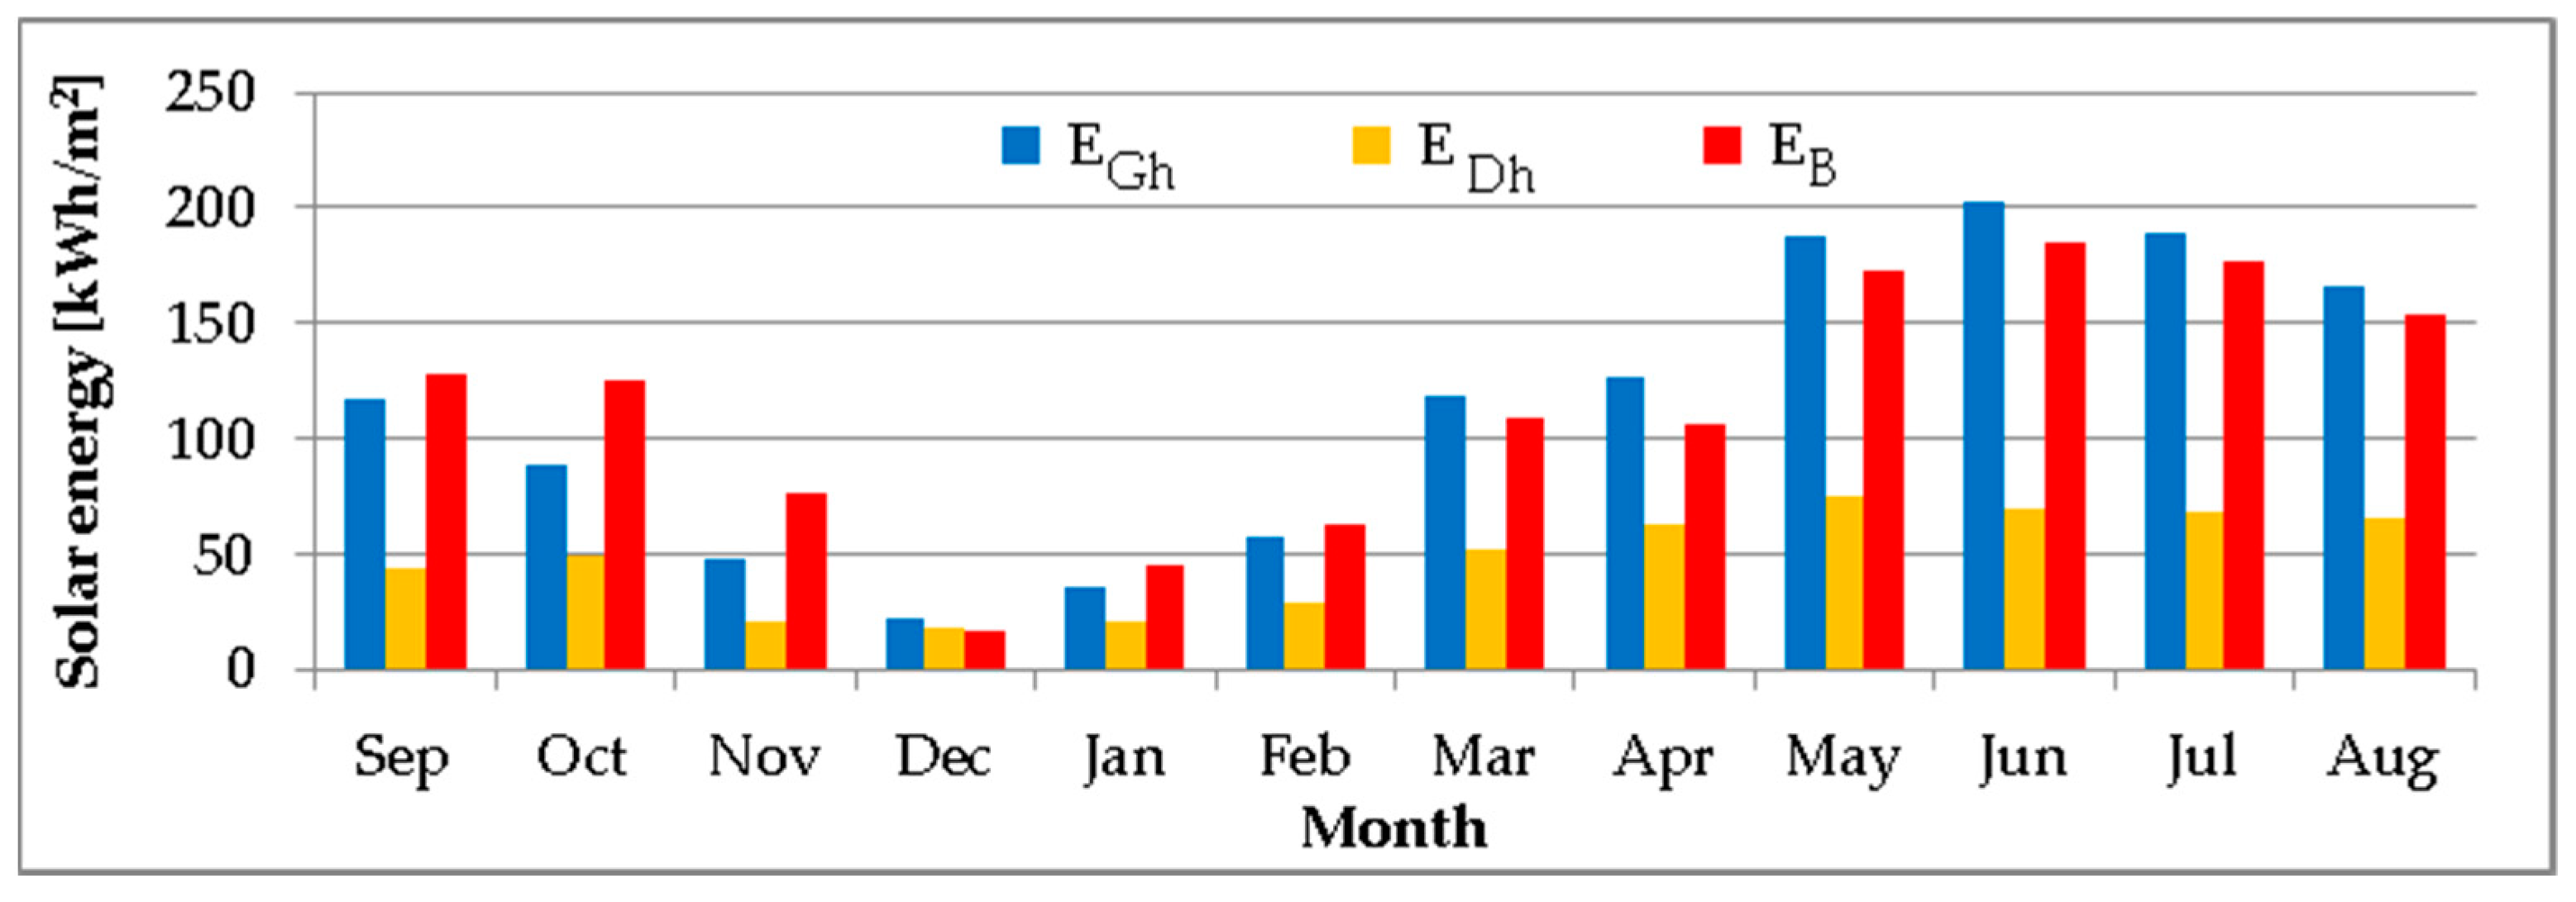
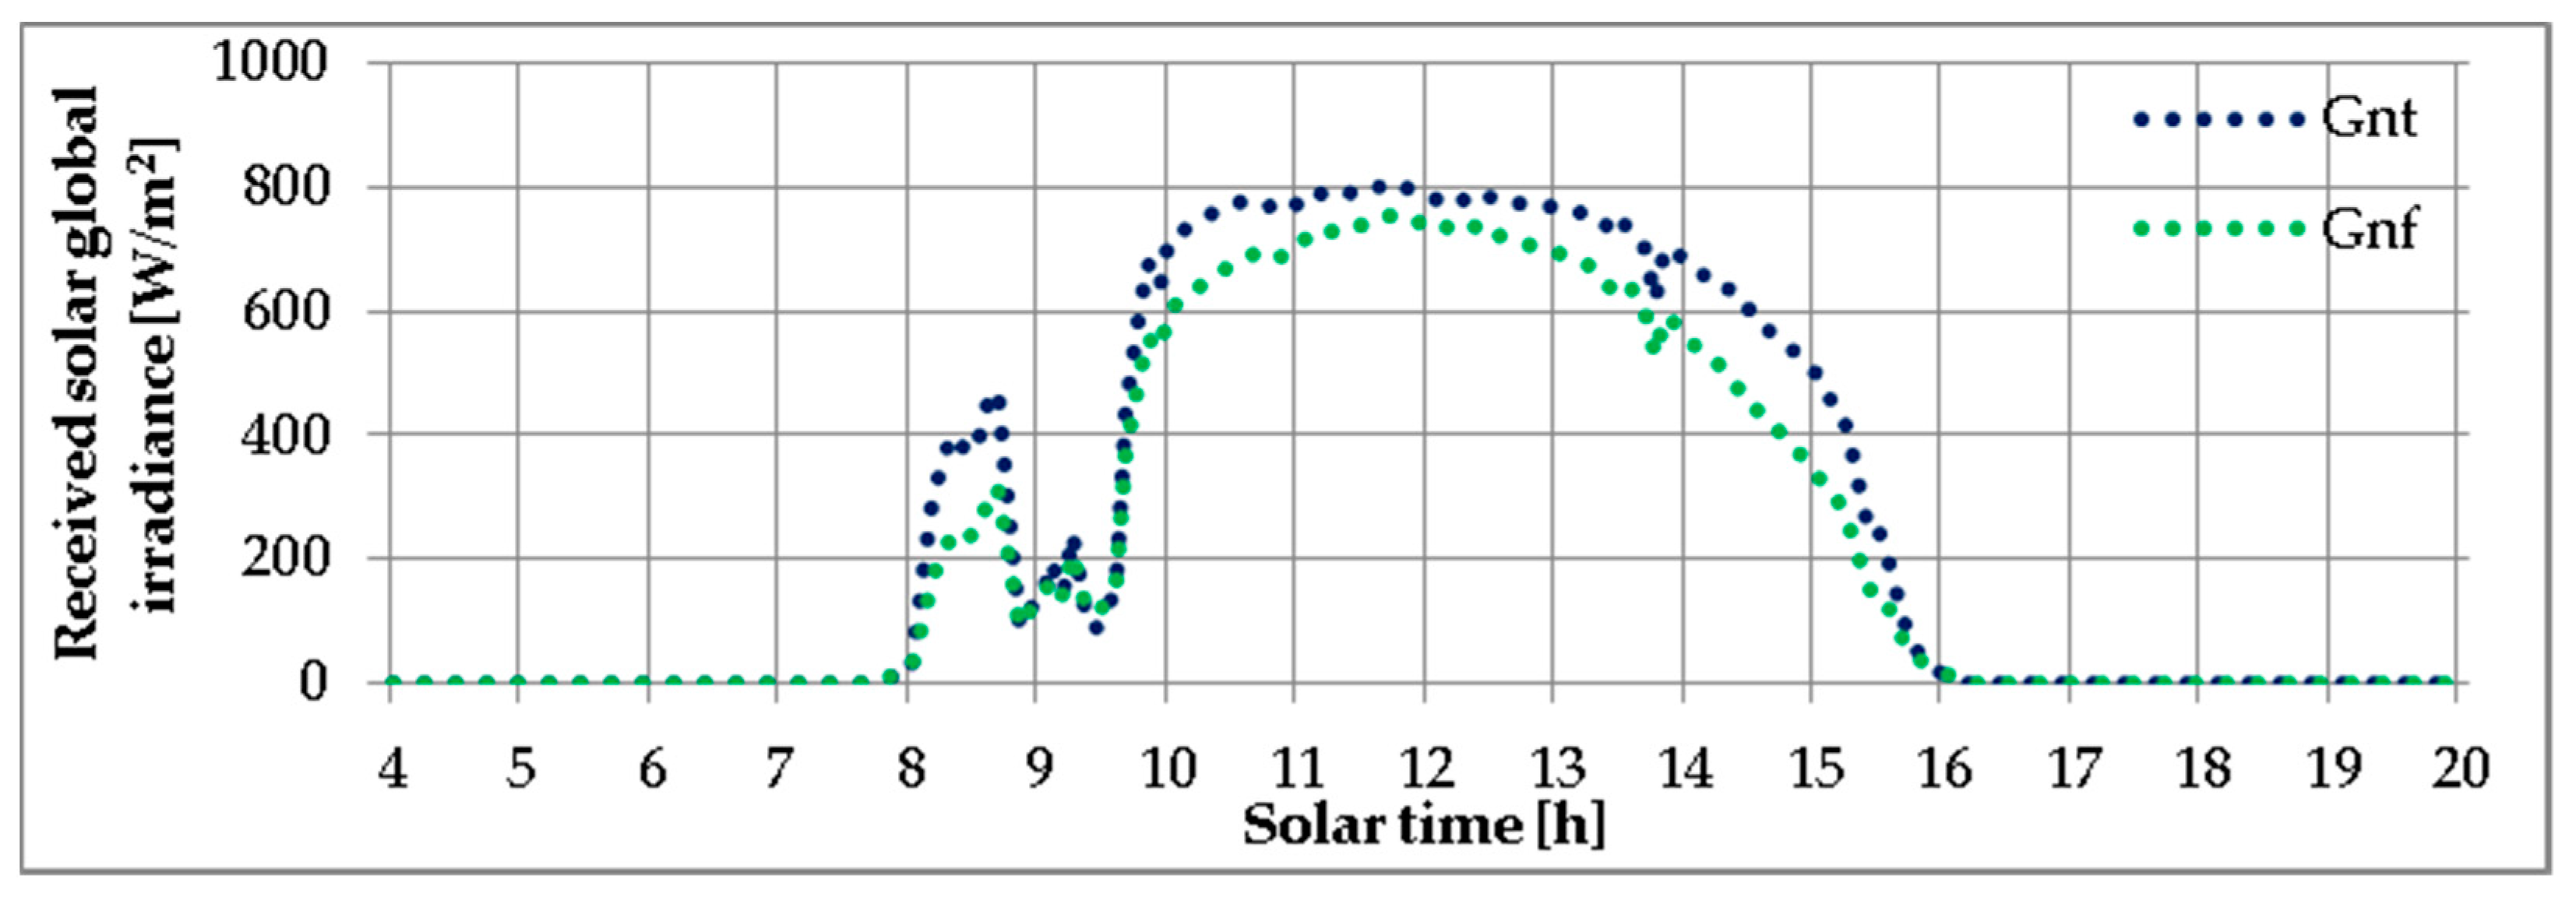
4.1. Solar Energy Potential

To evaluate the solar energy potential, the solar irradiance measured in Brasov between 1 September 2021–31 August 2022 is firstly processed and analysed. The yearly global solar energy received on the horizontal plane is 1360 kWh/m2, of which 42% (575 kWh/m2) is diffuse. The yearly direct solar energy reached a total of 1355 kWh/m2. The monthly distribution of the global horizontal (EGh), diffuse horizontal (EDh) and direct (EB) solar energy is plotted in Figure 7. The global horizontal solar energy has a minimum value of 22.5 kWh/m2 as obtained in December 2021, nine times lower than the maximum value of 202 kWh/m2 as measured in June 2022. An even higher ratio of 11 results from the maximum (185 kWh/m2 in June 2022) and minimum (17 kWh/m2 in December 2021) monthly values of the direct solar energy. The minimum and maximum monthly diffuse solar energy received in the horizontal plane were 17.7 kWh/m2 in December 2021 and 74.8 kWh/m2 in May 2022, respectively.
Based on the measured values of the solar irradiance, the received direct, diffuse and global solar irradiance are calculated using Equations (2)–(7) to obtain the monthly values of the solar energy received in the plane of the fixed and tracked photovoltaic platforms (Figure 8). A yearly solar energy gain of 28% is obtained by the tracked PV platform, which yields 1783 kWh/m2 per year, in comparison with the 1392 kWh/m2 received by the fixed PV platform over the same period using Equation (10). This gain ranges between a minimum value of 0% in December 2021 and a maximum value of 47% in June 2022.

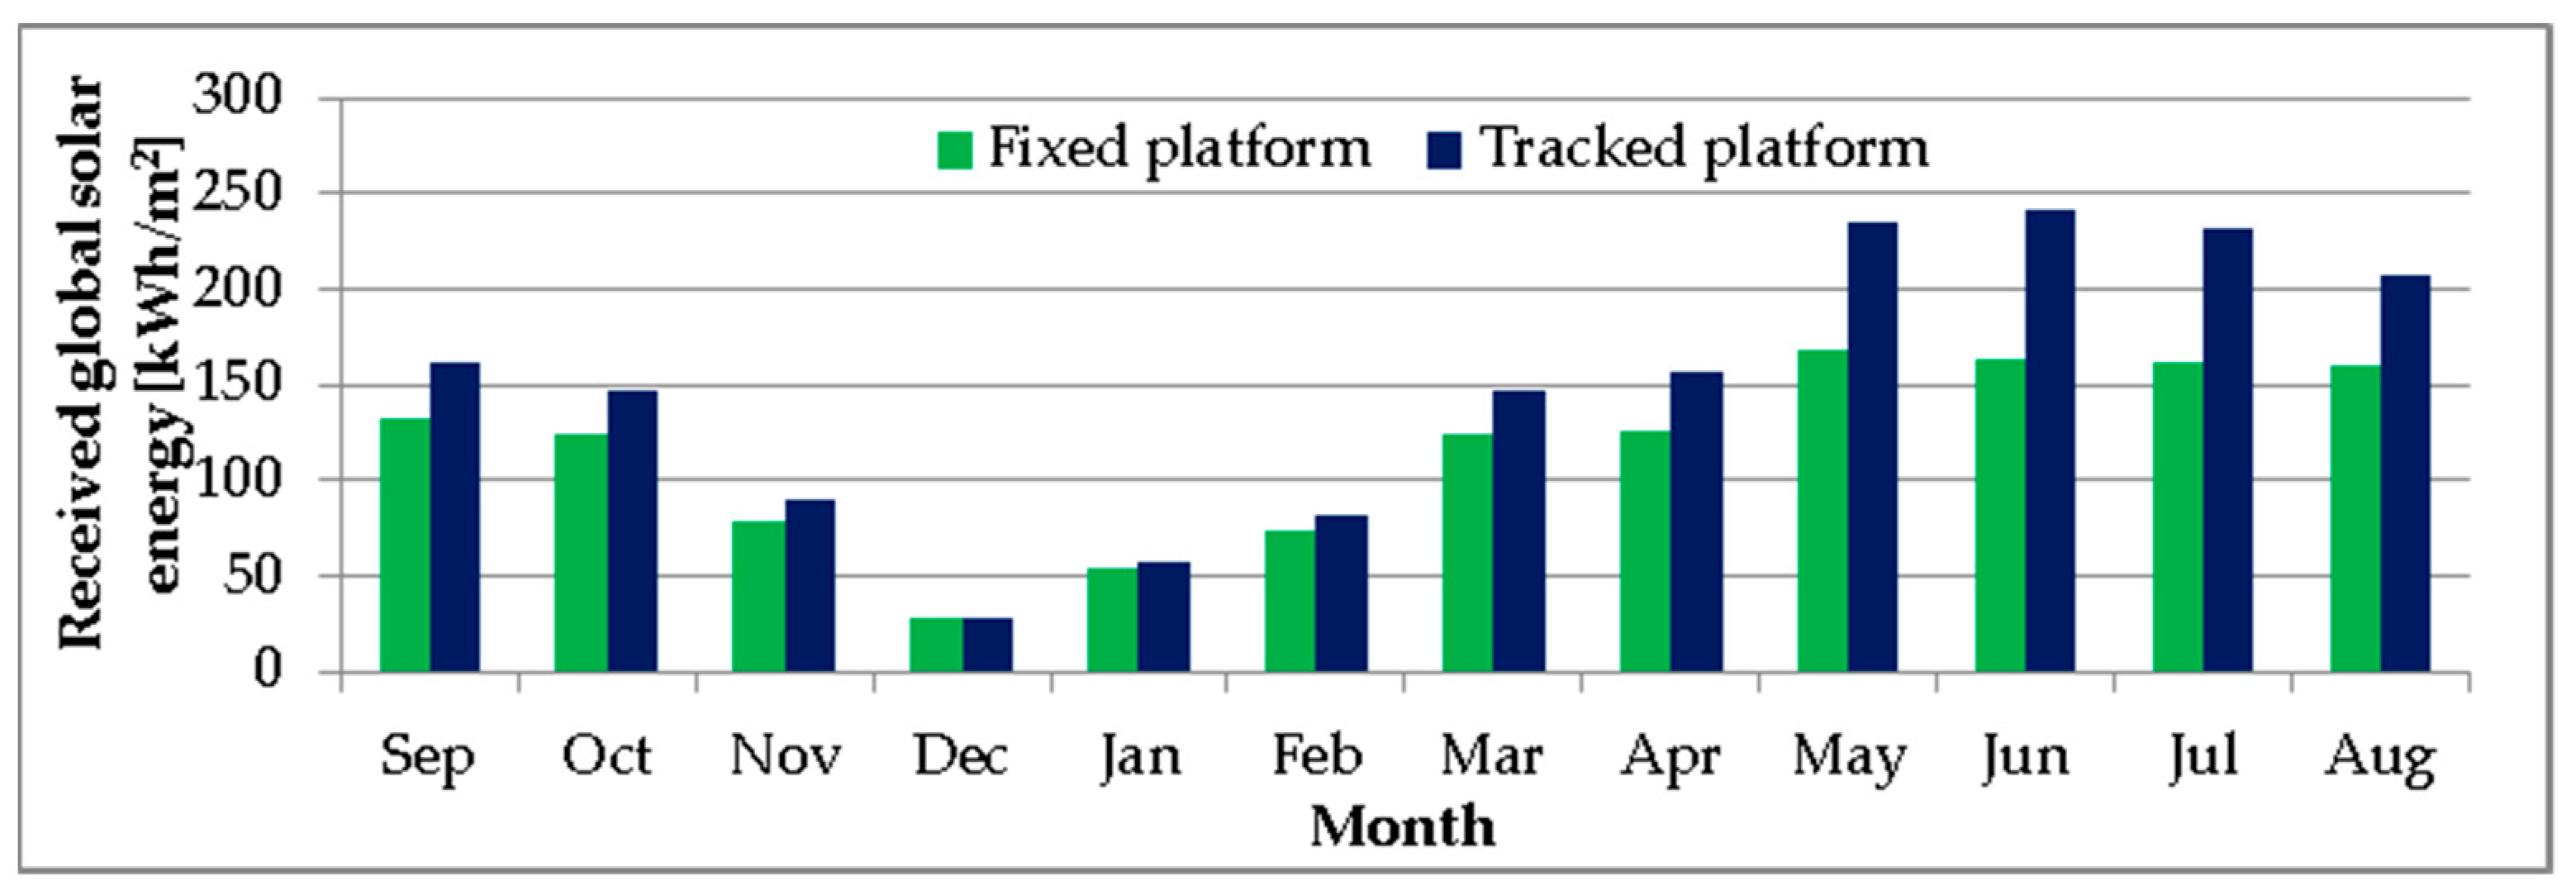
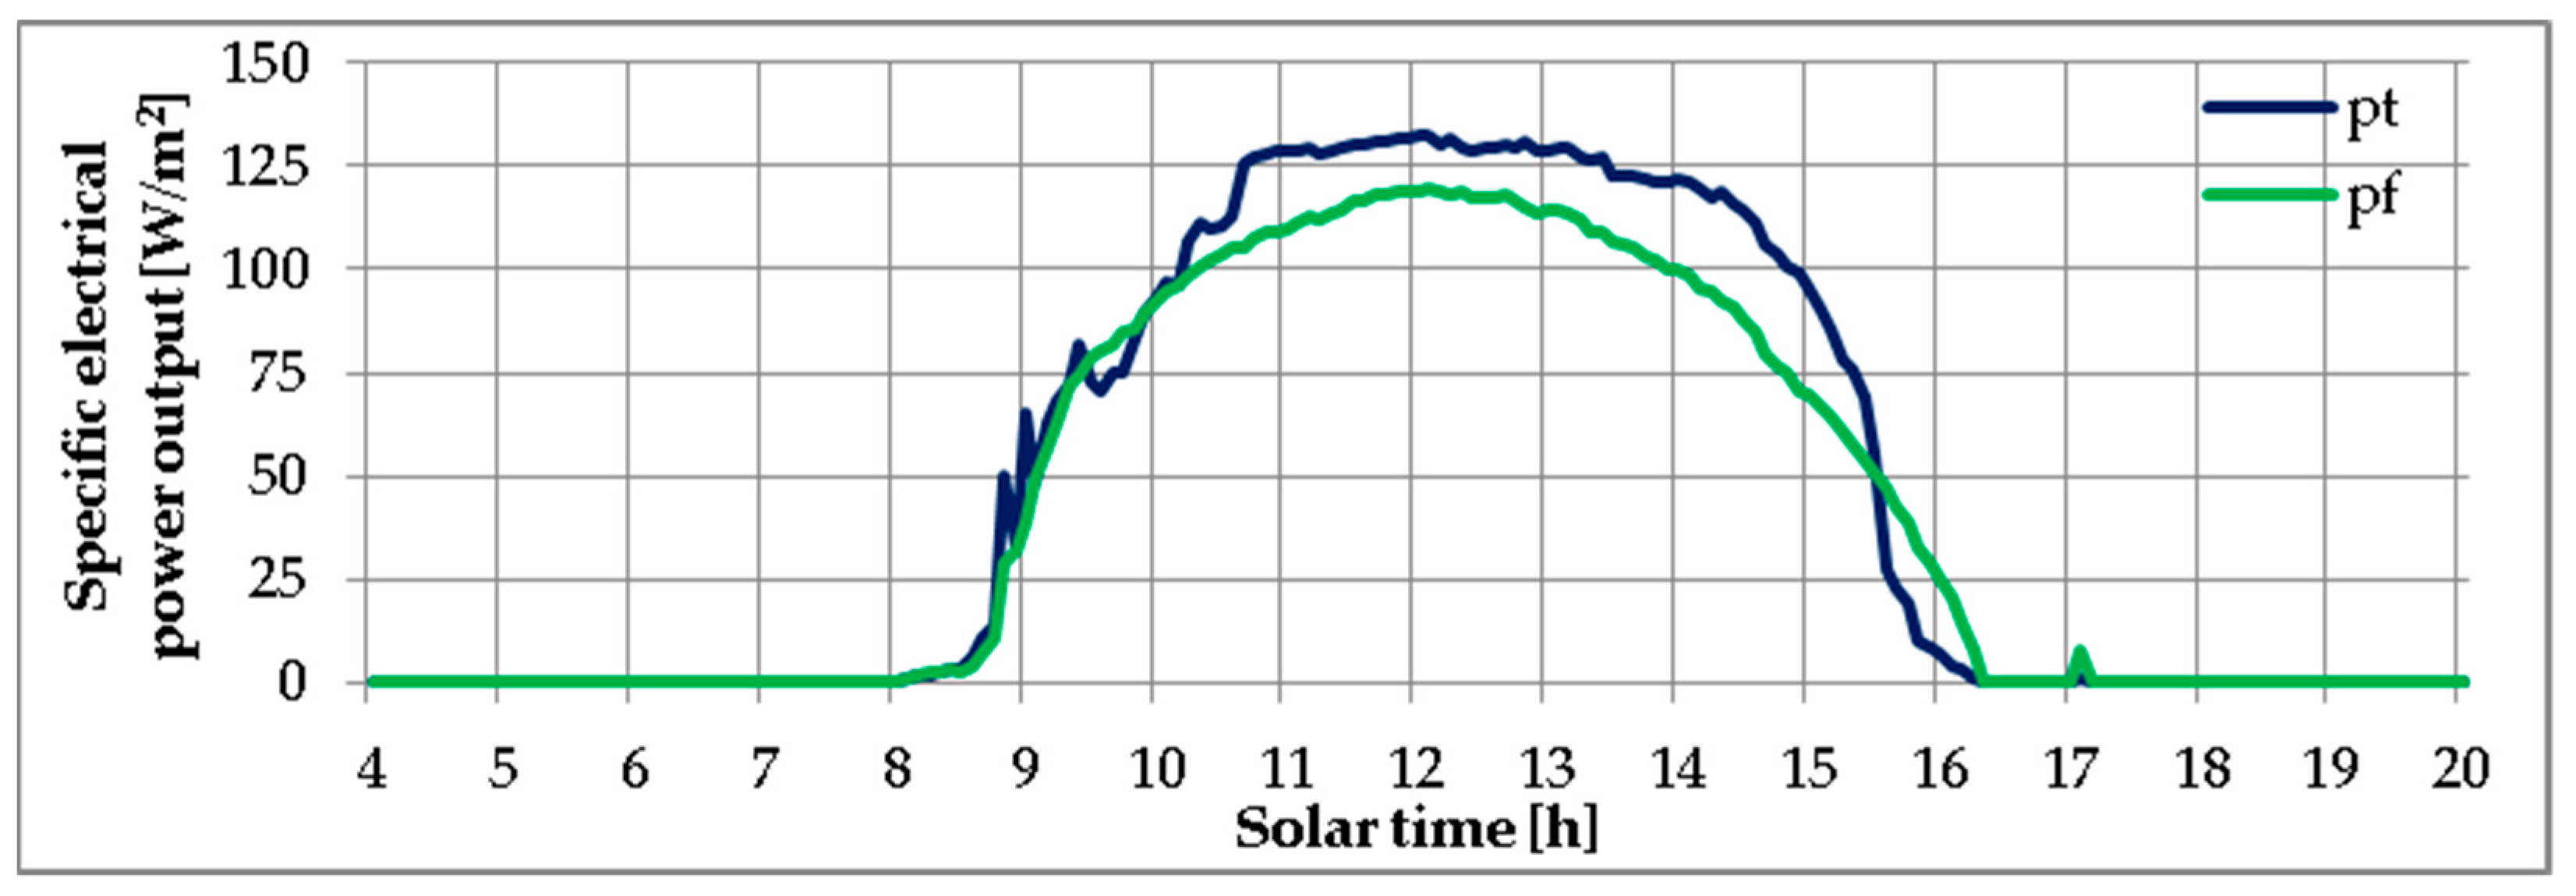
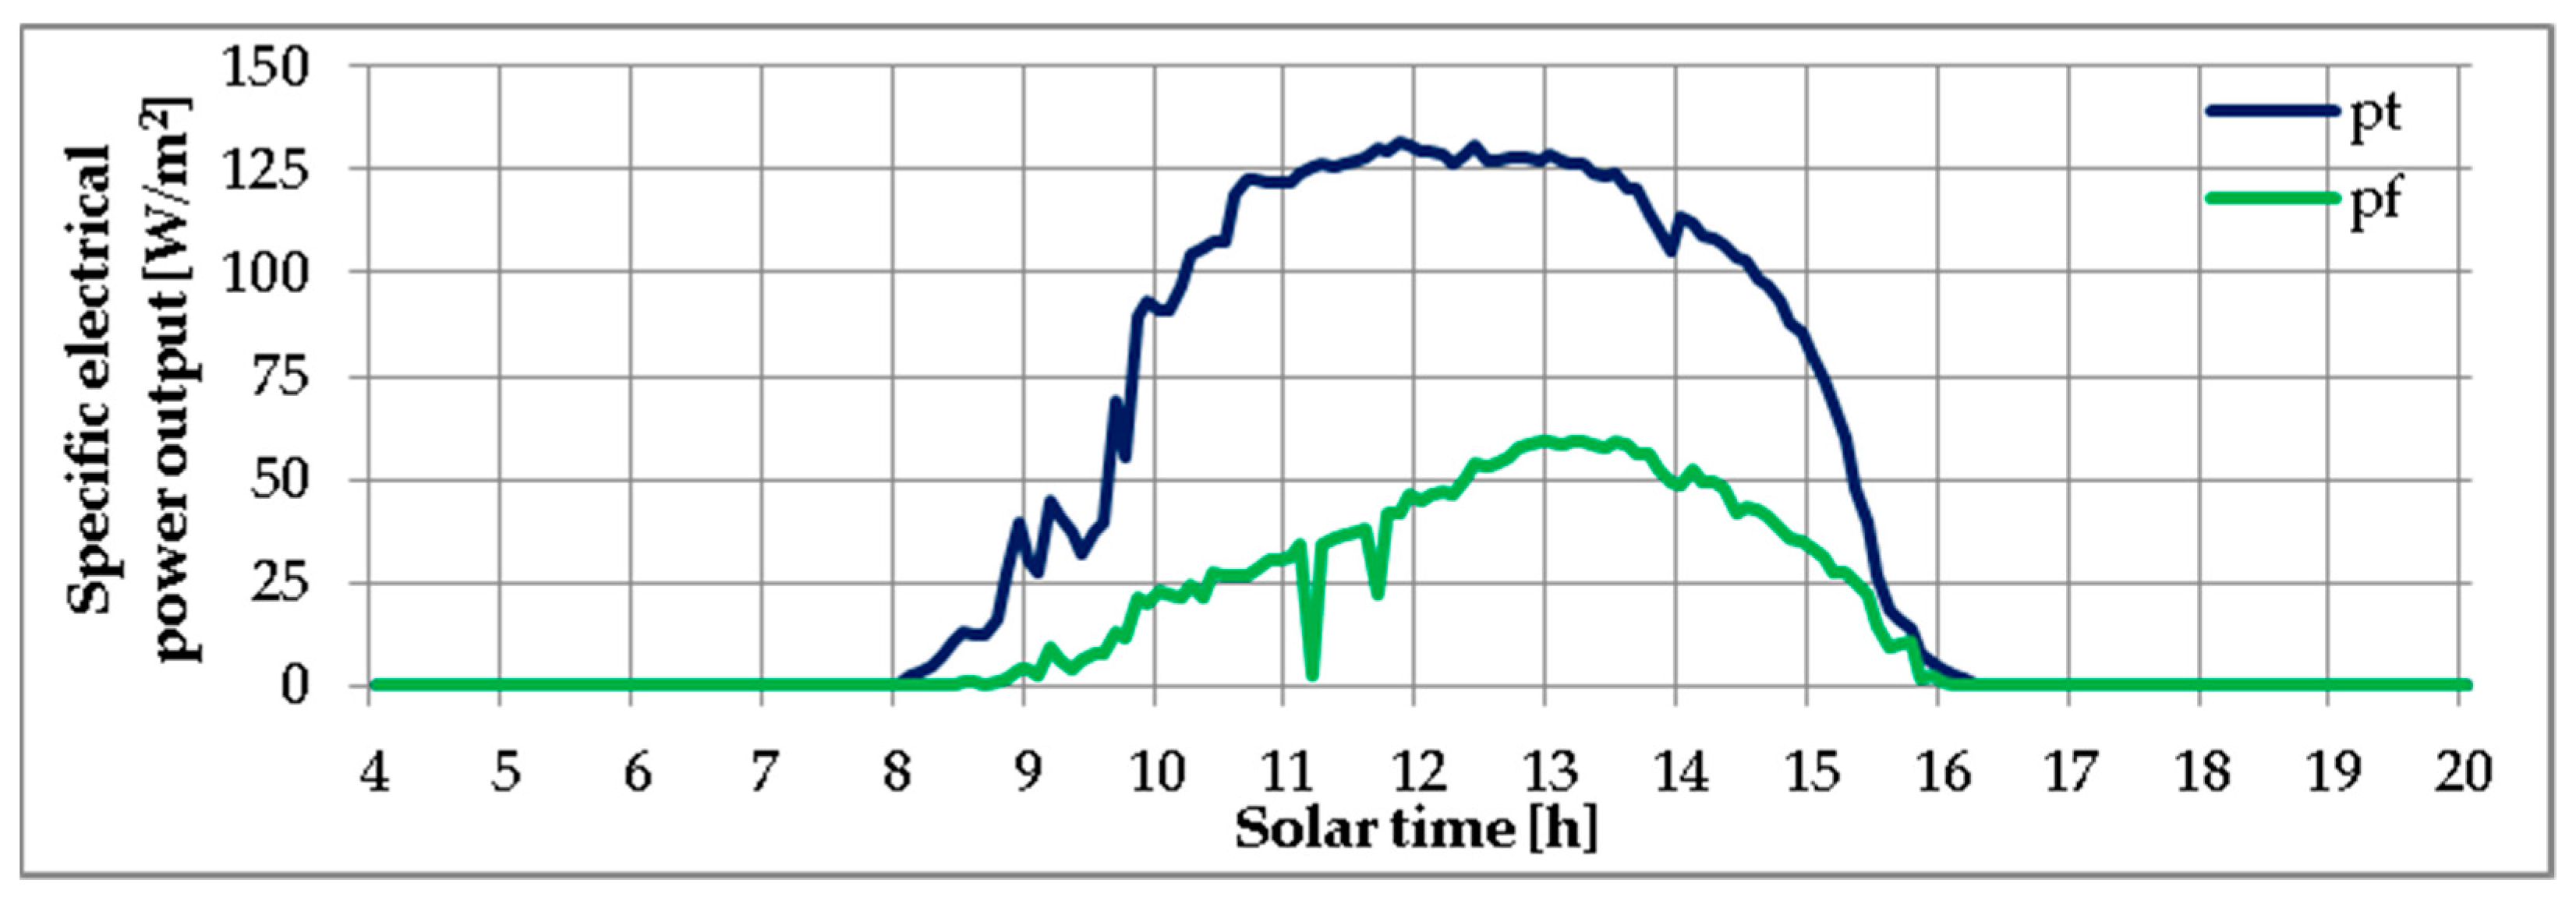
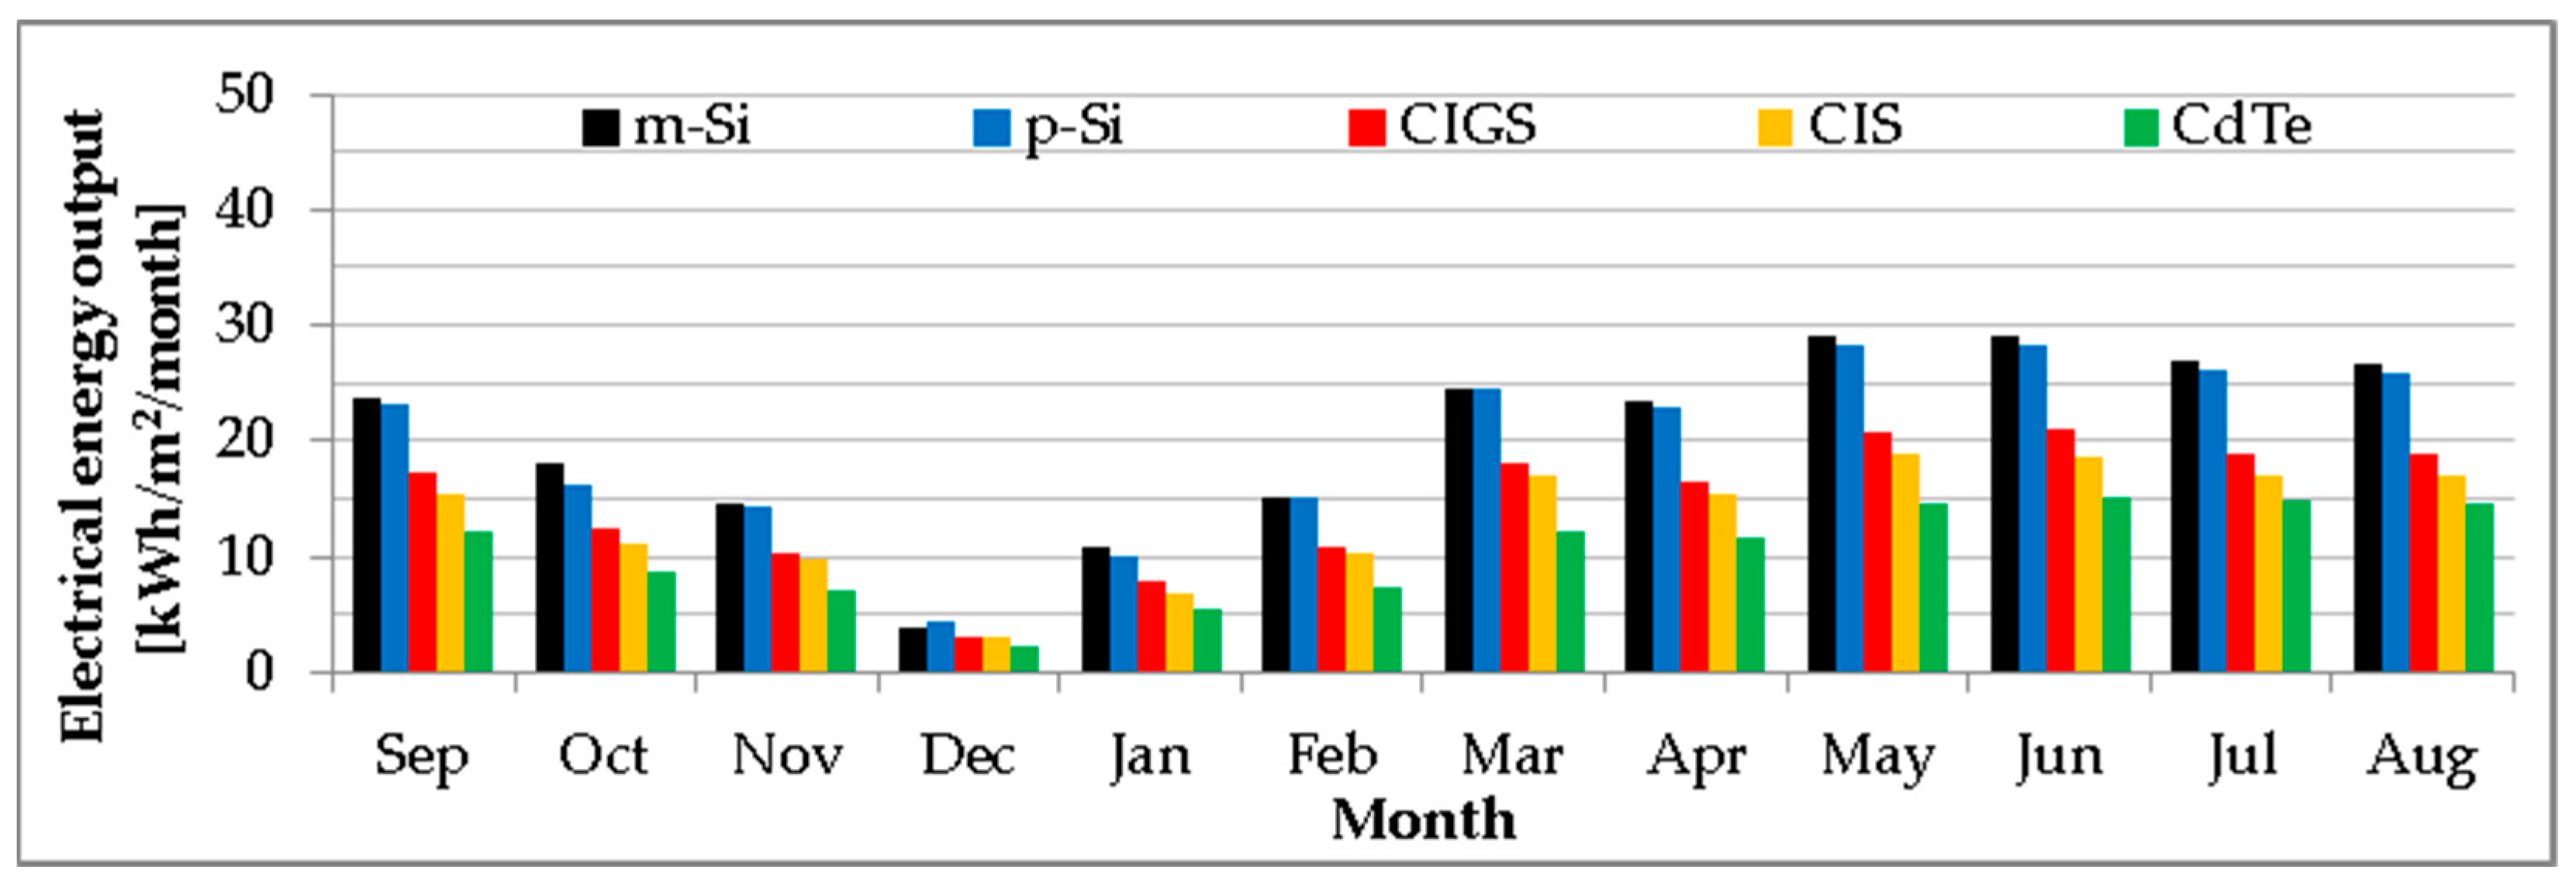
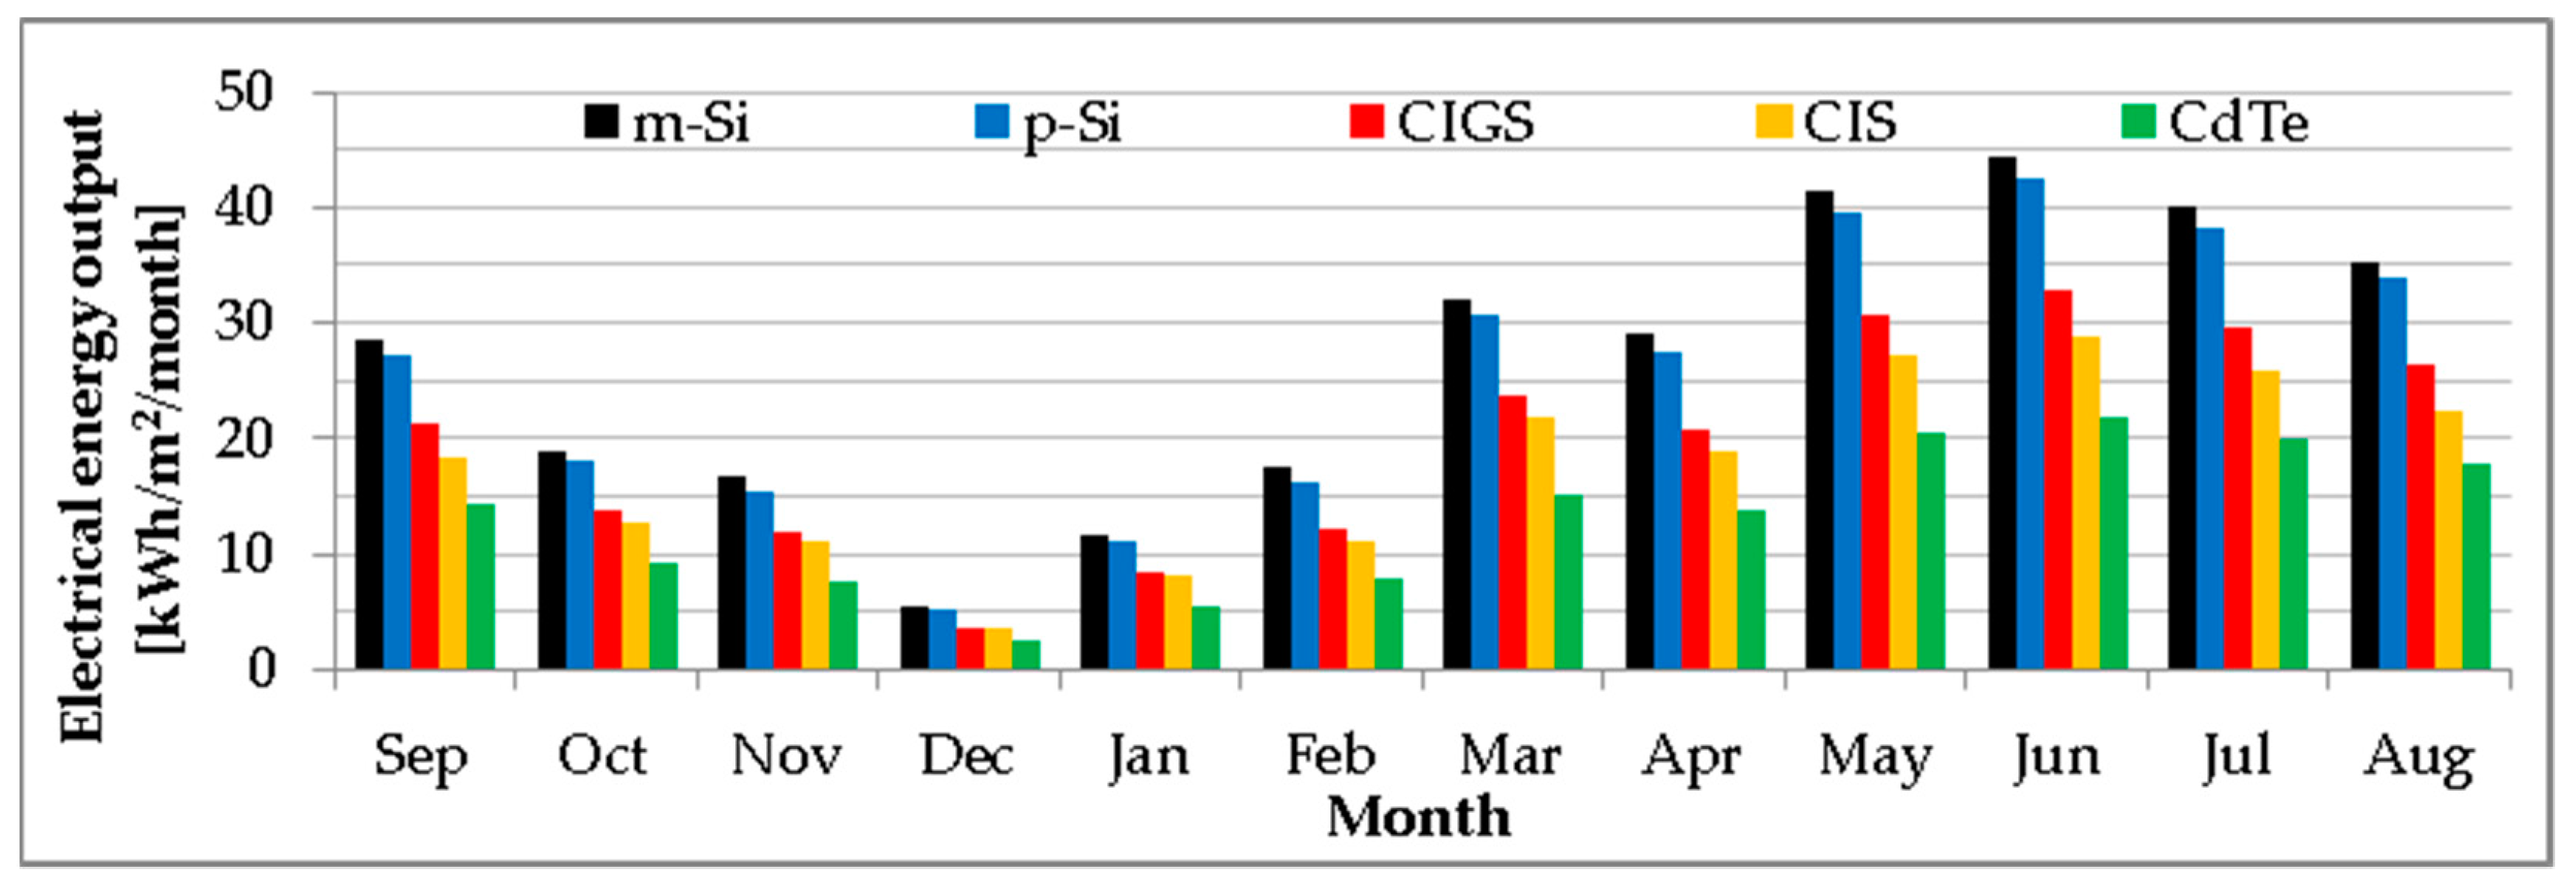
4.2. The Electrical Energy Output of the Fixed and Tracked Photovoltaic Platforms

The monthly distribution of the electrical energy output of the entire fixed and tracked photovoltaic platform is plotted in Figure 9. As expected, the tracked photovoltaic platform produced almost 58.4 kWh/m2 (29.6%) more electrical energy than the fixed one during the entire year (255.7 kWh/m2 against 197.3 kWh/m2). This yearly electrical energy gain corresponds to the 28% gain in global solar energy received by the tracked photovoltaic platform evaluated in Section 4.1.
Analysing the monthly variation of the absolute and relative electrical energy gain of the tracked vs. fixed PV platforms plotted in Figure 10, the highest values (12.15 kWh/m2 and 52%, respectively) were obtained in June 2022 when the tracked PV platform produced 35.51 kWh/m2 while the fixed one produced 23.36 kWh/m2. The lowest electrical energy gain (0.8 kWh/m2 and 9.4%, respectively) resulted in January 2022 when the tracked and fixed PV platforms produced 9.3 kWh/m2 and 8.5 kWh/m2. These maximum and minimum relative gains in electrical energy output correspond to the global solar energy gain of the tracked PV platform: 47% in June 2022 and 8.7% in January 2022 (Figure 9).
Further on, three sunny days (29 June 2022, 12 January 2022 and 23 December 2021) are selected to analyse the highest relative electrical energy obtained in June 2022, the lowest electrical energy gain obtained in January 2022 and the strangely high relative electrical energy gain obtained in December 2021, respectively.
For the summer sunny day (29 June 2022), the variation of the solar irradiance received by the tracked and fixed PV platforms is plotted in Figure 11. The advantage of tracking is clearly visible in the morning and in the evening due to the large difference between the 0° azimuthal angle of the fixed PV platform and the solar azimuthal angle, which is between 123.17° at sunrise and −123.17° at sunset; the solar azimuthal angle is followed by the tracked PV platform in approximatively one-hour steps. During the entire day, the tracked PV platform receives 11.44 kWh/m2, 65.3% more than that received by the fixed PV platform (6.92 kWh/m2).
The specific electrical output of the tracked (pt) and fixed (pf) PV platforms on the summer sunny day (29 June 2022) is plotted in Figure 12. Similar to the evolution of the global solar irradiance received by the two PV platforms, high electrical energy gains occur during the morning and evening. During the entire day, the tracked PV platform produced 1.44 kWh/m2, 67.3% higher than the fixed PV platform which produced only 0.86 kWh/m2.
In absolute values, the tracked PV platform produced 16.45 kWh electrical energy on 29 June 2022, with 6.62 kWh more than the fixed PV platform. The electrical energy consumption of the tracking system accounted during the entire day for 0.07 kWh, representing only 1.06% of the electrical energy gain of the tracked PV platform. Thus, the real electrical energy gain of the tracked PV platform is 6.55 kWh/day.
The variation of the solar irradiance received by the tracked and fixed PV platforms on the winter sunny day (12 January 2022) is plotted in Figure 13. The advantage of the tracking is not as clearly visible as in the case of the sunny summer day. The differences also occur in the morning and in the evening but they do not have large values because the solar azimuthal angle ranges only between 58.15° at sunrise and -58.15° at sunset, closer to the 0° azimuthal angle of the fixed PV platform. The small advantage of the tracked PV platform around noon is due to the elevation angle of the tracked PV platform that has the same elevation angle as the solar elevation angle (22.7°) while the elevation angle of the fixed PV platform is 47°. During the entire day, the tracked PV platform received 5.57 kWh/m2, 19.9% higher than that received by the fixed PV platform (4.65 kWh/m2). The solar energy received on the sunny winter day is 48.7% for the tracked PV platform and 67.2% for the fixed PV platform on the sunny summer day.
The specific electrical output of the tracked (pt) and fixed (pf) PV platforms on the winter sunny day (12 January 2022) is plotted in Figure 14. Similarly with the evolution of the global solar irradiance received by the two PV platforms, high electrical energy gains occur during the morning and evening. During the entire day, the tracked PV platform produced 0.75 kWh/m2, 12% more than the fixed PV platform which produced only 0.67 kWh/m2.
In absolute values, the tracked PV platform produced 8.52 kWh of electrical energy in 12 January 2022, 0.91 kWh more than the fixed PV platform. The electrical energy consumption of the tracking mechanism accounted for 0.04 kWh during the entire day, smaller than in the summer day due to the smaller angular angles for both azimuthal and elevation angles, representing, thus, only 4.4% of the electrical energy gain of the tracked PV platform. Thus, the real electrical energy gain of the tracked PV platform is 0.87 kWh for the sunny winter day.
To assess the strangely high relative gain of the tracked PV platform, the sunny day of 23 December 2021 is further analysed. The variation of the solar irradiance received by the tracked and fixed PV platforms is plotted in Figure 15. During December 2021, only two days were almost sunny, both of them being partly cloudy in the morning with the sky becoming clear only after 9:45. During the entire day, the tracked PV platform received 4.49 kWh/m2, 17.1% more than that received by the fixed PV platform (3.84 kWh/m2).
The specific electrical output of the tracked (pt) and fixed (pf) PV platforms on the winter sunny day (23 December 2021) is plotted in Figure 16. A high electrical energy gain occurs during the entire day, mainly during the morning and around noon. During the entire day, the tracked PV platform produced 0.688 kWh/m2, 186.7% higher than the fixed PV platform that produced only 0.240 kWh/m2. Comparing the specific electrical power output of the tracked PV platform on 23 December 2021 and 12 January 2022, similar evolutions are observed. The same cannot be said about the evolution of the specific electrical power output of the fixed PV platforms.
In absolute values, the tracked PV platform produced 7.85 kWh of electrical energy on 23 December 2021 (Figure 16). A large drop in the fixed PV platform electrical energy output resulted (5.1 kWh). Analysing the weather conditions in December 2021, a large number of periods with snow fall were found, including the day before 23 December 2021. During the morning of 23 December 2021, the snow which had accumulated during the night on the tracked PV platform fell from it, due to its almost vertical position at sunrise, while the fixed PV platform was partly covered with snow during the entire day because of its fixed position. The electrical energy consumption of the tracking mechanism accounted during the entire day for 0.04 kWh, representing, thus, only 0.8% of the electrical energy gain of the tracked PV platform. Thus, the real electrical energy gain of the tracked PV platform is 5.06 kWh for this sunny winter day with snow fall.

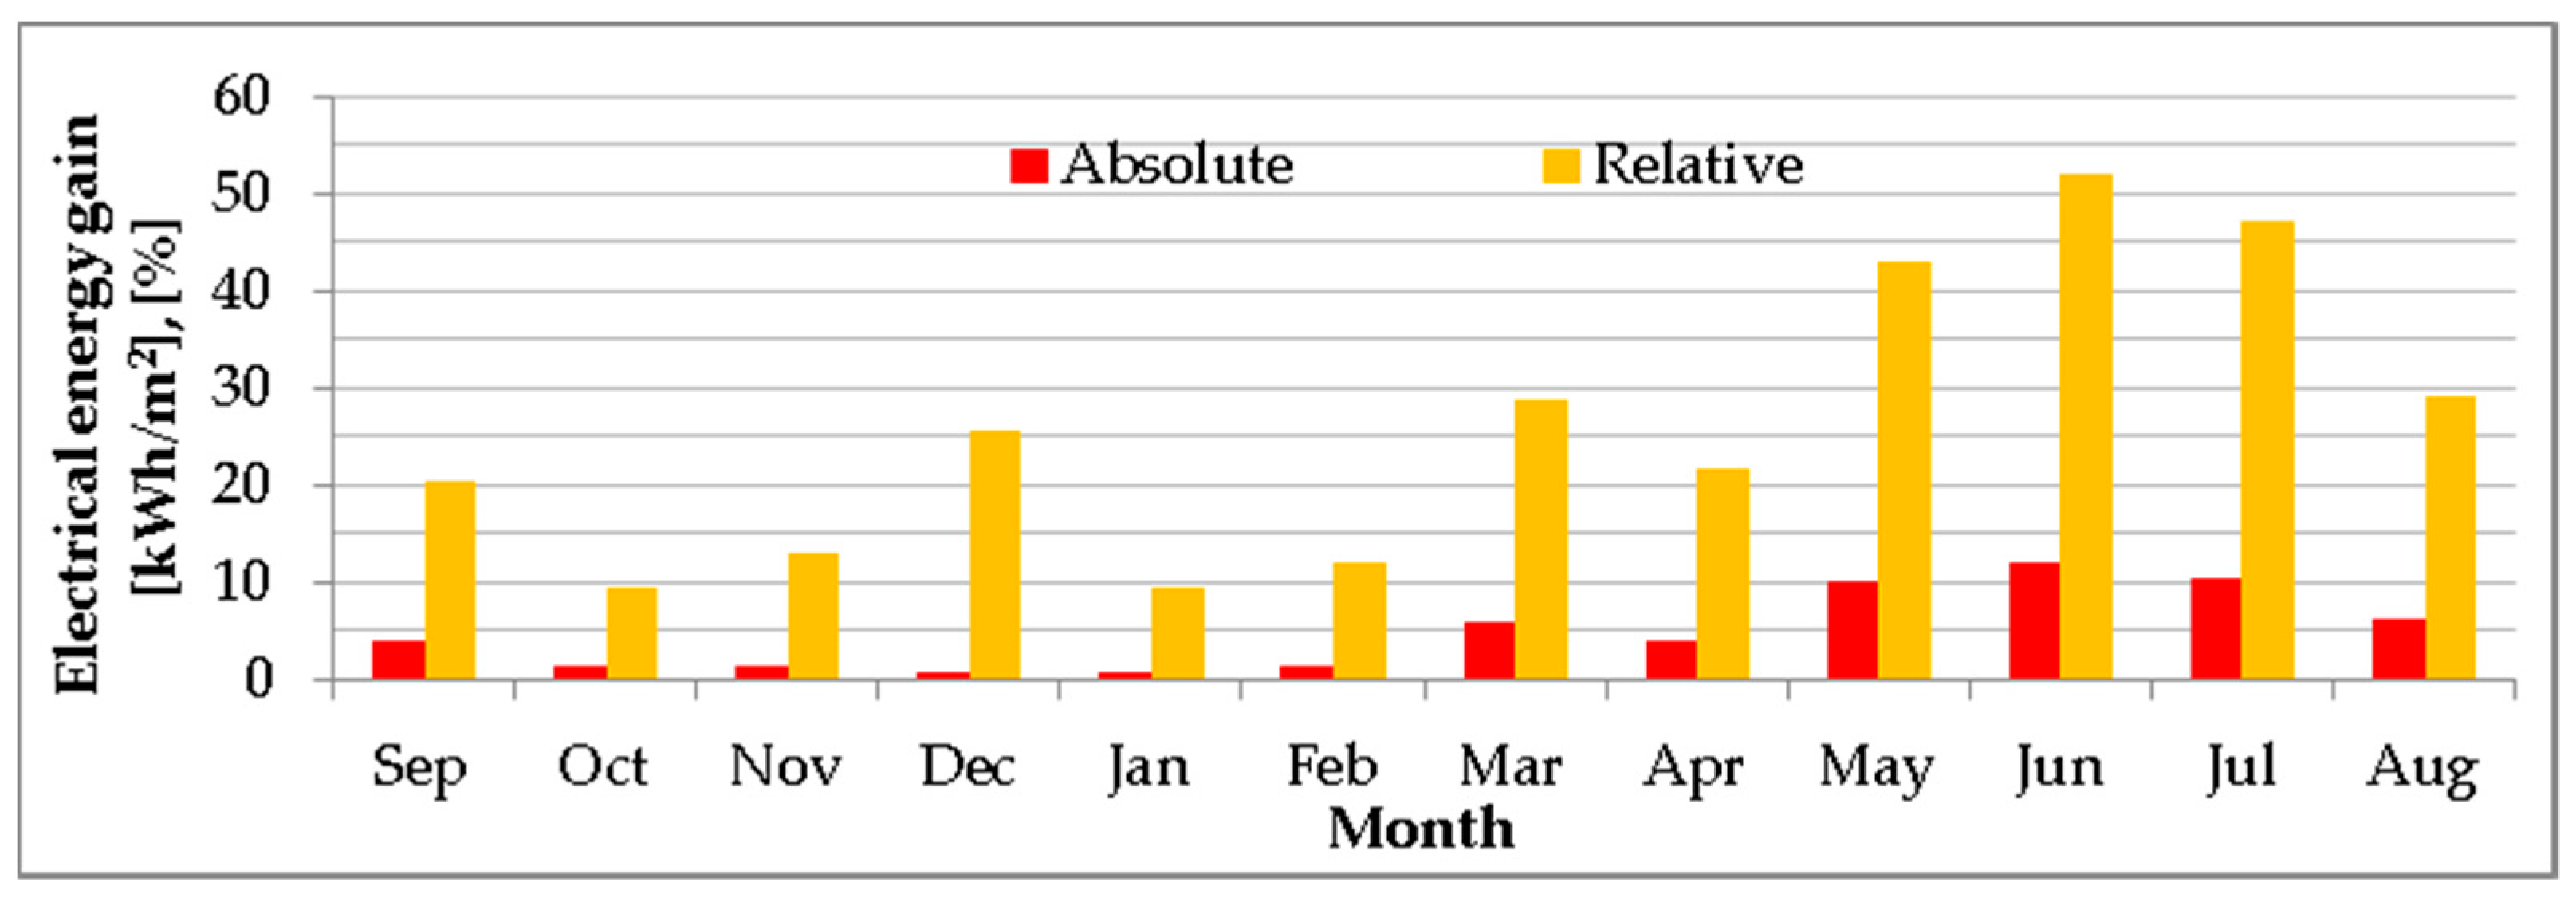
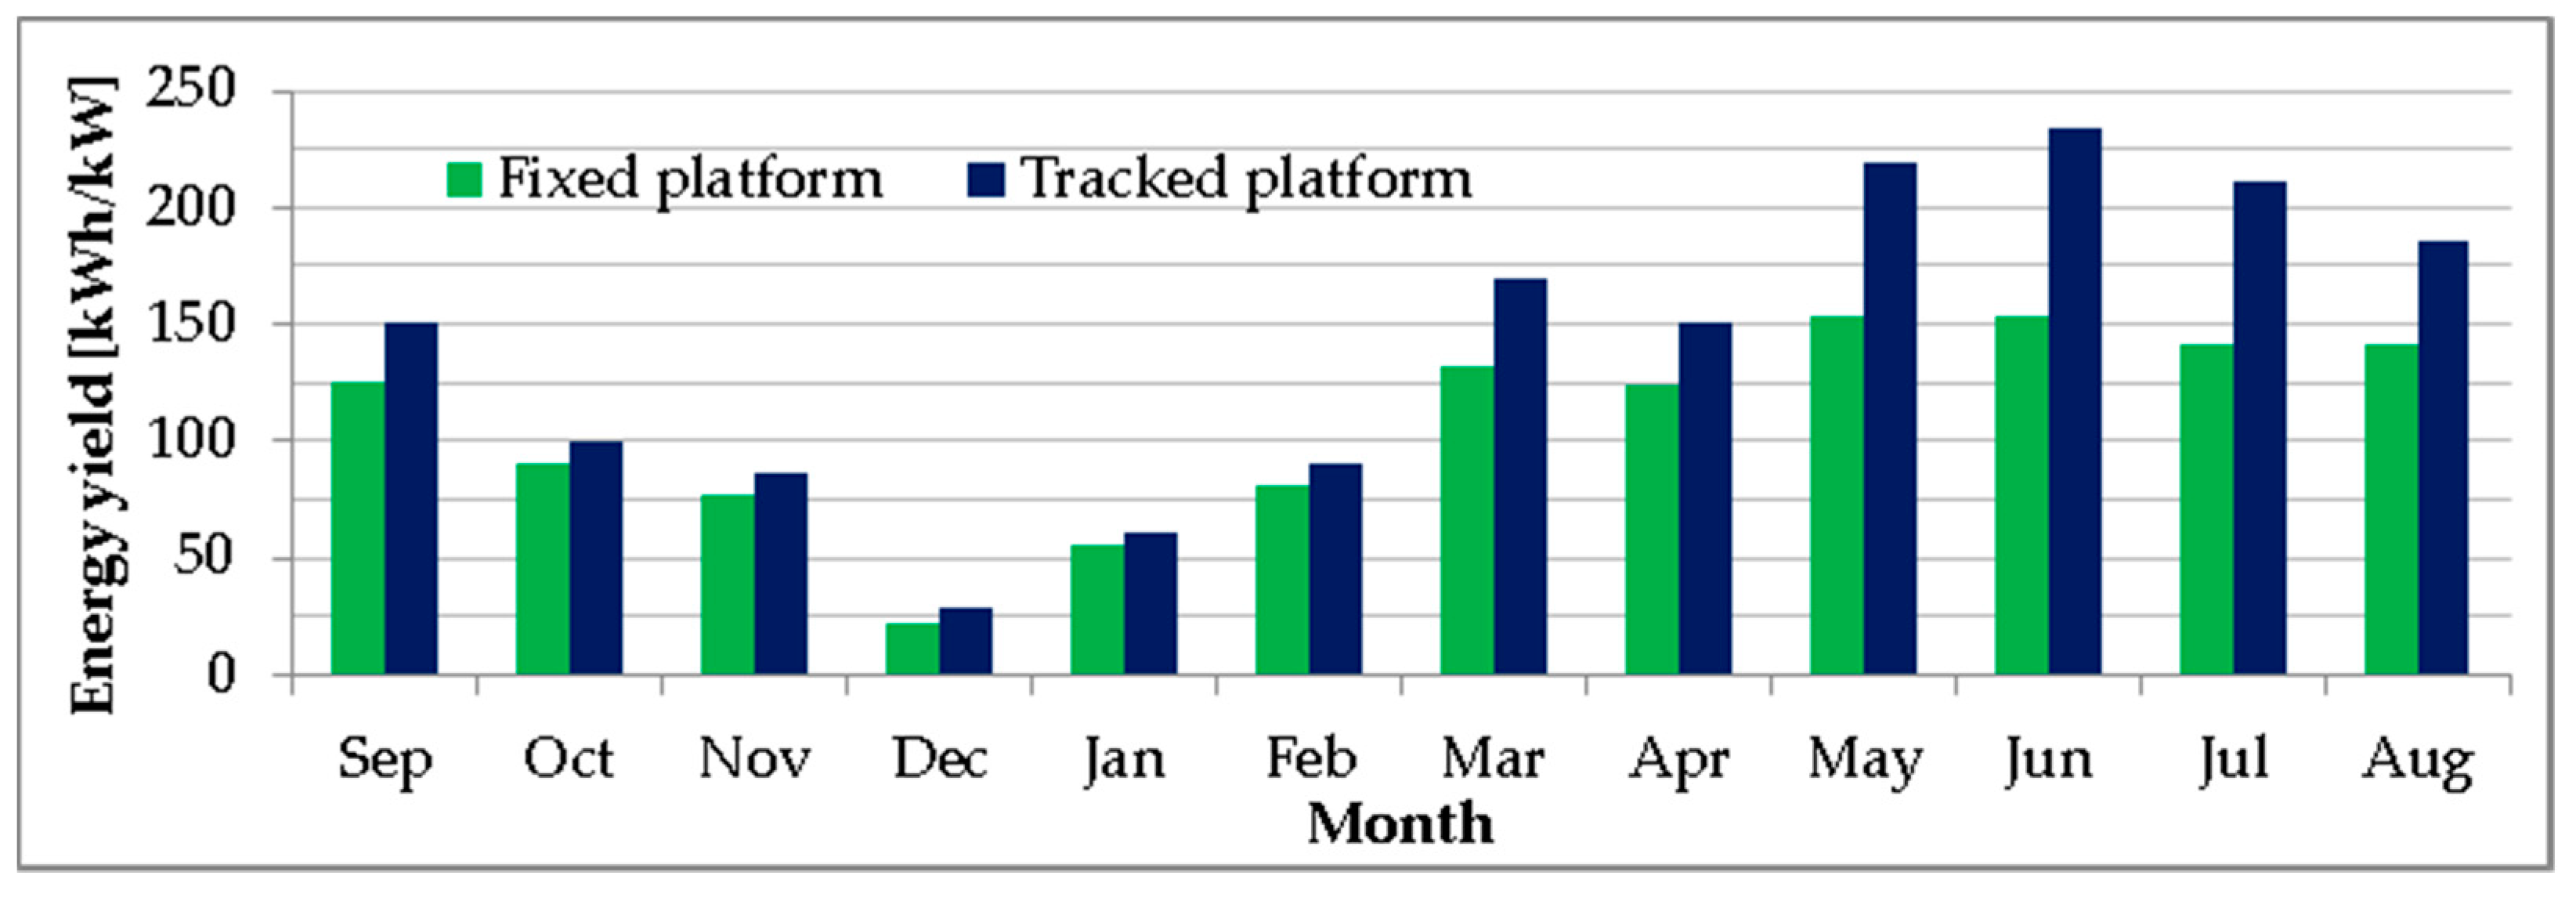
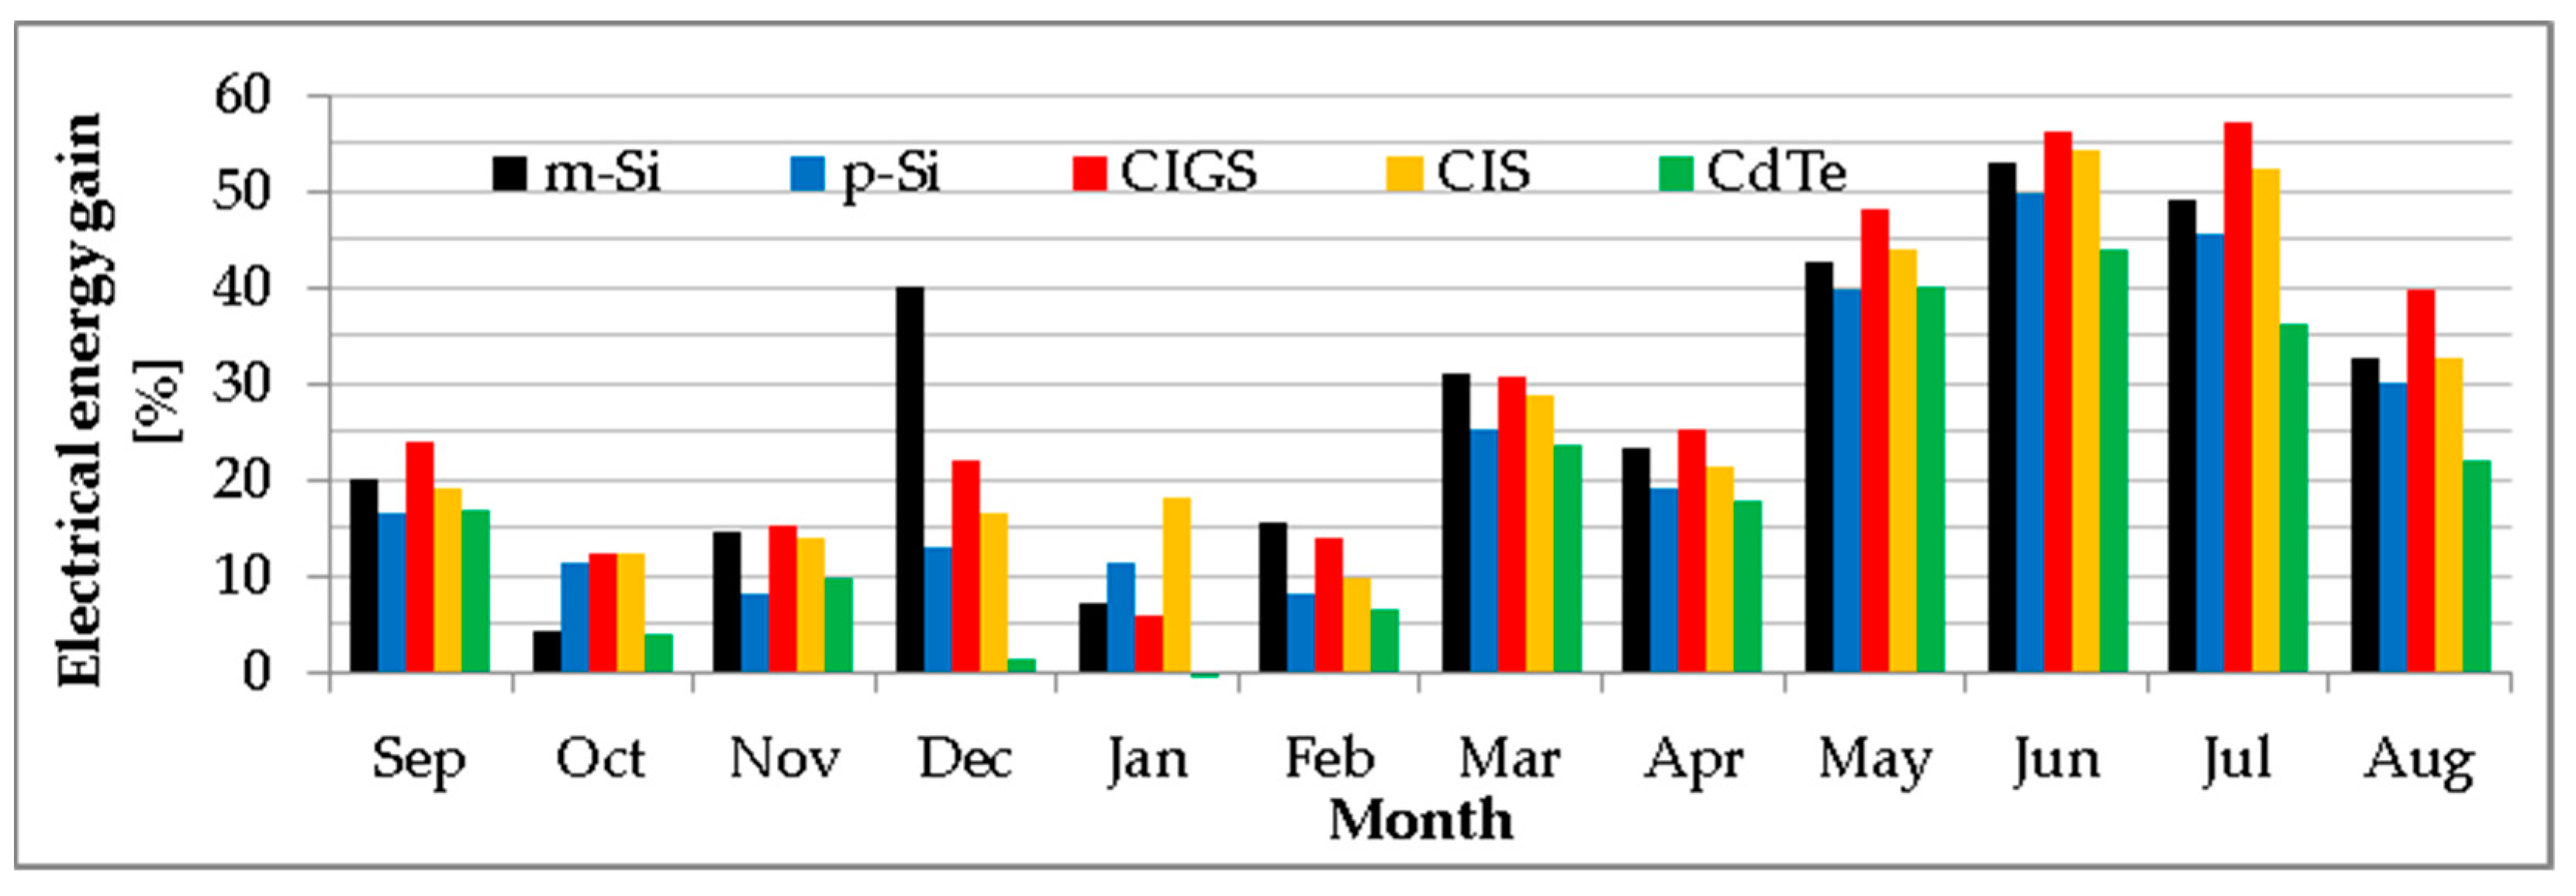
4.3. The Energy Yield of the Fixed and Tracked Photovoltaic Platforms

The monthly energy yield of the fixed and tracked photovoltaic platforms is plotted in Figure 17. The yearly energy yield of the tracked PV platform is 1686 kWh/kW, 29.6% higher than that of the fixed PV platform (1301 kWh/kW).

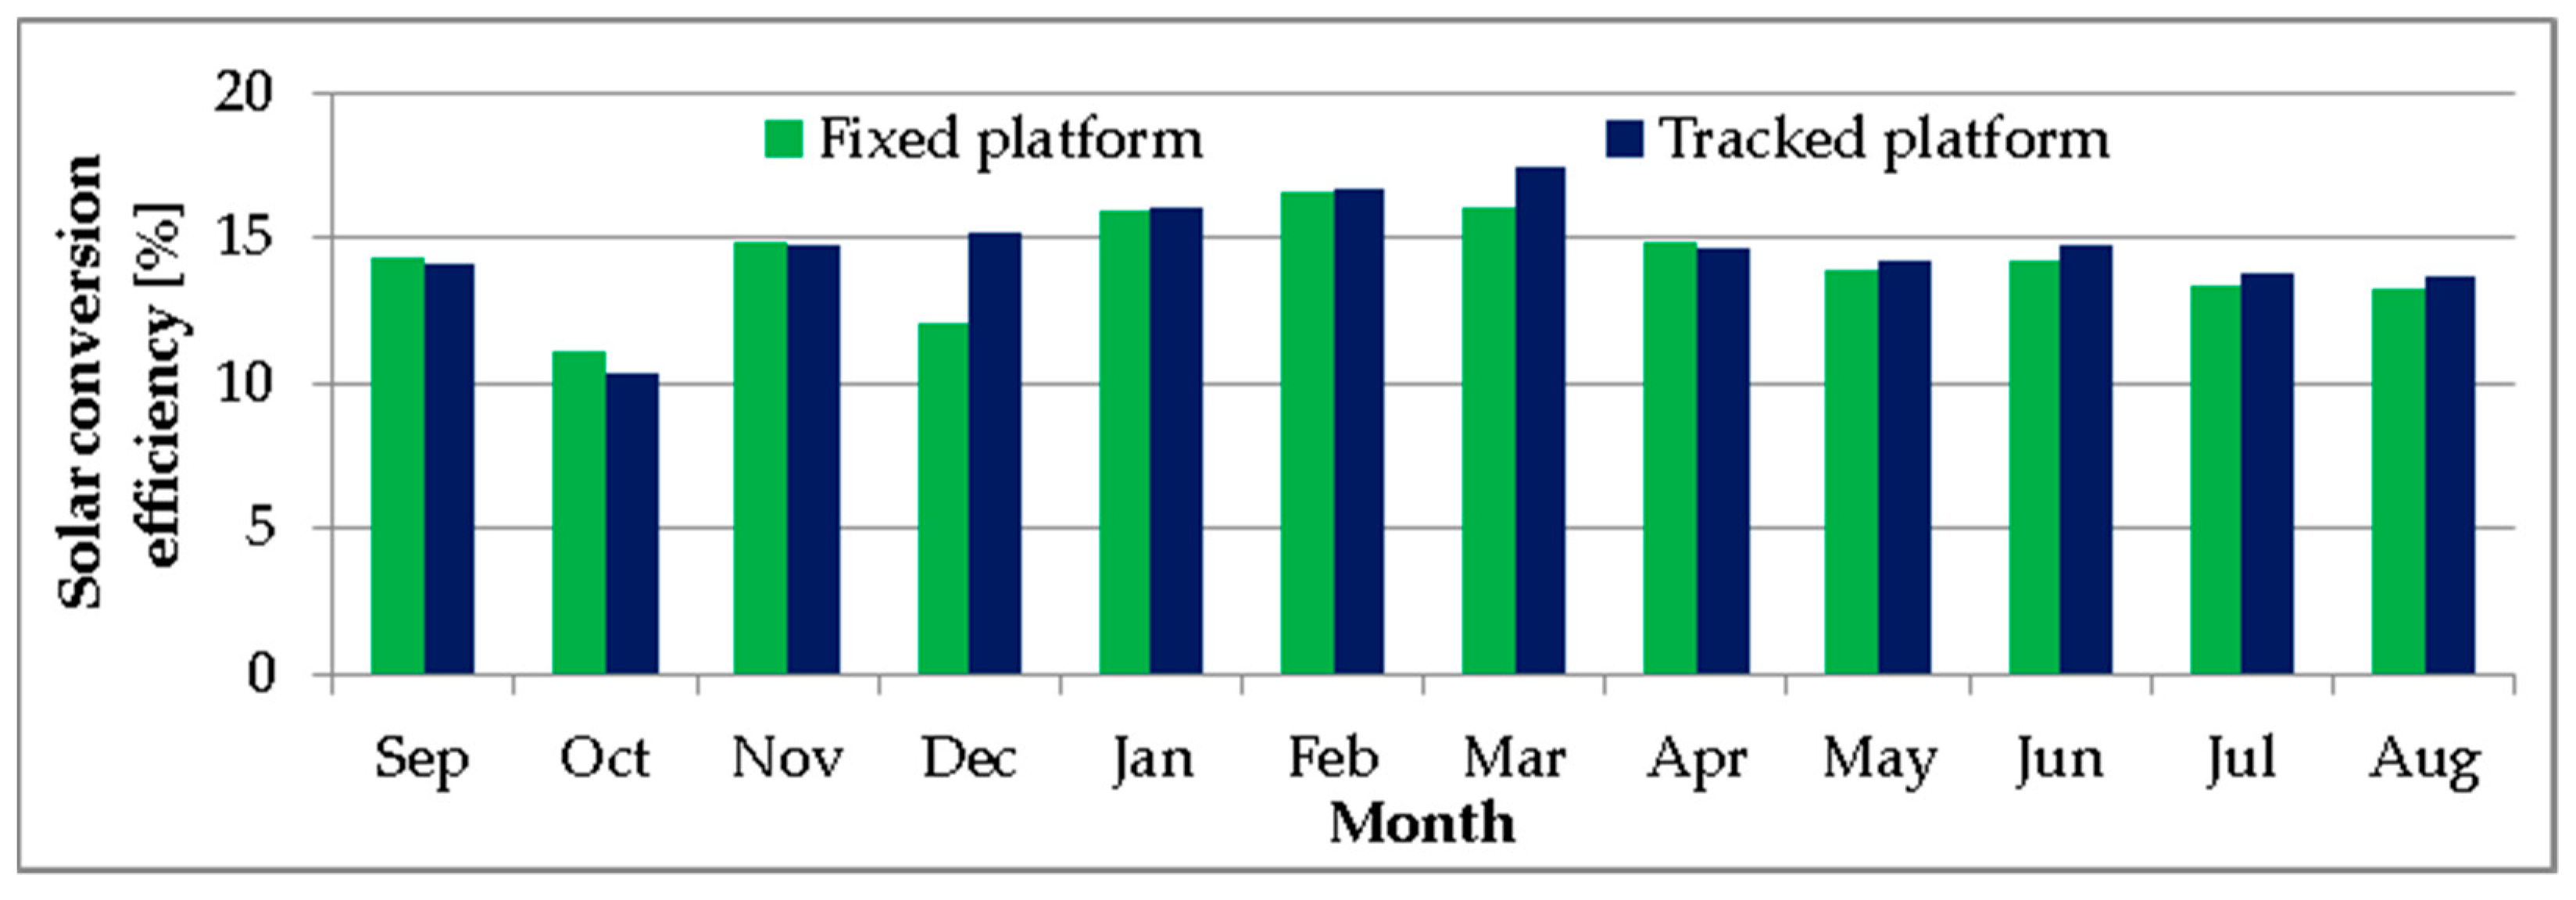
4.4. Experimental Solar Conversion Efficiency of the Fixed and Tracked PV Platforms

The global solar conversion efficiency of the fixed and tracked photovoltaic platforms is further analysed, resulting in yearly solar conversion efficiencies of 14.17% and 14.34% for the fixed and tracked platforms, respectively. The monthly solar conversion efficiencies are comparatively plotted in Figure 18. The monthly solar conversion efficiency ranges between 11.1% (in October 2021) and 16.6% (in February 2022) for the fixed photovoltaic platform and between 10.3% (in October 2021) and 17.42% (in March 2022) for the tracked photovoltaic platform. With the exception of September 2021, October 2021 and April 2022, the solar conversion efficiency of the tracked PV platform is higher than that of the fixed one, with a maximum difference of 3.1% in December 2021.

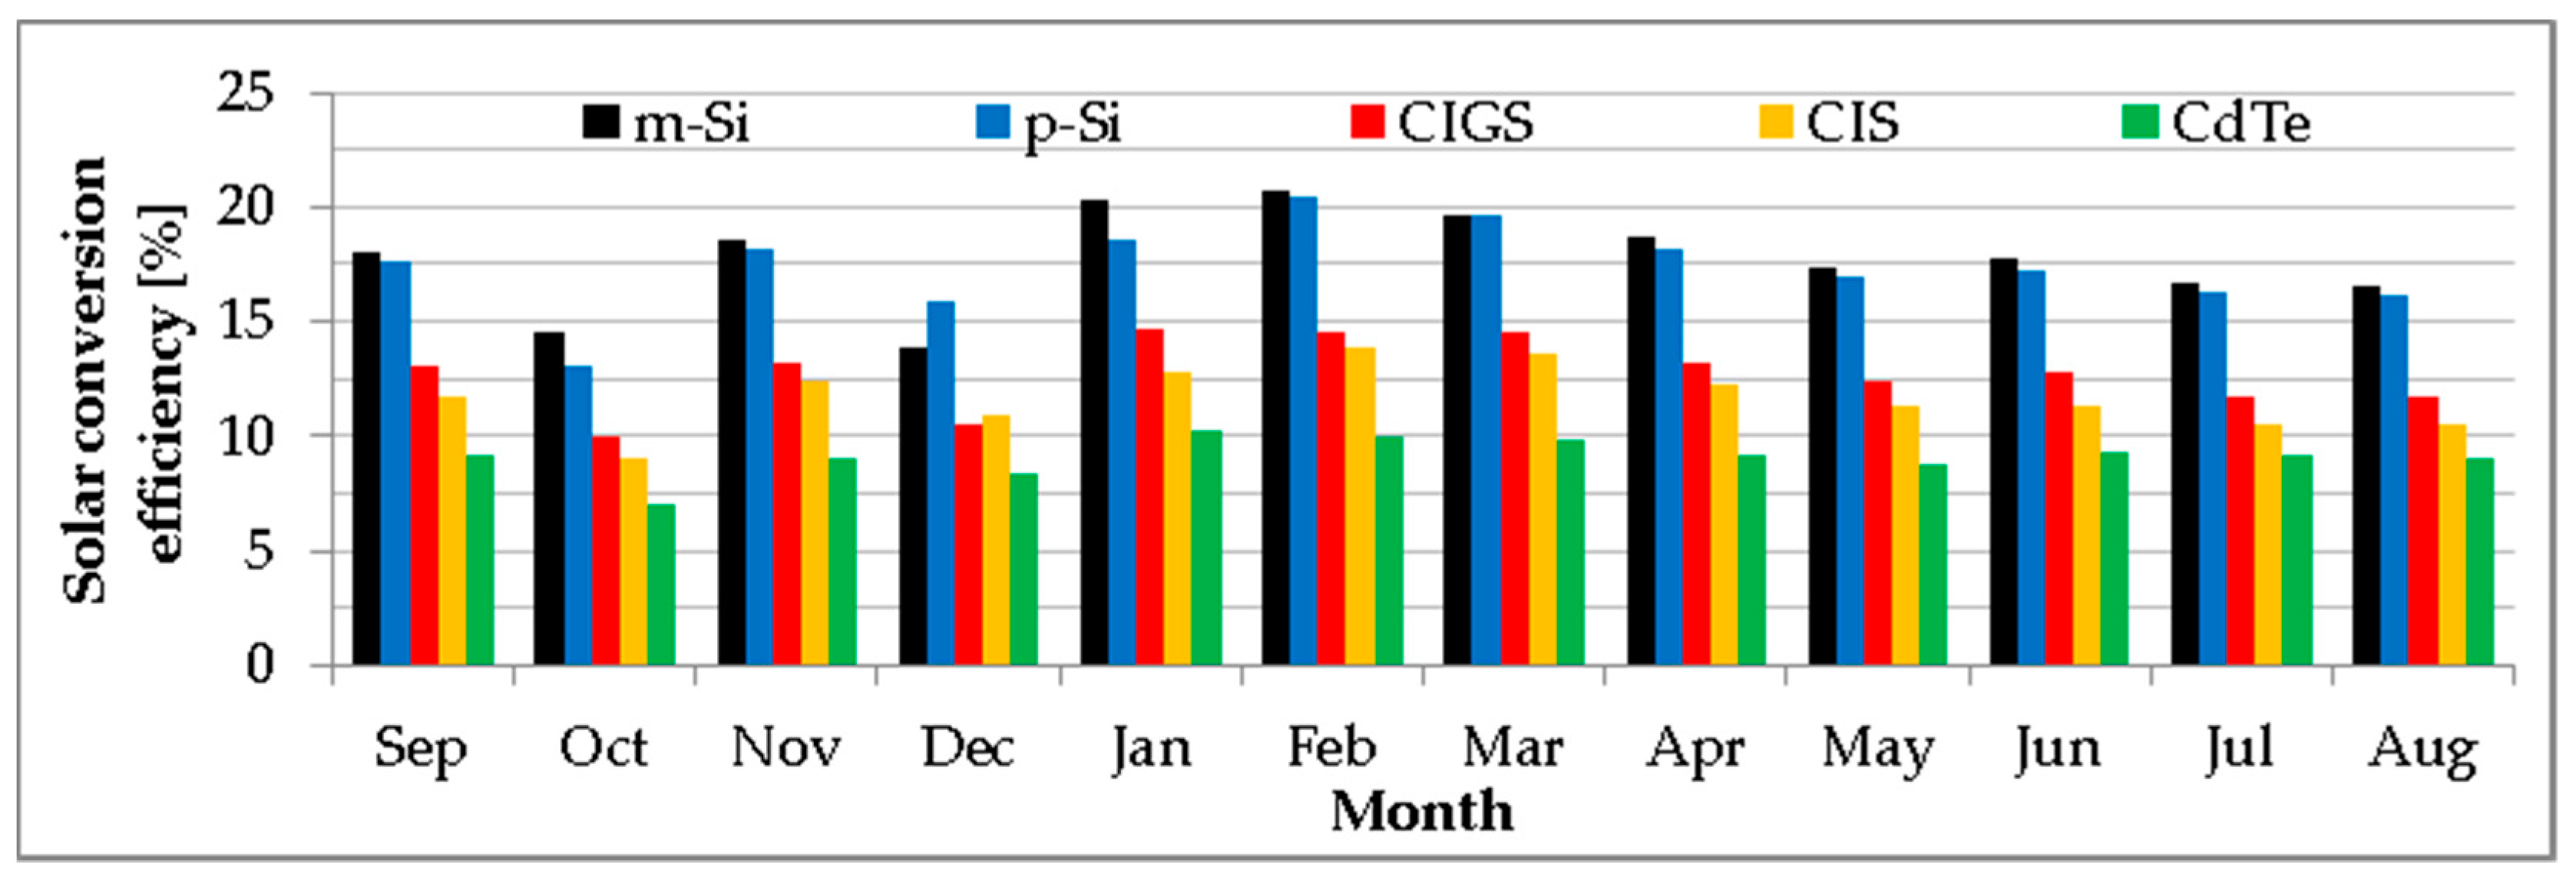
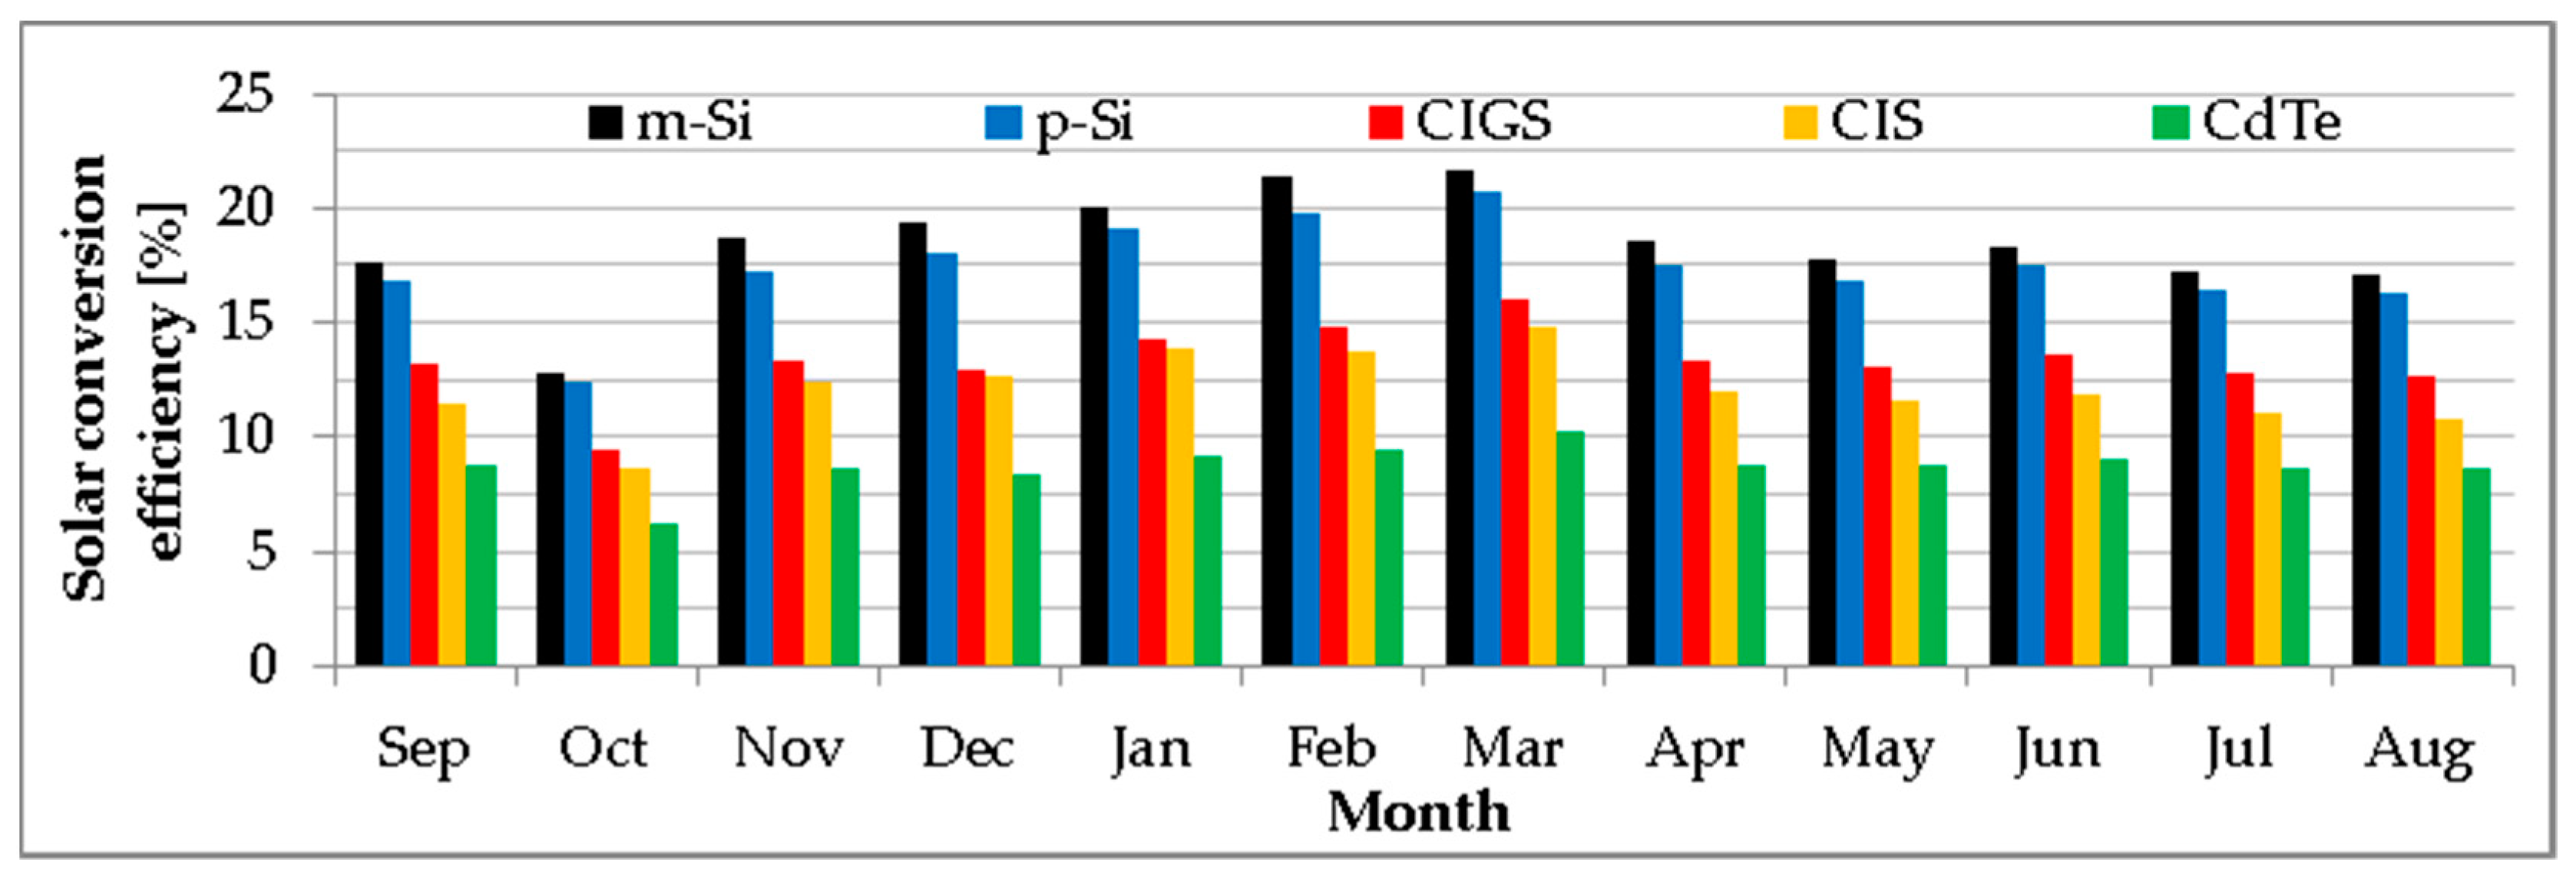
4.5. Experimental Solar Conversion Efficiency of the Fixed and Tracked PV Modules

In Section 4.4, the solar conversion efficiency was globally evaluated for all PV types installed on fixed and tracked PV platforms.
Further on, the influence of the photovoltaic technology on the solar conversion efficiency is assessed. The yearly electrical energy output of each PV module type is comparatively presented in Table 3. Based on these values the electrical energy gain (Equation (13)) was calculated, with the result that the CIGS technology benefits most from tracking, followed by CIS, m-Si, p-Si and CdTe PV technologies. This result can be explained based on influence from the higher temperature coefficients of the thin-film modules (Table 3). According to Table 3, the temperature coefficients of the tested PV modules decrease in the same order as the electrical energy gain decreases, excepting the CdTe modules which had high degradation rates during their first installation years, an aspect also mentioned in [27].
The relation between the high electrical energy gain and the high temperature coefficients can be explained in the following manner: since solar tracking increases the amount of received solar irradiance, it also leads to an increase in the tracked module’s temperature compared to fixed modules. The power produced under these circumstances by modules with high temperature coefficients will decrease in a smaller proportion than in the case of modules with low temperature coefficients.
Table 3. Yearly electrical energy output and electrical energy gain of the 5 PV modules types installed on the fixed and tracked platform.
PV Technologym-Sip-SiCIGSCISCdTe
Electrical energy output fixed module [kWh/m2/year]245.46239.37175.28160.18125.94
Electrical energy output tracked module [kWh/m2/year]320.56304.74234.82209.55155.36
Absolute electrical energy gain [kWh/m2/year]65.3775.0959.5449.3829.42
Relative electrical energy gain
[%]
30.5927.3133.9730.8323.36
Temperature coefficient of PMPP
[%/°K]
−0.44−0.45−0.38−0.39−0.25
During the warm months, between March and November, the high solar irradiance is heating the tracked PV modules to a higher degree than the fixed ones, enabling the modules with higher temperature coefficients (CIGS, CIS) to perform better than m-Si and p-Si modules (which have smaller temperature coefficients).
Similar results related to the improved performance of CIGS modules during intervals with high temperature/irradiance and in hot climates were also reported in [16,38].
The monthly electrical energy output of each PV module type is quantified, and the result plotted, in Figure 19 for the fixed PV platform and in Figure 20 for the tracked PV platform. Both silicon-based PV modules show higher electrical energy output than thin-film-based PV modules, with small differences between m-Si and p-Si technology, especially on the fixed PV platform.
The yearly ranking of the PV technologies based on their relative electrical energy gain (Equation (13)), presented in Table 3, is also consistent with results from the monthly level except the cold season (Figure 21).
Based on the individual electrical energy output of each PV module, the solar conversion efficiency is calculated for each of the five photovoltaic modules and comparatively presented in Figure 22 for the fixed PV platform and in Figure 23 for the tracked PV platform.
On both PV platforms, the m-Si PV modules perform better than all other PV module types with only one exception, occurring in December 2021 on the fixed platform when p-Si efficiency is the highest. The lowest efficiency is obtained for the CdTe PV modules. Between these extremes, p-Si PV modules stand in second place, CIGS in third and CIS in fourth place. The monthly efficiency ranking corresponds to the nominal efficiency ranking from Table 1. During the winter months—due to the air temperatures having maximum values ranging between 12.11 °C in December 2021 and 19.51 °C in March 2022, lower than STC (25 °C)—higher efficiencies than the nominal ones resulted for all PV modules with the exception of CdTe ones.
The m-Si, p-Si and CIS PV modules had a higher efficiency than the nominal one between November 2021 and April 2022 for both fixed and tracked PV platforms, excepting the month of December 2021 for the fixed PV platform where the snow does not drop as fast as in the case of tracked platform. The CIGS PV modules performed with a higher efficiency than the nominal one between January and March 2022.
The previously discussed degradation of the CdTe PV modules during the previous 10 years of functioning [27] is also visible in Figure 22 and Figure 23.

5. Conclusions

The paper analyses the electrical output and solar conversion efficiency of five types of photovoltaic modules (m-Si, p-Si, CIS, CIGS and CdTe) installed on a fixed and on a dual-axis solar-tracked photovoltaic platform in the continental climate of Brasov, Romania, for an entire year between September 2021 and August 2022.
The solar energy received by the fixed and by the tracked photovoltaic platforms is calculated based on the methodology described in Section 2 using values measured on-site of direct, horizontal diffuse and horizontal global solar irradiance. The tracked photovoltaic platform received 1783 kWh/m2 per year, 28% higher than the 1392 kWh/m2 received by the fixed platform in the same period. The monthly solar energy gain was significant in summer, when a maximum of 47% was reached in June. Winter resulted in lower gains, with 8.7% in January.
Accordingly, the tracked photovoltaic platform produced 29.6% more electrical energy than the fixed one over the entire year. In June, the electrical energy gain of the photovoltaic platform was 52% higher than that of the fixed platform. January resulted in the minimum value of this gain (9.4%).
Based on the measured electrical energy output and on the measured solar irradiance used to calculate the solar energy received by the fixed and tracked photovoltaic platforms, their solar conversion efficiency was assessed globally (for all five PV types together) resulting in yearly efficiencies of 14.17% and 14.34% for the fixed and tracked platforms, respectively. The highest global efficiency (17.42%) was obtained in March 2022 for the tracked PV platform, while its lowest global efficiency (10.3%) was obtained in October 2021. Similar values were obtained for the fixed photovoltaic platform: 16.6% in February 2022 and 11.1% in October 2021.
When comparing the electrical energy output of each individual PV module type, the highest relative electrical energy gain was obtained from the CIGS PV module (34%), followed by the CIS (30.8%), m-Si (30.6%), p-Si (27.3%) and CdTe (23.4%) PV technologies. The better performances of thin-film PV modules (except CdTe PV) are due to their lower temperature coefficients than that of m-Si and p-Si PV modules, considering the increased temperature of the PV module when it is exposed to a higher amount of solar energy as a result of solar tracking. The poor performance of CdTe modules is in line with other papers in the literature, which indicate similar results and a decrease of −5.55%/year [27] from the continental climate and [24,26] other climates. In terms of solar conversion efficiency—excepting December 2021, when the p-Si PV module performs best on the fixed platform—the m-Si PV module has the highest efficiency both on fixed and tracked PV platforms. In second place comes the p-Si PV module, followed by the CIGS, CIS and CdTe modules.

Author Contributions

Conceptualization, M.M., B.G.B. and I.V.; methodology, M.M. and B.G.B.; data curation, M.M. and B.G.B.; writing—original draft preparation, M.M. and B.G.B.; writing—review and editing, M.M., B.G.B. and I.V.; supervision, I.V. All authors have read and agreed to the published version of the manuscript.

Funding

We hereby acknowledge that the infrastructure required for this work was developed within the Project PRO-DD ID123, SMIS 2637 financed through POS-CCE, contract no. 11/2009.

Conflicts of Interest

The authors declare no conflict of interest. There are not any funders having a role in the design of the study; in the collection, analyses, or interpretation of data; in the writing of the manuscript,; or in the decision to publish the results.

Nomenclature

Bavailable direct solar irradiance, W/m²
Bnreceived direct solar irradiance, W/m²
Davailable diffuse solar irradiance, W/m²
Dhdiffuse horizontal solar irradiance, W/m²
Dnreceived diffuse solar irradiance, W/m²
Eelectrical energy output of the PV module or platform, Wh
Efelectrical energy output of the fixed PV module or platform, Wh
EGavailable global solar energy, Wh/m²
EGnreceived global solar energy, Wh/m²
EGnfglobal solar energy received in the fixed PV module plain, Wh/m²
EGntglobal solar energy received in the tracked PV module plain, Wh/m²
Etelectrical energy output of the tracked PV module or platform, Wh
Gavailable global solar irradiance, W/m²
Ghglobal horizontal solar irradiance, W/m²
Gnreceived global solar irradiance, W/m²
Gnfglobal solar irradiance received in the plane of fixed PV platform, W/m²
Gntglobal solar irradiance received in the plane of tracked PV platform, W/m²
Nnumber of the day (N = 1 for January 1st)
Pelectrical power of the PV module or platform, W
pfspecific electrical power output of the fixed PV module or platform, W/m2
Pfelectrical power output of the fixed PV module or platform, W
ptspecific electrical power output of the tracked PV module or platform, W/m2
Ptelectrical power output of the tracked PV module or platform, W
RErelative energy gain, %
RSrelative solar energy gain, %
SPVthe surface of the photovoltaic module or platform, m2
t1sunrise time of the day, h
t2sunset time of the day, h
tssolar time, h
Yenergy yield, kWh/kW
αsolar altitude angle, °
δdeclination angle, °
ΔEabsolute energy gain, Wh
λlongitude angle, °
ηsolar conversion efficiency, %
νincidence angle, °
φlatitude, °
χtilt angle, °
ωhour angle, °

References

  1. D’Agostino, D.; Tzeiranaki, S.T.; Zangheri, P.; Bertoldi, P. Assessing Nearly Zero Energy Buildings (NZEBs) development in Europe. Energy Strat. Rev. 2021, 36, 100680. [Google Scholar] [CrossRef]
  2. Visa, I.; Duta, A.; Moldovan, M.; Burduhos, B. Implementing Renewable Energy Systems in Nearly Zero Energy Communities. In Conference on Sustainable Energy; Springer: Cham, Swizterland, 2017; pp. 3–24. [Google Scholar]
  3. Moldovan, M.; Visa, I.; Duta, A. Future Trends for Solar Energy Use in Nearly Zero Energy Buildings. In Advances in Solar Heating and Cooling; Woodhead Publishing: Sawston, UK, 2016; pp. 547–569. [Google Scholar] [CrossRef]
  4. D’Agostino, D.; Tzeiranaki, S.T.; Zangheri, P.; Bertoldi, P. Data on nearly zero energy buildings (NZEBs) projects and best practices in Europe. Data Brief 2021, 39, 107641. [Google Scholar] [CrossRef] [PubMed]
  5. Attia, S.; Kurnitski, J.; Kosiński, P.; Borodiņecs, A.; Belafi, Z.D.; István, K.; Krstić, H.; Moldovan, M.; Visa, I.; Mihailov, N.; et al. Overview and future challenges of nearly zero-energy building (nZEB) design in Eastern Europe. Energy Build. 2022, 267, 112165. [Google Scholar] [CrossRef]
  6. Deng, S.; Wang, R.; Dai, Y. How to evaluate performance of net zero energy building—A literature research. Energy 2014, 71, 1–16. [Google Scholar] [CrossRef]
  7. Anwar, H.; Ibrahim, D. Development of power system designs for a net zero energy house. Energy Buildings 2014, 73, 120–129. [Google Scholar]
  8. Visa, I.; Comsit, M.; Moldovan, M.D.; Duta, A. Outdoor simultaneous testing of four types of photovoltaic tracked modules. J. Renew. Sustain. Energy 2014, 6, 033142. [Google Scholar] [CrossRef]
  9. Moldovan, M.; Visa, I. One Year Experimental Evaluation of the Electrical Gain by Solar Tracking a 12 KW Photovoltaic System Installed on a Building Rooftop. Mech. Mach. Sci. 2020, 91, 551–559. [Google Scholar] [CrossRef]
  10. Visa, I.; Diaconescu, D.V.; Saulescu, R.G.; Vatasescu, M.M.; Burduhos, B.G. New linkage with linear actuator for tracking PV systems with large angular stroke. Chin. J. Mech. Eng. 2011, 24, 744–751. [Google Scholar] [CrossRef]
  11. Burduhos, B.; Toma, C.; Neagoe, M.; Moldovan, M. Pseudo-Equatorial Tracking Optimization for Small Photovoltaic Platforms from Toronto/Canada. Environ. Eng. Manag. J. 2011, 10, 1059–1068. [Google Scholar] [CrossRef]
  12. Ameur, A.; Berrada, A.; Bouaichi, A.; Loudiyi, K. Long-term performance and degradation analysis of different PV modules under temperate climate. Renew. Energy 2022, 188, 37–51. [Google Scholar] [CrossRef]
  13. Ustun, T.S.; Nakamura, Y.; Hashimoto, J.; Otani, K. Performance analysis of PV panels based on different technologies after two years of outdoor exposure in Fukushima, Japan. Renew. Energy 2019, 136, 159–178. [Google Scholar] [CrossRef]
  14. Solís-Alemán, E.M.; de la Casa, J.; Romero-Fiances, I.; Silva, J.P.; Nofuentes, G. A study on the degradation rates and the linearity of the performance decline of various thin film PV technologies. Sol. Energy 2019, 188, 813–824. [Google Scholar] [CrossRef]
  15. Rajput, P.; Singh, Y.K.; Tiwari, G.; Sastry, O.; Dubey, S.; Pandey, K. Life cycle assessment of the 3.2 kW cadmium telluride (CdTe) photovoltaic system in composite climate of India. Sol. Energy 2018, 159, 415–422. [Google Scholar] [CrossRef]
  16. Oon, C.H.; Ng, K.W. CIGS photovoltaics for the urban tropics. Energy Procedia 2017, 143, 733–738. [Google Scholar] [CrossRef]
  17. Quansah, D.A.; Adaramola, M.S. Assessment of early degradation and performance loss in five collocated solar photo-voltaic module technologies installed in Ghana using performance ratio time-series regression. Renew. Energy 2019, 131, 900–910. [Google Scholar] [CrossRef]
  18. Humadaa, A.M.; Hojabri, M.; Hamadac, H.M.; Samsuria, F.B.; Ahmed, M.N. Performance evaluation of two PV tech-nologies (c-Si and CIS) for building integrated photovoltaic based on tropical climate condition: A case study in Malaysia. Energy Buildings 2016, 119, 233–241. [Google Scholar] [CrossRef] [Green Version]
  19. Kumar, N.M.; Sudhakar, K.; Samykano, M. Performance comparison of BAPV and BIPV systems with c-Si, CIS and CdTe photovoltaic technologies under tropical weather conditions. Case Stud. Therm. Eng. 2019, 13, 100374. [Google Scholar] [CrossRef]
  20. Ali, H.; Khan, H.A. Techno-economic evaluation of two 42 kWp polycrystalline-Si and CIS thin-film based PV rooftop systems in Pakistan. Renew. Energy 2020, 152, 347–357. [Google Scholar] [CrossRef]
  21. Balaska, A.; Tahri, A.; Tahri, F.; Stambouli, A.B. Performance assessment of five different photovoltaic module technologies under outdoor conditions in Algeria. Renew. Energy 2017, 107, 53–60. [Google Scholar] [CrossRef]
  22. Chikh, M.; Berkane, S.; Mahrane, A.; Sellami, R.; Yassaa, N. Performance assessment of a 400 kWp multi- technology photovoltaic grid-connected pilot plant in arid region of Algeria. Renew. Energy 2021, 172, 488–501. [Google Scholar] [CrossRef]
  23. Adouane, M.; Al-Qattan, A.; Alabdulrazzaq, B.; Fakhraldeen, A. Comparative performance evaluation of different pho-tovoltaic modules technologies under Kuwait harsh climatic conditions. Energy Rep. 2020, 6, 2689–2696. [Google Scholar] [CrossRef]
  24. Ameur, A.; Sekkat, A.; Loudiyi, K.; Aggour, M. Performance evaluation of different photovoltaic technologies in the region of Ifrane, Morocco. Energy Sustain. Dev. 2019, 52, 96–103. [Google Scholar] [CrossRef]
  25. Wang, H.; Muñoz-García, M.; Moreda, G.; Alonso-García, M. Seasonal performance comparison of three grid connected photovoltaic systems based on different technologies operating under the same conditions. Sol. Energy 2017, 144, 798–807. [Google Scholar] [CrossRef]
  26. Gao, B.; Shao, Y.; Liu, W.; Xiang, H.; Yu, Y.; Liu, Z. Outdoor reliability and degradation of HIT, CIGS, n-type multi-busbar, PERC, and CdTe modules in Shanghai, China. Sol. Energy Mater. Sol. Cells 2022, 236, 111490. [Google Scholar] [CrossRef]
  27. Kichou, S.; Wolf, P.; Silvestre, S.; Chouder, A. Analysis of the behaviour of cadmium telluride and crystalline silicon photovoltaic modules deployed outdoor under humid continental climate conditions. Sol. Energy 2018, 171, 681–691. [Google Scholar] [CrossRef]
  28. Burduhos, B.-G.; Vişa, I.; Duţă, A.; Neagoe, M. Analysis of the Conversion Efficiency of Five Types of Photovoltaic Modules During High Relative Humidity Time Periods. IEEE J. Photovol. 2018, 8, 1716–1724. [Google Scholar] [CrossRef]
  29. Moldovan, M.; Visa, I.; Burduhos, B.G. Experimental energy gain assessment of a photovoltaic system equipped with a biaxial solar tracking mechanism. In Proceedings of the Joint International Conference of the 13th IFToMM International Symposium on Science of Mechanisms and Machines (SYROM 2022), Iasi, Romania, 17–18 November 2022; Springer Nature: Cham, Switzerland, 2022. [Google Scholar]
  30. Visa, I.; Burduhos, B.; Neagoe, M.; Moldovan, M.; Duta, A. Comparative analysis of the infield response of five types of photovoltaic modules. Renew. Energy 2016, 95, 178–190. [Google Scholar] [CrossRef]
  31. Vatasescu, M.-M.; Diaconescu, D.; Duta, A.; Burduhos, B.G. Atmospheric Pollution Evaluation in Brasov Romania Based on Turbidity Factor Analysis. Environ. Eng. Manag. J. 2011, 10, 251–256. [Google Scholar] [CrossRef]
  32. Visa, I.; Duta, A.; Moldovan, M.; Burduhos, B.; Neagoe, M. Solar Energy Conversion Systems in the Built Environment. In Green Energy and Technology; Springer Nature: Cham, Switzerland, 2020. [Google Scholar] [CrossRef]
  33. SolarEdge. Technical Note—SolarEdge Fixed String Voltage, Concept of Operation, September 2012; SolarEdge: Herzliya, Israel, 2012. [Google Scholar]
  34. Cotorcea, A.; Pocora, A.; Visa, I. Optimum tilt angle of solar thermal collectors at sea. In Proceedings of the 7th International Conference on Energy Efficiency and Agricultural Engineering (EE&AE), Ruse, Bulgaria, 12–14 November 2020. [Google Scholar]
  35. Liu, Y.; Yao, L.; Jiang, H.; Lu, N.; Qin, J.; Liu, T.; Zhou, C. Spatial estimation of the optimum PV tilt angles in China by incorporating ground with satellite data. Renew. Energy 2022, 189, 1249–1258. [Google Scholar] [CrossRef]
  36. Moldovan, M.; Burduhos, B.-G.; Visa, I. Yearly Electrical Energy Assessment of a Photovoltaic Platform/Geothermal Heat Pump Prosumer. Energies 2021, 14, 3776. [Google Scholar] [CrossRef]
  37. Burduhos, B.G.; Visa, I.; Neagoe, M.; Badea, M. Modeling and optimization of the global solar irradiance collecting efficiency. Int. J. Green Energy 2015, 12, 743–755. [Google Scholar] [CrossRef]
  38. Alhammadi, N.; Rodriguez-Ubinas, E.; Alzarouni, S.; Alantali, M. Building-integrated photovoltaics in hot climates. Experimental study of CIGS and c-Si modules in BIPV ventilated facades. Energy Convers. Manag. 2022, 274, 116408. [Google Scholar] [CrossRef]
Figure 1. The tilt angle (χ) of a fixed PV module and the incidence angle (ν) between the Sun ray and the normal (n) of the PV module.
Energies 16 01229 g001
Figure 2. Angles in the Observer Q horizontal plane (a) and in the Earth equatorial plane (b).
Energies 16 01229 g002
Figure 3. Azimuthal solar-tracking system for a PV platform with five PV modules (a) and fixed PV platform (b) installed in the RESREC of the Transilvania University of Brasov, Romania.
Energies 16 01229 g003
Figure 4. Operation principle of SolarEdge systems based on DC/DC power optimizers [33].
Energies 16 01229 g004
Figure 5. Solar-tracking programme of the PV platform during the summer solstice (21 June 2022).
Energies 16 01229 g005
Figure 6. Delta-T weather station (a) and Solys 2 sun tracker (b) installed in the RESREC of the Transilvania University of Brasov, Romania.
Energies 16 01229 g006
Figure 7. Monthly global horizontal (EGh), diffuse horizontal (EDh) and direct (EB) solar energy measured in Brasov between September 2021–August 2022.
Energies 16 01229 g007
Figure 8. Monthly global solar energy received in the plane of the fixed (EGnf) and on the tracked (EGnt) PV platforms between September 2021–August 2022.
Energies 16 01229 g008
Figure 9. Monthly electrical energy output of the fixed and tracked photovoltaic platforms.
Energies 16 01229 g009
Figure 10. Absolute and relative monthly electrical energy gain of the tracked vs. fixed PV platform.
Energies 16 01229 g010
Figure 11. Solar global irradiance received by the tracked (Gnt) and fixed (Gnf) PV platforms on 29 June 2022.
Energies 16 01229 g011
Figure 12. Specific electrical output of the tracked (pt) and fixed (pf) PV platforms on 29 June 2022.
Energies 16 01229 g012
Figure 13. Solar global irradiance received by the tracked (Gnt) and fixed (Gnf) PV platforms on 12 January 2022.
Energies 16 01229 g013
Figure 14. Specific electrical output of the tracked (pt) and fixed (pf) PV platforms on 12 January 2022.
Energies 16 01229 g014
Figure 15. Solar global irradiance received by the tracked (Gnt) and fixed (Gnf) PV platforms on 23 December 2021.
Energies 16 01229 g015
Figure 16. Specific electrical output of the tracked (pt) and fixed (pf) PV platforms on 23 December 2021.
Energies 16 01229 g016
Figure 17. The monthly energy yield of the fixed and tracked PV platforms.
Energies 16 01229 g017
Figure 18. The monthly solar conversion efficiencies of the fixed and tracked PV platforms.
Energies 16 01229 g018
Figure 19. The monthly electrical energy output of the fixed photovoltaic modules.
Energies 16 01229 g019
Figure 20. The monthly electrical energy output of the tracked photovoltaic modules.
Energies 16 01229 g020
Figure 21. Monthly relative electrical energy gain of the tracked vs. fixed PV modules.
Energies 16 01229 g021
Figure 22. The monthly solar conversion efficiencies of the fixed photovoltaic modules.
Energies 16 01229 g022
Figure 23. The monthly solar conversion efficiencies of the tracked photovoltaic modules.
Energies 16 01229 g023
Table 1. Main parameters of the studied literature.
PaperClimate *LocationTime IntervalPV Type/TechnologyPV SystemPosition
[12]temperateIfrane,
Morocco
ϕ = 33.5°
6 years
(Jan. 2015–Dec. 2020)
m-Si, p-Si, a-SiFixed tilted 32°, south
[13]temperate/continentalFukushima,
Japan
ϕ = 37.8°
2 yearsm-Si, p-Si, a-Si, CIGS
(30 producers)
Fixed tilted 20°
[14]temperateJaén,
Spain
ϕ = 37.8°
6.5 yearsa-Si, a-Si/μc-Si,
CdTe, CIGS
Fixed tilted 30°, south
[15]temperateGurgaon,
India
ϕ = 28.5°
-CdTeFixed, south
[16]tropicalSingapore,
Malaysia
ϕ = 1.4°
1 year
(2015)
p-Si, CIGSFixed tilted 10°
[17]tropicalKumasi,
Ghana
ϕ = 6.7°
14 monthsa-Si, m-Si, HIT,
CIS, p-Si
-
[18]tropicalKuala Lumpur, Malaysia
ϕ = 3.2°
1 year
(2014)
m-Si, CISFixed tilted 17°, south
[19]tropicalPekan,
Malaysia
ϕ = 3.5°
-c-Si, CIS, CdTe- (BIPV/BAPV)
[20]tropicalLahore,
Pakistan
ϕ = 31.5°
1 yearp-Si, CISFixed tilted:
30° (p-Si)
15° (CIS)
[21]drySaida,
Algeriaϕ = 34.8°
1 year
(2014)
m-Si, CIS, HIT,
m-Si (B-C), a-Si/μc-Si
Fixed tilted 30°, south
[22]dryGhardaia,
Algeria
ϕ = 32.5°
1 year
(May 2015–Apr. 2016)
m-Si, p-Si, a-Si, CdTe-
[23]dryKuwait
ϕ = 29.5°
1 year
(2014)
m-Si, p-Si, HIT, CdTe,
CIGS, cyl. CIGS, a-Si
South,
fixed tilted:
0° (cyl. CIGS, a-Si)
20° (rest)
[24]temperateIfrane,
Morocco
ϕ = 33.5°
4 years
(Oct. 2014–Dec. 2018)
m-Si, p-Si, a-SiFixed tilted 32°, south
[25]temperateMadrid,
Spain
ϕ = 40.4°
1 year
(Dec. 2014–Dec. 2015)
p-Si, a-Si, CdTeFixed tilted 30°,
Azimuth angle: 3°
[26]temperateShanghai,
China
ϕ = 31.3°
3 years
(2016–2018)
bi- and monofacial HIT, CIGS, n-type multi-busbar, m-Si and p-Si PERC, CdTeFixed tilted 30°, south
[27]continentalBuštěhrad,
Czech Republic
ϕ = 50.1°
2 years
(Aug. 2015–Sep. 2017)
CdTe, m-Si, p-SiAzimuth angle 158°
Fixed on facades:
90° (m-Si, p-Si)
75° (CdTe)
[28]continentalBrașov,
Romania
ϕ = 45.67°
1 year
(2015)
m-Si, p-Si, CIS,
CIGS, CdTe
Fixed tilted 47.3°, south
[29]continentalBrașov,
Romania
ϕ = 45.67°
1 year
(Jun. 2018–Jul. 2019)
p-SiFixed tilted 40°, south vs. dual-axis tracker
* according to Köppen climate classification. https://www.britannica.com/science/Koppen-climate-classification. Accessed on 14 January 2023.
Table 2. Characteristics of the photovoltaic modules under Standard Test Conditions (STC) *.
NameUnitm-Sip-SiCIGSCISCdTe
Manufacturer HelieneLDKSolibroAvancisCalyxo
Model HEE215M250P-20SL2-120PS 125CX3-80
Maximum powerWp25025012012580
Power tolerance%±3±3−0/+5−0/+4-
Voltage at maximum powerV30.830.276.943.847.0
Current at maximum powerA8.128.281.562.851.72
Module open-circuit voltageV37.437.597.659.162.8
Module short-circuit currentA8.678.591.693.242.01
Temperature coefficient at Pmax°C−10.00440.00450.00380.00390.0025
Module aream21.391.460.890.960.673
Nominal efficiency%17.9417.1213.5413.0411.89
* Standard Test Conditions (1000 W/m2, 25 °C, AM = 1.5).
Disclaimer/Publisher’s Note: The statements, opinions and data contained in all publications are solely those of the individual author(s) and contributor(s) and not of MDPI and/or the editor(s). MDPI and/or the editor(s) disclaim responsibility for any injury to people or property resulting from any ideas, methods, instructions or products referred to in the content.

