Article

Efficiency of Polish Energy Companies in the Context of EU Climate Policy

by
Tomasz L. Nawrocki
and
Izabela Jonek-Kowalska
*
Faculty of Organization and Management, The Silesian University of Technology, 41-800 Zabrze, Poland
*
Author to whom correspondence should be addressed.
Energies 2023, 16(2), 826; https://doi.org/10.3390/en16020826
Submission received: 28 November 2022 / Revised: 31 December 2022 / Accepted: 3 January 2023 / Published: 11 January 2023
(This article belongs to the Special Issue Energy Consumption in the EU Countries II)

Abstract

:
The purpose of this article is to assess the impact of carbon allowances on the financial performance and strategic behavior of Polish energy companies listed on the Warsaw Stock Exchange, with a particular focus on the period when the price of these allowances increased. The eight largest Polish energy companies were surveyed, and the research period covered the period of 2010–2021. The research process used an analysis of financial condition and its determinants in the current and long-term perspective. In the current approach, the following were used: sales margin, operating margin, and cost and revenue structure. In the long-term approach, an assessment of the regularity of the capital structure and debt ratios was used. In both research perspectives, the results were confronted with the structure of power generation sources and the segmentation of the core business, including production, distribution, and trading. The results allow us to conclude that the increase in the price of emission allowances has adversely and most strongly affected companies focused on energy generation from high-carbon sources.

1. Introduction

The challenges of climate protection are extremely demanding and difficult [1,2]. The main reason for this is the need for radical changes in energy systems, which requires access to modern technologies and significant financial resources [3,4]. In addition, the energy transition requires proper planning and long-term effort and the involvement of both national and local governments and society as a whole [5,6,7]. In addition, its effects do not bring direct economic benefits, so it does not fit into the trend of increasing consumption and the rush for technological and civilizational progress.
The above challenges are intensified in emerging and developing economies due to their attachment to conventional and non-renewable energy fuels (mainly coal), technological and financial shortcomings, high levels of energy poverty, and low public environmental awareness [8,9,10,11,12]. These problems are highlighted in emerging European economies by, among others, Bublyk et al. (2021) [8] and Grosse (2011) [9]. In addition, Lin et al. (2022) [10], Kumar (2010) [11], and Nguyen et al. (2020) [12] also describe them in other regions of the world. The lack of energy strategies and/or the ineffectiveness of their implementation, or the instability of implemented legal solutions, can also be an impediment to achieving climate goals in these economies [13].
It is worth noting, however, that both attachment and attention to climate protection vary widely across the world’s geographic regions [14]. A real dimension of these differences is undoubtedly the scope, stringency, and commonality of environmental regulations in force in a given region. From this point of view, the European Union’s pro-environmental policy should be considered the most demanding on a global scale [15,16]. It has been implemented and tightened systematically for several decades, and its effects are intended to lead to zero greenhouse gas emissions in EU countries in 2050.
The realization of the above goal is served not only by indirect instruments of influence, including EU regulations, promotion of renewable energy sources, or pro-environmental education [17,18] but also, and perhaps most importantly, by direct financial restrictions [19,20,21]. The most radical of these is the carbon allowance system (CO2). This is an instrument that is used continuously (as opposed to penalties, which are generally used incidentally) and is systematically modified depending on the effects of its use and its impact on real reductions in greenhouse gas emissions.
The introduction and operation of the CO2 allowance system is expected to force the energy sectors and the companies operating in them in each country to systematically shift from high-carbon energy sources to low-carbon sources, including primarily renewables [22,23]. This is because the need to purchase allowances involves incurring additional and non-productive costs that negatively affect the financial performance and profitability of energy companies. Avoiding these costs, however, is possible and feasible by taking real measures to reduce greenhouse gas emissions, including, first and foremost, transforming companies’ individual energy mixes and replacing carbon-intensive sources with low- or zero-emission fuels [24,25].
Given the aforementioned circumstances, in this article, the authors intend to evaluate the impact of the use of carbon emission allowances on the condition and strategic behavior of Polish energy companies listed on the Warsaw Stock Exchange, with special attention to the period in which the price increase of these allowances occurred. In the course of the research thus defined, an answer is sought to the following research problem: whether and to what extent the increase in the price of CO2 emission allowances affected the financial condition and strategic behavior of Polish energy companies listed on the Warsaw Stock Exchange.
An analysis of the financial condition of the eight largest energy groups and thermal power plants listed on the Warsaw Stock Exchange was used to achieve the goal thus set and to solve the research problem indicated. It was conducted from two research perspectives: (1) current and (2) long-term. In the first, financial parameters such as sales margin, operating margin, and cost and revenue structure were used. In the other perspective, an assessment of the regularity of the capital structure and debt ratios was used.
The originality of the research results from the following circumstances:
  • Embedding considerations at the company level, while most studies on the impact of EU climate policy look at entire economies or sectors;
  • To conduct an analysis of the strategic behavior and financial performance of energy companies forced by the need to purchase carbon allowances—such studies are not a common subject of consideration in the energy economics stream;
  • To make an indirect assessment of the effectiveness of the introduction and tightening of emissions trading on the activities of energy companies in reducing greenhouse gas emissions.
The contributions of this research to the economics of the energy sector are as follows:
  • Empirical conclusions on Polish energy companies’ adaptation strategies to EU climate policy;
  • Observations on the financial impact of the introduction and increase in the price of emission allowances in the operations of Polish energy companies;
  • Sectoral and economic recommendations aimed at developing low-carbon energy while maintaining national energy security in Poland.
The value of the above analyses and conclusions is further strengthened by the location of considerations in the Polish energy sector, which has been supplied by hard coal and lignite mining for many years, and whose transformation has been extremely slow. This allows us to analyze the observed trends in a broader economic context providing a basis for recommendations for Poland’s current and future energy policy.
The research presented in this article was conducted in Poland, but due to the fact that it concerns the EU climate policy, it may be a premise for other analyzes in emerging and developing economies. The obtained results can also be an important recommendation both for the effectiveness of CO2 reduction and for creating strategies for energy companies in the European Union and other regions applying emission restrictions.
The layout of further considerations is subordinated to the research objectives formulated above. They begin with a review of the literature on two key themes, that is, CO2 allowances as an instrument of climate protection policy and their impact on the functioning of the economy and its participants. This is followed by a presentation of the research methodology adopted, along with the characteristics of the sector and the companies surveyed. The results section is divided into three subsections: (1) the structure of the generation sources and business segments of the surveyed companies; (2) the impact of emission allowances on current financial performance; and (3) the impact of emission allowances on long-term financial health. The discussion follows, with reference to the results of the research to date and recommendations for the companies, the sector, and the economy under study. In conclusion, the most relevant theoretical and research conclusions are cited, and limitations and directions for further research in the area in question are given.

2. Literature Studies

2.1. CO2 Allowances as a Climate Policy Instrument

The European Union has been actively working for many years to protect the climate, including, in particular, improving air quality and reducing greenhouse gas emissions [26,27]. A tangible expression of these actions is the successive climate packages, which assume a systematic reduction in CO2 of 20% by 2020, 40% by 2030, and 100% (zero-carbon economy) by 2050 [28,29]. These are very ambitious targets and require significant changes in the energy systems of especially those countries that, prior to 1997 (signing of the Kyoto Protocol), primarily used conventional non-renewable fuels in their energy mixes.
The carbon trading scheme was introduced in 2005 as a direct instrument for the European Union to influence the reduction of greenhouse gas emissions in individual national energy sectors [30]. It was implemented in stages so that, on the one hand, the effects of its use could be observed, and on the other hand, it gave companies a chance to adapt to the new system and economic conditions. These stages included the following phases:
(1)
The test phase (2005–2007) necessary to pilot the system and establish the infrastructure to operate it [31,32];
(2)
The original launch phase (2008–2012) and a slow reduction in the allocation of free emission allowances;
(3)
The improving operations phase (2013–2020) and further reducing access to free allowances combined with the radicalization of the system under the influence of the pro-environmental business lobby [33,34];
(4)
The tightening regulations phase (2021-present) oriented towards reaching a zero-carbon economy in 2050.
Companies that emit greenhouse gases are entitled to a pool of free allowances, which is, however, systematically reduced in order to accelerate and make more efficient the process of reducing CO2. If the volume of their emissions exceeds the free limits, then companies can purchase additional allowances on the European Energy Exchange or from another entity holding surplus allowances [35].
Proceeds from emissions trading go to member states, which are required to spend at least half of them on pro-environmental measures to prevent climate change. In addition, the European Investment Bank issues 300 million emission allowances to newly built systems. Proceeds from this emission create a fund to finance innovative demonstration projects on carbon capture and storage capabilities and the use of renewable energy sources. Thus, in the manner described above, both the penalization of environmentally degrading activities and the financing of climate protection initiatives are implemented [36].
It is also worth mentioning that the CO2 scheme provides additional pillars of support for EU countries that, for infrastructural or economic reasons, may fare less well in the energy transition process [37,38,39]. These include [36]:
  • The Solidarity Mechanism, which allocates 10% of all auction allowances to countries having difficulty adapting to climate policy (16 countries use it, including Poland to the greatest extent);
  • The Modernization Fund, which covers 2% of emissions of all allowances and is ear-marked for climate projects in the least prosperous EU countries (Poland is the largest beneficiary of this fund).
It follows, therefore, that Poland, as a member state, is receiving significant support to level the playing field for effective, pro-environmental energy policies. For these reasons, it is worth looking at the paths of energy companies in Poland under conditions of systematically tightening climate policy, but also in the context of legislative and financial support provided under the emissions regime for emerging and developing economies.

2.2. Impact of CO2 on the Functioning of the Economy and Its Participants

As mentioned in the introduction, the literature contains quite a number of studies and conclusions on the operation of emission systems for allowances implemented and operating in the Chinese economy. Far fewer publications deal with other regions, including the European Union. The following is an overview of the most important of these relating to the impact of ETS on business operations.
Thus, one of the threads taken up in the context of the impact of emission financial restrictions on companies is the assessment of their effectiveness, that is, their ability to force companies to reduce CO2. In this context, Zhang et al. (2015) [40], using the example of companies operating in the Chinese economy, conclude that the regional CO2 system has had a positive impact on reducing greenhouse gas emissions. It has also contributed to an increase in buyers’ environmental awareness and their orientation toward purchasing products created using low-carbon technologies. The authors also emphasize that state subsidies have been and remain an important factor in encouraging companies to make the energy transition.
Similar conclusions were reached by Zhi et al. (2022) [41] in their study conducted after the introduction of a sulfur dioxide emissions trading system in China. The authors conclude that the system has the desired effect of lower emissions and accelerates the process of increasing the use of renewable and low-carbon energy sources in production processes. In addition, the use of such a solution also has a beneficial effect on production efficiency and contributes to the promotion of environmentally friendly energy solutions in the economy.
In turn, a study by Wang et al. (2022) [42] covering seven Chinese pilot emission allowance schemes shows that their effectiveness is affected by three key elements: the ability of companies to reduce GHG emissions, the stability of the economic system, and the limits on free allowances. The authors also emphasize that the negative effects of ETS implementation on companies can be mitigated by pre-assessing their abatement capacity and controlling allowance prices so that the majority of companies covered by the system can pay them without undue burdens on their bottom line.
In addition to the effectiveness of ETSs, the literature also attempts to determine their impact on innovation and competitiveness. Thus, a study by Wei et al. (2022) [43] shows that there is a price limit up to which companies are reluctant to change their production strategies, but beyond which, the rate of exploration and implementation of green innovations definitely increases. This finding suggests that tightening financial restrictions improves business innovation and accelerates the process of reducing CO2. Nevertheless, the authors also argue that excessive price increases to emission allowances can worsen companies’ financial performance and competitiveness. Therefore, finding the optimal level of prices for emission allowances is of utmost importance, as it can bring maximum economic benefits and guarantee above-average operating profit for companies investing in green technologies.
In addition, a study of a sample of 86 Chinese enterprises by He et al. (2023) [44] shows that the introduction of the emission allowance system has helped to increase the innovativeness of high-carbon enterprises, which have been more willing to implement green technologies than before the introduction of the system. At the same time, the authors signal that the realization of this effect is deferred, with a postponement period of about a year.
However, not all publications confirm the positive consequences and effectiveness of the implementation of emission allowance systems. Indeed, Park’s (2020) [45] research in South Korea shows that the introduction of the CO2 allowance system did not accelerate investment in green technologies in Korean enterprises. This finding was especially true for large enterprises. According to the authors, the energy transition process can be more effectively accelerated by providing technological support and raising environmental awareness among companies and the public.
Similar conclusions were reached by Yang et al. (2016) [46], who conducted a survey of Chinese companies on the perception and use of the emission allowance system shortly after its implementation. Their results lead them to conclude that the system does not provide enough incentive to implement green innovations, and companies use it mainly to improve their image and deal with government institutions. Therefore, it fails to meet the hopes placed in it.
Going even further in their assessment are Chen et al. (2021) [47], who expose the negative effects of the introduction of an emission allowance system. Their research shows that due to the reduction in free cash flow—associated with the need to purchase allowances—companies are abandoning investments and not only environmental ones. Small and medium-sized companies are very often even forced to reduce production due to increased operating costs. Many companies are forgoing investment in research and development, which is certainly not conducive to the development of green innovations.
The financial impact of the introduction of the ETS is also the focus of Hi et al. (2022) [48], who undertook to determine the impact of the greenhouse gas emission allowance system on the operating performance and value of Chinese companies. Their study of 1267 companies showed that the introduction of the scheme did not have a significant impact on the financial performance of the companies surveyed, but it did contribute to a decline in the market value (stock market listing) of the companies surveyed over a two-year period. This was the reaction of investors to the increased market risk associated with the introduction of additional financial burdens. After two years, the strength of this negative impact weakened. Nevertheless, the authors emphasize that despite the described negative and short-term side effects, the emission allowance systems induce companies to invest in green technologies and, in the long term, effectively reduce carbon emissions contributing to climate protection.
A similar study was conducted in the European economy by Paramati et al. (2012) [49], who focused on assessing the impact of tightening financial restrictions in the first and second phases of the implementation of the European Union’s emission allowance system on the value of European electric corporations. Their study shows that the first relatively mild phase did not change the market value of the companies surveyed. Unfortunately, in the second, more repressive phase, there was a depreciation in the value of the corporations surveyed; however, only then was there an effective reduction in the greenhouse gases they emitted.
Wang and Zhang (2022) [50], on the other hand, state that the emission allowance system negatively affects the operating costs of companies using carbon-intensive energy sources and consequently leads to a significant reduction in their competitiveness. In the Chinese economy, this is primarily the case for state-owned enterprises using hard coal for energy production.
In an assessment of the impact of the ETS on businesses in the European Union, Spassov et al. (2011) [51], describing the operation of the ETS in the initial phase of its introduction in Bulgaria, found that it did not have the desired effect due to the large pool of non-refundable allowances. As a result of their allocation, companies disregarded the need to reduce CO2 emissions feeling secure and safe. The implementation of the ETS has also failed to improve the innovativeness of Bulgarian companies due to the lack of coordination in this regard at the level of state authorities.
Similar results are obtained by Howie and Atakhanova (2022) [52] based on a survey of Kazakh companies. They show that the implementation of the system of emission allowances has proved economically ineffective and has not reduced carbon emissions, which continue to have an upward trend. According to the authors, this is primarily due to the lack of sufficient control over the mechanism for passing on the cost of acquiring allowances and the importance of large state-owned fossil fuel mining companies to Kazakhstan’s economy.
A geographically and thematically more extensive literature review by Joltreau and Sommerfeld (2019) [53] on the impact of the EU ETS on companies, on the other hand, shows that in the first two phases of its introduction, there were virtually no negative effects on competitiveness. According to the authors, this was due to the liberal and over-allocation of free allocations and, consequently, low demand and low prices for paid emission allowances. At the time, companies also did not pass on rising costs to final consumers. It is also worth mentioning that the system also achieved its goals, as companies reduced their greenhouse gas emissions. The authors also noted a positive effect of the ETS on corporate innovation, but it was rather small.
It is also worth noting the contestation of Beule et al. (2022) [54], who, in the course of their research, expose the negative side effects of the introduction of the emission allowance system. According to the authors, these effects are not only related to the possibility of the flight of emissions themselves to areas not subject to European Union restrictions but also result in the flight of carbon-intensive investments to pollution havens where emissions trading does not apply. This is an important observation and highly relevant to the dialogue on making global low-carbon policies more coherent.
Summarizing the above literature review, it can be concluded that the introduction of an emission allowance system has the desired effect of reducing greenhouse gases. This effect generally increases as the price of emission allowances increases. However, once the price exceeds the price that is acceptable to companies and represents a serious cost burden for them, we may face carbon and investment flight and a deterioration in the competitiveness of companies.
In addition, the effectiveness of the ETS is determined by the willingness and ability of companies to make the energy transition, the size of the limits on free allowances, and the economic situation of a country. This means that the effects of the implementation of the ETS can vary strongly geopolitically. This is confirmed by the examples of Bulgaria and Kazakhstan cited above—emerging economies where, despite the introduction of the ETS, CO2 reductions have not been achieved.
In the context of the above considerations, there is a need to identify the behavior and financial impact of the introduction of an emissions allowance system on companies in the European Union region, including emerging and developing economies in particular [55,56]. Filling this research gap will, on the one hand, enable a better understanding of the motives and actions of companies and, on the other hand, provide a basis for improving climate policies aimed at reducing greenhouse gas emissions [57,58].

3. Materials and Methods

3.1. Characteristics of the Sector and the Companies Surveyed

As already mentioned, this research was conducted in the Polish energy sector using the example of 8 companies listed on the Warsaw Stock Exchange. It is worth mentioning at this point that Poland’s power sector has been using hard coal and lignite for years, and this still remains the dominant source of energy in the Polish energy mix [59] because significant amounts of hard coal are still mined in Poland [60]. It is also an important source of energy in production processes [61] in heavy industry, which dominates the Polish economy [62]. It is supplemented by natural gas, and the use of renewable sources is at a low level (wind, solar, and biomass). All this means that Poland—like some EU emerging and developing countries—is struggling to adapt to EU environmental requirements [63,64,65]. This is due to the lack of adequate infrastructure and financial resources to modify it, as well as the lack of a permanent, consistently implemented energy policy [66,67]. Currently—as a result of the Ukrainian-Russian armed conflict—Poland has taken steps to build two nuclear power plants, which in the future would provide it with better low-carbon performance and allow it to become independent from foreign supplies of solid fuels and energy. However, the effect of these measures—if implemented—will only be seen over the next dozen years or so. Due to the climate problems of emerging and developing economies described in the literature studies, the presented research methodology can also be used in relation to sectors and energy enterprises in countries other than Poland. Such an approach can be a valuable basis for international comparisons and broader reasoning.
Operation characteristics of the researched entities are shown in Table 1.

3.2. Research Stages and Methods

Research on the impact of the introduction of the emission allowance system was divided into three stages. In the first stage (I), reference was made to the structure of energy generation sources in the companies under study, taking into account low-carbon (gas + renewables) and high-emission carbon sources. Such a look made it possible to relate the results obtained to the modes of energy production and their changes over the period covered by the analysis. In addition, this stage also referred to the segments of the business (generation, trading, distribution, extraction) in order to determine what part of the activities of the analyzed groups is exposed to the market risk associated with the introduction and increase in the price of CO2.
In the second research stage (II), the current financial situation of energy companies was analyzed using the following equations:
(a)
Net margin on sales:
n e t   m a r g i n   o n   s a l e s = n e t   p r o f i t   o n   s a l e s   s a l e s   r e v e n u e s
(b)
Operating margin on sales:
o p e r a t i n g   m a r g i n   o n   s a l e s = E B I T s a l e s   r e v e n u e s
Due to data availability, the operating margin was calculated both overall and by business segment.
In addition, as part of this stage, the structure of the operating result by business segment was analyzed, as well as its determinants in the form of the structure of sales revenue (including individual segments) and costs by type, including cost level indicators.
In the third research stage (III), reference was made to the long-term financial situation of the surveyed companies assessed from the perspective of debt levels. For such an assessment, the following equations were used:
(a)
Coverage of fixed assets with fixed capital:
coverage of fixed assets with fixed capital = e q u i t y + l o n g   t e r m   d e b t f i x e d   a s s e t s
(b)
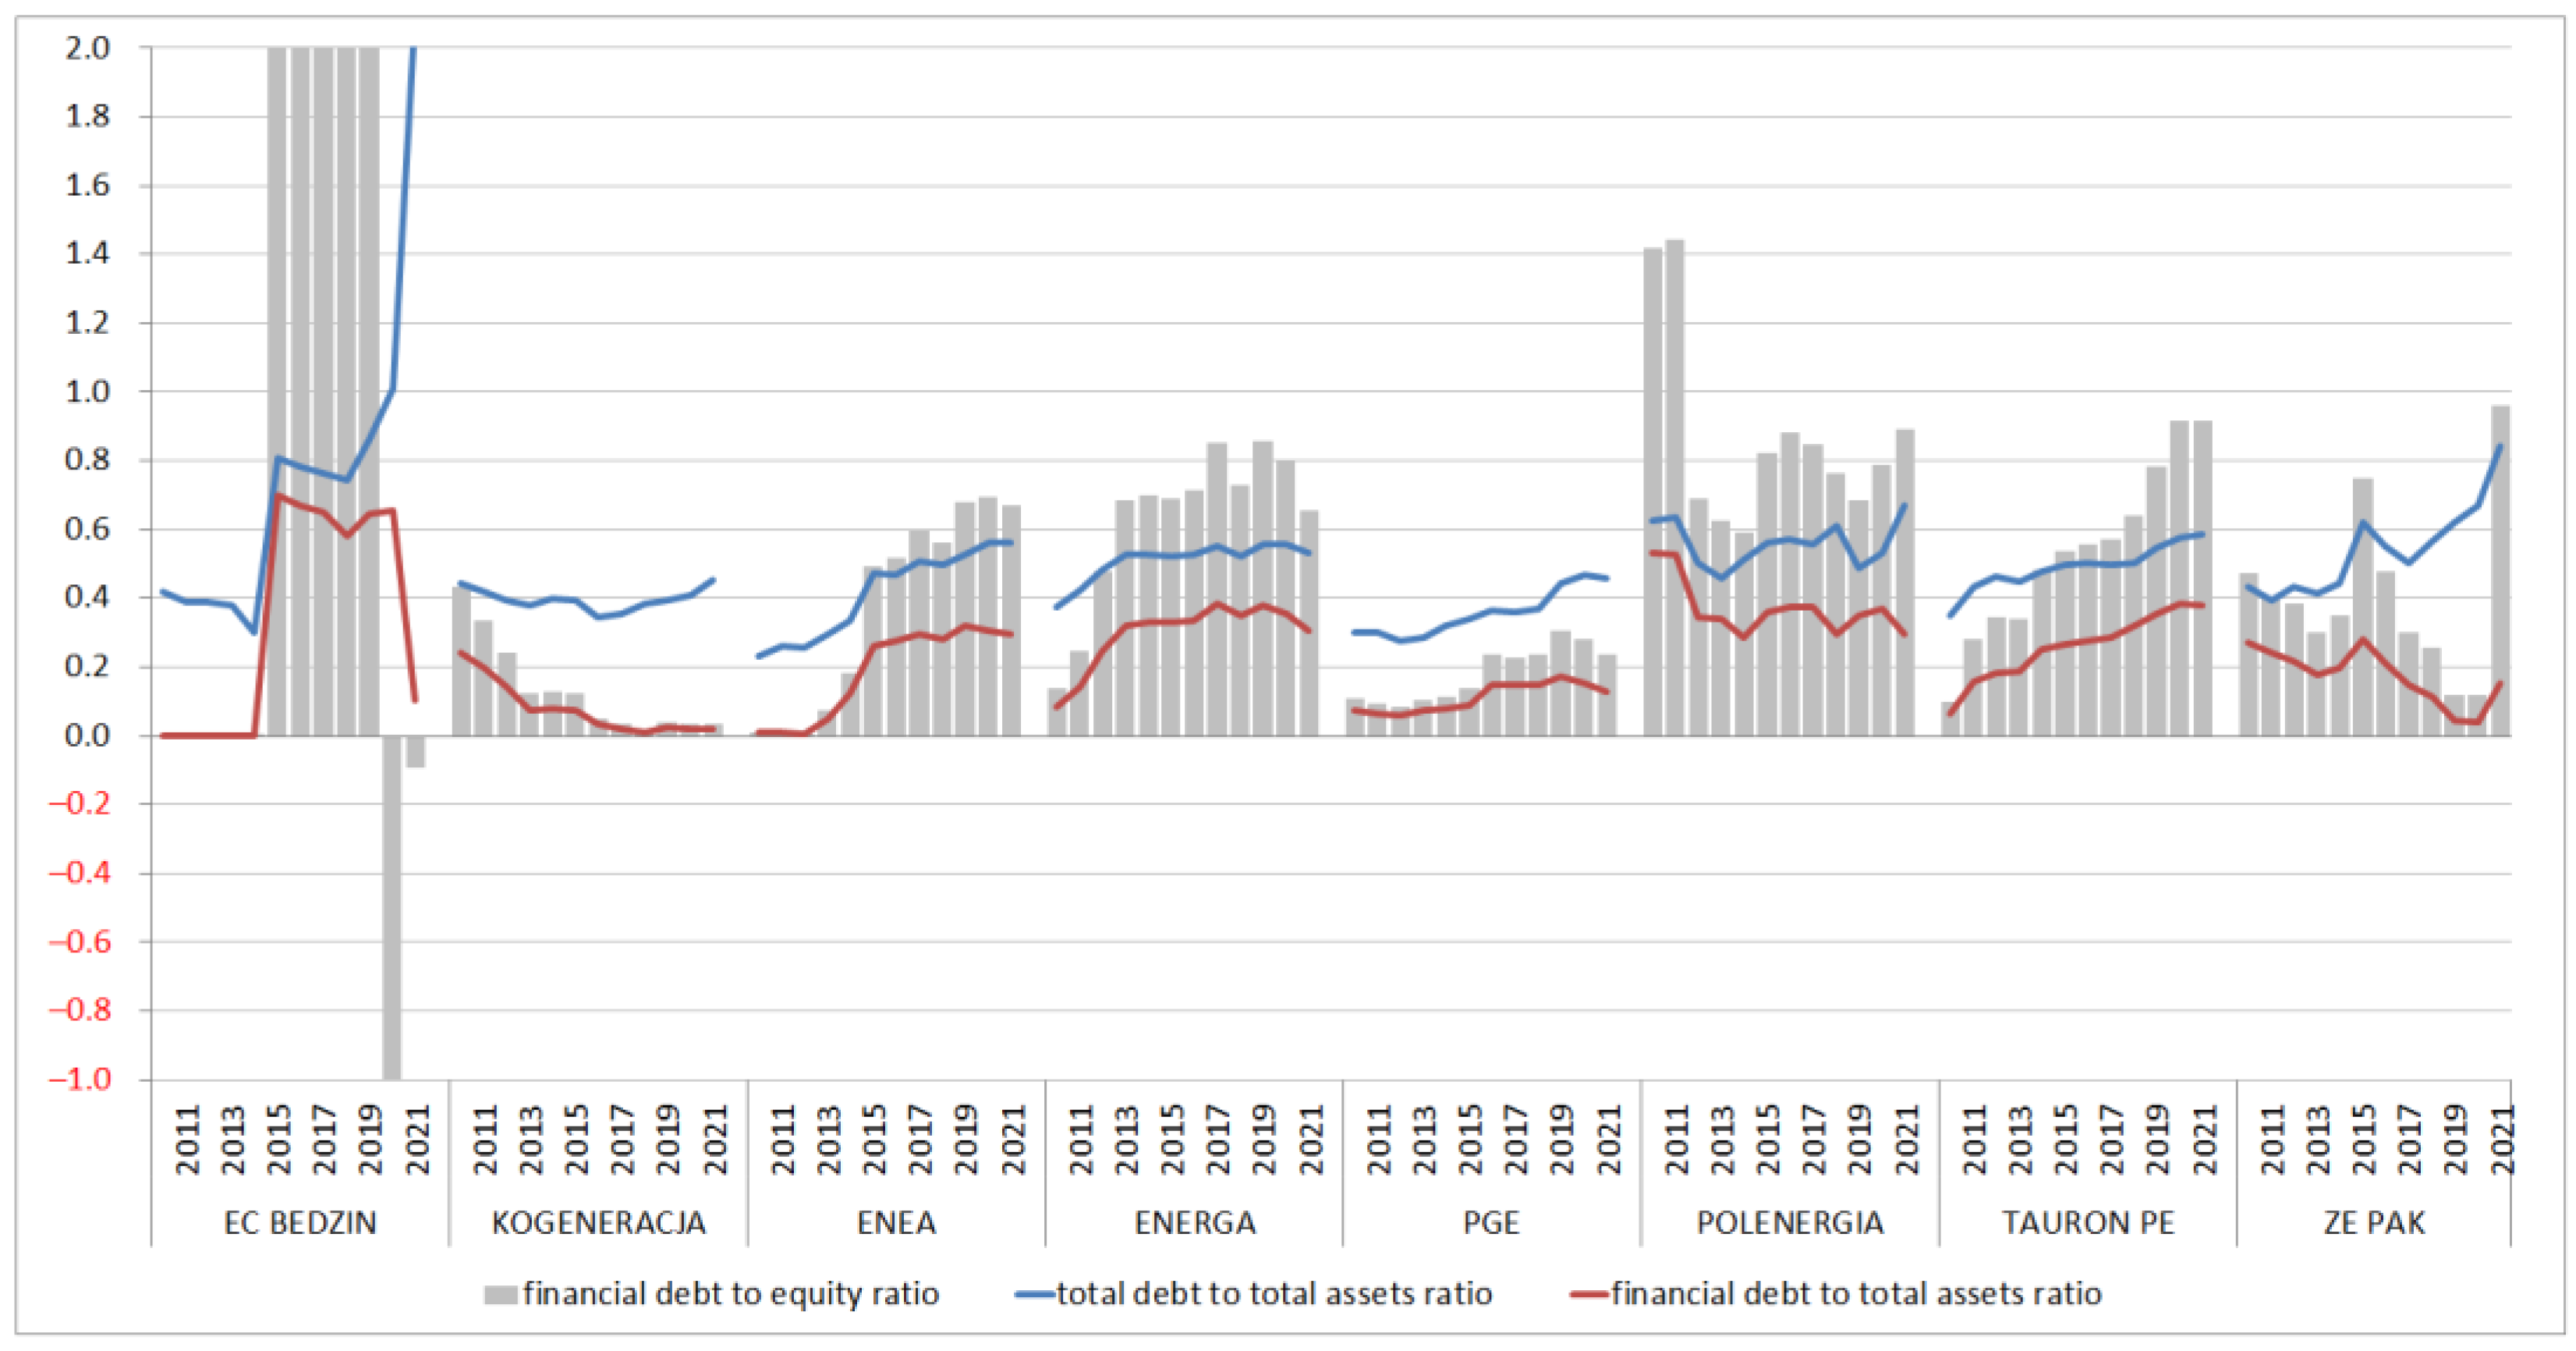
Financial debt-to-equity ratio:
f i n a n c i a l   d e b t   t o   e q u i t y   r a t i o = f i n a n c i a l   d e b t e q u i t y
(c)
Total debt-to-total-assets ratio:
t o t a l   d e b t   t o   t o t a l   a s s e t s   r a t i o = t o t a l   d e b t t o t a l   a s s e t s
(d)
Financial debt-to-total-assets ratio:
f i n a n c i a l   d e b t   t o   t o t a l   a s s e t s   r a t i o = f i n a n c i a l   d e b t t o t a l   a s s e t s
The study period covered 2010–2021, with special attention paid to the 2018–2021 sub-period when, due to the reduction of limits on free emission allowances, demand for them increased sharply, triggering significant and systematic price increases—Table 2.
Additionally, Figure 1 shows the level of CO2 emissions in the Polish economy in the period covered by the analysis. The presented data show that until 2014 the emission was systematically decreasing. Since 2014, it has been increasing to the level of 2010, which proves the ineffectiveness of climate policy. It was not until 2020 that CO2 emissions were reduced. It is worth noting that the renewed increase in emissions in 2018–2019 coincided with a sharp increase in ETS prices, which meant an accumulation of unfavorable climate trends for Poland.

4. Results

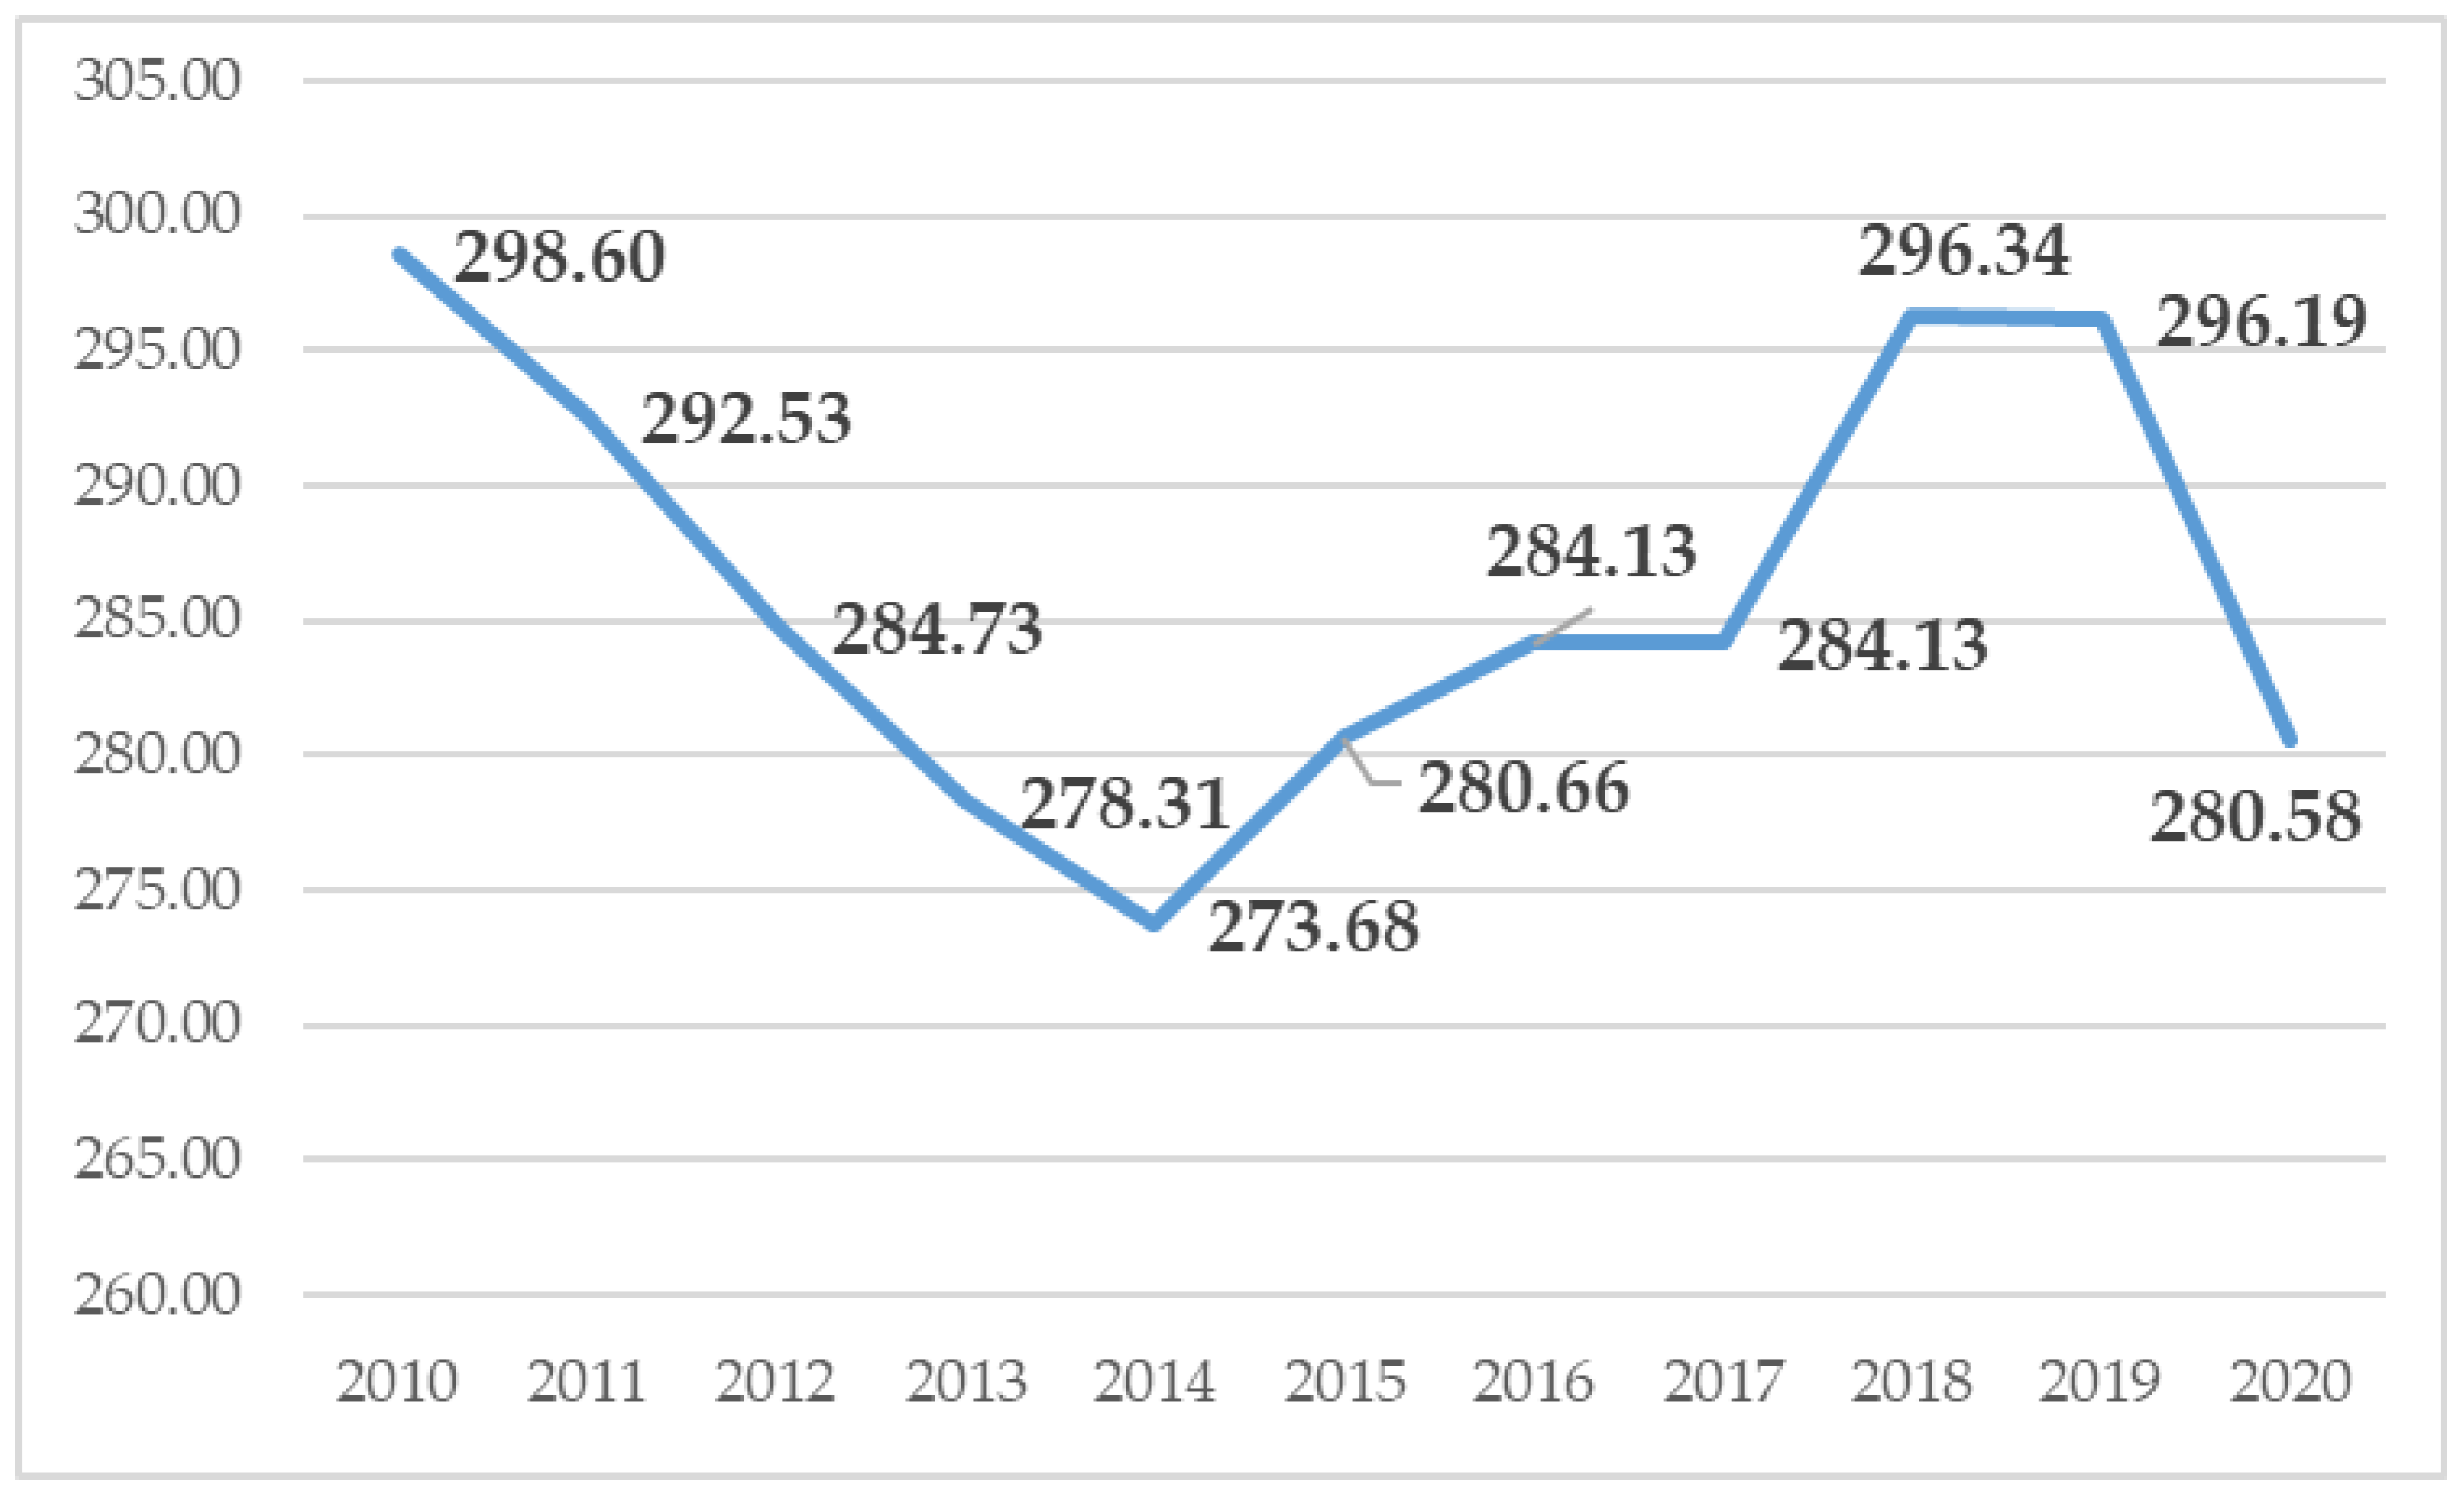
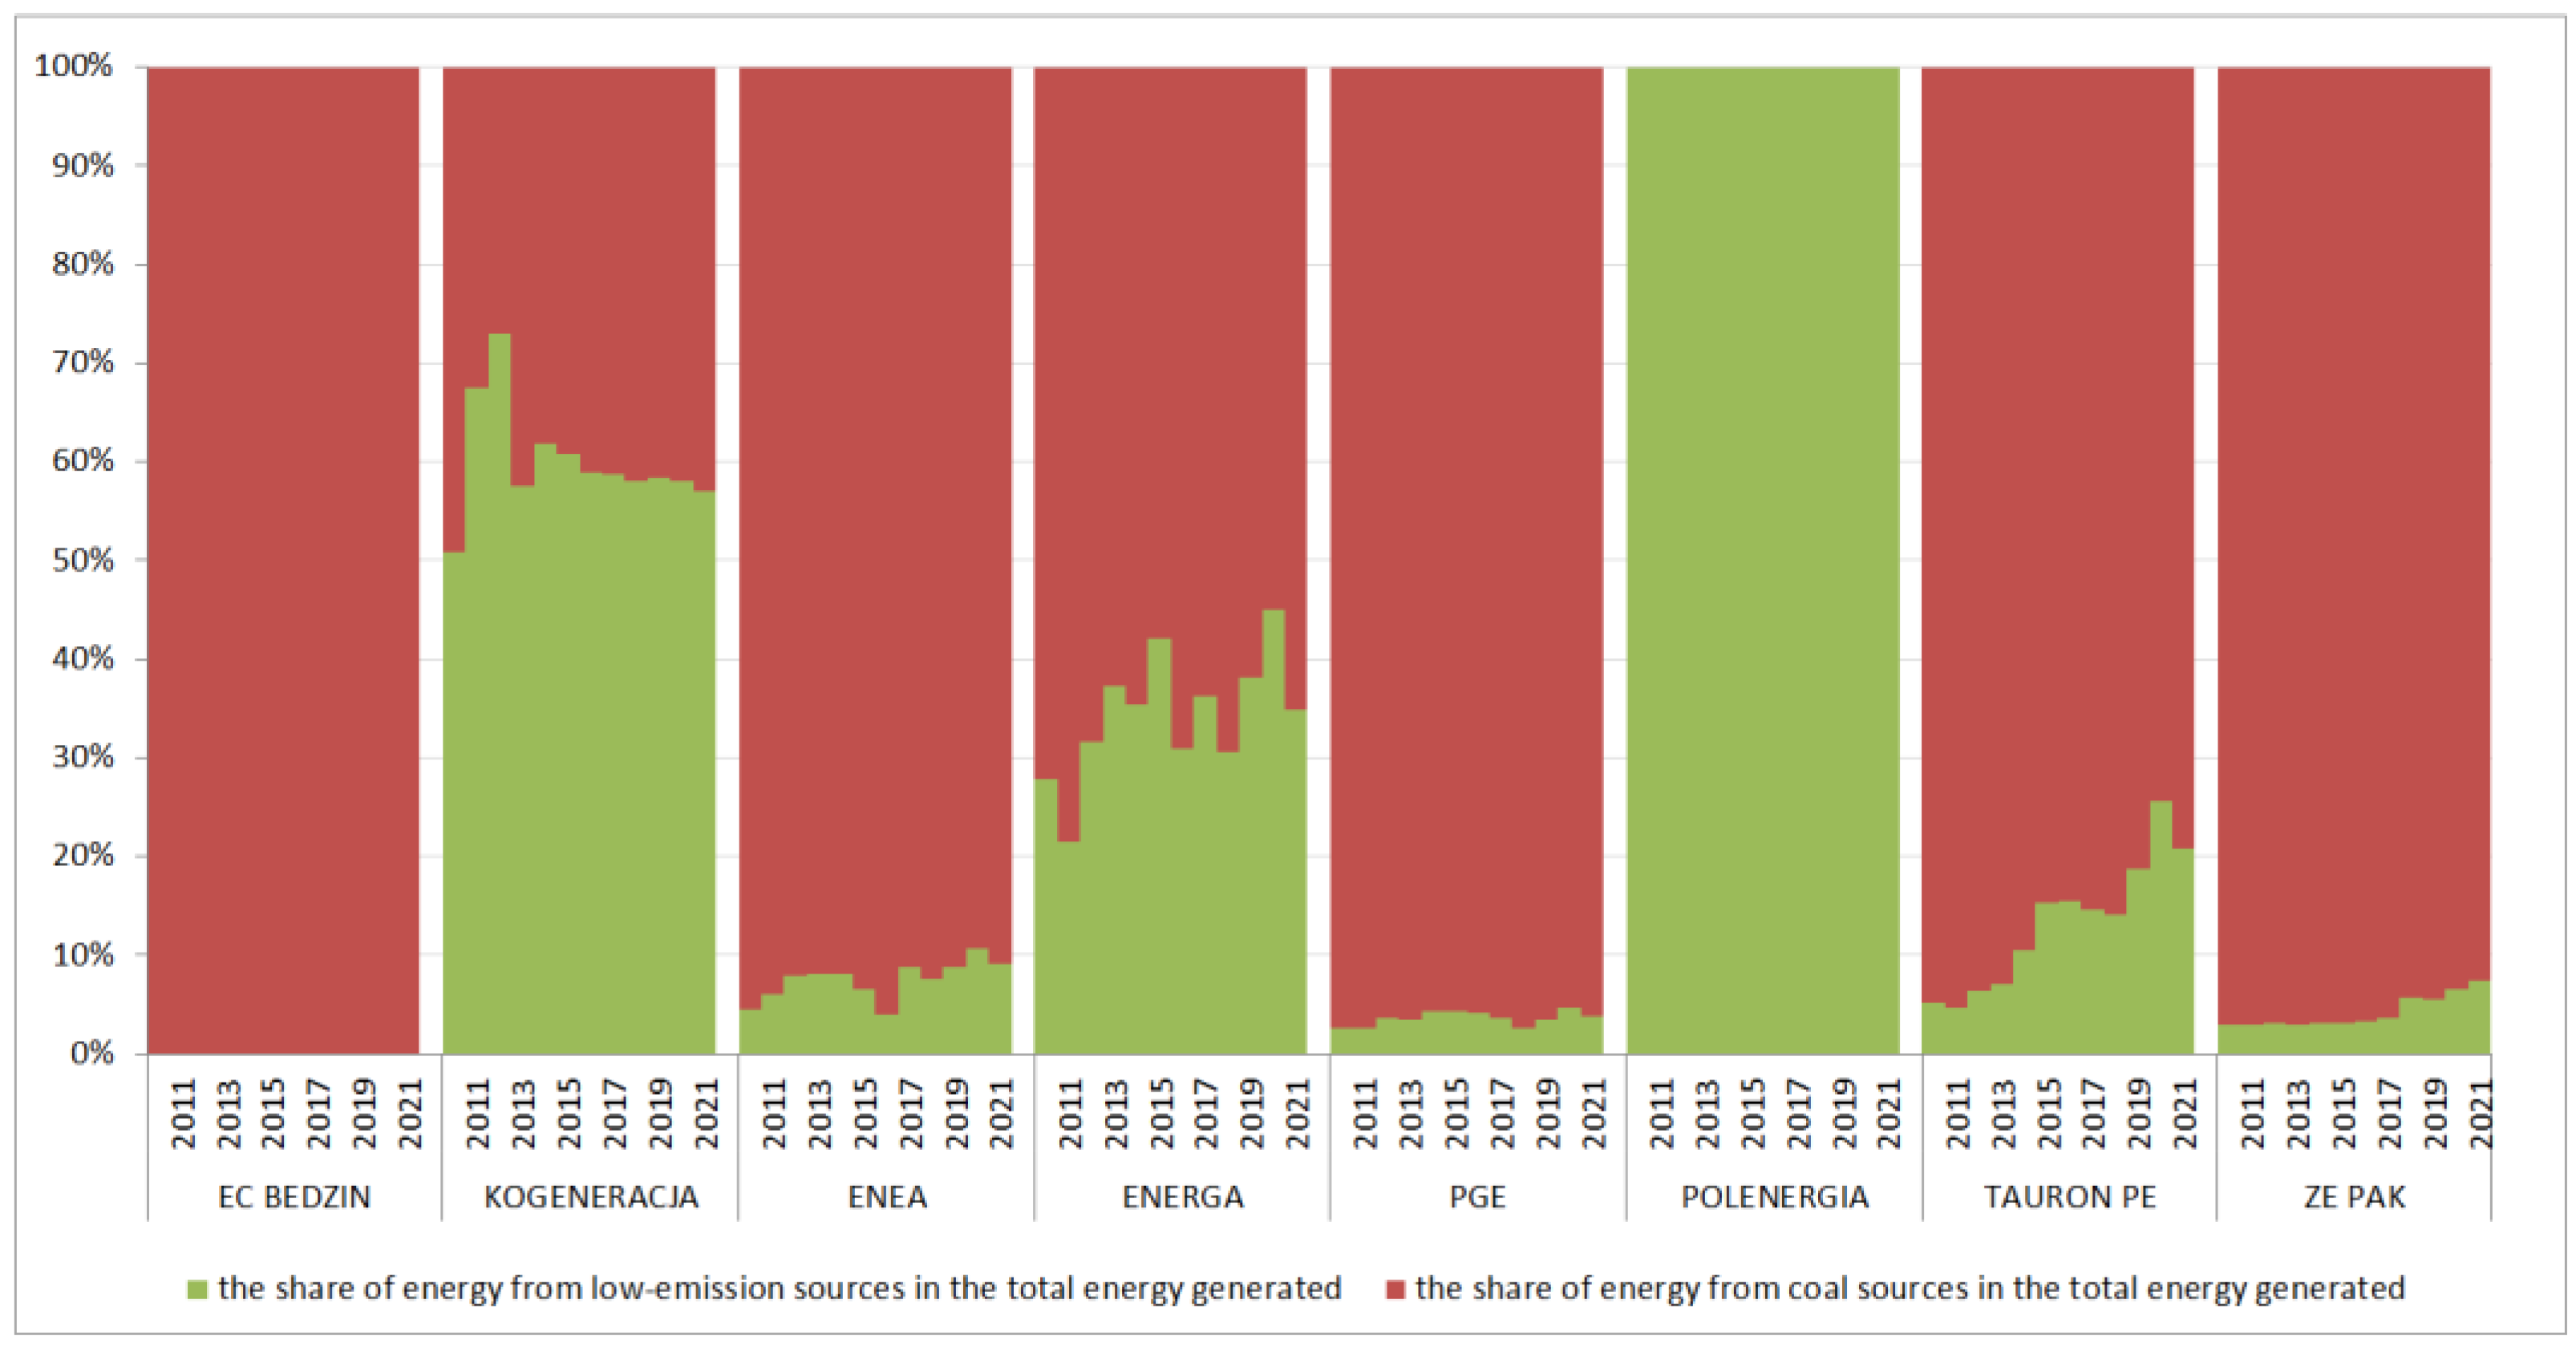
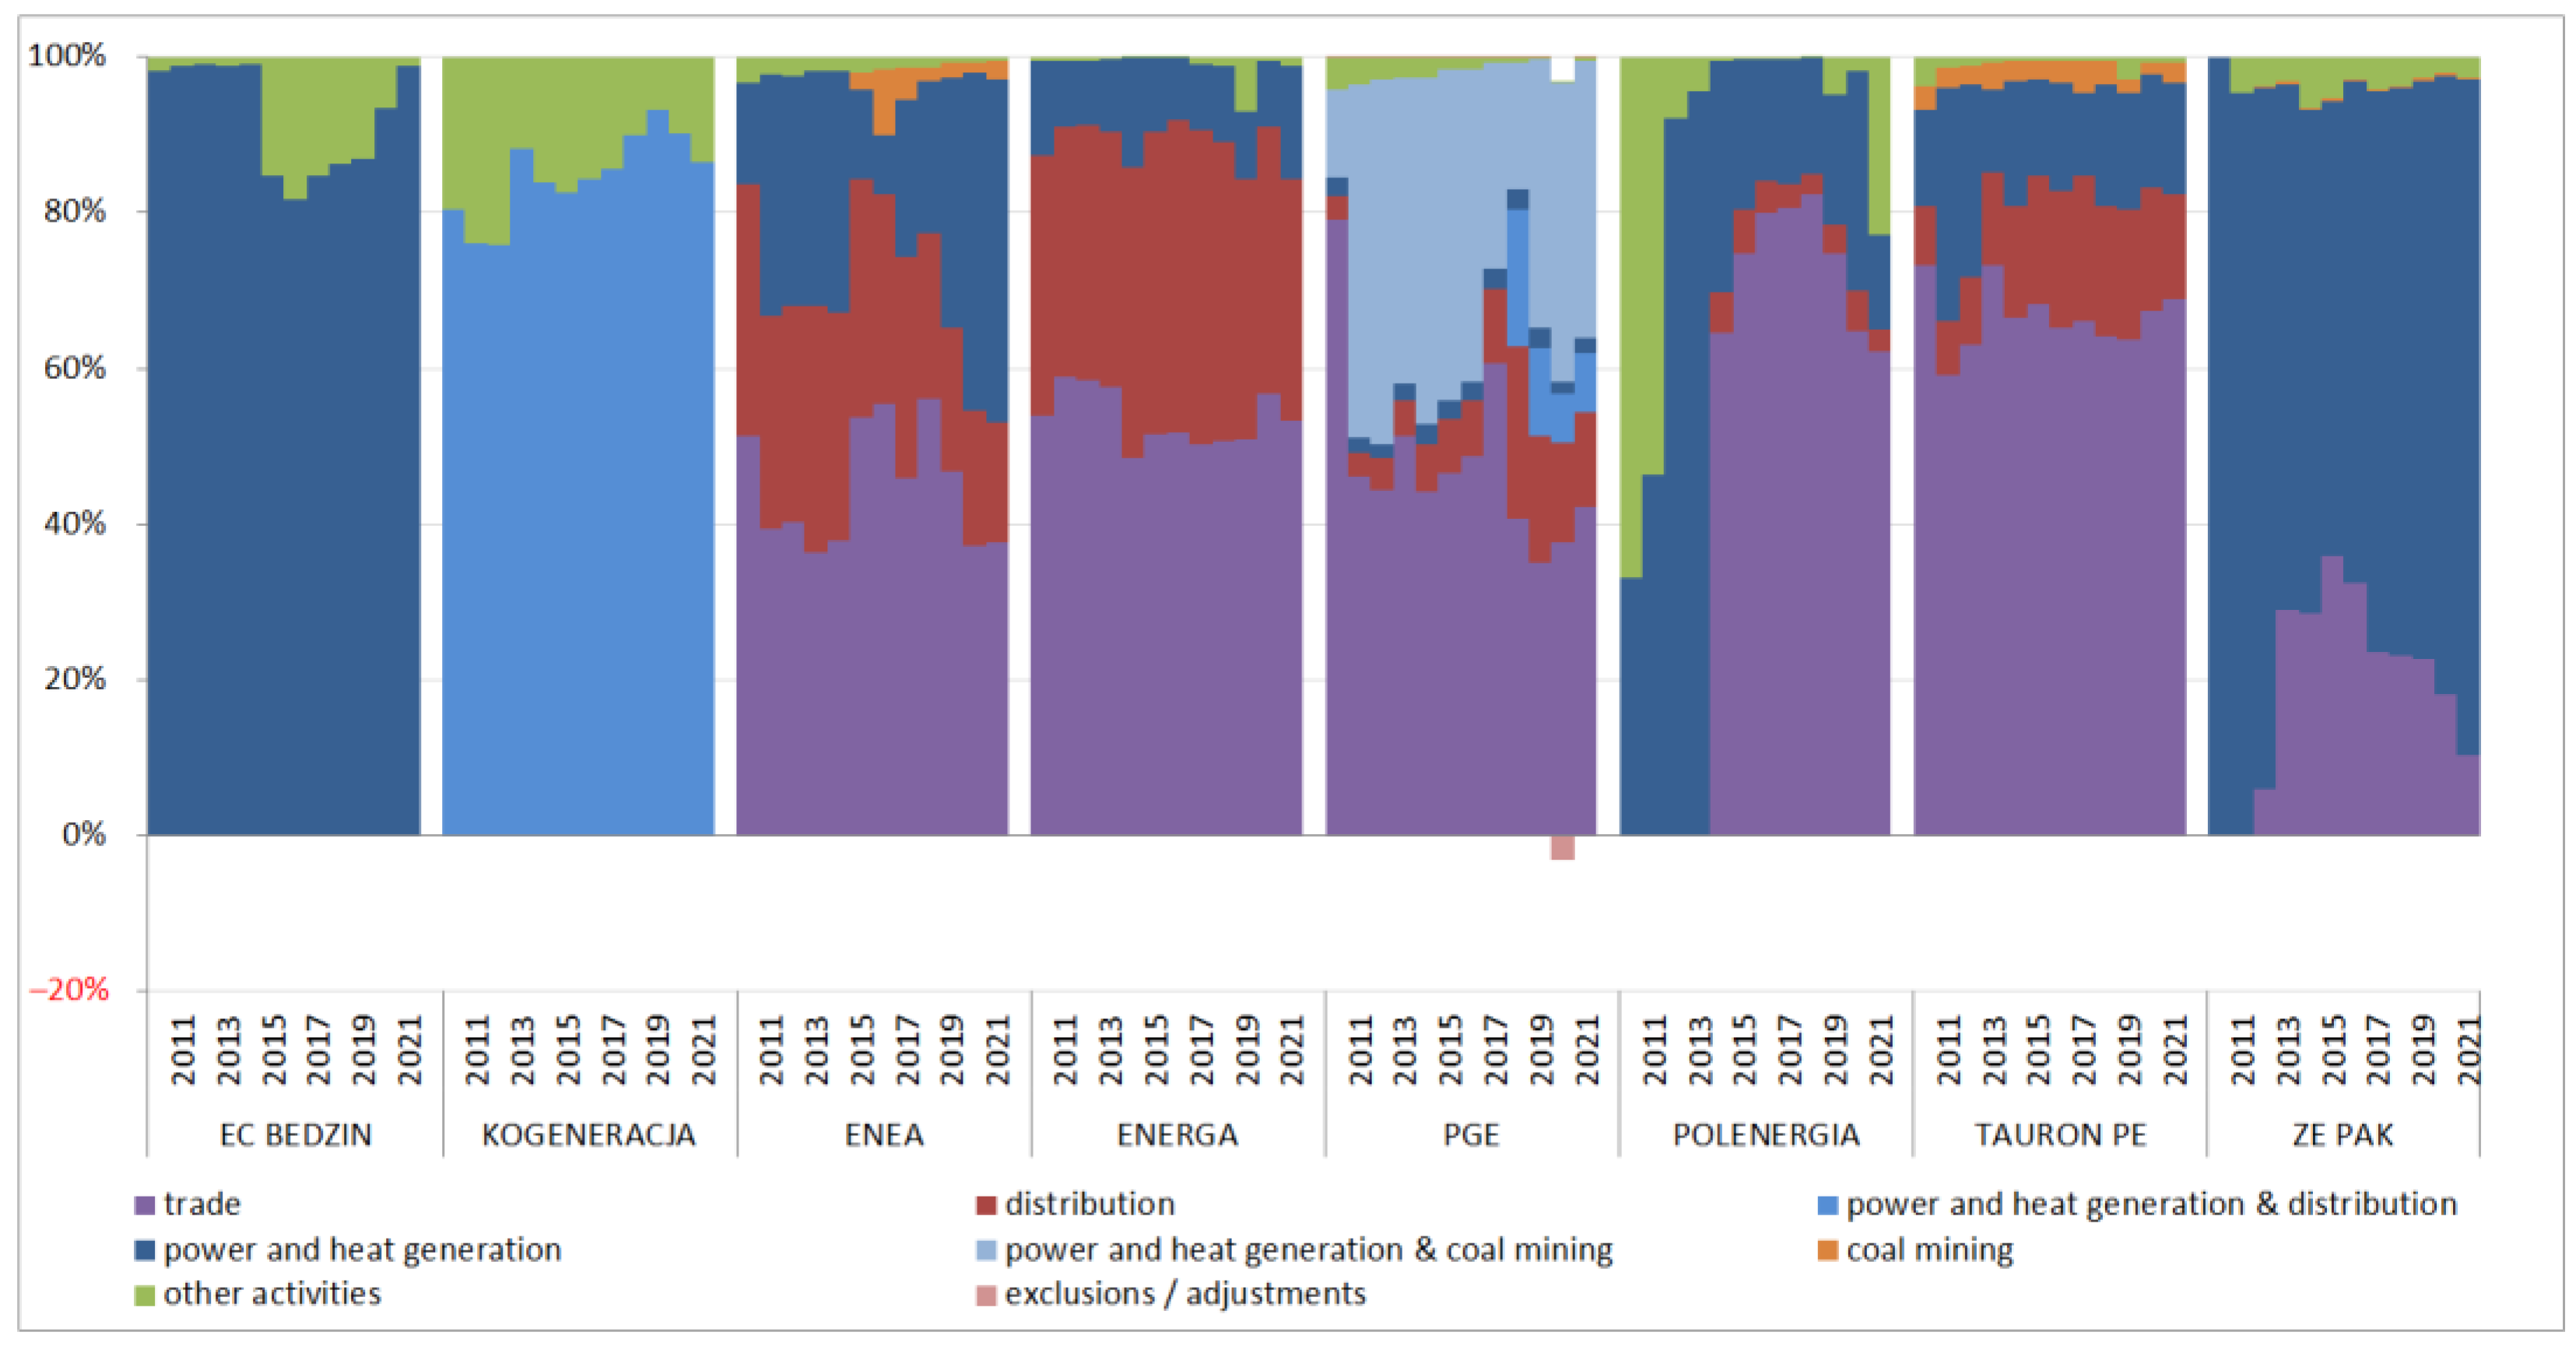
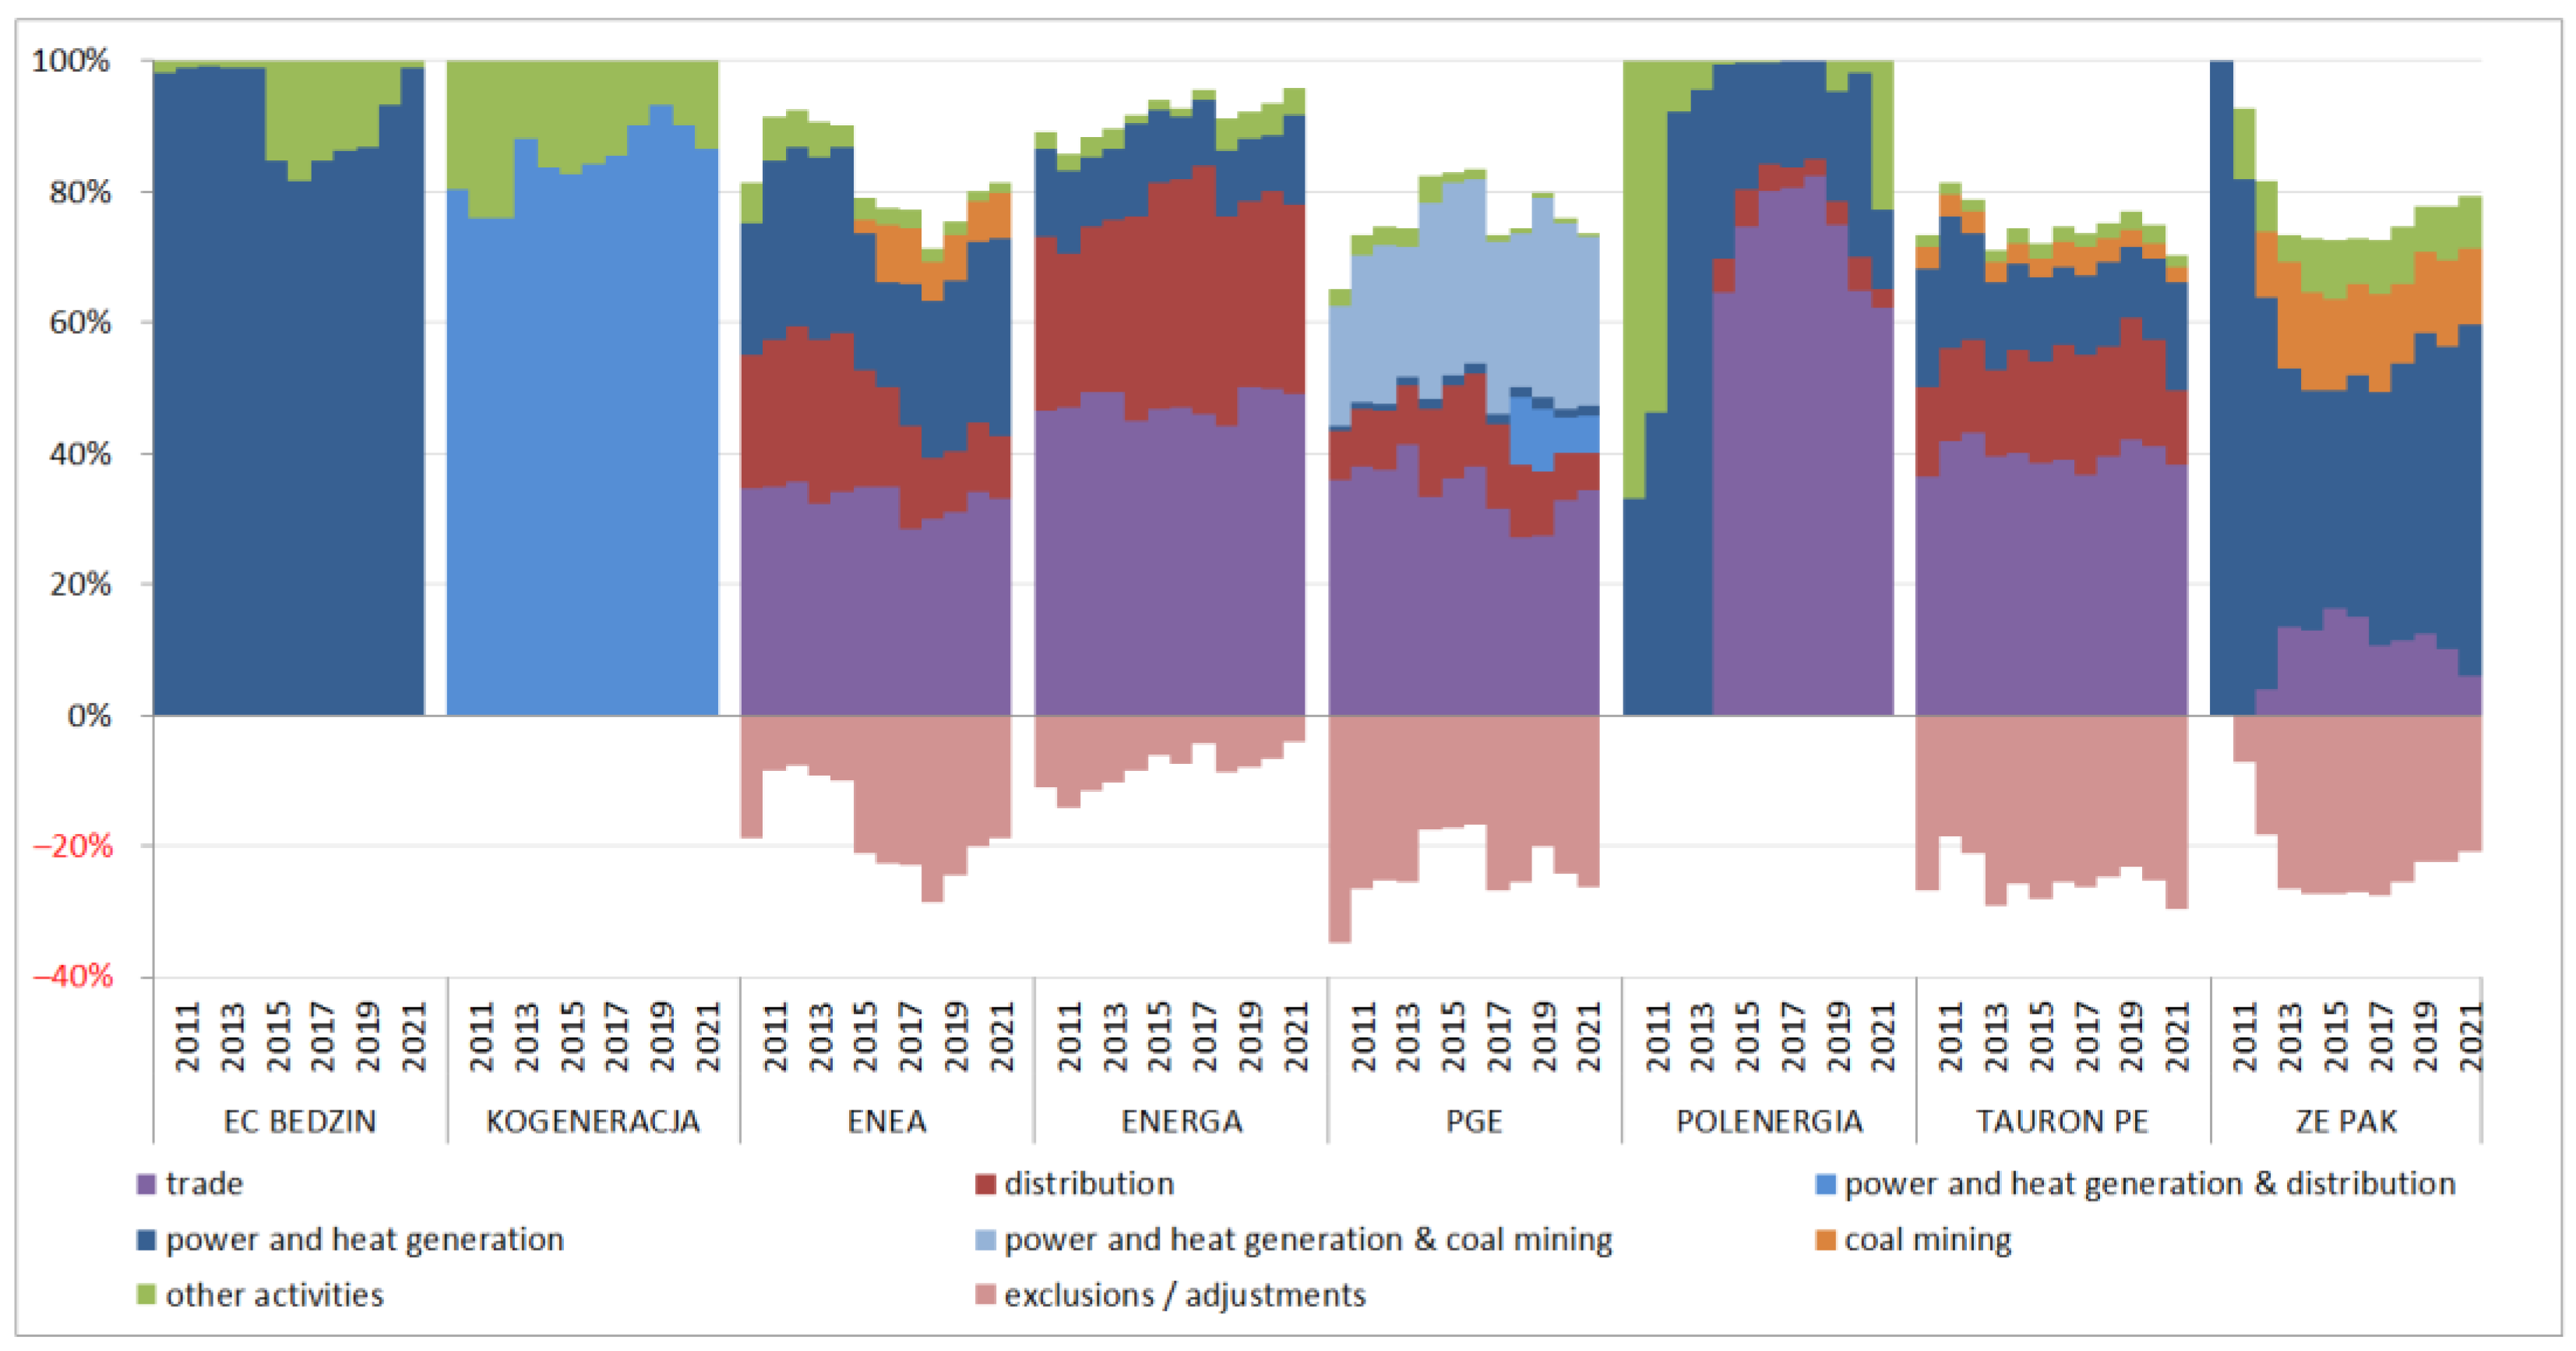
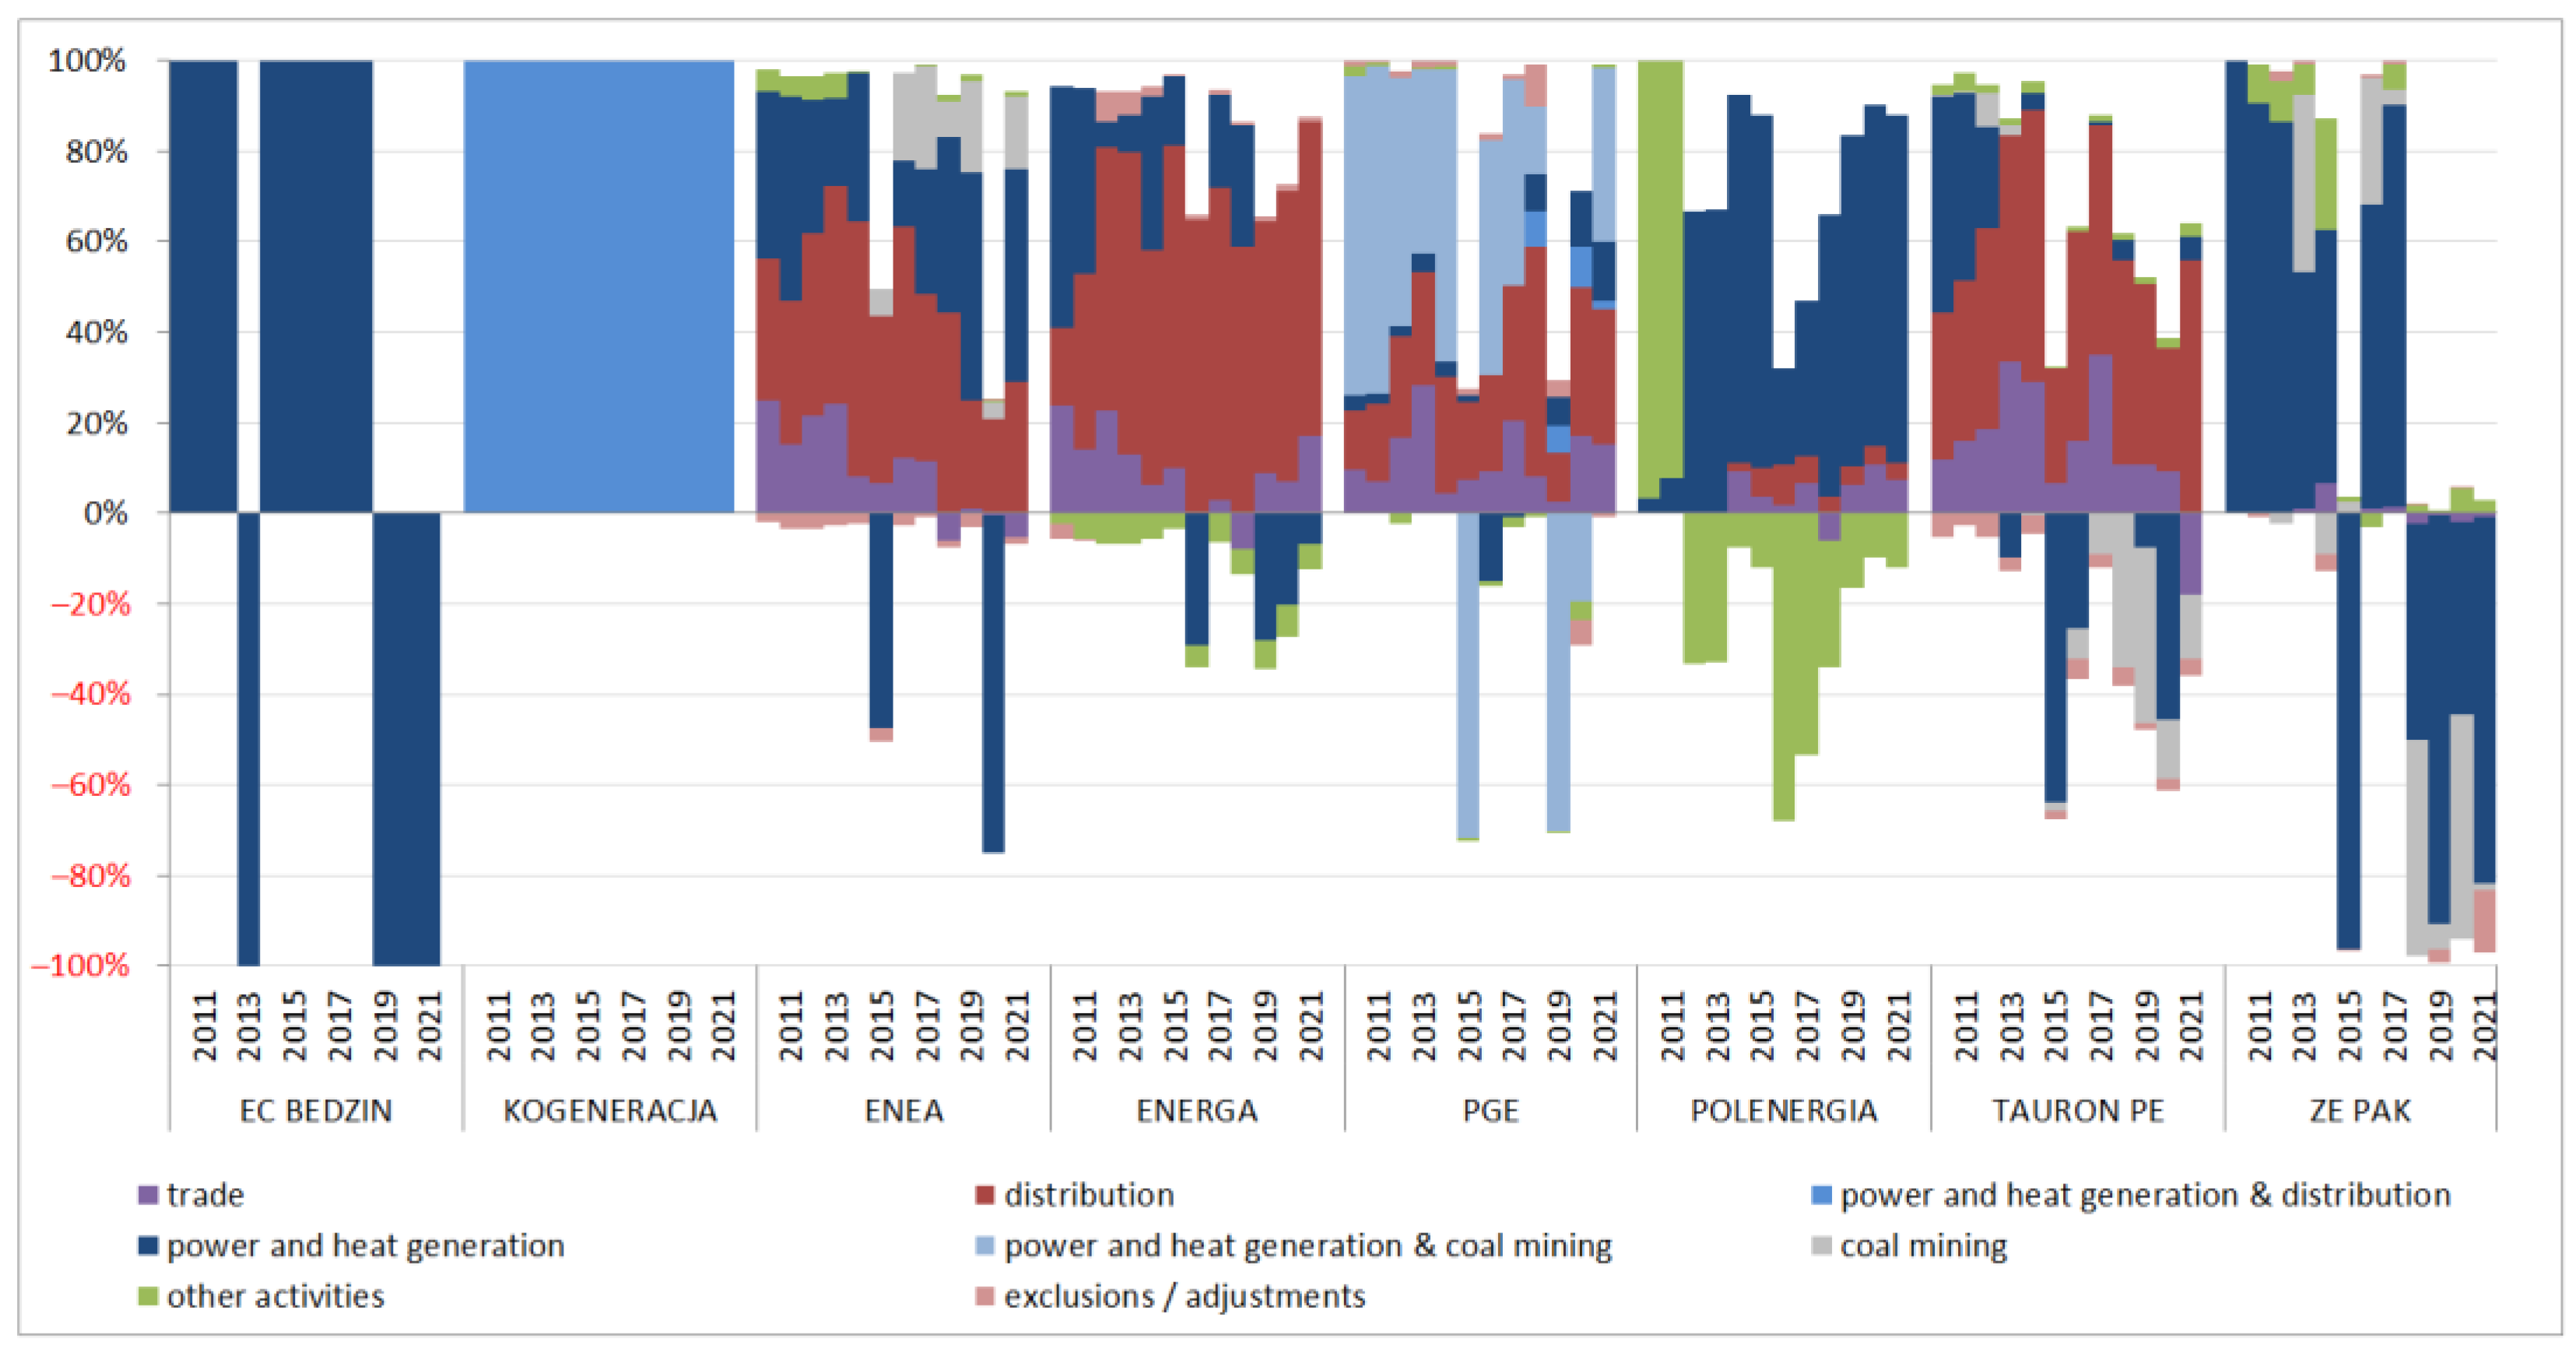
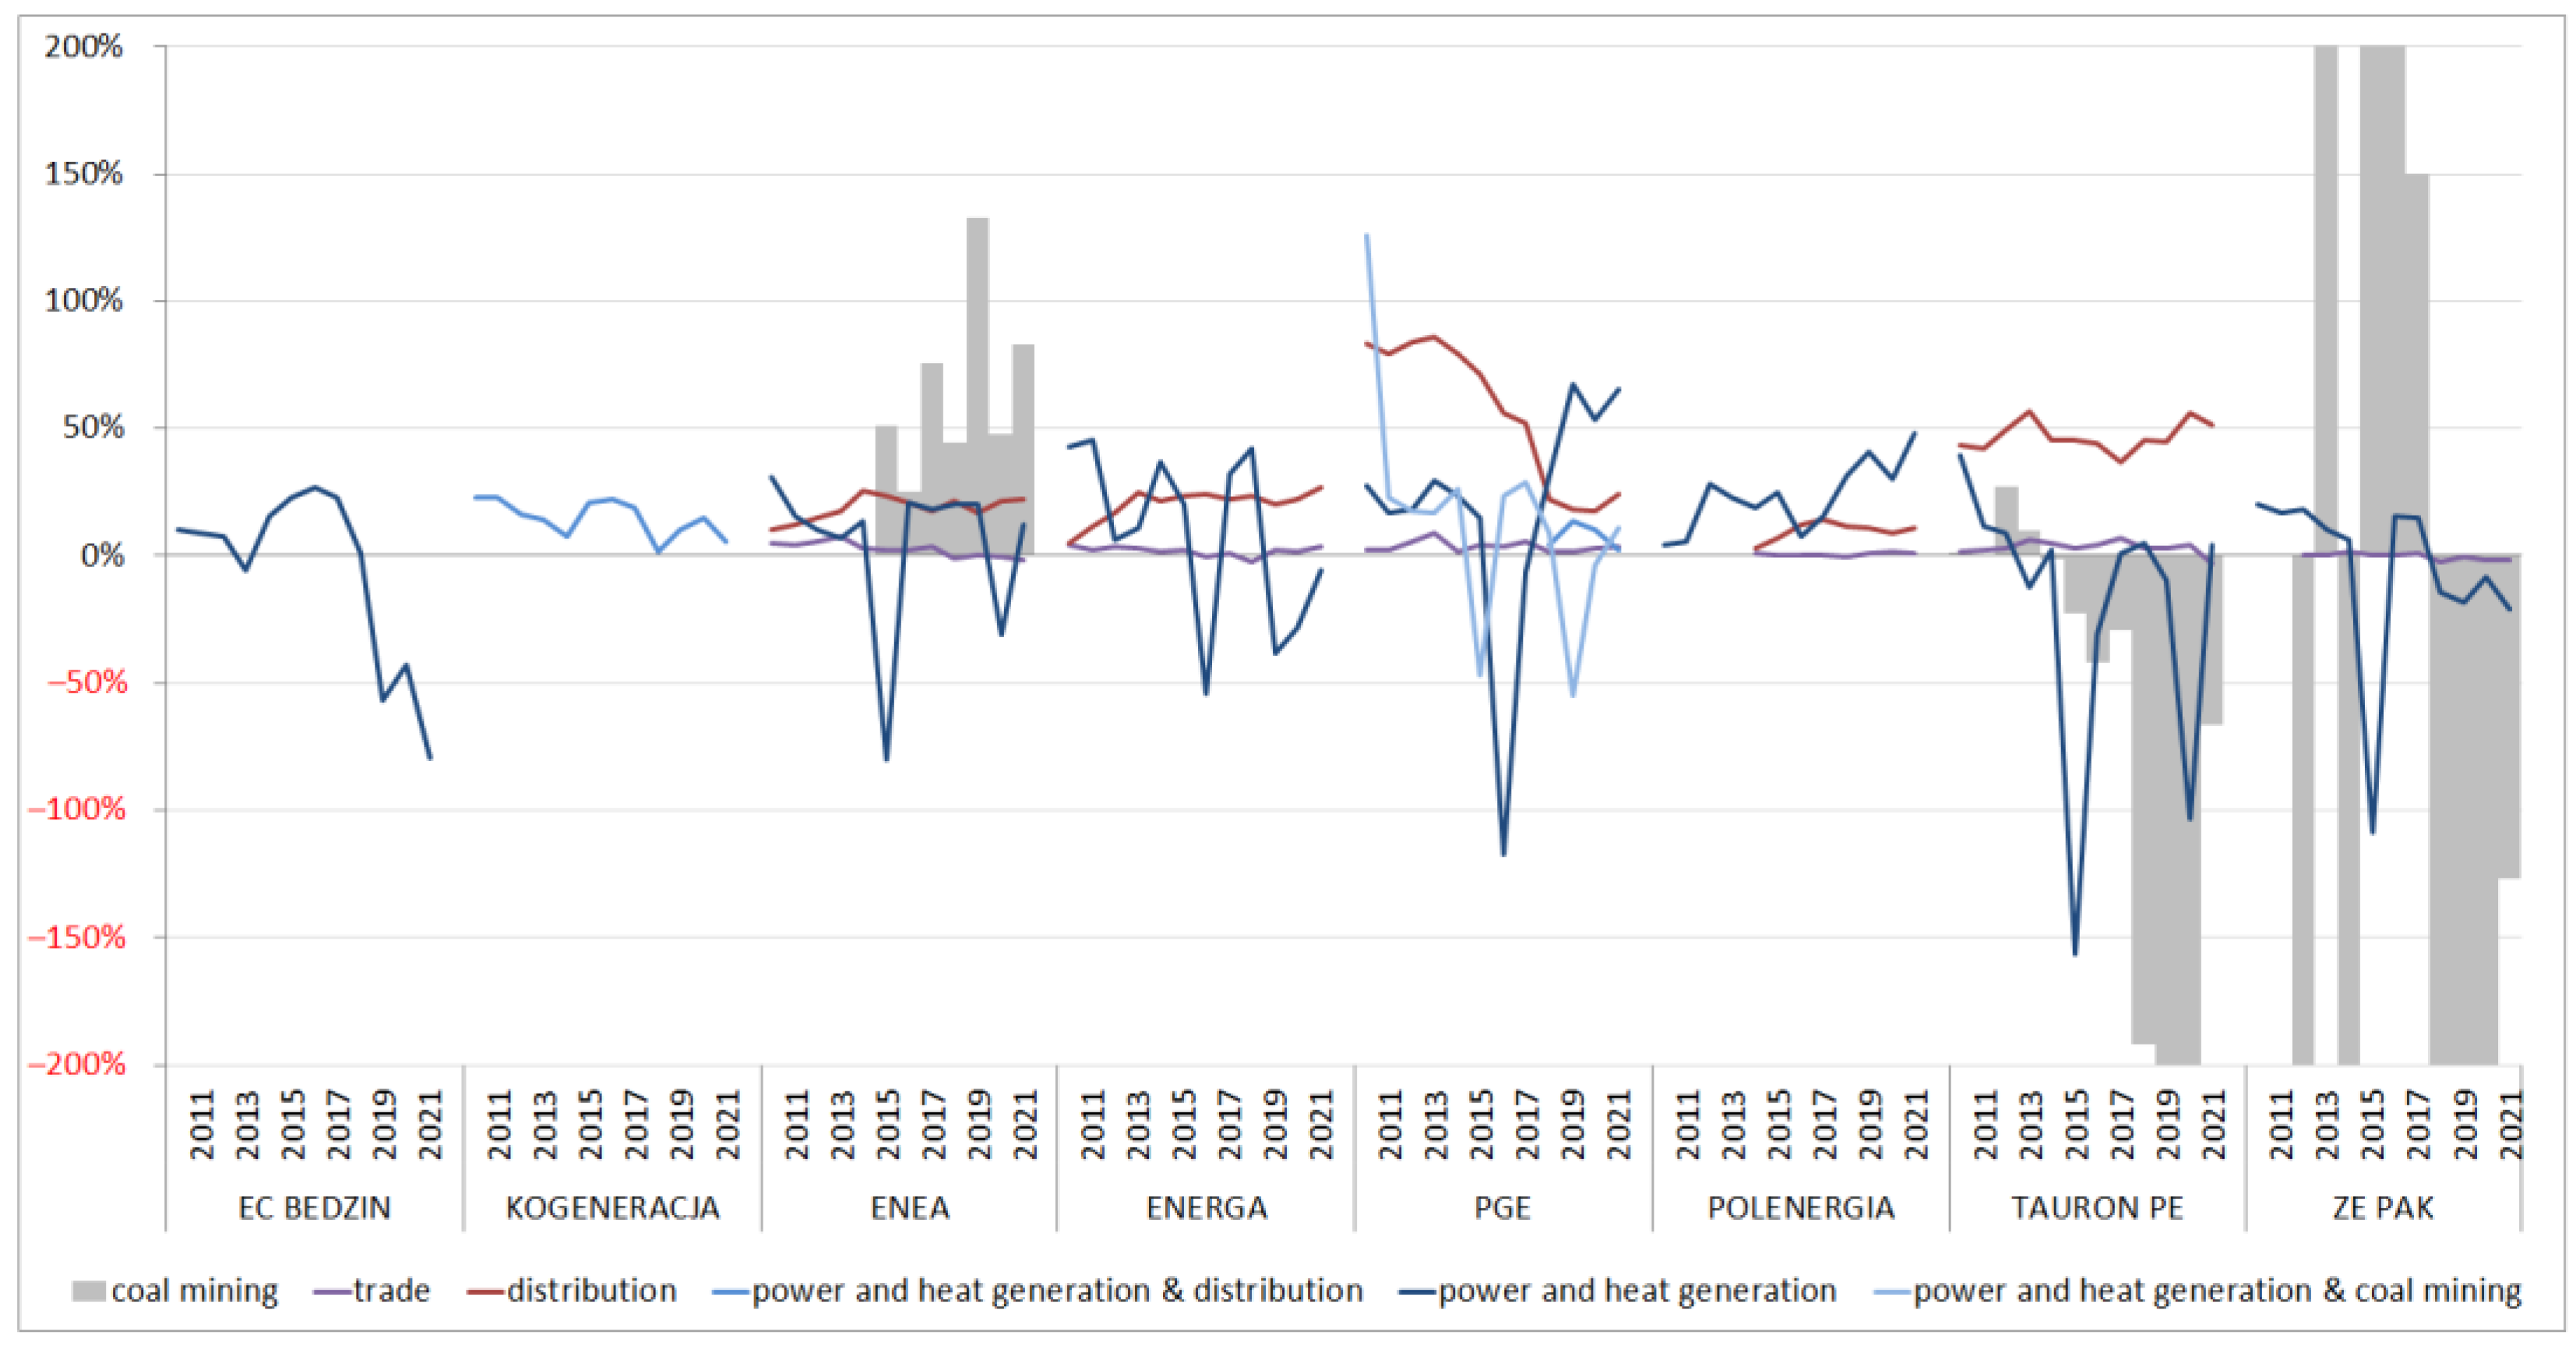
4.1. Characteristics of Power Generation Sources and Business Segments in the Surveyed Companies

In the first stage of this study, reference was made to the structure of the sources of energy generation by the entities surveyed in the article. This is important because of the different carbon intensities of the various sources, which is directly related to the need to purchase carbon allowances. Thus, Figure 2 shows the structure of electricity generation in the surveyed power companies by low-carbon and carbon sources.
From the data presented in Figure 2, it can be seen that, in the studied group, there was one company with a mix composed entirely of low-carbon sources (Polenergia SA) and one that uses 100% coal sources (EC Będzin SA). The remaining companies have a mixed energy mix, but nevertheless, in two of them, the share of low-carbon sources can be treated as significant (Kogeneracja SA and Energa SA), and in the other four, as complementary—not exceeding 20% (Enea SA; PGE SA; Tauron SA; ZE PAK SA).
In the context of the analyzed aspect, it is also worth noting that not much has changed in most of the surveyed companies over the analyzed period, covering 2010–2021. The most dynamic—although still small—pro-environmental changes in the structure of electricity generation can only be observed in Tauron PE SA. This testifies to the poor alignment with the European Union’s climate policy and the low seriousness of both the legal conditions themselves and the financial restrictions related to carbon dioxide emissions. Indeed, more than ten years of the period covered by the study should be considered sufficient for decisions and changes in the selection of energy production sources.
The circumstances described above suggest that for most of the surveyed enterprises, the introduction of the CO2 emission allowance system and the increase in ETS prices may be a serious financial burden. The strongest impact on the financial results should be manifested in EC Będzin SA, PGE SA, and ZE PAK SA, as these companies produce energy almost entirely from non-renewable sources. In turn, financial emission restrictions should not affect Polenergia SA, as this company uses low-emission energy sources.
In the context of changes in the structure of energy generation sources, it is worth adding that the increase in ETS prices was an impulse to increase the use of low-emission energy sources only in two out of eight surveyed enterprises: ZE PAK SA and Tauron SA. No radical actions in this regard were recorded in other entities.
As mentioned, the companies surveyed represent the energy sector. Nevertheless, the internal segments of their business are quite diverse. Indeed, within the energy sector, companies may not only produce energy but also engage in energy trading and distribution. In addition, as part of industry consolidation, which has occurred quite frequently in Poland in recent years, energy companies may also engage in the extraction of energy resources. For these reasons, Figure 3 and Figure 4 show the revenue structure of the surveyed companies, taking into account the segments mentioned above. Due to the internal use of coal for energy production, the revenue structure is presented in terms limited to transactions with external customers (Figure 3) and including intra-group turnover, i.e., between segments (Figure 4).
For five of the eight companies surveyed, electricity trading and distribution dominate their operations (Enea SA; Energa SA; PGE SA; Polenergia SA; Tauron SA). The energy generation process only complements their key trading activities. It should be noted here, however, that due to the so-called “exchange obligation” in effect during the period under review, electricity generators were obliged to sell the energy they generated and fed into the system on the Polish Power Exchange (POLPX). Hence, in order to sell energy to their customers (end users), they had to first purchase (so to speak) it on the POLPX, which somewhat artificially increased the share of the trading segment in total revenues. Only three companies focus on generation or generation combined with extraction or distribution: (1) EC Będzin SA, (2) Kogeneracja SA, and (3) ZE PAK SA, the first two of which are thermal power plants. At the same time, it is worth noting that they use, respectively, (1) coal, (2) an energy mix dominated by low-carbon sources (gas + renewables), and (3) an energy mix dominated by coal and a slowly increasing share of renewables.
Analyzing the structure of operations and the colors of Figure 3 and Figure 4, two groups of energy enterprises can be distinguished. The first and most numerous includes four enterprises (Enea SA, Energa SA, PGE SA, and Tauron PE). Their core business is trade and distribution. Its complement is the generation of energy and heat. This group may also include PGE SA, which differs from other enterprises only in the use of its own coal resources extracted in the mines belonging to this capital group. The second group of energy enterprises includes three enterprises (EC Będzin, Kogeneracja SA, and ZE PAK SA). Their main activity is the generation of energy and heat. In the case of Kogeneracja SA, this is generation combined with coal mining. With regard to this group, a hypothesis could be put forward about the high impact of ETS and the increase in their prices on financial results because they focus on the production of energy from non-renewable sources.
In the context of the above observations, it can be concluded that most of the surveyed energy companies (excluding EC Będzin and Kogeneracja, which are thermal power plants) are unlikely to engage in increasing revenues from risky generation activities (Enea and ZE PAK are exceptions) and prefer to focus on using their transmission assets for energy distribution and on energy trading activities (trading), thus minimizing exposure to the risks associated with restrictive EU environmental policies.

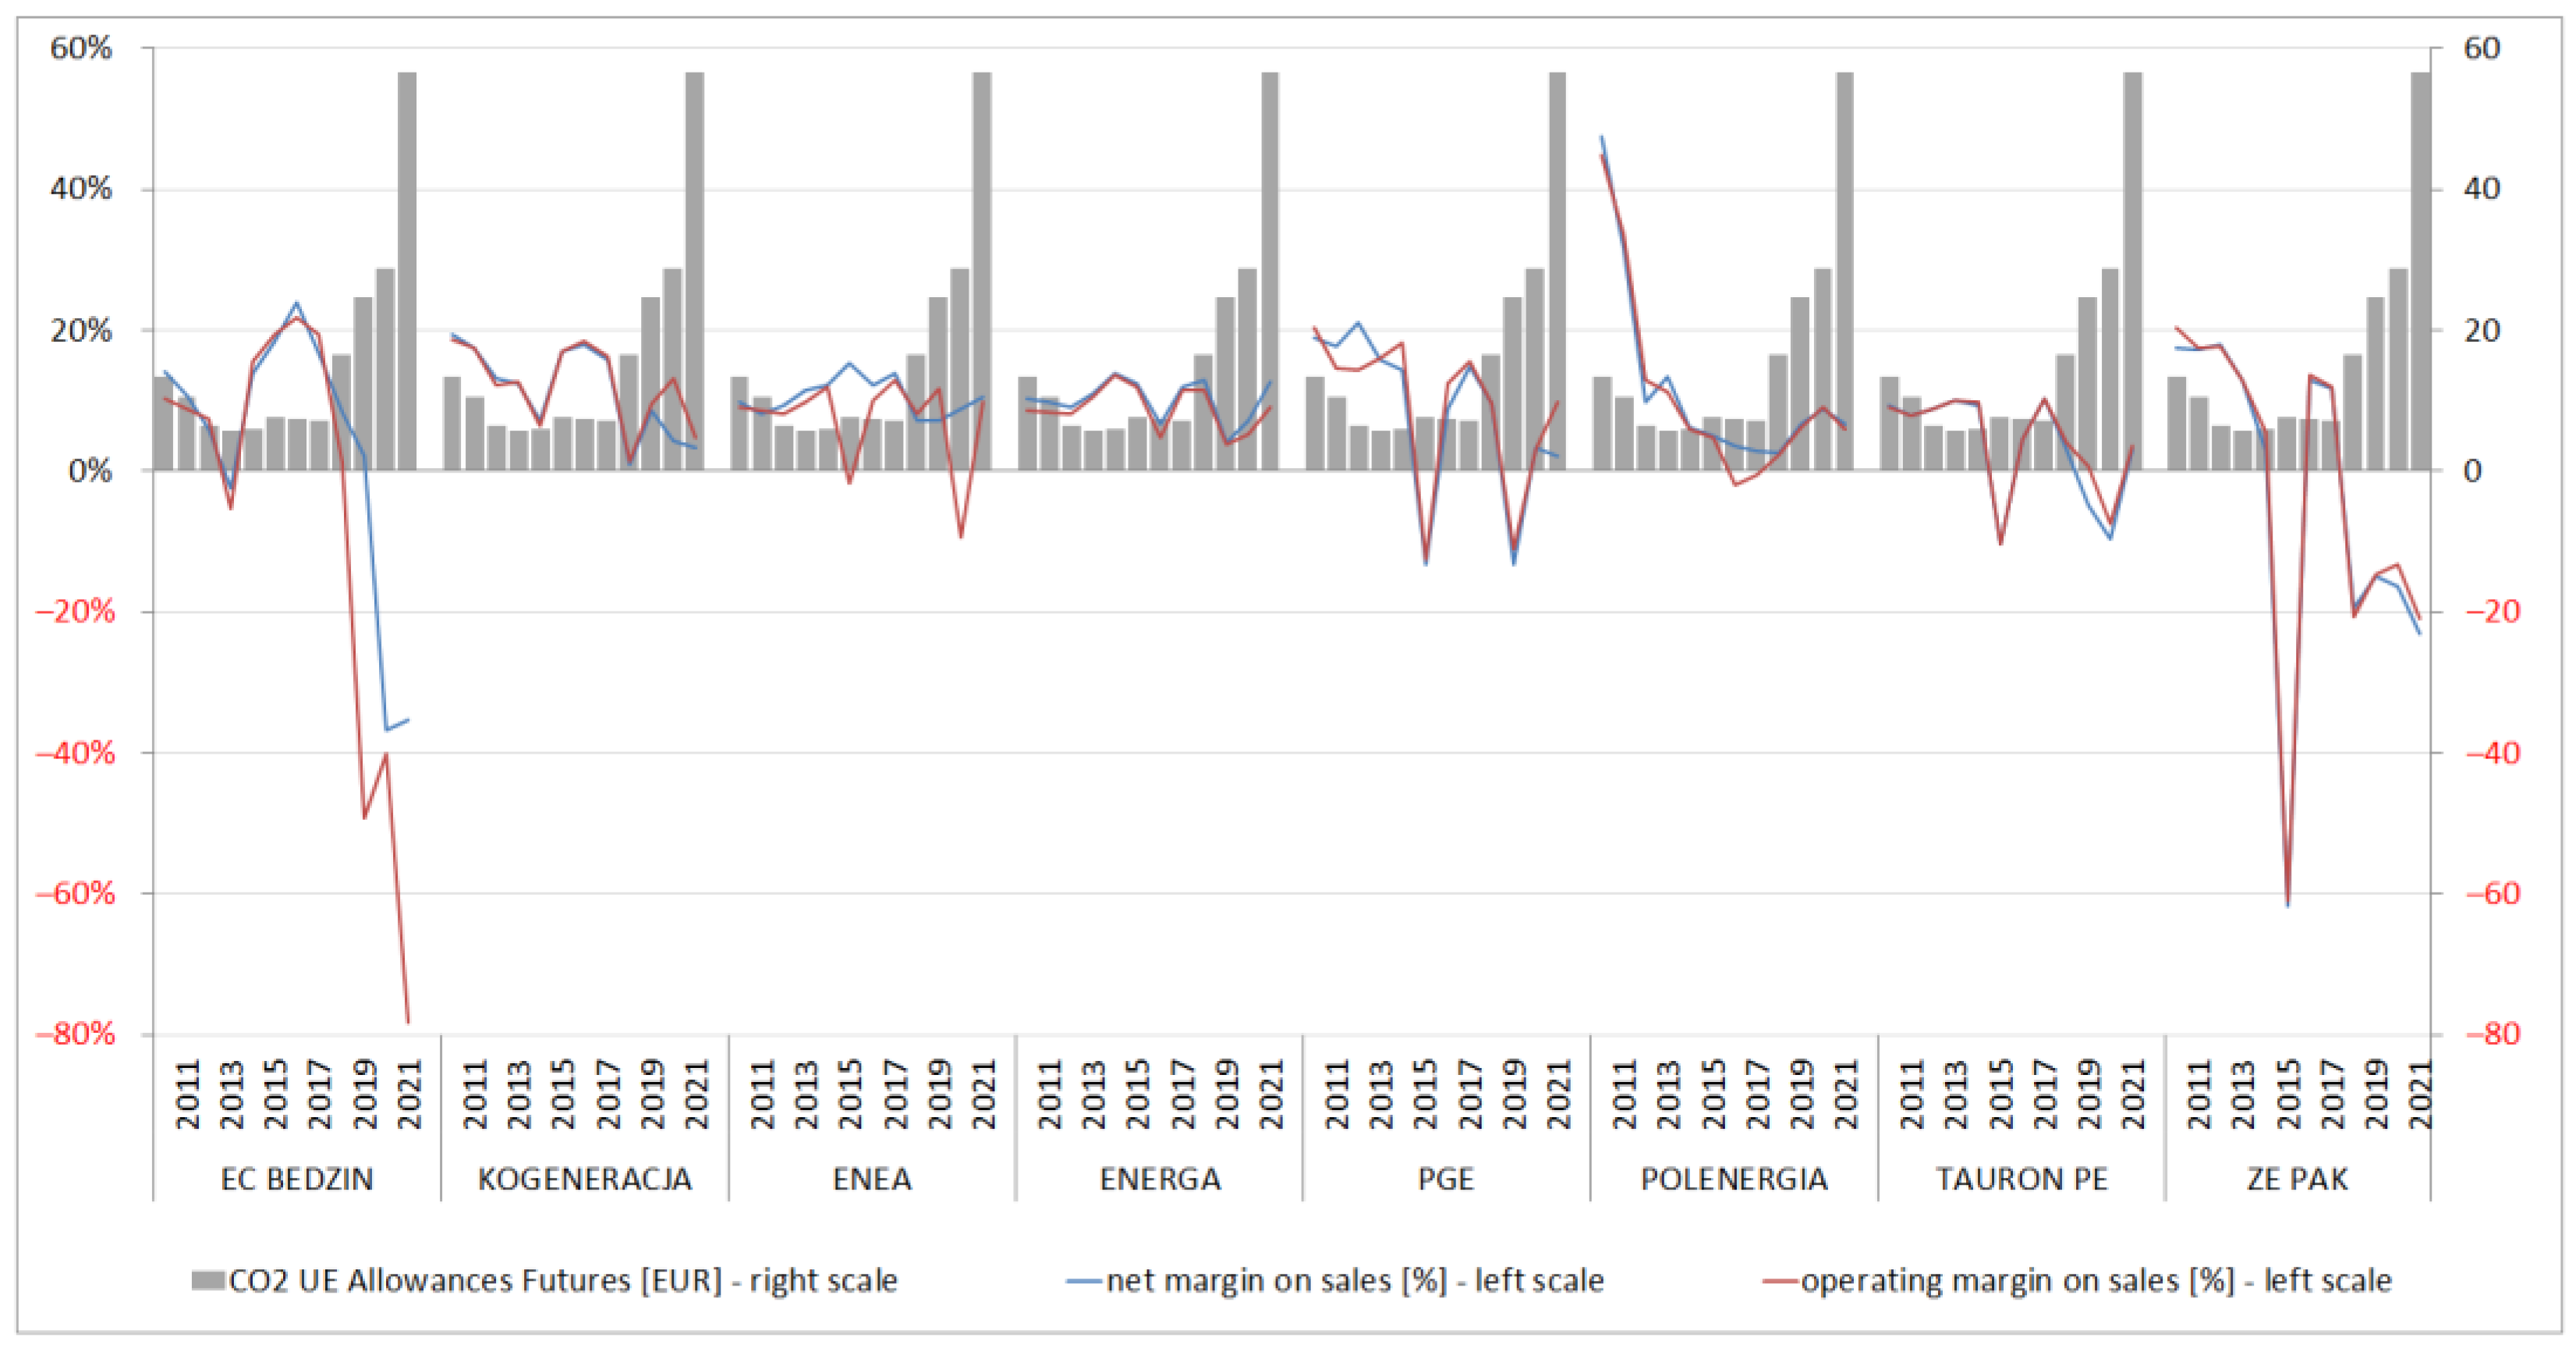
4.2. Analysis of the Financial Performance of the Surveyed Energy Companies—Current Perspective

In the second stage of this research, the financial results and sales margins of the surveyed companies were analyzed from a current perspective, that is, referring to subsequent fiscal years. The analysis began with a general look at the relationship of net sales margins and operating margins to the price of CO2 contracts—Figure 5.
Figure 4 clearly shows the intensive increase in ETS prices in the last four years of the analysis. This should result in a decrease in the net operating margin on sales and the net margin on sales (except for Enea SA, these margins are strongly correlated, so they can be considered together). Meanwhile, according to the data presented in Figure 5, taking into account the considered period covering 2010–2021 for the surveyed Polish energy companies, no clear impact of the increase in the price of CO2 emission rights on the deterioration of their sales margins can be found. A strong negative dependence has been marked in recent years only for EC Będzin and ZE PAK. In these enterprises, both calculated margins rapidly decrease and fall well below zero. This phenomenon is particularly intense in EC Będzin SA. Among the negative reactions of margins to the increase in ETS prices, it can also be mentioned: Tauron SA, Kogeneracja SA, PGE SA, and Energa SA, but it is not so deep and long-lasting. It appears in the initial period of price increase and then margins increase again. In the case of other entities, the negative dependence is not visible or even absent.
This state of affairs is influenced, on the one hand, by the structure of the sources of energy production of the companies under study (Figure 2) and, on the other hand, by the diversity of activities of the analyzed entities (Figure 3 and Figure 4). The low share of low-emission sources in generation and the high diversification of operations protect enterprises against the negative impact of the increase in ETS prices on their financial results. Both of these determinants were described in the previous section.
In the case of EC Będzin and ZE PAK, in the area of the core business, there is a concentration on power generation, mainly from coal sources. As a result, in recent years, one can observe in these entities a dynamic increase in the cost of redemption of CO2 emission rights, including their share in total operating costs (Figure 6) or in relation to sales revenue (Figure 7). Such a large share and increase in the costs related to the purchase of ETSs in these enterprises is a significant burden on the financial result and causes the previously described decrease in net margins. The costs of ETS are also visible in those enterprises where margins deteriorated in the first years of price increases (Tauron SA, Kogeneracja SA, PGE SA, and Energa SA). These are also enterprises with a large share of high-emission sources in production.
This has resulted in a deterioration of their operating results (Figure 8) and, thus, their operating margin (Figure 9) in the “manufacturing” segment. Figure 8 clearly shows a decrease in the generation margin in EC Będzin SA and ZE PAK SA. These are the key business segments of these enterprises, so they have a decisive impact on the final financial result described above in the context of net margins. In the case of the other four companies (Tauron SA, Kogeneracja SA, PGE SA, and Energa SA), the structure of operating profit also reflects the negative impact of the increase in ETS prices, but it is less significant.
It is worth noting at this point that Kogeneracja SA, similarly to the two entities mentioned above, also concentrates its core business on energy generation (Figure 3 and Figure 4), which, due to the nature of the company’s reporting, is reported together with electricity and heat distribution, but unlike them, it obtains more than half of its energy from low-emission sources based on the combustion of natural gas (Figure 2). As a result, the cost of canceling CO2 emission rights, despite the increase in their value and share in total costs by type, does not have such a destructive impact on the result and operating margin.
Given the above, it can be concluded that the dominance of generation in the business profile and the use of high-carbon fuels as part of this generation inevitably exposes the power company to increased market risk, which is measurably reflected in the deterioration of current financial performance. Thus, stagnating and ignoring changes related to the tightening of EU environmental regulations is not an appropriate or desirable strategy for survival in the energy industry. The cited examples (ZE PAK SA and EC Będzin SA) also confirm the effectiveness of environmental repressive instruments, as they negatively affect the profitability and financial position of the companies and may be the cause of their bankruptcy, as the example of EC Będzin SA quite clearly shows.
It is also worth mentioning at this point that, unlike EC Będzin SA (which will find it difficult to change its method of power generation due to infrastructural considerations), ZE PAK SA is currently strongly changing the structure of power generation by engaging in the development of nuclear power, which may be an attractive development path for the company that has already been chosen and confirmed by, for example, the aforementioned Kogeneracja SA.
As for the other energy entities surveyed, their relatively weak response to the recent increases in the price of CO2 emission rights can be explained by a greater concentration of core business on the “trading” and “distribution” segments of energy (Figure 3 and Figure 4). From the point of view of profitability and operating margin, especially the latter segment stood out as positive (Figure 8 and Figure 9).

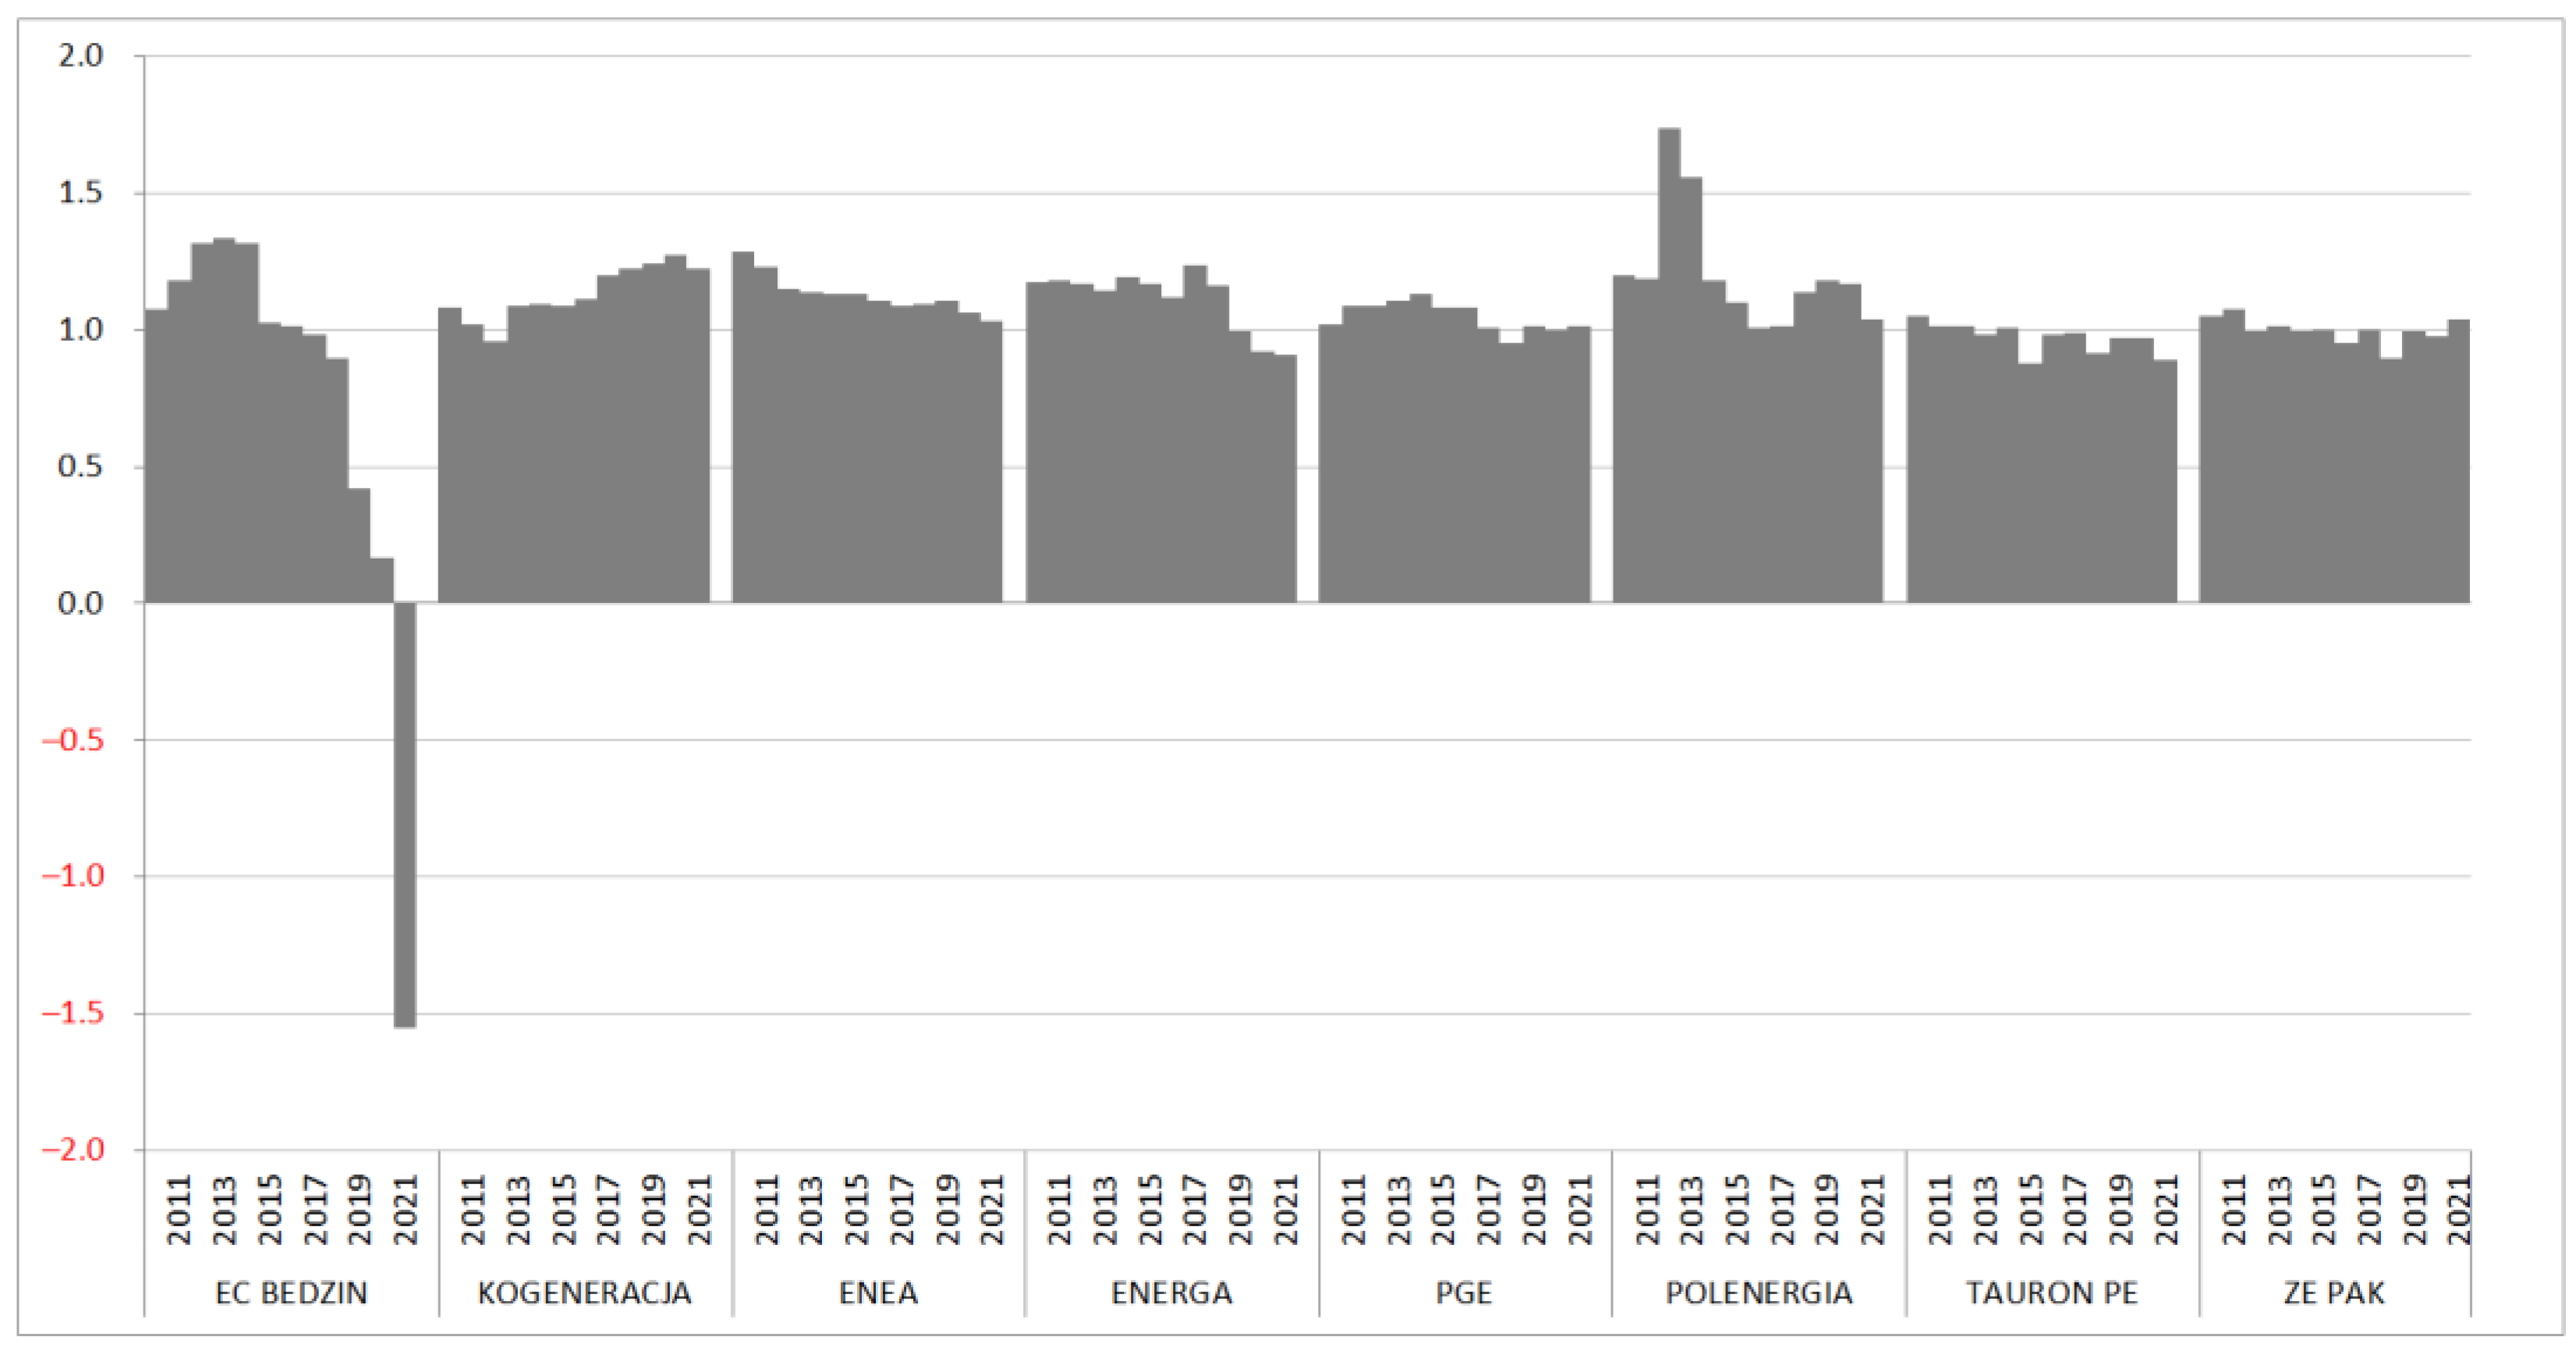
4.3. Analysis of the Capital Structure and Debt of the Surveyed Companies—A Long-Term Perspective

In the final stage of this research, reference was made to the capital and debt structure of the surveyed companies to assess whether and to what extent current financial performance has translated into the state of funding sources. These parameters are shown in Figure 10 and Figure 11, respectively.
Figure 10 shows that the ratio of fixed capital to fixed assets in most of the companies studied (7 out of 8) was significantly better in the early years of the analysis. At that time, fixed assets had stable, long-term sources of financing of a surplus nature. Over time, the ratio has steadily deteriorated, indicating a deterioration in the quality of the capital structure. It assumed a particularly dramatic course in the case of EC Będzin SA, where negative financial results resulted in negative equity in 2021. This is a direct result of the increase in the price of CO2 emission allowances, as clearly indicated by the analysis of the generic costs of the company under review earlier. Such a profound deterioration in the long-term situation and prospects of operation at EC Będzin SA is the result of two circumstances: the concentration of its operations on power and heat generation and the basing of this generation on coal—the most emission-intensive non-renewable fuel.
The above circumstances also translate into a catastrophic level of debt at EC Będzin SA (Figure 11). It should also be added that most of the surveyed companies have seen a systematic increase in debt over time, which is indicative of the increasing financial risk and deterioration of the long-term financial situation of the surveyed power companies. The exception in this regard is Kogeneracja SA, which, in the context of its business profile, is distinguished by the combination of generation and distribution and the use of a dominant share of low-carbon sources (gas + non-renewable sources) in the production process.
In this section, the impact of emission allowance was analyzed in the aspect of costs, financial results, net margins, and financing structure. According to the obtained results, it was the strongest in enterprises focused on generating energy and heat from non-renewable energy sources. In enterprises with a more diversified activity and generating energy with a greater share of renewable energy, it was definitely lower.
The increase in the prices of emission allowances resulted in an increase in operating costs, a decrease in financial results, and a sharp decrease in net margins. In addition, in the long term, it contributed to the increase in debt and the disruption of the capital structure. In the context of the above, it can be concluded that the introduction of emission allowance fulfilled its sanctioning task and, in the absence of the reaction of energy companies, significantly deteriorated their financial condition.

5. Discussion

The results of the analyses and evaluations carried out confirm some of the conclusions about the effects and consequences of the introduction of the emission allowance system in Poland. As part of this discussion, we present the conclusions obtained against the background of the EU climate policy guidelines, which apply to all Member States, including primarily other emerging and developing economies. The broader context of the discussion makes it possible to place the conclusions in a specific regional context and to formulate recommendations also in the strategic aspect. Of course, the detailed conclusions refer only to Polish energy enterprises, which we emphasize in the conclusion section.
First of all, the obtained results point out that the financial consequences of acquiring allowances affect, to the greatest extent, companies that use high-emission sources for energy production, including primarily hard coal and lignite. This fact has been pointed out previously by, for example, Wang and Zhang [50] and Howie and Atakhanova [52]. Such a situation reduces the competitiveness of companies relying on conventional fuels and not making efforts to diversify the energy sources used. It also significantly increases the risk of financial problems, including bankruptcy.
In economic terms, the results of the survey confirm the fact of low adaptation of companies operating in developing economies to EU climate policy, as most of the companies surveyed have changed little in terms of the energy sources they use. The proportion of renewable and low-carbon sources (e.g., gas) has not significantly increased in their original energy mixes (as of 2010). This demonstrates the poor effectiveness of EU climate policy implementation, especially in the context of pressure for low-carbon transformation, and confirms the conclusions reached by Spassov et al. (2011) [51] and Howie and Atakhanova (2022) [52] in their study of the Bulgarian and Kazakh economies.
The above observations also do not provide a good prognosis for improving the innovativeness of Polish energy companies and their focus on implementing green generation technologies [46]. This will most likely have disastrous consequences for both the energy transition and the level of innovativeness of the Polish economy, especially since, as highlighted in the introduction, Poland is the main beneficiary of additional EU funds allocated to support the reduction of CO2 emissions.
Given the conclusions and the importance of EU climate policy for the quality of life of current and future generations, the following recommendations should be made to Polish energy companies:
  • Systematically increasing the share of low-carbon sources in the generation segment regardless of its share in total revenues;
  • Monitoring and forecasting the economic situation in terms of the ability to maintain current sales and operating margins in the distribution and trading segments;
  • Implementing green innovations that can become the basis for strengthening competitiveness and survival in the future;
  • Establishing cooperation with research entities to raise funds for innovative research in the area of the low-carbon economy, creating conditions for full adaptation to EU climate policy.
In addition, given the sector insights so far, the Polish economy and energy industry should be given the following recommendations:
  • Monitor the changes and effects of the European Union’s climate policy and its impact on companies;
  • Step up efforts to make effective use of EU funds related to the emission allowance system;
  • Coordinate activities and funding development research in the area of green innovation, as highlighted by He et al. (2023) [48] and Park (2020) [45];
  • Identify the impact of the price of emission allowances on the behavior and financial situation of enterprises in order to negotiate with the EU the extent to which they are regulated and to prevent undesirable side effects with reference to the optimal price formation mechanism also described by Wei et al. (2022) [43].

6. Conclusions

Based on the analyzed case studies of Polish energy companies, the following research conclusions can be formulated, which are at the same time the answer to the research problem posed in the article: whether and to what extent the increase in the price of CO2 emission allowances affected the financial situation and strategic behavior of Polish energy companies listed on the Warsaw Stock Exchange.
(1)
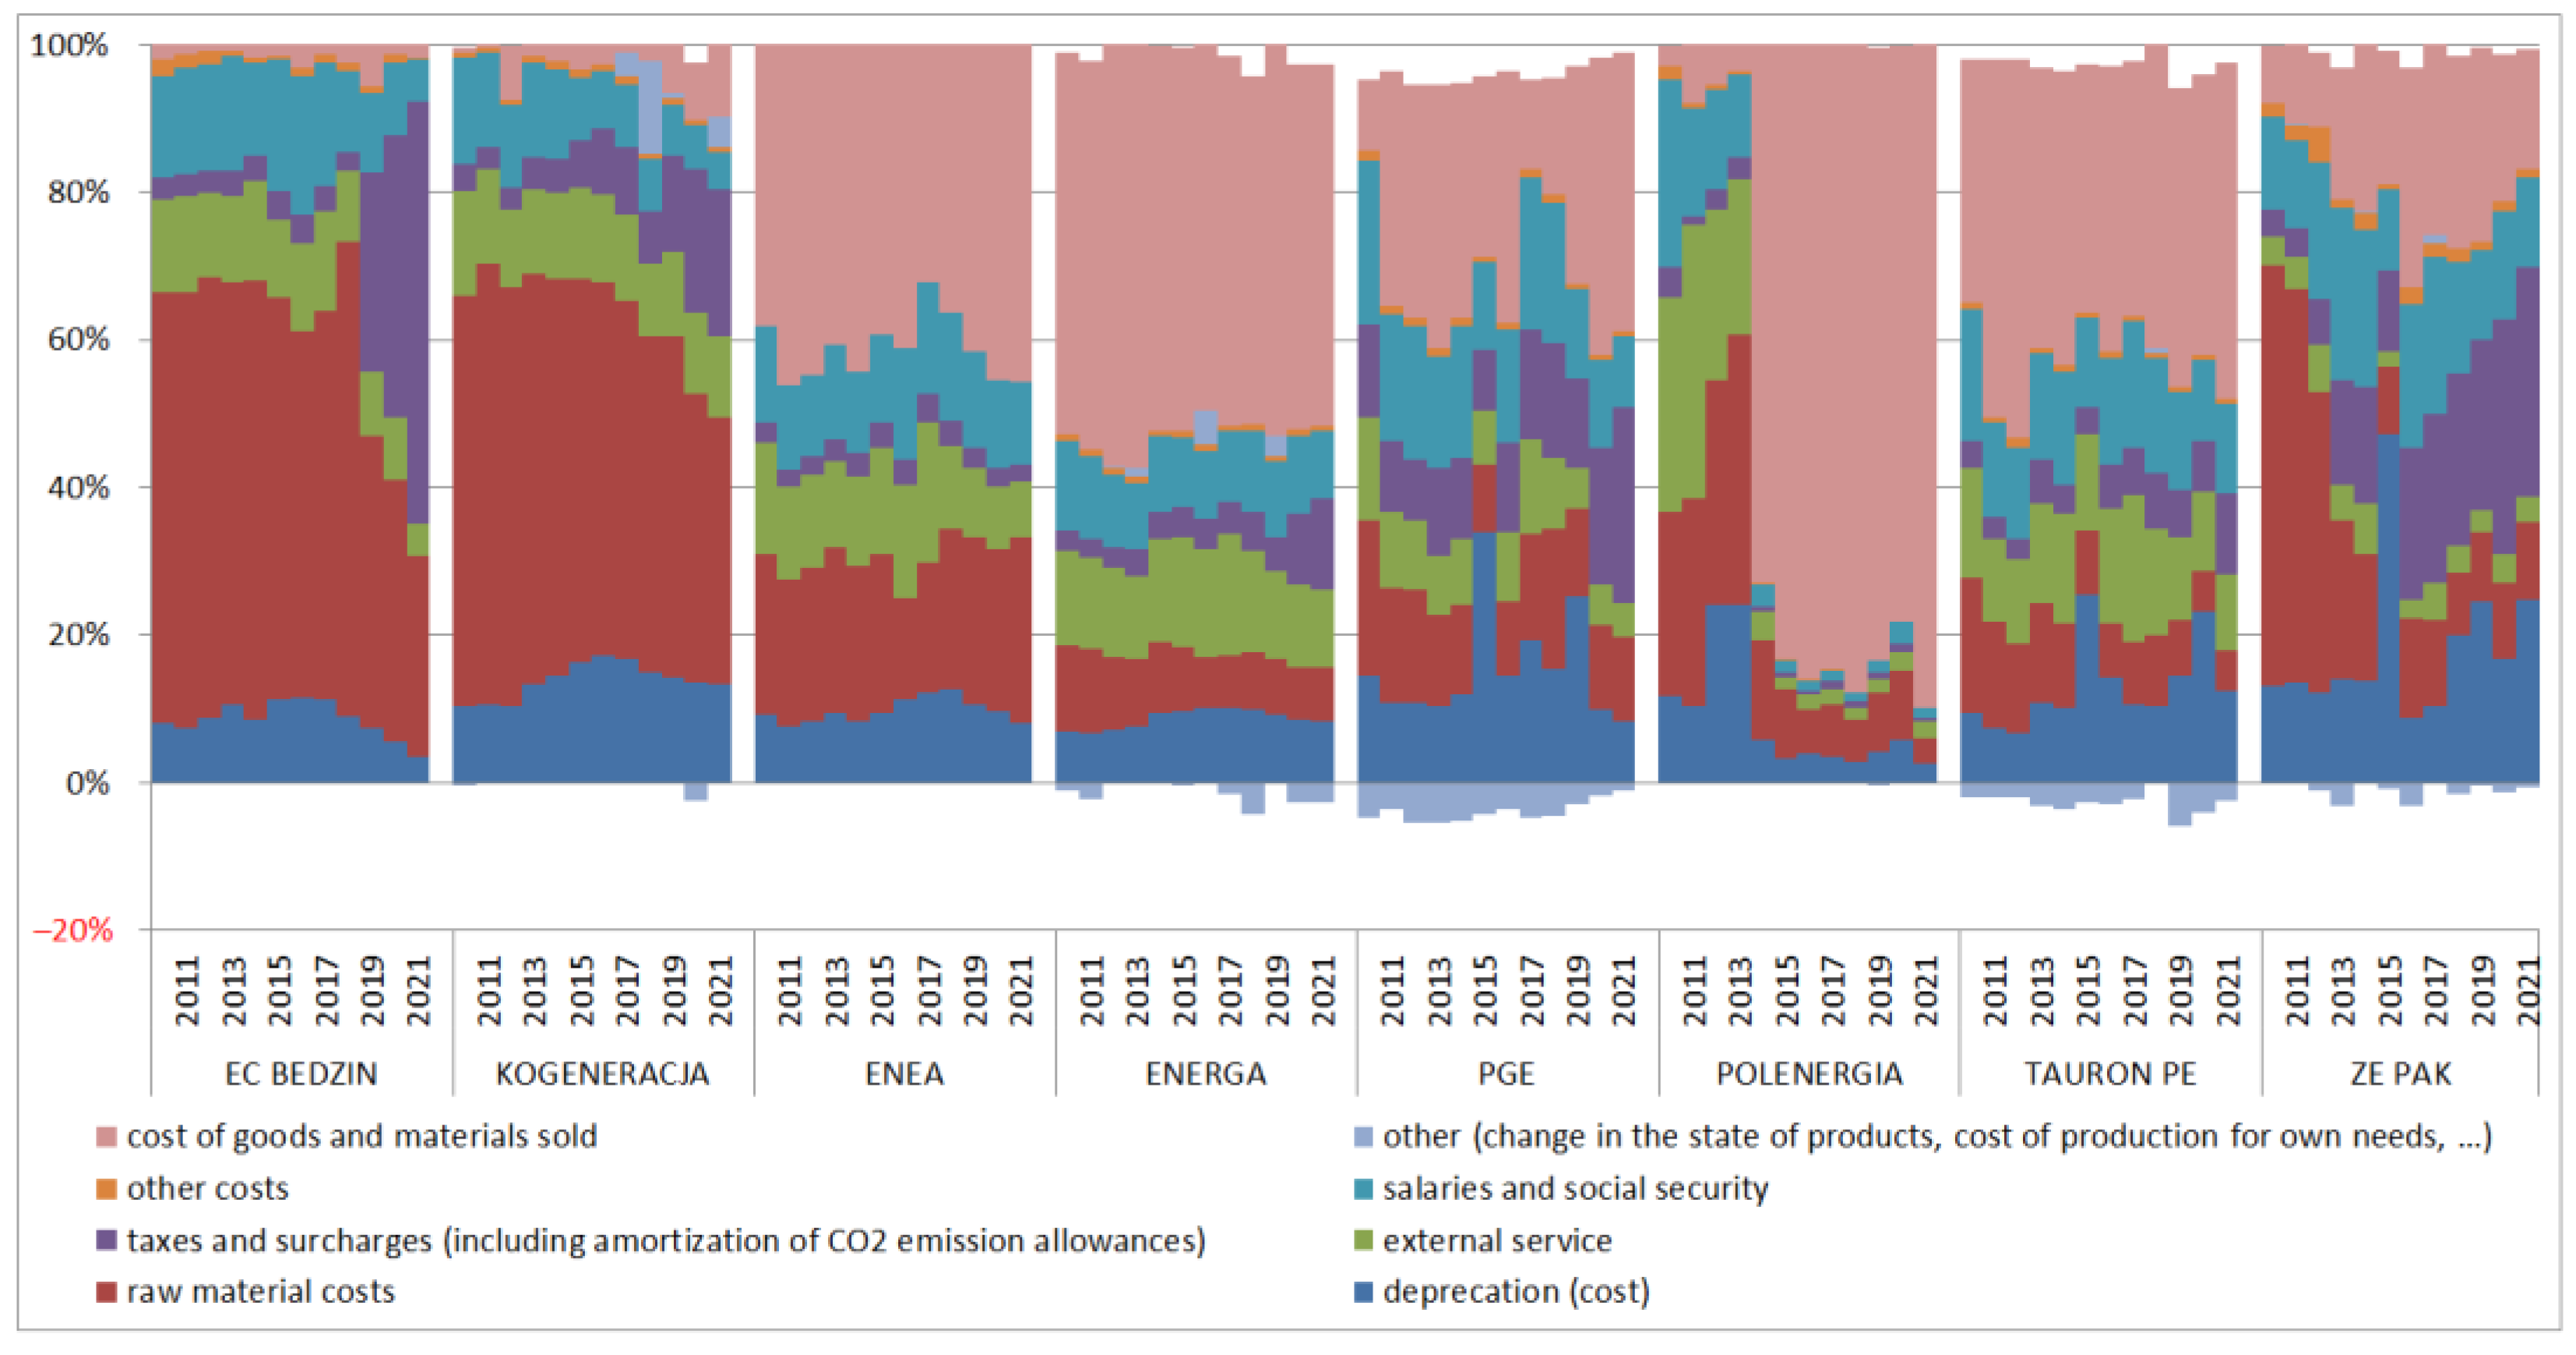
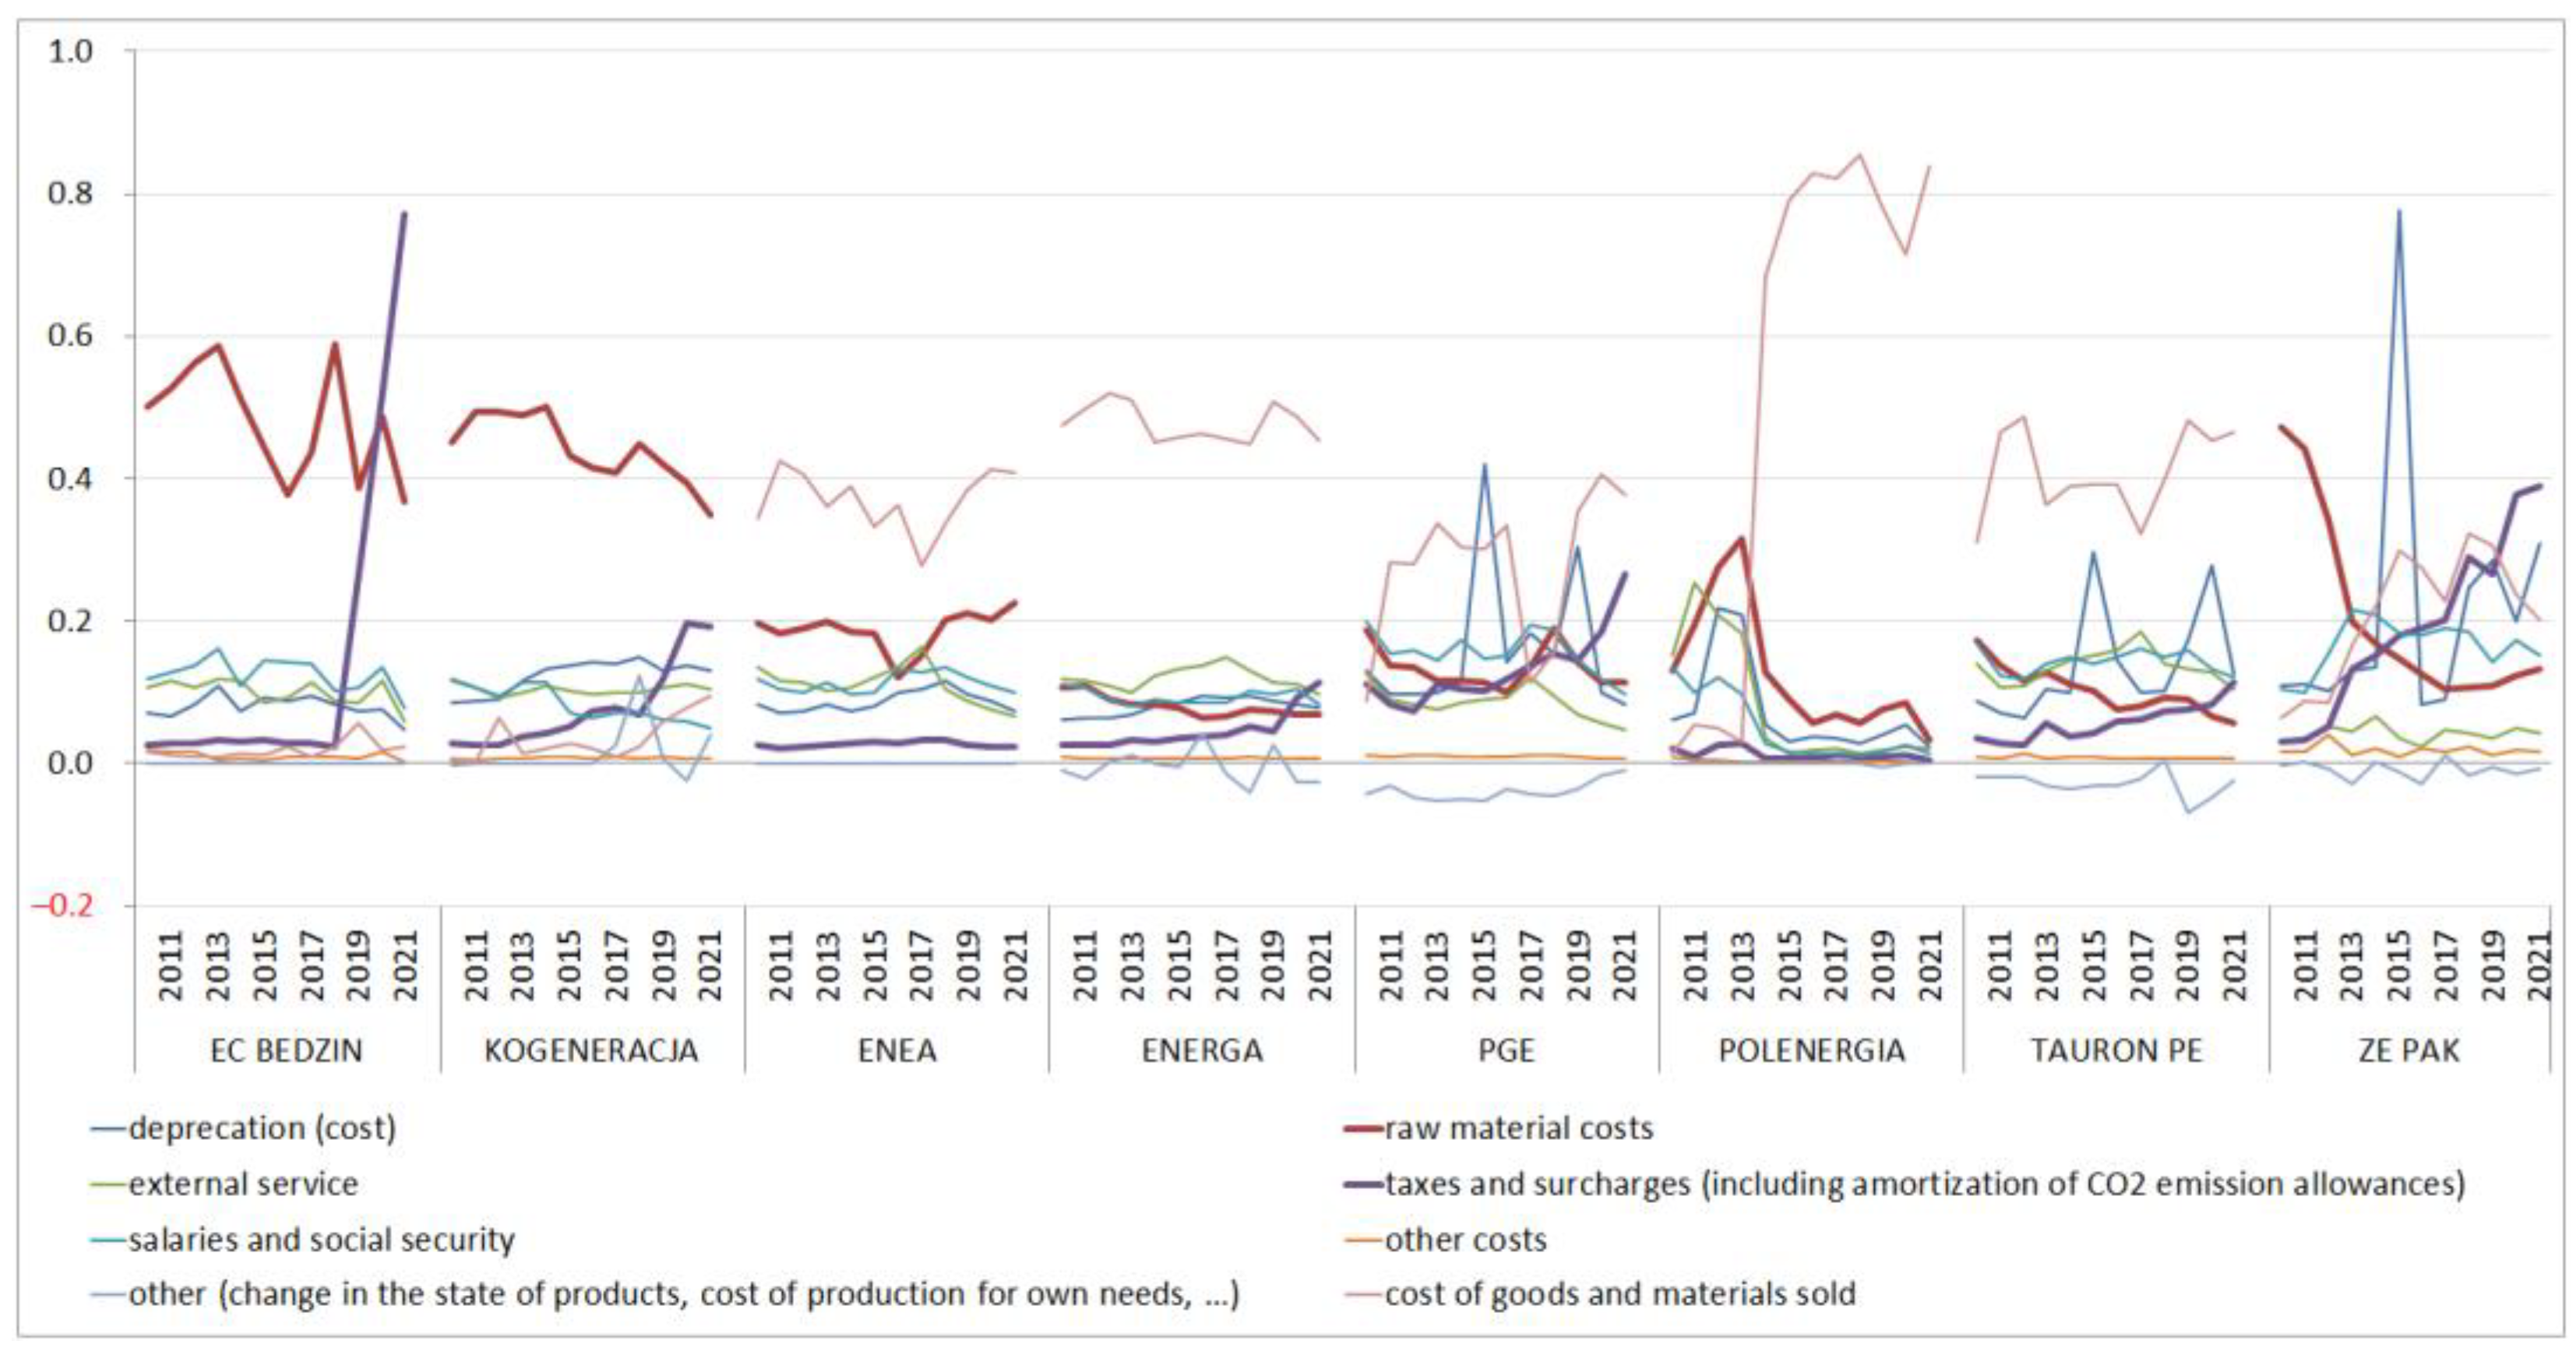
The increase in the price of CO2 emission allowances was most pronounced at EC Będzin SA, a company focused on power and heat generation using coal, which was directly reflected in an increase in operating costs and a deterioration in financial performance, including sales and operating margins. The poor current performance situation translated into an increase in debt and the collapse of the capital and asset structure at this company.
(2)
ZE PAK SA was also affected by the effect of the increase in the price of carbon emission allowances, although to a lesser extent than in Będzin SA (increase in operating costs, deterioration of financial results, and increase in debt). The reasons for this are similar to Będzin SA’s power generation structure (coal-based) and poor diversification of business segments (dominance of generation).
(3)
In the other companies surveyed, the increase in the price of carbon allowances did not cause a significant financial impact. This is due to the diversification of operations and the offsetting of potential increases in power generation costs (related to the purchase of CO2 allowances) from segments related to energy distribution and trading (favorable sales and operating margins).
In the context of the above empirical findings, the following general observations can be made:
  • The restrictiveness of the European Union’s climate policy, as expressed in the introduction, and tightening of the rules for the operation of carbon allowances, has the strongest impact on companies that do not diversify their operations in the energy sector and do not use low-carbon energy sources.
  • In the long term, companies following the above strategy are at risk of bankruptcy due to rising costs, deteriorating financial performance, and a collapse of the capital structure.
  • Thus, in the context of the above statements, it can be concluded that the instruments of financial repression for environmental abuses are effective because they force energy companies to change the energy mix they use and, in extreme cases, can even threaten their continued operation.
  • Diversification of operations in the energy sector (combining generation, distribution, trading) and maximizing the use of low-carbon sources (gas + renewables) can be an effective way to increase the resilience of companies to the increase in market risk associated with rising CO2 prices.
  • Nevertheless, the above method must not take the extreme form of reducing the business to trading and distribution, as it will then only mean a form of avoiding overexposure to market risk associated with the need to purchase emission rights.
  • It is also worth adding that the focus of domestic energy companies only or mainly on energy trading and distribution may pose a threat to the security and stability of the Polish energy system, as it may lead to a situation in which there is a shortage of energy producers and domestic sources are replaced by energy imports.
This research provides insight into the impact of the introduction of CO2 on the financial performance of companies in the energy industry in emerging economies. Research in this area has not been conducted before and can be used both by energy companies to build effective environmental strategies and by policymakers at the economic level to induce desired environmental changes.
Their main limitation is the use of case studies, which does not allow for broad generalization of research conclusions. In addition, cognitive conclusions are based on the analysis of typical financial indicators, which hinders the in-depth analysis of cause-and-effect relationships. The results obtained concern Polish enterprises and the energy sector, which limits their applicability to a specific region. Nevertheless—taking into account the difficulties of other EU developing economies with the implementation of EU climate policy—they can be an inspiration for further research and comparative analyses.
Further research could use a comparative analysis including cases from other European emerging or developing economies. It would also be possible to strengthen the analysis performed by examining the statistical relationship between the quotation of emission allowance contracts and the perception of the companies under study by stock market investors based on an analysis of capital market indicators. Finally, taking into account contemporary research on the impact of ETS on innovation, it would be worthwhile to look at this aspect of the activities of the surveyed companies, as well as the directions and effects of the spending of additional EU funds supporting the implementation of the European Union’s climate policy.

Author Contributions

Conceptualization, T.L.N. and I.J.-K.; methodology, T.L.N. and I.J.-K.; software, T.L.N. and I.J.-K.; validation, T.L.N. and I.J.-K.; formal analysis, T.L.N. and I.J.-K.; investigation, T.L.N. and I.J.-K.; resources, T.L.N. and I.J.-K.; data curation, T.L.N. and I.J.-K.; writing—original draft preparation, T.L.N. and I.J.-K.; writing—review and editing, T.L.N. and I.J.-K.; visualization, T.L.N. and I.J.-K.; supervision, T.L.N. and I.J.-K.; project administration, T.L.N. and I.J.-K.; funding acquisition, T.L.N. and I.J.-K. All authors have read and agreed to the published version of the manuscript.

Funding

The research was financed from Statutory research No. 13/010/BK_21/0057 and No. 13/010/BK_23/0072 (Institute of Economics and Computer Science, Faculty of Organization and Management, Silesian University of Technology).

Data Availability Statement

https://www.money.pl/ (accessed on 27 November 2022).

Conflicts of Interest

The authors declare no conflict of interest.

References

  1. Khan, S.A.R.; Ibrahim, R.L.; Al-Amin, A.Q.; Yu, Z. An Ideology of Sustainability under Technological Revolution: Striving towards Sustainable Development. Sustainability 2022, 14, 4415. [Google Scholar] [CrossRef]
  2. Potrč, S.; Čuček, L.; Martin, M.; Kravanja, Z. Sustainable renewable energy supply networks optimization—The gradual transition to a renewable energy system within the European Union by 2050. Renew. Sustain. Energy Rev. 2021, 146, 111186. [Google Scholar] [CrossRef]
  3. Afshan, S.; Ozturk, I.; Yaqoob, T. Facilitating renewable energy transition, ecological innovations and stringent environmental policies to improve ecological sustainability: Evidence from MM-QR method. Renew. Energy 2022, 196, 151–160. [Google Scholar] [CrossRef]
  4. Dall-Orsoletta, A.; Romero, F.; Ferreira, P. Open and collaborative innovation for the energy transition: An exploratory study. Technol. Soc. 2022, 69, 101955. [Google Scholar] [CrossRef]
  5. Heffron, R.J. Applying energy justice into the energy transition. Renew. Sustain. Energy Rev. 2022, 156, 111936. [Google Scholar] [CrossRef]
  6. Chen, B.; Xiong, R.; Li, H.; Sun, Q.; Yang, J. Pathways for sustainable energy transition. J. Clean. Prod. 2019, 228, 1564–1571. [Google Scholar] [CrossRef]
  7. Hu, W.; Wang, D. How does environmental regulation influence China’s carbon productivity? An empirical analysis based on the spatial spillover effect. J. Clean. Prod. 2020, 257, 120484. [Google Scholar] [CrossRef]
  8. Bublyk, M.; Kowalska-Styczeń, A.; Lytvyn, V.; Vysotska, V. The Ukrainian Economy Transformation into the Circular Based on Fuzzy-Logic Cluster Analysis. Energies 2021, 14, 5951. [Google Scholar] [CrossRef]
  9. Grosse, T.G. Low Carbon Economy Policy in Poland: An Example of the Impact of Europeanisation. Equilibrium 2011, 6, 9–39. [Google Scholar] [CrossRef]
  10. Lin, C.; Zhang, L.; Zhang, Z. The impact of the rise of emerging economies on global industrial CO2 emissions: Evidence from emerging economies in Regional Comprehensive Economic Partnership. Resour. Conserv. Recycl. 2022, 177, 106007. [Google Scholar] [CrossRef]
  11. Kumar, S. Pakistan’s Energy Security: Challenges and Options. Strat. Anal. 2010, 34, 912–924. [Google Scholar] [CrossRef]
  12. Nguyen, C.P.; Schinckus, C.; Su, T.D. Economic integration and CO2 emissions: Evidence from emerging economies. Clim. Dev. 2020, 12, 369–384. [Google Scholar] [CrossRef]
  13. Hadfield, P.; Cook, A. Financing the Low-Carbon City: Can Local Government Leverage Public Finance to Facilitate Equitable Decarbonisation? Urban Policy Res. 2019, 37, 13–29. [Google Scholar] [CrossRef]
  14. Shepard, J.U.; van Ruijven, B.J.; Zakeri, B. Impacts of Trade Friction and Climate Policy on Global Energy Trade Network. Energies 2022, 15, 6171. [Google Scholar] [CrossRef]
  15. Księżopolski, K.; Maśloch, G. Time Delay Approach to Renewable Energy in the Visegrad Group. Energies 2021, 14, 1928. [Google Scholar] [CrossRef]
  16. Famulska, T.; Kaczmarzyk, J.; Grząba-Włoszek, M. Environmental Taxes in the Member States of the European Union—Trends in Energy Taxes. Energies 2022, 15, 8718. [Google Scholar] [CrossRef]
  17. Quaranta, E.; Aggidis, G.; Boes, R.M.; Comoglio, C.; De Michele, C.; Patro, E.R.; Georgievskaia, E.; Harby, A.; Kougias, I.; Muntean, S.; et al. Assessing the energy potential of modernizing the European hydropower fleet. Energy Convers. Manag. 2021, 246, 114655. [Google Scholar] [CrossRef]
  18. Quaranta, E.; Bódis, K.; Kasiulis, E.; McNabola, A.; Pistocchi, A. Is There a Residual and Hidden Potential for Small and Micro Hydropower in Europe? A Screening-Level Regional Assessment. Water Resour. Manag. 2022, 36, 1745–1762. [Google Scholar] [CrossRef]
  19. Beal, C.M.; King, C.W. The zero-emissions cost of energy: A policy concept. Prog. Energy 2022, 3, 023001. [Google Scholar] [CrossRef]
  20. Guo, Z.; Liu, H. The impact of carbon tax policy on energy consumption and CO2 emission in China. Energy Sources Part B Econ. Plan. Policy 2016, 11, 725–731. [Google Scholar] [CrossRef]
  21. Wolde-Rufael, Y.; Weldemeskel, E.M. Environmental policy stringency, renewable energy consumption and CO2 emissions: Panel cointegration analysis for BRIICTS countries. Int. J. Green Energy 2020, 17, 568–582. [Google Scholar] [CrossRef]
  22. Mu, H.; Pei, Z.; Wang, H.; Li, N.; Duan, Y. Optimal Strategy for Low-Carbon Development of Power Industry in Northeast China Considering the ‘Dual Carbon’ Goal. Energies 2022, 15, 6455. [Google Scholar] [CrossRef]
  23. Segura, S.; Ferruz, L.; Gargallo, P.; Salvador, M. EU ETS CO2 emissions constraints and business performance: A quantile regression approach. Appl. Econ. Lett. 2014, 21, 129–134. [Google Scholar] [CrossRef]
  24. Swain, R.B.; Karimu, A.; Gråd, E. Sustainable development, renewable energy transformation and employment impact in the EU. Int. J. Sustain. Dev. World Ecol. 2022, 29, 695–708. [Google Scholar] [CrossRef]
  25. Hillebrand, R. Climate protection, energy security, and Germany’s policy of ecological modernisation. Environ. Politics 2013, 22, 664–682. [Google Scholar] [CrossRef]
  26. Kastanaki, E.; Giannis, A. Energy decarbonisation in the European Union: Assessment of photovoltaic waste recycling potential. Renew. Energy 2022, 192, 1–13. [Google Scholar] [CrossRef]
  27. Biresselioglu, M.E.; Demir, M.H.; Kaplan, M.D.; Solak, B. Individuals, collectives, and energy transition: Analysing the motivators and barriers of European decarbonisation. Energy Res. Soc. Sci. 2020, 66, 101493. [Google Scholar] [CrossRef]
  28. European Commission. Communication from the Commission: Europe 2020: A Strategy for Smart, Sustainable and Inclusive Growth, Brussels; European Commission: Brussel, Belgium, 2009.
  29. European Commission. Communication from the Commission to the European Parliament, the Council, the European Economic and Social Committee and the Committee of the Regions: A Policy Framework for Climate and Energy in the Period from 2020 to 2030; European Commission: Brussel, Belgium, 2014.
  30. Kruse-Andersen, P.K.; Sørensen, P.B. Optimal carbon taxation in EU frontrunner countries: Coordinating with the EU ETS and addressing leakage. Clim. Policy 2022. [Google Scholar] [CrossRef]
  31. Demailly, D.; Quirion, P. CO2 abatement, competitiveness and leakage in the European cement industry under the EU ETS: Grandfathering versus output-based allocation. Clim. Policy 2006, 6, 93–113. [Google Scholar] [CrossRef]
  32. Hill, M.R. The European Union’s Emissions Trading Scheme: A Policy Response to the Kyoto Protocol. J. Contemp. Eur. Stud. 2006, 14, 393–410. [Google Scholar] [CrossRef]
  33. Fitch-Roy, O.; Fairbrass, J.; Benson, D. Ideas, coalitions and compromise: Reinterpreting EU-ETS lobbying through discursive institutionalism. J. Eur. Public Policy 2020, 27, 82–101. [Google Scholar] [CrossRef]
  34. Garcia-Torea, N.; Giordano-Spring, S.; Larrinaga, C.; Rivière-Giordano, G. Accounting for Carbon Emission Allowances: An Empirical Analysis in the EU ETS Phase 3. Soc. Environ. Account. J. 2022, 42, 93–115. [Google Scholar] [CrossRef]
  35. Available online: https://climate.ec.europa.eu/eu-action/eu-emissions-trading-system-eu-ets_en (accessed on 1 November 2022).
  36. Adamczewski, T. Forum Energii Po co Jest EU-ETS Ijaka Reforma nas Czeka? Available online: https://www.forum-energii.eu/pl/blog/ets-reforma (accessed on 20 November 2022).
  37. Nielsen, H.; Warde, P.; Kander, A. East versus West: Energy intensity in coal-rich Europe, 1800–2000. Energy Policy 2018, 122, 75–83. [Google Scholar] [CrossRef]
  38. Pérez, M.D.L.E.M.; Scholten, D.; Stegen, K.S. The multi-speed energy transition in Europe: Opportunities and challenges for EU energy security. Energy Strat. Rev. 2019, 26, 100415. [Google Scholar] [CrossRef]
  39. Balezentis, T. Shrinking ageing population and other drivers of energy consumption and CO2 emission in the residential sector: A case from Eastern Europe. Energy Policy 2020, 140, 111433. [Google Scholar] [CrossRef]
  40. Zhang, Y.-J.; Wang, A.-D.; Tan, W. The impact of China’s carbon allowance allocation rules on the product prices and emission reduction behaviors of ETS-covered enterprises. Energy Policy 2015, 86, 176–185. [Google Scholar] [CrossRef]
  41. Zhi, H.; Ni, L.; Zhu, D. The impact of emission trading system on clean energy consumption of enterprises: Evidence from a quasi-natural experiment in China. J. Environ. Manag. 2022, 318, 115613. [Google Scholar] [CrossRef] [PubMed]
  42. Wang, W.; Xie, P.; Wang, W.; Zhao, D. Overview and evaluation of the mitigation efficiency for China’s seven pilot ETS. Energy Sources Part A Recovery Util. Environ. Eff. 2022, 44, 1798–1812. [Google Scholar] [CrossRef]
  43. Wei, Y.; Zhu, R.; Tan, L. Emission trading scheme, technological innovation, and competitiveness: Evidence from China’s thermal power enterprises. J. Environ. Manag. 2022, 320, 115874. [Google Scholar] [CrossRef]
  44. He, M.; Zhu, X.; Li, H. How does carbon emissions trading scheme affect steel enterprises’ pollution control performance? A quasi natural experiment from China. Sci. Total. Environ. 2023, 858, 159871. [Google Scholar] [CrossRef]
  45. Park, H. Factors to enhance reduction technology development through ETS. Energy Strat. Rev. 2020, 29, 100489. [Google Scholar] [CrossRef]
  46. Yang, L.; Li, F.; Zhang, X. Chinese companies’ awareness and perceptions of the Emissions Trading Scheme (ETS): Evidence from a national survey in China. Energy Policy 2016, 98, 254–265. [Google Scholar] [CrossRef]
  47. Chen, Z.; Zhang, X.; Chen, F. Do carbon emission trading schemes stimulate green innovation in enterprises? Evidence from China. Technol. Forecast. Soc. Chang. 2021, 168, 120744. [Google Scholar] [CrossRef]
  48. He, Y.; Wei, Y.; Fang, Y.; Cao, Y. Booming or sinking: How does an emission trading scheme affect enterprise value? Chin. J. Popul. Resour. Environ. 2022, 20, 227–236. [Google Scholar] [CrossRef]
  49. Paramati, S.R.; Mo, D.; Gupta, R. The effects of stock market growth and renewable energy use on CO2 emissions: Evidence from G20 countries. Energy Econ. 2017, 66, 360–371. [Google Scholar] [CrossRef]
  50. Wang, W.; Zhang, Y.-J. Does China’s carbon emissions trading scheme affect the market power of high-carbon enterprises? Energy Econ. 2022, 108, 105906. [Google Scholar] [CrossRef]
  51. Spassov, Y.; Krustev, A.; Nikolovska, V. Lowest-cost Abatement in Light of the EU ETS and Renewable Feed-in Tariffs in the Electricity Sector in Bulgaria. J. Energy Nat. Resour. Law 2011, 29, 281–303. [Google Scholar] [CrossRef]
  52. Howie, P.; Atakhanova, Z. Assessing initial conditions and ETS outcomes in a fossil-fuel dependent economy. Energy Strategy Rev. 2022, 40, 100818. [Google Scholar] [CrossRef]
  53. Joltreau, E.; Sommerfeld, K. Why does emissions trading under the EU Emissions Trading System (ETS) not affect firms’ competitiveness? Empirical findings from the literature. Clim. Policy 2019, 19, 453–471. [Google Scholar] [CrossRef] [Green Version]
  54. De Beule, F.; Schoubben, F.; Struyfs, K. The pollution haven effect and investment leakage: The case of the EU-ETS. Econ. Lett. 2022, 215, 110536. [Google Scholar] [CrossRef]
  55. Mularczyk, A.; Zdonek, I.; Turek, M.; Tokarski, S. Intentions to Use Prosumer Photovoltaic Technology in Poland. Energies 2022, 15, 6300. [Google Scholar] [CrossRef]
  56. Ober, J.; Karwot, J. Pro-Ecological Behavior: Empirical Analysis on the Example of Polish Consumers. Energies 2022, 15, 1690. [Google Scholar] [CrossRef]
  57. Wolniak, R.; Skotnicka-Zasadzień, B. Development of Photovoltaic Energy in EU Countries as an Alternative to Fossil Fuels. Energies 2022, 15, 662. [Google Scholar] [CrossRef]
  58. Zdonek, I.; Tokarski, S.; Mularczyk, A.; Turek, M. Evaluation of the Program Subsidizing Prosumer Photovoltaic Sources in Poland. Energies 2022, 15, 846. [Google Scholar] [CrossRef]
  59. Jonek-Kowalska, I. Multi-criteria evaluation of the effectiveness of energy policy in Central and Eastern European countries in a long-term perspective. Energy Strategy Rev. 2022, 44, 100973. [Google Scholar] [CrossRef]
  60. Jonek-Kowalska, I. Towards the reduction of CO2 emissions. Paths of pro-ecological transformation of energy mixes in European countries with an above-average share of coal in energy consumption. Resour. Policy 2022, 77, 102701. [Google Scholar] [CrossRef]
  61. Jonek-Kowalska, I.; Nawrocki, T.L. Holistic fuzzy evaluation of operational risk in polish mining enterprises in a long-term and sectoral research perspective. Resour. Policy 2019, 63, 101464. [Google Scholar] [CrossRef]
  62. Gajdzik, B.; Wolniak, R.; Grebski, W.W. An Econometric Model of the Operation of the Steel Industry in Poland in the Context of Process Heat and Energy Consumption. Energies 2022, 15, 7909. [Google Scholar] [CrossRef]
  63. Midor, K.; Ivanova, T.N.; Molenda, M.; Biały, W.; Zakharov, O.V. Aspects of Energy Saving of Oil-Producing Enterprises. Energies 2022, 15, 259. [Google Scholar] [CrossRef]
  64. Nawrocki, T.L.; Jonek-Kowalska, I. Assessing operational risk in coal mining enterprises—Internal, industrial and international perspectives. Resour. Policy 2016, 48, 50–67. [Google Scholar] [CrossRef]
  65. Janik, A.; Ryszko, A.; Szafraniec, M. Determinants of the EU Citizens’ Attitudes towards the European Energy Union Priorities. Energies 2021, 14, 5237. [Google Scholar] [CrossRef]
  66. Jonek-Kowalska, I. How do turbulent sectoral conditions sector influence the value of coal mining enterprises? Perspectives from the Central-Eastern Europe coal mining industry. Resour. Policy 2018, 55, 103–112. [Google Scholar] [CrossRef]
  67. Król, K.; Zdonek, D. Local Government Website Accessibility—Evidence from Poland. Adm. Sci. 2020, 10, 22. [Google Scholar] [CrossRef]
  68. Available online: https://www.money.pl/ (accessed on 1 November 2022).
Figure 1. The emission of CO2 in Poland (in thousands of tons).
Energies 16 00826 g001
Figure 2. The structure of electricity generation in the surveyed power companies by low-carbon and carbon-fired sources. Source: own elaboration.
Energies 16 00826 g002
Figure 3. Structure of revenue from sales to external customers of the surveyed energy companies by business segment. Source: own elaboration.
Energies 16 00826 g003
Figure 4. Structure of total sales revenues (to external customers + inter-segment sales) of the surveyed energy companies by business segment. Source: own elaboration.
Energies 16 00826 g004
Figure 5. Net sales margin and operating margin of the surveyed energy companies (in %) vs. CO2 rights contract prices (in EUR/ton). Source: own elaboration.
Energies 16 00826 g005
Figure 6. Structure of generic costs of the surveyed energy companies. Source: own elaboration.
Energies 16 00826 g006
Figure 7. Cost level indicators for individual costs by type in surveyed energy companies (given cost by type/sales revenues). Source: own elaboration.
Energies 16 00826 g007
Figure 8. Structure of operating profit of the surveyed energy companies by business segment. Source: own elaboration.
Energies 16 00826 g008
Figure 9. Operating margin on sales in the surveyed energy companies within main business segments. Source: own elaboration.
Energies 16 00826 g009
Figure 10. Coverage of fixed assets with fixed capital in analyzed energy companies. Source: own elaboration.
Energies 16 00826 g010
Figure 11. Debt level in analyzed energy companies. Source: own elaboration.
Energies 16 00826 g011
Table 1. The characteristics of the researched energy companies.
No.EnterpriseBusiness Description
1EC Będzin SAThe company’s core business is the generation of heat and electricity. It is the main source of heat for heating, hot water, and process heat for the Dąbrowa Basin. Customers are industrial, municipal, and service sector entities and households.
2Kogeneracja SAManufacturer of electricity and heat generated in cogeneration. It consists of three power plants: EC Wrocław, EC Czechnica, and EC Zawidawie. It is part of PGE Energia Ciepła, a PGE Group Company.
3Enea SAThe group is a vertically integrated structure that covers with its activity five basic areas on the energy market: electric and thermal energy production (e.g., Kozienice Power Station and Połaniec Power Station), trade in electrical energy, distribution of electrical energy, distribution of heat, as well as mining and enriching hard coal (Lubelski Węgiel Bogdanka). The group provides energy for 2.5 million customers, and the distribution network covers 1/5 of the country.
4Energa SAThe core activity of the company involves production, distribution, and trade in electric and thermal energy. The total installed electrical capacity of the group’s power plants is about 1.4 GW. The company’s generating capacity includes a system power plant in Ostrołęka, 2 thermal power plants, 47 hydroelectric power plants, a pumped storage power plant in Żydów, as well as 5 wind farms and 2 photovoltaic farms. The distribution network of the group covers 1/4 of the country.
5PGE SAIt is a vertically integrated entity, participating in the entire electricity value chain. It is one of the biggest electricity sector companies in Poland. The group is involved in lignite extraction, production of electrical energy out of fossil fuels (lignite, hard coal, natural gas) and from renewable energy sources (water power plants, wind farms, biomass), and distribution and sale of electrical energy to end customers.
6Polenergia SAIt is Poland’s first private energy group consisting of vertically integrated companies operating in the areas of power generation from renewable and low-carbon gas sources, distribution and trading, and sale of electricity to retail and business customers.
7Tauron PE SAThis group is one of the leading energy concerns in Poland, covering with its scope 18% of the country’s territory. It is the biggest distributor in the country and the second biggest seller and manufacturer of electrical energy. The basic areas of the group’s activities that create the energy value chain are the extraction of hard coal, production, distribution, and sale of electrical energy and heat.
8ZE PAK SAThe group generates energy from conventional sources and by burning and co-firing biomass. The generation assets include four lignite-fired power plants located in central Poland, in the Wielkopolskie Province (Pątnów II Power Plant, which is equipped with a supercritical power unit, Konin Power Plant, and two power plants additionally equipped with biomass co-firing facilities: Pątnów I Power Plant and Adamów Power Plant).
Source: [68].
Table 2. Average annual prices of emission allowances (EUR/EUA) and their changes over time (in %).
SpecificationYears
201020112012201320142015201620172018201920202021
Price13.4710.596.535.686.067.657.387.1216.4624.7228.6856.68
Price dynamics (previous year = 100%)100%79%62%87%107%126%97%96%231%150%116%198%
Price dynamics (2010 = 100%)100%79%48%42%45%57%55%53%122%184%213%421%
Disclaimer/Publisher’s Note: The statements, opinions and data contained in all publications are solely those of the individual author(s) and contributor(s) and not of MDPI and/or the editor(s). MDPI and/or the editor(s) disclaim responsibility for any injury to people or property resulting from any ideas, methods, instructions or products referred to in the content.

