Article

Rational Use of Energy in Sports Centres to Achieve Net Zero: The SAVE Project (Part A)

by
Dimitris A. Katsaprakakis
1,2,*,
Nikos Papadakis
1,
Efi Giannopoulou
3,
Yiannis Yiannakoudakis
2,
George Zidianakis
2,
Michalis Kalogerakis
4,
George Katzagiannakis
5,
Eirini Dakanali
2,
George M. Stavrakakis
1 and
Avraam Kartalidis
6
1
Power Plant Synthesis Laboratory, Department of Mechanical Engineering, Hellenic Mediterranean University, 71410 Heraklion, Greece
2
Aeolian Land S.A., Agias Paraskevis 1, 70300 Arkalochori, Greece
3
Minoan Energy Community, El. Venizelou 183, 70300 Arkalochori, Greece
4
Kalogerakis M. & Associates, 25th August 16, 71202 Heraklion, Greece
5
Minoa Pediadas Municipality, El. Venizelou 212, 70300 Arkalochori, Greece
6
Centre for Research and Technology Hellas/Chemical Process and Energy Resources Institute, Egialeias 52, 15125 Athens, Greece
*
Author to whom correspondence should be addressed.
Energies 2023, 16(10), 4040; https://doi.org/10.3390/en16104040
Submission received: 27 February 2023 / Revised: 27 April 2023 / Accepted: 9 May 2023 / Published: 11 May 2023
(This article belongs to the Topic Energy Saving and Energy Efficiency Technologies)

Abstract

:
Sports centres constitute major energy consumers. This article presents the proposed energy performance upgrade process and the achieved results for the municipal sports centre in Arkalochori, Greece. The facility consists of a swimming pool centre, an outdoor 8 × 8 football court, and two tennis and basketball courts. It operates with considerably high energy consumption due to the lack of any measure towards its energy efficiency improvement since its initial construction in 2002. Due to the significantly high heating cost, the swimming pool centre remains operative only during the summer period. The energy performance upgrade of the facility was holistically approached through all possibly applicable passive and active measures: insulation of opaque surfaces and replacement of openings, construction of a new, bioclimatic enclosure for the swimming pool’s centre and conversion of the current outdoor facility to an indoor one, installation of heat pumps for indoor space conditioning and swimming pool heating, installation of a solar–combi system for domestic hot water production, upgrade of all indoor and outdoor lighting equipment and installation of a photovoltaic plant on the new enclosure’s roof for the compensation of the remaining electricity consumption. With the proposed measures, the municipal sports centre is upgraded to a zero energy facility. The payback period of the investment was calculated at 14 years on the basis of the avoided energy procurement cost. The swimming pool’s centre operation is prolonged during the entire annual period. This work has been funded by the Horizon 2020 project with the acronym “NESOI” and was awarded the public award of the “Islands Gamechanger” competition of the NESOI project and the Clean Energy for EU Islands initiative.

1. Introduction

1.1. Background

Energy saving and, in a more general approach, Rational Use of Energy (RUE) constitute a major pylon of the energy transition. It refers to the maximisation of energy use efficiency and the minimisation of the primary energy consumption for the coverage of the final energy needs and, in general, to the adoption of a more sustainable energy use attitude. Energy saving refers to all sectors of human activities: residential, commercial, municipal facilities, industrial, agricultural-stock farming and transportation. It should be the beginning of a rational and effective energy transition, together with the cultivation of adequate awareness of the local communities [1]. In the European Union (EU), energy saving and the improvement of energy efficiency have been officially introduced as an essential obligation for all Member States with Directive 2018/844 on the energy performance of buildings [2] and Directive 2012/27/EU on energy efficiency [3]. According to these Directives, all Member States should introduce in their national legislation specific targets and measures applied to all final energy consumption sectors, aiming to approach RUE. Indicatively, according to law 4122/2013 [4], all new public and municipal buildings in Greece should be nearly zero energy buildings. To this end, dedicated funding calls and actions are regularly posted, focused mainly on the energy performance upgrade of buildings and other municipal facilities, and specific pilot projects have been accomplished so far [5,6].
Buildings and the buildings’ construction sector were responsible for 30% of the global annual final energy consumption and 27% of the total global energy annual emissions in 2021 [7]. Although energy use in buildings has slowed down since 2010, it is still on the rise, and it is estimated to reach 50% by 2050 [8]. As a result of different economies, resources and climate conditions, there is significant geographical variation associated with the building sector’s share of the total energy consumption [8,9,10,11,12]. In the EU, 63% of the energy consumed in households refers to indoor space heating, 15% to domestic hot water production and 14.5% to lighting [13].
The main motivation for more energy-efficient production methods is the increasing cost of fuel and the requirement for the reduction of CO2 and other harmful emissions [14]. Around the world, green buildings reduce operating costs by approximately 10–30%. However, their construction costs are much higher [15].
Sports facilities, especially outdoor swimming pools and indoor sports halls, have large energy needs for almost all final energy uses: indoor space conditioning, hot water production, swimming pool heating, and lighting. Due to their size and their extensive operation for long periods during the day, the coverage of these final energy usages imposes high energy consumption. For this reason, the energy performance upgrade of energy-consuming sports facilities has high technical and economic feasibility and constitutes a popular topic for technical projects and in the scientific literature. The following literature survey focuses mainly on sports centres and particularly on swimming pools since this is the main topic of the article.

1.2. Literature Review

Although several building codes and benchmark indicators exist for energy-efficiency buildings in different parts of the countries [16,17,18], there has not been much focus on swimming pools, probably because of the specific climatic conditions and operational parameters associated with each specific installation. Additionally, this lack of information may be attributed to the fragmented definitions for even simple concepts such as Zero Emission Building (ZEB), which is different in Europe, the United States, Japan and Korea [19,20,21,22].
Unlike other types of buildings, heating a building with an indoor swimming pool is higher energy intensive due to swimming water heating [23]. The commonly used water heating technologies are associated with high fuel costs and Greenhouse Gas (GHG) emissions [23]. Kampel et al. analysed 43 Norwegian swimming facilities and reported that energy usage is predominantly dependent on the overall water usage of the swimming pool facility [24]. The CIBSE Energy Benchmark [25] reported that, on average, swimming pool centres require 245 kWh/m2 of electricity and 1130 kWh/m2 of gas. Similar results are also found in [26]. This is consistent with other findings that report that swimming facilities use between 400 kWh/m2 and almost 1600 kWh/m2 [23]. Trianti-Stourna et al. audited five Greek swimming facilities [27]. They reported an average annual total energy consumption per unit floor area of 450 kWh/m2 and per water surface area of 1094.5 kWh/m2, and annual electricity consumption per unit floor area of 57.5 kWh/m2.
Passive technologies can be traced back to cave-dwelling, i.e., for thousands of years, and are more energy efficient for building applications [10]. Another important factor is the thermal insulation of a building. The recommended insulation thickness doubled in northern Europe between the 1970s and 2010s [28].
Common passive approaches for buildings, in general, today include sun shading, insulation, interior garden, water features, atrium space and natural ventilation [28,29,30,31]. Additionally, there are different types of energy-efficient walls (such as Trombe walls, ventilated walls and glazed walls) and fenestration types (e.g., aerogel, vacuum glazing and frames) [28,29]. For the roof of a building, several energy-efficient techniques have been proposed, including green roofs, photovoltaic roofs, the radiant barrier and evaporative roof cooling systems [28,29]. Finally, the optimization of the thermal mass of the building (with or without the use of phase change materials) is another possible energy-efficient passive technique (often overlooked) that can affect the thermal loads [28,29].
For swimming pools, Trianti-Stourna [27] reported that simple architectural interventions (i.e., better insulation of external walls and roof, shading of openings and increase in natural ventilation) lead to significant coverage of cooling needs up to 45%.
Various techniques may be implemented to improve energy efficiency in applications that require hot water [10]. Heat pumps and boilers have been developed for over a century, and recent improvements have increased their efficiency [32].
Solar thermal is a widely used renewable energy technology that uses the sun’s radiation to produce hot water (unlike photovoltaics that produce electricity) [33]. According to an International Energy Agency (IEA) report, the global market in operation for solar heating and cooling at the end of 2019 was estimated at 479 GWth worldwide [34]. Fadzlin et al. investigated challenges for building integrated Solar Water Heating (SWH) and reported that only a small percentage of the installed SWH is for applications other than domestic hot water [34]. Evacuated solar thermal collectors have been reported to provide better payback periods compared to other solar thermal collector technologies [35].
Katsaprakakis et al. investigated different passive and active heating systems for swimming pool facilities and reported that passive solar systems reduce the swimming pool heating load by more than 90% and that Geothermal Heat Exchangers (GHE) and Geothermal Heat Pumps (GHP), combined with biomass heaters, can be used to supplement the water heating in energy production [36,37].
A system with a Water-Solar-Assisted Heat Pump (W-SAHP) coupled with unglazed flat solar collectors was considered and was compared to a traditional gas-boiler plant [38]. For the Italian climatic conditions, it was reported that the W-SAHP offered energy saving between 35% and 50%. It was also reported that the power saving was reduced almost linearly with the Degree Days of the site. Chow et al. [39] investigated a solar-assisted heat pump system for indoor swimming pool water and reported that the system’s overall Coefficient of Performance (COP) could reach 4.5, and the fraction factor of energy saving is 79% compared to a conventional energy system.
Combined Heat and Power systems (CHP) from a Phosphoric Acid Fuel Cell were modelled mathematically, and the results showed a high potential to improve the utilization efficiency of the fuel cell production [23]. CHP systems fueled by biomass have also been proposed for water heating in swimming pools [40] and in agricultural processes [41], exhibiting high technical and economic feasibility.
Reclamation of waste heat from an ice rink’s chiller unit was used by a swimming pool heating system in Gaziantep, Turkey [42]. It was reported that an ice rink with a size of 475 m2 gives optimal performance for a semi-Olympic size swimming pool (625 m2). Liebersbach et al. [43] reported a reduction in the energy demand between 34 and 67% of greywater heat recovery for indoor swimming pools.
Significant reductions are also reported by optimization of the operation of the swimming pool. The Pool efficiency program report states that the pool pump energy consumption was reduced by 71% through retrofitting of pump speed controllers [44]. Furthermore, electricity saving in excess of 80% is achievable on the circulators used for the pool’s water heating with typical solar thermal collectors when they operate at flow rates reduced by up to 75%, while the collectors’ efficiency is only reduced by approximately 10–15% [45].
A very important aspect of this work is that this is a large-scale retrofit and not a new installation. The aspect of retrofitting for the Greek building sector has been investigated by Balaras et al. [46]. Several analysis methodologies for energy retrofits can be found in the relevant literature [46,47,48,49,50].
For large-scale retrofits Swan, Ismet, and Ugursal have reviewed techniques for the modelling of end-use energy consumption in the residential sector [51]. Furthermore, Pittarello et al. have proposed an artificial neural network (ANN) methodology to optimize zero-energy building projects from early design stages [52].
Finally, methodologies for assessing the economic effect have been proposed [53,54].

1.3. Research Aim

In this article, the methodology and the results are presented of the implemented application studies on the energy performance upgrade of the municipal sports centre in the small town of Arkalochori, Crete, Greece. The target was the upgrade of the sports centre to a zero energy facility. To this end, the most technically and economically feasible passive and active measures were proposed. The article anticipates presenting in a comprehensive approach the holistic process (methodology, mathematical background, data and assumptions, application details, and results) towards the achievement of the aforementioned target.
The work presented in this article was implemented within the frame of the project “Sustainable Actions for Viable Energy” (SAVE), which was funded by the Horizon 2020 project “New Energy Solutions Optimized for Islands” (NESOI) [55]. The project was implemented by the Minoan Energy Community [56]. The whole project included the design of a smart grid in Crete and the implementation of energy performance upgrade studies for the municipal sports centre and the indoor sports hall in Arkalochori. This first article presents the work accomplished for the municipal sports centre. The SAVE project was awarded the public award of the Islands Gamechanger competition [57], organized by the European Commission’s Secretariat of the “Clean Energy for EU Islands” initiative and the NESOI Consortium.

2. The Sports Facility

As stated previously, the under-consideration sports facility is located in Arkalochori, Crete. Arkalochori is a small town with 5000 population, located at the very centre of the mainland of the Heraklion Prefecture, roughly 25 km from both the northern and the southern coastline of the island, with an absolute altitude from 350 m to 400 m. Within the SAVE project, the energy performance upgrade study was accomplished for the municipal sports centre.
The municipal sports centre, constructed in 2002, contains a swimming pool centre, with two swimming pools, one of Olympic size (50 × 20 m) and a training one (25 × 6 m), two tennis courts, an 8 × 8 football ground and a basketball court (Figure 1). Currently, all the aforementioned facilities are outdoor facilities. The swimming pools are supported by a building which hosts the changing rooms for the swimming pool users, the administrative office, the reception, the medical service office, storage rooms and the engine room (pumps, circulators, and two oil heaters) in the building’s basement. More details on the building’s constructive elements and geometry are given in Section 5.2.2.

3. Methodology

The methodology applied in this work can be analysed in the following discrete steps:
  • Invitation for collaboration with the Municipality and establishment of an open communication line with the staff in charge of the operation and maintenance of the facility;
  • An initial visit to the sports facility and on-site investigation and collection of all required data regarding the existing architectural elements, the operation schedule and the energy demand;
  • First computational simulation of the sports facility’s operation in the existing condition and calculation of the indoor space conditioning and swimming pool heating load for full annual operation;
  • Calculation of the current primary energy consumption for full coverage of all final energy needs, with the existing active systems for indoor space conditioning, swimming pool heating, hot water production, lighting and pumps’ operation;
  • Selection, siting and sizing of the most technically feasible and cost-effective passive measures, aiming at the minimisation of the indoor space conditioning and swimming pool heating load;
  • Second computational simulation of the sports facility’s operation with the introduction of the proposed passive measures and calculation of the indoor space conditioning and swimming pool heating load for full annual operation;
  • Selection and sizing of the most technically feasible and cost-effective active measures for indoor space conditioning, swimming pool heating, hot water production and lighting;
  • Calculation of the primary energy consumption for full coverage of all final energy needs with the proposed active systems;
  • Sizing and siting of a photovoltaic park for the annual compensation of the remaining electricity consumption;
  • Calculation of the achieved annual energy saving, the project’s total budget and other typical Key Performance Indicators (KPIs).
All the aforementioned calculations, both for passive and active systems, were executed computationally on the basis of annual time series with hourly average values. The process and the corresponding mathematical background are given in Section 5. The above-described methodology is given graphically in Figure 2.
Finally, regarding the data involved in this study:
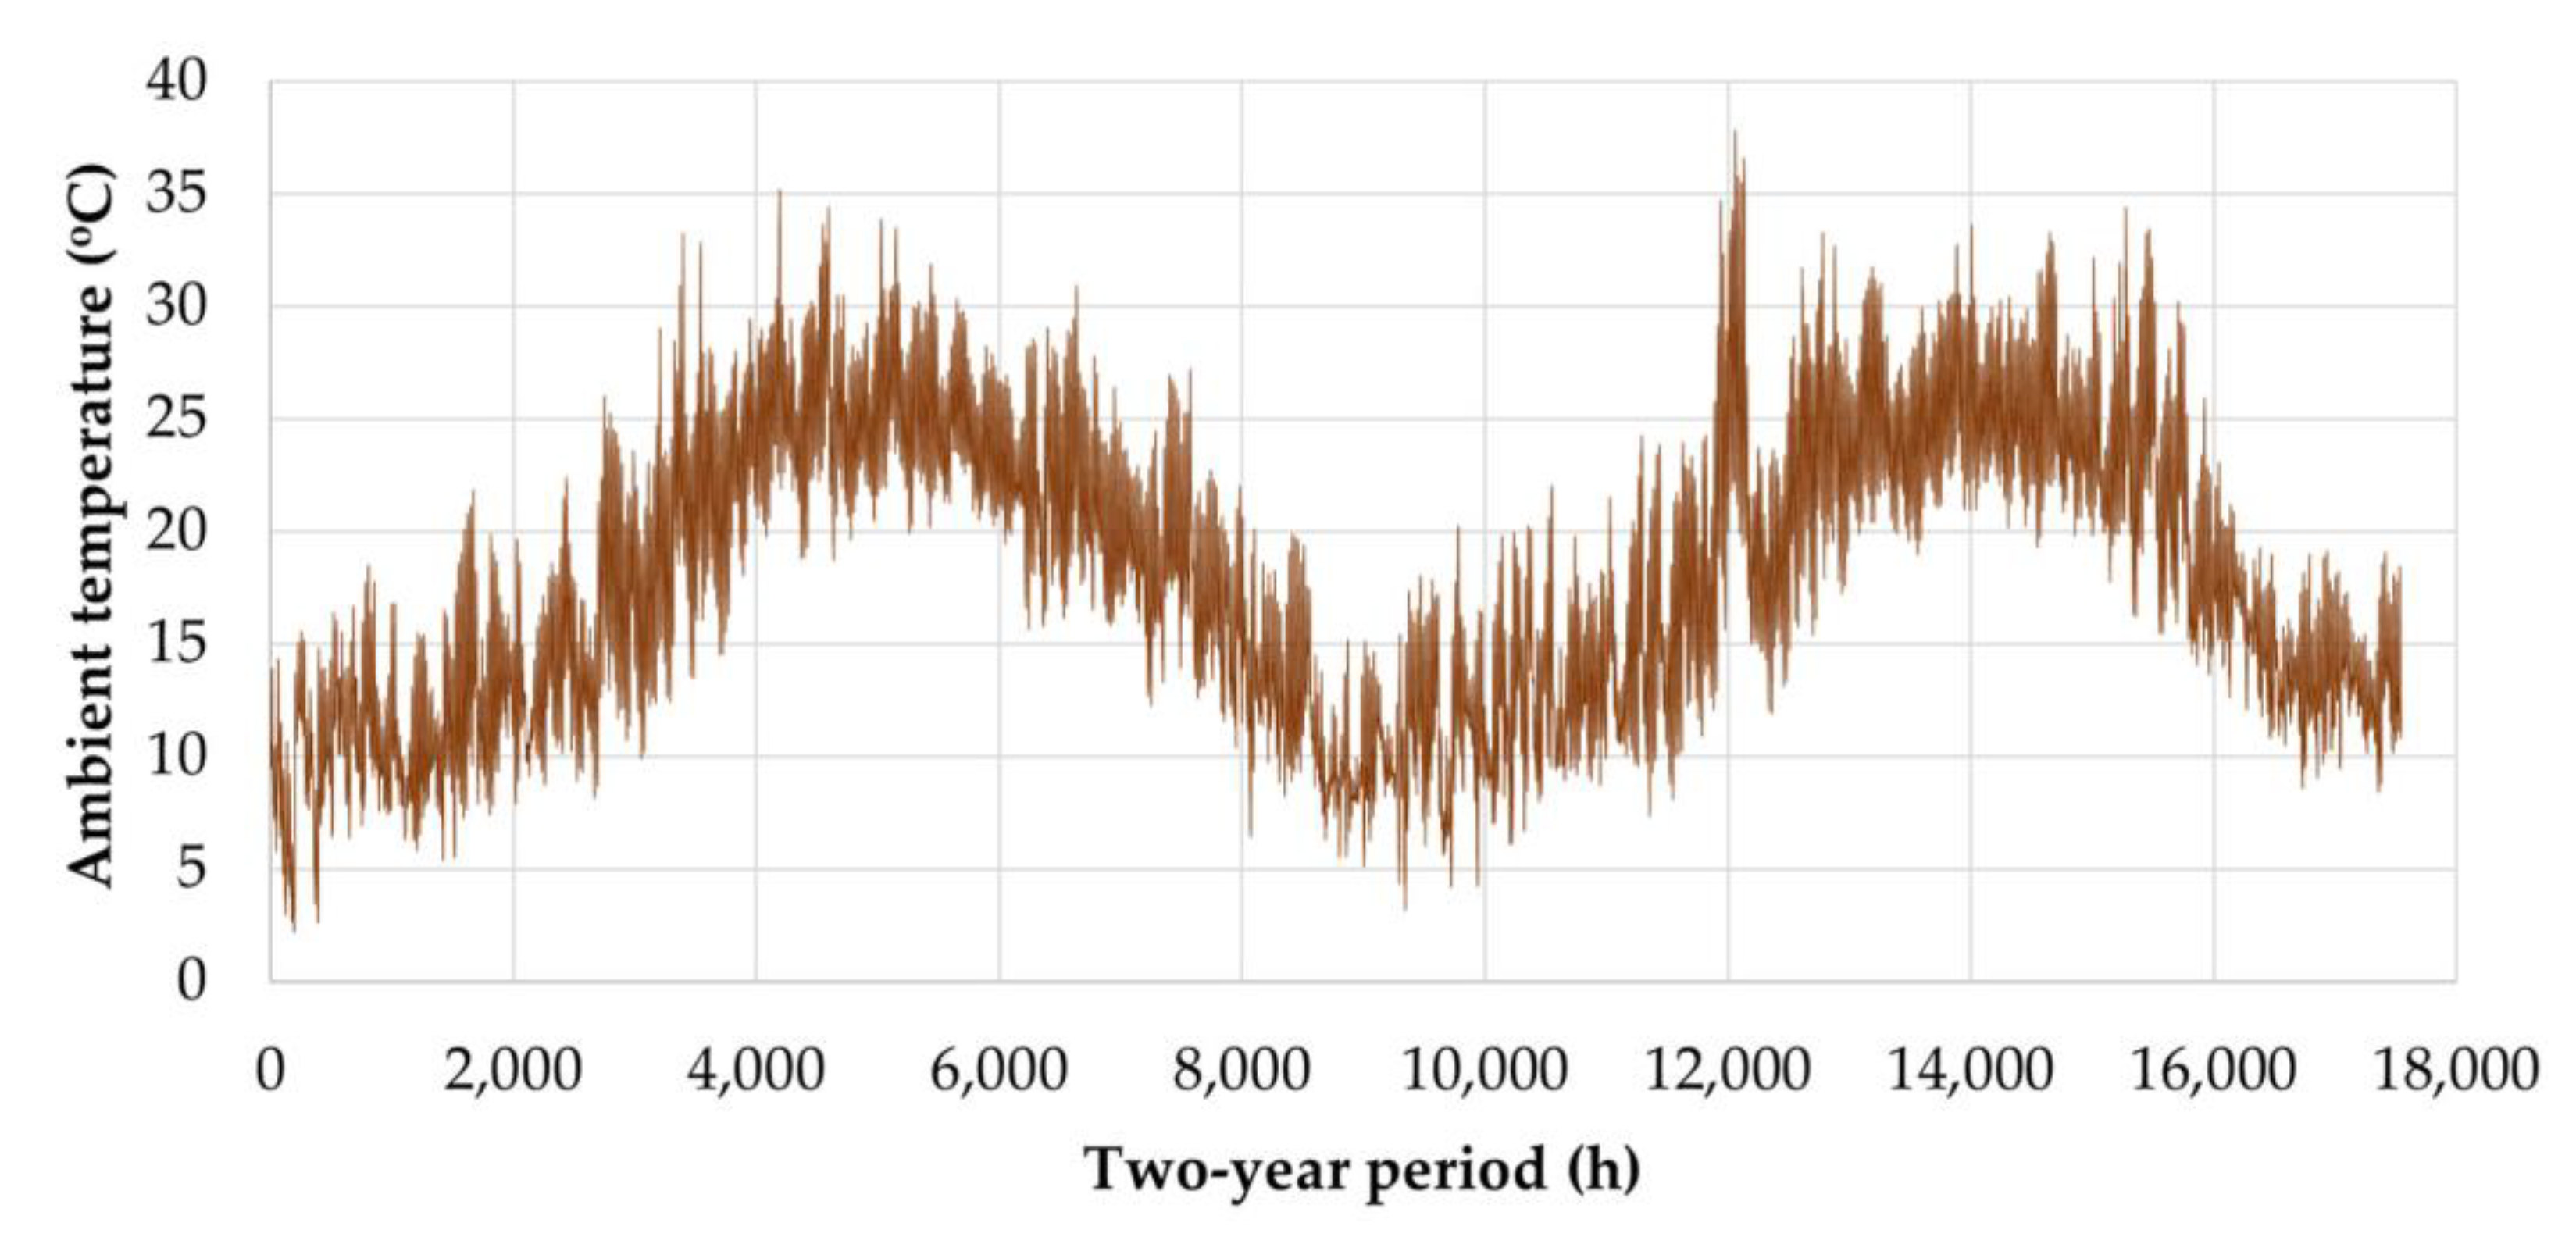
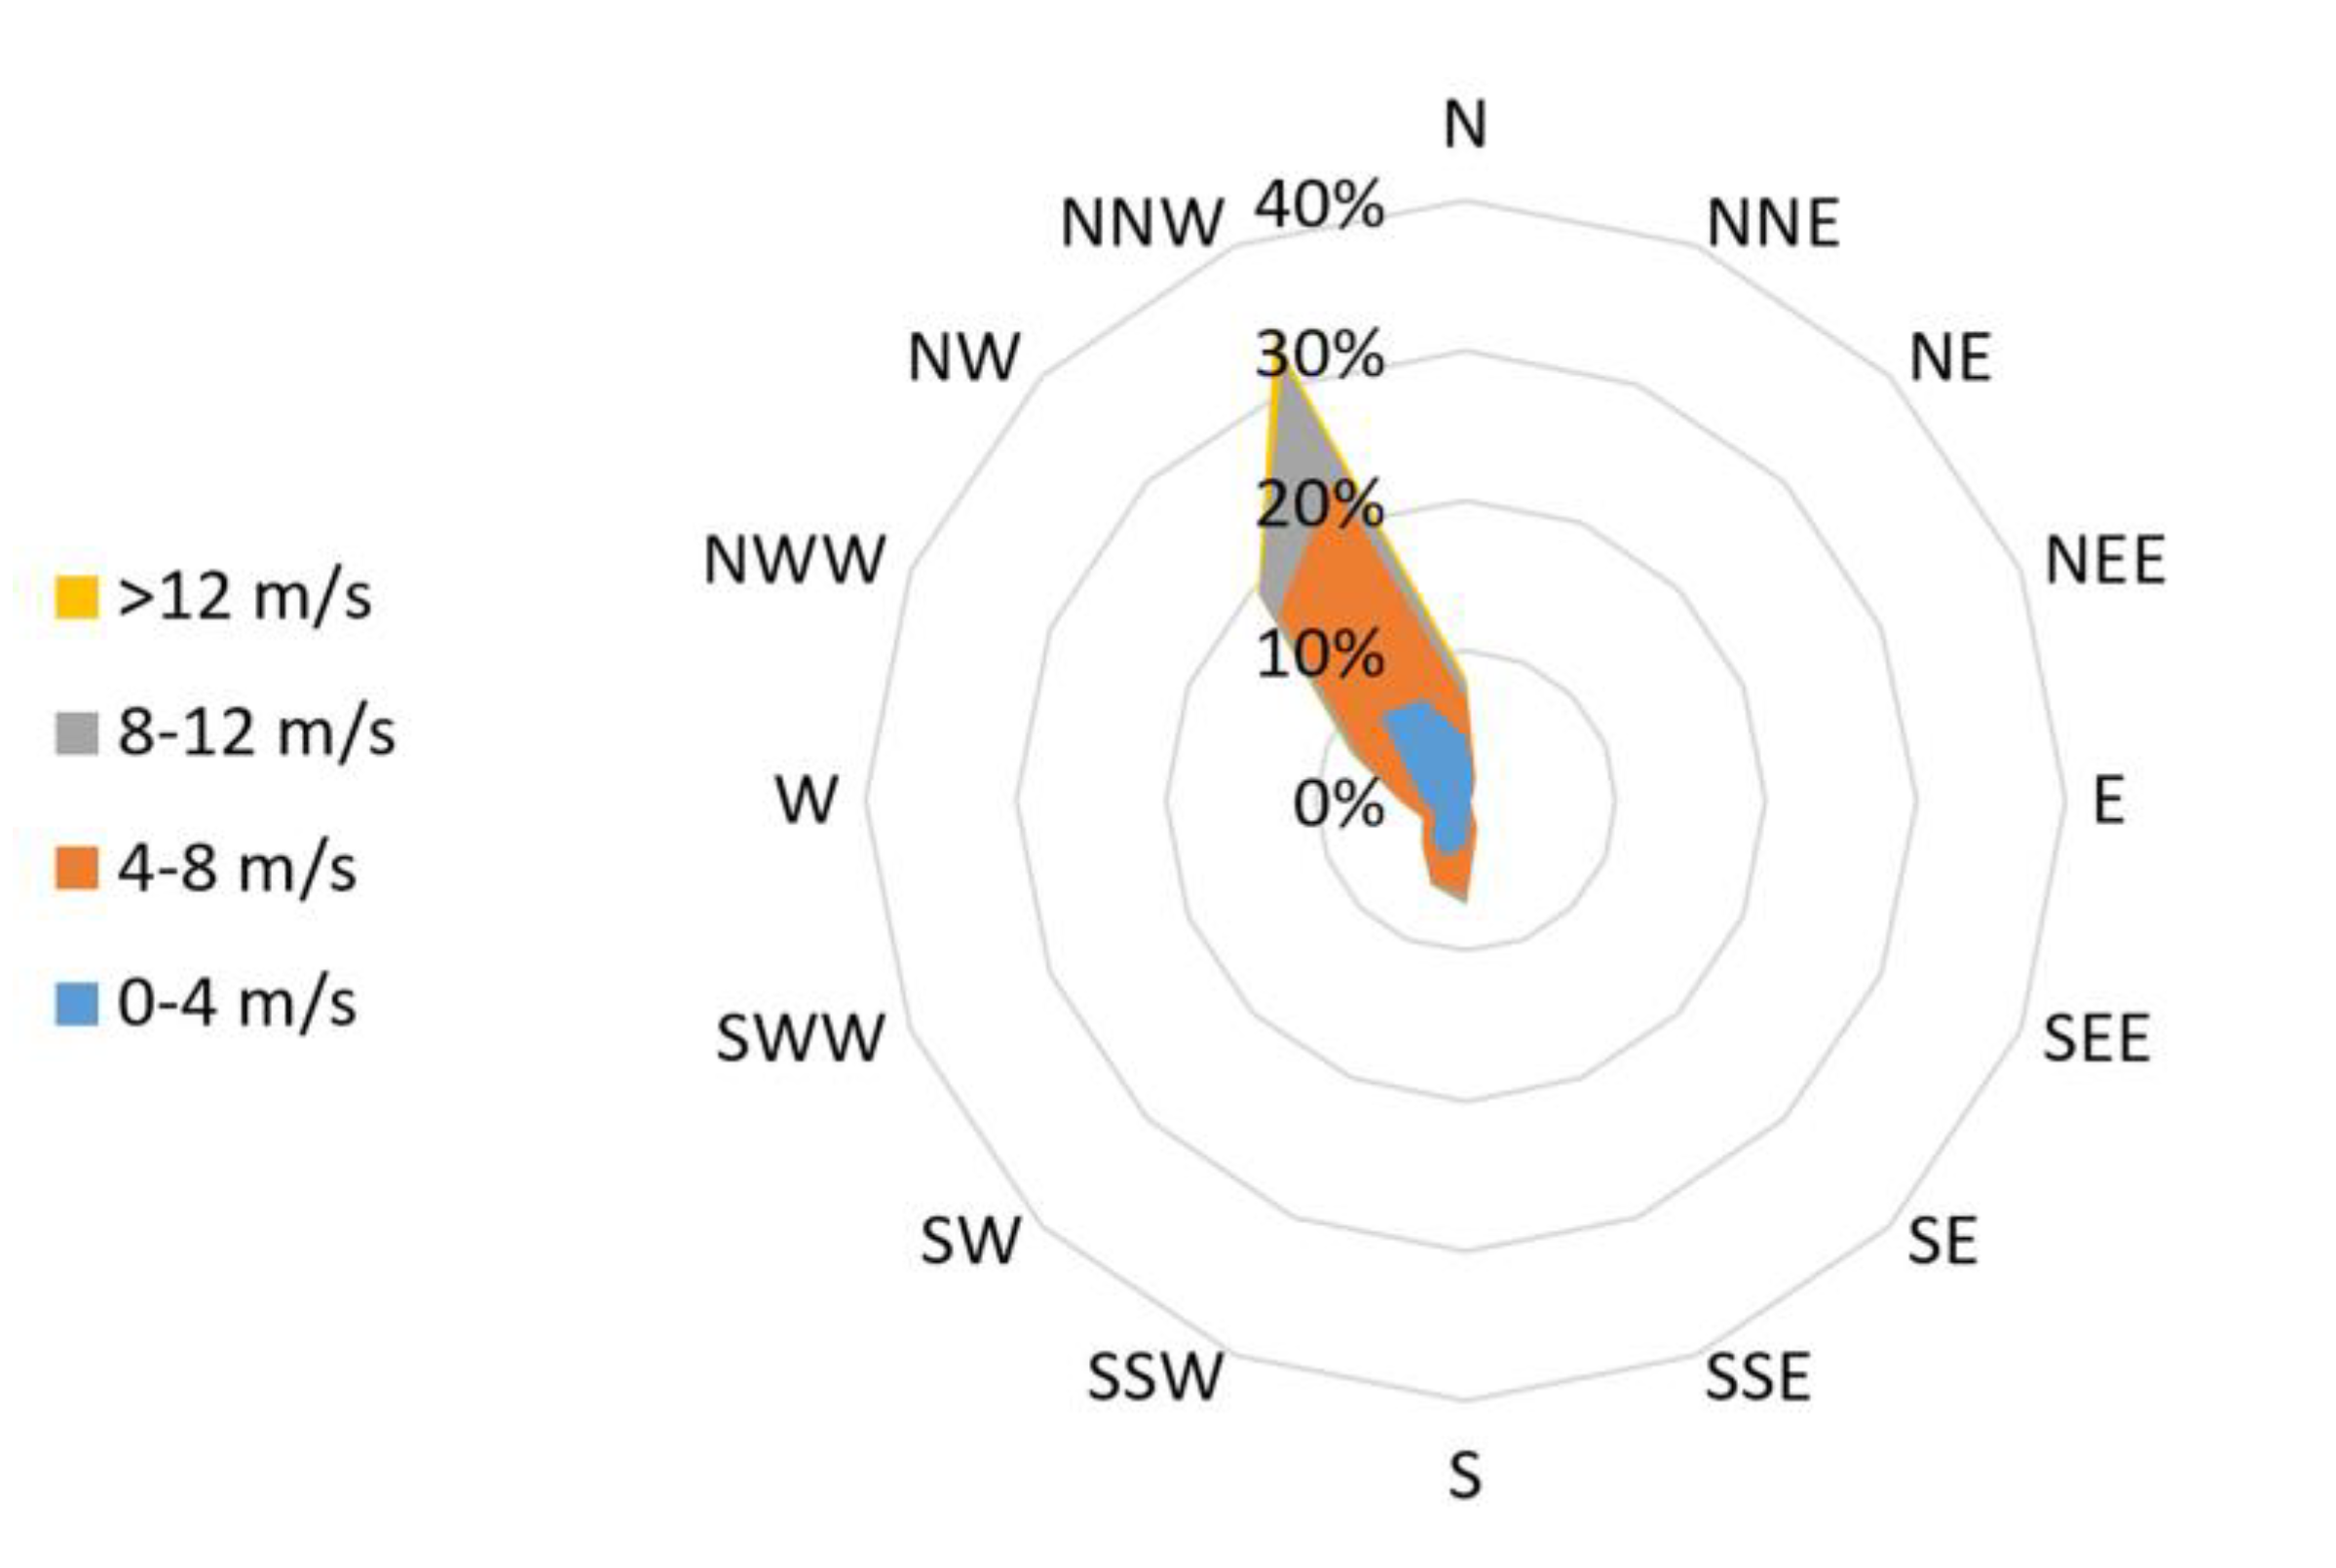
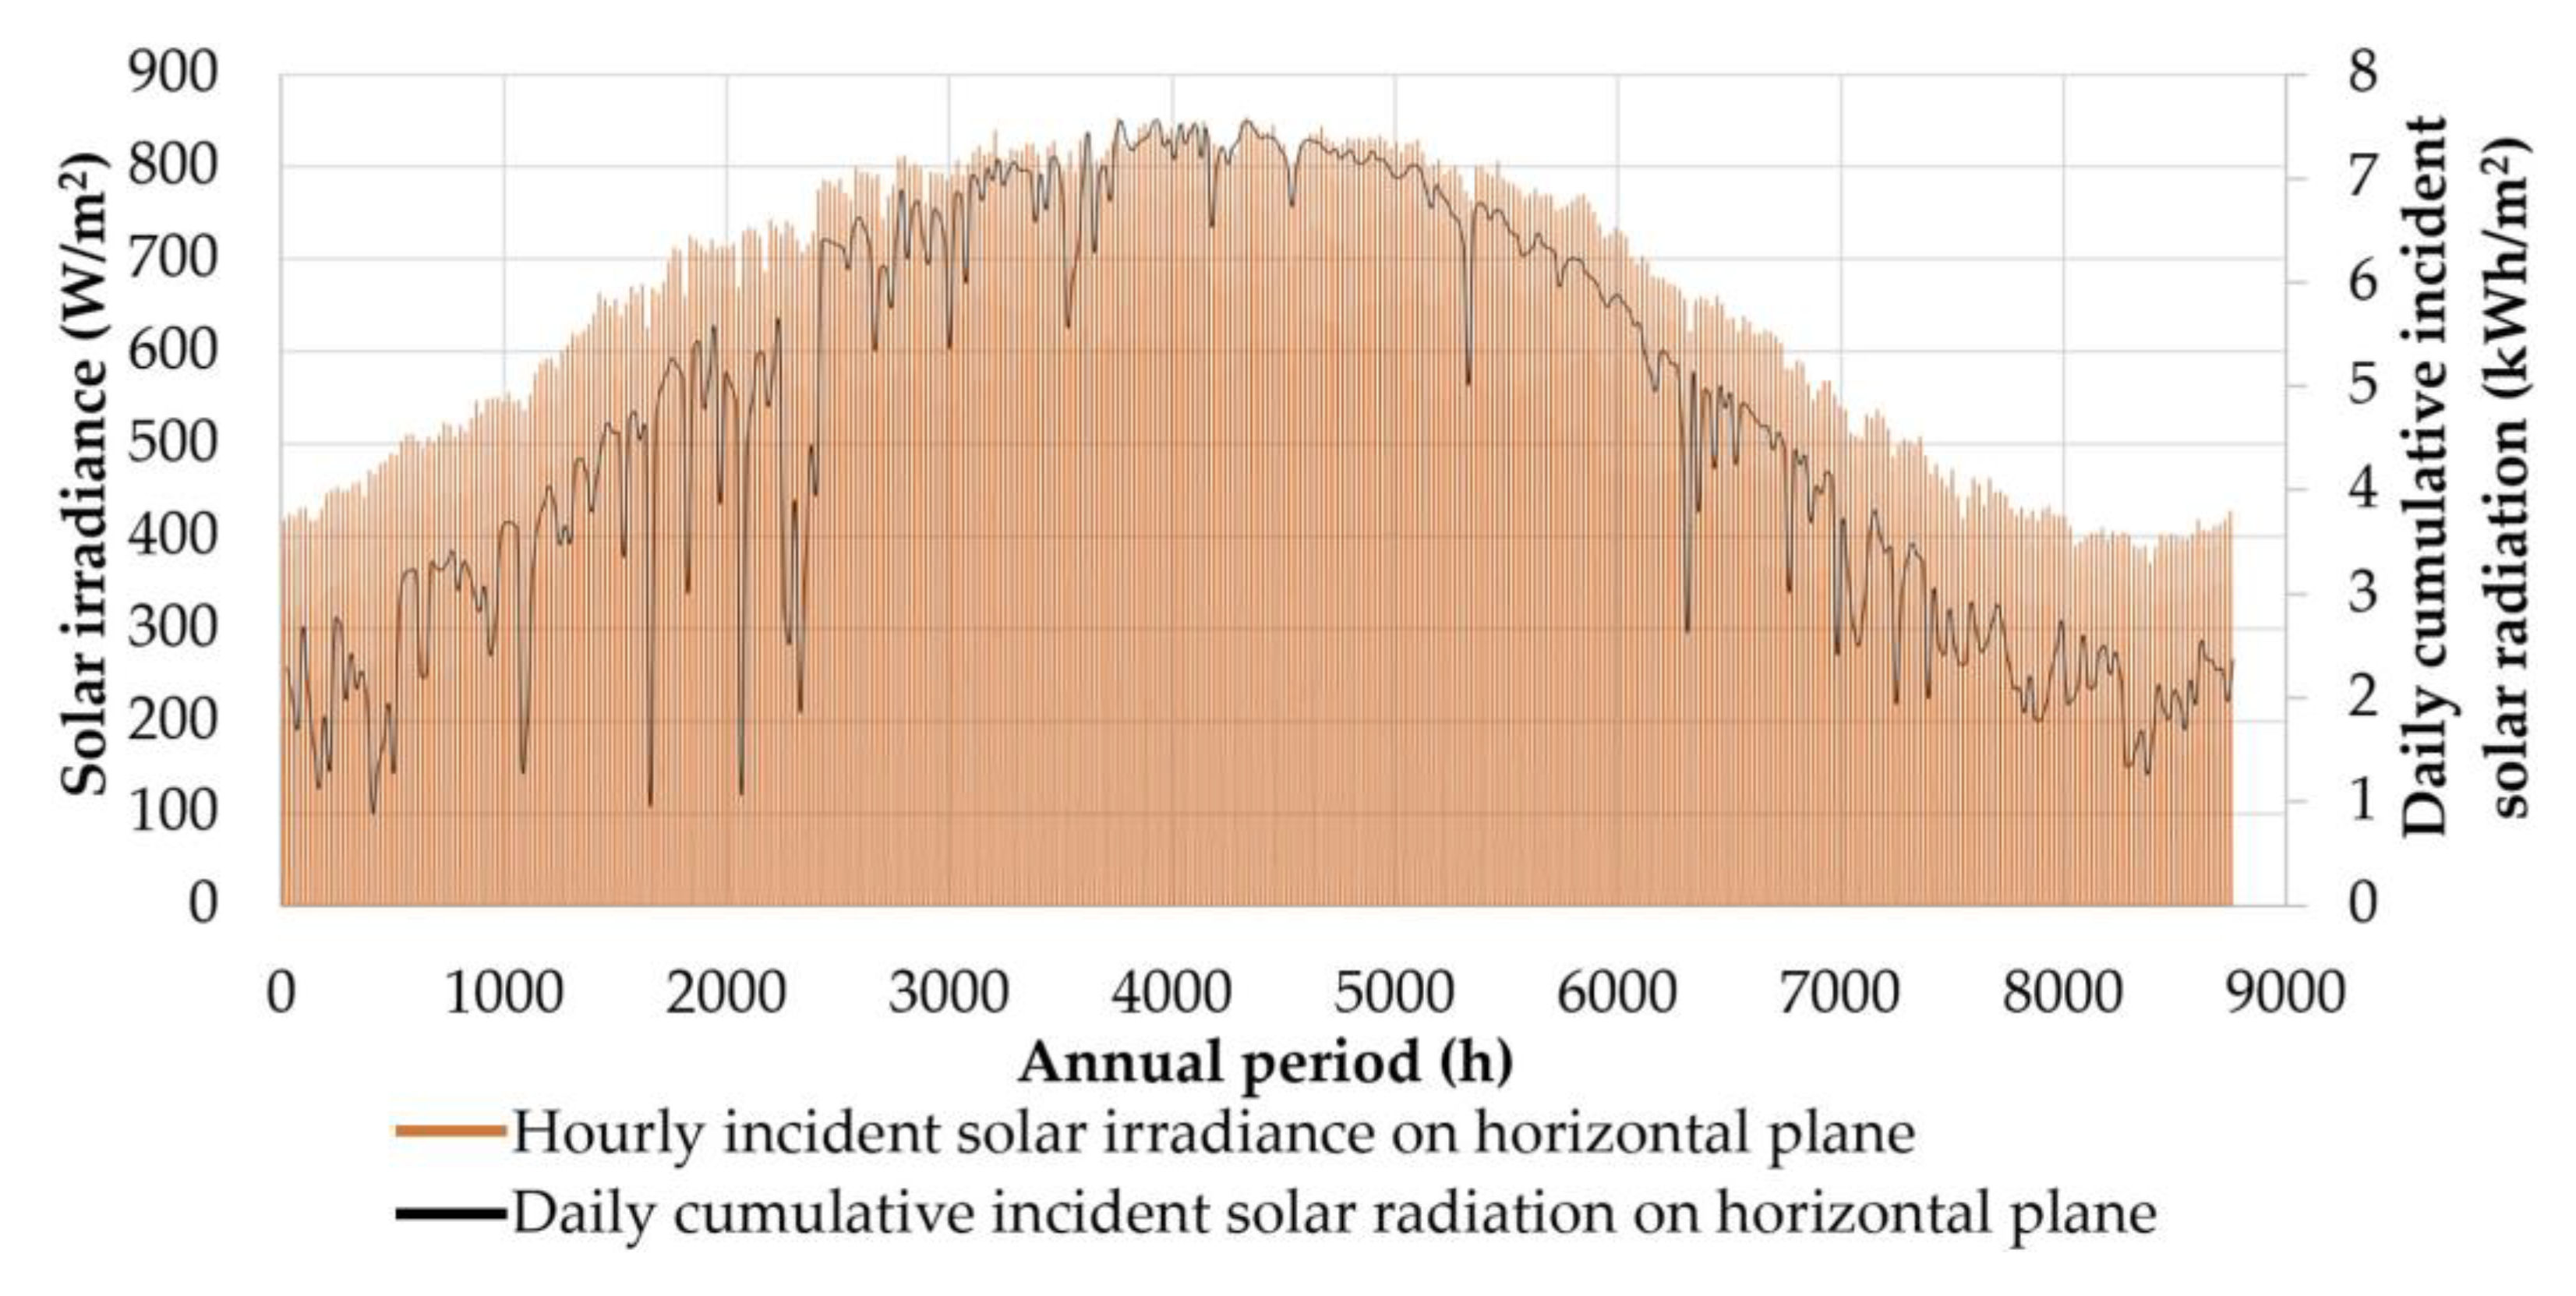
  • The meteorological data were retrieved from the European Centre for Medium-Range Weather Forecasts (see Section 4)
  • The data regarding the new proposed equipment and the materials were retrieved from the manufacturers’ datasheets
  • The data regarding the existing constructive elements in the facility were calculated or taken from the literature.

4. Climate Conditions—Meteorological Data

The local climate in the town of Arkalochori is characterized by rather mild winter, with ambient temperature usually between 5 °C and 15 °C, and cool summer, with ambient temperature rarely higher than 30 °C. For the purposes of this work, meteorological data were retrieved from the available climate data in the European Centre for Medium-Range Weather Forecasts (ECMWF) and for the period 2010–2020 [58] for a geographical point only 13.5 km to the north of the town. All meteorological data were downloaded in the form of annual time series with hourly average values. Indicatively, in Figure 3, Figure 4 and Figure 5, the fluctuation of the ambient temperature, the ambient relative humidity and the wind velocity at 2 m height above ground are presented for the two consecutive years, 2019 and 2020. The annual periodicity for all three magnitudes is observed in these figures. The annual average ambient temperature for 2019 and 2020 was 18.0 °C and 18.1 °C, respectively. The annual average wind velocity for 2019 and 2020 was 4.9 m/s and 5.1 m/s, respectively.
In Figure 6, the annual wind velocity rose graph for 2020 is presented, showing a northwestern wind blowing prevailing direction. This is also configured by the constant local northwest winds blowing during the summer, known as “meltemia”, which configures a cool summer climate.
Finally, in Figure 7, the annual fluctuation for the year 2020 is presented of the average hourly incident solar irradiance and the daily cumulative solar radiation on the horizontal plane. The yearly cumulative incident solar radiation on the horizontal plane is calculated at 1675 kWh/m2, indicating the availability of considerable solar potential in the area.
The above-presented annual time series of the meteorological magnitudes will be used in this study for the calculation of the indoor space conditioning load, the swimming pool’s heating load, the electricity production from photovoltaic panels and the heat production from solar thermal collectors.

5. The Energy Performance Upgrade of the Municipal Sports Centre

5.1. Current State

The most energy-consuming facility in the municipal sports centre is, of course, the swimming pools. As seen in Figure 1, the overall facility is outdoors, and the swimming pools are totally exposed to ambient climate conditions. No measure is currently applied for the reduction of the swimming pool heating load. On the hypothesis of normal, daily operation, the required annual diesel oil consumption for the swimming pool heating with the existing diesel oil burner (2182 kWth nominal capacity) is calculated at 307,940 L. Assuming a diesel oil procurement price of 1.2 EUR/L, the corresponding annual cost for the swimming pool heating is calculated at 369,528 EUR. This cost is too high to be afforded by the local Municipality, so, practically, the swimming pool’s centre remains inoperative during the winter period, namely from early October to late May, and it operates only for a period of roughly four months per year, depriving the local community of such an important facility.
Apart from the large size oil burner, dedicated exclusively to the swimming pool heating, a second, smaller oil burner, of 116 kWth capacity, has also been installed for the existing building’s indoor space heating and the domestic hot water production for the changing rooms. In practice, due to the high diesel oil procurement price, this oil burner is used only for domestic hot water production.
Except for diesel oil, electricity is also consumed in the facility for the operation of all the pumps and circulators in the swimming pool’s engine room, in the four existing autonomous, small-size air-to-air heat pumps (split units) for the indoor space conditioning, for the indoor space lighting, the outdoor security lighting of the overall facility and the football court lighting when it is used during nighttime.
The installed apparatus for outdoor lighting are mercury or halogen floodlights with a nominal electrical power of 250 W, 400 W and 2000 W. Fluorescent bulbs are used for indoor space lighting, installed in old-type luminaires with no reflecting surfaces.
According to the provided data by the local Municipality, the existing electricity annual consumption was 107,920 kWh in 2019 and 91,040 in 2020. Additionally, 500 L of diesel oil are consumed from May to September, namely during the swimming pool’s operation period, for domestic hot water production. However, for the needs of this study, it was assumed that the swimming pool’s centre fully operates during the whole year and the existing building is normally conditioned. This assumption is considered necessary to obtain a common comparison basis for the operation of the sports centre under the existing and the proposed conditions. The existing loads and the consumed energy for the current state, and the assumption of full annual operation are calculated and presented in the following section.

5.2. Energy Consumption in the Current State

The energy consumption of the municipal sports centre in the current state is calculated separately for the discrete final energy uses presented below:
  • Swimming pools heating;
  • Existing building indoor space conditioning;
  • Domestic hot water production;
  • Indoor and outdoor space lighting;
  • Pumps’ station operation for the swimming pools’ water circulation.
For the aforementioned uses, the energy consumption in the municipal sports centre in the current state on the assumption of full annual operation is analysed in the following sections.

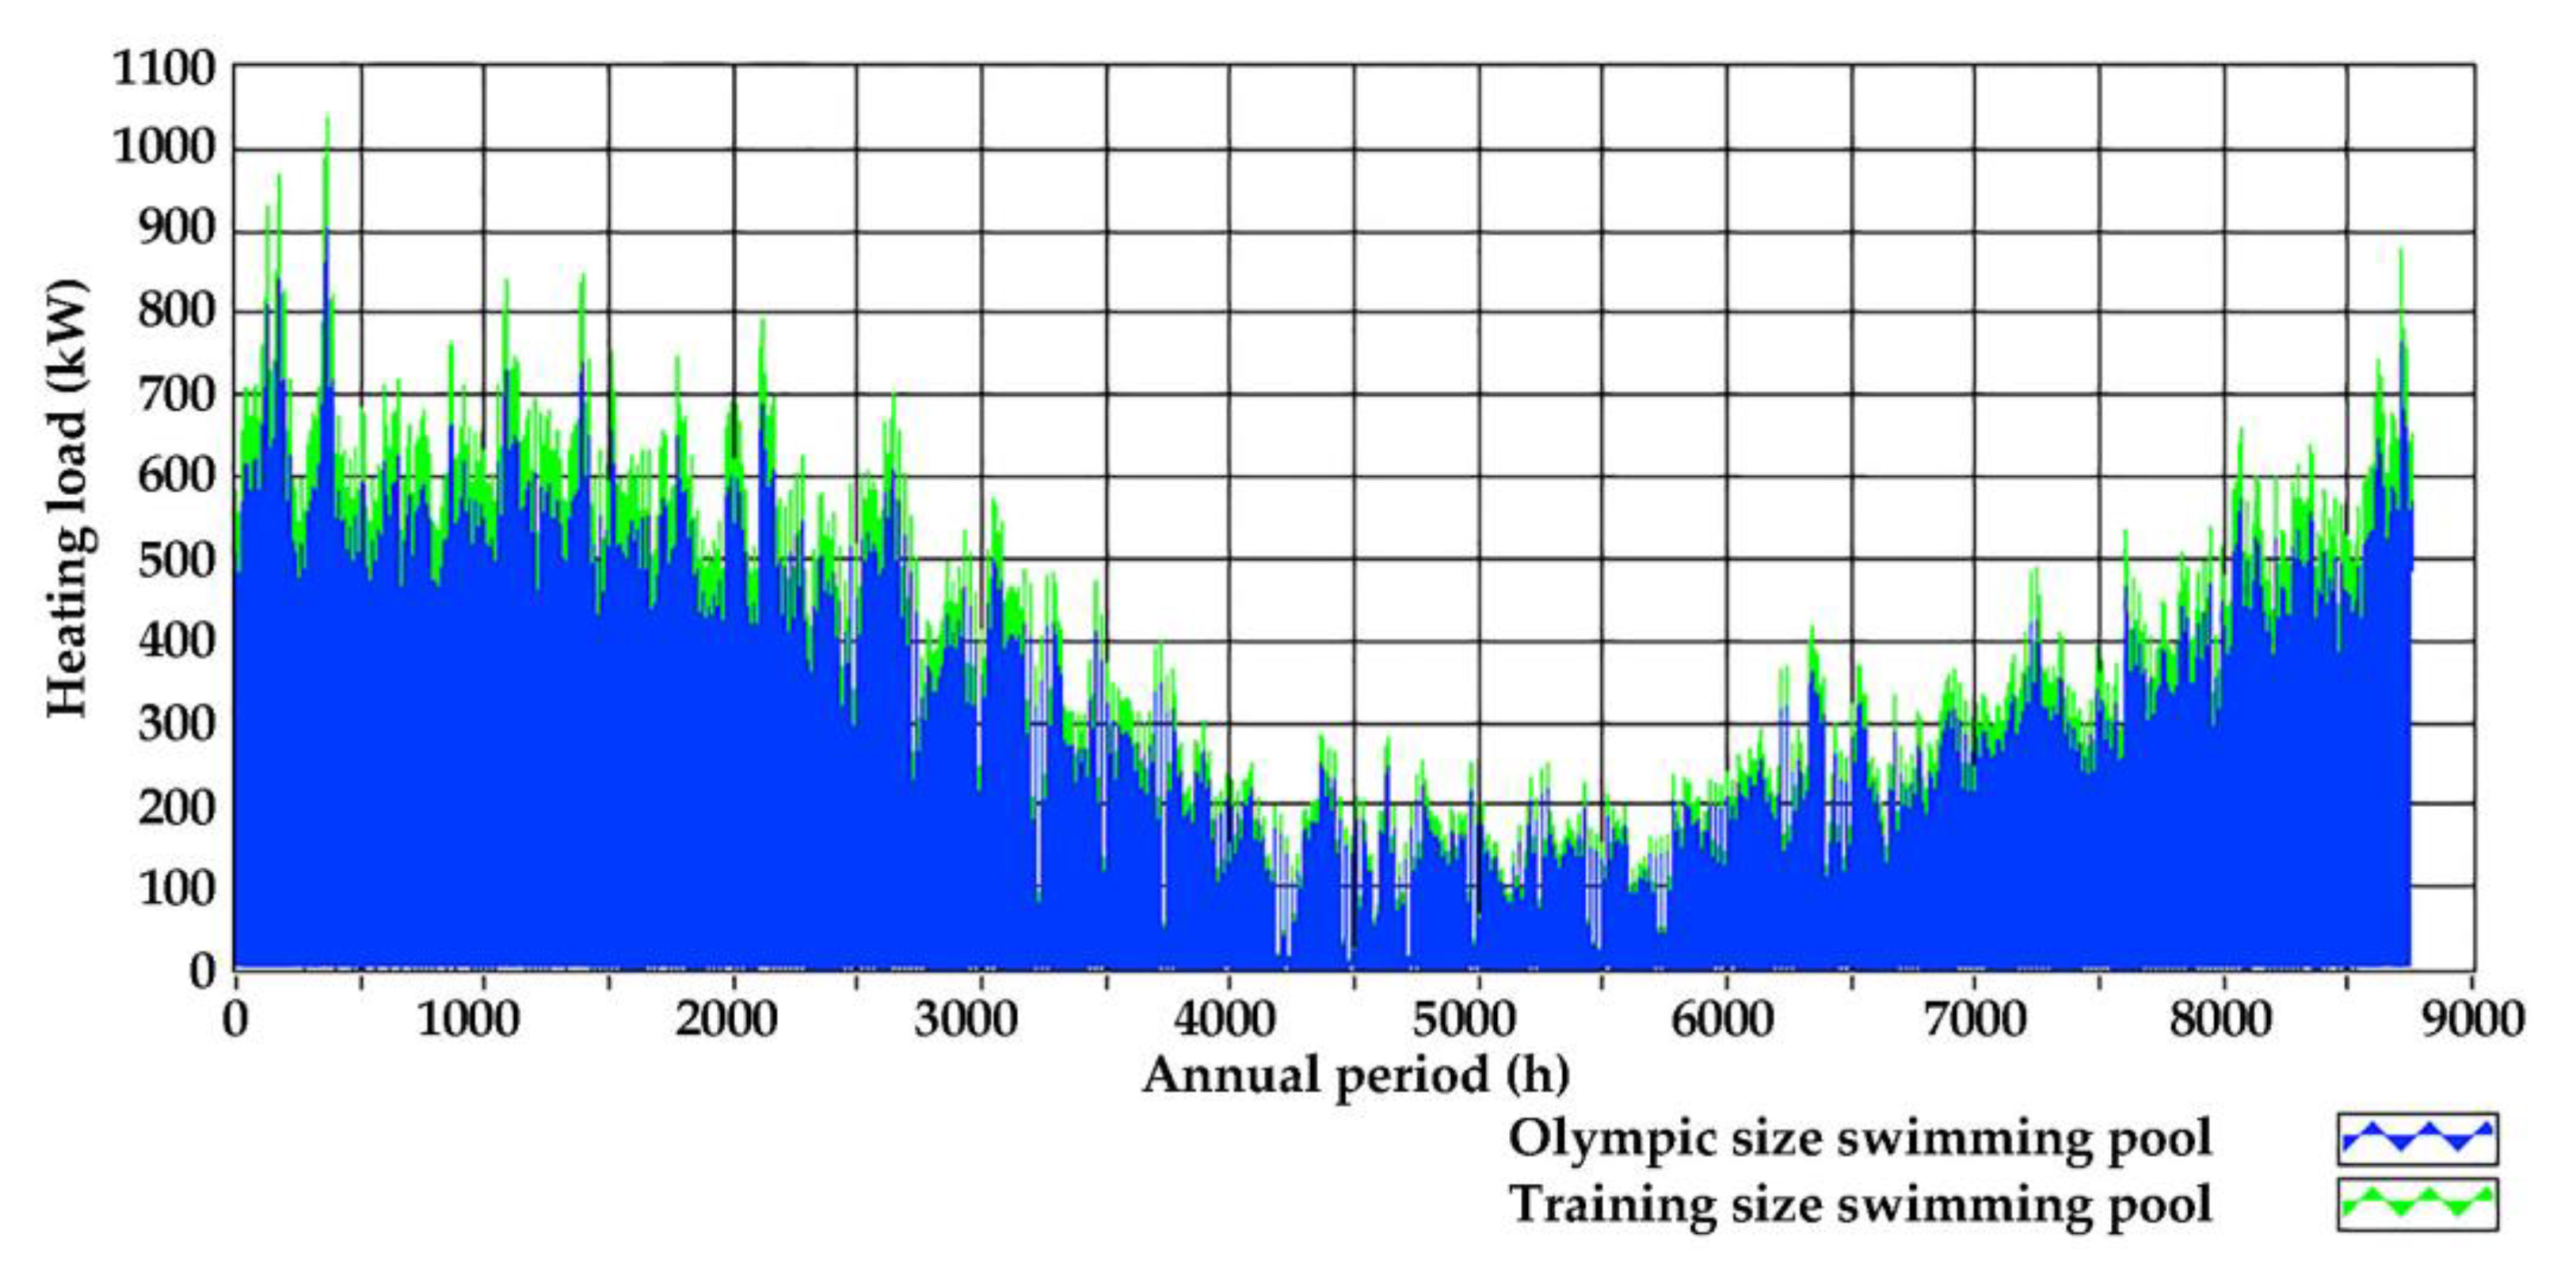
5.2.1. Swimming pool Heating

Firstly, in this section, the mathematical background for the swimming pools’ heating load calculation, as a special calculation method, is presented in detail. The swimming pools’ total heating load is given by Equation (1):
Q ˙ tot = Q ˙ conv rad + Q ˙ ev + Q ˙ rep Q ˙ sg ,
where:
  • Q ˙ tot the total heat loss from the swimming pools’ upper surfaces (in kW);
  • Q ˙ conv - rad the heat loss from the swimming pools’ upper surfaces with convection and radiation (in kW);
  • Q ˙ ev the heat loss from the swimming pools’ upper surfaces with evaporation (in kW);
  • Q ˙ rep the additional heating load due to the replacement of the evaporated water from the water supply network (in kW);
  • Q ˙ sg the solar heat gain due to the solar radiation incidence (in kW).
If Tamb is the ambient temperature (Figure 3, Section 4), the heat loss Q ˙ conv - rad with convection and radiation is given by Equation (2) [59]:
Q ˙ conv - rad = A sp · U · T w T amb ,
where:
  • Asp the swimming pools’ total upper surface (in m2);
  • U the thermal heat transfer factor (the so-called U-factor), from the swimming pools’ upper surfaces to the ambient environment (in W/m2∙K);
  • Tw the required water temperature in the swimming pools (Τw = 26 °C for the Olympic size pool and Τw = 30 °C for the training swimming pool).
The heat transfer factor U describes the heat loss with convection and radiation from the swimming pools’ upper surfaces and is given by Equation (3):
U = h rw + h c ,
where hc is the heat convection factor for ambient air horizontal flow with an average velocity of 5 m/s (see Section 4), adopted equal to hc = 10 W/m2∙Κ [60], and hrw is the heat radiation factor, which is given by Equation (4):
h rw =   4 · ε w · σ · T w + T amb 2 3 ,
where εw the emissivity of water and σ the Stefan–Boltzman constant. The ratio inside the parenthesis is the average water-ambient air temperature.
The heat loss due to the water evaporation can be calculated with the following empirical Equation (5) [61]:
Q ˙ ev = h e · p sw       p ,
where:
  • he an evaporation transfer factor;
  • psw the water vapour saturation pressure at the water temperature Tw in the swimming pools (in kPa);
  • p the partial vapour pressure away from the swimming pools, at ambient temperature Τamb (in kPa).
The evaporation transfer factor is calculated with the following empirical Equation (6):
h e = 0.0563 + 0.0689 · u 0.3 ,  
where u0.3 is the wind velocity in m/s at 30 cm height from the swimming pools’ upper surfaces. Knowing the wind velocity at 2 m height above ground (Figure 5, Section 4), the wind velocity at 30 cm height above ground can be calculated with the wind velocity profile exponential law, given by Equation (7):
u z 1 u z 2 = z 1 z 2 n ,
where:
  • uz1 the wind velocity at height z1 above ground (e.g., at 0.3 m);
  • uz2 the wind velocity at height z2 above ground (e.g., at 2 m).
The exponent n is given versus the ground roughness height z0 by Equation (8):
n = 0.04∙lnz0 + 0.003∙(lnz0)2 + 0.24,
where the ground roughness height for a semi-urban environment at the swimming pools’ installation site can be adopted equal to 0.5 m.
The saturation vapour pressure ps,w can be retrieved from the relevant table for the water temperature Tw in the swimming pools and for atmospheric pressure (ps,w = 3.17 kPa at Tw = 25 °C) [62].
The partial vapour pressure p away from the swimming pools can be calculated by the essential definition Equation (9) for the ambient relative humidity φ, which has also been downloaded from the ERA-5 meteorological database (Figure 4, Section 4):
φ   = p p s , p = φ · p s , ,
where p s , the saturation vapour pressure at ambient temperature Τamb and atmospheric pressure [62].
The additional heat load due to the replacement of the evaporated water from the water supply network is given by Equation (10):
Q ˙ rep = m ˙ rep · c p · T w     T sw ,
where:
  • m ˙ rep the water mass flow rate for the replacement of the evaporated water (in kg/s);
  • cp the water-specific heat capacity (4.187 kJ/kg∙K);
  • Tw the required water temperature in the swimming pools (Τw = 26 °C for the Olympic size pool and Τw = 30 °C for the training swimming pool);
  • Tsw the water temperature in the water supply network
The water mass flow rate can be calculated by Equation (11):
m ˙ rep = Q ˙ ev h fg ,
where hfg is the specific latent heat of water (2441.7 kJ/kg at 25 °C [63]). Average monthly values for the water temperature in the water supply network are provided by the Technical Directive of the Technical Chamber of Greece 20701-1/2017 [64].
Finally, the solar heat gain from the incident solar radiation on the swimming pools’ surfaces is calculated by Equation (12) [59,60]:
Q ˙ sg = a · G · A sp ,
where:
  • a solar radiation absorbance factor from the swimming pools adopted equal to 0.85 for light-colour tanks [61]
  • G the incident solar radiation on the horizontal plane (in W/m2, Figure 7, Section 4)
  • Asp the swimming pools’ total upper area (1000 m2 for the Olympic-size pool and 125 m2 for the training pool).
The values of the involved parameters in the calculation of the swimming pools’ heating load are summarized in Table 1.
By applying the above presented mathematical process with the parameters’ values of Table 1 and with the swimming pools’ weekly operation schedule (from 12:00–22:00 daily and from 9:00–17:00 on Saturdays), the annual fluctuation of the swimming pools heating load is calculated and presented in Figure 8 separately for the two swimming pools. The annual heating load of the Olympic size and the training swimming pool is calculated by aggregating these annual time series, equal to 1,932,485 kWh and 289,873 kWh, respectively (in total, 2,222,385 kWh). As seen in Figure 8, there is a heating load even during summer in the current operation state.
With the assumption of full coverage of the annual heating load with the existing oil burner and with the following adopted parameters:
  • Oil burner efficiency: 80%;
  • Heat distribution system efficiency: 88%;
  • Diesel oil calorific value: 10.25 kWh/L [65].
The annual diesel oil consumption is calculated at 307,940.4 L. The corresponding primary energy consumption is calculated from the diesel oil’s chemical energy multiplied by a factor of 1.1 [65], equal to 3,472,434 kWh. The annual peak heat demand is calculated at 901.7 kWth and 135.3 kWth for the large and the small swimming pool, respectively.

5.2.2. Indoor Space Conditioning

The indoor space conditioning in the current operation state refers to the existing supporting building of the swimming pool’s centre. The building consists of two levels, the ground floor and the basement. In the basement, with a total area of 568.7 m2, the pump station, the boiler room, the fuel tanks, the chlorination, and all the machinery required for the swimming pool water heating, treatment, and circulation have been installed. The ground floor has a total covered area of 297.5 m2 with a conditioned space of 228.2 m2. The building has been constructed with reinforced concrete and bricks, with no insulation (U-factors at the range of 3 W/m2∙K). The existing openings are of a metallic frame with no thermal break and double glazing, with U-factor at 4 W/m2∙K.
The indoor space heating and cooling load was calculated by applying the essential methodology [66], accounting for the heat losses and the solar heat gains through the building’s envelope. Particularly the ASHRAE Transfer Function Method (TFM) [67] was applied arithmetically with TRNSYS. Actually, all indoor space heating and cooling load calculations were executed with TRNSYS, both for the existing and the proposed condition of the sports facility. The U-factors were calculated analytically for the opaque surfaces using the following fundamental Equation (13):
1 U = 1 h i + j d j k j + 1 h o ,
where dj and kj are the thickness and the thermal conductivity factor of the structural material j of the opaque constructive element. The heat transfer factor from the inner space hi and towards the outer space ho (or conversely in summer) were assumed equal to [59]:
  • hi = 10 W/m2∙K and ho = 25 W/m2∙K for airflow over horizontal surfaces and for average wind speed of 5 m/s;
  • hi = 7.7 W/m2∙K and ho = 25 W/m2∙K for airflow next to vertical surfaces and for average wind speed of 5 m/s.
The U-factors for the openings and the transparent surfaces were chosen from the TRNSYS library. The solar heat gain factor through transparent surfaces was set at 0.77.
The natural ventilation due to the openings’ inadequate sealing was calculated by Equation (14) [60,68], introduced by ASHRAE (ACH: air changes per hour):
ACH = K 1 + K 2 · T in     T amb + K 3 · u w ,
where uw is the average wind velocity, Tin and Tamb are the indoor space and the ambient temperature (Figure 3, Section 4), and the parameters K1, K2 and K3 are set equal to 0.100, 0.023 and 0.070, respectively, for the existing, inadequate sealing condition.
The thermal comfort conditions were set at 22 °C/50% in winter and 26 °C/50% in summer [31,65]. The operation schedule of the building follows the aforementioned operation schedule of the swimming pools.
The annual heating and cooling load of the existing building was calculated at 13,973.5 kWh and 8502.6 kWh, giving a specific heat consumption of 62.2 kWh/m2 for heating and 37.2 kWh/m2 for cooling.
Assuming full coverage of this annual heat demand with the existing oil burner for heating and autonomous heat pumps for cooling with a typical Energy Efficiency Ratio (EER) from 1.5 to 3.2, the annual diesel oil, electricity and the corresponding primary energy consumption are presented in Table 2.

5.2.3. Domestic Hot Water Production
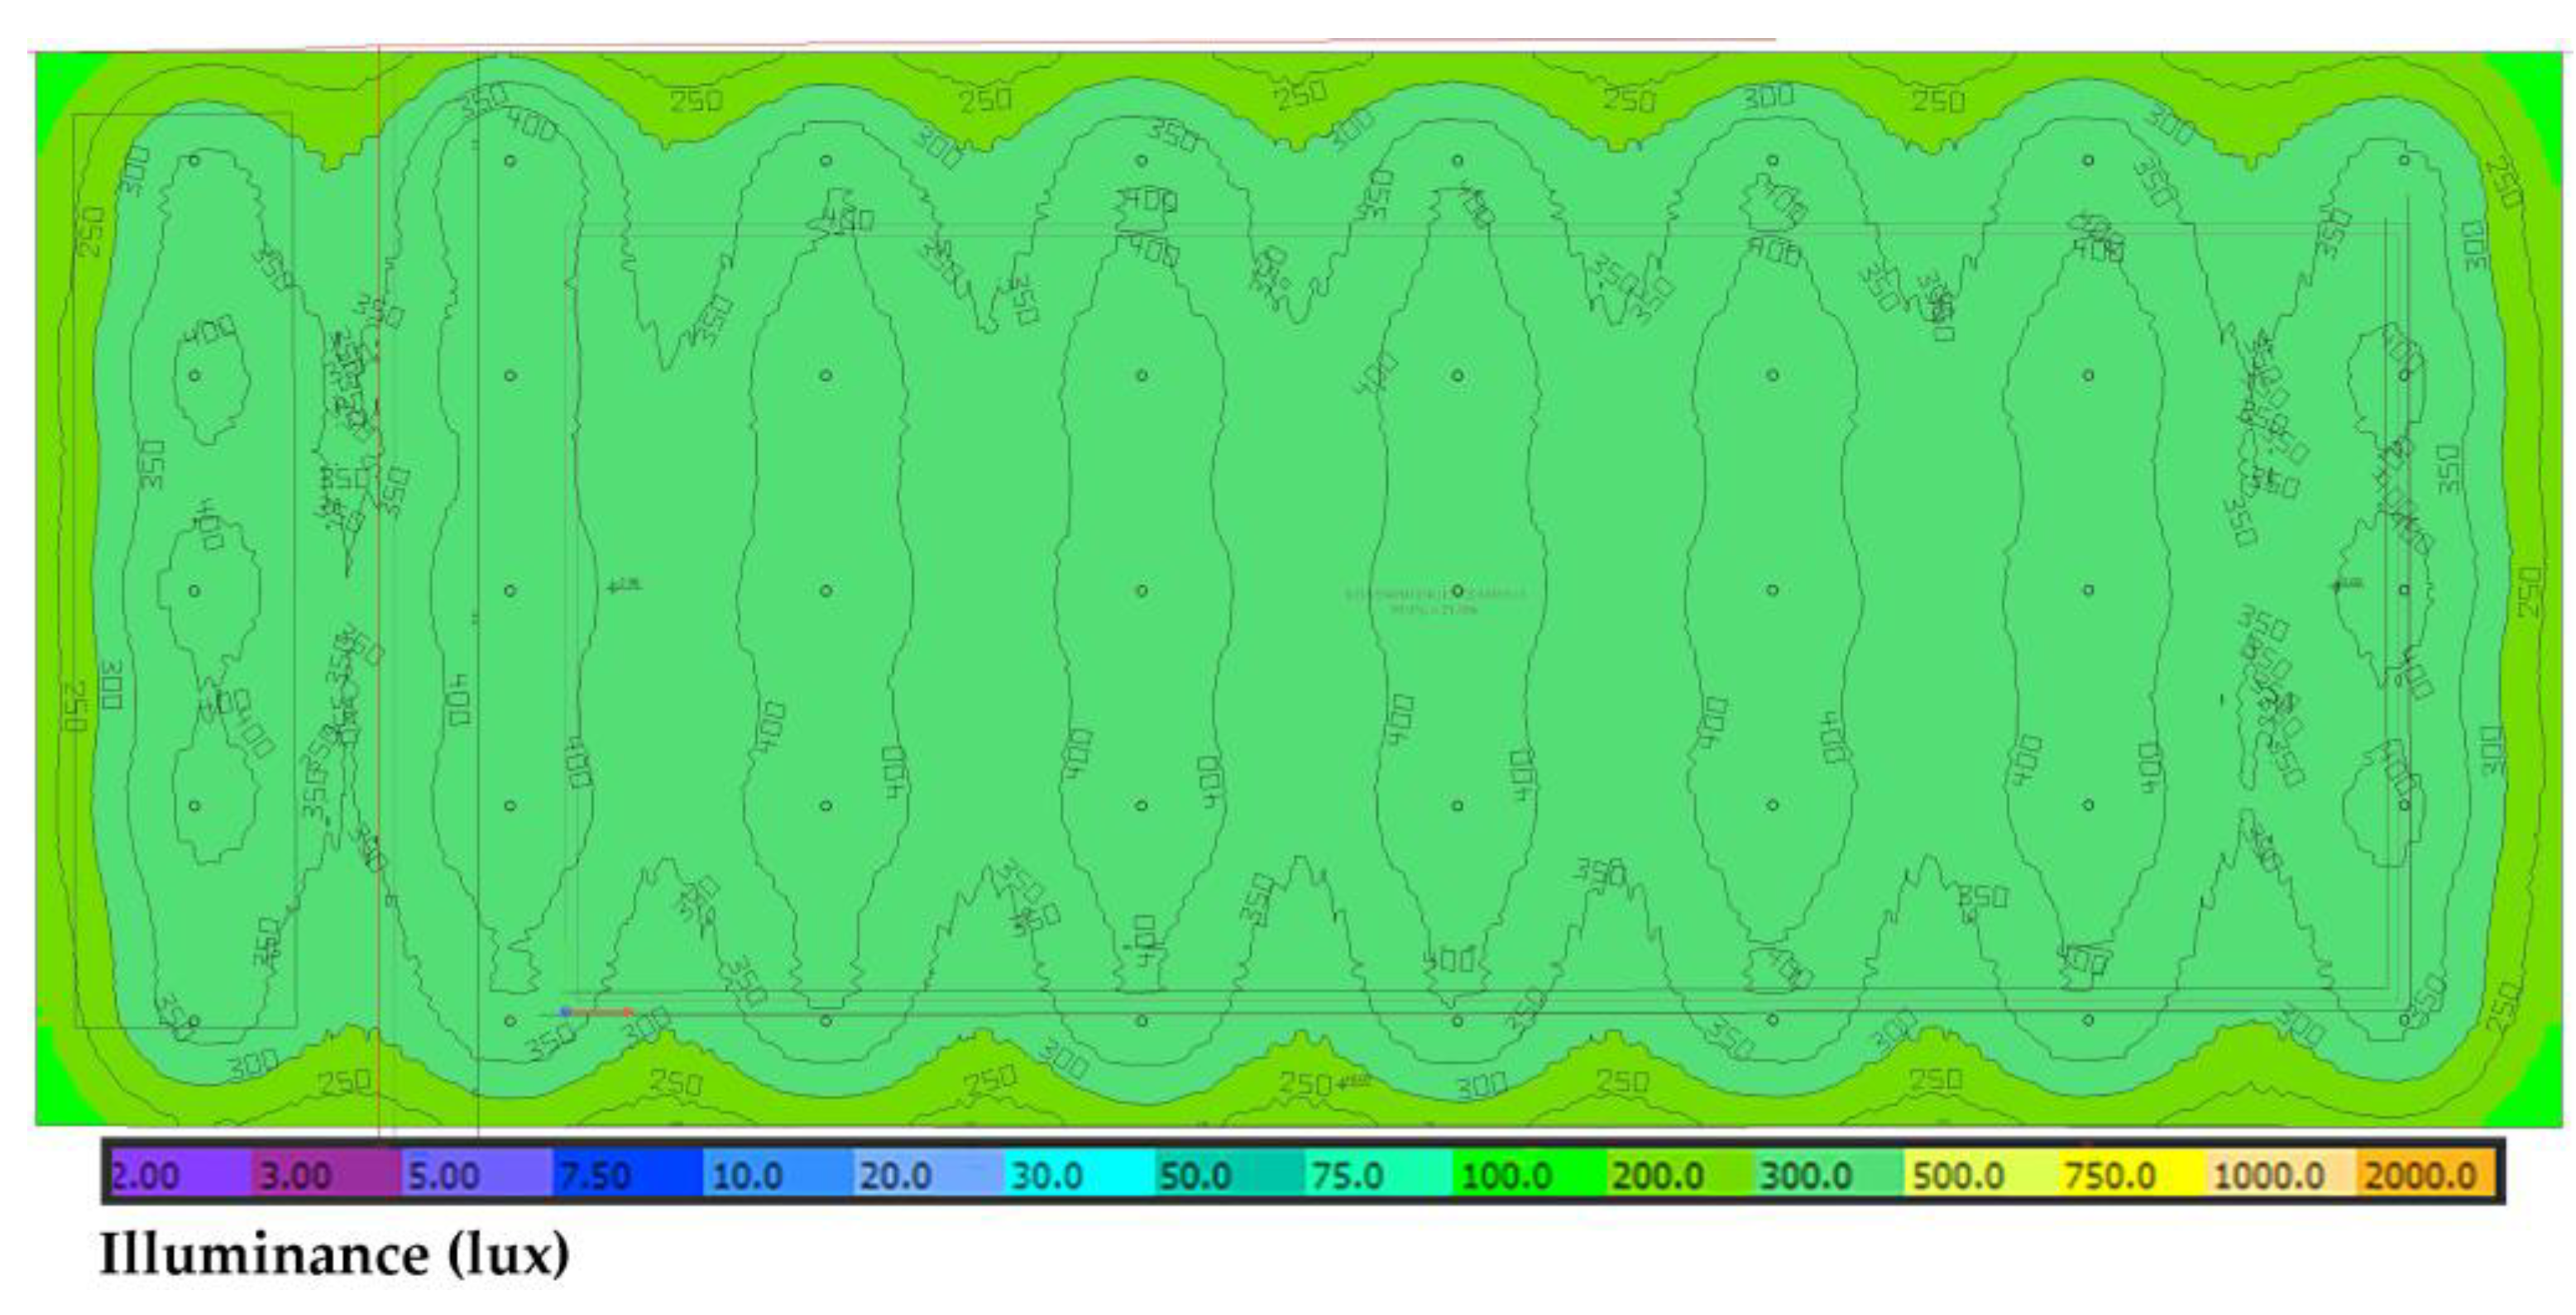
Domestic hot water is consumed in the changing rooms of the swimming pools’ existing supporting building. The calculation of the corresponding annual required heat is simple and is based on the fundamental Equation (15):
Q ˙ = m ˙ h · c p · Δ Τ = m ˙ · c p · Τ hw Τ sw ,
where m ˙ h is the hot water consumed mass flow rate, cp = 4.187 kJ/kg∙K the water specific heat capacity, Thw = 45 °C the hot water required temperature and Tsw the water temperature from the municipal water supply network. The temperature Tsw is given by Technical Directive 20701-1/2017 [64] and ranges from 12.8 °C in February to 26.6 °C in August. The hot water consumed mass was calculated, following the information provided by the sports centre’s secretariat, by assuming 15 users per hour during the daily operation period and 40 L hot water consumption per user.
With the aforementioned data and assumptions, the annual fluctuation of the heat demand for the required domestic hot water production in the swimming pool’s centre is presented in Figure 9.
By aggregating the above presented time series, the annual heat demand for hot water production is calculated at 65,253.7 kWh. In the current operation state, hot water is exclusively produced by the 116 kWth oil burner. Accounting for the efficiencies of the oil burner at 75% and the hot water distribution hydraulic network at 80%, and taking the diesel oil calorific value equal to 10.25 kWh/L [65], the annual diesel oil consumption for the production of hot water is calculated at 10,610.3 L. The corresponding annual primary energy consumption, due to the diesel oil consumption, is calculated at 119,631.7 kWh.

5.2.4. Lighting

The existing lighting equipment in the municipal sports centre can be categorized in:
  • Fluorescent, incandescent and LED lamps for indoor space;
  • Mercury floodlights for the perimeter, security lighting;
  • Halogen floodlights for the football ground.
The existing electricity consumption for lighting is easily calculated by accounting for the installed electrical lighting power per different use and the operation schedule for each one of these uses. The results are summarized in Table 3. The presented nominal power consumptions have been read from the installed bulbs and floodlights. The corresponding primary energy consumption is calculated by multiplying the electricity consumption with the factor 2.9 [65].

5.2.5. Other Electricity Consumptions

Electricity is also consumed in the swimming pools’ pump station and the circulators installed in the hydraulic networks for indoor space heating and domestic hot water distribution. The swimming pool’s pump station is equipped with three pumps with a nominal volume flow rate of 225 m3/h, nominal head of 27 m, nominal efficiency of 78% and nominal electrical power input of 20.7 kW. Of these pumps, one is used as a spare, and the other two operate continuously throughout the whole year. Additionally, there is a circulator for the domestic hot water network and another one for the indoor space heating network, with nominal electrical power inputs of 100 W and 1.5 kW, respectively. The operation of these two circulators is imposed by the hot water demand and the indoor space heating load time series.
Given the aforementioned data, the annual electricity consumption is calculated at:
  • A total of 362,664.0 kWh from the swimming pools’ water circulation pumps;
  • A total of 9249.0 kWh for the indoor space heating hydraulic network;
  • A total of 140.7 kWh for the domestic hot water hydraulic distribution network.
The total annual electricity consumption from these pumps and circulators is 372,053.7 kWh, which corresponds to 1,078,955.7 kWh of primary energy.

5.2.6. Energy Consumption Synopsis in Existing Conditions

Following the previously presented calculations, the diesel oil and electricity annual consumption and the corresponding primary energy consumptions are summarized per different final energy use in Table 4.
Given the results presented in Table 4, it is obvious that the main energy consumption in the municipal sports centre comes from the swimming pool heating (almost 70%). Second in rank comes the pumps and circulators consumption, which is responsible for 92% of the total electricity consumption in the sports centre. Consequently, the proposed energy-saving measures should be focused on the swimming pool heating, while the pumps and circulator’s operation should not be ignored.

5.3. Proposed Energy Saving Measures

For the energy performance upgrade of the municipal sports centre in Arkalochori, the following most feasible and effective passive and active measures were proposed. Specifically, starting from the passive measures:
  • Construction of an enclosure for the conversion of the existing outdoor swimming pool to an indoor sports facility. Full architectural and civil engineering work was accomplished for the design of a high-aesthetics, bioclimatic construction, as seen in Figure 10.
It consists of a metallic bearing structure, boxed in reinforced concrete, as an anti-corrosion protection and covered with reflective aluminium surfaces, which will reflect the surroundings, integrating, in this way, the whole construction in the environment. The rest vertical surfaces, apart from the ones which coincide with the bearing structure, will be transparent glass surfaces so as to maximize the solar heat gains and the natural lighting during winter. These surfaces will fully open during summer to avoid overheating in the indoor space. The roof will be constructed of opaque, stone wool panels of 8 cm thickness and a U-factor of 0.39 W/m2∙K. The new enclosure will include both the swimming pool and the existing building. The total covered area with the new enclosure will be 3425 m2, with a height from 5.85 m to 7.90 m. The roof’s inclination with regard to the horizontal plane will be 3.5°.
  • Installation of a polyethene floating insulating cover on the swimming pools’ upper surface, whenever they are not in use, with 2 cm thickness and 0.025 W/m∙K thermal conductivity factor.
  • Installation of external insulation for all opaque vertical surfaces and the roof of the existing building, with 7 cm thickness stone wool sheets. The total net surface of the vertical opaque walls and the roof, which will be insulated, is 370.7 m2 and 611.5 m2, respectively. The new U-factors will be 0.40 W/m2∙K for the bearing structure surfaces and the roof and 0.34 W/m2∙K for the rest vertical opaque surfaces.
  • Installation of new low-e openings for the existing building, with synthetic frame and double glazing. In total, 60 openings will be replaced, with a total area of 111.3 m2. The new U-factors will be 0.95 W/m2∙K for the windows and 1.2 W/m2∙K for the doors.
Additionally, the following active systems are proposed:
  • For the ventilation of the newly configured indoor space above the swimming pools, two air duct lines of 65 min length each will be installed, one for fresh air supply and one for air disposal from the indoor space to the ambient environment. The air ducts will be of circular vertical cross-section, with 300 mm inner diameter (this gives an airflow velocity of 9 m/s, typical for industrial installations), galvanized, with a smooth inner surface. The mechanical ventilation network will be supported by two axial air fans of 2400 m3/h nominal volume flow rate each.
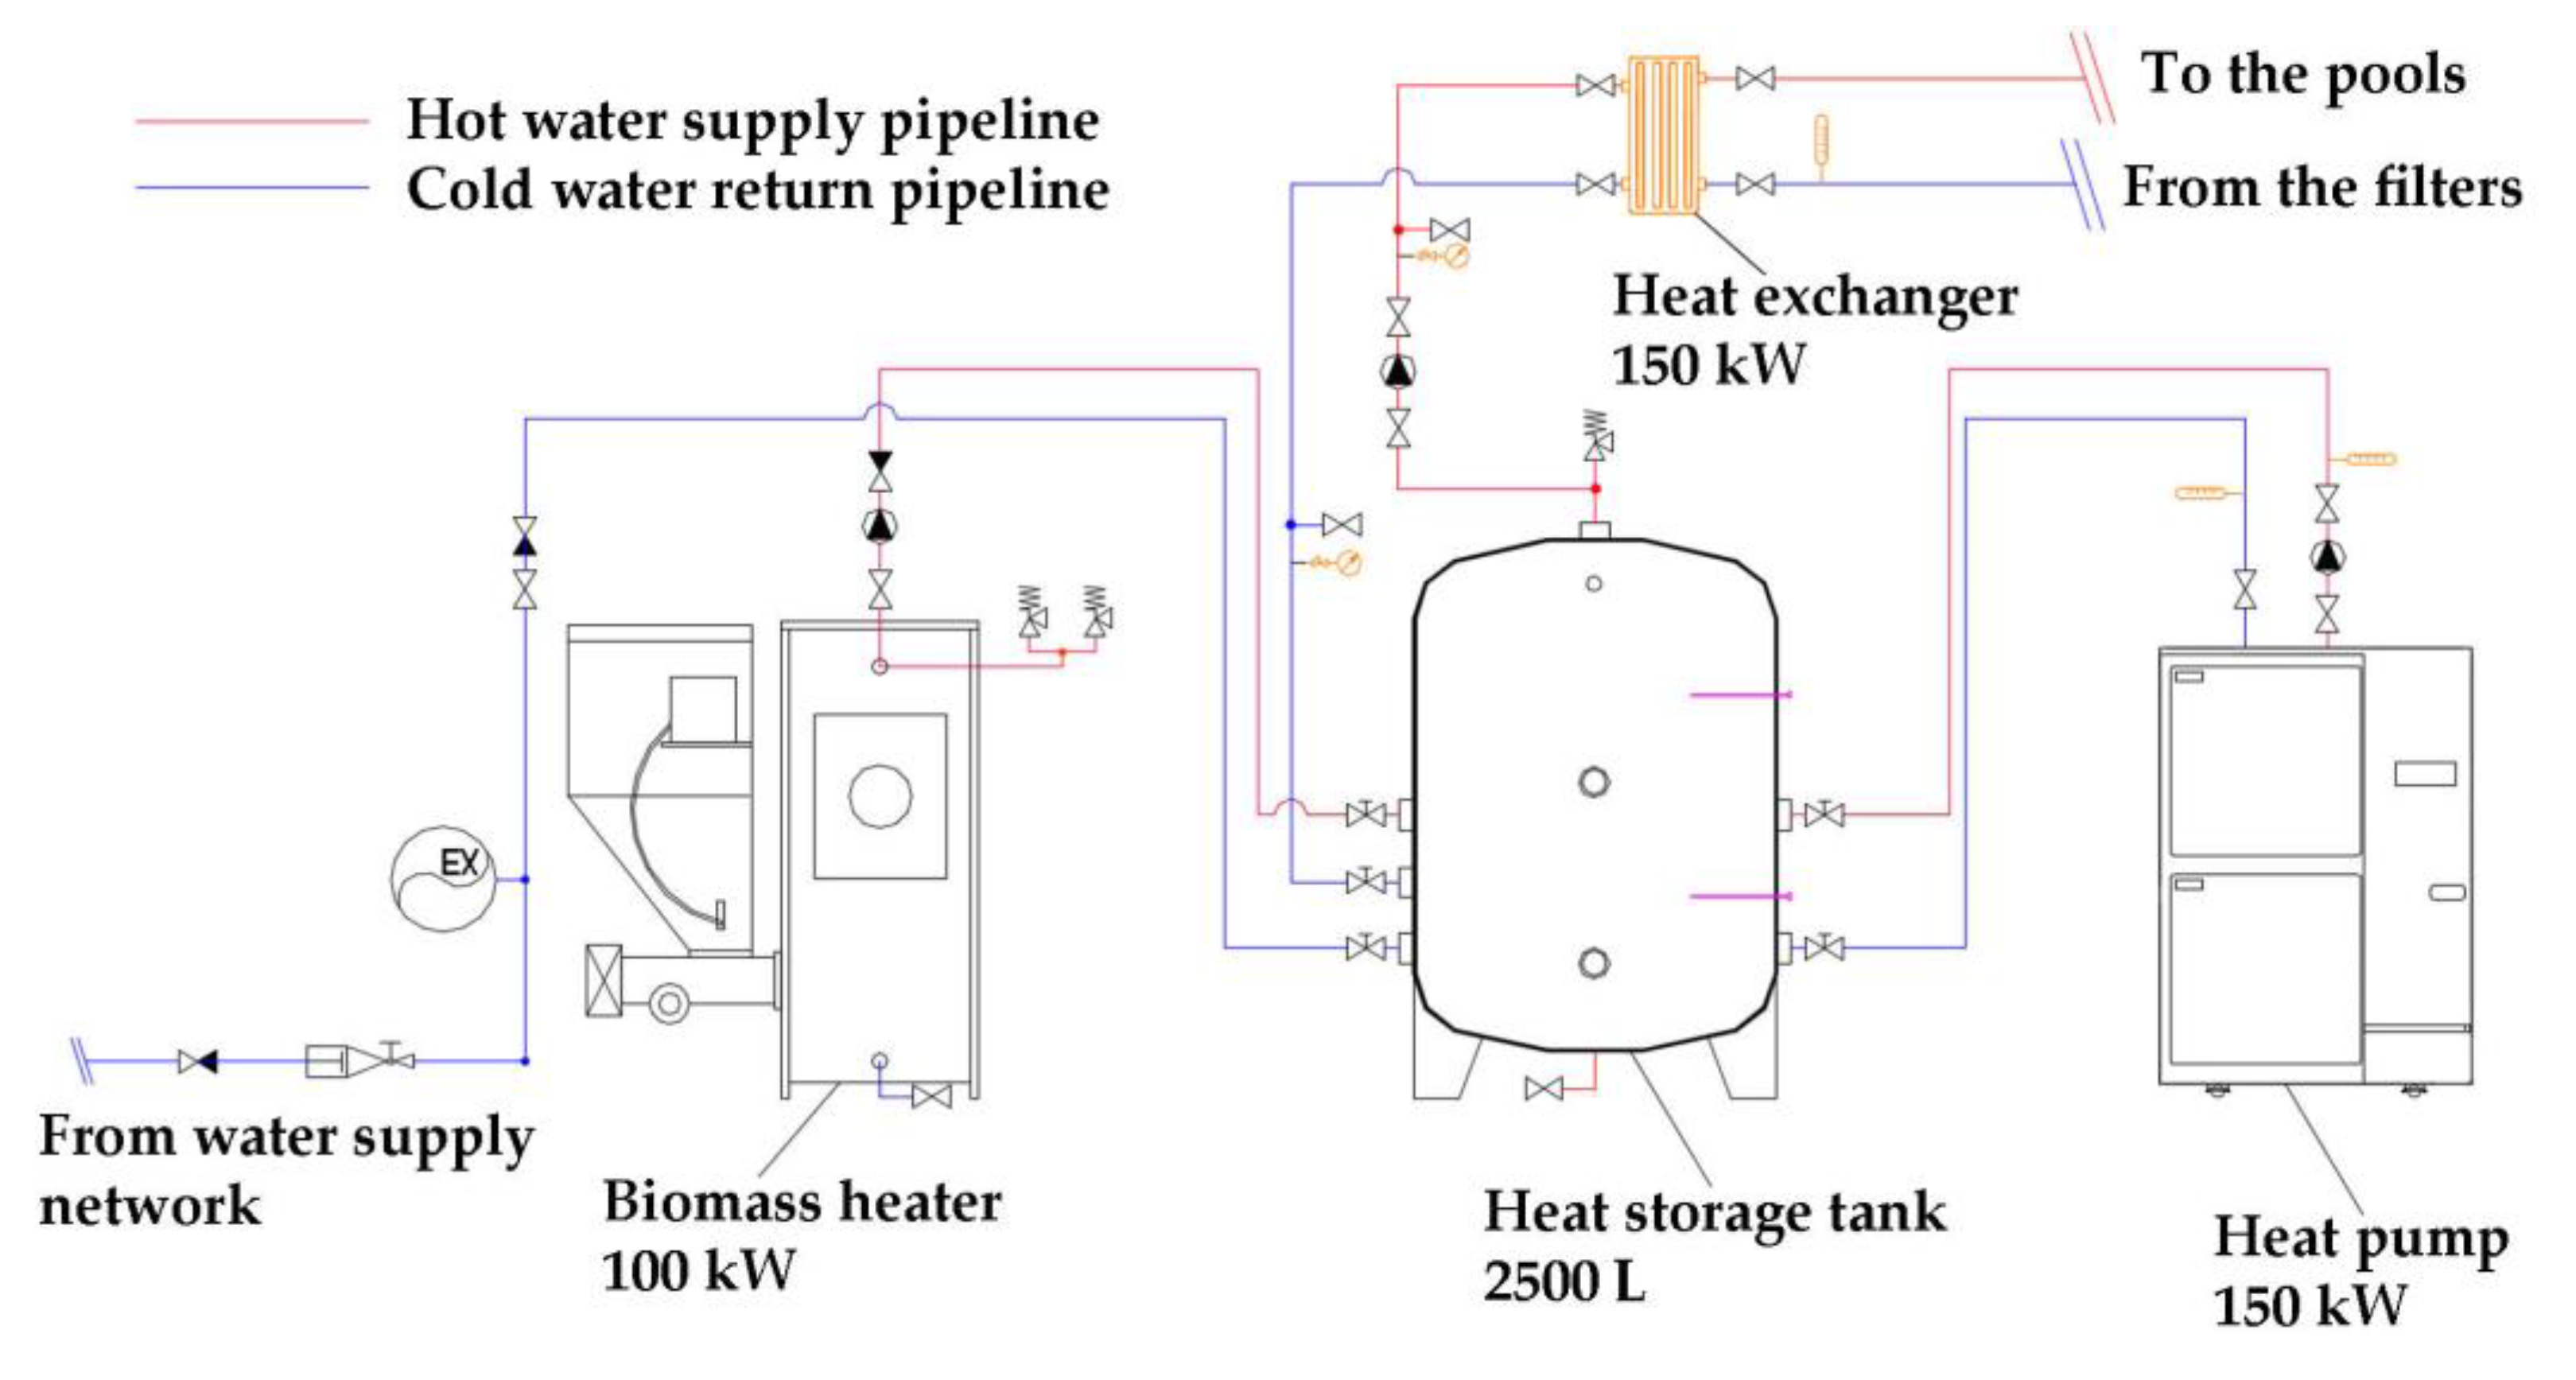
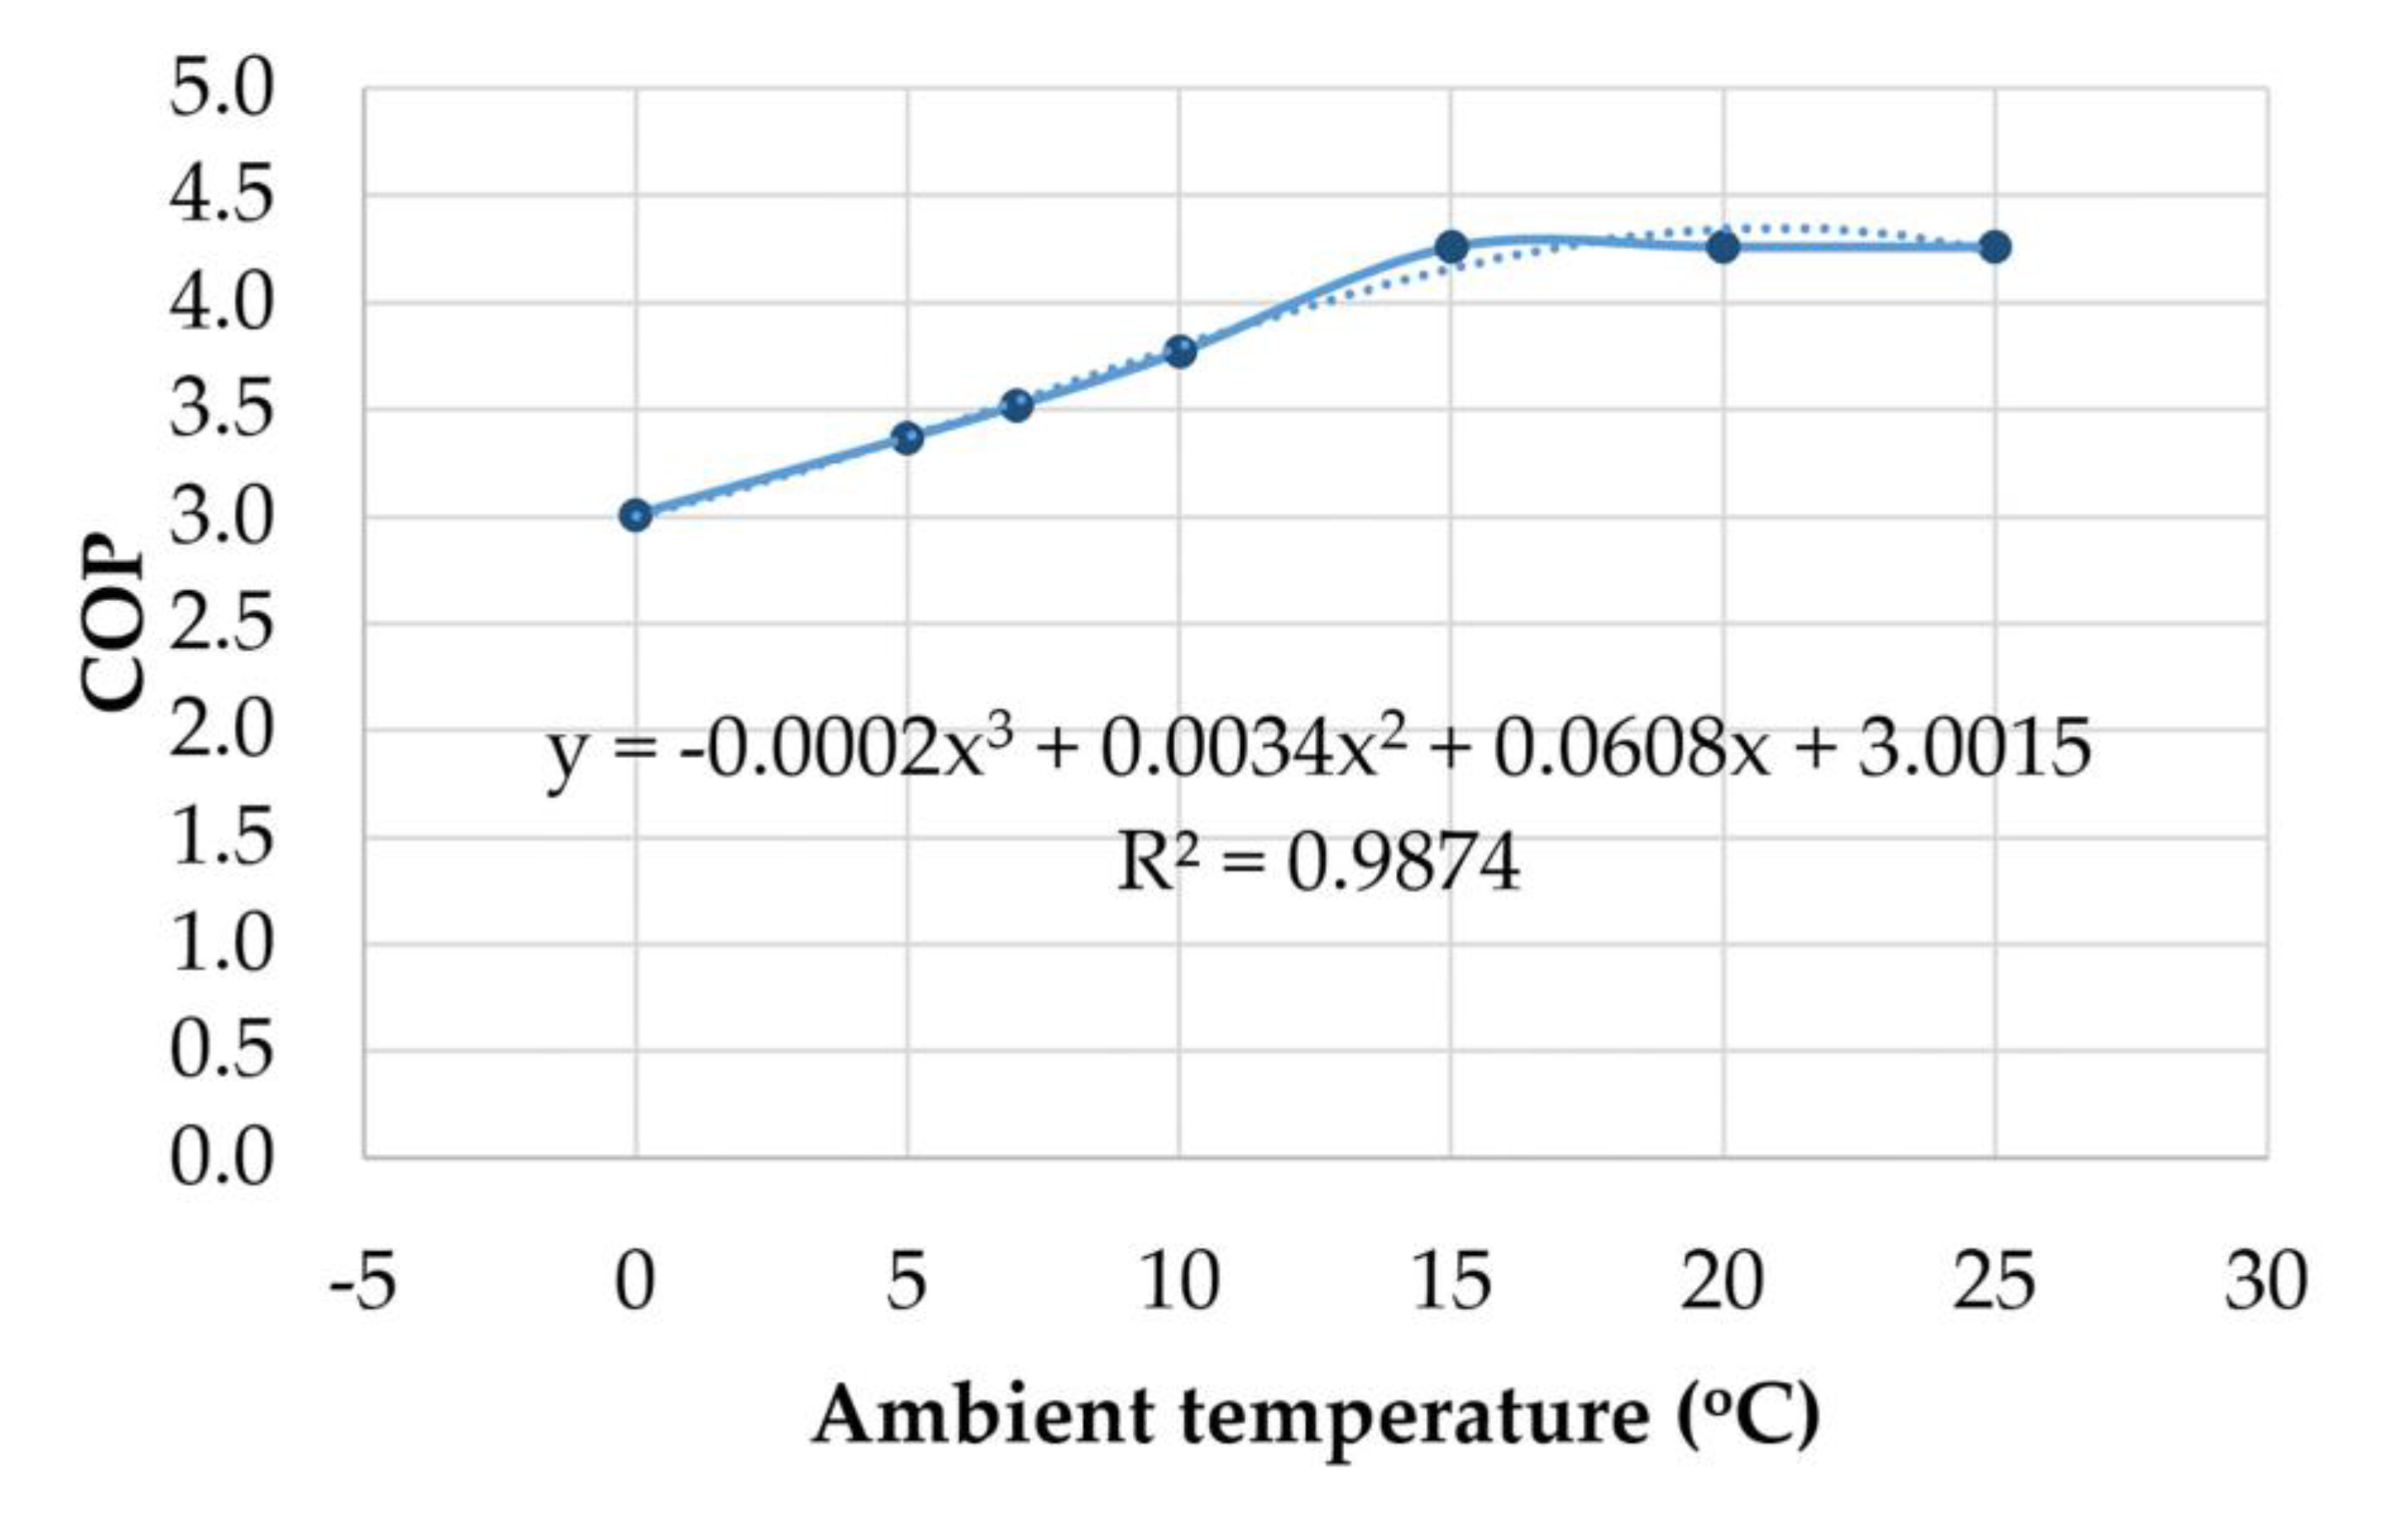
  • Installation of an air-to-water heat pump, with a nominal heat capacity of 150 kWth and nominal COP 3.47 for the swimming pool heating. Additionally, as a backup unit during periods with temperatures lower than 5 °C, a biomass burner is also proposed, with a nominal capacity of 100 kWth and efficiency at 89–91%, when operating with biomass pellets. The two heat production units will be integrated with a heat storage tank of 2500 L capacity, through which the heat will be supplied to the 150 kWth plate heat exchanger. The nominal power of the heat pump and the heat exchanger are derived from the swimming pool heating load, presented in the next section, after the introduction of the proposed passive measures. The proposed system layout is depicted in Figure 11.
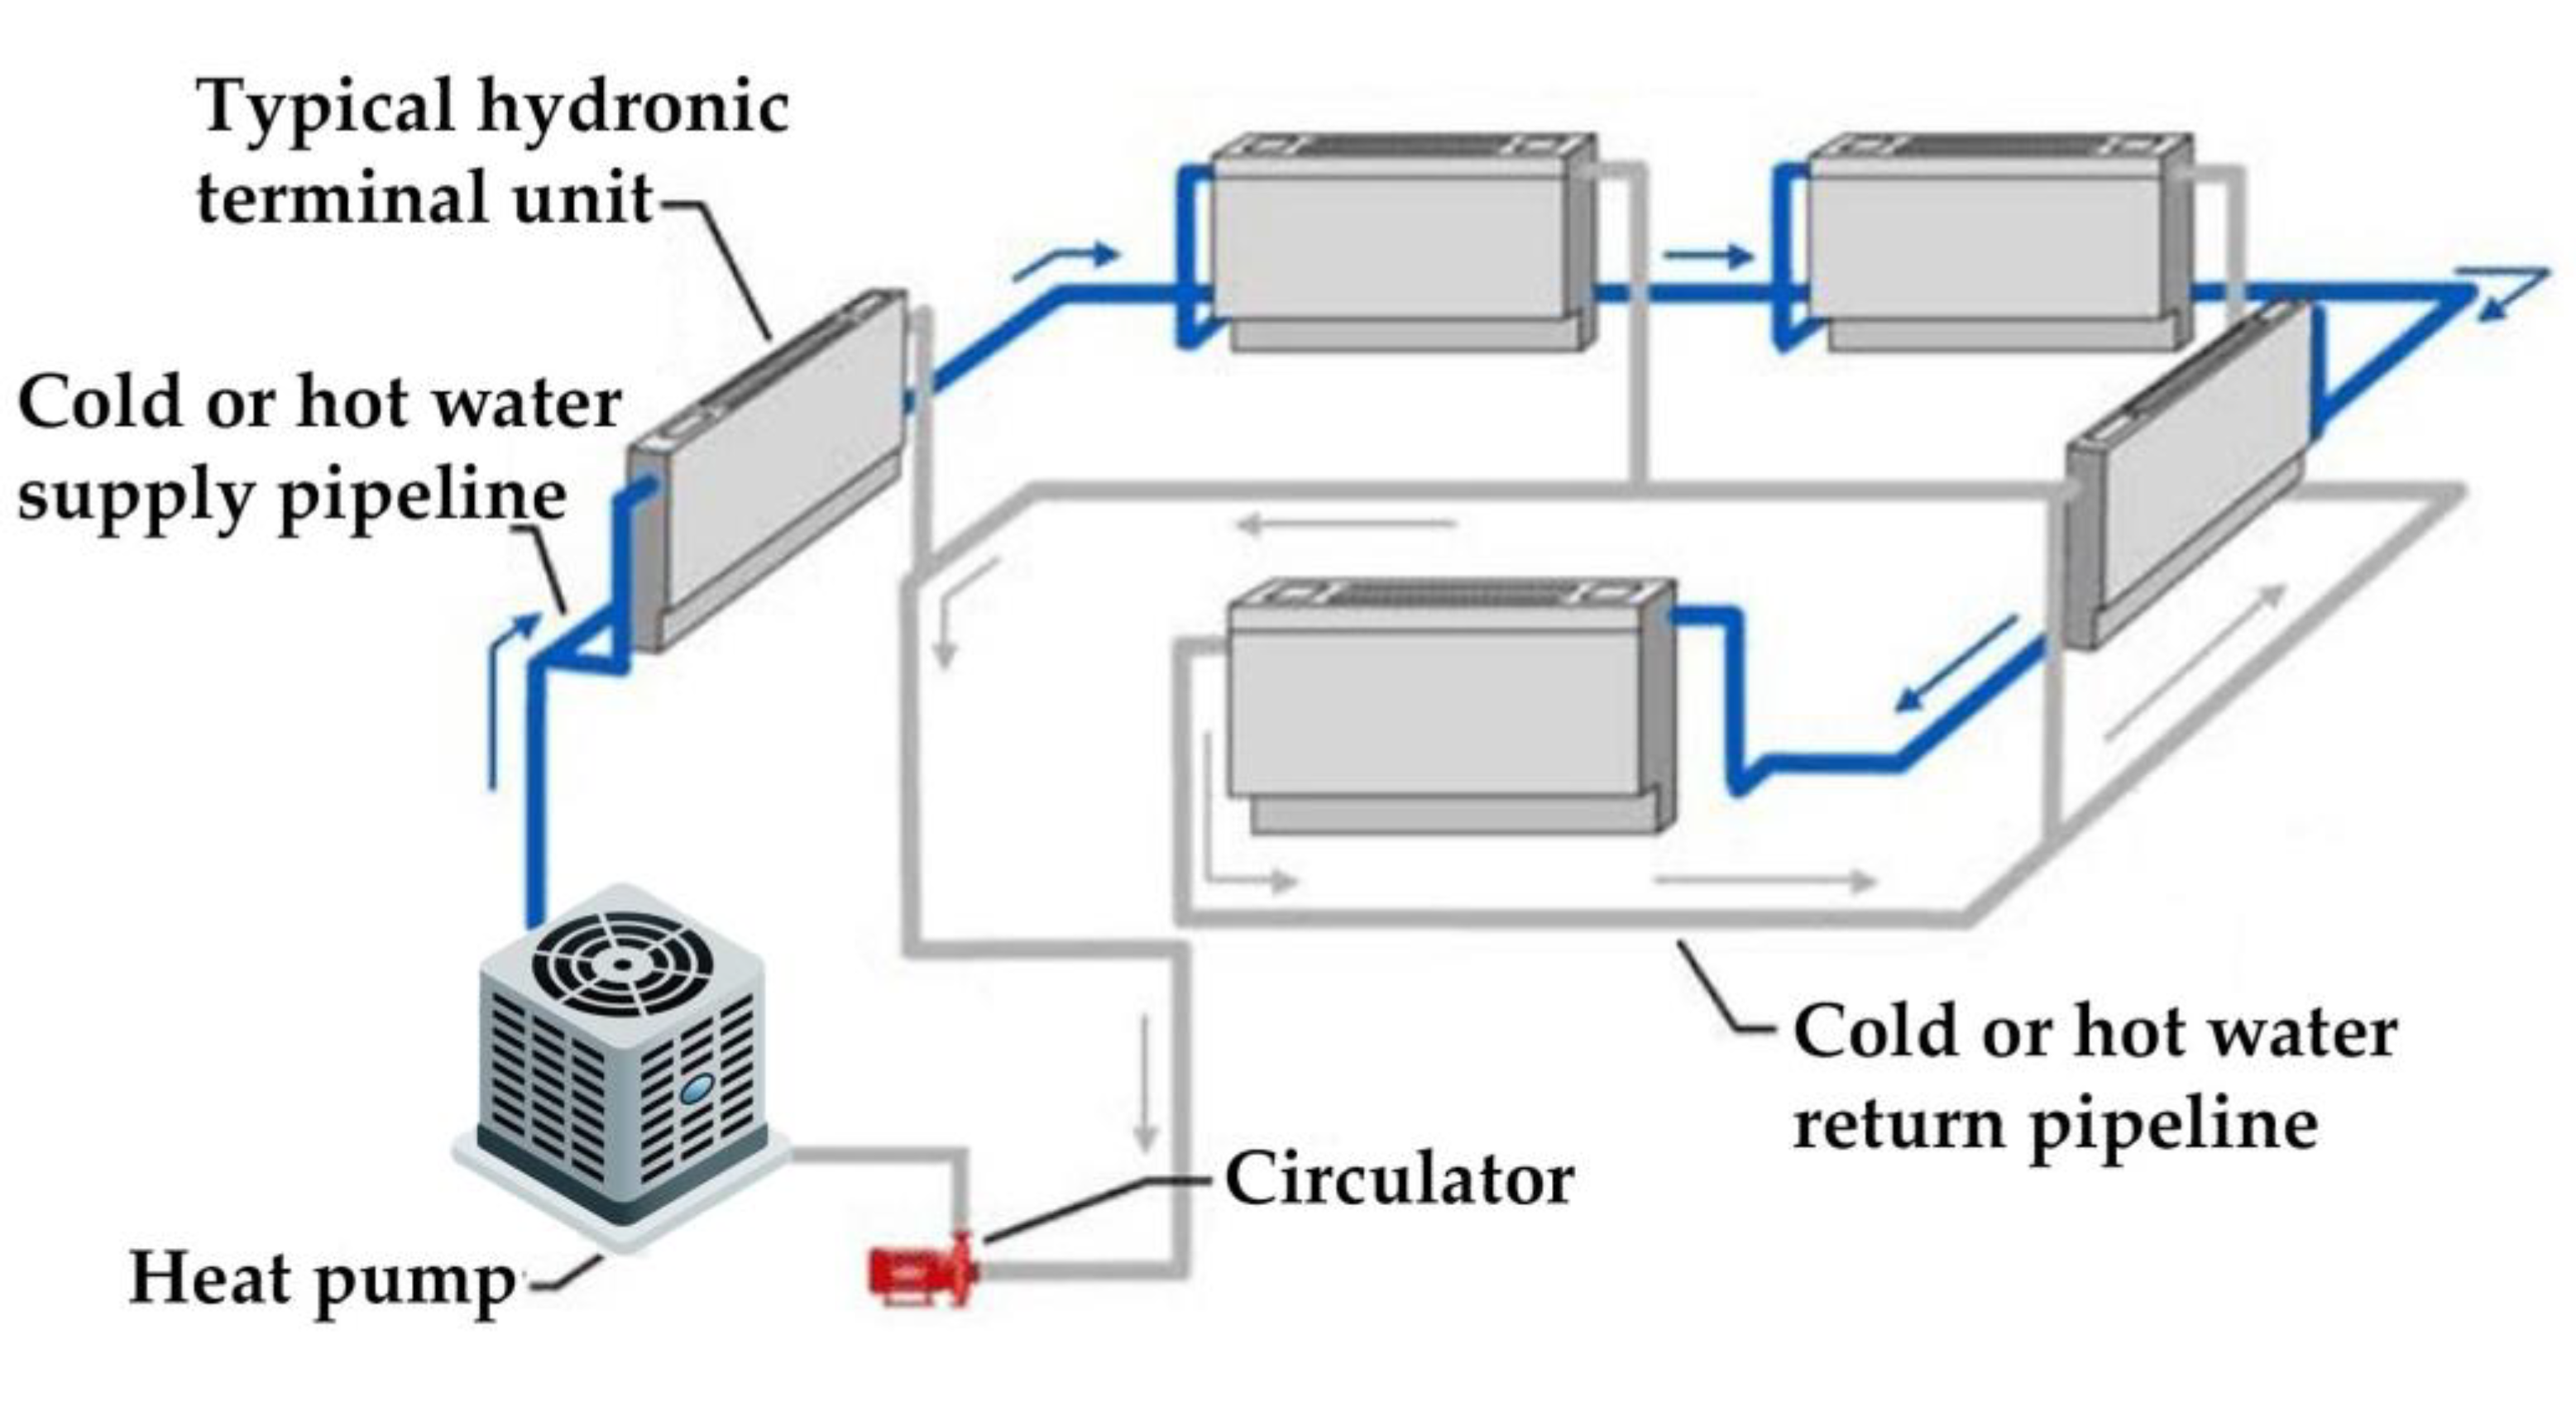
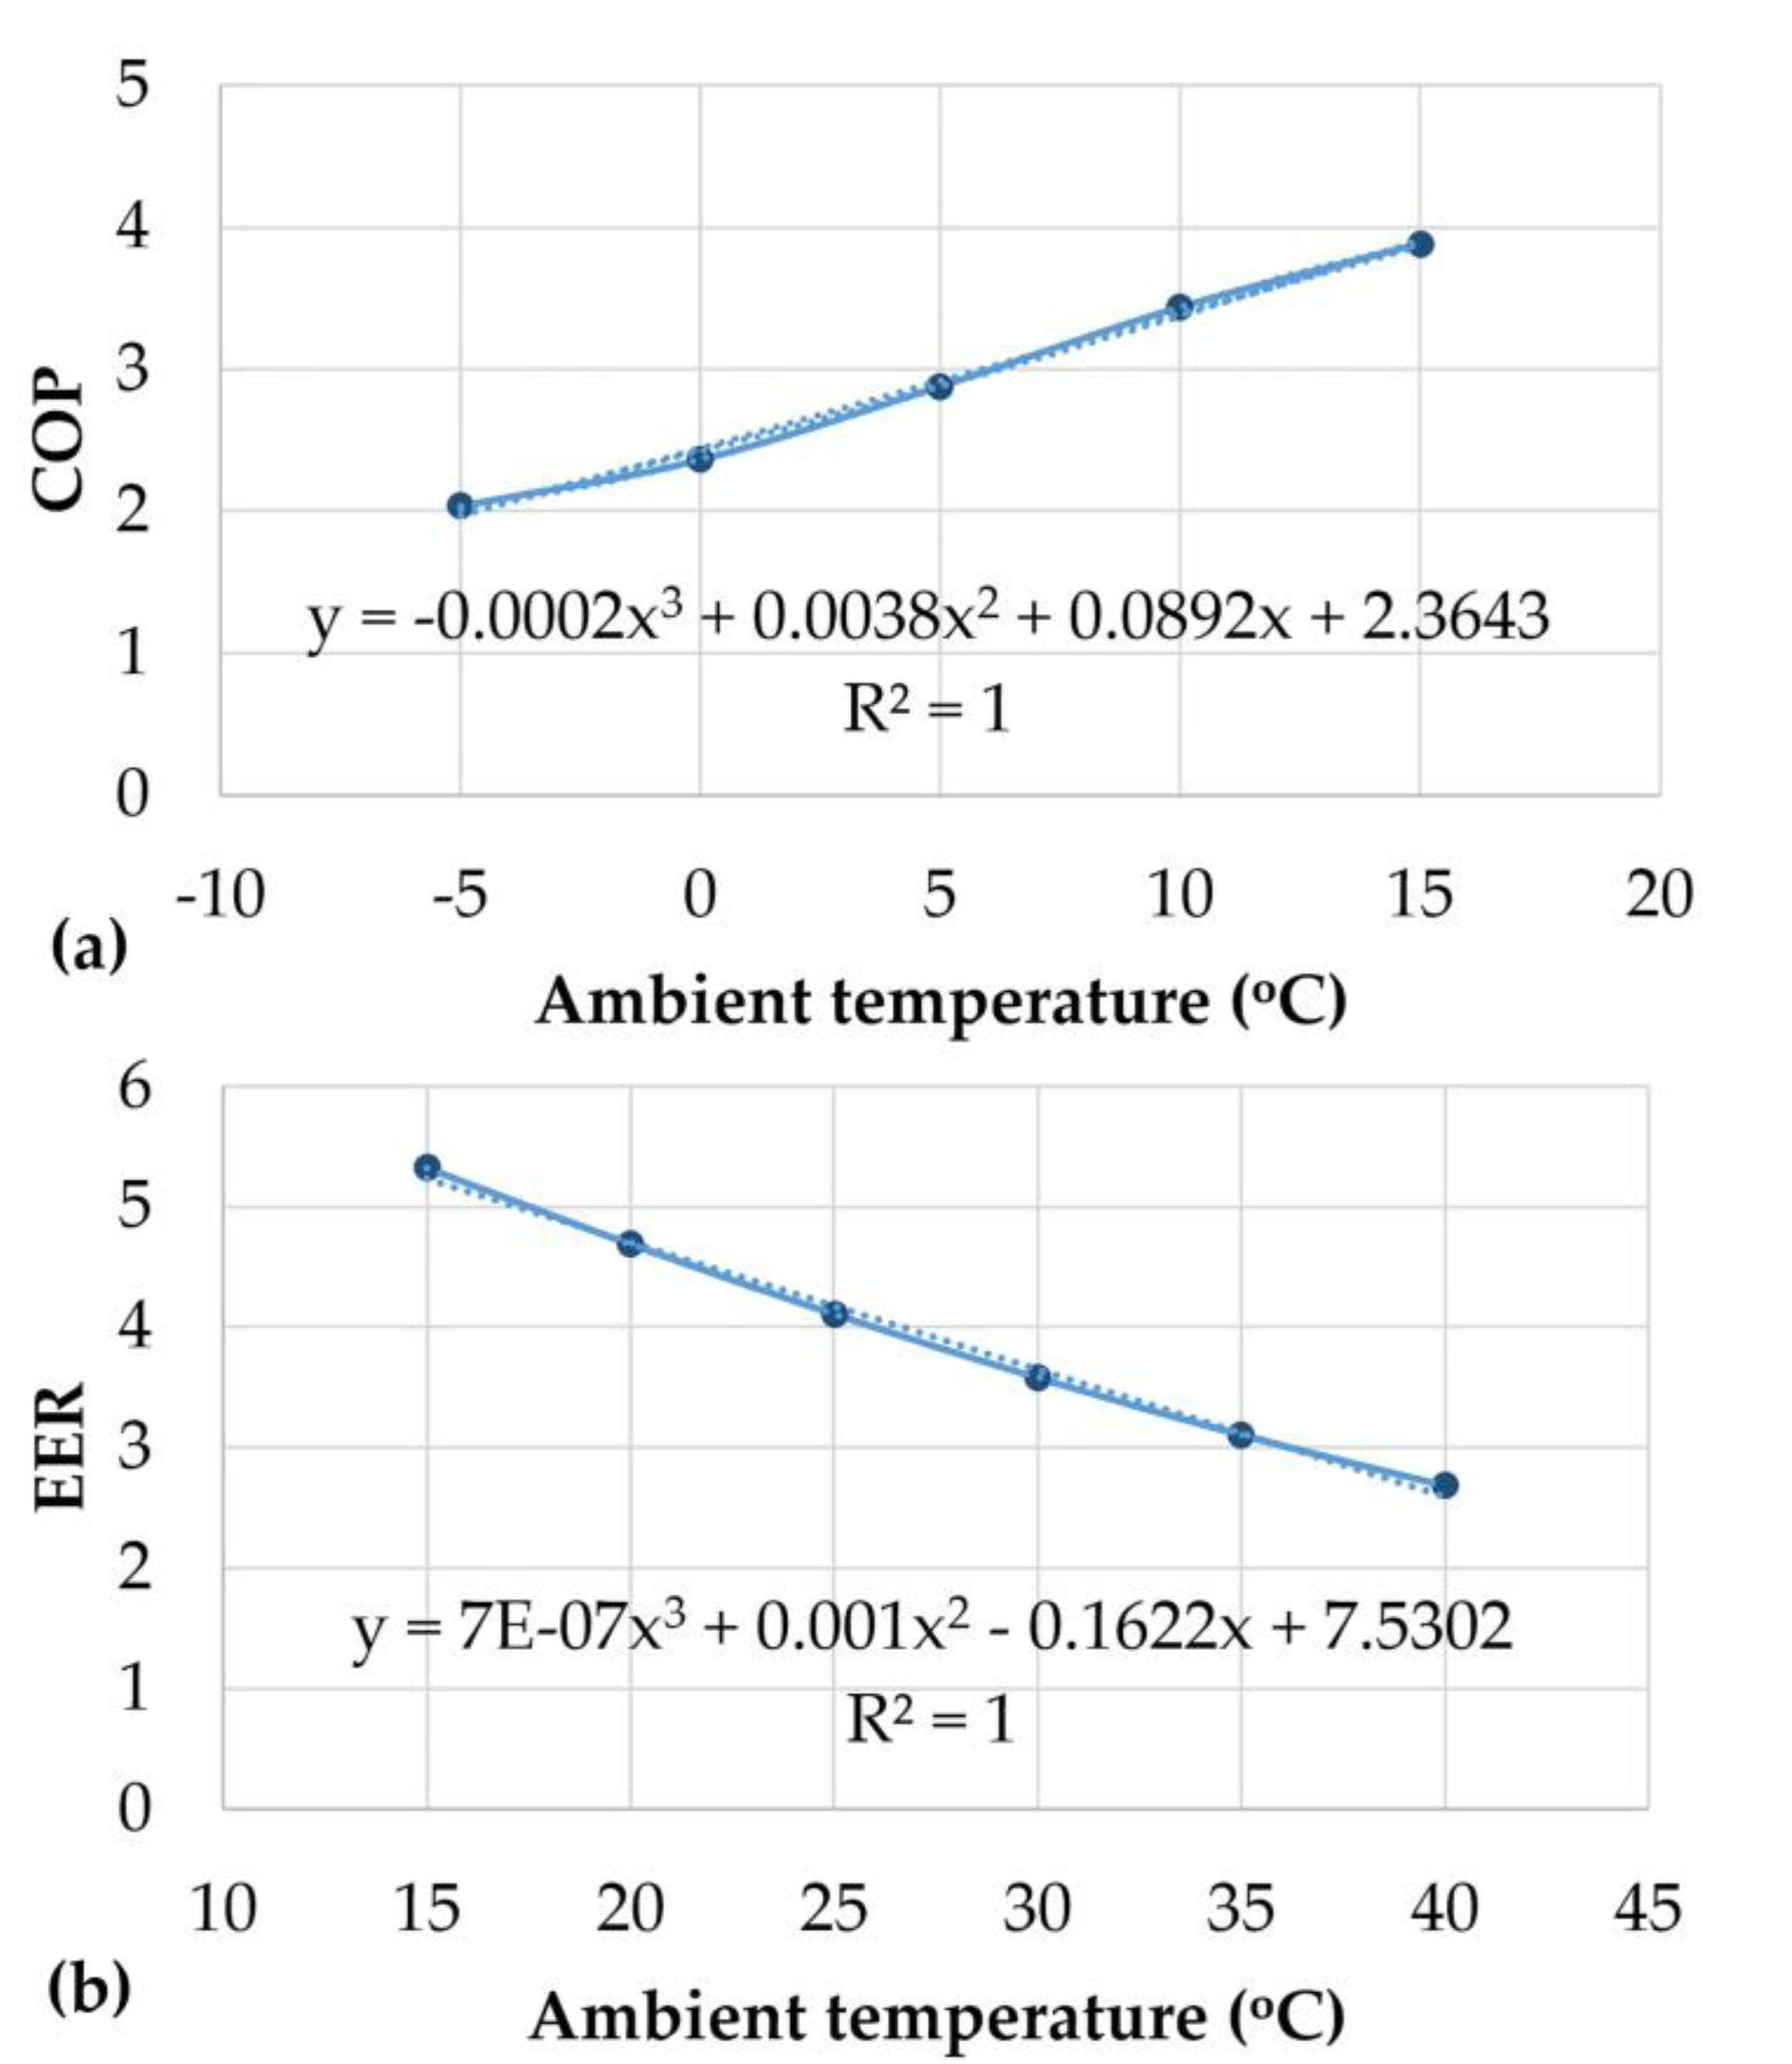
  • With the construction of the swimming pool’s enclosure, a new indoor space will be created. For the conditioning of this particular new indoor space, a second air-to-water heat pump with a nominal capacity of 181.2 kWth for heating and 178.8 kWth for cooling is proposed, together with a new hydraulic network with 32 hydronic terminal units, with a capacity of 6.4 kWth for heating and 5.3 kWth for cooling each one of them and polypropylene (PPR) pipelines. The nominal power of the proposed heat pump is imposed by the heating load calculation of the new indoor space, as presented in the next section. The overall layout of such a conditioning system is presented in Figure 12.
  • A third air-to-water heat pump is finally proposed for the indoor space conditioning of the existing swimming pool building. The nominal capacity of this third heat pump will be 23 kWth for heating and 20 kWth for cooling, given the expected heating and cooling load after the introduction of the proposed passive measures (see Section 5.4.3). The heat pump will also be combined with a new hydraulic network with hydronic terminal units. In total, 13 new hydronic units will be installed for the existing building, with nominal capacities from 1.8 kWth to 3.2 kWth for heating and from 1.8 kWth to 3.8 kWth for cooling. The proposed active systems (heat pumps and hydraulic networks) for the new swimming pool indoor space and the existing building will be totally independent.
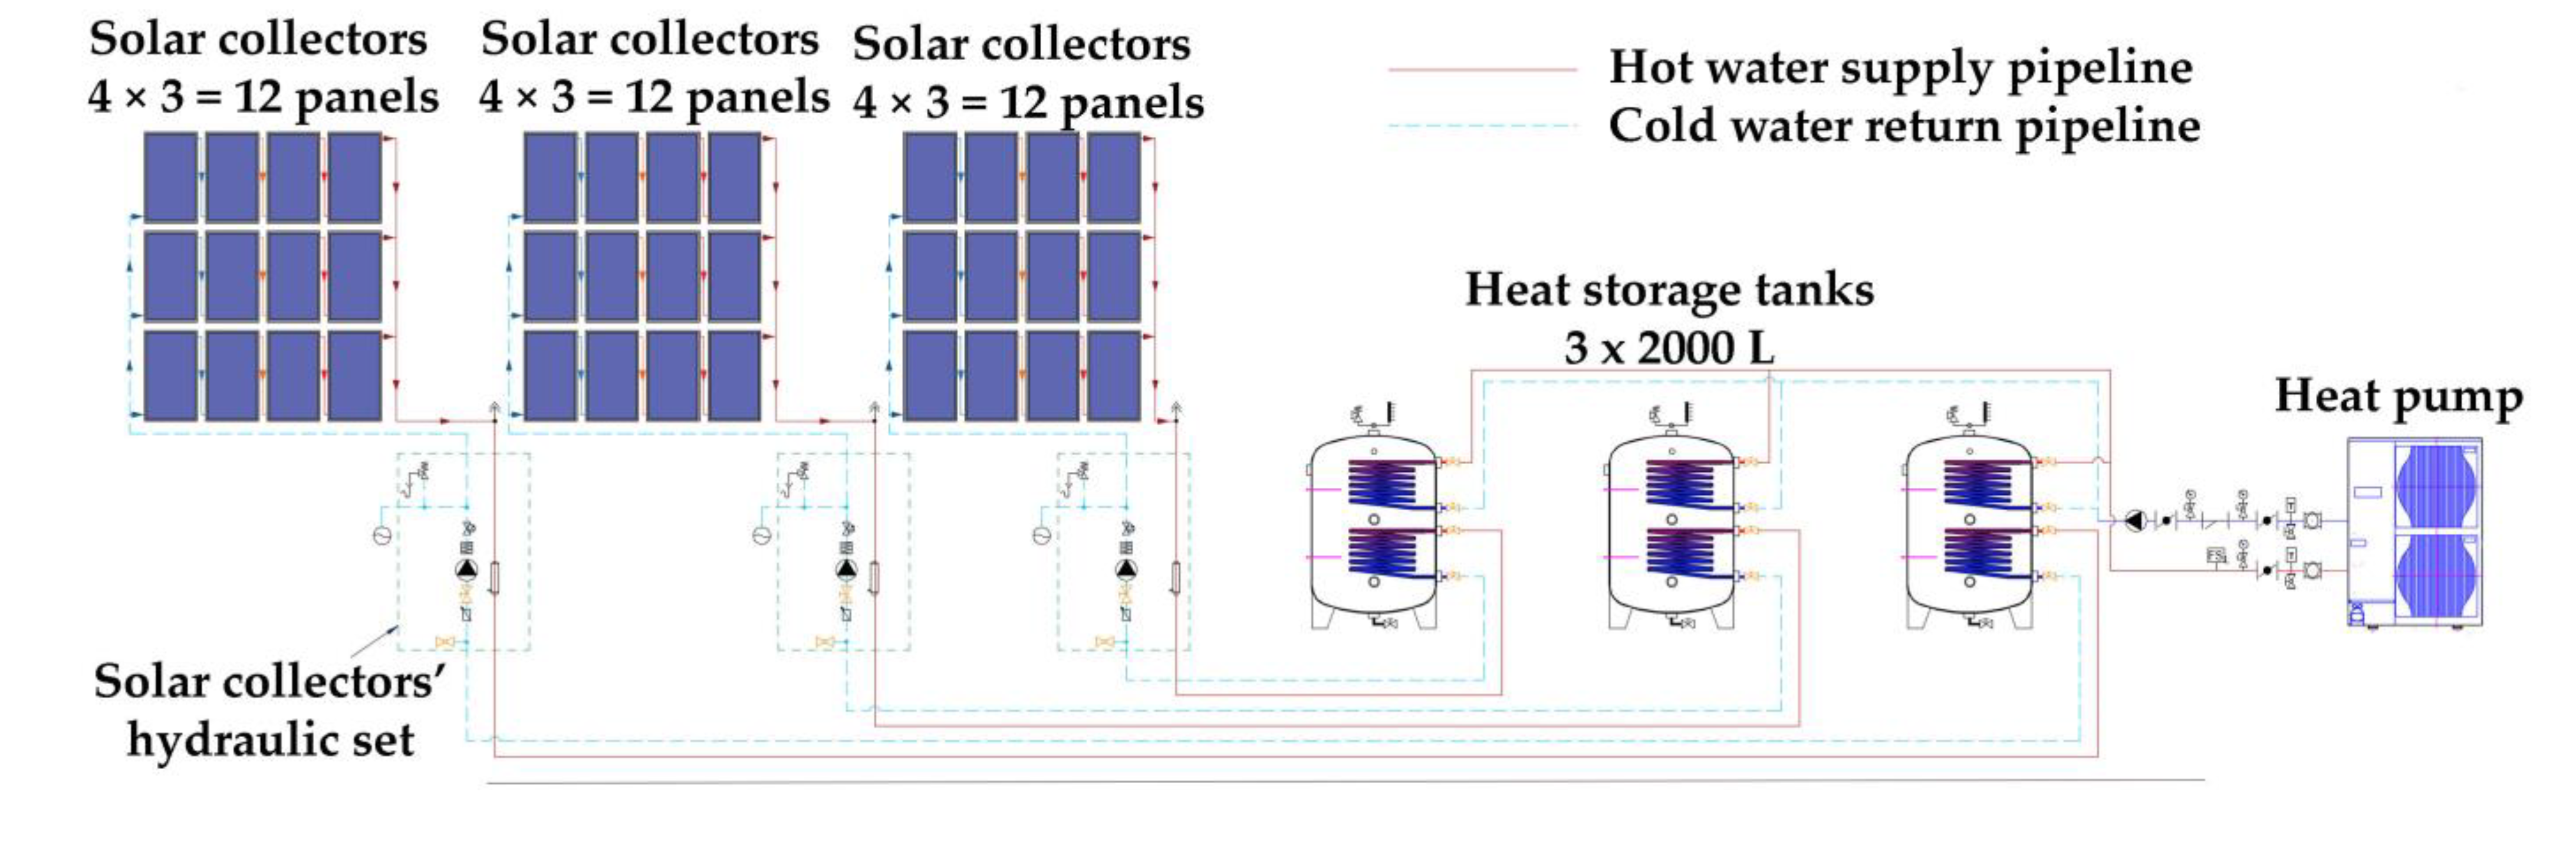
  • A new solar–combi system, with structural concept presented in Figure 13, is also proposed for domestic hot water production in the swimming pool centre. The system will consist of 36 solar thermal covered collectors of selective coating, divided into three groups of 12 collectors. Each one of these groups will be connected to a heat storage tank of 2000 L capacity. The system will be supported by a fourth air-to-water heat pump, with a nominal heating capacity of 23 kWth. This sizing is the result of the computational simulation of the system’s annual operation and a relevant iterative optimization process, presented in Section 5.4.4. The collectors will be installed at the northeastern part of the available land property, on the roof of a new metallic bearing structure, to avoid space capturing on the ground. In order to maximize the annual heat production during winter, the solar collectors will be installed with a 40° inclination with regard to the horizontal plane and southern orientation.
  • All existing indoor and outdoor lamps, luminaires and floodlights of the swimming pool’s centre and the football ground will be replaced with new LED technology. The total installed outdoor lighting power will be reduced from 48.1 kW to 8.2 kW (83.0%). The total installed indoor lighting power will increase from 10.7 kW to 11.6 kW (8.4%) due to the configuration of the swimming pool’s new indoor space.
  • An overall upgrade is also proposed for the existing pumping and hydraulic infrastructure for the circulation of the swimming pools’ water, including the redesign of the overall hydraulic network, replacement of the existing metallic pipes with new ones of PVC, replacement of the existing three pumps with four new ones, with 18.5 kW electrical nominal power each, 220.9 m3/h flow rate capacity, 20.2 m head and 80.4% nominal efficiency etc. All the proposed interventions in the swimming pools’ machinery aim to reduce the required head for the water’s circulator, increase the pumps’ efficiency and increase the flexibility of the pumps’ operation, by increasing their number, for the water circulator independently in the two swimming pools.
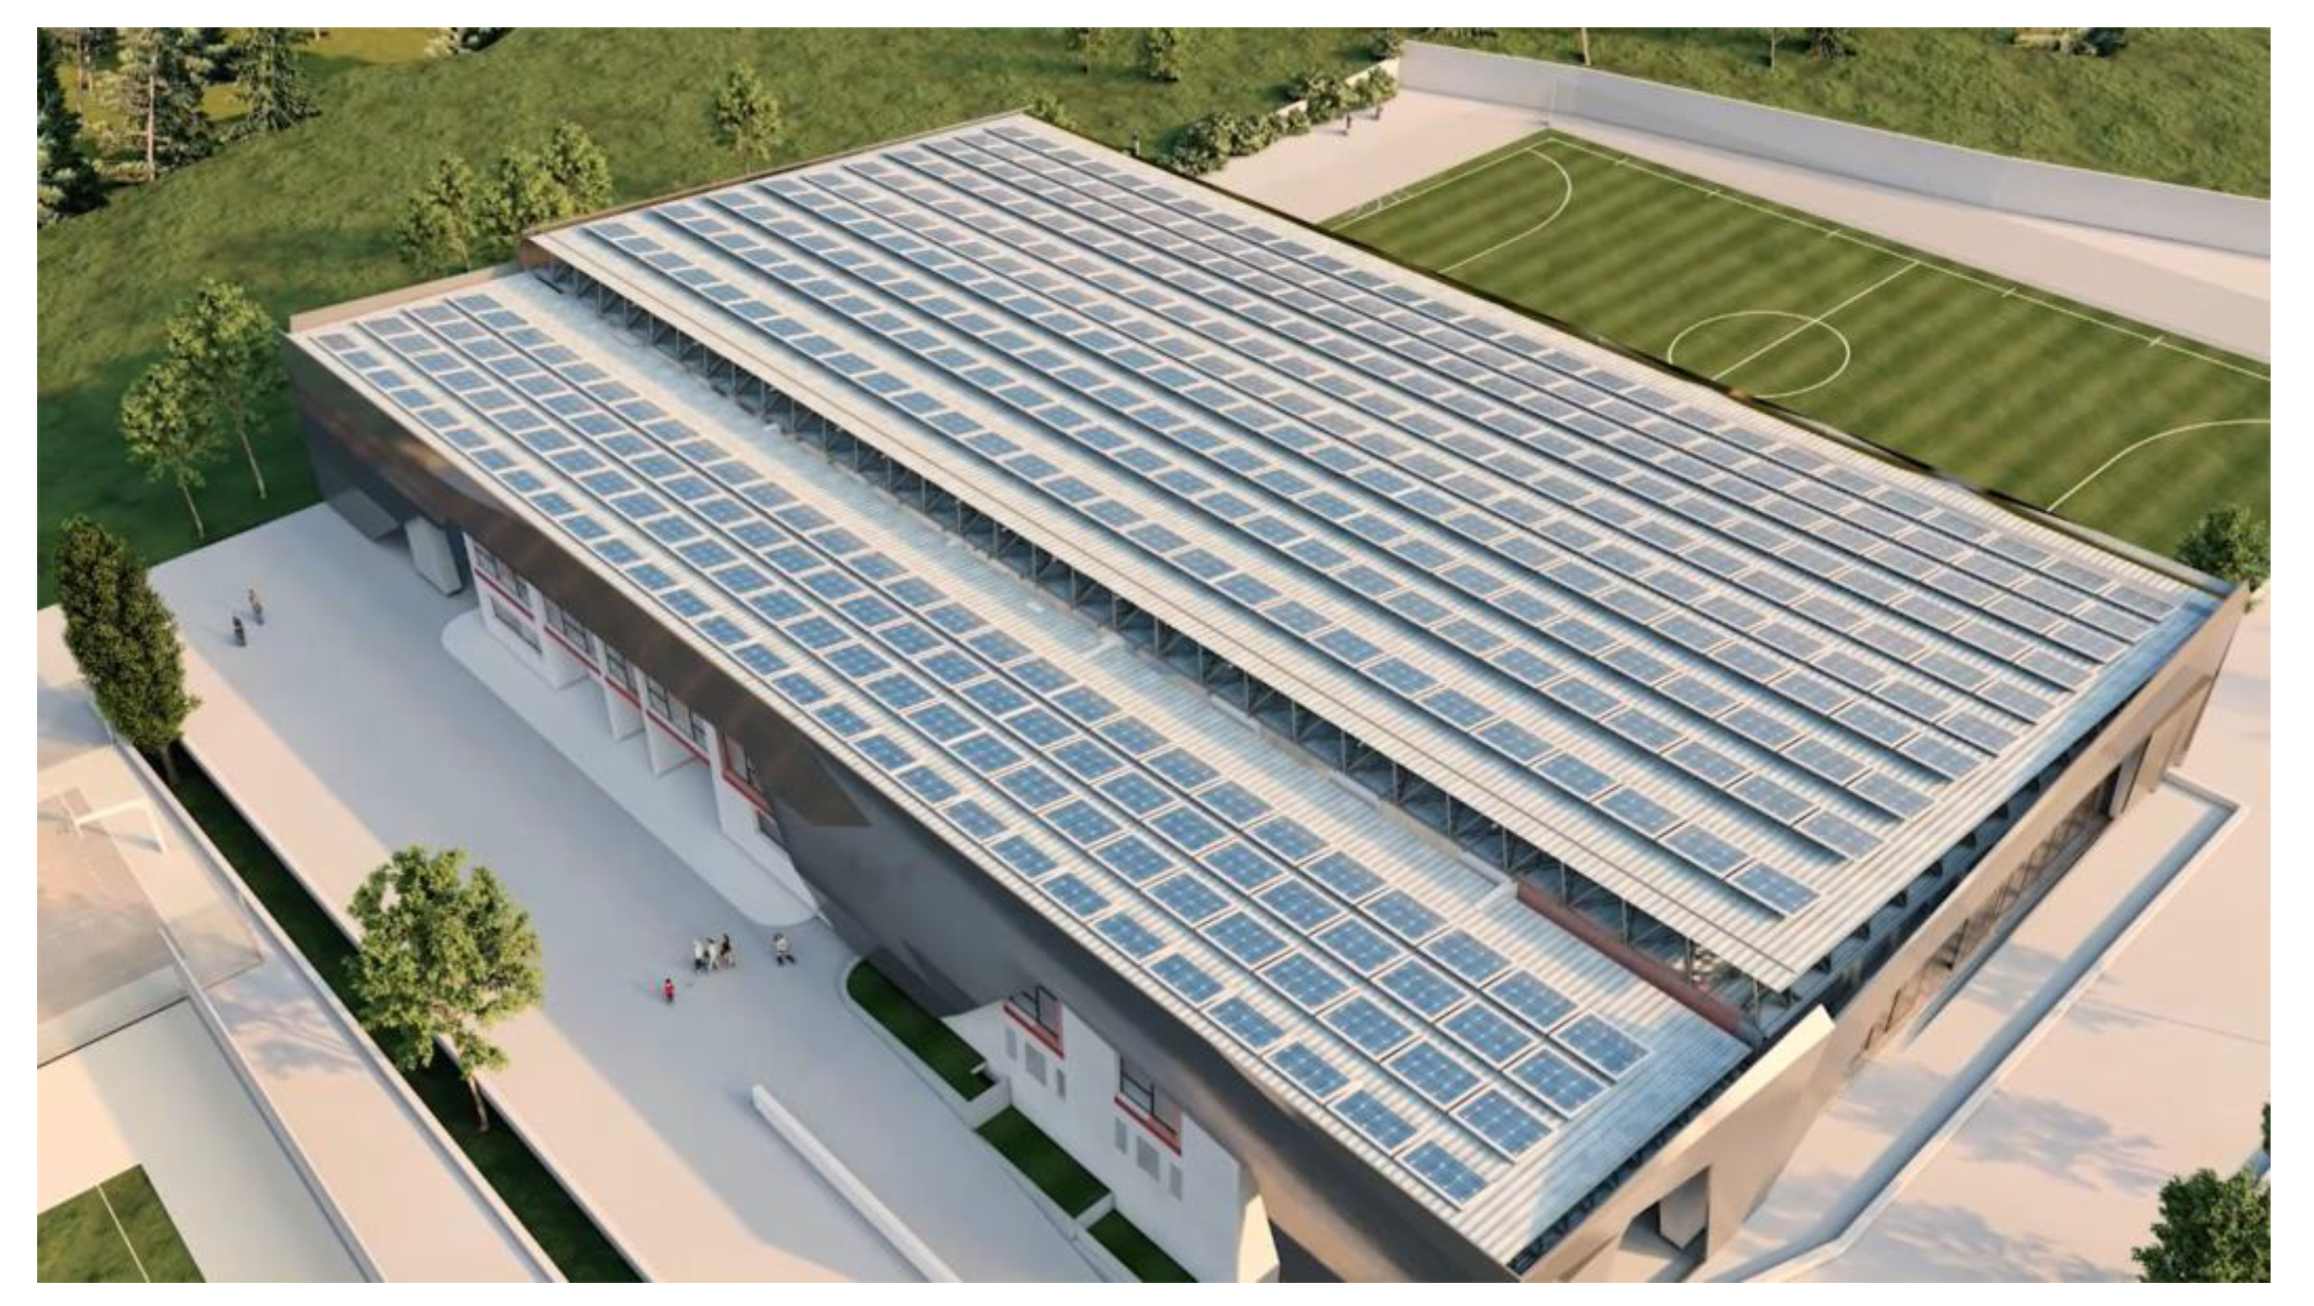
  • With the proposed passive and active measures, the use of diesel oil is totally eliminated in the municipal sports centre, and the coverage of all the final energy uses is fully transferred to electricity. As compensation for the remaining electricity consumption, a photovoltaic station is proposed to be installed on the new enclosure’s roof.

5.4. Energy Consumption with the Proposed Upgrade Measures

In this section, the energy consumption will be presented separately for all discrete energy final uses in the municipal sports centre once all the proposed passive and active energy-saving measures have been implemented.

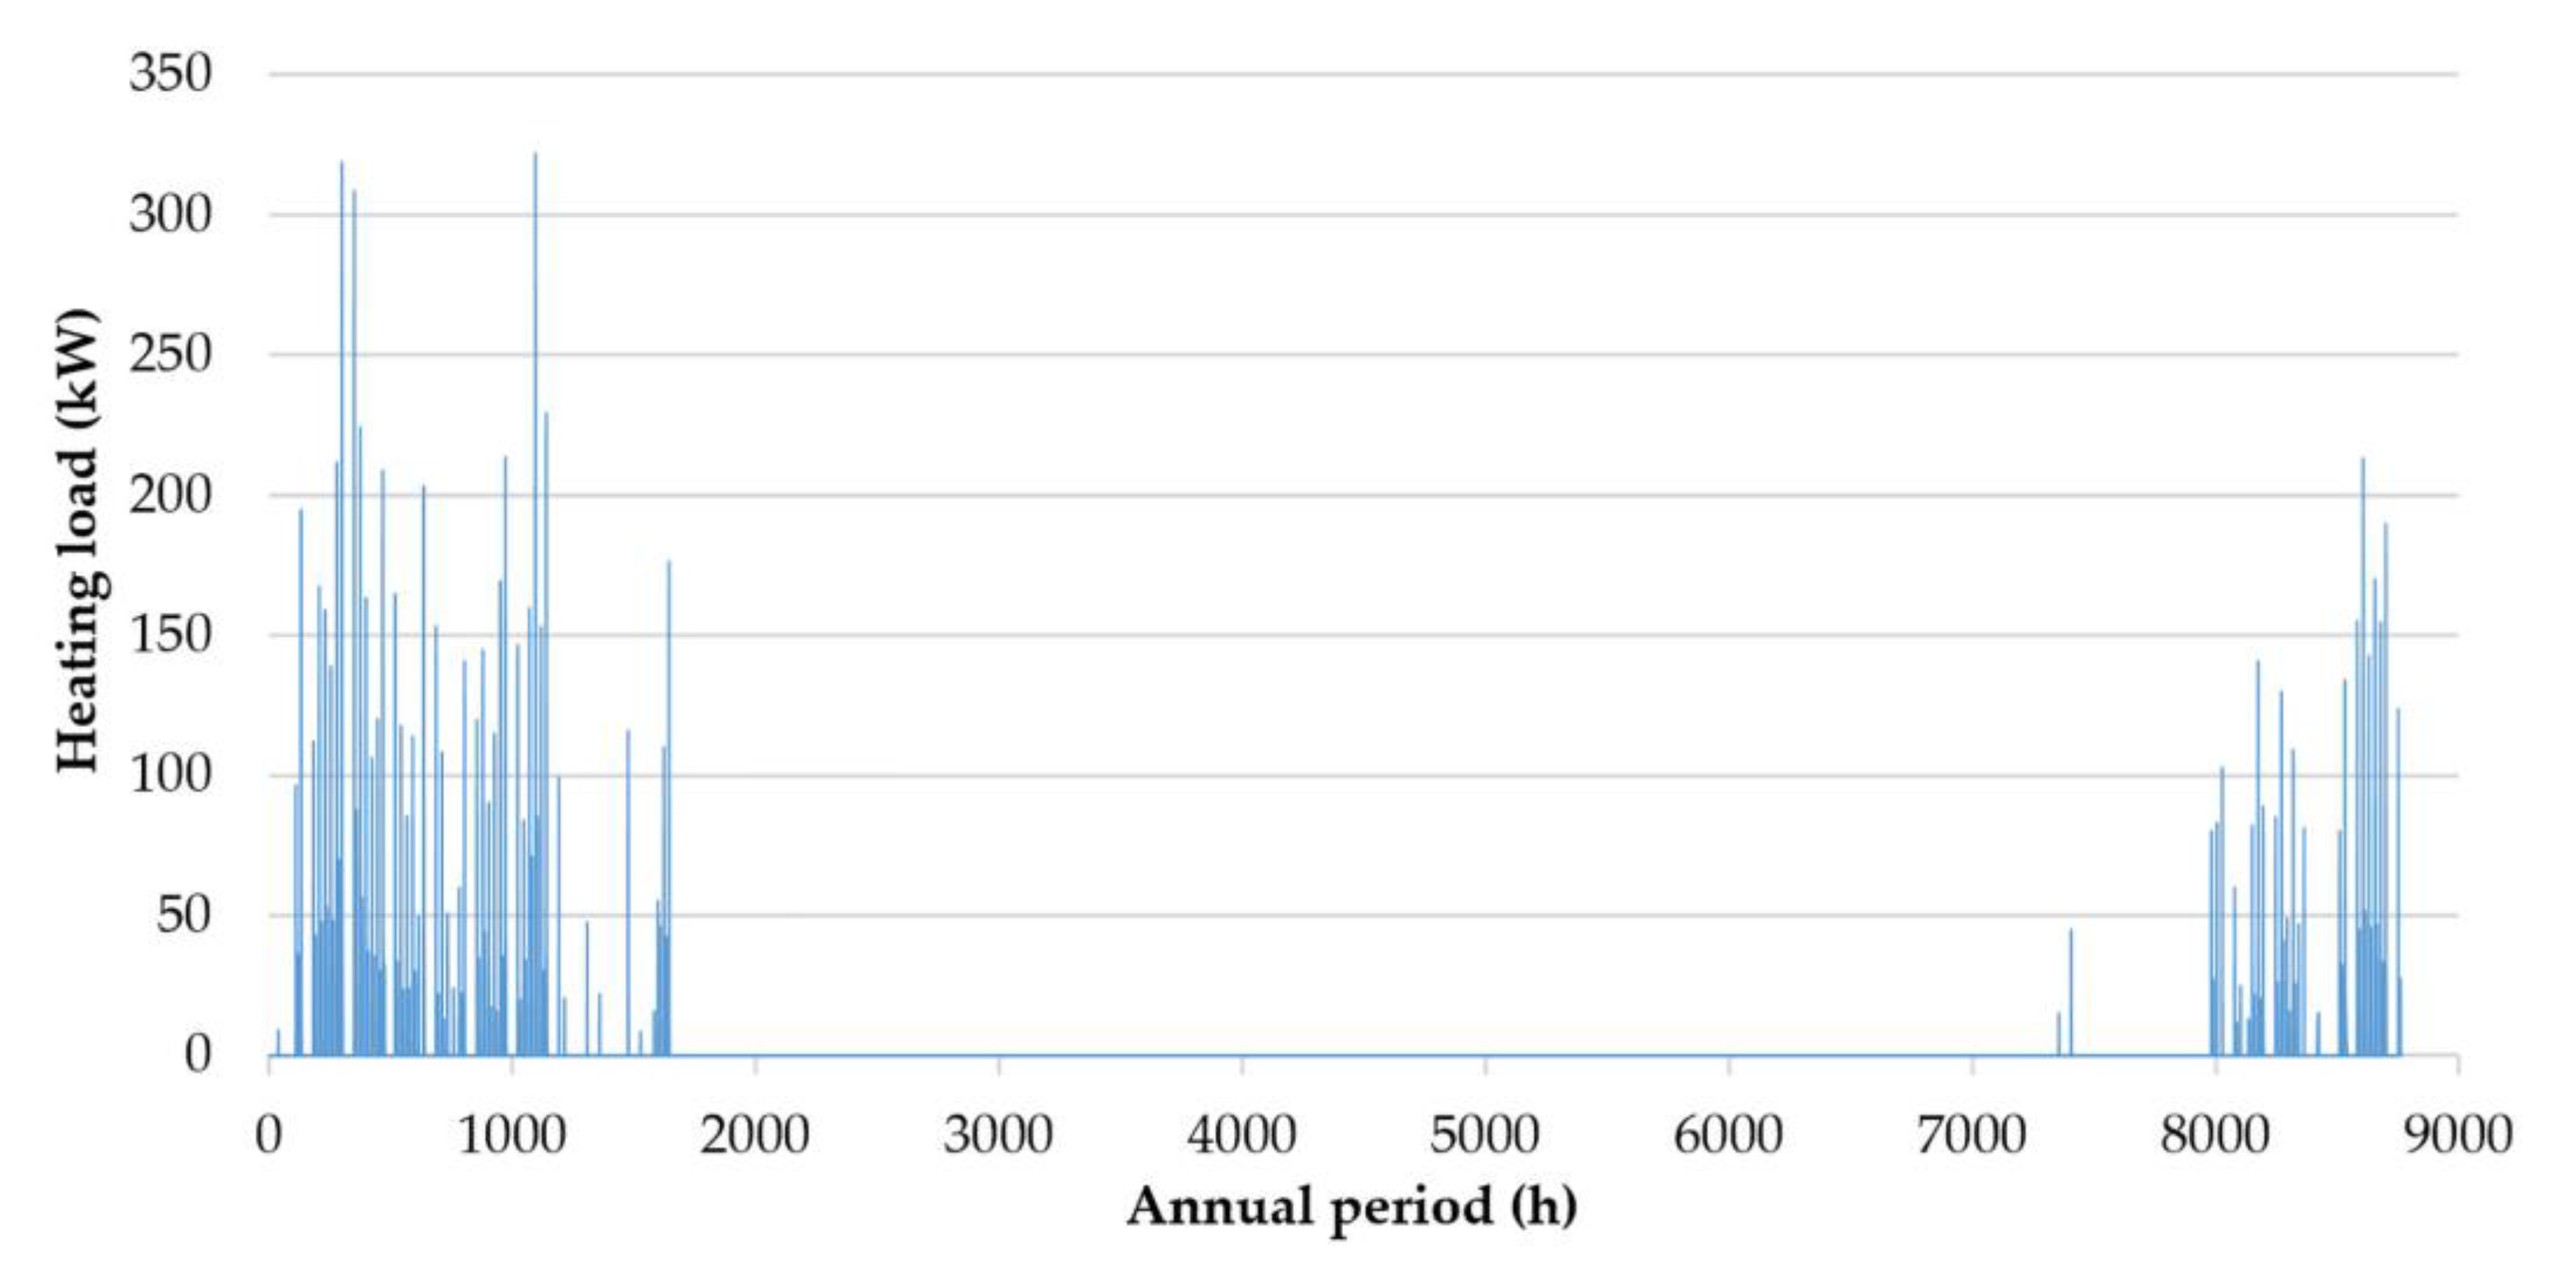
5.4.1. Heating Load of the New Swimming Pool Indoor Space

The process starts with the calculation of the heating load of the new swimming pools’ indoor space. It is reminded that the vertical transparent surfaces of the new enclosure open during summer to avoid overheating this newly configured indoor space, so there is no cooling load to be calculated. The heating load calculation follows the process presented in Section 5.2.2. The achieved U-factors of the new enclosure’s structural elements are 0.367 W/m2∙K for the roof, 0.377 W/m2∙K for the vertical opaque surfaces and 0.6677 W/m2∙K for the vertical transparent surfaces. The natural ventilation is calculated again with Equation (14), with the parameters K1, K2 and K3 equal to 0.100, 0.011 and 0.034, respectively, for adequate air sealing. The required mechanical ventilation air changes, according to the Greek Directive on Buildings’ Energy Performance [65], were set equal to 2250 m3/h. The thermal performance of the newly configured indoor space with the construction of the swimming pool enclosure was computationally simulated with the TRNSYS software.
The heating load annual fluctuation of the swimming pools’ new indoor space is presented in Figure 14. By aggregating this time series, the total annual heating load is calculated at 16,688.7 kWh, which, given the covered area of the new space (2196 m2), gives a specific annual heating load of 7.60 kWh/m2.
The peak heating load was calculated at 321.7 kWth, while the 10th annual maximum heat demand was calculated at 202.8 kWth. The selection of the air-to-water heat pump was implemented according to the latter. The closest commercially available model found has a nominal heating output of 181.2 kWth. The Coefficient of Performance (COP) is given by the manufacturer equal to 3.34, according to the EN14511 standard, under normal heating conditions at an outdoor temp of 7 °C DB/6 °C WB and outlet water temperature of 45 °C.
The heat pump will be combined with a network of 32 hydronic terminal units (fan coils), with a capacity of 6.4 kWth for heating each one of them, placed in two lines of 16 units each along the two long sides of the new enclosure. Introducing a typical COP curve versus the ambient temperature, as shown in Figure 15, the electrical power consumption Pel for the swimming pools’ new indoor space heating is calculated by Equation (16):
P el = Q h COP
where Qh is the newly configured indoor space heating load. By applying Equation (16) in the annual heating load time series of Figure 14, with the COP selected from Figure 15 versus the ambient temperature (Figure 3, Section 4), the corresponding annual electrical power consumption time series is produced, and the annual electricity consumption is calculated as equal to 4240 kWh, which corresponds to 12,296 kWh of primary energy.
Finally, another necessary magnitude required for the calculation of the swimming pools’ new heating load is the indoor temperature of this newly configured indoor space. Its annual fluctuation is presented in Figure 16. The indoor space temperature annual profile was also a result of the thermal performance simulation of the newly configured indoor space, executed with TRNSYS. During summer, the swimming pool is again converted to an outdoor facility. The temperature above the swimming pool’s space is considered equal to the ambient temperature.

5.4.2. Swimming Pool Heating

The swimming pools’ heating load is calculated after the construction of the new enclosure and the installation of the insulating floating cover on the swimming pools’ surfaces. The total heat loss from the swimming pools is calculated again by using Equation (1).
The heat loss with convection and radiation are calculated with Equation (2), yet instead of the ambient temperature Tamb, the temperature Tin for the new swimming pools’ indoor space (Figure 16, Section 5.4.1) is used, as seen in Equation (17):
Q ˙ conv - rad = A sp · U · T w T in ,
The U-factor appeared in Equation (17) expresses the heat loss from the swimming pools under two different operation conditions:
  • Operation periods of swimming pools: these time periods coincide with the swimming pools’ centre operation schedule. During these periods, the swimming pools are in use, so their upper surfaces are free of indoor ambient air. The U-factor for the calculation of the heat loss is given by Equations (3) and (4), as in the existing outdoor condition. Yet, with the construction of the enclosure, the heat transfer factor hc in Equation (3) is set equal to 2.5 W/m2∙K [59] (instead of 10 W/m2∙K), and the temperature Tamb in Equation (4) should be replaced with the new indoor space temperature Tin (Figure 16, Section 5.4.1).
  • Time periods of inoperative swimming pools: during these time periods, the swimming pools are not in use. The proposed insulating floating cover will be placed on their surfaces. The U-factor for these periods is calculated by Equation (18):
U c = 1 1 h w + d c k c + 1 h fc ,
where:
  • hw the thermal convection factor of still water, equal to 50 W/(m2∙K);
  • kc the thermal conduction factor of the insulating floating cover, equal to 0.025 W/m∙K;
  • dc the insulating floating cover thickness, equal to 0.02 m;
  • hfc the heat transfer factor from the insulating floating cover to the indoor ambient air.
The heat transfer factor hfc describes the heat loss with convection and radiation from the insulating floating cover to the indoor ambient air and is given by Equation (19):
h fc = h rc + h c ,
where hc is the thermal convection factor for ambient indoor air horizontal flow, adopted equal to hc = 2.5 W/m2∙Κ [59], and hrc is the thermal radiation factor from the insulating floating cover to the ambient indoor air, which is given by Equation (20):
h rc = 4 · ε c · σ · T c + T in 2 3 ,
where εc the emissivity of the floating insulating cover’s material, equal to 0.550, Tc is the floating cover’s temperature, which can be assumed to be equal to the water temperature in the pools and Tin the new indoor space temperature (Figure 16, Section 5.4.1). The ratio inside the parenthesis is the average indoor air temperature.
Additionally, the calculation process described in Section 5.2.1 for the heat loss due to the water evaporation and the water replacement from the municipal water-supply network is also applied in the proposed operation condition, yet, obviously, only for the time periods during which the swimming pools are in use. The same is also applied to the calculation of the solar heat gains. Particularly regarding the heat loss calculation due to evaporation, the following changes should be considered:
  • The wind velocity u0.3 is 30 cm in height from the swimming pools’ upper surfaces, and for indoor space conditions, it is 0. Hence, the evaporation transfer factor is calculated at 0.0563 with the empirical Equation (6);
  • The partial vapour pressure p far away from the swimming pools is calculated by Equation (9) versus the relative humidity φ and the saturation vapour pressure p s , for the indoor space temperature Tin and not the ambient temperature Tamb.
With the application of the above-presented methodology, the swimming pools’ annual heating load time series is calculated for the proposed operation condition, presented in Figure 17.
The results from the calculations of the swimming pools’ annual heating load are analysed in Table 5 for both the existing and the proposed operating conditions. With the proposed passive measures (enclosure construction and placement of the floating insulation cover), the annual heating load is 95.7% reduced, while the peak heat demand is 88.8% reduced. The achieved results reveal the important contribution of the swimming pools’ housing towards the minimisation of their heating needs.
The proposed active system for the swimming pools’ heating is presented in Figure 11 and in Section 5.3. Adopting the COP curve versus the ambient temperature presented in Figure 15, the electrical power consumption for the swimming pool’s heating is calculated as equal to 27,847 kWh, also with Equation (16). This electricity consumption corresponds to 72,056.9 kWh of primary energy.
Table 5 also summarizes the achieved diesel oil and primary energy saving too. The diesel oil consumption is totally eliminated for the swimming pool’s heating, and a primary energy saving of 97.9% is achieved.

5.4.3. Indoor Space Conditioning of the Existing Building

The indoor space heating and cooling load of the existing building is calculated again after the installation of the proposed passive measures. The process is presented in Section 5.2.2 and Section 5.4.1. The insulated surfaces, the number of openings, which will be replaced, and the corresponding surfaces, along with the achieved U-factors for all these new structural elements, have been presented in detail in Section 5.3.
In Figure 18, the annual fluctuation is presented of the heating and cooling load of the existing building in (a) the existing operation state and (b) the operation state after the application of the proposed passive measures.
In Table 6, the annual statistics are summarized on the heating and cooling load calculation results for the existing building before and after the application of the proposed passive measures.
A third air-to-water heat pump is proposed for the indoor space conditioning of the existing building with a nominal capacity of 23 kWth for heating and 20 kWth for cooling. This heat pump will supply a new hydraulic network with 13 total hydronic terminal units (fan coils), independent from the network of the swimming pool’s newly configured indoor space with the construction of the enclosure.
The electricity consumption from the new indoor space conditioning system is calculated by introducing the COP and EER curves, presented in Figure 19, versus the ambient temperature for the new air-to-water heat pump and using Equation (16) for the electrical power consumption for heating and Equation (21) for the electrical power consumption for cooling.
P el = Q c EER
The results regarding the electricity and primary energy consumption for all indoor space conditioning of the municipal sports centre (both the new swimming pool indoor space and the existing building) are summarized in Table 7.
As seen in Table 7, despite the configuration of the new indoor space above the swimming pool with the construction of the proposed enclosure and the introduction, in this way, of a new indoor space heating load for the facility, with the proposed passive and active measures the total primary energy consumption for all indoor space conditioning is 44.9% reduced.

5.4.4. Domestic Hot Water Production

The domestic hot water is proposed to be produced by the solar–combi system presented in Figure 13, Section 5.3. It consists of three similar parts. Each one of them consists of 12 solar collectors, connected in three parallel groups with four in-series connected collectors in each one of them and a heat storage tank with 2000 L storage capacity. An air-to-water heat pump with a nominal heating capacity of 23 kWth is connected to the three storage tanks as a backup unit. The aforementioned sizing was the result of the dimensioning procedure, which will be briefly described below.
If we designate:
  • Tsol the supplied water temperature from the solar collectors;
  • Tst the stored water temperature in the heat storage tanks;
  • Thw the required hot water temperature.
Then, with regard to Figure 13, the operation algorithm of the solar–combi system can be analysed in the following simple three steps:
  • If Tsol > Tst, the circulator of the solar collectors’ primary closed loop turns on, and heat is transferred from the solar collectors to the heat storage tanks;
  • If Tsol ≤ Tst, then the heat produced by the solar collectors cannot be transferred to the heat storage tanks, and the circulator of the solar collectors’ primary closed loop remains off;
  • If Tst < Thw, then the backup unit (the heat pump) is turned on.
The installation inclination of the solar collectors was selected at 40° with regard to the horizontal plane, following the results of an iterative calculation process of the total incident annual cumulative solar radiation on a flat plane, versus its inclination, at the specific geographical location and for southern orientation. These results are presented in Table 8.
As seen in Table 8, the annual cumulative incident solar radiation is maximized for 30° inclination. Yet, the cumulative incident solar radiation, specifically during the winter period (from 15/10 to 15/3), is maximised for 50° inclination. In order to approach this optimum operation during the winter months, when the heat demand is sensibly higher, without considerably diverging from the maximum annual incident solar radiation received for 30°, the average inclination of 40° was eventually selected.
The annual fluctuation of the incident solar irradiance on the solar collectors for 40° inclination is presented in Figure 20.
The sizing of the proposed solar–combi system was accomplished through the computational simulation of the system’s annual operation, following the aforementioned simple operation algorithm. Annual time series of average hourly values were employed. For this task, the following data were used:
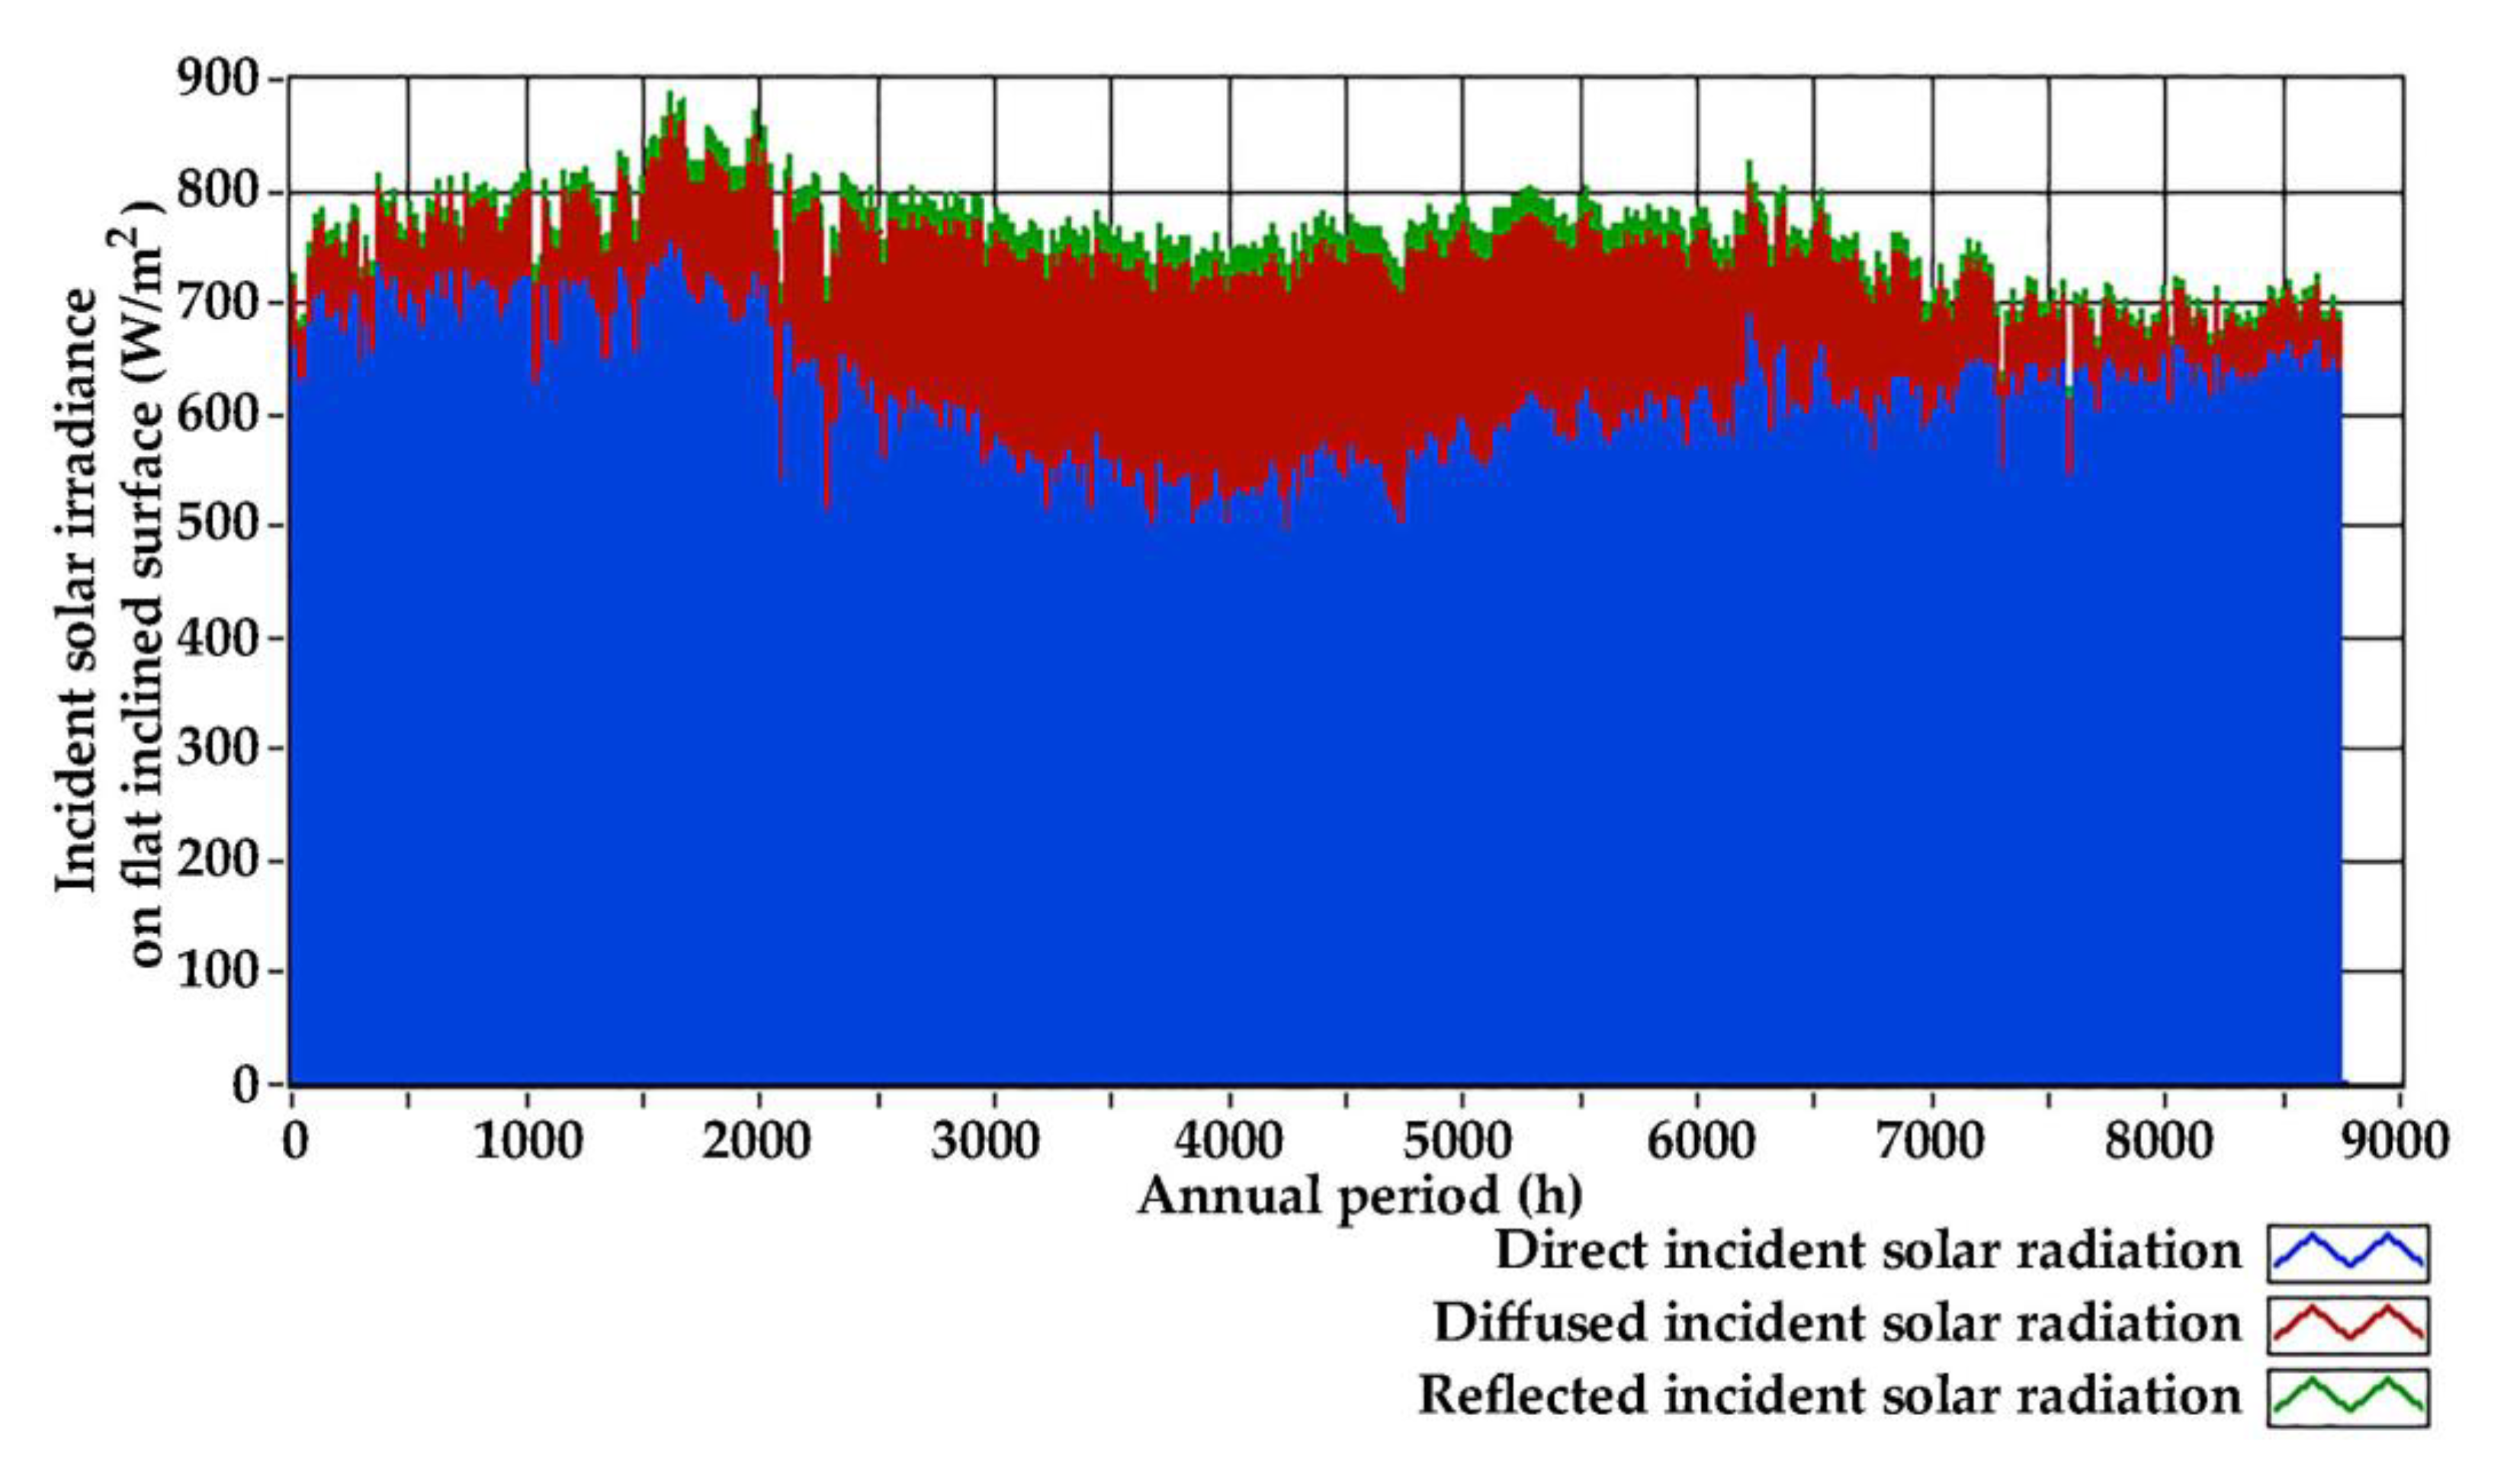
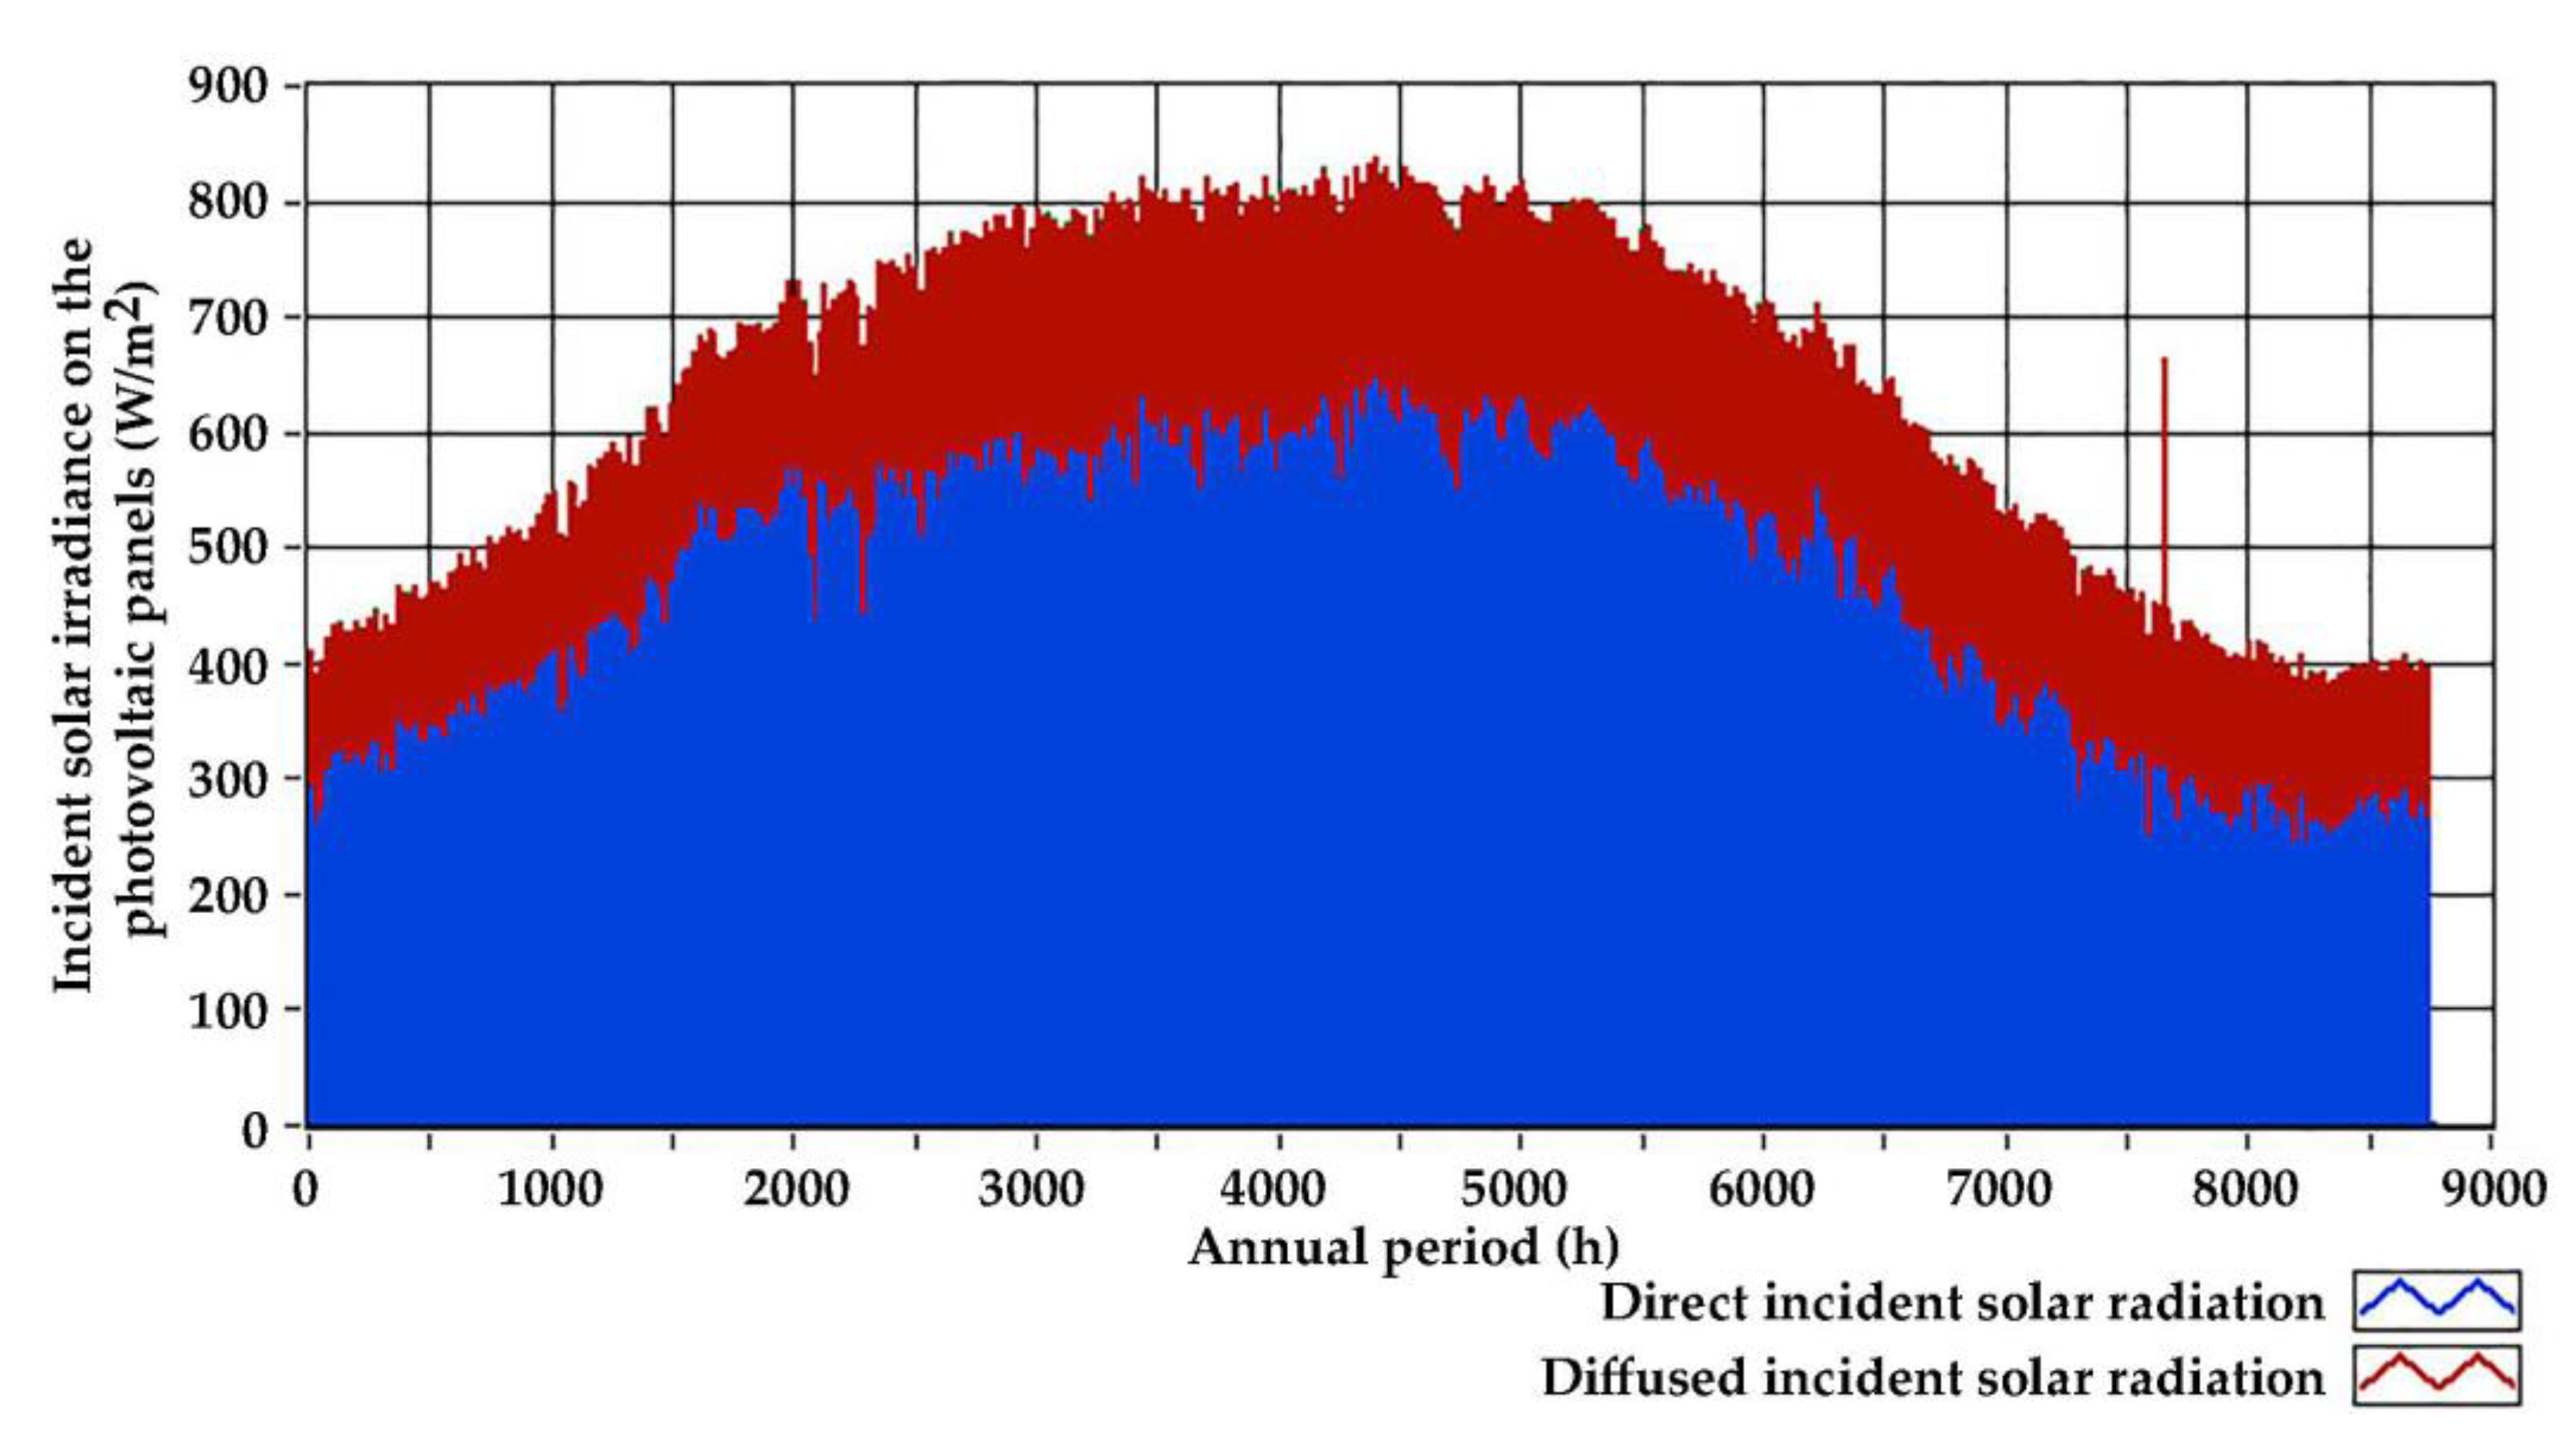
  • The annual times series of the total incident solar irradiance on the 40° inclined surface (Figure 20);
  • The annual time series of the heat demand for domestic hot water production (Figure 9, Section 5.2.3);
  • The annual time series of the ambient temperature (Figure 3, Section 4);
  • The annual time series of the wind velocity (Figure 5, Section 4);
  • The water-specific heat capacity (4.187 kJ/kg∙K);
  • The domestic hot water minimum required temperature Thw, set equal to:
    -
    From the 1st of January to the 30th of April: 40 °C
    -
    From the 1st of May to the 30th of June: 35 °C
    -
    From the 1st of July to the 15th of September: 30 °C
    -
    From the 16th of September to the 15th of November: 35 °C
    -
    From the 16th of November to the 31st of December: 40 °C;
  • typical geometrical and thermo-physical features of a collective plate, flat solar collector’s model [69];
  • typical geometrical and thermo-physical features of a heat storage tank with 2000 L storage capacity (2.4 m height, 1.3 m diameter, 10 mm insulation thickness and total U-factor 0.22 W/m2∙K).
The computational simulation of the system’s annual operation was iteratively executed for different numbers of solar collectors and heat storage tanks. The optimization criterion was the minimization of the heat-production-specific cost from the solar–combi system, which was approached by Equation (22):
c th = N sc · C sc + N ST · C ST E SC · T LP ,
where:
  • ΝSC: the solar collectors’ total number in the system;
  • CSC: the procurement price of one solar collector adopted is equal to 450 EUR;
  • Ν: the heat storage tanks’ number in the system, with storage capacity of 2000 L;
  • C: the procurement price of one 2000 L heat storage tank, adopted equal to 6000 EUR;
  • ESC: the annual heat demand coverage for domestic hot water production from the solar–combi system;
  • ΤLP: the solar–combi system’s life period adopted equal to 15 years.
Additionally, the annual coverage of at least 50% of the final heat demand by the solar collectors was also set as a dimensioning requirement.
It is conceivable that the above presented specific cost is not accurate since it does not contain other components of the solar–combi system set-up cost, such as the required hydraulic network or any automation devices, as well as any component of the annual operation cost (for example the maintenance of the heat pump or the glazing cleaning of the solar collectors). Yet, the accurate calculation of this magnitude is not crucial because it is introduced only as a comparative evaluation criterion for the dimensioning of the solar–combi system.
The mathematical background for the calculation of the thermal power production from the solar collectors and the heat storage in the tanks is described in detail in [69,70].
By applying the computational simulation process of the solar–combi system’s annual operation iteratively, the results presented in Table 9 are collected. It is also reminded that, as calculated in Section 5.2.3, the annual heat demand for domestic hot water production is 65,253.7 kWh.
As seen in Table 9, the minimum heat-production-specific cost with annual heat demand percentage coverage from the solar collectors higher than 50% is given by 36 collectors and three heat storage tanks of 2000 L each.
The annual fluctuation of the thermal power production from the solar collectors and the heat pump for the domestic hot water production in the municipal sports centre is presented in Figure 21. In Figure 22, the annual fluctuation of the supplied hot water temperature from the solar collectors’ primary loop to the heat storage tanks is also presented.
As calculated from the computational simulation of the system’s annual operation, the solar collectors’ total average efficiency varies during the annual period from 0.15% to 79.20%.
Energy saving on domestic hot water production is achieved in the municipal sports centre with:
  • the production of 50.3% of the annual hot water from solar collectors;
  • the elimination of diesel oil consumption and its replacement with the heat pump operation.
Having calculated the annual thermal power production from the heat pump (Figure 21), the corresponding electrical power consumption can be easily calculated by using the previously introduced COP curve versus the ambient temperature (Figure 19a, Section 5.4.3) and with Equation (16). The results are summarized in Table 10.

5.4.5. Lighting

All existing indoor and outdoor fluorescent lamps, halogen and mercury floodlights and luminaires are proposed to be replaced with new LED technology. The new swimming pool’s indoor space will be equipped with 40 LED floodlights of 147 W each. The existing 32 mercury floodlights of the football court will also be replaced with 24 LED floodlights, distributed in six pylons with four floodlights each. Photometric calculations were executed for all indoor and outdoor spaces with DIALux evo 11 [71] so as to ensure that the required illuminance, according to the relevant standards, is achieved. Indicatively, the photometric graphs are presented for the swimming pool’s newly configured indoor space and the outdoor football court in Figure 23 and Figure 24, respectively.
The installed electrical power drop for all lighting equipment in the facility and the achieved annual electricity saving are summarized in Table 11.
The achieved corresponding primary energy annual saving is calculated at 187.890 kWh.

5.4.6. Swimming Pool Pumps’ Station

The operation of the pump station for the water circulator in the swimming pools imposes the major electricity consumption in the swimming pools’ centre. Hence it is essential to apply any possible measures for the improvement of the pumps and the hydraulic network operation efficiency. To this end, the existing steel hydraulic network is fully replaced with a new network with PVC pipelines, which exhibit a lower flow losses factor (in the range of <0.025 [72]). Additionally, all the secondary auxiliary equipment (filters, heat exchangers, smaller circulators) is replaced. With the redesign of the hydraulic network, the overall head drops from 27 m to 20.2 m. The existing three pumps are replaced with four smaller units for higher flexibility and higher efficiency (from 78% to 80.4%).
With all the proposed measures, the achieved electricity and primary energy saving are summarized in Table 12.

5.4.7. Remaining Electricity Consumption

The remaining electricity consumption in the municipal sports centre, after the implementation of the proposed passive and active energy performance upgrade measures, is analysed in Table 13, following the results of the above-presented calculations. The electricity consumption from the circulators, the mechanical ventilation fans of the swimming pool’s new indoor space and the hydronic unit’s fans of the indoor space conditioning system are calculated by considering the nominal electrical input power of the involved units and the annual operation time period of the system, as imposed by the results of the computational simulation of the system’s annual operation. As seen in Table 13, the major consumption in the proposed operation comes from the swimming pool’s pump station instead of their heating.

5.4.8. Photovoltaic Station

The remaining electricity consumption is proposed to be compensated on an annual basis by a photovoltaic station, which will be installed on the roof of the swimming pools’ new enclosure. The photovoltaic panels will be installed following the inclination (3.5°) and the orientation (western) of the new enclosure’s roof. Given these facts and the available solar irradiance at the installation location, the annual fluctuation of the incident solar irradiance on the photovoltaic panels is depicted in Figure 25.
Following the essential calculation process for the electricity produced by a photovoltaic plant [73], the available required photovoltaic nominal power is calculated at 342 kW. The photovoltaic plant can be configured with 912 photovoltaic panels of 375 W nominal power each and three inverters of 110 kW each. The total captured area on the enclosure’s roof is 2102 m2. The total annual electricity production is calculated at 439,989 kWh, giving a total final annual capacity factor of 14.7%. The corresponding primary energy is calculated at 1,275,969 kWh. A 3D representation of the photovoltaic plant on the new enclosure’s roof is given in Figure 26.

5.5. Summary of Energy Saving Results and Key Performance Indicators

Table 14 summarizes the results regarding the primary energy consumption in the current and the expected operation state of the municipal sports centre. As seen in this table, the remaining primary energy consumption is negative due to the electricity production annual surplus from the photovoltaic plant. This imposes annual primary energy saving equal to 100.9%, which practically means that the municipal sports centre is upgraded to a zero-energy facility.
Table 15 gives the total diesel oil and electricity annual saving. The diesel oil consumption is totally eliminated, while, despite the full transfer of all the final energy uses to electricity, a 9.3% electricity consumption annual drop is also achieved.
The project’s total budget is analysed in Table 16 in a comprehensive approach, categorized per different proposed types of energy performance upgrade measures.
The annual economic benefit from the implementation of the proposed energy performance upgrade is calculated by accounting for the annual electricity and diesel oil saving and by introducing indicative procurement prices. The results are analysed in Table 17. As clearly stated in Table 17, the existing operation refers to the theoretical approach of full annual operation and adequate coverage of all energy needs of the facility under the existing conditions. On the other hand, the new, expected operation refers to the calculated operation when the proposed energy performance upgrade measures will be implemented. It is clarified that none of the proposed measures has been implemented so far. It is also clarified that with the annual electricity consumption compensation achieved by the photovoltaic station operation, the electricity procurement cost is approximately 85% reduced. A remaining 15% procurement cost with regard to the initial amount, which corresponds to the electrical grid use rates, taxes etc., cannot be avoided. As seen in this table, the energy source’s annual procurement cost is impressively 96.8% reduced.
  • Based on the aforementioned figures, the following typical KPIs can be calculated:
  • Payback period: It is calculated equal to 14.0 years by dividing the project’s total budget over the annually achieved economic benefit.
  • Annual primary energy saving: As documented in Table 14, the annual primary energy achieved saving is 5,026,869 kWh, namely 100.9% with regard to the existing annual primary energy consumption.
  • Annual Renewable Energy Sources (RES) penetration: The total contribution of the involved RES technologies to the annual energy demand coverage comes from:
    -
    The production of 439,989 kWh of electricity from the photovoltaic plant, which corresponds to 1,275,969 kWh of primary energy
    -
    The production of 32,831 kWh of heat from the solar collectors, which corresponds to 59,693 kWh of primary solar radiation, by assuming a typical average efficiency of 55% for the solar collectors.
The total primary energy penetration from the RES technologies is calculated at 1,335,662 kWh. The remaining electricity consumption in the facility is 424,240 kWh which corresponds to 1,230,296 kWh of primary energy. By dividing these two primary energy amounts, the RES annual penetration in the facility is calculated at 108.6% with regard to the remaining electricity consumption (before its compensation from the photovoltaic plant).
  • CO2 emissions saving: The annual CO2 emissions saving is due to the elimination of diesel oil consumption and the electricity saving and demand compensation with the photovoltaic plant. According to the Greek Directive on the Buildings’ Energy Performance [65], the following factors are introduced as the specific CO2 emissions:
    -
    A total of 0.989 kg CO2/kWh of electricity
    -
    A total of 0.264 kg CO2/kWh of primary energy corresponds to diesel oil consumption.
Given the aforementioned factors, the CO2 emissions annual saving are calculated as shown in Table 18.

6. Discussion

The necessity for the energy performance upgrade of the municipal sports centre was something widely known among the local stakeholders of the town of Arkalochori. This can be documented by:
  • The limited operation of the swimming pool’s centre only from May to September, precisely due to the extremely high heating cost of the water in the pools;
  • The inadequate indoor space conditioning of the existing building, practically only with four low-efficiency, air-to-air heat pumps;
  • The consumption of diesel oil for domestic hot water production during summer, especially in a geographical location with abundant solar potential;
  • The use of ineffective lighting equipment.
Despite these facts, the local Municipality of Minoa Pediadas had not taken the initiative to proceed to the beginning of the required process for the implementation of the necessary energy performance upgrade, which, sensibly, should be initiated with the accomplishment of the final application studies.
Given the aforementioned facts, the work presented in this article was ignited by the European Commission’s Horizon 2020 project entitled “New Energy Solutions Optimized for Islands” (NESOI). The NESOI Consortium opened a call in 2020 for the funding of the implementation of studies for energy transition projects. The proposal was submitted by the Minoan Energy Community (currently the largest energy community in Greece, founded in 2019 in Arkalochori), following a relevant approval by the local Municipality, which is also an official member of the Community. The proposal, entitled “Sustainable Actions for Viable Energy” (SAVE), was among the first 30 approved projects by the NESOI Consortium out of the 120 totally submitted proposals.
The outcomes of the SAVE project can constitute a pilot example for similar initiatives worldwide and for several different reasons. Firstly, it shows how international or national funding calls can be exploited to treat important issues, cover real, existing needs and develop lighthouse energy transition projects. It also constitutes an excellent example of collaboration between local authorities, such as municipalities, with community-based, private schemes, such as energy communities or cooperatives. Additionally, it highlights how energy transition projects can also be significant social contributions to local communities, such as in the specific swimming pool’s centre, which, through its upgrade to an indoor sports facility, can be easily operated throughout the whole annual period, with minimized operation cost, instead of only four months per year. Finally, through the proposed technical solutions, the importance of energy saving towards the rational and effective energy transition is also highlighted.
Focusing particularly on the technical and economic outcomes of the presented project, we should, first of all, sensibly stand at the importance of the swimming pool’s housing and the floating insulating cover use, regarding the minimisation of their heating cost. These two proposed passive measures lead to an almost 96% drop in the swimming pool’s heating load and make the annual operation of the facility affordable. High energy saving percentages are achieved for all final energy uses, except the pumps’ station for the swimming pool’s water circulation. In this case, although the whole water circulation infrastructure, including the pipeline routes and material, the pumps, the automation etc., are totally upgraded, the achieved energy saving can be only 7.2%. This, practically, shows that actually there is not a high margin for energy saving in this particular pumping-hydraulic infrastructure. However, apart from this, for all other final energy uses, annual energy saving percentages higher than 45% can be achieved, while specifically for lighting and domestic hot water production, the achieved annual energy saving is higher than 70%. The feasibility of the proposed measures is also documented by the quite satisfying payback period (only 14 years), calculated on the basis of the achieved drop in the energy source’s annual procurement cost.
It should also be underlined that the work was accomplished on the assumption that the municipal sports centre, in its current state, operates for the full annual period, covering fully all the imposed final energy needs for the swimming pool’s heating, the indoor space conditioning, the domestic hot water production, the lighting etc. This assumption was necessary in order to obtain a common reference level for the comparison of the existing and the proposed operation.
Finally, the proposed enclosure’s architecture was designed accounting both its aesthetics and smooth integration in the existing environment and its energy performance by introducing as many bioclimatic architecture elements as possible, such as:
  • The large transparent vertical surfaces open during summer to enable natural ventilation and avoid overheating, while natural lighting is maximized for all seasons;
  • The opaque, insulated roof is to avoid direct lighting and indoor space overheating;
  • The placement of the enclosure’s long sides with eastern and western orientations, shaded by horizontal overhangs integrated with the bearing structure, aiming to maximise diffused lighting and avoid overheating;
  • The placement of the southern wall of the new enclosure close to the long side of the training pool maximises the solar heat gain for the specific pool, where the required water temperature is 30 °C.
The SAVE project was awarded by the European Commission with the public award of the “Islands Gamechanger” competition, organized by the NESOI Consortium and the Secretariat of the “Clean Energy for EU Islands” initiative.
Within the SAVE project, the energy performance upgrade study of another municipal sports facility was also implemented, the indoor sports hall, also in Arkalochori. This work is presented in part B of this article, following a similar approach as the one presented in this article: passive measures for insulation and natural lighting, including the installation of solar tubes on the sports hall’s roof, active measures for indoor space conditioning, domestic hot water production and lighting and a photovoltaic plant for electricity production, all them leading to another zero-energy facility.

7. Conclusions

This article presented the energy performance upgrade of the municipal sports centre of Arkalochori, Crete, Greece. The work was implemented in the frame of the “Sustainable Actions for Viable Energy” (SAVE) project, funded by the European Commission’s Horizon 2020 project entitled “New Energy Solutions Optimized for Islands” (NESOI).
For indoor space conditioning, independent air-to-water heat pumps, PPR pipelines and hydronic terminal units were proposed. The swimming pool’s heating will be mainly undertaken by one more exclusive air-to-water heat pump, with the support of a biomass burner, for the coldest days of the year. A solar–combi system, consisting of solar collectors, heat storage tanks and a fourth air-to-water, exclusive heat pump, is proposed for domestic hot water production. All existing ineffective indoor and outdoor lamps, luminaires and floodlights will be replaced with LED technology equipment. Finally, the pumping and hydraulic infrastructure for the swimming pool’s water circulation will be fully upgraded.
All proposed passive and active energy-saving measures proved to be highly technical and economically feasible. This is documented by the high-achieved energy-saving percentages and the low payback period. Specifically, energy saving for indoor space conditioning was higher than 45%, while for lighting and domestic hot water production, it was higher than 70%. The quite impressive energy saving percentage of 88% was achieved for the swimming pool’s heating, mainly due to the conversion of the current outdoor facility to an indoor one and the use of a floating, insulating cover for the pools’ surfaces whenever they are not in use.
The project, initiated by a community-based scheme, constitutes a pilot lighthouse global example, indicating excellent collaboration between local authorities and community-based, private initiatives, exploitation of energy transition for local social and economic development, an exemplary application of energy-saving passive and active measures and holistic approach of energy performance upgrade of municipal sports facilities. For all these reasons, the SAVE project was awarded by the European Commission with the public award of the “Islands Gamechanger” competition, organized by the NESOI Consortium and the Secretariat of the “Clean Energy for EU Islands” initiative.

Author Contributions

Conceptualization, D.A.K.; methodology, D.A.K., E.G. and M.K.; software, D.A.K. and G.Z.; validation, D.A.K. and A.K.; formal analysis, D.A.K. and A.K.; investigation, D.A.K., N.P., E.G., E.D. and Y.Y.; resources, G.K.; data curation, G.M.S.; writing—original draft preparation, D.A.K. and N.P.; writing—review and editing, D.A.K. and N.P.; visualization, D.A.K. and N.P.; supervision, D.A.K.; project administration, D.A.K. and E.D.; funding acquisition, D.A.K. All authors have read and agreed to the published version of the manuscript.

Funding

This research was funded by the European Commission’s Horizon 2020 project entitled “New Energy Solutions Optimized for Islands” (NESOI), under the grant number EL-056-2021-006 and the sub-project entitled “Sustainable Actions for Viable Energy” (SAVE).

Data Availability Statement

Data sharing not applicable. No new data were created or analyzed in this study.

Acknowledgments

The authors and the working team of this project are grateful to the NESOI Consortium for the approval of the SAVE proposal and for their overall contribution and support for the implementation of the project.

Conflicts of Interest

The authors declare no conflict of interest.

Abbreviations

ANNArtificial Neural Network
ASHRAEAmerican Society of Heating, Refrigerating and Air-Conditioning Engineers
CHPCombined Heat and Power
COPCoefficient Of Performance
EEREnergy Efficiency Ratio
EUEuropean Union
GHEGeothermal Heat Exchangers
GHGGreenhouse Gas
GHPGeothermal Heat Pumps
IEAInternational Energy Agency
KPIsKey Performance Indicators
PPRpolypropylene
RHCRadiant Heating and Cooling
RESRenewable Energy Sources
RUERational Use of Energy
SWHSolar Water Heating
TFMTransfer Function Method
W-SAHPWater-Solar-Assisted Heat Pump
Nomenclature
Q ˙ tot the total heat losses from the swimming pools’ upper surfaces (in kW)
Q ˙ conv - rad the heat losses from the swimming pools’ upper surfaces with convection and radiation (in kW)
Q ˙ ev the heat losses from the swimming pools’ upper surfaces with evaporation (in kW)
Q ˙ rep the additional heating load due to the replacement of the evaporated water from the water supply network (in kW)
Q ˙ sg the solar heat gain due to the solar radiation incidence (in kW)
Tambthe ambient temperature
Aspthe swimming pools’ total upper surface (in m2)
Uthe thermal heat transfer factor (the so-called U-factor) (in W/m2∙K)
Twthe required water temperature in the swimming pools (Τw = 26 °C for the Olympic size pool and Τw = 30 °C for the training swimming pool)
hcthe heat convection factor for ambient air horizontal flow with average velocity of 5 m/s (10 W/m2∙Κ)
hrwthe heat radiation factor
εwthe emissivity of water
σthe Stefan–Boltzman constant
heevaporation transfer factor
ps,wthe water vapour saturation pressure at the water temperature Tw in the swimming pools (in kPa)
p the partial vapour pressure away from the swimming pools, at ambient temperature (in kPa)
u0.3the wind velocity in m/s at 30 cm height from the swimming pools’ upper surfaces
uz1the wind velocity at height z1 above ground
uz2the wind velocity at height z2 above ground
nthe exponent n of the atmospheric wind velocity exponential law
z0the ground roughness height
p s , the saturation vapour pressure at ambient temperature Τamb
φthe relative humidity
m ˙ rep the water mass flow rate for the replacement of the evaporated water (in kg/s)
cpthe water specific heat capacity (4.187 kJ/kg∙K)
Tswthe water temperature in the water supply network
hfgthe specific latent heat of water (2441.7 kJ/kg at 25 °C)
asolar radiation absorbance factor from the swimming pools, adopted equal to 0.85 for light-colour tanks
Gthe incident solar radiation on the horizontal plane (in W/m2)
Aspthe swimming pools’ total upper area (1000 m2 for the Olympic-size pool and 125 m2 for the training pool)
djthe thickness of the structural material j of the opaque constructive element
kjthe thermal conductivity factor of the structural material j of the opaque constructive element
hithe heat transfer factor from the inner space and towards the outer space ho (or conversely in summer)
hothe heat transfer factor towards the outer space (or conversely in summer)
ACHair changes per hour
Tinthe indoor space temperature
m ˙ h the domestic hot water consumed mass flow rate
Thwthe hot water required temperature
Pelthe electrical power consumption in the heat pump
Qhthe indoor space heating load
hwthe thermal convection factor of still water, equal to 50 W/(m2∙K)
kcthe thermal conduction factor of the insulating floating cover, equal to 0.025 W/m∙K
dcthe insulating floating cover thickness, equal to 0.02 m
hfcthe heat transfer factor from the insulating floating cover to the indoor ambient air
hcthe thermal convection factor for ambient indoor air horizontal flow, adopted equal to hc = 2.5 W/m2∙Κ
hrcthe thermal radiation factor from the insulating floating cover to the ambient indoor air
εcthe emissivity of the floating insulating cover’s material, equal to 0.550
Tcthe floating cover’s temperature
Qcthe indoor space cooling load
Tsolthe supplied water temperature from the solar collectors
Tstthe stored water temperature in the heat storage tanks
Thwthe required hot water temperature
ΝSCthe solar collectors’ total number in the system
CSCthe procurement price of one solar collector, adopted equal to 450 EUR
Νthe heat storage tanks’ number in the system, with storage capacity of 2000 L
Cthe procurement price of one 2000 L heat storage tank, adopted equal to 6000 EUR
ESCthe annual heat demand coverage for domestic hot water production from the solar–combi system
ΤLPthe solar–combi system’s life period, adopted equal to 15 years
cththe heat production specific cost from the solar–combi system

References

  1. Katsaprakakis, D.A.; Michopoulos, A.; Skoulou, V.; Dakanali, E.; Maragkaki, A.; Pappa, S.; Antonakakis, I.; Christakis, D.; Condaxakis, C. A Multidisciplinary Approach for an Effective and Rational Energy Transition in Crete Island, Greece. Energies 2022, 15, 3010. [Google Scholar] [CrossRef]
  2. Directive (EU) 2018/844 of the European Parliament and of the Council of 30 May 2018 Amending Directive 2010/31/EU on the Energy Performance of Buildings and Directive 2012/27/EU on Energy Efficiency. Available online: https://eur-lex.europa.eu/legal-content/EN/TXT/?uri=uriserv%3AOJ.L_.2018.156.01.0075.01.ENG (accessed on 14 February 2023).
  3. Directive 2012/27/EU of the European Parliament and of the Council of 25 October 2012 on Energy Efficiency, Amending Directives 2009/125/EC and 2010/30/EU and Repealing Directives 2004/8/EC and 2006/32/EC Text with EEA Relevance. Available online: https://eur-lex.europa.eu/legal-content/EN/TXT/?uri=CELEX%3A32012L0027 (accessed on 14 February 2023).
  4. Law 4122/2013. Official Governmental Gazette 42A’/19-2-2013. Energy Performance of Buildings—Harmonization with the Directive 2010/31/EU of the European Parliament and the Council and Other Clauses. Available online: http://www.kenak.gr/files/NOMIKO_PLAISIO/NOMOS_4122_2013_FEK_42_19.2.2013.pdf (accessed on 14 February 2023).
  5. Katsaprakakis, D.A.; Zidianakis, G.; Yiannakoudakis, Y.; Manioudakis, E.; Dakanali, I.; Kanouras, S. Working on Buildings’ Energy Performance Upgrade in Mediterranean Climate. Energies 2020, 13, 2159. [Google Scholar] [CrossRef]
  6. Katsaprakakis, D.A.; Georgila, K.; Zidianakis, G.; Michopoulos, A.; Psarras, N.; Christakis, D.G.; Condaxakis, C.; Kanouras, S. Energy upgrading of buildings. A holistic approach for the Natural History Museum of Crete, Greece. Renew. Energy 2017, 114, 1306–1332. [Google Scholar] [CrossRef]
  7. IEA. Buildings, IEA. Paris, License: CC BY 4.0. 2022. 2022. Available online: https://www.iea.org/reports/buildings (accessed on 14 February 2023).
  8. Vakiloroaya, V.; Samali, B.; Fakhar, A.; Pishghadam, K. A Review of Different Strategies for HVAC Energy Saving. Energy Convers. Manag. 2014, 77, 738–754. [Google Scholar] [CrossRef]
  9. Baek, S.G. Plan for the Sustainability of Public Buildings through the Energy Efficiency Certification System: Case Study of Public Sports Facilities, Korea. Buildings 2021, 11, 589. [Google Scholar] [CrossRef]
  10. Li, X.; Shen, C.; Yu, C.W.F. Building Energy Efficiency: Passive Technology or Active Technology? Indoor Built Environ. 2017, 26, 729–732. [Google Scholar] [CrossRef]
  11. Balaras, C.A.; Grossman, G.; Henning, H.M.; Infante Ferreira, C.A.; Podesser, E.; Wang, L.; Wiemken, E. Solar Air Conditioning in Europe—An Overview. Renew. Sustain. Energy Rev. 2007, 11, 299–314. [Google Scholar] [CrossRef]
  12. Pérez-Lombard, L.; Ortiz, J.; Pout, C. A Review on Buildings Energy Consumption Information. Energy Build. 2008, 40, 394–398. [Google Scholar] [CrossRef]
  13. Eurostat. Energy Use in Households in 2020. Available online: https://ec.europa.eu/eurostat/web/products-eurostat-news/-/ddn-20220617-1 (accessed on 25 February 2023).
  14. Arsalis, A. A Comprehensive Review of Fuel Cell-Based Micro-Combined-Heat-and-Power Systems. Renew. Sustain. Energy Rev. 2019, 105, 391–414. [Google Scholar] [CrossRef]
  15. Weerasinghe, A.S.; Ramachandra, T. Economic Sustainability of Green Buildings: A Comparative Analysis of Green vs. Non-Green. Built Environ. Proj. Asset. Manag. 2018, 8, 528–543. [Google Scholar] [CrossRef]
  16. Clark, D. What Colour Is Your Building? Measuring and Reducing the Energy and Carbon Footprint of Buildings; RIBA Publishing: London, UK, 2019. [Google Scholar]
  17. Yezioro, A.; Capeluto, I.G. Energy Rating of Buildings to Promote Energy-Conscious Design in Israel. Buildings 2021, 11, 59. [Google Scholar] [CrossRef]
  18. Khan, M.A.; Wang, C.C.; Lee, C.L. A Framework for Developing Green Building Rating Tools Based on Pakistan’s Local Context. Buildings 2021, 11, 202. [Google Scholar] [CrossRef]
  19. Zero Energy Building Certification System. Available online: https://zeb.energy.or.kr/BC/BC00/BC00_01_001.do (accessed on 21 February 2023).
  20. Teni, M.; Čulo, K.; Krstić, H. Renovation of Public Buildings towards NZEB: A Case Study of a Nursing Home. Buildings 2019, 9, 153. [Google Scholar] [CrossRef]
  21. Garcia, J.F.; Kranzl, L. Ambition Levels of Nearly Zero Energy Buildings (NZEB) Definitions: An Approach for Cross-Country Comparison. Buildings 2018, 8, 143. [Google Scholar] [CrossRef]
  22. Topriska, E.; Kolokotroni, M.; Melandri, D.; McGuiness, S.; Ceclan, A.; Christoforidis, G.C.; Fazio, V.; Hadjipanayi, M.; Hendrick, P.; Kacarska, M.; et al. The Social, Educational, and Market Scenario for NZEB in Europe. Buildings 2018, 8, 51. [Google Scholar] [CrossRef]
  23. Liu, J.; Kim, S.C.; Shin, K.Y. Feasibility Study and Economic Analysis of a Fuel-Cell-Based CHP System for a Comprehensive Sports Center with an Indoor Swimming Pool. Energies 2021, 14, 6625. [Google Scholar] [CrossRef]
  24. Kampel, W.; Carlucci, S.; Aas, B.; Bruland, A. A Proposal of Energy Performance Indicators for a Reliable Benchmark of Swimming Facilities. Energy Build. 2016, 129, 186–198. [Google Scholar] [CrossRef]
  25. TM46: Energy Benchmarks|CIBSE. Available online: https://www.cibse.org/knowledge-research/knowledge-portal/tm46-energy-benchmarks (accessed on 19 February 2023).
  26. ECG 78 Energy Use in Sports and Recreation Buildings, Building Research Energy Conservation Support Unit—Publication Index|NBS. Available online: https://www.thenbs.com/PublicationIndex/documents/details?Pub=BRECSU&DocID=285163 (accessed on 19 February 2023).
  27. Trianti-Stourna, E.; Spyropoulou, K.; Theofylaktos, C.; Droutsa, K.; Balaras, C.A.; Santamouris, M.; Asimakopoulos, D.N.; Lazaropoulou, G.; Papanikolaou, N. Energy Conservation Strategies for Sports Centers: Part B. Swimming Pools. Energy Build. 1998, 27, 123–135. [Google Scholar] [CrossRef]
  28. Sadineni, S.B.; Madala, S.; Boehm, R.F. Passive Building Energy Savings: A Review of Building Envelope Components. Renew. Sustain. Energy Rev. 2011, 15, 3617–3631. [Google Scholar] [CrossRef]
  29. Stavrakakis, G.M.; Katsaprakakis, D.A.; Damasiotis, M. Basic principles, most common computational tools, and capabilities for building energy and urban microclimate simulations. Energies 2021, 25, 6707. [Google Scholar] [CrossRef]
  30. Bai, G.; Gong, G.; Yu, C.W.; Zhen, O. A Combined, Large, Multi-Faceted Bulbous Façade Glazed Curtain with Open Atrium as a Natural Ventilation Solution for an Energy Efficient Sustainable Office Building in Southern China. Indoor Built Environ. 2015, 24, 813–832. [Google Scholar] [CrossRef]
  31. Stavrakakis, G.M.; Stamou, A.I.; Markatos, N.C. Evaluation of thermal comfort in indoor environments using Computational Fluid Dynamics (CFD). In Indoor Work and Living Environments: Health, Safety and Performance; Nova Science: New York, NY, USA, 2009; pp. 97–166. [Google Scholar]
  32. Chua, K.J.; Chou, S.K.; Yang, W.M. Advances in Heat Pump Systems: A Review. Appl. Energy 2010, 87, 3611–3624. [Google Scholar] [CrossRef]
  33. Fadzlin, W.A.; Hasanuzzaman, M.; Rahim, N.A.; Amin, N.; Said, Z. Global Challenges of Current Building-Integrated Solar Water Heating Technologies and Its Prospects: A Comprehensive Review. Energies 2022, 15, 5125. [Google Scholar] [CrossRef]
  34. Weiss, W.; Spörk-Dür, M. Global Market Development and Trends in 2019 Detailed Market Data 2018; IEA: Gleisdorf, Austria, 2020. [Google Scholar]
  35. Calise, F.; Figaj, R.D.; Vanoli, L. Energy and Economic Analysis of Energy Savings Measures in a Swimming Pool Centre by Means of Dynamic Simulations. Energies 2018, 11, 2182. [Google Scholar] [CrossRef]
  36. Katsaprakakis, D.A. Comparison of Swimming Pools Alternative Passive and Active Heating Systems Based on Renewable Energy Sources in Southern Europe. Energy 2015, 81, 738–753. [Google Scholar] [CrossRef]
  37. Katsaprakakis, D.A.; Dakanali, I.; Zidianakis, G.; Yiannakoudakis, Y.; Psarras, N.; Kanouras, S. Potential on Energy Performance Upgrade of National Stadiums: A Case Study for the Pancretan Stadium, Crete, Greece. Appl. Sci. 2019, 9, 1544. [Google Scholar] [CrossRef]
  38. Tagliafico, L.A.; Scarpa, F.; Tagliafico, G.; Valsuani, F. An Approach to Energy Saving Assessment of Solar Assisted Heat Pumps for Swimming Pool Water Heating. Energy Build. 2012, 55, 833–840. [Google Scholar] [CrossRef]
  39. Chow, T.T.; Bai, Y.; Fong, K.F.; Lin, Z. Analysis of a Solar Assisted Heat Pump System for Indoor Swimming Pool Water and Space Heating. Appl. Energy 2012, 100, 309–317. [Google Scholar] [CrossRef]
  40. Yuan, X.; Lindroos, L.; Jokisalo, J.; Kosonen, R.; Pan, Y.; Jin, H. Demand response potential of district heating in a swimming hall in Finland. Energy Build. 2021, 248, 111149. [Google Scholar] [CrossRef]
  41. Katsaprakakis, D.A.; Moschovos, T.; Michopoulos, A.; Kargas, I.D.; Flabouri, O.; Zidianakis, G. Feasibility for the introduction of decentralised combined heat and power plants in agricultural processes. A case study for the heating of algae cultivation ponds. Sustain. Energy Technol. Assess. 2022, 53, 102757. [Google Scholar] [CrossRef]
  42. Kuyumcu, M.E.; Tutumlu, H.; Yumrutaş, R. Performance of a Swimming Pool Heating System by Utilizing Waste Energy Rejected from an Ice Rink with an Energy Storage Tank. Energy Convers. Manag. 2016, 121, 349–357. [Google Scholar] [CrossRef]
  43. Liebersbach, J.; Żabnieńska-Góra, A.; Polarczyk, I.; Sayegh, M.A. Feasibility of Grey Water Heat Recovery in Indoor Swimming Pools. Energies 2021, 14, 4221. [Google Scholar] [CrossRef]
  44. Zhao, J.; Sproul, A. RP1014u1: Energy Efficient Swimming Pools—Engagement and Utilization Final Report. UNSW/RCC/SBPS Residential Swimming Pool Efficiency Program. Low Carbon Living CRC 2019. Available online: https://www.lowcarbonlivingcrc.com.au/sites/all/files/publications_file_attachments/lcl_crc_rp1014u_final_report_final.pdf (accessed on 14 February 2023).
  45. Cunio, L.; Sproul, A. Performance Characterisation and Energy Savings of Uncovered Swimming Pool Solar Collectors under Reduced Flow Rate Conditions. Sol. Energy 2012, 86, 1511–1517. [Google Scholar] [CrossRef]
  46. Balaras, C.; Gaglia, A.G.; Georgopoulou, E.; Mirasgedis, S.; Sarafidis, Y.; Lalas, D. European residential buildings and empirical assessment of the Hellenic building stock, energy consumption, emissions and potential energy savings. Build. Environ. 2007, 42, 1298–1314. [Google Scholar] [CrossRef]
  47. Ma, Z.; Cooper, P.; Daly, D.; Ledo, L. Existing building retrofits: Methodology and state-of-the-art. Energy Build. 2012, 55, 889–902. [Google Scholar] [CrossRef]
  48. Luddeni, G.; Krarti, M.; Pernigotto, G.; Gasparella, A. An analysis methodology for large-scale deep energy retrofits of existing building stocks: Case study of the Italian office building. Sustain. Cities Soc. 2018, 41, 296–311. [Google Scholar] [CrossRef]
  49. Ascione, F.; Bianco, N.; De Stasio, C.; Mauro, G.M.; Vanoli, G.P. Addressing Large-Scale Energy Retrofit of a Building Stock via Representative Building Samples: Public and Private Perspectives. Sustainability 2017, 9, 940. [Google Scholar] [CrossRef]
  50. Gabrielli, L.; Ruggeri, A.G. Optimal design in energy retrofit interventions on building stocks: A decision support system. Green Energy Technol. 2021, 231–248. [Google Scholar] [CrossRef]
  51. Swan, L.; Ugursal, I. Modeling of end-use energy consumption in the residential sector: A review of modeling techniques. Renew. Sustain. Energy Rev. 2009, 13, 1819–1835. [Google Scholar] [CrossRef]
  52. Pittarello, M.; Scarpa, M.; Ruggeri, A.G.; Gabrielli, L.; Schibuola, L. Artificial neural networks to optimize zero energy building (ZEB) projects from the early design stages. Appl. Sci. 2021, 11, 5377. [Google Scholar] [CrossRef]
  53. Tuominen, P.; Forsström, J.; Honkatukia, J. Economic effects of energy efficiency improvements in the Finnish building stock. Energy Policy 2013, 52, 181–189. [Google Scholar] [CrossRef]
  54. Gabrielli, L.; Ruggeri, A.G.; Scarpa, M. Automatic energy demand assessment in low-carbon investments: A neural network approach for building portfolios. J. Eur. Real Estate Res. 2020, 13, 357–385. [Google Scholar] [CrossRef]
  55. New Energy Solutions Optimized for Islands (NESOI). The “Sustainable Actions for Viable Energy” (SAVE) Project. Available online: https://www.nesoi.eu/content/save-greece (accessed on 15 February 2023).
  56. Minoan Energy Community: The SAVE Project of NESOI. Available online: https://minoanenergy.com/en/%cf%84%ce%bf-%ce%ad%cf%81%ce%b3%ce%bf-save-%cf%84%ce%bf%cf%85-nesoi/ (accessed on 15 February 2023).
  57. European Commission. Clean Energy for EU Islands. Island Gamechanger Award. Available online: https://clean-energy-islands.ec.europa.eu/assistance/island-gamechanger-award (accessed on 15 February 2023).
  58. European Centre for Medium-Range Weather Forecasts (ECMWF): ERA5 from the Copernicus Climate Change Service (C3S) Climate Date Store. ERA5 Hourly Data on Single Levels from 1959 to Present. Available online: https://cds.climate.copernicus.eu/#!/search?text=ERA5&type=dataset (accessed on 16 February 2023).
  59. Kteniadakis, M. Heat Transfer Applications, 2nd ed.; Ziti Editions: Athens, Greece, 2021. [Google Scholar]
  60. American Society of Heating, Refrigerating and Air-Conditioning Engineers. 2009 ASHRAE Handbook—Fundamentals (SI Edition); American Society of Heating, Refrigerating and Air-Conditioning Engineers, Inc.: Atlanta, GA, USA, 2009. [Google Scholar]
  61. Asimakopoulos, D.; Arampatzis, G.; Aggelis-Dimakis, A.; Kartalidis, A.; Tsiligkiridis, G. Renewable Energy Sources, Potential and Technologies, 1st ed.; Sofia Editions: Athens, Greece, 2015. [Google Scholar]
  62. The Engineering Toolbox: Water—Saturation Pressure vs. Temperature. Available online: https://www.engineeringtoolbox.com/water-vapor-saturation-pressure-d_599.html (accessed on 25 February 2023).
  63. The Engineering Toolbox: Water—Heat of Vaporization vs. Temperature. Available online: https://www.engineeringtoolbox.com/water-properties-d_1573.html (accessed on 25 February 2023).
  64. Technical Chamber of Greece. Technical Chamber of Greece. Technical Directive 20701-1/2017. In Official Governmental Gazette 4003B’/17-11-2017; TEE: Athens, Greece, 2017. [Google Scholar]
  65. Directive on Buildings’ Energy Performance. Official Governmental Gazette 2367Β’/12-7-2017. Available online: http://tdm.tee.gr/wp-content/uploads/2017/07/fek_12_7_2017_egrisi_kenak.pdf (accessed on 17 February 2023).
  66. Kreider, J.; Rabl, A.; Curtiss, P. Heating and Cooling of Buildings, 3rd ed.; CRC Press: Boca Raton, FL, USA, 2017. [Google Scholar]
  67. Spitler, J.D. Load Calculation Applications Method, 2nd ed.; ASHRAE Editions: Atlanta, GE, USA, 2014. [Google Scholar]
  68. Stavrakakis, G.M.; Tomazinakis, N.M.; Markatos, N.C. Modified ‘closure’ constants of the Standard k-ε turbulence model for the prediction of wind-induced natural ventilation. Build. Serv. Eng. Res. Technol. 2012, 33, 241–261. [Google Scholar] [CrossRef]
  69. Katsaprakakis, D.A. Computational Simulation and Dimensioning of Solar-Combi Systems for Large-Size Sports Facilities: A Case Study for the Pancretan Stadium, Crete, Greece. Energies 2020, 13, 2285. [Google Scholar] [CrossRef]
  70. Katsaprakakis, D.A.; Zidianakis, G. Optimized Dimensioning and Operation Automation for a Solar-Combi System for Indoor Space Heating. A Case Study for a School Building in Crete. Energies 2019, 12, 12010177. [Google Scholar] [CrossRef]
  71. DIALux Evo. Available online: https://www.dialux.com/en-GB/ (accessed on 25 February 2023).
  72. He, Y.L.; Zhang, Y. Chapter Two—Advances and Outlooks of Heat Transfer Enhancement by Longitudinal Vortex Generators. Adv. Heat Transf. 2012, 44, 119–185. [Google Scholar]
  73. Fragkiadakis, I. Photovoltaic Systems, 4th ed.; Ziti Editions: Athens, Greece, 2019. [Google Scholar]
Figure 1. General aerial view of the Municipal sports centre.
Energies 16 04040 g001
Figure 2. The methodology logical flow chart.
Energies 16 04040 g002
Figure 3. Ambient temperature fluctuation for 2019 and 2020 in Arkalochori.
Energies 16 04040 g003
Figure 4. Ambient relative humidity fluctuation for 2019 and 2020 in Arkalochori.
Energies 16 04040 g004
Figure 5. Wind velocity fluctuation for 2019 and 2020 at 2 m height above ground in Arkalochori.
Energies 16 04040 g005
Figure 6. Annual wind velocity rose graph at 2 m height above ground in Arkalochori for 2020.
Energies 16 04040 g006
Figure 7. Annual fluctuation for 2020 of the hourly average incident solar irradiance and the daily cumulative solar radiation on the horizontal plane.
Energies 16 04040 g007
Figure 8. Annual fluctuation of the swimming pools’ annual heating load in the current operation state.
Energies 16 04040 g008
Figure 9. Annual fluctuation the heat demand for the required domestic hot water production in the swimming pool centre.
Energies 16 04040 g009
Figure 10. General external aspects of the new proposed enclosure of the swimming pool.
Energies 16 04040 g010
Figure 11. The layout of the proposed system for the swimming pool heating.
Energies 16 04040 g011
Figure 12. Typical design and operation layout of the proposed indoor space conditioning and distribution system.
Energies 16 04040 g012
Figure 13. The layout of the proposed system for the domestic hot water production.
Energies 16 04040 g013
Figure 14. Annual fluctuation of the heating load for the swimming pools’ new indoor space.
Energies 16 04040 g014
Figure 15. COP fluctuation versus the ambient temperature of the introduced heat pump for the swimming pool’s new indoor space conditioning.
Energies 16 04040 g015
Figure 16. Annual fluctuation of the temperature for the swimming pools’ new indoor space.
Energies 16 04040 g016
Figure 17. Annual fluctuation of the swimming pools’ annual heating load in the proposed operation.
Energies 16 04040 g017
Figure 18. Annual fluctuation of the indoor space heating and cooling load of the existing building, (a) before and (b) after the application of the proposed passive measures.
Energies 16 04040 g018
Figure 19. (a) COP and (b) EER curves versus ambient temperature of the new heat pump introduced for the existing building indoor space conditioning.
Energies 16 04040 g019
Figure 20. Annual fluctuation of the incident solar irradiance on the solar collectors for 40° inclination.
Energies 16 04040 g020
Figure 21. Annual fluctuation of the thermal power production from the solar collectors and the heat pump for the domestic hot water production.
Energies 16 04040 g021
Figure 22. Annual fluctuation of the supplied hot water temperature from the solar collectors’ primary loop to the heat storage tanks.
Energies 16 04040 g022
Figure 23. Photometric graph of the swimming pool’s newly configured indoor space.
Energies 16 04040 g023
Figure 24. Photometric graph of the outdoor football court.
Energies 16 04040 g024
Figure 25. Annual fluctuation of the incident solar irradiance on the photovoltaic panels for 3.5° inclination and western orientation.
Energies 16 04040 g025
Figure 26. A 3D representation of the photovoltaic plant on the roof of the swimming pools’ new enclosure.
Energies 16 04040 g026
Table 1. Calculation parameters of the swimming pool heating load.
ParameterValue
Emmissivity of water εw0.957
Convection factor hc for air flow over horizontal surface with average velocity at 5 m/s (W/m2∙K)25.0
Stefan–Boltzmann constant (W/m2∙K4)5.67 × 10−8
Upper surface of Olympic size swimming pool 50 × 20 (m2)1000
Upper surface of training swimming pool 25 × 6 (m2)125
Water required temperature in swimming pool Tw (°C)26/30
Ground roughness height z0 (m)0.5
Water-specific heat capacity cp (kJ/kg∙K)4.187
Water-specific latent heat hfg at 25 °C (kJ/kg)2441.7
Solar radiation absorbance factor a from the swimming pool0.85
Table 2. Energy consumption analysis for indoor space conditioning in the existing operation.
EnergyDiesel OilElectricity
Final heat production (kWh)13,973.58502.6
Annual consumption (L/kWh)2475.13677.9
Primary energy consumption (kWh)27,906.310,665.8
Total primary energy consumption (kWh)38,572.1
Table 3. Electricity consumption for lighting in the current operation state.
Lighting Use/Power/ConsumptionInstalled Electrical Power (kW)Electricity Consumption (kWh)
Outdoor perimeter floodlights2.213,882.8
Football court12.826,595.8
Swimming pools32.043,728.0
Indoor ground floor lighting5.37006.7
Indoor basement lighting5.4198.4
Total installed power57.7
Total electricity consumption 91,411.7
Total primary energy consumption 265,093.8
Table 4. Annual energy consumption on the assumption of full operation of the municipal sports centre during the whole year under the current state.
Final Energy UseDiesel Oil (L)Electricity (kWh)Primary Energy
(kWh)(%)
Swimming pool heating307,940.40.03,472,028.069.7
Indoor space heating2475.10.027,906.80.6
Indoor space cooling0.03677.910,665.90.2
Hot water production10,610.30.0119,631.12.4
Lighting0.091,411.7265,093.95.3
Pumps and circulators0.0372,053.71,078,955.721.7
Total321,025.8467,143.34,974,281.5100.0
Table 5. Swimming pool heating load achieved drop with the introduction of the proposed passive measures and primary energy saving with the proposed active system.
Pool/Heat Demand/
Energy Source
Annual Heating Load and Heat Demand (kWh/kW)Annual Saving/Drop
Existing
Operation
Proposed
Operation
(kWh/L)(%)
Olympic size1,932,48583,8831,848,60295.7
Training289,87312,583277,290
Total2,222,35896,4652,125,893
Heat peak demand103711692188.8
Diesel oil consumption307,9400307,940100.0
Electricity consumption024,847−24,847-
Primary energy consumption3,472,43472,0573,400,37897.9
Table 6. Reduction of indoor space conditioning load of the existing building due to the application of all proposed passive measures.
Indoor Space
Conditioning Mode
Annual LoadAnnual Load
Reduction
Existing OperationProposed Operation(kWh)(%)
Heating13,9737803617044.2
Cooling85033872463154.5
Total22,47611,67510,80148.1
Table 7. Electricity consumption in the municipal sports centre for indoor space conditioning after the implementation of the proposed passive and active measures.
EnergyLoad—ConsumptionSaving
Existing OperationProposed Operation(kWh)(%)
Swimming pool’s newly configure indoor space
Heating load (kWh)016,689−16,689-
Diesel oil (L)000-
Electricity (kWh)04240−4240-
Primary energy (kWh)012,296−12,296-
Existing building
Heating and cooling load (kWh)22,47611,67510,80148.1
Diesel oil (L)247502475100.0
Electricity (kWh)3678308659216.1
Primary energy (kWh)38,573894929,62376.8
All indoor space
Heating and cooling load (kWh)22,47628,364−5888−26.2
Diesel oil (L)247502475100.0
Electricity (kWh)36787326−3648−99.2
Primary energy (kWh)38,57321,24517,32744.9
Table 8. Calculation of the total incident annual cumulative solar radiation on a flat surface versus its inclination at the geographical location of the municipal sports centre.
Solar RadiationSurface Inclination with Regard to the Horizontal Plane
20°25°30°35°40°45°50°55°60°
Annually cumulative incident solar radiation (kWh/m2)
Direct10601078108810891083106810451014975
Diffused696684670653634613590566539
Reflected1320293951647893109
Total176917831787178217681744171216721623
Cumulative incident solar radiation from 15/10 to 15/3 (kWh/m2)
Direct320340357371382390396398397
Diffused203200196191185179172165157
Reflected468111417212529
Total527545560572581586589588584
Table 9. Iterative process results for the dimensioning of the solar–combi system.
Collectors’ NumberTanks’ NumberInitial Heat
Production from
Solar Collectors (kWh)
Heat
Storage (kWh)
Rejected Heat
Percentage (%)
Heat
Coverage from
Collectors (kWh)
Heat Demand Coverage
Percentage from Collectors (%)
Collectors-Tanks Cost (EUR)Heat
Production Specific Cost (EUR/kWh)
12131,39916,92646.112,52419.211,4000.0607
16139,82719,10452.014,17521.713,2000.0621
16239,82726,66733.018,81428.819,2000.0680
20247,89930,51736.321,69933.221,0000.0645
24255,79732,98940.923,54436.122,8000.0646
24355,79740,74727.027,53842.228,8000.0697
28263,57235,08544.825,10538.524,6000.0653
28363,57244,01530.829,80845.730,6000.0684
32371,27646,48534.831,55048.332,4000.0685
36378,94148,29838.832,83150.334,2000.0694
40386,58049,63542.733,77751.836,0000.0711
40486,58057,19033.936,28555.642,0000.0772
Table 10. Energy saving summary for domestic hot water production.
EnergyLoad—ConsumptionSaving
Existing OperationProposed Operation(kWh)(%)
Heat demand for hot water production (kWh)65,25465,25400.0
Diesel oil (L)10,610010,610100.0
Electricity (kWh)010,902−10,902-
Primary energy (kWh)119,63131,61788,01473.6
Table 11. Summary of the achieved results on the installed electrical power drop and electricity saving for lighting in the municipal sports centre.
Existing OperationProposed OperationPower DropElectricity Saving
Power (W)Electricity (kWh)Power (W)Electricity (kWh)(W)(%)(kWh)(%)
Outdoor perimeter lighting175013,8836303337112064.010,54676.0
Outdoor football ground12,80026,596720012,467560043.814,12953.1
Swimming pool’s lighting125043,728270667198078.429,63381.6
Existing building indoor ground floor lighting3007007105408119565.0292641.8
Existing building indoor basement lighting10,748198570566504346.913266.6
Total32,00091,412588026,6222612081.664,79070.9
Table 12. Energy saving summary due to the upgrade of the pumps’ station equipment.
EnergyConsumptionSaving
Existing OperationProposed Operation(kWh)(%)
Electricity (kWh)362,664336,38426,2807.2
Primary energy (kWh)1,051,726975,51476,212
Table 13. Remaining electricity consumption analysis.
UseConsumption
(kWh)(%)
Swimming pool’s heating24,8475.9
Swimming pool’s newly configured indoor space heating42401.0
Existing bulding indoor space conditioning30860.7
Domestic hot water production10,9022.6
Lighting26,6226.3
Swimming poos’ pump station336,38479.3
Indoor space conditioning hydraulic network
circulators and hydronic units’ fans
17,7594.2
Mechanical ventilation fans4000.1
Total424,240100.0
Table 14. Primary energy saving results following the energy performance upgrade of the municipal sports centre.
Load/Energy UseLoad/Primary Energy Consumption (kWh)Saving
Existing OperationProposed Operation(kWh)(%)
Swimming pools’ heating load2,222,35896,4662,125,89395.7
Existing building indoor space conditioning load22,47611,67510,80148.1
Pools’ new indoor space heating load016,689−16,689-
Primary energy for swimming pools’ heating3,472,43472,0573,400,37897.9
Primary energy for indoor space conditioning38,57321,24517,32844.9
Primary energy for domestic hot water production119,63231,61788,01573.6
Primary energy for lighting265,09477,204187,89070.9
Primary energy for pumps’ station operation1,051,726975,51476,2127.2
Primary energy in circulators and fans33,73851,501−17,763−52.7
Primary energy in mechanical ventilation fans01160−1160-
Photovoltaic plant primary energy production0−1,275,9691,275,969-
Total annual primary energy consumption4,981,197−45,6715,026,869100.9
Table 15. Diesel oil and electricity annual saving in the municipal sports centre.
Energy SourcesConsumption (L or kWh)Annual Saving
Existing OperationProposed Operation(L or kWh)(%)
Diesel oil321,0260321,026100.0
Electricity467,143424,24042,9039.2
Table 16. Budget comprehensive analysis of the proposed energy performance upgrade project.
Budget ComponentCost (EUR)
Swimming pools’ new enclosure4,173,993
Existing buildings insulation and openings replacement335,242
Swimming pools floating cover117,420
Swimming pools heating199,773
Indoor space heating297,102
Domestic hot water production83,267
Lighting33,099
Pumps’ station684,286
BEMS69,326
Reactive power compensation panel38,130
Photovoltaic plant760,161
Total6,791,800
Table 17. Analysis of the achieved annual economic benefit due to the implementation of the energy performance upgrade.
Energy SourceProcurement Price (EUR/kWh–EUR/L)Existing Theoretical OperationNew Expecting OperationEconomic Saving
Annual Consumption (kWh–L)Annual Procurement Cost (EUR)Annual Consumption (kWh–L)Annual Procurement Cost (EUR)(EUR)(%)
Electricity0.25467,143116,786424,24015,894100,89286.4
Diesel oil1.2321,025385,23100385,231100.0
Total 502,017 15, 894486,12396.8
Table 18. Calculation of the annual CO2 emissions saving.
Energy SourceCO2 Specific Emissions (kg/kWh)Existing OperationProposed OperationElectricity and
Primary Energy Annual Saving (kWh)
CO2 Emissions Drop
Annual
Consumption (kWh–L)
Primary Energy (kWh)Annual
Consumption (kWh–L)
Primary
Energy (kWh)
(kg)(%)
Electricity0.989467,1431,354,715−15,749−45,672482,892477,580103.4
Diesel oil0.264321,0263,619,566003,619,566955,565100.0
Total 4,974,281 −45,6725,019,9531,433,146101.1
Disclaimer/Publisher’s Note: The statements, opinions and data contained in all publications are solely those of the individual author(s) and contributor(s) and not of MDPI and/or the editor(s). MDPI and/or the editor(s) disclaim responsibility for any injury to people or property resulting from any ideas, methods, instructions or products referred to in the content.

