
The Environmental Impact of Changes in the Structure of Electricity Sources in Europe

1
Institute of Economics, University of Applied Sciences in Elbląg, Wojska Polskiego 1, 82-300 Elbląg, Poland
2
Institute of Economics and Finance, Warsaw University of Life Sciences—SGGW, Nowoursynowska 166, 02-787 Warsaw, Poland
*
Author to whom correspondence should be addressed.
Energies 2023, 16(1), 501; https://doi.org/10.3390/en16010501
Submission received: 9 December 2022
/
Revised: 23 December 2022
/
Accepted: 27 December 2022
/
Published: 2 January 2023
(This article belongs to the Special Issue Energy Consumption in the EU Countries II)
Abstract
:The limited use of non-renewable energy sources facilitates a reduction in the negative environmental impact of electricity production. The policies of European countries aim to change the structure of electricity sources, focusing particularly on non-renewable sources. The aim of this study was to assess changes in the structure of electricity generation depending on the energy sources used in 34 European countries in the years 1990–2020 in terms of their environmental impact. This study was conducted using cluster analysis: a method applied in multivariate comparative analyses. Such an approach provided a new, broader outlook on changes in the structure of electric energy production in Europe. A total of nine homogeneous groups of countries were distinguished in terms of energy transformation. The ecological scarcity method 2013 was applied to assess the environmental impact of electricity production in the analyzed countries. In the investigated period, the negative environmental impact of electricity production in European countries decreased. The median of the volume of this impact, determined based on the structure of production in 1990, for the analyzed countries was 464 UBP/1 kWh. In the following years, the value of the median dropped to 413 UBP/1 kWh (2000), 322 UBP/1 kWh (2010), and 204 UBP/1 kWh (2020), respectively. The diversification of the countries in this respect also decreased, which resulted in a reduction in the number of clusters from eight in 1990 to two in 2020.
1. Introduction
The EU common energy policy is based on competition, security, and sustainable development [1]. Efforts to reduce carbon dioxide emissions and eliminate non-renewable energy sources, together with the promotion of renewable sources, have led to considerable changes in the energy balances of individual countries [2]. Increasing the use of renewable energy sources is a major element in the strategy of sustainable development and one of the strategic goals of the European Union [3]. It is a prerequisite for the assumed emission reduction levels and other goals, such as assuring energy security, among other things [4].
The use of fossil fuels as the main source of energy is associated with a significant negative environmental impact resulting from emissions of particulate matter, as well as CO2 and other gases that are generated in the combustion process [5]. For this reason, many countries are taking steps to increase the share of renewable energy sources in their energy balance since they have a much lower environmental impact throughout the product life cycle [6]. The LCA analysis allows the environmental impact of the electricity production process to be assessed depending on the selected technology, fuel used, and the location of the facility. This analysis takes into account the stage of obtaining, transporting, and processing primary fuel, the stage of construction, operation, and decommissioning of the power plant together with successive land reclamation, as well as the storage and disposal of the generated waste. Taking into account all stages of energy production is particularly important in the comparative analyses of those energy sources that are characterized by very low emissions at the stage of operation [7,8]. This tool can therefore be used to assess the production technologies used in individual countries and to identify those solutions that contribute the greatest extent to the reduction in environmental impact [9]. A description presenting the use of the LCA methodology to build optimization models that take into account the environmental impact as part of the zero-emission building concept can be found in the works of Mehrtash et al. [10,11].
Increasing the share of energy generated from renewable sources in the energy balances of individual countries is a considerable challenge both technologically and economically. It requires changes in the existing infrastructure, which in turn, generates huge investment outlays [2]. Many European countries have implemented support systems that promote renewable energy sources. The first countries to introduce such programs were Denmark, Portugal, and Germany [4]. The importance of measures undertaken by governments of individual European countries to increase the use of renewable energy sources in the generation of electricity was emphasized in their studies, e.g., by Bórawski et al. [12], Child et al. [13], Lowitzsch, Hoicka, and van Tulder [14]. In view of technological challenges, particular attention is focused on variable renewable energy sources (VRES), such as wind and solar energy. While they are perceived as key elements of future energy systems [15,16,17,18,19,20], nevertheless, problems with integrating VRES into the currently existing electric energy systems are also indicated [20,21].
The implementation of a sustainable energy system in individual countries plays a key role in the economy, the natural environment, and society. A systemic review of the literature concerning sustainable electric energy systems was presented in a paper by Łukasiewicz et al. [22]. Studies concerning strategies aimed at the transformation of energy balances in individual European countries indicated trends toward progressing convergence [4]. Scenarios have been developed to promote climate neutrality in the EU by 2050 [23]. Published research data indicates that the adoption of advanced technologies will facilitate the implementation of a sustainable electric energy system, 100% based on renewable sources [24]. The need to ensure public participation in the process of transformation towards low-emission energy systems is also stressed [25,26]. The increased importance of renewable energy sources is also associated with the problem of energy security, particularly in the case of VRES, whose integration into the existing electric energy system is hindered due to its specific character. Energy security and the efficiency of renewable energy sources have been investigated, e.g., by Fazıl Gökgöz and Mustafa Taylan Güvercin, Muhammad Adil Khattak et al., as well as Ken’ichi Matsumoto, Michalis Doumpos, and Kostas Andriosopoulos [27,28,29].
The aim of this study was to assess changes in the structure of electricity production in Europe depending on the used sources in terms of their environmental impact. The conducted analysis covers the years 1990–2020. The secondary data used were published by Eurostat for 34 European countries. Groups of similar countries were distinguished based on the directions of energy transformation. The environmental impact of energy production using various sources in European countries was assessed using the ecological scarcity method 2013 (ESM). Based on the calculated values of the impact of electrical energy production in individual countries, a clustering procedure was performed for the countries, which held the aim of identifying groups with a comparable level of environmental impact.
Problems related to energy balances in individual countries and the use of renewable energy sources have been studied in many publications. These research papers concern, e.g., directions of changes in the energy balance [1,2,3,30] or the environmental impact of energy generation using various sources [5,31,32]. The previous works lack a comprehensive view of the directions of change in the energy systems of such a large group of European countries, covering a 30-year period of change. The cluster analysis applied in this study was previously used in research conducted by Kacperska et al. [3] concerning directions of changes in the energy balance during the years 2009–2019. In this study, the analysis covers a longer period (1990–2020). A novel aspect is primarily connected with the extension of research and incorporation of changes in the environmental impact resulting from different electricity production structures. The analysis comprised in this paper provides a comprehensive assessment of both the directions of energy transformation and changes in the pressure of the natural environment caused as a result of electricity production in European countries.
2. Materials and Methods
The presented comparative analysis was conducted based on multidimensional objects, in this case, concerning 34 European countries. The objects for analysis were selected based on the availability of a complete time series containing data on the changes in the volume and structure of electric energy production in the years 1990–2020. In view of the different energy sources used to generate electricity, Estonia was excluded from the analysis. An important unique characteristic of the Estonian electric energy sector is the considerable level of electricity production (exceeding domestic energy demand) in power stations fired by oil shale of a relatively low efficiency [33,34].
Changes in the structure of electricity sources in Europe were assessed using secondary data published by Eurostat. The analysis conducted at the level of individual countries and covering the period of 1990–2020 included the following basic electricity sources:
- -
- X1—hard coal,
- -
- X2—lignite,
- -
- X3—crude oil and petroleum products,
- -
- X4—natural gas,
- -
- X5—nuclear energy,
- -
- X6—hydropower,
- -
- X7—wind power,
- -
- X8—solar power,
- -
- X9—geothermal power,
- -
- X10—biogas.
The degree of diversification of the investigated countries was assessed using cluster analysis. It is a method applied in multivariate comparative analyses, which divides a large group of objects into relatively homogeneous groups called clusters. Generally speaking, cluster analysis is used to classify n objects, described using i variables. Cluster analysis considers the similarity or distinctness of objects, and on this basis, mutually exclusive groups of objects (clusters) are distinguished. Objects classified to each cluster are similar to one another in terms of the values of all i variables [35].
In order to identify groups of countries similar to one another in terms of the directions of energy transformation, the algorithm of on-hierarchic cluster analysis was applied, i.e., the k-means clustering. The k-means algorithm is one of the relatively frequent methods of non-hierarchic grouping, facilitating the identification of similar objects [36]. The traditional clustering algorithm using the k-means method consists of [37]:
- (1)
- The random placement of k centroids in the i–th dimensional space with centroids acting as central points for the individual clusters;
- (2)
- Classification based on the function of the distance of each object to the nearest cluster;
- (3)
- The repeated identification of the center for each cluster based on the coordinates of objects grouped in a given cluster;
- (4)
- The iterative repetition of steps two and three—transferring objects between the clusters last until differences within the clusters are minimized while differences between separate clusters are maximized. This means reaching the criterion of convergence, i.e., the state in which the allocation of points to individual groups has not changed.
In this method, measures of similarity or difference are based on the distance between objects d(A,B). The greater the distance between two objects (in this case, countries), the more these objects differ from each other. Objects contained within a given group are similar objects (the distance between objects from the same group is small), and at the same time, they are different from objects outside this group (a large distance between objects forming a given cluster and the other objects lying outside this group) [38].
Many methods may be applied to determine the distances between objects. The method most frequently applied, and used within this study, is the Euclidean distances method [39]. It consists of the determination of distances between two objects in the i-th dimensional space based on the following dependence [40]:
where:
d(p,q)—The distance between two objects p and q (countries);
i— The number of variables;
xp,i, xq,i—The value of the i-th variable for objects p and q.
Diagnostic variables used in the analysis have different distributions. For this reason, prior to the determination of distances, variables were standardized using the Z-score approach according to the following formula [41]:
where:
zp,i—The value of the i-th variable for the object p after standardization;
—The mean value of the i-th variable;
—The standard deviation of the variable i.
Based on the performed standardization, a matrix of distances was established, which constituted a starting point for clustering.
There are several indexes of the homogeneity of units or heterogeneity of clusters that make it possible to determine an optimal number of clusters in a given set of objects. These indexes include indexes of entropy, coefficients of spatial concentration, the silhouette factor, etc. [42,43,44]. In this study, the quality of the group structure was evaluated based on the silhouette factor, determined by the formula [45]:
where:
SI—Silhouette factor;
n—Number of all investigated units of set X;
a(xi)—Mean distance of element i from the other elements of the group;
b(xi)—Mean distance of element i from elements of the closest neighboring group.
The value of the index meets the inequality: −1 ≤ SI ≤ 1, while values close to one mean that a given object p is well classified. The mean value SI is calculated based on the values of the indexes for all objects from a given cluster and indicates the degree of clustering correctness [46]. It is assumed that the optimal value is the number of clusters corresponding to the maximum mean value of the silhouette factor, determined for a different number of clusters k identified in the investigated set of objects [47].
The non-hierarchic grouping using the k-means method was conducted in the R environment using the ‘cluster’ package (package ‘cluster’, https://cran.r-project.org/web/packages/cluster/cluster.pdf, accessed on 12 October 2022). The figures presented in this study were elaborated by the authors using the ‘ggplot2’ package (package ‘ggplot2’, https://cran.r-project.org/web/packages/ggplot2/ggplot2.pdf, accessed on 4 November 2022).
The environmental impact of electricity production from different energy sources in European countries was assessed using the Sima Pro program and the associated eco-invent database. Calculations were made by applying the ecological scarcity method 2013 (ESM). It is a method applied in the life cycle assessment (LCA) of products and processes. It was originally developed and applied in Switzerland [48]. Since then, it has been continuously developed and updated [49]. In this study, the latest version (1.07) available in SimaPro 9.2 was used. The ecological scarcity method is based on the distance to the target approach. It uses as the standard the objectives of environmental quality defined in legal regulations: the greater the exceedance of desirable emission levels or raw material consumption, the stronger the effect. An eco-factor measures the pressure imposed on the environment based on the difference between the present situation and the objectives specified in the regulations [50].
ESM makes it possible to express various environmental impacts in the same units, referred to as unit-based pricing (UBP). This facilitates the comparison of various environmental impacts and their conversion into one aggregated value [49]. Such results may be used by decision-makers in political bodies or enterprises to improve environmental management [51]. At the methodological level, ESM is a comprehensive method of analysis, well-adapted to investigate renewable energy supply [52].
The level of this impact was expressed in the unit-based pricing (UBP), the value of which was determined for the production of 1 kWh of electricity according to the structure of production in a given country in a given year. Due to the fact that the shares of all 10 energy sources analyzed in this study did not always total 100% (e.g., in Finland, biomass is a major source used to generate electricity [53]), the impact of the other part of energy production was determined based on the impact established for the energy mix of a given country.
The life cycle of European electricity mixes comprises the construction, operation, disassembly, and disposal of the power plant facilities, the processing of spent fuels, including obtaining primary energy sources (natural gas, crude oil, hard coal, uranium, wood), their refining, as well as their conditioning and final storage, transmission and distribution to low-voltage consumers, as well as all transportation of fuels, building materials, consumables, and waste [54].
Based on the calculated values of the impact of energy production and using the k-means clustering, the countries were grouped with the aim of identifying groups of countries with similar levels of environmental impact. The statistical significance of differences between values of the mean calculated for individual clusters was verified using the Mann–Whitney U test. This test is a non-parametric test determining the constancy of a measure of the central trend (mean or median) in two groups—also in the case when the distribution of a variable does not meet the criterion of fit to a normal distribution and when the distribution is considerably asymmetric in relation to the mean [55].
3. Results
3.1. Changes in the Energy Mix in European Countries in the Years 1990–2020
Preliminary calculations indicated marked differences in the levels of the percentage shares of individual energy sources in the total electricity production in the analyzed years (Figure 1). Considerable differences were observed, particularly between the EU-15 and the new EU member countries, as reflected in the high coefficients of variation for individual variables. In 1990, the mean share of energy generated from hard coal was 17.5% (median 8.5%), from lignite—15.5% (median 0.3%), from oil and petroleum products it was 13% (median 5%), while from natural gas it was 9% (median 3%). The only renewable source used in electricity production was hydropower, the mean share of which was 24% (median 12%). The rest of the energy was generated in nuclear power plants, with a meaningful share of 17% (median 0%). Considerable differences between the mean and median values resulted from the fact that in many countries, individual sources were not used to generate electricity. This pertains particularly to nuclear power engineering.
In 2020, among all the fossil fuels, the greatest share in electricity production was recorded for natural gas (mean 21%, median 15%). Mean shares for the other fossil fuels amounted to 4.3% for hard coal (median 0.7%), 3.7% for crude oil and petroleum products (median 0.8), and 0.9% for lignite (median 0%). The main renewable source was hydropower (mean share 24%, median 17%). However, the shares of the other alternative sources—particularly wind power plants (mean share 12%, median 9%) and photovoltaics (mean share 3.6%, median 3%), increased considerably. The mean share of nuclear power was 15%.
3.2. The Share of Renewable Energy Sources in Electricity Production in the Years 1990–2020
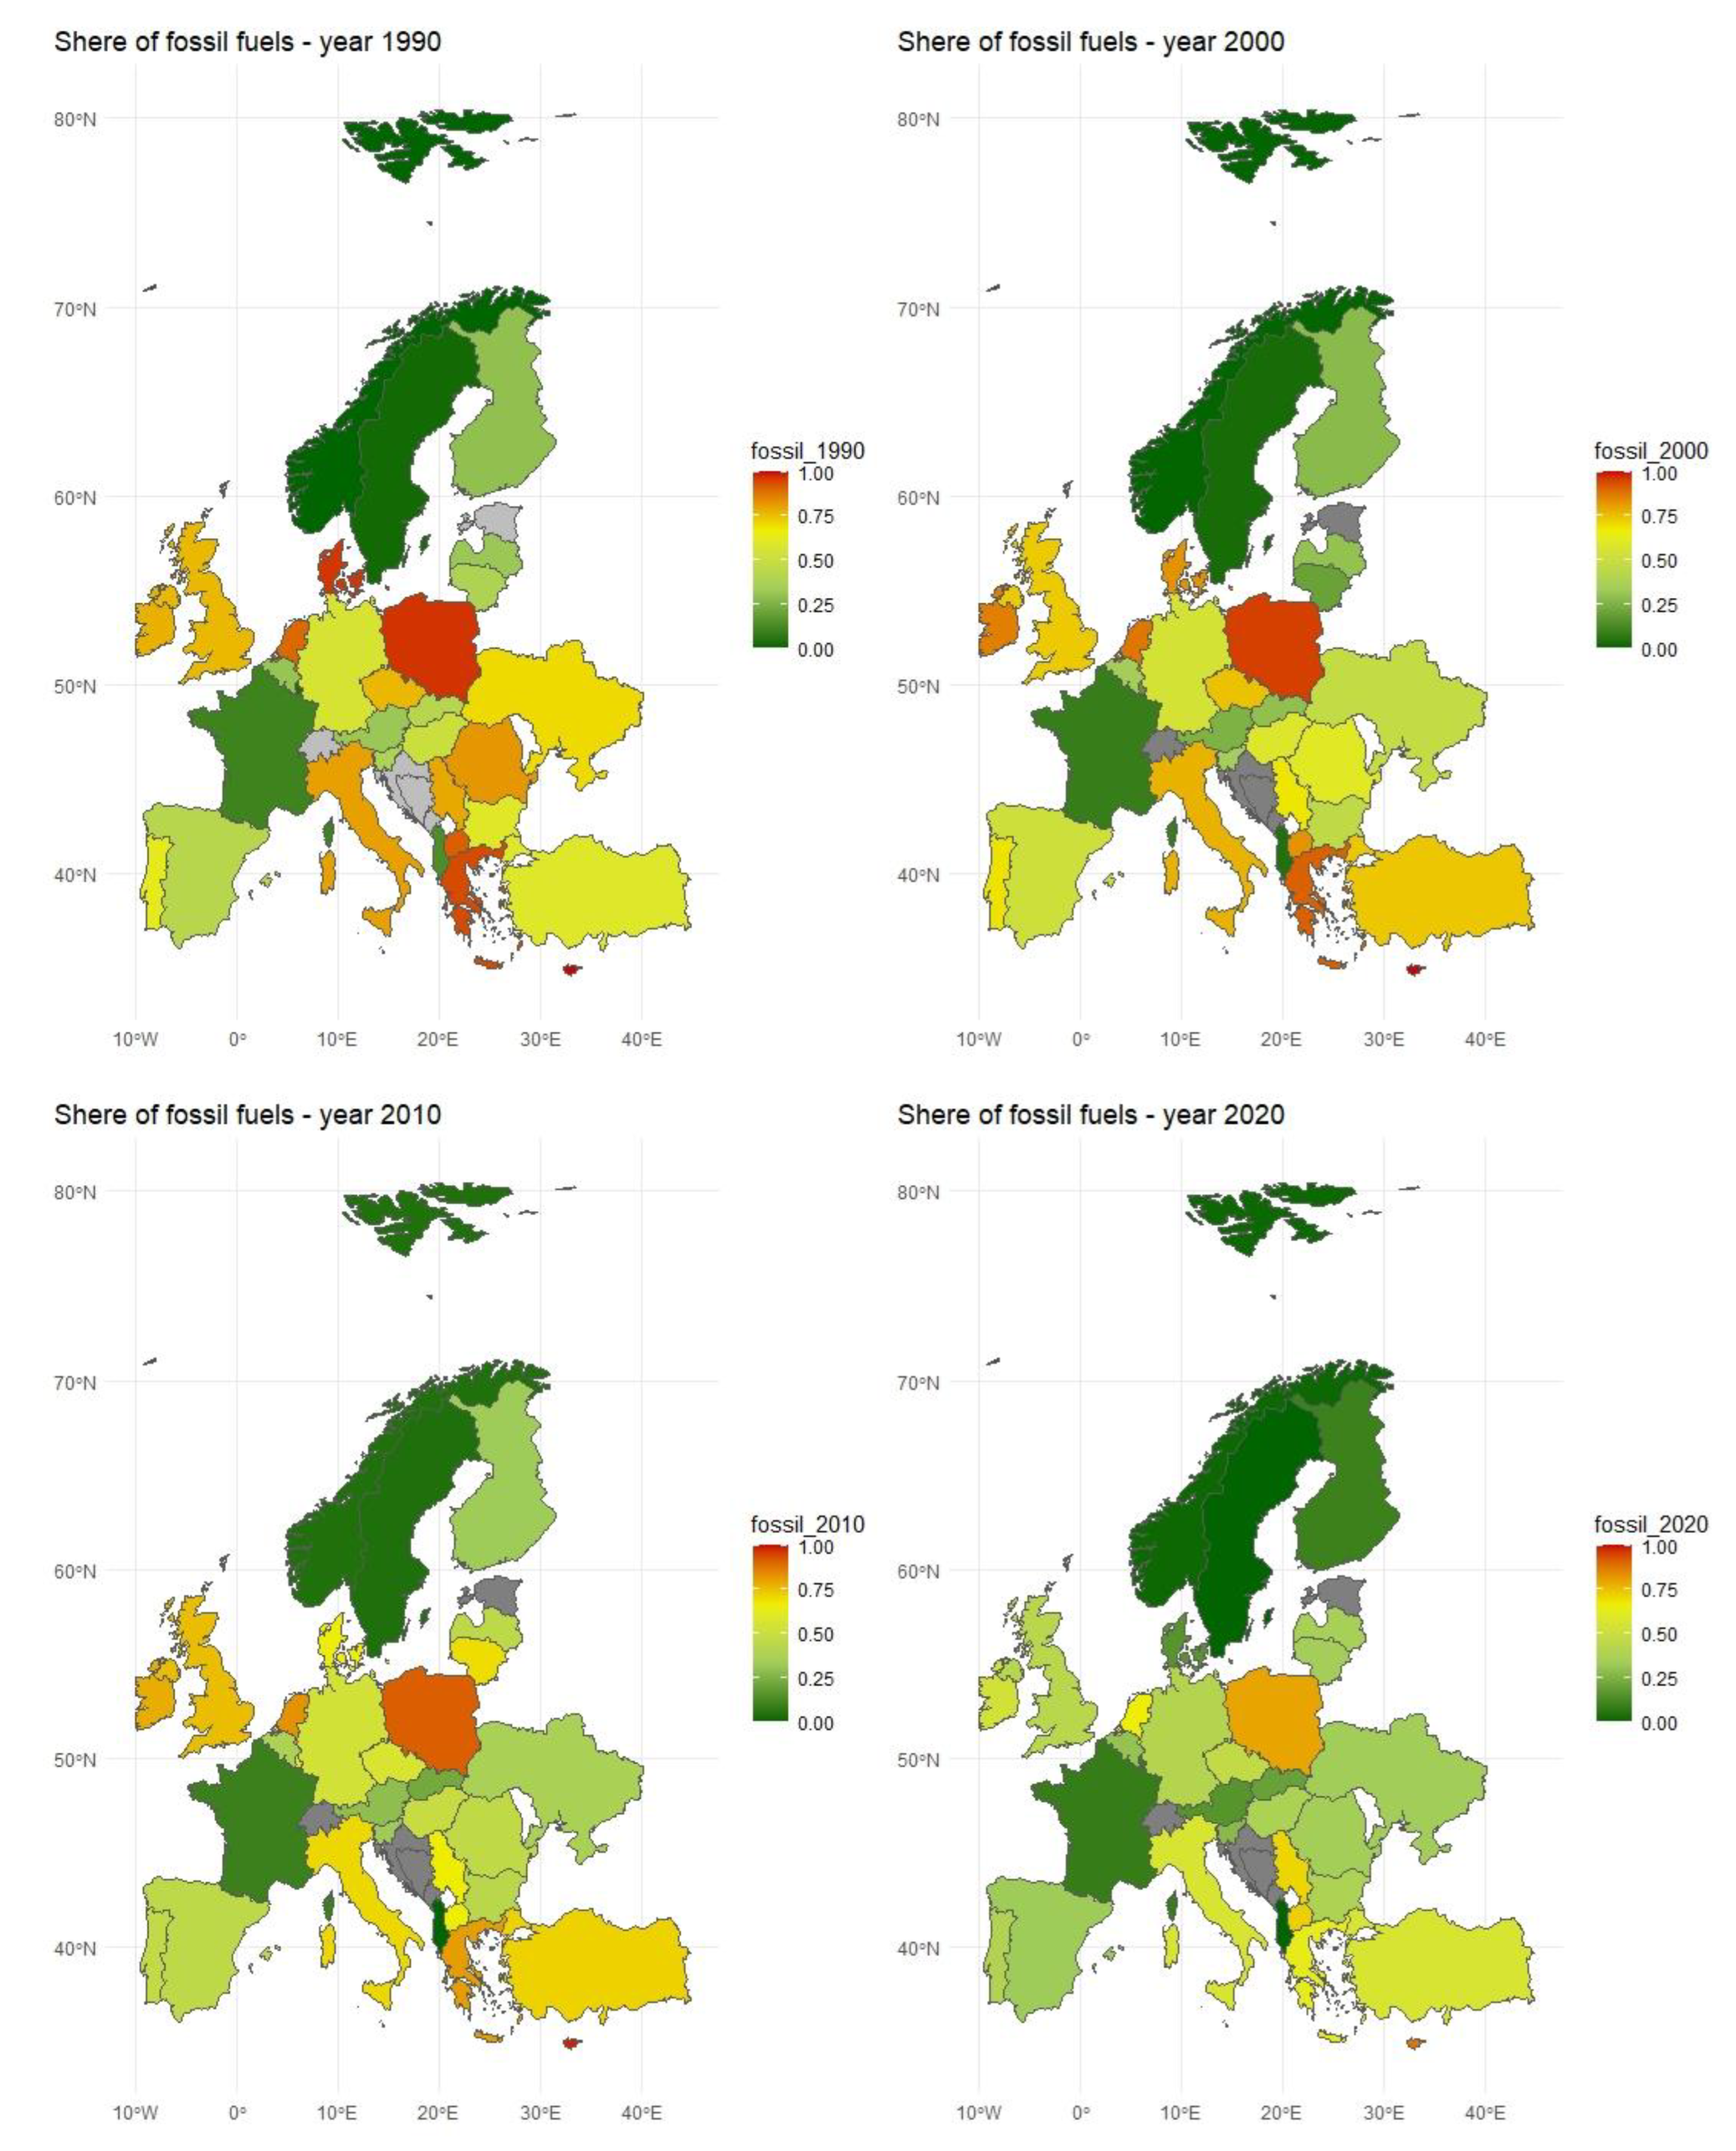
The presented data indicate a growing share of electricity produced from renewable energy sources (Figure 2). In 1990 only six of the analyzed European countries had a share of renewable sources in electricity production that exceeded 50% (Iceland, Norway, Albania, Latvia, Austria, and Luxemburg). This group is comprised primarily of highly developed European countries, which founded their energy policies first of all on renewable energy sources (using mainly hydropower). A large share of the renewable power production sector in Albania (86%) results from the dependence of the electrical energy production system on hydropower in this country. Due to the complete dependence of electricity production on hydrological conditions, the electricity supply system in that country is unreliable. For example, 2017 brought a drop in the volume of energy production in relation to 2016. This led to a considerable increase in the import of electricity from neighboring countries [56].
In 2000, the group of countries with over a 50% share of renewable sources in their total electricity production was joined by Croatia and Sweden. The Croatian electricity production system has a unique topology, resulting from the fact that it was established in the period when Croatia was part of a larger country (Yugoslavia), which comprised all the neighboring countries (i.e., Serbia, Bosnia and Hercegovina, and Slovenia). As a result, the Croatian system has a very high interconnection capacity, and the level of import is approx. 20–30% of the total energy consumption. Due to the geographical and natural conditions, the production of electricity in Croatia is characterized by very high seasonality, with high peaks in the southern regions during the summer tourist season. Most electricity output comes from hydropower plants (approx. 40% to 50%), which are located along the coast and in the northern region of the country. Slightly less electricity (20% to 30%) is generated by thermal power stations located in the northern and eastern regions of Croatia, while some electricity is generated in the Krško nuclear power plant in Slovenia [57].
In 2010, almost 50% of electricity originating from renewable energy sources was also produced in Portugal. Portugal was a country with an energy sector that was, to a considerable extent, dependent on the imports of oil and natural gas. In 2005 the imports of crude oil and natural gas covered 85% of the demand for energy carriers. The share of renewable energy sources in gross electricity production in the first decade of the 21st century raged from 20% to 35%, and it was dependent on the volume of hydropower production in wet and dry years [58]. Changes in the energy policy of Portugal were initiated in the early 21st century and consisted of the implementation of the feed-in tariffs mechanism combined with public tenders for connection licenses in the years 2001, 2002, and 2005. The aim of the undertaken measures was to promote the use of renewable energy sources, primarily wind. Thanks to these actions, a 17% share of wind energy was obtained in the structure of electricity production in 2010, with its further increase to over 20% starting in 2015 [59].
In 2020, in three European countries, the share of renewable energy sources in electricity production was approx. 100% (Albania, Iceland, Norway—mainly thanks to electricity produced in hydropower plants), while in another eight countries it exceeded 50% (Austria, Luxemburg, Denmark, Sweden, Croatia, Lithuania, Portugal). Apart from the traditionally used hydropower, electricity production also used:
- -
- Wind energy—a 56% share in electricity production in Denmark, approx. 30% share in Ireland and Lithuania, as well as 20% share in Portugal, Germany, and Estonia,
- -
- Solar power—approx. 10% share in electricity production in Malta, Greece, Italy, and Germany.
Despite the development of these technologies, the share of geothermal and biogas sources in electricity production in Europe remains very low. Nevertheless, geothermal power is increasingly seen as an option that could aid in reaching the Paris Agreement goal, i.e., reducing the increase in air temperature to max. 2 °C [60]. In this respect, the EU focuses on this energy source, as indicated by the allocation of 90 billion euros in the years 2014–2018 for the research and development of geothermal technologies within the Horizon 2020 framework program [61].
The increased importance of renewable sources in the structure of electricity production varied depending on the country. When comparing 2020 to 1990, it may be stated that the greatest percentage increase in the energy output from renewable energy sources was recorded in Denmark (with an increase of 60 p.p.), Lithuania (an increase of 53 p.p.), Germany (an increase of 38 p.p.), Ireland (an increase of 33 p.p.), and Greece (an increase of 31 p.p.). In all these countries, the share of the renewable power sector in the total electricity production in 1990 did not exceed 10%, while the primary energy sources included hard coal (over 90% share in Denmark and 40% share in Ireland), lignite (72% share in Greece and 30% share in Germany), and nuclear energy (60% share in Lithuania). Following the closure of the Lithuanian nuclear power plant at Ignalina (INPP) towards the end of 2009, renewable energy sources in that country accounted for an approx. 12% gross domestic consumption of fuels and energy [62]. In 2020 this share was approx. 35%.
The group of countries with the lowest increase in the share of renewable energy included Turkey (increase in the share of renewable energy sources by 1 p.p.), Serbia (increase by 8 p.p.), Ukraine (increase by 8 p.p.), and Czechia (increase by 9 p.p.). In turn, in Latvia, due to the increase in the share of energy produced from natural gas, the share of renewable energy sources in the electricity balance decreased in 2020 compared to 1990 by 12 p.p. Nevertheless, in 2020 over 55% of electricity generated in Latvia came from renewable sources—mainly from hydropower plants. The large amount of electricity generated in hydropower plants in Latvia may be explained by a high annual precipitation total and high discharge flow in the Daugava River. This has a positive effect on the amount of produced electricity and could lead to the energy self-sufficiency of Latvia (the index is calculated by subtracting the volume of export from the volume of the import of energy sources and dividing this number by the total energy consumption). This made it possible for Latvia to reach the strategic goal of the use of renewable energy sources, i.e., the 40% share of energy produced from renewable sources in the gross end use of energy in 2020 [63].
For over a decade, the EU has been gradually shifting from conventional power engineering based on fossil fuels and nuclear power (in accordance with the Green Energy strategy [64]) toward an increased share of renewable energy sources in the structure of electricity consumption from various sources. Despite the growing importance of renewable energy observed throughout Europe in 2020, as many as seven European countries failed to reach a 20% share of renewable energy sources in their electricity production. This group of countries includes:
- -
- Hungary (11% share of renewable energy sources, with nuclear power being the most important energy source at 47%);
- -
- Czechia (11% share of renewable energy sources, 36% share of nuclear energy and 35% share of energy from lignite);
- -
- Malta (11% share of renewable energy sources, 86% energy from natural gas);
- -
- Ukraine (12% share of renewable energy sources, 40% electricity produced from natural gas);
- -
- Cyprus (12% share of renewable energy sources, the primary energy sources crude oil and petroleum products—88%);
- -
- Poland (14% share of renewable energy sources, 44% energy from hard coal);
- -
- Bulgaria (16% share of renewable energy sources, 41% energy generated in nuclear power plants).
3.3. Groups of Countries in Terms of Changes in the Structure of Electricity Production
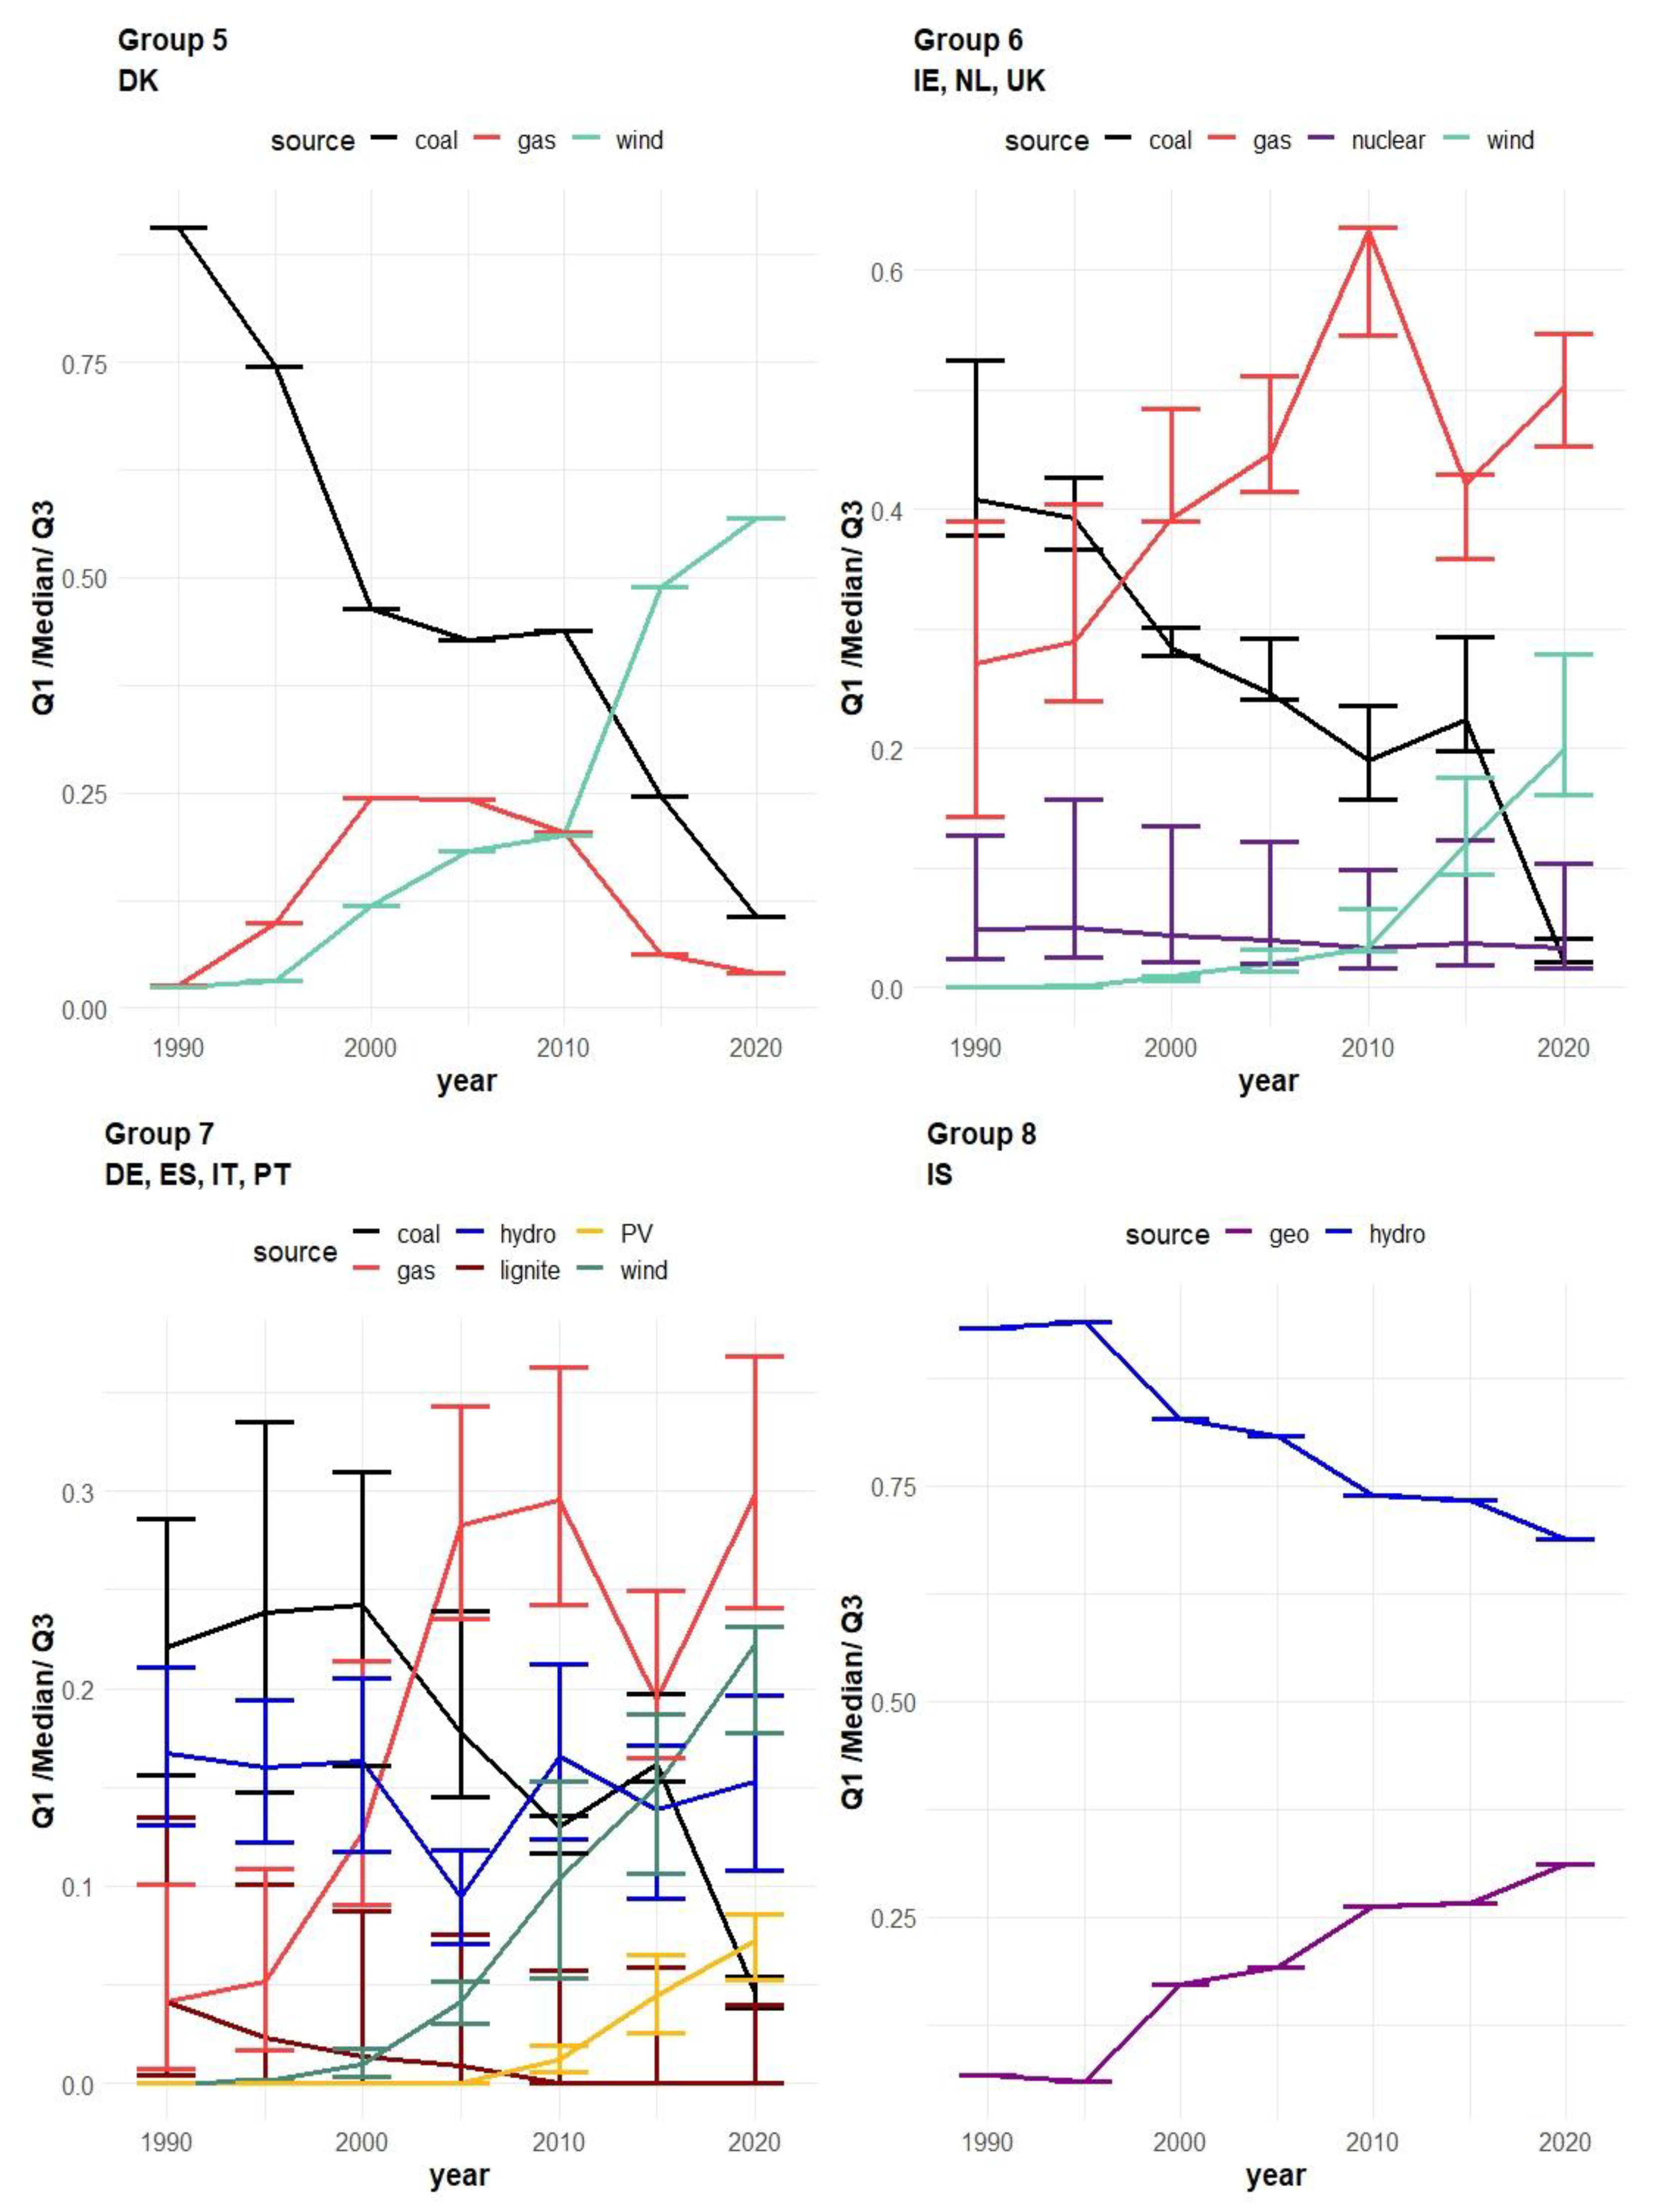
The results presented above concerning the structure of electricity production in individual European countries in the period of 1990–2020 indicate considerable variation in the direction of occurring changes. The homogeneous groups of countries in terms of changes in the structure of electricity production were identified using k-means clustering. Based on the calculations, it was found that the best quality of clustering for countries may be obtained assuming the division of the analyzed objects into eight groups. The results of non-hierarchic clustering are presented in Figure 3 and Figure 4. These figures present the median (in the form of a point, from which lines linking values from successive years extend) as well as quartiles 1 and 3 (in the form of whiskers) from the values of shares for main energy sources in the individual group in the period of 1990–2020.
Group 1 contains countries in which hard coal and lignite dominated the structure of electricity production in the 1990s (Czechia, Greece, North Macedonia, Poland, and Serbia). In this group of countries, renewable energy was generated first of all in hydropower plants. However, in recent years, countries belonging to group 1 have considerably reduced their share of coal in electricity production. In 2020 the median share of lignite for this group of countries was 35%, while for hard coal, it was 0%. In this respect, Poland deviates from other countries. The production of electricity in Poland continues to be dominated by coal. Hard coal accounts for over 60% of the coal used for energy production, while the rest is lignite. Poland has the highest share of coal in electricity production among all the countries within the IEA (International Energy Agency) and ranks second after Australia in terms of the share of fossil fuels used in electricity production. Despite the rapid development of renewable energy sources, Poland is still found in the group of IEA member countries with the lowest share of renewable energy sources. Coal will remain the main energy source for many years. In 2035, it is planned to reduce this source to 105 487 GWhe, although until 2050, it will probably be 63,563 GWhe. At present, in Poland, nuclear energy is not generated, but after 2035 two reactors with the combined power output of 6 GWe nuclear energy are planned [65].
The second group comprises two small European countries—Malta and Cyprus. Starting from the mid-1990s, both these countries based their electricity production on almost 100% of crude oil. Cyprus, as an EU member country, differs from the other EU countries due to the fact that its electricity grid operates as an independent and isolated grid. It is the only EU country that is not connected to the European grid and is completely dependent on domestic production. At present, the electricity system of that island, to a considerable extent, is dependent on fossil fuels, with approx. 90% of the total electricity production comes from fuel oil and heavy oil [66]. Similarly, as in the case of Cyprus, Malta, in the first decade of the 21st century, followed a complete shift from hard coal (from which, as late as 1990, over 50% of electricity was produced) toward generating electricity entirely from crude oil. At present, after the transformation implemented in recent years, the energy mix of Malta includes 86% natural gas and only, to a limited extent, renewable energy sources (11% share of photovoltaics) [67].
Group 3 contains seven European countries—Albania, Austria, Croatia, Luxemburg, Latvia, Norway, and Turkey. These countries—mainly thanks to the high share of hydropower (from 42% in Croatia to almost 100% in Norway and Albania) belong to the group of European leaders in terms of the share of electricity generated from renewable sources. Turkey is an exception in this group, as it is a country importing electricity and has problems with energy self-sufficiency. Moreover, a high percentage of energy demand is met using fossil fuels. In 2020, it was 55%, including 23% from natural gas. Starting from 2014, a marked upward trend could be observed in terms of the share of renewable sources, among which hydropower had the highest share (2/3 of energy produced from renewable energy sources) [68]. Moreover, Turkey is intensively developing the production of energy using wind power plants (in 2020, accounting for 8% of the total produced electricity) and solar power plants (4%).
Group 4 is the most numerous. It comprises 11 countries (Belgium, Bulgaria, Finland, France, Lithuania, Romania, Slovakia, Slovenia, Sweden, and Ukraine) with a relatively diverse production structure. The common characteristic of countries in this group is the high share of electricity generated in nuclear power plants (over 70%—until the close of the nuclear power plant in Lithuania in 2009, approx. 2/3 in France, 55% in Slovakia, 40% in Belgium and Bulgaria, 35% in Finland and Slovenia, 30% in Sweden, and 20% in Romania and Ukraine). Nuclear energy is considered a source capable of combining the safe supply of the assumed amount of electricity without generating CO2 emissions. For this reason, it is treated as an effective technology that may be used within actions countering long-term climate change. According to NEA/IEA [69], in terms of the scenario to reduce an increase in temperature by 2 °C by 2050, it will be necessary to increase on a global scale the installed power of nuclear power plants from 396 to 930 GW. This will mean reaching a 17% share of nuclear energy in the world’s electricity production. Other sources of electricity important for group 4 include natural gas (20–30% share in production in Belgium, Hungary, Lithuania, and Romania) and hydropower (over 20% share in production in Finland, France, Romania, Slovakia, and Slovenia).
The next group contains only one country—Denmark. The analyses of changes that have taken place in the Danish energy policy within the last 30 years show that the direction of transformation in the electric energy sector differs from those described previously. According to the environmental performance index from 2020, Denmark is the greenest economy worldwide, leading in terms of air quality, sanitary conditions, safe drinking water, and waste management while also being the world leader in combating climate change and reducing greenhouse gas emissions by 70% for 2030 [70]. Within the last several decades, that country has been exceptionally successful in the development of renewable energy. As late as the 1990s, over ¾ of electricity produced in Denmark was generated using hard coal. Since then, Denmark has selected and invested huge funds in renewable energy sources, particularly wind power [71]. The primary element in the promotion of wind energy in Denmark was connected with the feed-in tariff system (FIT) [72]. Energy enterprises were obliged to purchase electricity generated in wind power facilities at a rate of 85% of the price paid by consumers. The support system was supplemented by direct subsidies and tax exemptions for private turbine owners, 30% investment subsidies, and the tax-free generation of electricity by up to 7000 kWh [73]. The introduced support mechanisms for wind power generation resulted in an over 50% share of these sources in electricity production in that country in 2020. In turn, the goal of the Danish energy policy for the year 2050 is to completely eliminate fossil fuels from energy production in that country [74].
Group 6 comprises three countries: Ireland, the Netherlands, and Great Britain. Towards the end of the 20th century, the energy production systems in all these countries were based primarily on coal, with the share in the production structure ranging from 30–40% in Ireland to 60% in Great Britain, and on natural gas (30–40% share in Ireland and Great Britain, and 50% in the Netherlands). The high share of coal in electricity production in Great Britain was a consequence of the decision made by the British government to impose an obligation on companies generating electric energy to purchase large quantities of coal from the nationalized British Coal [75]. At the same time, since the 1990s, an increase was observed in the consumption of natural gas to generate electricity. This phenomenon accelerated in 1998, together with the end of the coal contracts [76]. Similarly to British changes, the trend in the structure of production consisting of the gradual increase in the share of gas in the production structure at the expense of hard coal was also observed in the Netherlands and Ireland [77]. In the last decade, wind power has become the third source in the structure of electricity production in all the countries from this group. In 2020, the share of electricity generated from wind ranged from 12% in the Netherlands up to 36% in Ireland. The feature distinguishing this group from the others is the very low (from 0% to 3%) share of hydropower, constituting the primary renewable energy source in Europe.
Group 7 consists of Germany, Estonia, Portugal, and Italy. The electric energy system in the first three countries from this group in the 1990s was based on coal (both hard coal and lignite), the share of which ranged from 30% to 50%. Additional sources used to generate electricity production included either nuclear power (30% share in Germany and Estonia) or hydropower (30% share in Portugal). In 2010, the German federal government passed a package of measures, which comprised a long-term goal of reaching an 80% share of renewable energy in the annual energy consumption by 2050, and in 2011, the resolution was adopted to eliminate nuclear energy by 2022 [78]. The consequences of this strategy for the development of the power sector included reduced electricity production from coal, an increased share of natural gas, and the development of alternative energy sources, primarily wind and solar power. Changes similar to those in Germany were also observed in Portugal, Estonia, and to a lesser extent, Italy [79]. At present, the share of natural gas in electricity production in this group of countries ranges from 20% (in Germany) to 50% (in Italy) for wind power, it is approx. 20% (in Germany, Estonia, and Portugal), while for hydropower, it is 20–30%% (in Italy and Portugal). A supplementation of the electric energy generation system is provided by nuclear power plants (in Germany and Estonia) and coal-fired power plants (in Germany).
The last—eighth group consists of one country, Iceland. The Icelandic electric energy policy and the directions of its transformation, similarly as in the case of Denmark, deviate from those of the other European countries. Iceland has a huge geothermal potential resulting from the geographic location of this country in a hot spot of the Mid-Atlantic Ridge. The country is mountainous and volcanic, with a high annual precipitation total, thanks to which Iceland has abundant water resources, which are used also for energy generation purposes. The geothermal resources of that country are used both to generate electricity and to produce hot utility water that can be introduced to the heat distribution network [80]. Within the last two decades, the volume of electricity production from geothermal energy has been increasing systematically, mainly thanks to the increased demand for electricity in the energy-consuming industry [81]. Together with the growing share of geothermal energy in electricity production, the amount of electricity produced in hydropower plants has been decreasing.
3.4. Environmental Impact of Electricity Production in the Years 1990–2020
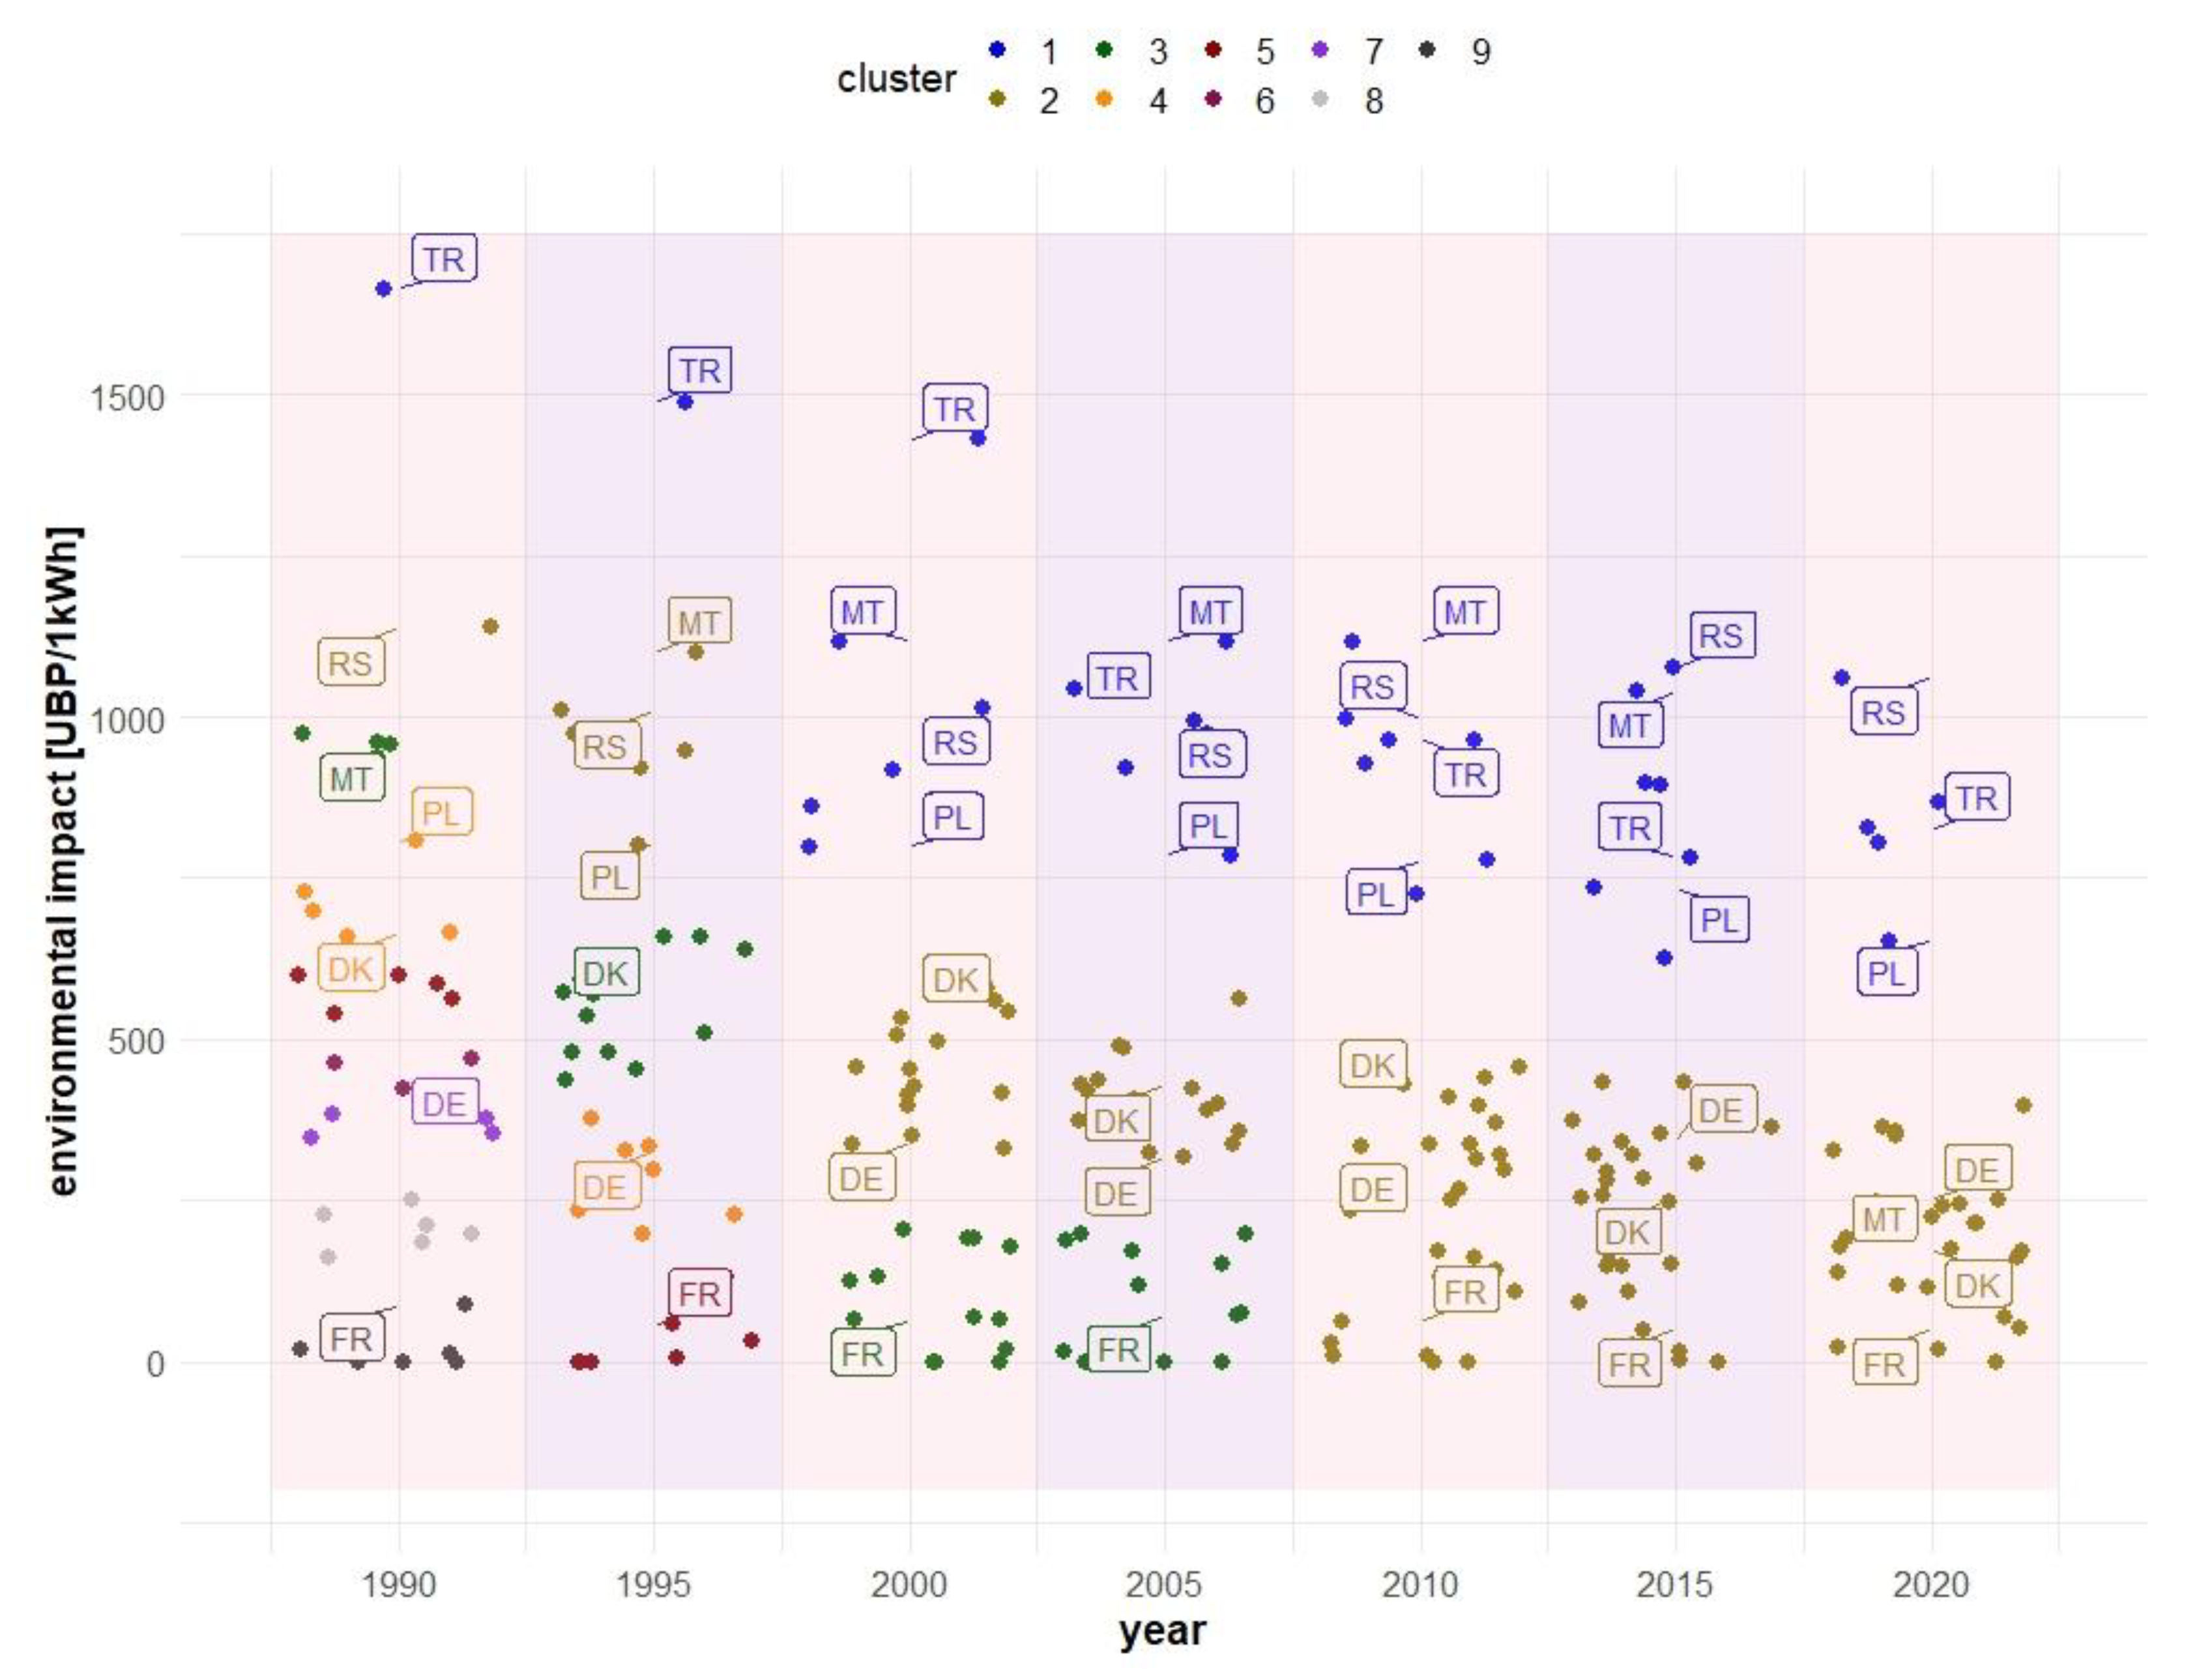
The above-mentioned changes in the structure of electricity production observed in the period of 1990–2020 constitute the basis for determining the environmental impact of electric energy production in the analyzed European countries. The calculated level of this impact was expressed in UBP/1 kWh of produced electricity considered when estimating environmental impacts—the production of 1 kWh of electricity from various sources in accordance with the production structure in a given country in a given year (Figure 5).
The analysis of the presented results indicates a gradual reduction in the environmental impact of electricity production in Europe. By the end of the 20th century, Turkey was a definite leader in terms of the environmental impact of electricity production. Between 1990 and 1995, the volume of this impact per 1 kWh of produced energy was 1650 and 1490 UBP, respectively. These values were markedly higher than those in the other European countries, and thus, Turkey constituted a single-element cluster of the countries with the greatest environmental impact on electric energy generation. The high level of the electric energy sector impact in Turkey results from the considerable share of lignite in electricity production since, until 2000, it accounted for 1/3 of the electricity produced in that country. In the later 1990s, the process of a gradual shift from coal to natural gas was initiated in the Turkish economy. In the period of 1985–2003, the share of gas-fired power plants increased from 17% to 45% [82]. This resulted in a marked reduction in the environmental impact of the Turkish energy sector.
Denmark is an example of a country, to an even greater extent than Turkey, has limited the environmental impact of energy production. The level of this impact calculated for the 1990s (when the Danish electric energy sector was based primarily on hard coal) was approx. 660 UBP/1 kWh. Thanks to the energy transformation initiated in the early 21st century, the environmental impact calculated based on the structure of production in 2015 was 255 UBP/1 kWh, while in 2020, it was 175 UBP/1 kWh. The observed change results from the Danish energy policy, which since the late 1990s has been supporting wind power and, in later years, other technologies of renewable energy production [83].
A considerable change in the level of environmental impact was also observed in the period of 2015–2020 in Malta. As late as 2015, Malta, producing electric energy primarily from crude oil and petroleum products (93% share), belonged to the group of countries with the greatest environmental impact in their energy sector. The transition from crude oil to natural gas as an energy carrier, which took place in the period of 2015–2020, caused a reduction in the environmental impact from 1038 UBP/1 kWh in 2015 to 242 UBP/1 kWh in 2020.
The group of countries with the smallest environmental impact on electricity production included Iceland, Norway, and Albania. The low impact of energy production in these countries is connected with a very high share of hydropower plants in the structure of energy production. According to the method of estimating the UBP value, the production of electricity in hydropower plants (considering the entire life cycle) leads to the smallest environmental impact among all the energy sources.
Based on the estimated values, the grouping of countries was conducted by applying k-means clustering. The calculated values of the index indicate that for values calculated for 1990, the optimal number of clusters considering the environmental impact of the power industry was nine. The volume of the impact determined for the successive years shows a gradual reduction in the number of groups of countries. The values of the environmental impact calculated for the structure of production in 1995 distinguished five groups of countries for those of 2000 and 2005, three groups, while for the production structure from 2010, 2015, and 2020 it was only two. The statistical differences between the objects belonging to neighboring clusters were verified using the Mann–Whitney U test.
The decreasing number of groups is a consequence of the gradually diminishing differences in the environmental impact of electricity production resulting from the transformation of the electric energy production sector in Europe in the 21st century. The increased importance of renewable energy sources, particularly in the case of countries that previously produced energy using fossil fuels, has led to a reduced impact on the electric energy sector. The median of the environmental impact that was determined based on the structure of production in 1990 for the analyzed countries was 464 UBP/1 kWh. In the following years, the value of the median was 413 UBP/1 kWh (for the structure in 2000), 322 UBP/1 kWh (for the structure of 2010), and 204 UBP/1 kWh (for the structure in 2020). The presented values indicate the appropriate character of the energy policy implemented in Europe and are aimed at the limitation of the environmental impact of the power generation sector.
4. Discussion
The presented calculation results concerning the identification of homogeneous groups of countries in terms of the changes taking place in the electric energy production system during the period of 1990–2020 are not consistent with the findings published by Brodny and Tukat [84], whose aim was based on the k-means method to isolate groups of EU countries that are similar in terms of the structure and volume of energy production using renewable energy sources, as well as depending on the GDP values of a given country, per capita, and in relation to the country’s area. The results of the calculations presented by those authors indicate that the analyzed countries may be divided into four groups comprising Austria, Italy, Sweden, and France (group 1), Great Britain and Spain (group 2), Germany (group 3), and the other 21 countries UE (group 4). The analysis conducted by those authors covered a less numerous population of countries but also included other variables than those considered in this study.
The similarity of countries in terms of their development of renewable energy sources based on analysis applying the Ward method was also presented in a study by Miłek, Nowak, and Latosińska [85]. According to those authors, on the basis of nine variables describing the share of energy generated from renewable energy sources and the installed power of plants using renewable sources, European countries may be divided into the four following groups (results for 2020):
- -
- Group 1 of eight elements comprising Malta, Luxemburg, Cyprus, Hungary, Czechia, Poland, the Netherlands, and Belgium;
- -
- Group 2 of eight elements comprising Lithuania, Estonia, Italy, Spain, Greece, Germany, Ireland, and Denmark;
- -
- Group 3 of five elements consisting of Slovakia, Slovenia, Romania, France, and Bulgaria;
- -
- Group 4 of five elements composed of Finland, Latvia, Austria, Portugal, and Croatia.
When comparing the presented clustering results with those given in this study, we may indicate groups of countries, which in both studies were classified into the same clusters: France-Bulgaria-Romania, Germany-Italy-Estonia, Slovakia-Slovenia, Poland-Czechia, and Cyprus-Malta.
The differentiation in the level of sustainable development in the energy markets of the EU countries was also investigated by Bluszcz and Manowska [86]. According to those authors, the most divergent elements in cluster analysis considered the following set of diagnostic variables: the consumption of electricity generated from renewable energy sources per capita (TWH/person), the consumption of hard coal (million ton/person), and greenhouse gas emissions per capita, including Luxemburg as well as Sweden and Finland, which constitute clusters 1 and 2. The other 23 countries belong to two groups of 12 and 11 elements, respectively. Similarly, as before, the same group comprises the following pairs of countries: Czechia-Poland, Germany-Estonia, and France-Romania.
The analysis conducted using the taxonomic methods based on 15 indicators describing energy consumption both from conventional sources and those generated from renewables in the European Union in 2019 indicates that among the European countries, there are some which use both traditional and renewable sources (the Netherlands, Germany, Austria, Italy): those which rely on one energy source and use solely traditional energy carriers (Poland), or those, which in their production structure use primarily renewable sources (Sweden, Finland) [87].
In turn, considering the set of Eurostat indicators from the sections factors for climate change and the environment and energy, the optimal number of clusters for the 27 EU countries was 10. The most numerous group was Czechia, Slovenia, Hungary, Romania, Bulgaria, Malta, and Greece. The next cluster consisted of Sweden, Finland, Portugal, Belgium, and Austria. They were classified into one group mainly due to the comparable level of pollutant emissions and their key share of renewable energy sources in electricity production. A separate group contained Ireland and Luxemburg due to their very similar structure of energy source used, in which crude oil is a total of 50% of the energy mix. Similarly, as in the case of this analysis, Denmark forms a separate group, while Finland and Sweden are classified in the same group [88].
The grouping procedure conducted using the taxonomic methods for European countries depending on the emission levels of their economies and their socio-economic potential in terms of energy transformation indicate the possibility of distinguishing four groups of countries. Group 1, comprising countries with a considerable share of renewable energy sources in electricity production and a very limited reliance on external energy sources, included Estonia, Finland, and Sweden. An opposite group was that of 12 countries (mainly CEEs) which are, to a considerable extent, dependent on the import of energy and based on conventional energy sources, primarily coal or gas [89]. Based on the comparison of the degree of use for renewable energy sources in 10 countries that were new EU members, they may be divided into four groups [90]. The most numerous, based on data from 2019, comprised Romania, Slovenia, Latvia, and Slovakia, i.e., countries with an over 60% share of renewable energy production from hydropower plants in the total production of renewable energy. For this reason, similarly to this study, Slovenia and Slovakia were classified in the same group of countries.
The classification of EU countries was conducted based on data from 2020 concerning the use of renewable sources and indicated that [91]:
- -
- The Scandinavian countries Sweden, Finland, and Denmark were characterized by a high level of renewable energy use (group 1);
- -
- Six countries had a medium-high level of renewable energy use in 2020—these included Austria, Germany, Estonia, Portugal, Luxemburg, and Latvia (group 2);
- -
- The largest number of EU countries were classified in the group with a medium-low use of renewable energy sources (group 3);
- -
- Only Poland was found in the group with a low level of renewable energy use (group 4).
The above results of grouping European countries were calculated based on various sets of diagnostic variables describing sample populations of different sizes for different periods of analysis. For this reason, these results may not be compared directly. Despite these differences, we may observe the following regularities, which were also confirmed by the results presented in this study:
- -
- A high similarity in the electric energy systems of the countries of northern Europe—particularly Sweden, Finland, and Denmark, at a simultaneous difference in comparison to the electric energy systems of the other European countries;
- -
- The grouping of countries with a considerable share of nuclear power into one cluster—France, Romania, Bulgaria;
- -
- The similarity of the electric energy systems of the countries traditionally relying on coal for their electricity production—e.g., Poland and Czechia.
The structure of electricity production in individual countries affects the level of the environmental impact of the electric energy sector. The increased importance of renewable energy sources has contributed to a reduction in the environmental impact of electricity production. The calculations presented in this study indicate that countries with the greatest environmental impact in their energy sector are those whose energy mix was based first of all on fossil fuels. Similar conclusions may be found in a study by Krebs Frischknecht, who determined the environmental impact of energy production in European countries based on data from 2018 [92]. According to the presented results of this analysis, the countries with the greatest environmental impact included Cyprus with 897 UBP/1 kWh (environmental impact calculated in this paper according to its structure in 2015 was 949 UBP/1 kWh), Malta with 856 UBP/1 kWh (in this paper 1038 UBP/1 kWh), and Poland with 847 UBP/1 kWh (here 735 UBP/1 kWh). The smallest environmental impact was recorded for the energy mixes of Austria −170 UBP/1 kWh (in this study 91 UBP/1 kWh), Sweden—243 UBP/1 kWh (here 165 UBP/1 kWh), and Lithuania with 292 UBP/1 kWh (here 280 UBP/1 kWh). Despite the use of different sources of data and analyses, which were conducted by applying different methods, both studies show high consistency in terms of the estimated environmental impact.
5. Conclusions
In view of the negative phenomena observed in the last several years in relation to climate change, the further global economic growth based on the use of fossil fuels has led to increasing environmental pollution, which is neither viable nor feasible. Projections concerning the condition of the natural environment for the next few years indicate the need to implement considerable and rapid changes leading to increased use of renewable energy sources. This trend has additionally been confirmed by the events of the last several months and the war in Ukraine. Energy transformation in Europe is becoming not only an environmental but also a political challenge, thanks to which it will be possible not only to reduce the environmental impact of the electric energy sector, but also a chance for European countries to become independent of Russian energy carriers—primarily crude oil, natural gas, and hard coal. In view of the current uncertainty of energy supplies, we need to emphasize the necessity of diversifying energy sources in order to ensure the highest possible level of energy security as a guarantee of further socio-economic growth.
The results of the analysis presented in this paper provide grounds for the formulation of the following opinions:
- -
- In the period 1990–2020, considerable changes were observed in the structure of energy carriers used in electricity generation;
- -
- The attempts to achieve sustainable development and the realization of successive environmental goals formulated by the EU resulted in the increased role of renewable energy sources in the energy mix of individual countries;
- -
- However, diversification is also observed in the directions of occurring changes—on this basis, eight groups of varying numbers of countries with similar directions of energy transformation were observed;
- -
- At the turn of the 20th and 21st centuries, the primary renewable source used in Europe to produce electricity was hydropower. Technological progress, as well as the reduction in the level of investment outlays, has resulted in the increased importance of other renewable energy sources: mainly solar and wind power;
- -
- The type of used renewable energy sources depends mainly on the climate and geographic conditions of a given country;
- -
- As a result of energy transformation, the level of environmental impact on the power sector decreased.
- -
- Due to an increase in the role of renewable energy sources in terms of the level of environmental impact caused by electricity production, European countries are becoming increasingly similar. A consequence is a reduced number of groups of countries from eight in 1990 to two in 2020.
- -
- Still, in Europe, we may indicate countries that use coal to generate electricity. |The level of the environmental impact of electricity production in the group of these countries is the greatest.
The presented research results may prove useful when establishing strategic directions of energy transformation considering common climate goals and economic integration. The energy policy has a strategic effect on reaching the assumed climate goals, thus the indication of the diverse aims for the identified groups of countries seems to be a measure that will facilitate the optimization of common environmental goals.
The research results presented in this paper concerning the similarities between European countries in terms of energy transformation occurring in the period of 1990–2020 broadens our knowledge of the structure of energy markets not only in the European Union itself but also in countries aspiring to join it, such as Turkey, Serbia, North Macedonia, and Ukraine. The research results make it possible to conduct a multi-criterion division of countries into similar groups, constituting the basis for the construction of similar scenarios for the further transformation of energy markets in these countries, aiming to reach common environmental goals. The indicated similarities of energy markets based on the used energy mix may become a key aspect for strategic actions that aim at the construction of further development models for selected groups. An important aspect of this study was also to show the diversity of European countries, which may influence the rate of integration for energy markets: a process occurring for many years now within the European Union.
These research results may constitute a valuable source of information for public and EU institutions as well as individual European countries when creating and implementing energy and environmental policies. Decision makers may use the results presented in this study when making decisions on the allocation of public funds considering the current situation and the realization of EU priorities. In view of the current situation in Europe, the authors are planning to continue this line of research considering the ongoing changes in the structure of energy production in Europe as a consequence of the war in Ukraine. The analysis conducted within this study is limited to synthetic indicators for environmental impact and is based on the statistical data available for individual countries. Further research needs to consider to a greater extent the specific character of individual countries as well as the interactions between various environmental factors, including individual categories of such impact, i.e., human health or ecosystem quality. In this context, it is advisable to conduct further studies on changes in the environmental impact of electricity generation on the scale of individual countries and regions.
Author Contributions
Conceptualization, M.B., J.M. and A.S.; methodology, M.B., J.M. and A.S.; formal analysis, M.B.; writing—original draft preparation, M.B. and A.S.; writing—review and editing, J.M. All authors have read and agreed to the published version of the manuscript.
Funding
This research received no external funding.
Institutional Review Board Statement
Not applicable.
Informed Consent Statement
Not applicable.
Data Availability Statement
Not applicable.
Conflicts of Interest
The authors declare no conflict of interest.
References
- Rokicki, T.; Perkowska, A. Diversity and Changes in the Energy Balance in EU Countries. Energies 2021, 14, 1098. [Google Scholar] [CrossRef]
- Jonek-Kowalska, I. Transformation of Energy Balances with Dominant Coal Consumption in European Economies and Turkey in the Years 1990–2017. Oeconomia Copernic. 2019, 10, 627–647. [Google Scholar] [CrossRef] [Green Version]
- Kacperska, E.; Łukasiewicz, K.; Pietrzak, P. Use of Renewable Energy Sources in the European Union and the Visegrad Group Countries—Results of Cluster Analysis. Energies 2021, 14, 5680. [Google Scholar] [CrossRef]
- Kitzing, L.; Mitchell, C.; Morthorst, P.E. Renewable Energy Policies in Europe: Converging or Diverging? Energy Policy 2012, 51, 192–201. [Google Scholar] [CrossRef] [Green Version]
- Martins, F.; Felgueiras, C.; Smitkova, M.; Caetano, N. Analysis of Fossil Fuel Energy Consumption and Environmental Impacts in European Countries. Energies 2019, 12, 964. [Google Scholar] [CrossRef] [Green Version]
- Abdelkareem, M.A.; Elsaid, K.; Wilberforce, T.; Kamil, M.; Sayed, E.T.; Olabi, A. Environmental Aspects of Fuel Cells: A Review. Sci. Total Environ. 2021, 752, 141803. [Google Scholar] [CrossRef] [PubMed]
- Nugent, D.; Sovacool, B.K. Assessing the Lifecycle Greenhouse Gas Emissions from Solar PV and Wind Energy: A Critical Meta-Survey. Energy Policy 2014, 65, 229–244. [Google Scholar] [CrossRef]
- Salvador, R.; Barros, M.V.; Rosário, J.G.D.P.D.; Piekarski, C.M.; da Luz, L.M.; de Francisco, A.C. Life Cycle Assessment of Electricity from Biogas: A Systematic Literature Review. Environ. Prog. Sustain. Energy 2019, 38, 13133. [Google Scholar] [CrossRef]
- Barros, M.V.; Salvador, R.; Piekarski, C.M.; de Francisco, A.C.; Freire, F.M.C.S. Life Cycle Assessment of Electricity Generation: A Review of the Characteristics of Existing Literature. Int. J. Life Cycle Assess. 2020, 25, 36–54. [Google Scholar] [CrossRef]
- Mehrtash, M.; Capitanescu, F.; Heiselberg, P.K.; Gibon, T.; Bertrand, A. An Enhanced Optimal PV and Battery Sizing Model for Zero Energy Buildings Considering Environmental Impacts. IEEE Trans. Ind. Appl. 2020, 56, 6846–6856. [Google Scholar] [CrossRef]
- Mehrtash, M.; Capitanescu, F.; Heiselberg, P.K.; Gibon, T. A New Bi-Objective Approach for Optimal Sizing of Electrical and Thermal Devices in Zero Energy Buildings Considering Environmental Impacts. IEEE Trans. Sustain. Energy 2020, 12, 886–896. [Google Scholar] [CrossRef]
- Bórawski, P.; Bełdycka-Bórawska, A.; Szymańska, E.J.; Jankowski, K.J.; Dubis, B.; Dunn, J.W. Development of Renewable Energy Sources Market and Biofuels in The European Union. J. Clean. Prod. 2019, 228, 467–484. [Google Scholar] [CrossRef]
- Child, M.; Kemfert, C.; Bogdanov, D.; Breyer, C. Flexible Electricity Generation, Grid Exchange and Storage for the Transition to a 100% Renewable Energy System in Europe. Renew. Energy 2019, 139, 80–101. [Google Scholar] [CrossRef]
- Lowitzsch, J.; Hoicka, C.E.; van Tulder, F.J. Renewable Energy Communities under the 2019 European Clean Energy Package—Governance Model for the Energy Clusters of the Future? Renew. Sustain. Energy Rev. 2020, 122, 109489. [Google Scholar] [CrossRef]
- Jacobson, M.Z.; Delucchi, M.A. Providing All Global Energy with Wind, Water, and Solar Power, Part I: Technologies, Energy Resources, Quantities and Areas of Infrastructure, and Materials. Energy Policy 2011, 39, 1154–1169. [Google Scholar] [CrossRef]
- Delucchi, M.A.; Jacobson, M.Z. Providing All Global Energy with Wind, Water, and Solar Power, Part II: Reliability, System and Transmission Costs, and Policies. Energy Policy 2011, 39, 1170–1190. [Google Scholar] [CrossRef]
- Association, E.P.I. Connecting the Sun. Solar Photovoltaics on the Road to Large-Scale Grid Integration; European Photovoltaic Industry Association: Brussels, Belgium, 2012. [Google Scholar]
- Van De Putte, J.; Short, R.; Beranek, J.; Thies, F.; Teske, S.; Dawe, A.; Hunter, J. Battle of the Grids. How Europe Can Go 100% Renewable and Phase out Dirty Energy; Greenpeace International: Amsterdam, The Netherlands, 2011. [Google Scholar]
- Cho, A. Energy’s Tricky Tradeoffs. Science 2010, 329, 786–787. [Google Scholar] [CrossRef]
- Gils, H.C.; Scholz, Y.; Pregger, T.; de Tena, D.L.; Heide, D. Integrated Modelling of Variable Renewable Energy-Based Power Supply in Europe. Energy 2017, 123, 173–188. [Google Scholar] [CrossRef] [Green Version]
- Rodriguez, R.A.; Becker, S.; Andresen, G.B.; Heide, D.; Greiner, M. Transmission Needs across a Fully Renewable European Power System. Renew. Energy 2014, 63, 467–476. [Google Scholar] [CrossRef] [Green Version]
- Łukasiewicz, K.; Pietrzak, P.; Kraciuk, J.; Kacperska, E.; Cieciora, M. Sustainable Energy Development—A Systematic Literature Review. Energies 2022, 15, 8284. [Google Scholar] [CrossRef]
- Hainsch, K.; Löffler, K.; Burandt, T.; Auer, H.; del Granado, P.C.; Pisciella, P.; Zwickl-Bernhard, S. Energy Transition Scenarios: What Policies, Societal Attitudes, and Technology Developments Will Realize the EU Green Deal? Energy 2022, 239, 122067. [Google Scholar] [CrossRef]
- Capros, P.; Zazias, G.; Evangelopoulou, S.; Kannavou, M.; Fotiou, T.; Siskos, P.; De Vita, A.; Sakellaris, K. Energy-System Modelling of the EU Strategy towards Climate-Neutrality. Energy Policy 2019, 134, 110960. [Google Scholar] [CrossRef]
- Seyfang, G.; Park, J.J.; Smith, A. A Thousand Flowers Blooming? An Examination of Community Energy in the UK. Energy Policy 2013, 61, 977–989. [Google Scholar] [CrossRef]
- Bauwens, T.; Gotchev, B.; Holstenkamp, L. What Drives the Development of Community Energy in Europe? The Case of Wind Power Cooperatives. Energy Res. Soc. Sci. 2016, 13, 136–147. [Google Scholar] [CrossRef]
- Gökgöz, F.; Güvercin, M.T. Energy Security and Renewable Energy Efficiency in EU. Renew. Sustain. Energy Rev. 2018, 96, 226–239. [Google Scholar] [CrossRef]
- Khattak, M.A.; Ayoub, M.A.H.; Manaf, M.A.F.A.; Mahru, M.F.; Juhari, M.R.M.; Mustaffa, M.I.; Kazi, S. Global Energy Security and European Union: A Review. J. Adv. Res. Appl. Sci. Eng. Technol. 2018, 11, 64–81. [Google Scholar]
- Matsumoto, K.; Doumpos, M.; Andriosopoulos, K. Historical Energy Security Performance in EU Countries. Renew. Sustain. Energy Rev. 2018, 82, 1737–1748. [Google Scholar] [CrossRef]
- Bajan, B.; Łukasiewicz, J.; Mrówczyńska-Kamińska, A. Energy Consumption and Its Structures in Food Production Systems of the Visegrad Group Countries Compared with Eu-15 Countries. Energies 2021, 14, 3945. [Google Scholar] [CrossRef]
- Moutinho, V.; Madaleno, M.; Inglesi-Lotz, R.; Dogan, E. Factors Affecting CO2 Emissions in Top Countries on Renewable Energies: A LMDI Decomposition Application. Renew. Sustain. Energy Rev. 2018, 90, 605–622. [Google Scholar] [CrossRef] [Green Version]
- Shahsavari, A.; Akbari, M. Potential of Solar Energy in Developing Countries for Reducing Energy-Related Emissions. Renew. Sustain. Energy Rev. 2018, 90, 275–291. [Google Scholar] [CrossRef]
- Miskinis, V.; Galinis, A.; Konstantinaviciute, I.; Lekavicius, V.; Neniskis, E. Comparative Analysis of the Energy Sector Development Trends and Forecast of Final Energy Demand in the Baltic States. Sustainability 2019, 11, 521. [Google Scholar] [CrossRef]
- Galinis, A.; Martišauskas, L.; Jääskeläinen, J.; Olkkonen, V.; Syri, S.; Avgerinopoulos, G.; Lekavičius, V. Implications of Carbon Price Paths on Energy Security in Four Baltic Region Countries. Energy Strategy Rev. 2020, 30, 100509. [Google Scholar] [CrossRef]
- Rokach, L.; Maimon, O. Clustering Methods Data Mining and Knowledge Discovery Handbook; Springer: Berlin/Heidelberg, Germany, 2005; pp. 321–352. [Google Scholar]
- Yu, S.-S.; Chu, S.-W.; Wang, C.-M.; Chan, Y.-K.; Chang, T.-C. Two Improved K-Means Algorithms. Appl. Soft Comput. 2018, 68, 747–755. [Google Scholar] [CrossRef]
- MacQueen, J. Classification and Analysis of Multivariate Observations. In Proceedings of the 5th Berkeley Symposium on Mathematical Statistics and Probability, Davis, CA, USA, 21 June–18 July 1967; pp. 281–297. [Google Scholar]
- Murtagh, F.; Legendre, P. Ward’s Hierarchical Agglomerative Clustering Method: Which Algorithms Implement Ward’s Criterion? J. Classif. 2014, 31, 274–295. [Google Scholar] [CrossRef] [Green Version]
- Le Roux, B.; Rouanet, H. Geometric Data Analysis: From Correspondence Analysis to Structured Data Analysis; Springer Science & Business Media: Berlin/Heidelberg, Germany, 2004. [Google Scholar]
- Krislock, N.; Wolkowicz, H. Euclidean Distance Matrices and Applications. In Handbook on Semidefinite, Conic and Polynomial Optimization; Springer: Berlin/Heidelberg, Germany, 2012; pp. 879–914. [Google Scholar]
- Mohamad, I.B.; Usman, D. Standardization and Its Effects on K-Means Clustering Algorithm. Res. J. Appl. Sci. Eng. Technol. 2013, 6, 3299–3303. [Google Scholar] [CrossRef]
- Dunn, J.C. Well-Separated Clusters and Optimal Fuzzy Partitions. J. Cybern. 1974, 4, 95–104. [Google Scholar] [CrossRef]
- Jajuga, K.; Najman, K.; Walesiak, M. Data Analysis and Classification; Springer: Berlin/Heidelberg, Germany, 2021. [Google Scholar]
- Arbelaitz, O.; Gurrutxaga, I.; Muguerza, J.; Pérez, J.M.; Perona, I. An Extensive Comparative Study of Cluster Validity Indices. Pattern Recognit. 2013, 46, 243–256. [Google Scholar] [CrossRef]
- Tambunan, H.B.; Barus, D.H.; Hartono, J.; Alam, A.S.; Nugraha, D.A.; Usman, H.H.H. Electrical Peak Load Clustering Analysis Using K-Means Algorithm and Silhouette Coefficient. In Proceedings of the 2020 International Conference on Technology and Policy in Energy and Electric Power (ICT-PEP), Jakarta, Indonesia, 23–24 September 2020; IEEE: Piscataway, NJ, USA, 2020; pp. 258–262. [Google Scholar]
- Açar, T.S.; Öz, N.A. The Determination of Optimal Cluster Number by Silhouette Index at Clustering of the European Union Member Countries and Candidate Turkey by Waste Indicators. Pamukkale Üniversitesi Mühendis. Bilim. Derg. 2020, 26, 481–487. [Google Scholar]
- Rousseeuw, P.J. Silhouettes: A Graphical Aid to the Interpretation and Validation of Cluster Analysis. J. Comput. Appl. Math. 1987, 20, 53–65. [Google Scholar] [CrossRef] [Green Version]
- Müller-Wenk, R. Die Ökologische Buchhaltung: Ein Informations-u. Steuerungsinstrument für Umweltkonforme Unternehmenspolitik. Hrsg. von d. Stiftung Gesellschaft u. Unternehmen; Campus: Frankfurt, Germany, 1978. [Google Scholar]
- Ahbe, S.; Weihofen, S.; Wellge, S. The Ecological Scarcity Method for the European Union: A Volkswagen Research Initiative: Environmental Assessments; Springer Nature: London, UK, 2017. [Google Scholar]
- Frischknecht, R.; Knöpfel, S.B. Swiss Eco-Factors 2013 According to the Ecological Scarcity Method; Federal Office for the Environment: Bern, Switzerland, 2013. [Google Scholar]
- Grinberg, M.; Ackermann, R.; Finkbeiner, M. Ecological Scarcity Method: Adaptation and Implementation for Different Countries. Rigas Teh. Univ. Zinat. Raksti 2013, 10, 9. [Google Scholar] [CrossRef] [Green Version]
- Lambrecht, H.; Lewerenz, S.; Hottenroth, H.; Tietze, I.; Viere, T. Ecological Scarcity Based Impact Assessment for a Decentralised Renewable Energy System. Energies 2020, 13, 5655. [Google Scholar] [CrossRef]
- Pilpola, S.; Arabzadeh, V.; Mikkola, J.; Lund, P.D. Analyzing National and Local Pathways to Carbon-Neutrality from Technology, Emissions, and Resilience Perspectives—Case of Finland. Energies 2019, 12, 949. [Google Scholar] [CrossRef]
- Turconi, R.; Boldrin, A.; Astrup, T. Life Cycle Assessment (LCA) of Electricity Generation Technologies: Overview, Comparability and Limitations. Renew. Sustain. Energy Rev. 2013, 28, 555–565. [Google Scholar] [CrossRef] [Green Version]
- Nachar, N. The Mann-Whitney U: A Test for Assessing Whether Two Independent Samples Come from the Same Distribution. Tutor. Quant. Methods Psychol. 2008, 4, 13–20. [Google Scholar] [CrossRef] [Green Version]
- Gebremedhin, A.; Mariona, Z. Power System Analysis: The Case of Albania. Int. J. Innov. Technol. Interdiscip. Sci. 2020, 3, 501–512. [Google Scholar] [CrossRef]
- Holjevac, N.; Baškarad, T.; Daković, J.; Krpan, M.; Zidar, M.; Kuzle, I. Challenges of High Renewable Energy Sources Integration in Power Systems—The Case of Croatia. Energies 2021, 14, 1047. [Google Scholar] [CrossRef]
- Krajačić, G.; Duić, N.; da Graça Carvalho, M. How to Achieve a 100% RES Electricity Supply for Portugal? Appl. Energy 2011, 88, 508–517. [Google Scholar] [CrossRef]
- Peña, I.; Azevedo, I.L.; Ferreira, L.A.F.M. Lessons from Wind Policy in Portugal. Energy Policy 2017, 103, 193–202. [Google Scholar] [CrossRef]
- Report of the Conference of the Parties on Its Twenty-First Session, Held in Paris from 30 November to 13 December 2015; United Nations: New York, NY, USA, 2016.
- Hoogland, O.; Veenstra, E.; Vega, P.C.T.; Saastamoinen, H.; Kärki, J. Study on Impacts of EU Actions Supporting the Development of Renewable Energy Technologies: Technology Sector Report, Bioenergy; European Commission EC: Brussels, Belgium, 2019. [Google Scholar]
- Gaigalis, V.; Katinas, V. Analysis of the Renewable Energy Implementation and Prediction Prospects in Compliance with the EU Policy: A Case of Lithuania. Renew. Energy 2020, 151, 1016–1027. [Google Scholar] [CrossRef]
- Suharevska, K.; Blumberga, D. Progress in Renewable Energy Technologies: Innovation Potential in Latvia. Rigas Teh. Univ. Zinat. Raksti 2019, 23, 47–63. [Google Scholar] [CrossRef] [Green Version]
- Communication from the Commission to the European Parliament, the European Council, the Council, the European Economic and Social Committee and the Committee of the Regions the European Green Deal; European Commission EC: Brussels, Belgium, 2019.
- Burchart-Korol, D.; Pustejovska, P.; Blaut, A.; Jursova, S.; Korol, J. Comparative Life Cycle Assessment of Current and Future Electricity Generation Systems in the Czech Republic and Poland. Int. J. Life Cycle Assess. 2018, 23, 2165–2177. [Google Scholar] [CrossRef] [Green Version]
- Demetriou, E.; Mallouppas, G.; Hadjistassou, C. Embracing Carbon Neutral Electricity and Transportation Sectors in Cyprus. Energy 2021, 229, 120625. [Google Scholar] [CrossRef]
- Ossowska, L.J.; Janiszewska, D.A. Toward Sustainable Energy Consumption in the European Union. Polityka Energ. 2020, 23, 37–48. [Google Scholar] [CrossRef]
- Mukhtarov, S.; Yüksel, S.; Dinçer, H. The Impact of Financial Development on Renewable Energy Consumption: Evidence from Turkey. Renew. Energy 2022, 187, 169–176. [Google Scholar] [CrossRef]
- Nuclear Energy Agency. Technology Roadmap: Nuclear Energy 2015; Nuclear Energy Agency: Paris, France, 2015.
- Esty, D.C.; Levy, M.A.; Kim, C.H.; de Sherbinin, A.; Srebotnjak, T.; Mara, V. Environmental Performance Index. New Haven: Yale Center for Environmental Law and Policy Food and Agriculture Organization (2000) New Dimensions in Water Security; AGLMISC/25/2000; FAO: Rome, Italy, 2008. [Google Scholar]
- Shah, M.I.; Kirikkaleli, D.; Adedoyin, F.F. Regime Switching Effect of COVID-19 Pandemic on Renewable Electricity Generation in Denmark. Renew. Energy 2021, 175, 797–806. [Google Scholar] [CrossRef]
- Hvelplund, F.; Østergaard, P.A.; Meyer, N.I. Incentives and Barriers for Wind Power Expansion and System Integration in Denmark. Energy Policy 2017, 107, 573–584. [Google Scholar] [CrossRef]
- Lipp, J. Lessons for Effective Renewable Electricity Policy from Denmark, Germany and the United Kingdom. Energy Policy 2007, 35, 5481–5495. [Google Scholar] [CrossRef]
- Sun, K.; Xiao, H.; Liu, S.; You, S.; Yang, F.; Dong, Y.; Wang, W.; Liu, Y. A Review of Clean Electricity Policies—From Countries to Utilities. Sustainability 2020, 12, 7946. [Google Scholar] [CrossRef]
- Thomas, S. The British Model in Britain: Failing Slowly. Energy Policy 2006, 34, 583–600. [Google Scholar] [CrossRef] [Green Version]
- Safarzynska, K.; van den Bergh, J.C. Industry Evolution, Rational Agents and the Transition to Sustainable Electricity Production. Energy Policy 2011, 39, 6440–6452. [Google Scholar] [CrossRef]
- Rourke, F.O.; Boyle, F.; Reynolds, A. Renewable Energy Resources and Technologies Applicable to Ireland. Renew. Sustain. Energy Rev. 2009, 13, 1975–1984. [Google Scholar] [CrossRef] [Green Version]
- Joas, F.; Pahle, M.; Flachsland, C.; Joas, A. Which Goals Are Driving the Energiewende? Making Sense of the German Energy Transformation. Energy Policy 2016, 95, 42–51. [Google Scholar] [CrossRef]
- Monforti, F.; Huld, T.; Bódis, K.; Vitali, L.; D’isidoro, M.; Lacal-Arántegui, R. Assessing Complementarity of Wind and Solar Resources for Energy Production in Italy. A Monte Carlo Approach. Renew. Energy 2014, 63, 576–586. [Google Scholar] [CrossRef]
- Ragnarsson, Á.; Steingrímsson, B.; Thorhallsson, S. Geothermal Development in Iceland 2015–2019. In Proceedings of the World Geothermal Congress 2020+1, Reykjavik, Iceland, 24–27 October 2020; p. 1. [Google Scholar]
- Ragnarsson, Á. Geothermal Energy Use, Country Update for Iceland. In Proceedings of the European Geothermal Congress, Pisa, Italy, 3–7 June 2013; pp. 1–11. [Google Scholar]
- Yılmaz, A.O.; Uslu, T. Energy Policies of Turkey during the Period 1923–2003. Energy Policy 2007, 35, 258–264. [Google Scholar] [CrossRef]
- Ratinen, M.; Lund, P. Analysing Changes in Electricity Industries against Actors and Technologies: Utility to Business Transformations in Denmark, Germany, Finland and Spain. J. Technol. Manag. Innov. 2012, 7, 87–101. [Google Scholar] [CrossRef] [Green Version]
- Brodny, J.; Tutak, M. Analyzing Similarities between the European Union Countries in Terms of the Structure and Volume of Energy Production from Renewable Energy Sources. Energies 2020, 13, 913. [Google Scholar] [CrossRef] [Green Version]
- Miłek, D.; Nowak, P.; Latosińska, J. The Development of Renewable Energy Sources in the European Union in the Light of the European Green Deal. Energies 2022, 15, 5576. [Google Scholar] [CrossRef]
- Bluszcz, A.; Manowska, A. Differentiation of the Level of Sustainable Development of Energy Markets in the European Union Countries. Energies 2020, 13, 4882. [Google Scholar] [CrossRef]
- Chudy-Laskowska, K.; Pisula, T. An Analysis of the Use of Energy from Conventional Fossil Fuels and Green Renewable Energy in the Context of the European Union’s Planned Energy Transformation. Energies 2022, 15, 7369. [Google Scholar] [CrossRef]
- Rybak, A.; Rybak, A.; Joostberens, J.; Kolev, S.D. Cluster Analysis of the EU-27 Countries in Light of the Guiding Principles of the European Green Deal, with Particular Emphasis on Poland. Energies 2022, 15, 5082. [Google Scholar] [CrossRef]
- Pietrzak, M.B.; Olczyk, M.; Kuc-Czarnecka, M.E. Assessment of the Feasibility of Energy Transformation Processes in European Union Member States. Energies 2022, 15, 661. [Google Scholar] [CrossRef]
- Wałachowska, A.; Ignasiak-Szulc, A. Comparison of Renewable Energy Sources in ‘New’ EU Member States in the Context of National Energy Transformations. Energies 2021, 14, 7963. [Google Scholar] [CrossRef]
- Stec, M.; Grzebyk, M. Statistical Analysis of the Level of Development of Renewable Energy Sources in the Countries of the European Union. Energies 2022, 15, 8278. [Google Scholar] [CrossRef]
- Krebs, L.; Frischknecht, R. Life Cycle Assessment of GO Based Electricity Mixes of European Countries 2018; Federal Office for the Environment (FOEN): Bern, Switzerland, 2018. [Google Scholar]
Figure 1.
Changes in the structure of electricity production in Europe in the years 1990–2020.

Figure 2.
Share of electricity generated from fossil fuels in the years 1990–2020.

Figure 3.
Changes in the structure of electricity production—clusters 1–4.

Figure 4.
Changes in the structure of electricity production—clusters 5–8.

Figure 5.
The level of environmental impact of electricity production in Europe in the period of 1990–2020 [UBP/1 kWh].
Figure 5.
The level of environmental impact of electricity production in Europe in the period of 1990–2020 [UBP/1 kWh].

Disclaimer/Publisher’s Note: The statements, opinions and data contained in all publications are solely those of the individual author(s) and contributor(s) and not of MDPI and/or the editor(s). MDPI and/or the editor(s) disclaim responsibility for any injury to people or property resulting from any ideas, methods, instructions or products referred to in the content. |
© 2023 by the authors. Licensee MDPI, Basel, Switzerland. This article is an open access article distributed under the terms and conditions of the Creative Commons Attribution (CC BY) license (https://creativecommons.org/licenses/by/4.0/).
Share and Cite
MDPI and ACS Style
Bukowski, M.; Majewski, J.; Sobolewska, A. The Environmental Impact of Changes in the Structure of Electricity Sources in Europe. Energies 2023, 16, 501. https://doi.org/10.3390/en16010501
AMA Style
Bukowski M, Majewski J, Sobolewska A. The Environmental Impact of Changes in the Structure of Electricity Sources in Europe. Energies. 2023; 16(1):501. https://doi.org/10.3390/en16010501
Chicago/Turabian StyleBukowski, Marcin, Janusz Majewski, and Agnieszka Sobolewska. 2023. "The Environmental Impact of Changes in the Structure of Electricity Sources in Europe" Energies 16, no. 1: 501. https://doi.org/10.3390/en16010501
Note that from the first issue of 2016, this journal uses article numbers instead of page numbers. See further details here.