
Optimization of Urban-Scale Sustainable Energy Strategies to Improve Citizens’ Health

 ,
, 
 ,
,  ,
,  and
and 
Abstract
:1. Introduction
2. Literature Review
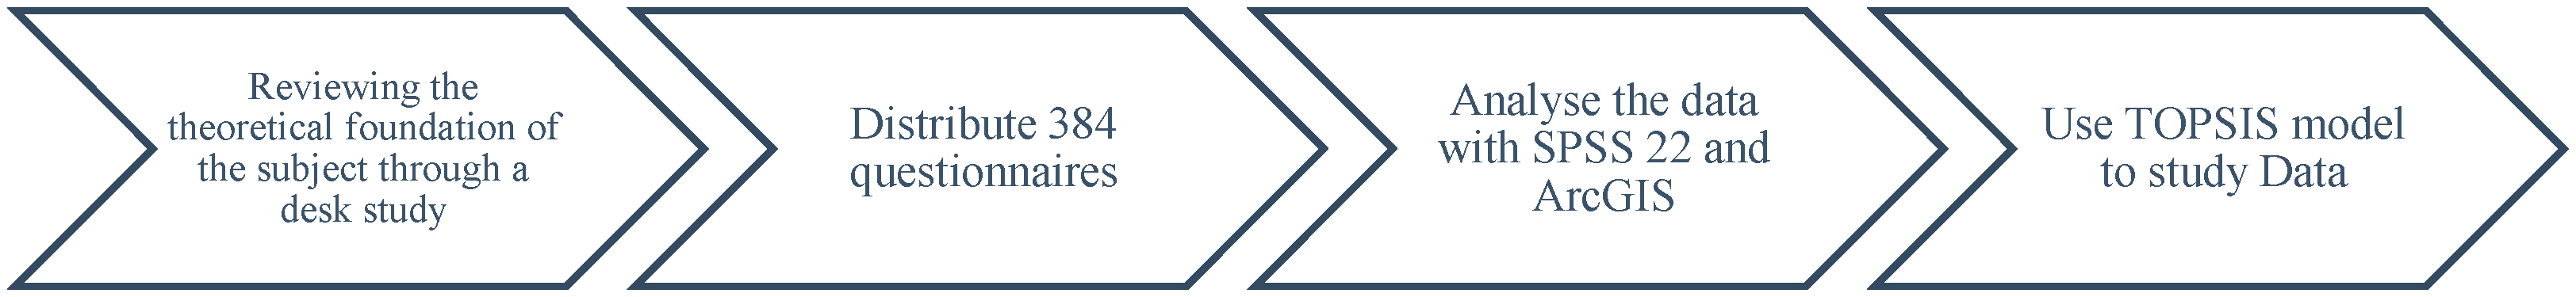
3. Materials and Methods
4. Results
4.1. Distribution of Research Variables
- H0: Data in the distribution are not normal.
- H1: Data in the distribution are normal.
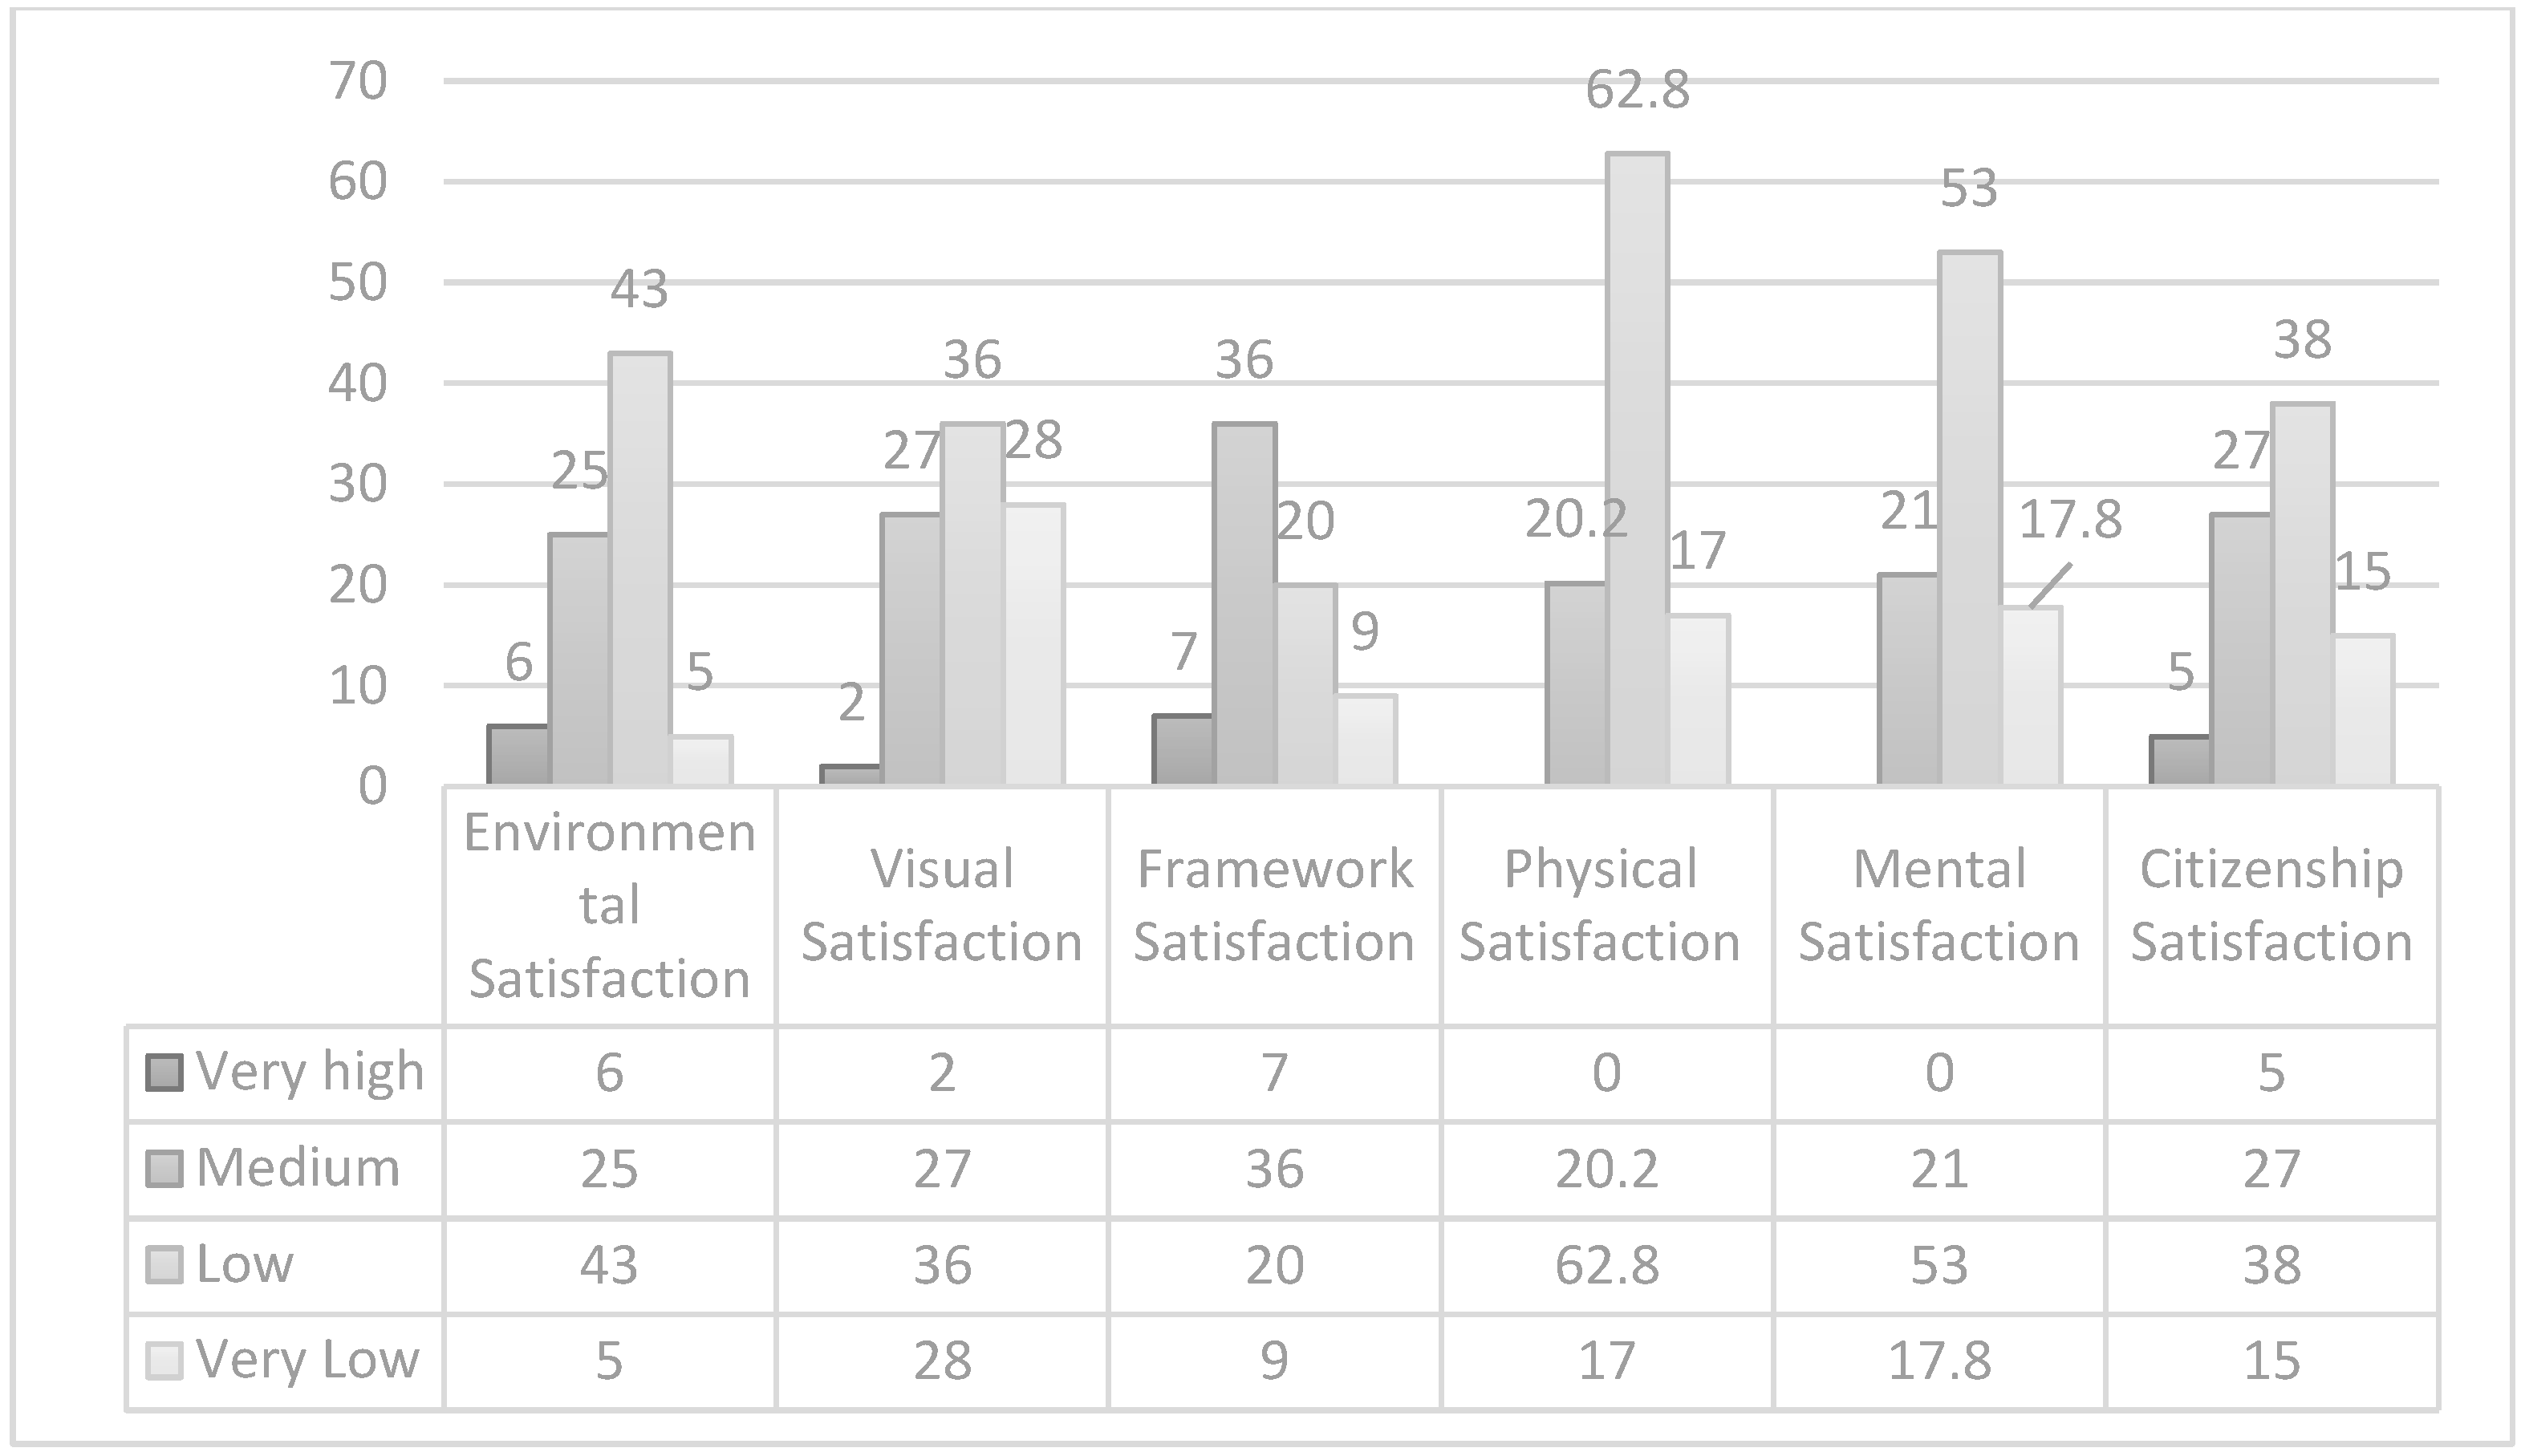
4.2. Impact of Environmental Quality Factors on Respondents’ Health
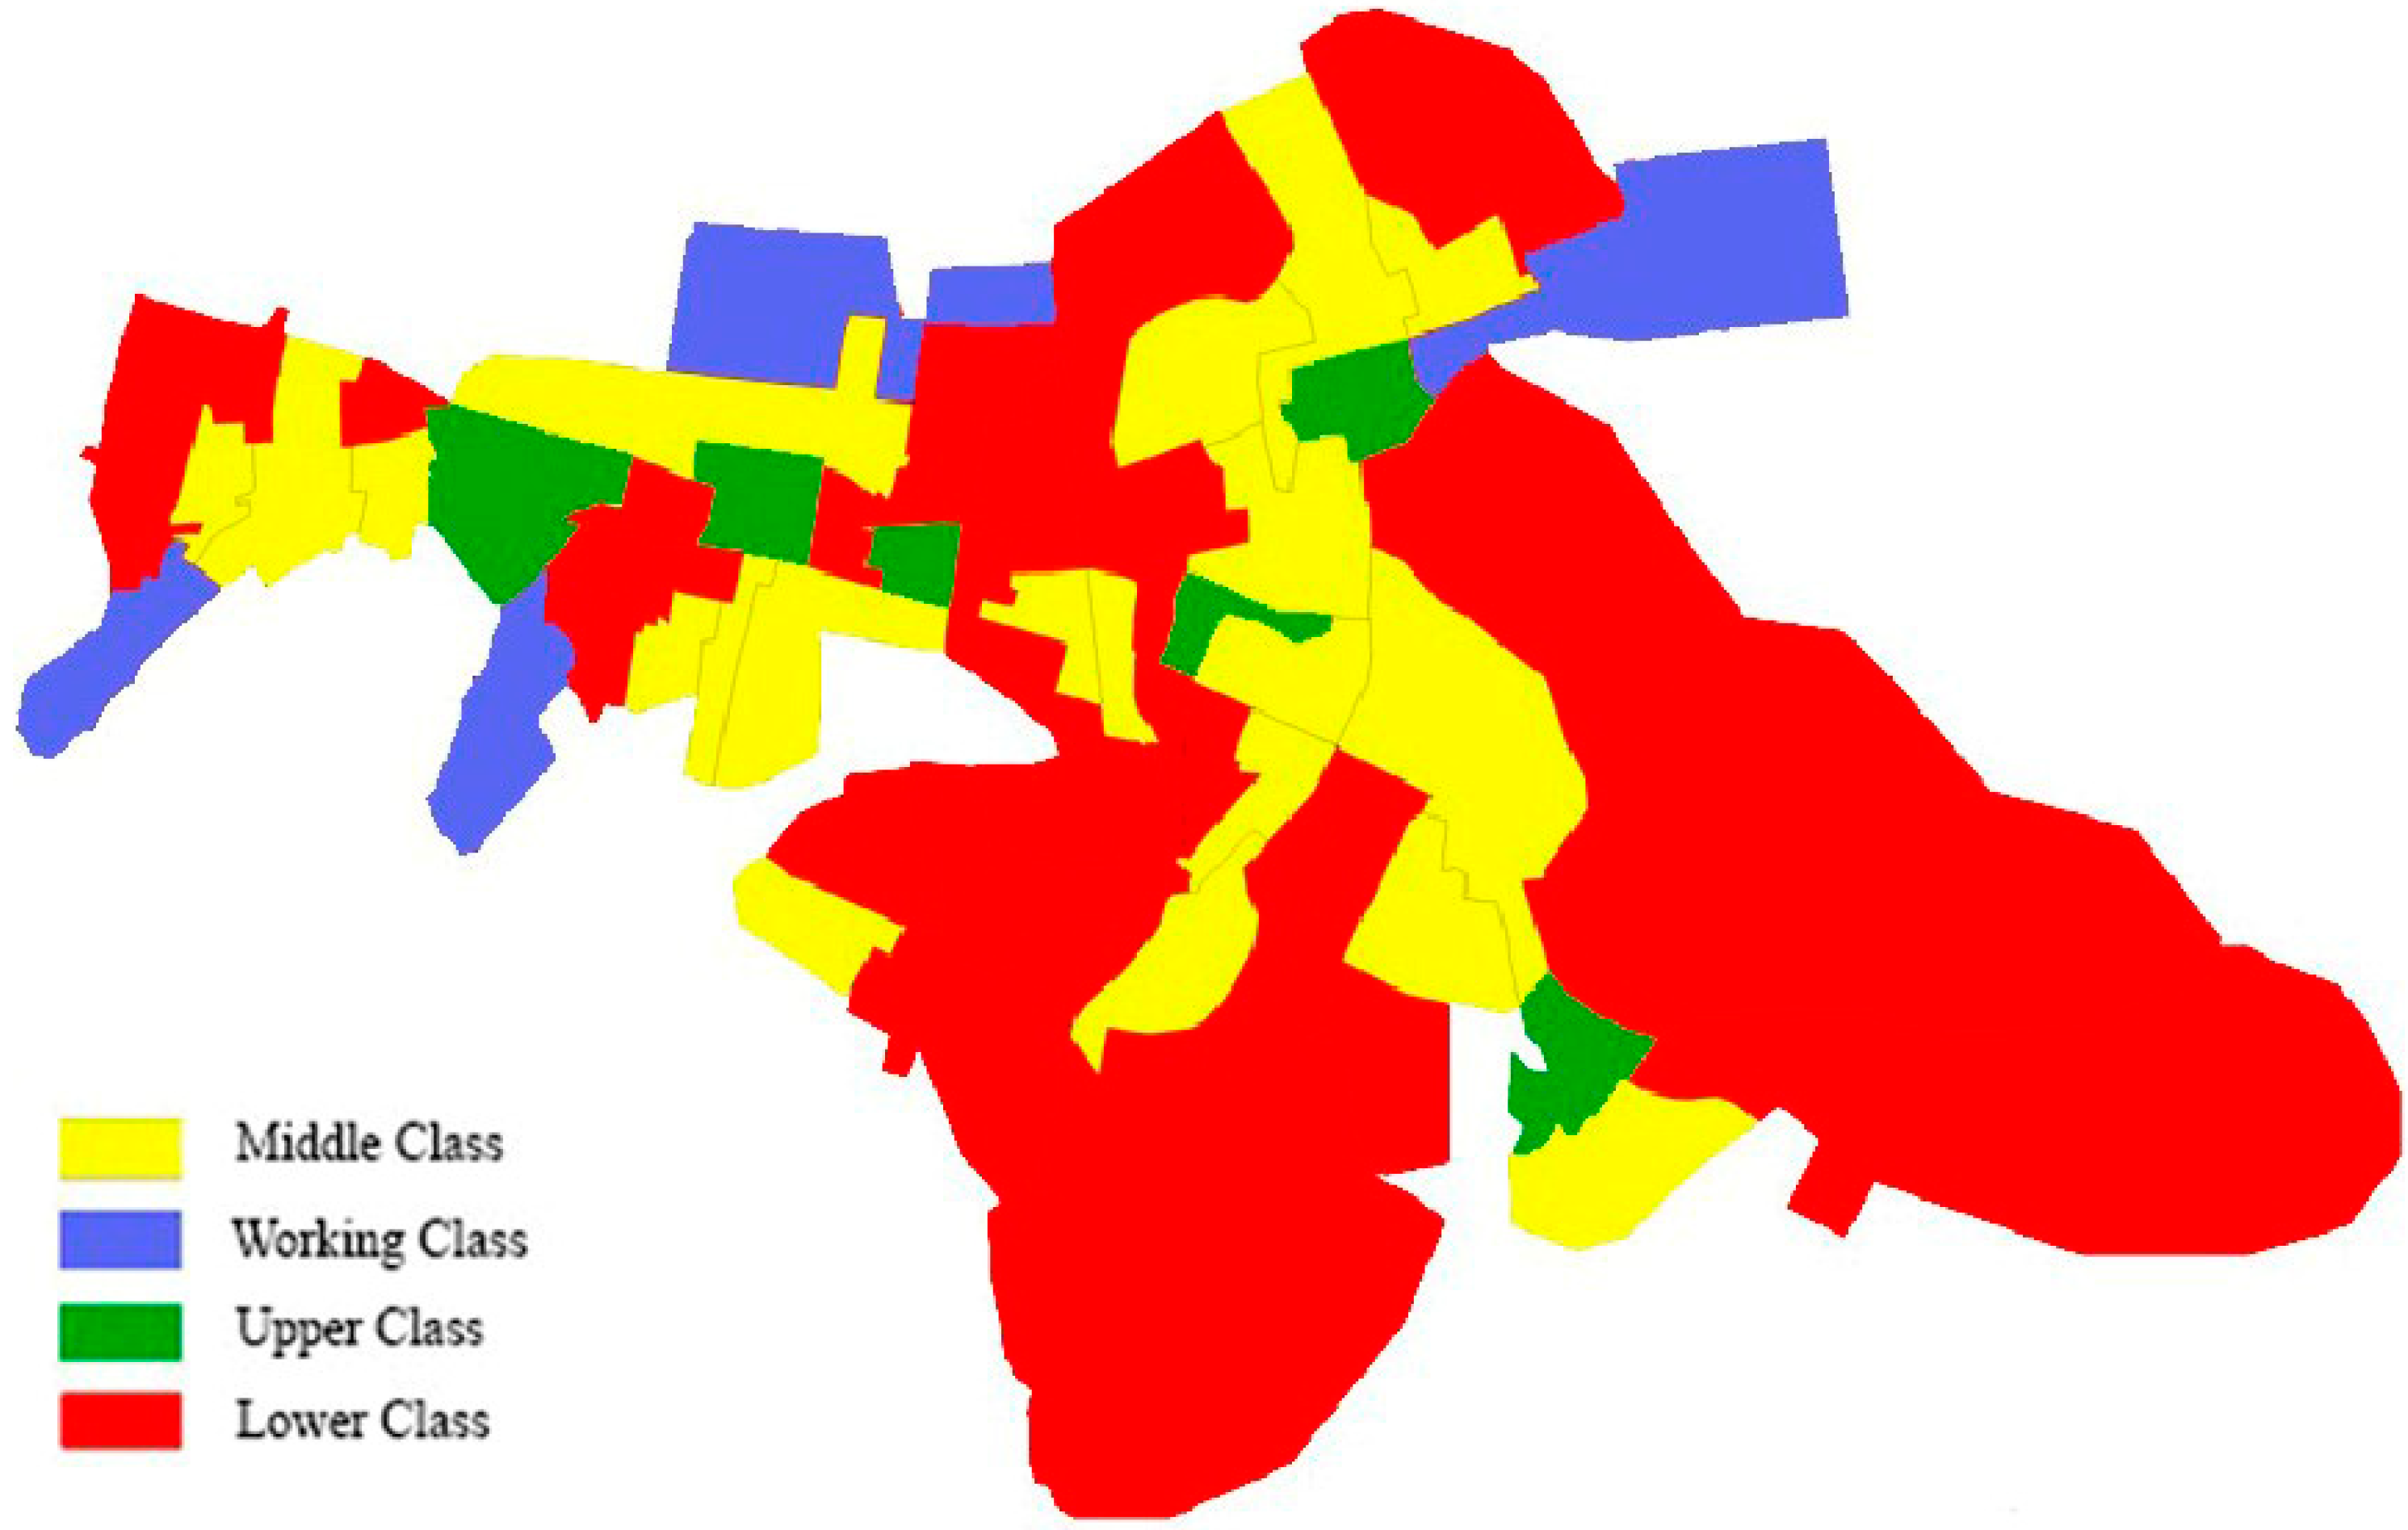
4.3. 5.Levelling Urban Region of Mahabad by TOPSIS Method
5. Discussion
5.1. Impact of Urban Spaces on Mental Health
5.2. Impact of Urban Spaces on Physical Health
5.3. Urban Spaces and Social Dimension
6. Conclusions
Author Contributions
Funding
Data Availability Statement
Conflicts of Interest
References
- Berardi, U.; Jafarpur, P. Assessing the impact of climate change on building heating and cooling energy demand in Canada. Renew. Sustain. Energy Rev. 2020, 121, 109681. [Google Scholar] [CrossRef]
- Bazazzadeh, H.; Pilechiha, P.; Nadolny, A.; Mahdavinejad, M.; Hashemi safaei, S.S. The Impact Assessment of Climate Change on Building Energy Consumption in Poland. Energies 2021, 14, 4084. [Google Scholar] [CrossRef]
- Bazazzadeh, H.; Nadolny, A.; Safaei, S.S.H. Climate Change and Building Energy Consumption: A Review of the Impact of Weather Parameters Influenced by Climate Change on Household Heating and Cooling Demands of Buildings. Eur. J. Sustain. Dev. 2021, 10, 1. [Google Scholar] [CrossRef]
- Sohani, A.; Cornaro, C.; Shahverdian, M.H.; Samiezadeh, S.; Hoseinzadeh, S.; Dehghani-Sanij, A.; Pierro, M.; Moser, D. Using Building Integrated Photovoltaic Thermal (BIPV/T) Systems to Achieve Net Zero Goal: Current Trends and Future Perspectives. In Towards Net Zero Carbon Emissions in the Building Industry; Sayigh, A., Ed.; Springer International Publishing: Cham, Switzerland, 2023; pp. 91–107. [Google Scholar] [CrossRef]
- Hoseinzadeh, S.; Nastasi, B.; Groppi, D.; Astiaso Garcia, D. Exploring the penetration of renewable energy at increasing the boundaries of the urban energy system—The PRISMI plus toolkit application to Monachil, Spain. Sustain. Energy Technol. Assess. 2022, 54, 102908. [Google Scholar] [CrossRef]
- Gilani, H.A.; Hoseinzadeh, S.; Esmaeilion, F.; Memon, S.; Garcia, D.A.; Assad, M.E.H. A solar thermal driven ORC-VFR system employed in subtropical Mediterranean climatic building. Energy 2022, 250, 123819. [Google Scholar] [CrossRef]
- Huber, M.; Knottnerus, J.A.; Green, L.; van der Horst, H.; Jadad, A.R.; Kromhout, D.; Leonard, B.; Lorig, K.; Loureiro, M.I.; van der Meer, J.W.M.; et al. How should we define health? BMJ 2011, 343, d4163. [Google Scholar] [CrossRef] [Green Version]
- Schweitzer, M.; Gilpin, L.; Frampton, S. Healing Spaces: Elements of Environmental Design That Make an Impact on Health. J. Altern. Complement. Med. 2004, 10, S71–S83. [Google Scholar] [CrossRef] [Green Version]
- Gordon, D.L.A. Planning Twentieth Century Capital Cities; Routledge: London, UK, 2006. [Google Scholar] [CrossRef]
- Bahrainy, H.; Khosravi, H. The impact of urban design features and qualities on walkability and health in under-construction environments: The case of Hashtgerd New Town in Iran. Cities 2013, 31, 17–28. [Google Scholar] [CrossRef]
- Inzulza-Contardo, J.; Moran-Figueroa, P. Towards an analytical framework based on the principles of Civic Design. The case of post-earthquake Talca, Chile 2010–2016. Cities 2018, 72, 356–368. [Google Scholar] [CrossRef]
- Mahdavy, H. Patterns And Problems Of Economic Development In Rentier States The Case Of Iran; Studies in the Economic History of the Middle-East; Oxford University Press: Oxford, UK, 1970. [Google Scholar]
- Azami, M.; Mirzaee, E.; Mohammadi, A. Recognition of urban unsustainability in Iran (case study: Sanandaj city). Cities 2015, 49, 159–168. [Google Scholar] [CrossRef]
- Mansourianfar, M.H.; Haghshenas, H. Micro-scale sustainability assessment of infrastructure projects on urban transportation systems: Case study of Azadi district, Isfahan, Iran. Cities 2018, 72, 149–159. [Google Scholar] [CrossRef]
- Rouhi, M.; Usefi, H.; Hasan, M.; Vizheh, M. Ethnicity as a risk factor for postpartum depression. Br. J. Midwifery 2012, 20, 419–426. [Google Scholar] [CrossRef]
- O’Shea, M.T. Trapped Between the Map and Reality: Geography and Preceptions of Kurdistan; Routledge: London, UK, 2004. [Google Scholar] [CrossRef]
- Ahmad, Z.; Ahmad, N. Urbanism, Space and Human Psychology: Value Change and Urbanization in Malaysia. Eur. J. Soc. Sci. 2009, 11, 464–470. [Google Scholar] [CrossRef] [Green Version]
- Knöll, M.; Roe, J.J. Ten questions concerning a new adolescent health urbanism. Build. Environ. 2017, 126, 496–506. [Google Scholar] [CrossRef]
- Zinatizadeh, S.; Azmi, A.; Monavari, S.M.; Sobhanardakani, S. Evaluation and prediction of sustainability of urban areas: A case study for Kermanshah city, Iran. Cities 2017, 66, 1–9. [Google Scholar] [CrossRef]
- Reiser, R.A. A history of instructional design and technology: Part II: A history of instructional design. Educ. Technol. Res. Dev. 2001, 49, 57–67. [Google Scholar] [CrossRef]
- Hanson, J. Urban transformations: A history of design ideas. Urban Des. Int. 2000, 5, 97–122. [Google Scholar] [CrossRef]
- Akhondzadeh-Noughabi, E.; Alizadeh, S.; Ahmadvand, A.-M.; Minaei-Bidgoli, B. FTiS: A new model for effective urban management: A case study of urban systems in Iran. Cities 2013, 31, 394–403. [Google Scholar] [CrossRef]
- Jelokhani-Niaraki, M.; Hajiloo, F.; Samany, N.N. A Web-based Public Participation GIS for assessing the age-friendliness of cities: A case study in Tehran, Iran. Cities 2019, 95, 102471. [Google Scholar] [CrossRef]
- Reiner, T.A. The Place of the Ideal Community in Urban Planning; University of Pennsylvania Press: Philadelphia, PA, USA, 1963; ISBN 9781512806113. [Google Scholar]
- Wolny, A. Are suburban commuters confined to private transport? A case study of a medium-sized functional urban area (FUA) in Poland. Cities 2019, 92, 82–96. [Google Scholar] [CrossRef]
- Dilani, A. Architecture: The beneficial health outcomes of salutogenic design. In Design for Health; Routledge: London, UK, 2017. [Google Scholar] [CrossRef] [Green Version]
- Duhl, L.J.; Sanchez, A.K. Sanchez Healthy Cities and and the City Planning Process: A Background Document on Links between Health and Urban Planning; WHO Regional Office for Europe: København, Denmark, 1999. [Google Scholar]
- Liu, W.; Zhang, T.; Lai, D. Inverse design of a thermally comfortable indoor environment with a coupled CFD and multi-segment human thermoregulation model. Build. Environ. 2023, 227, 109769. [Google Scholar] [CrossRef]
- Yao, W.; Li, X.; Cao, W.; Li, G.; Ren, L.; Gao, W. Research on the influence of indoor thermal environment and activity levels on thermal comfort in protective clothing. Energy Build. 2023, 279, 112681. [Google Scholar] [CrossRef] [PubMed]
- Shakouri, M.; Ghadamian, H.; Hoseinzadeh, S.; Sohani, A. Multi-objective 4E analysis for a building integrated photovoltaic thermal double skin Façade system. Sol. Energy 2022, 233, 408–420. [Google Scholar] [CrossRef]
- Takano, T.; Nakamura, K. An analysis of health levels and various factors of urban environments for healthy cities projects. J. Epidemiol. Community Health 2001, 55, 263–270. [Google Scholar] [CrossRef] [Green Version]
- Prasad, A.; Gray, C.B.; Ross, A.; Kano, M. Metrics in Urban Health: Current Developments and Future Prospects. Annu. Rev. Public Health 2016, 37, 113–133. [Google Scholar] [CrossRef] [Green Version]
- Pineo, H.; Glonti, K.; Rutter, H.; Zimmermann, N.; Wilkinson, P.; Davies, M. Urban Health Indicator Tools of the Physical Environment: A Systematic Review. J. Urban Heal. 2018, 95, 613–646. [Google Scholar] [CrossRef]
- Lopes, R.H.C. Kolmogorov-Smirnov Test. In International Encyclopedia of Statistical Science; Springer: Berlin/Heidelberg, Germany, 2011. [Google Scholar] [CrossRef]
- Mir, M.A.; Ghazvinei, P.T.; Sulaiman, N.; Basri, N.; Saheri, S.; Mahmood, N.; Jahan, A.; Begum, R.; Aghamohammadi, N. Application of TOPSIS and VIKOR improved versions in a multi criteria decision analysis to develop an optimized municipal solid waste management model. J. Environ. Manag. 2016, 166, 109–115. [Google Scholar] [CrossRef]
- Health, M.; Action, G. Mental Health Gap Action Programme: Scaling up Care for Mental, Neurological, and Substance Use Disorders; WHO Regional Office for Europe: Geneva, Switzerland, 2008; ISBN 9789241596. [Google Scholar]
- Lowe, M.; Boulange, C.; Giles-Corti, B. Urban design and health: Progress to date and future challenges. Heal. Promot. J. Aust. 2014, 25, 14–18. [Google Scholar] [CrossRef] [Green Version]
- Jackson, L.E. The relationship of urban design to human health and condition. Landsc. Urban Plan. 2003, 64, 191–200. [Google Scholar] [CrossRef]
- Schieman, S.; Meersman, S.C. Neighborhood Problems and Health Among Older Adults: Received and Donated Social Support and the Sense of Mastery as Effect Modifiers. J. Gerontol. Ser. B Psychol. Sci. Soc. Sci. 2004, 59, S89–S97. [Google Scholar] [CrossRef]
- Galea, S.; Ahern, J.; Rudenstine, S.; Wallace, Z.; Vlahov, D. Urban built environment and depression: A multilevel analysis. J. Epidemiol. Community Health 2005, 59, 822–827. [Google Scholar] [CrossRef] [PubMed] [Green Version]
- O’Campo, P.; Salmon, C.; Burke, J. Neighbourhoods and mental well-being: What are the pathways? Heal. Place 2009, 15, 56–68. [Google Scholar] [CrossRef] [PubMed]
- Wen, M.; Fan, J.; Jin, L.; Wang, G. Neighborhood effects on health among migrants and natives in Shanghai, China. Health Place 2010, 16, 452–460. [Google Scholar] [CrossRef] [PubMed]
- Golembiewski, J.A. Salutogenic architecture in healthcare settings. In The Handbook of Salutogenesis; Springer: Berlin/Heidelberg, Germany, 2016. [Google Scholar] [CrossRef] [Green Version]
- Conley, L. Improving Well-Being With Naber: Creating A Mobile App Experience to Help People Move and Thrive in a New Neighborhood. 2018. Available online: https://uh-ir.tdl.org/handle/10657/3142 (accessed on 9 September 2022).
- Roux, V.D. Investigating neighborhood and area effects on health. Am. J. Public Heal. 2001, 91, 1783–1789. [Google Scholar] [CrossRef] [PubMed]
- Saberifar, R. Investigate the Relationship between Urban Furniture and Utilization of Urban Spaces with Mental Health. 2018, Tehran, Iran, 10.29252/hrjbaq.3.2.89, hrjbaq.ir. Available online: https://hrjbaq.ir/article-1-48-en.html (accessed on 9 September 2022).
- Jafari, M. The Role of Urban Furniture in the Mental Health of the Elders in Regions 1 and 2 of North of Tehran and Regions 19 and 20 of South of Tehran. ijeprjournal.org. Available online: https://www.ijeprjournal.org/article.asp?issn=2395-2296;year=2016;volume=2;issue=3;spage=184;epage=187;aulast=Jafari (accessed on 9 September 2022).
- Koohsari, M.J.; Mavoa, S.; Villanueva, K.; Sugiyama, T.; Badland, H.; Kaczynski, A.T.; Owen, N.; Giles-Corti, B. Public Open Space, Physical Activity, Urban Design and Public Health: Concepts, Methods and Research Agenda. Elsevier: Amsterdam, The Netherlands, 2015; Available online: https://www.sciencedirect.com/science/article/pii/S1353829215000295 (accessed on 9 September 2022). [CrossRef] [Green Version]
- Koohsari, M.J.; Badland, H.; Giles-Corti, B. (Re) Designing the Built Environment to Support Physical Activity: Bringing Public Health Back into Urban Design and Planning. Elsevier: Amsterdam, The Netherlands, 2013. Available online: https://www.sciencedirect.com/science/article/pii/S0264275113000978 (accessed on 9 September 2022).
- Peykari, N.; Larijani, B. A multi-sectoral approach to combatting non-communicable diseases: Iran’s experience. J. Diabetes Metab. Disord. 2019, 18, 719–720. [Google Scholar] [CrossRef] [Green Version]
- Peykari, N.; Hashemi, H.; Dinarvand, R.; Haji-Aghajani, M.; Malekzadeh, R.; Sadrolsadat, A.; Sayyari, A.A.; Asadi-Lari, M.; Delavari, A.; Farzadfar, F.; et al. National action plan for non-communicable diseases prevention and control in Iran; a response to emerging epidemic. J. Diabetes Metab. Disord. 2017, 16, 3. [Google Scholar] [CrossRef] [Green Version]
- Fathi, S.; Sajadzadeh, H.; Sheshkal, F.M.; Aram, F.; Pinter, G.; Felde, I.; Mosavi, A. The Role of Urban Morphology Design on Enhancing Physical Activity and Public Health. Int. J. Environ. Res. Public Health 2020, 17, 2359. [Google Scholar] [CrossRef] [PubMed] [Green Version]
- Briggs, D. Environmental pollution and the global burden of disease. Br. Med. Bull. 2003, 68, 1–24. [Google Scholar] [CrossRef] [PubMed] [Green Version]
- Lu, Z.N.; Chen, H.; Hao, Y.; Wang, J.; Song, X.; Mok, T.M. The Dynamic Relationship between Environmental Pollution, Economic Development and Public Health: Evidence from China. Elsevier. Available online: https://www.sciencedirect.com/science/article/pii/S0959652617317250?casa_token=WVLfnjUyQ2MAAAAA:Mns8VVxE7cxnukFUsy4GHwdv4J-oGqgbctgzDn9NNw486J0hBR8jua5--97HvQPQVBkelrWK (accessed on 9 September 2022).
- Omid, N.S.; Qasim, T.A.; Morteza, M. Statistic and Synoptic Analysis of Dust Phenomena in West of Iran. J. Arid. Reg. Geogr. Stud. 2012, 2, 63–81. Available online: https://jes.ut.ac.ir/article_29154.html?lang=en (accessed on 9 September 2022). [CrossRef]
- Boloorani, A.D.; Nabavi, S.O.; Bahrami, H.A.; Mirzapour, F.; Kavosi, M.; Abasi, E.; Azizi, R. Investigation of dust storms entering Western Iran using remotely sensed data and synoptic analysis. J. Environ. Health Sci. Eng. 2014, 12, 1–12. [Google Scholar] [CrossRef] [Green Version]
- Moreira, T.C.; Polizel, J.L.; Santos ID, S.; Silva Filho, D.F.; Bensenor, I.; Lotufo, P.A.; Mauad, T. Green Spaces, Land COVER, Street Trees and Hypertension in the Megacity of São Paulo. mdpi.com. Available online: https://www.mdpi.com/624352 (accessed on 9 September 2022).
- Selmi, W.; Weber, C.; Rivière, E.; Blond, N.; Mehdi, L.; Nowak, D. Air Pollution Removal by Trees in Public Green Spaces in Strasbourg City, France. Elsevier. Available online: https://www.sciencedirect.com/science/article/pii/S1618866716301571?casa_token=SuxfeTQmidEAAAAA:_T7n85yhXvL7QIWZC_indPRKqlZJDm_nv5uF8ODYfUtxs8anjYBq8oMvxnK-x2eWSu5MReER (accessed on 9 September 2022).
- Wood, L.; Hooper, P.; Foster, S.; Bull, F. Public Green Spaces and Positive Mental Health–Investigating the Relationship between Access, Quantity and Types of Parks and Mental Wellbeing. Elsevier. Available online: https://www.sciencedirect.com/science/article/pii/S1353829216303689?casa_token=ckX7M7m5tZMAAAAA:He57g6ALuUBkBGTaDXdN7eNbfCumk5T99ercQYuoZ_c6ygPcWwb6411TfqLgaI-YjHPsM_Hd (accessed on 9 September 2022).
- AGENCY, N. Per Capita Green Space in Mahabad is Lower than the National Standard [Persian]. IRIB news Aganny, 2016. Available online: http://www.iribnews.ir/fa/news/2061515 (accessed on 9 September 2022).
- Hosseinzadeh, D. How Much is Green Space, Mahabadi Per Capita? [Persian]. Rahdana Information Network, Dana Agency: Tehran, Iran, 2016. Available online: https://www.dana.ir/news/1289781.html (accessed on 9 September 2022).
- Haskell, W.L.; Blair, S.N.; Hill, J.O. Physical Activity: Health Outcomes and Importance for Public Health Policy. Elsevier. Available online: https://www.sciencedirect.com/science/article/pii/S0091743509002199?casa_token=nxFEMh8rihEAAAAA:XxEaFs2E9RumnDK_6Ue72OAzQwMmYylVLRpy4opW-qzGIAOTbYBo3HCxVdkPun9-BNOcqLKb (accessed on 9 September 2022).
- Green, G.; Gilbertson, J.M.; Grimsley, M.F. Fear of Crime and Health in Residential Tower Blocks: A Case Study in LIVERPOOL, UK. academic.oup.com. Available online: https://academic.oup.com/eurpub/article-abstract/12/1/10/591454 (accessed on 9 September 2022).
- Rappe, E.; Kivela, S.L.; Rita, H. Visiting Outdoor Green Environments Positively Impacts Self-Rated Health among Older People in Long-Term Care. journals.ashs.org. Available online: https://journals.ashs.org/horttech/view/journals/horttech/16/1/article-p55.xml (accessed on 9 September 2022).
- Allahyar, M.; Kazemi, F. Effect of Landscape Design Elements on Promoting Neuropsychological Health of Children. Elsevier. Available online: https://www.sciencedirect.com/science/article/pii/S1618866721003605?casa_token=71unJaDOp5IAAAAA:Hxdlz5jZaiPIl664YtFyE5oHtlAKVTA-Sn7C1l-KT-diWghrCqOj5XM071QgxgTNTzELRvYw (accessed on 9 September 2022).
- Marques, B.; McIntosh, J.; Kershaw, C. Healing Spaces: Improving Health and Wellbeing for the Elderly through Therapeutic Landscape Design. 2019. Available online: https://openaccess.wgtn.ac.nz/articles/journal_contribution/Healing_spaces_improving_health_and_wellbeing_for_the_elderly_through_therapeutic_landscape_design/12413336 (accessed on 9 September 2022).
- Wang, F.; Zhang, R.; Dong, S.; Liang, L. Urban Planning and Design of Pedestrian Space from Perspectives of Fitness. Elsevier. Available online: https://www.sciencedirect.com/science/article/pii/S1877705811048612 (accessed on 9 September 2022).
- Tibbalds, F. Making People-Friendly Towns; Spon Press: 2001. Available online: https://www.routledge.com/Making-People-Friendly-Towns-Improving-the-Public-Environment-in-Towns/Tibbalds/p/book/9780415237598 (accessed on 9 September 2022).
- Rad, V.B.; Ngah, I.B. Assessment of Quality of Public Urban Spaces. Sci. Int. 2014, 26, 335–338. Available online: http://www.sci-int.com/pdf/200550752865-335-338--Bigdeli%20Rad--SS--MALAYSIA--PAID[2]%20GP%20Revised%20Back.pdf (accessed on 9 September 2022).
- Azimi, E.; Sattarzadeh, D.; Bolillan, L.; Tarf, A.A.; Asli, M.F. Evaluation of the effect of physical-environmental factors of public spaces on the mental health of citizens (Case study: Ardabil city). J. Appl. Res. Geogr. Sci. 2021, 20, 307–319. [Google Scholar] [CrossRef]
- Badland, H.M.; Schofield, G.M.; Witten, K.; Schluter, P.J.; Mavoa, S.; Kearns, R.A.; Hinckson, E.A.; Oliver, M.; Kaiwai, H.; Jensen, V.G.; et al. Understanding the Relationship between Activity and Neighbourhoods (URBAN) Study: Research design and methodology. BMC Public Health 2009, 9, 224. [Google Scholar] [CrossRef] [PubMed] [Green Version]
- Kirtland, K.A.; Porter, D.E.; Addy, C.L.; Neet, M.J.; Williams, J.E.; Sharpe, P.A.; Neff, L.J.; Kimsey, C.D., Jr.; Ainsworth, B.E. Environmental measures of physical activity supports: Perception versus reality. Am. J. Prev. Med. 2003, 24, 323–331. [Google Scholar] [CrossRef] [PubMed]
- Adlakha, D.; Hipp, J.A.; Brownson, R.C.; Eyler, A.A.; Lesorogol, C.K.; Raghavan, R. ‘Can we walk?’ Environmental supports for physical activity in India. Prev. Med. 2017, 103, S81–S89. [Google Scholar] [CrossRef] [Green Version]
- Hipp, J.A.; Reeds, D.N.; van Bakergem, M.A.; Marx, C.M.; Brownson, R.C.; Pamulapati, S.C.; Hoehner, C.M. Review of Measures of Worksite Environmental and Policy Supports for Physical Activity and Healthy Eating. Prev. Chronic Dis. 2015, 12, 140410. [Google Scholar] [CrossRef] [Green Version]
- Krizek, K.J.; Johnson, P.J. Proximity to Trails and Retail: Effects on Urban Cycling and Walking. J. Am. Plan. Assoc. 2006, 72, 33–42. [Google Scholar] [CrossRef]
- CABE Space. The Value of Public Space: How High-Quality Parks and Public Spaces Create Economic, Social and Environmental Value; CABE Space: London, UK, 2004. [Google Scholar]
- McCartney, G.; Hearty, W.; Arnot, J.; Popham, F.; Cumbers, A.; McMaster, R. Impact of Political Economy on Population Health: A Systematic Review of Reviews. Am. J. Public Health 2019, 109, e1–e12. [Google Scholar] [CrossRef]


| Kaiser–Meyer–Olkin Measure of Sampling Adequacy | Bartlett’s Test of Sphericity | ||
|---|---|---|---|
| Approx. Chi-Square | df | Sig. | |
| 0.846 | 8 × 10³ | 211 | |
| Demographic Characteristics | Classifications | Frequency | % |
|---|---|---|---|
| Gender | Male | 66 | 66 |
| Female | 34 | 34 | |
| Age | Under 25 | 25 | 25 |
| Between 25 and 45 | 52 | 52 | |
| Over 45 | 23 | 23 | |
| Educational Level | Under Diploma | 18 | 18 |
| Diploma | 27 | 27 | |
| Bachelor | 50 | 50 | |
| Master’s and Higher | 5 | 2 | |
| Career Status | Employee | 16 | 16 |
| Worker | 34.5 | 34.5 | |
| Farmer | 11 | 11 | |
| Self-employed | 23 | 23 | |
| Unemployed | 7.5 | 7.5 | |
| Vendor | 3.5 | 3.5 | |
| etc. | 4.5 | 4.5 | |
| Sense of Job Security | Very High | 8 | 8 |
| High | 12 | 12 | |
| Medium | 31.5 | 31.5 | |
| Low | 27.5 | 27.5 | |
| Very low | 21 | 21 |
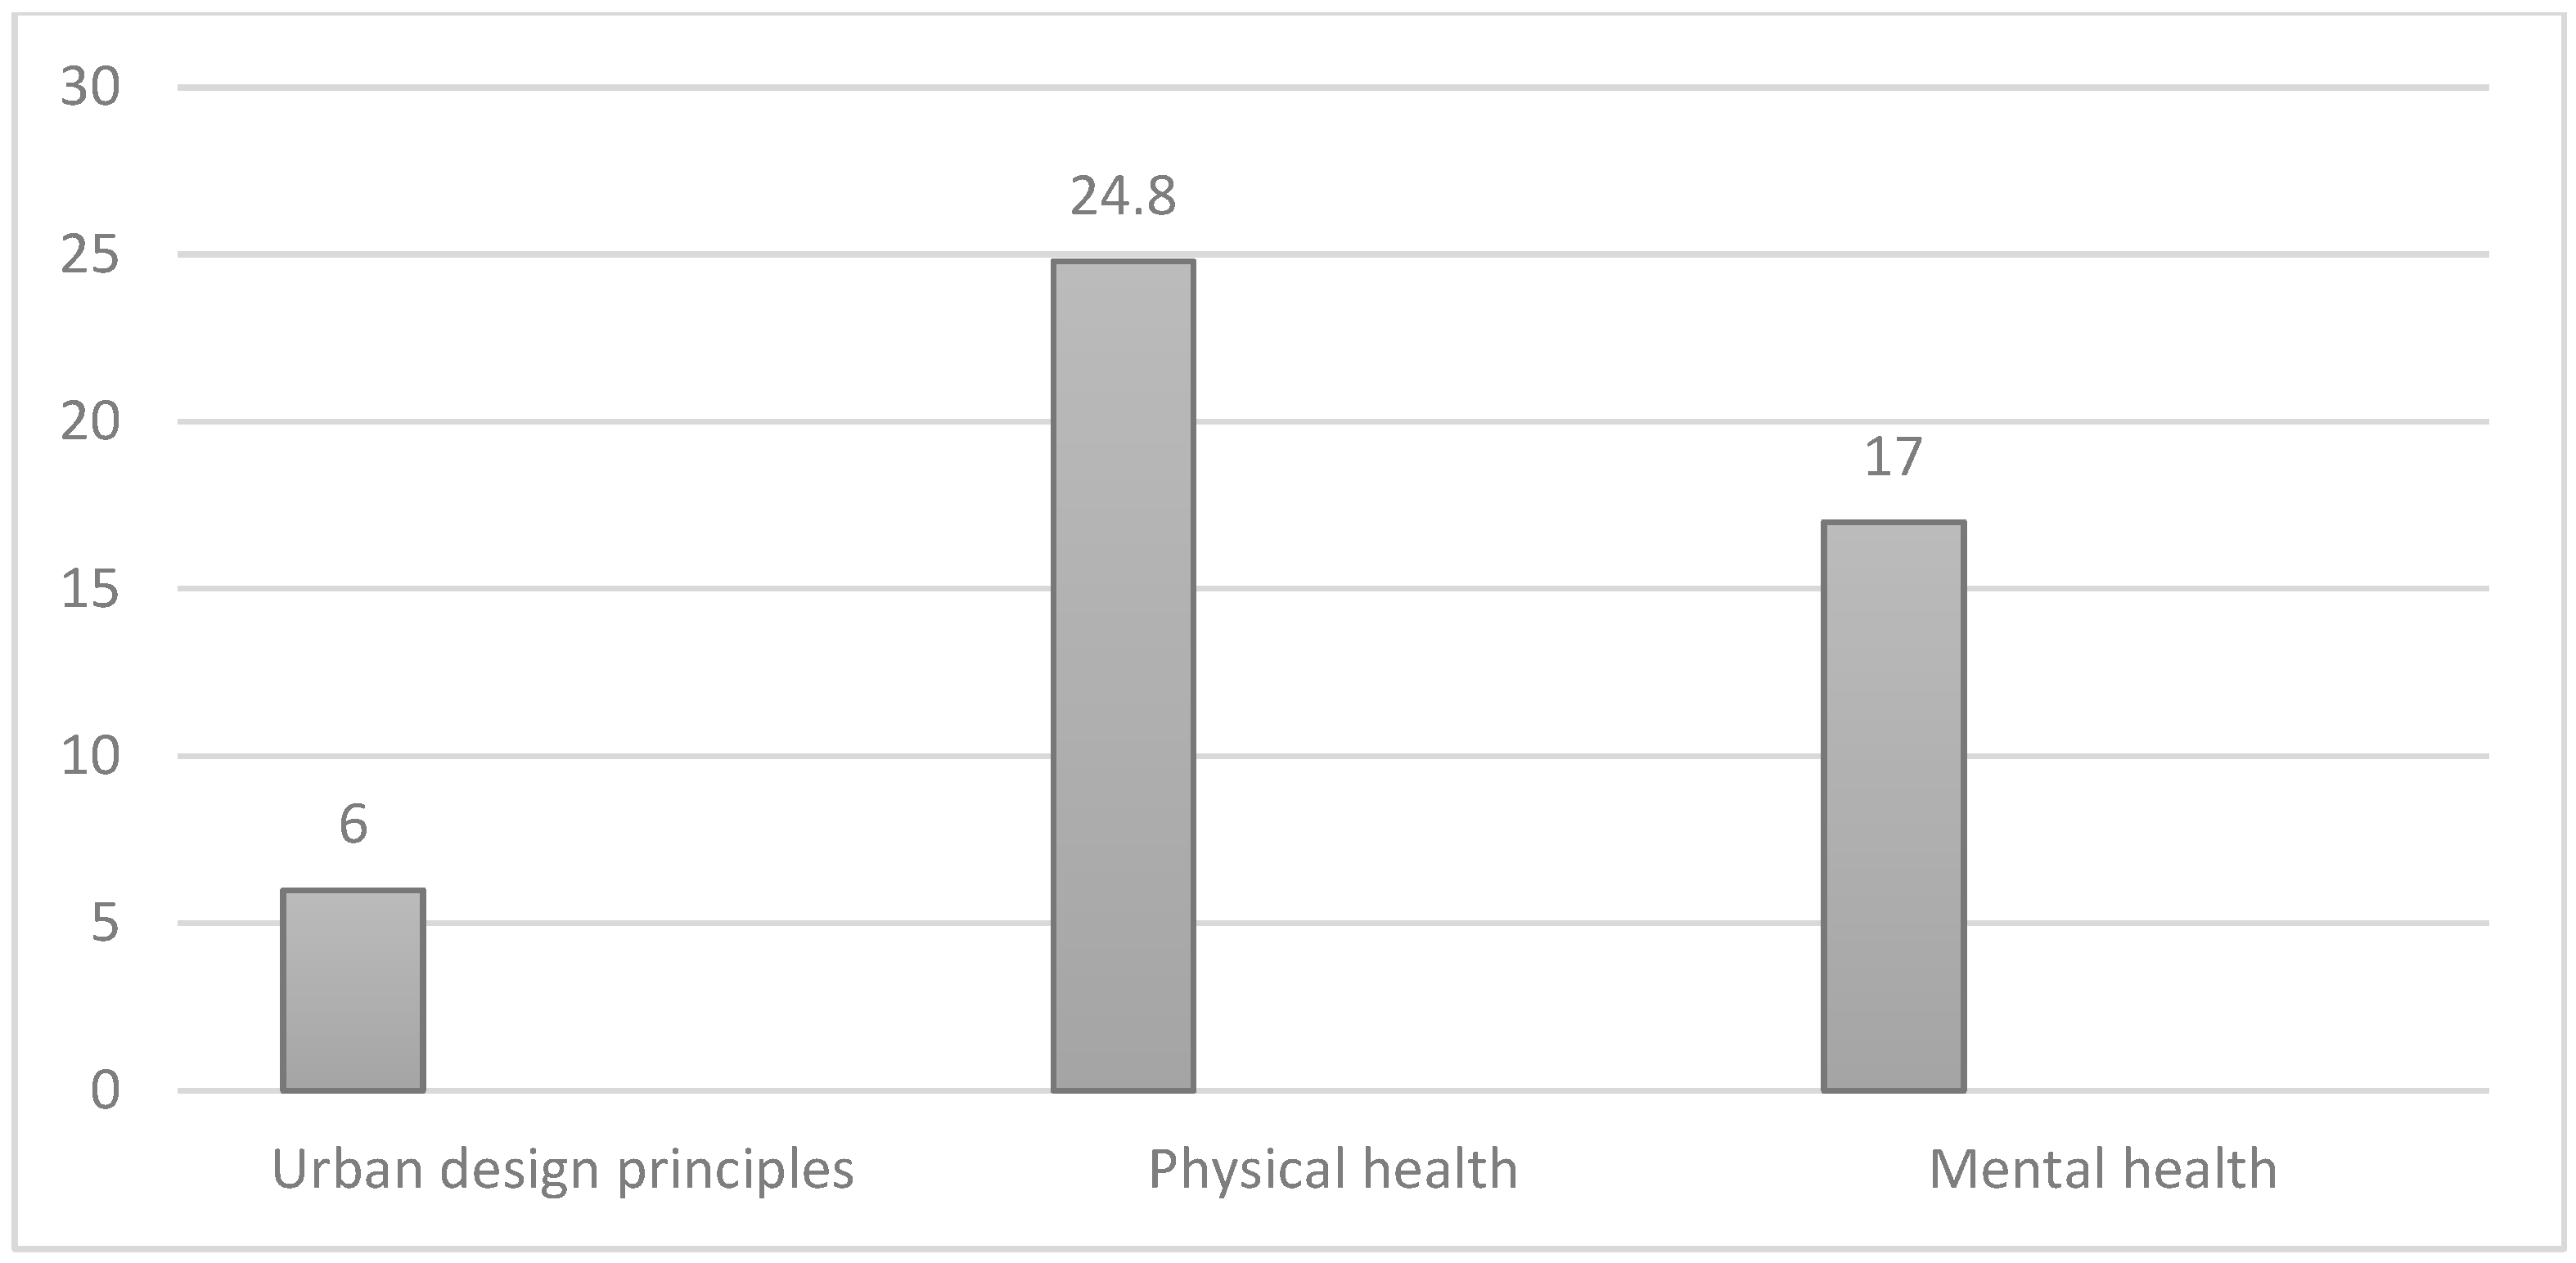
| Urban Design Principles | Physical Health | Mental Health | |
|---|---|---|---|
| Urban Design Principles | 1 | 0.712 | 0.746 |
| Physical Health | 0.52 | 1 | 0.52 |
| Mental Health | 0.746 | 0.712 | 1 |
| No. | Factor | Correlations |
|---|---|---|
| Environmental Quality | 0.895 | |
| 1 | Green spaces and nature, lack of environmental pollution | 0.801 |
| 2 | Coordinating environment with residents’ desire and culture, lack of noise pollution | 0.652 |
| Local Spaces’ Liveliness | 0.421 | |
| 3 | Landscape and environmental aesthetic | 0.598 |
| 4 | Enjoying aesthetic location | 0.471 |
| 5 | Environmental artistic features (use of color in particular) | 0.512 |
| 6 | Access to daily services | 0.459 |
| 7 | Signs and symbols | 0.601 |
| Readability | 0.598 | |
| 8 | Stability and desire to continue living | 0.524 |
| 9 | Sense of belonging | 0.532 |
| Framework Quality | 0.601 | |
| 10 | Compatible neighborhood | 0.503 |
| 11 | Access to appropriate urban furniture | 0.468 |
| Identity and Social Relationships | 0.532 | |
| 12 | Interaction with urban managers to address environmental problems | 0.520 |
| 13 | Social and local responsibilities in relation to environmental quality | 0.452 |
| Quality of Public Spaces | 0.709 | |
| 14 | Pedestrian development spaces (e.g., safe walking and cycling routes) | 0.429 |
| 15 | Residential blocks | 0.395 |
| 16 | Access and distribution of sport facilities | 0.701 |
| 17 | Health and therapy facilities | 0.487 |
| 18 | Public transportation and traffic | 0.660 |
| 19 | Public spaces for children and elderly | 0.638 |
| 20 | Landscape and urban furniture | 0.428 |
| 21 | Signs and symbols in neighborhood | 0.541 |
| Model | Unstandardized Coefficients | Standardized Coefficients | T | Sig. | |
|---|---|---|---|---|---|
| B | Std. Error | Beta | |||
| Constant | 2.142 | 1.012 | 0.015 | 4.410 | 0.001 |
| Environmental quality | 0.018 | 0.012 | 0.110 | 1.790 | 0.005 |
| Liveliness of local spaces | 0.007 | 0.003 | 0.183 | 1.633 | 0.000 |
| Readability | 0.003 | 0.010 | 0.013 | 0.263 | 0.005 |
| Framework quality | 0.031 | 0.011 | 0.183 | 3.551 | 0.000 |
| Identity and social relationships | 0.007 | 0.007 | 0.079 | 1.529 | 0.000 |
| Quality and public spaces in the city | 0.034 | 0.009 | 0.391 | 3.528 | 0.000 |
| R = 0.483 | R2 = 0.228 | adjR2 = 0.209 | |||
| std.err = 0.363 | Durbin–Watson = 2.293 | F = 8.841 | Sig = 0.001 | ||
| Important Factors of Environmental Quality | Eij | Wj |
|---|---|---|
| Green spaces and nature, lack of environmental pollution | 3.62 | 0.11 |
| Coordinating environment with residents’ desire and culture, lack of noise pollution | 2.93 | 0.13 |
| Landscape and environmental aesthetic | 3.00 | 0.02 |
| Enjoying aesthetic location | 4.98 | 0.05 |
| Environmental artistic features (use of color in particular) | 3.96 | 0.05 |
| Access to daily services | 3.05 | 0.01 |
| Signs and symbols | 6.05 | 0.05 |
| Stability and desire to continue living | 6.5 | 0.07 |
| Compatible neighborhood | 0.05 | 0.00 |
| Access to appropriate urban furniture | 4.72 | 0.04 |
| Interaction with urban managers to address environmental problems | 5.12 | 0.02 |
| Social and local responsibilities in relation to environmental quality | 5.97 | 0.00 |
| Quality and public spaces in the city | 2.57 | 0.01 |
| Pedestrian development spaces (e.g., safe walking and cycling routes) | 5.96 | 0.07 |
| Residential blocks | 3.14 | 0.02 |
| Access and distribution of sport facilities | 3.12 | 0.02 |
| Health and therapy facilities | 6.01 | 0.06 |
| Public transportation and traffic | 5.56 | 0.06 |
| Public spaces for children and elderly | 6.02 | 0.06 |
| Landscape and urban furniture | 5.58 | 0.06 |
| Signs and symbols in neighborhood | 3.47 | 0.03 |
Disclaimer/Publisher’s Note: The statements, opinions and data contained in all publications are solely those of the individual author(s) and contributor(s) and not of MDPI and/or the editor(s). MDPI and/or the editor(s) disclaim responsibility for any injury to people or property resulting from any ideas, methods, instructions or products referred to in the content. |
© 2022 by the authors. Licensee MDPI, Basel, Switzerland. This article is an open access article distributed under the terms and conditions of the Creative Commons Attribution (CC BY) license (https://creativecommons.org/licenses/by/4.0/).
Share and Cite
Adibhesami, M.A.; Karimi, H.; Sharifi, A.; Sepehri, B.; Bazazzadeh, H.; Berardi, U. Optimization of Urban-Scale Sustainable Energy Strategies to Improve Citizens’ Health. Energies 2023, 16, 119. https://doi.org/10.3390/en16010119
Adibhesami MA, Karimi H, Sharifi A, Sepehri B, Bazazzadeh H, Berardi U. Optimization of Urban-Scale Sustainable Energy Strategies to Improve Citizens’ Health. Energies. 2023; 16(1):119. https://doi.org/10.3390/en16010119
Chicago/Turabian StyleAdibhesami, Mohammad Anvar, Hirou Karimi, Ayyoob Sharifi, Borhan Sepehri, Hassan Bazazzadeh, and Umberto Berardi. 2023. "Optimization of Urban-Scale Sustainable Energy Strategies to Improve Citizens’ Health" Energies 16, no. 1: 119. https://doi.org/10.3390/en16010119