
Do Nuclear Energy, Renewable Energy, and Environmental-Related Technologies Asymmetrically Reduce Ecological Footprint? Evidence from Pakistan


Abstract
:1. Introduction
2. Literature Review
2.1. Nexus between Nuclear Energy and Environment
2.2. Nexus between Technological Innovation-Environment
2.3. Nexus between Renewable Energy Utilization and Environment
3. Data, Model Design and Empirical Methodology
3.1. Data and Model Arrangement
3.2. Empirical Methodology
4. Results and Discussion
4.1. Results of Descriptive Statistics and Correlation Matrix
4.2. Results of Unit Root Tests (without and with Structural Break)
4.3. Results of Broock, Dechert, and Scheinkman (BDS) Test for Non-Linearity
4.4. Cointegration Test Findings
4.5. Results of Nonlinear ARDL Estimates
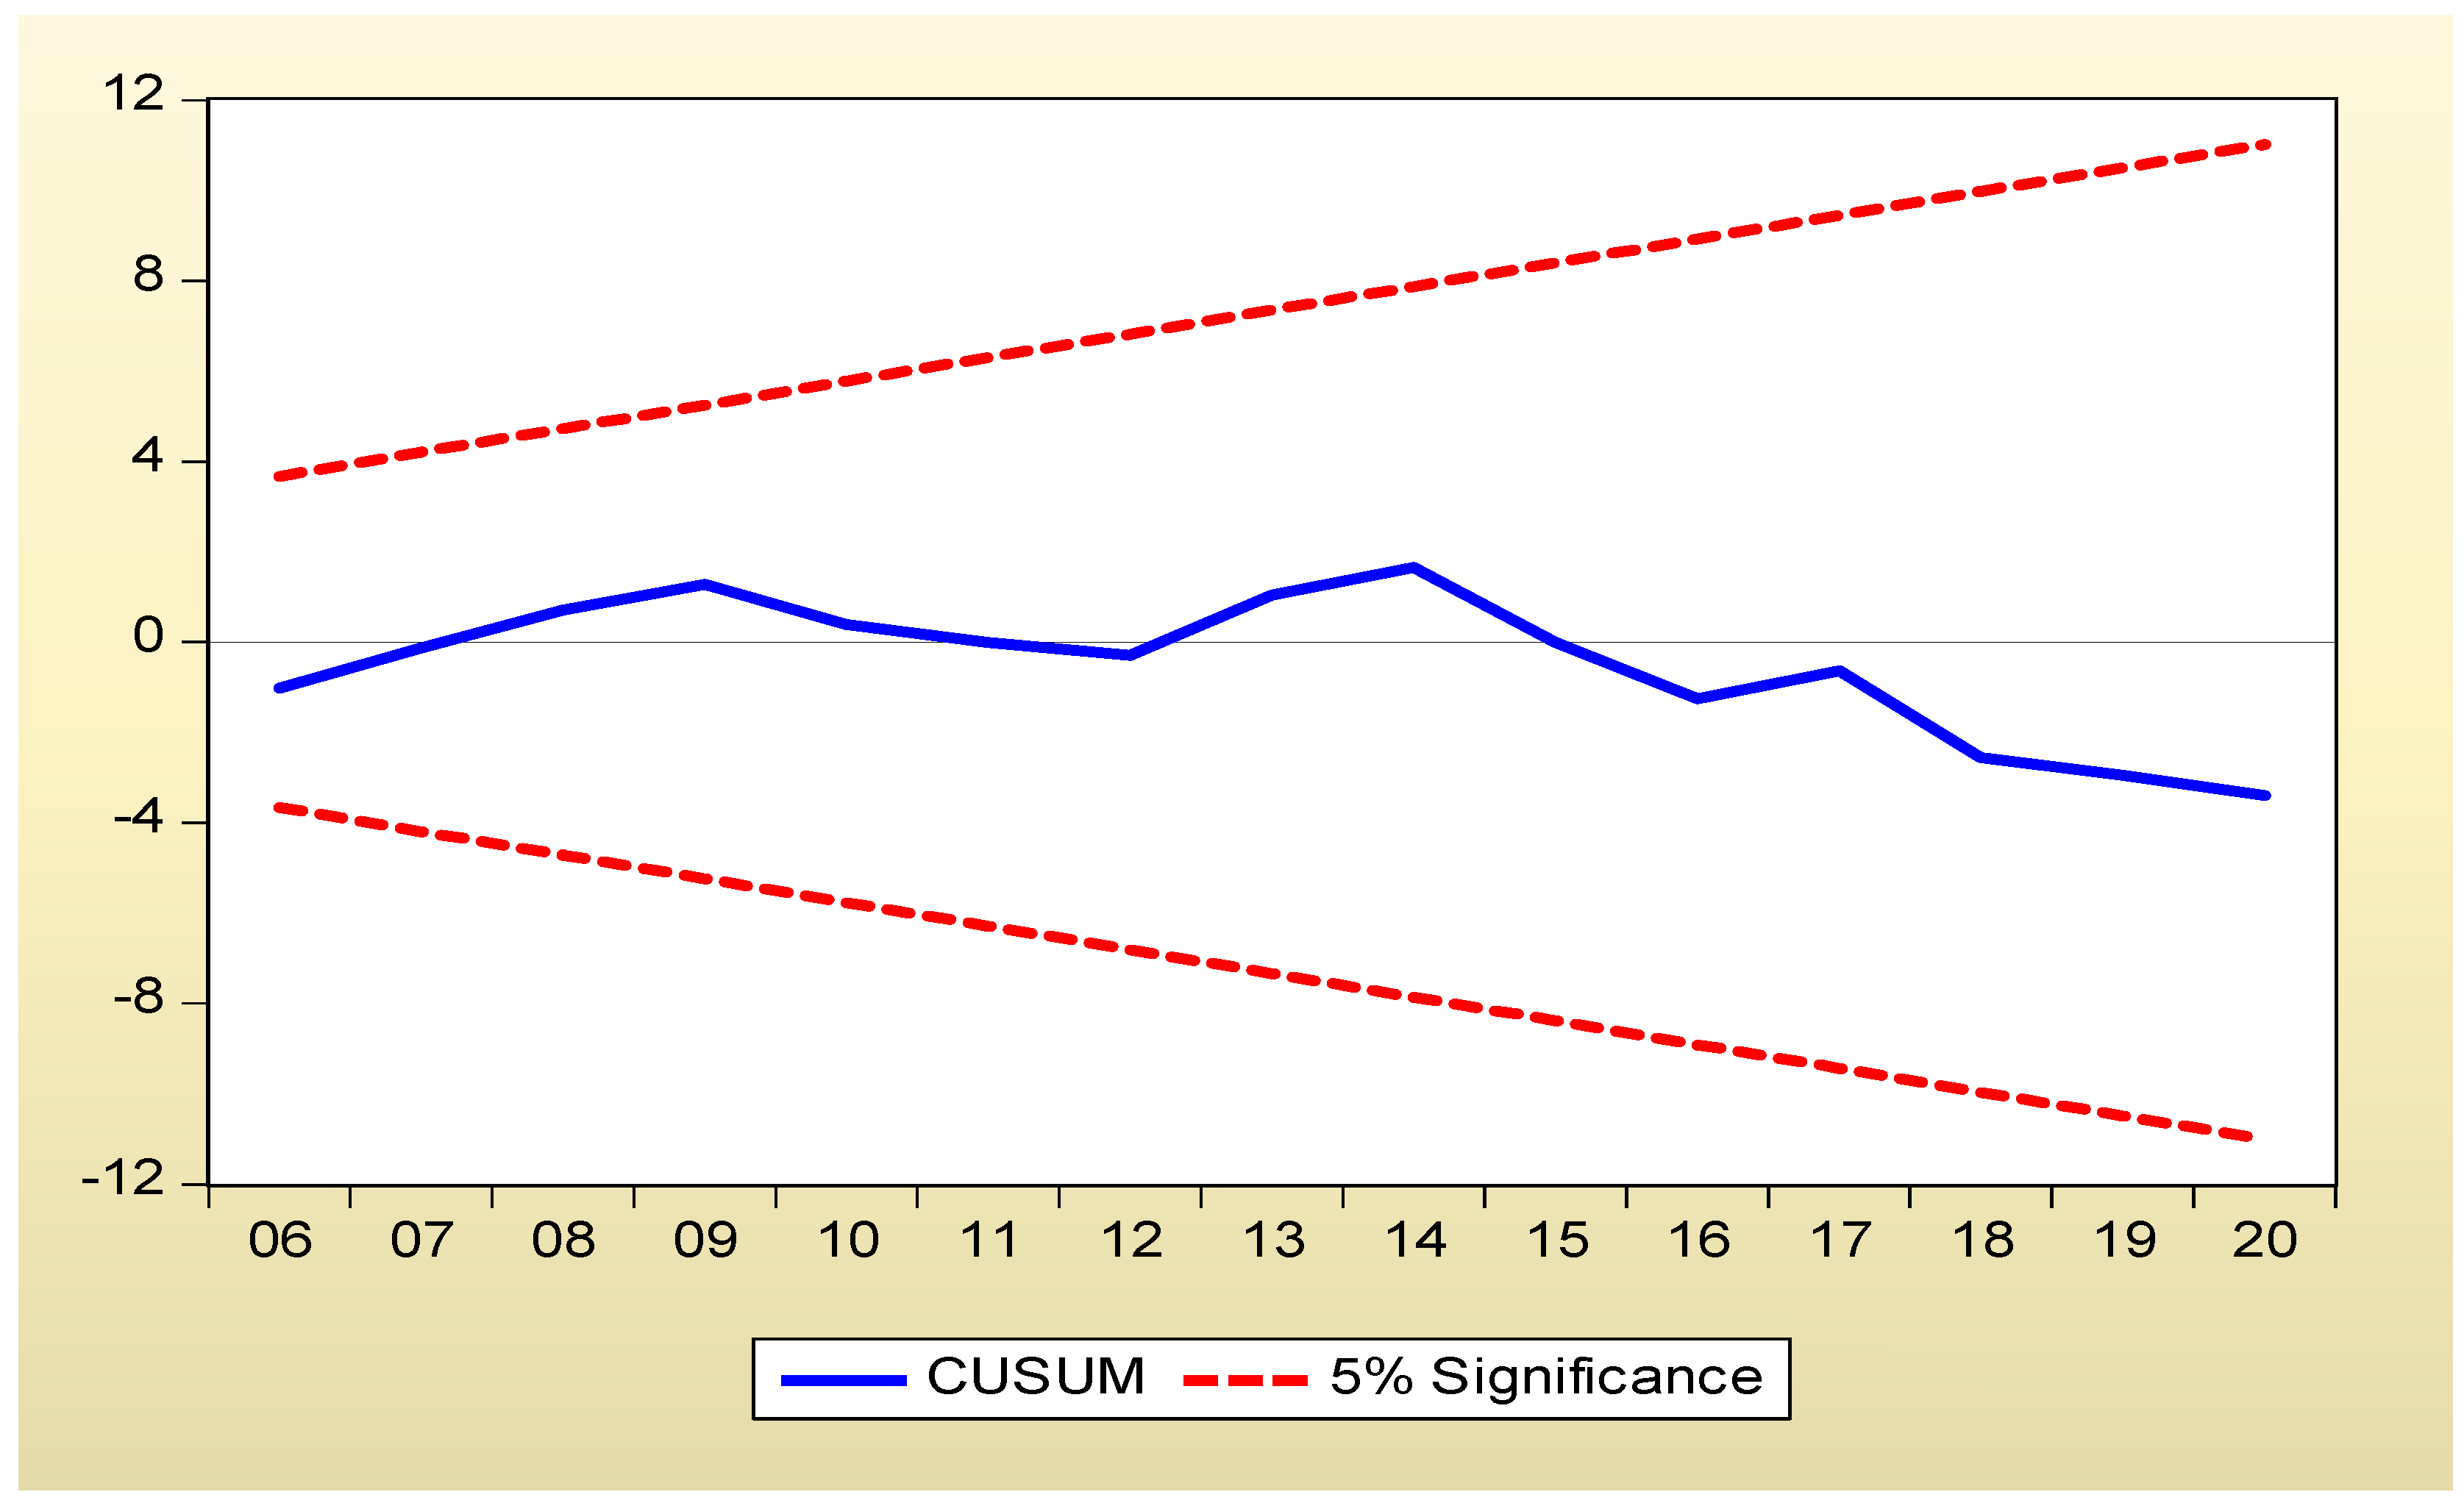
4.6. Sensitivity Analysis
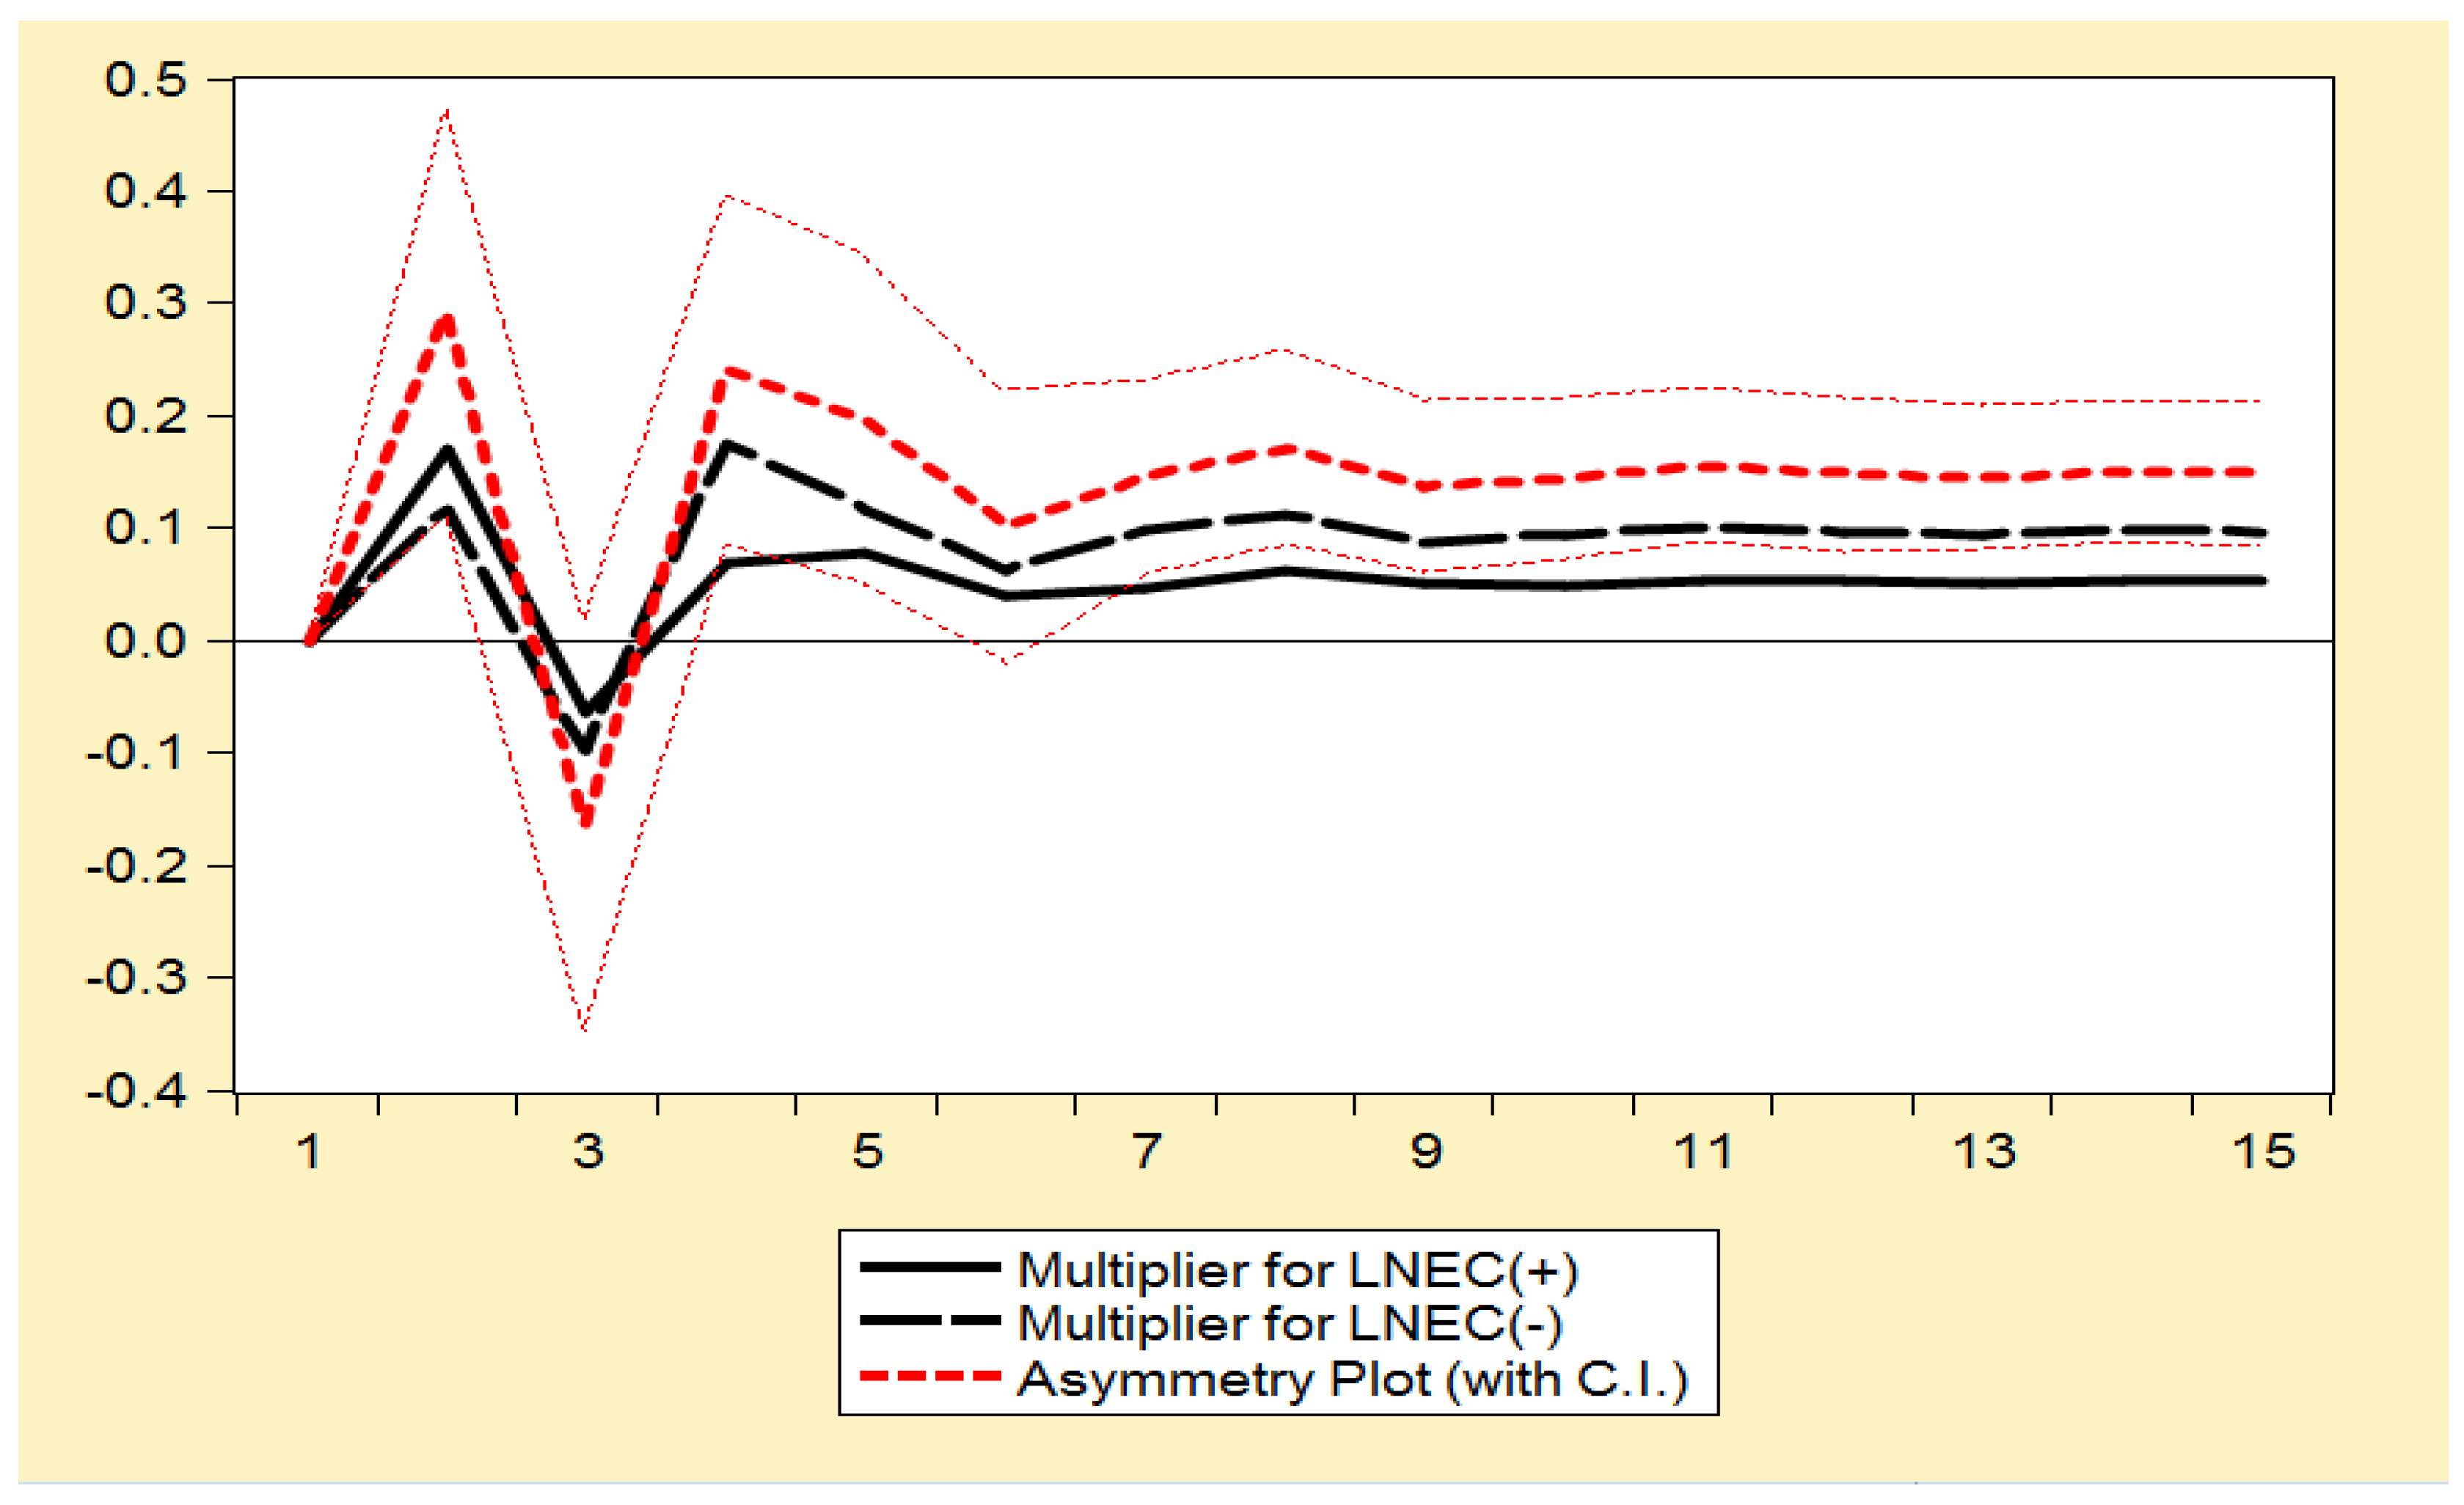
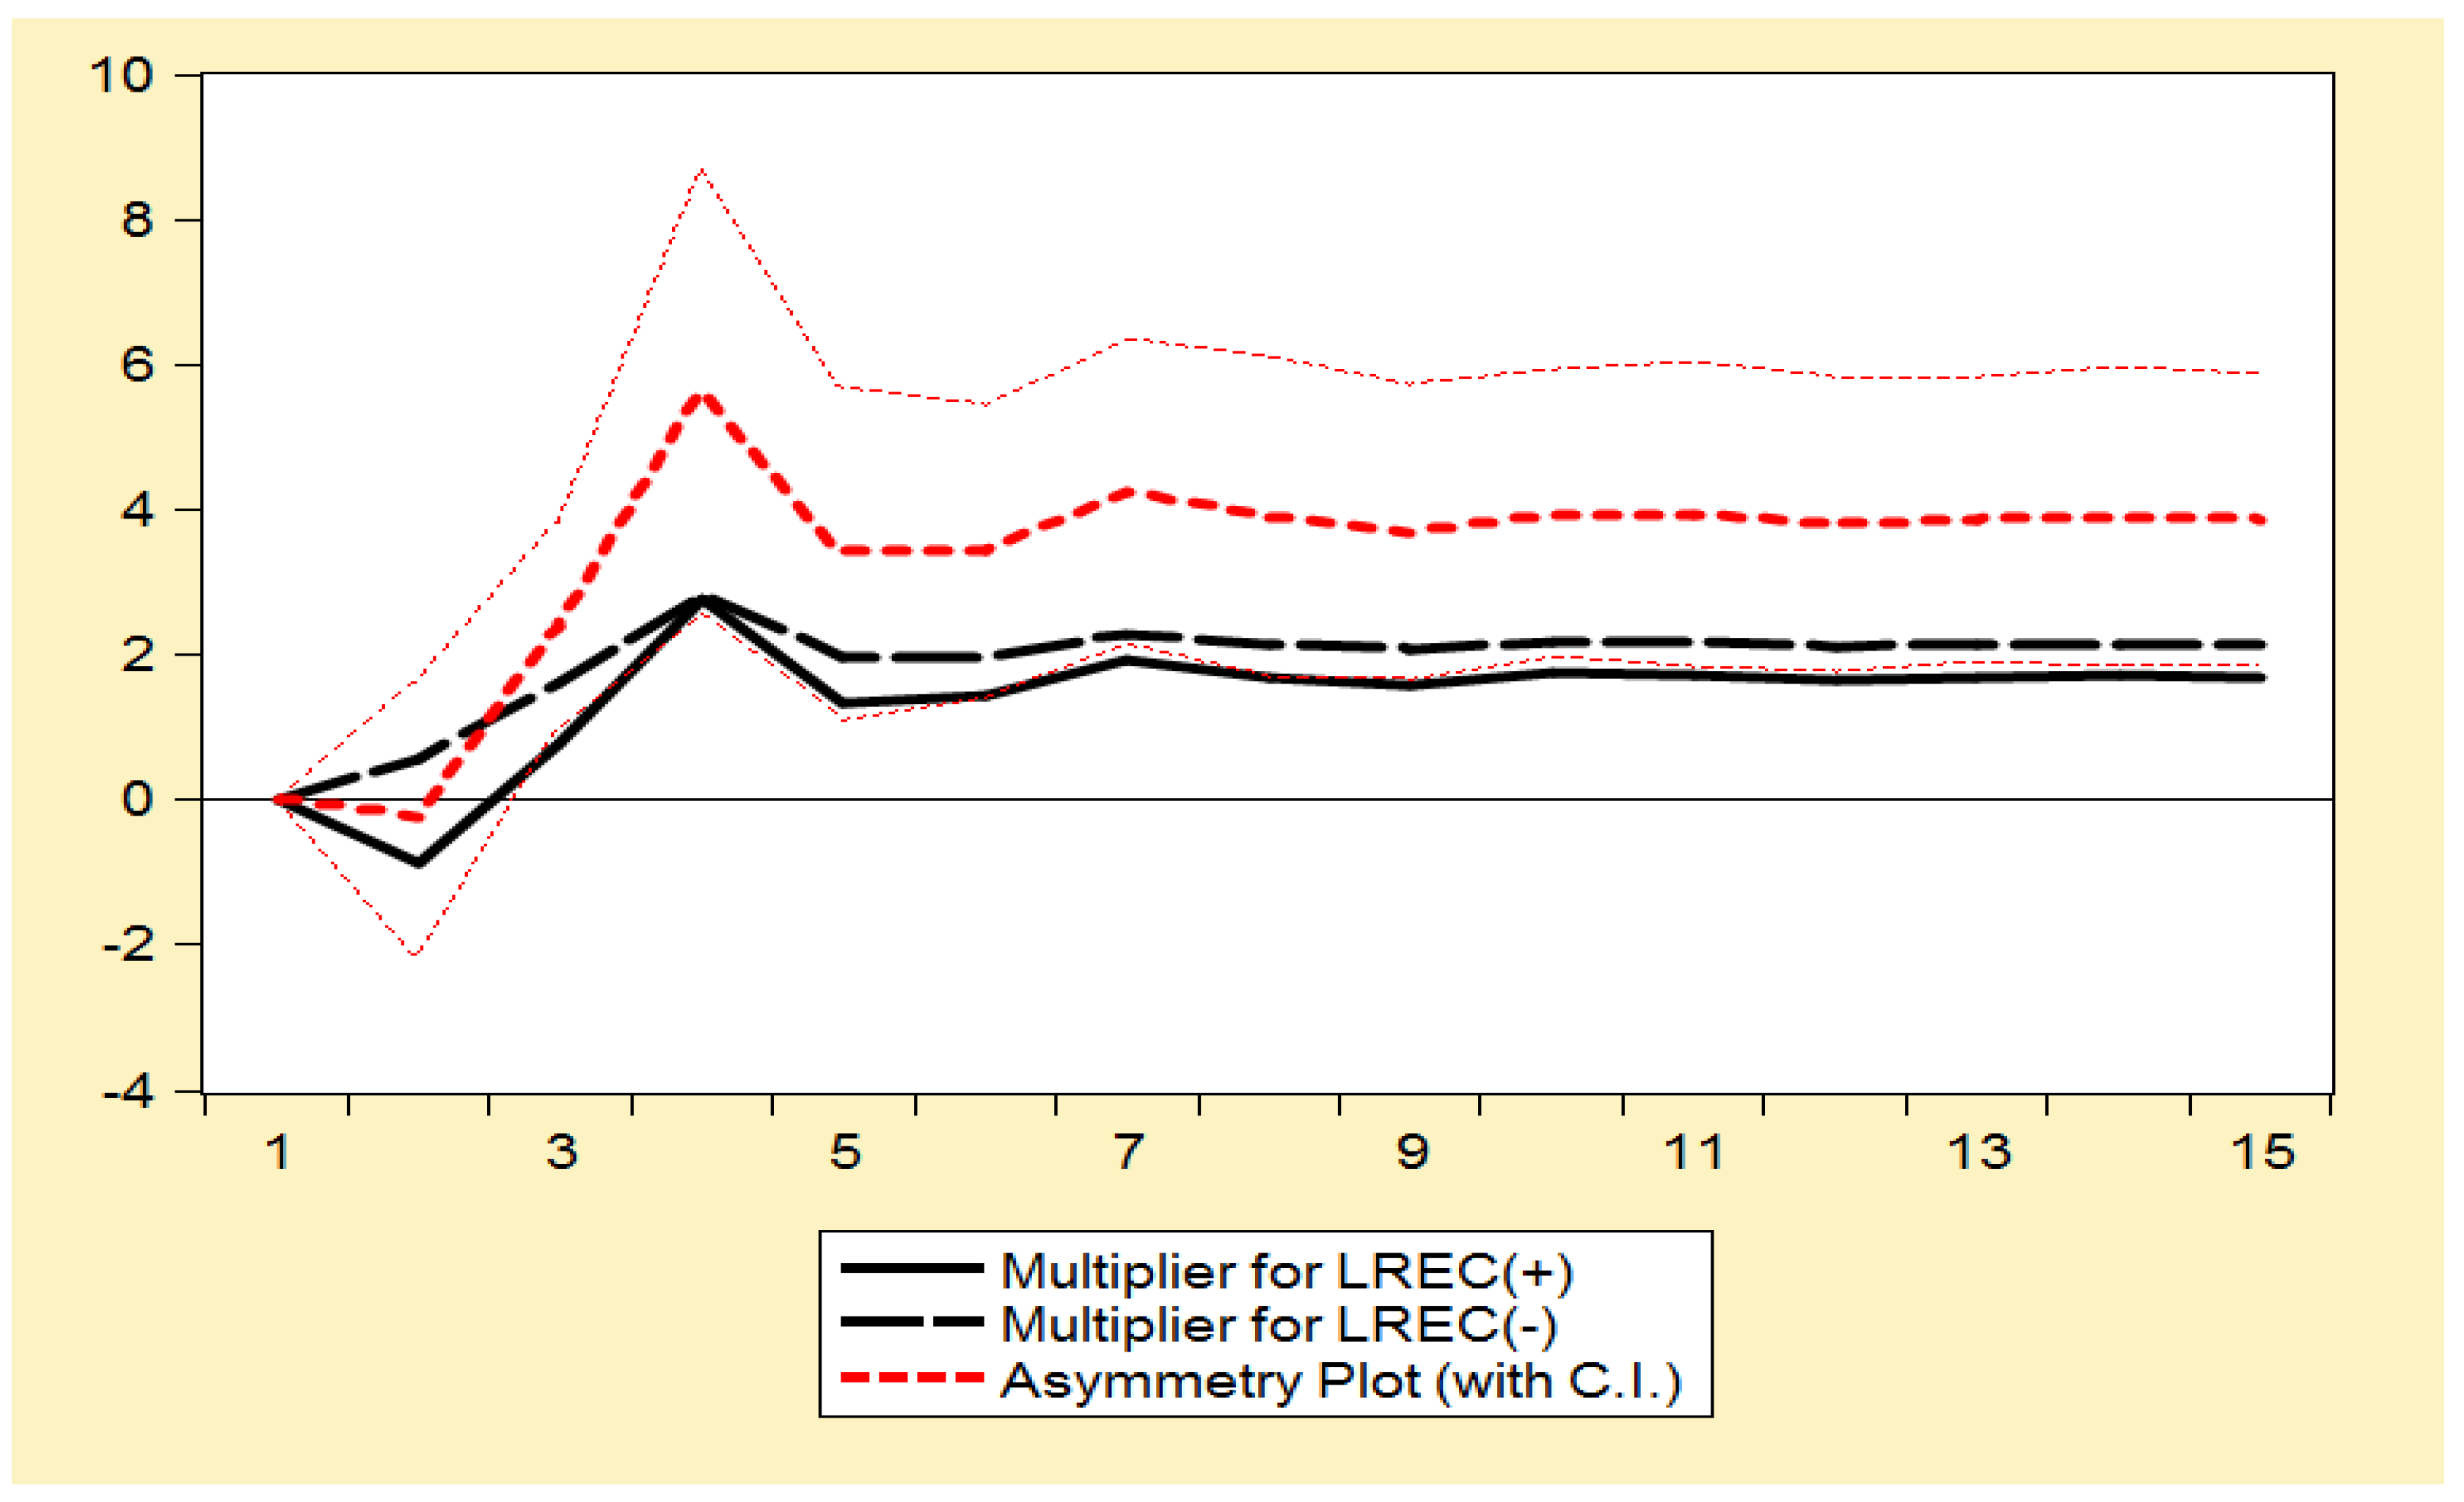
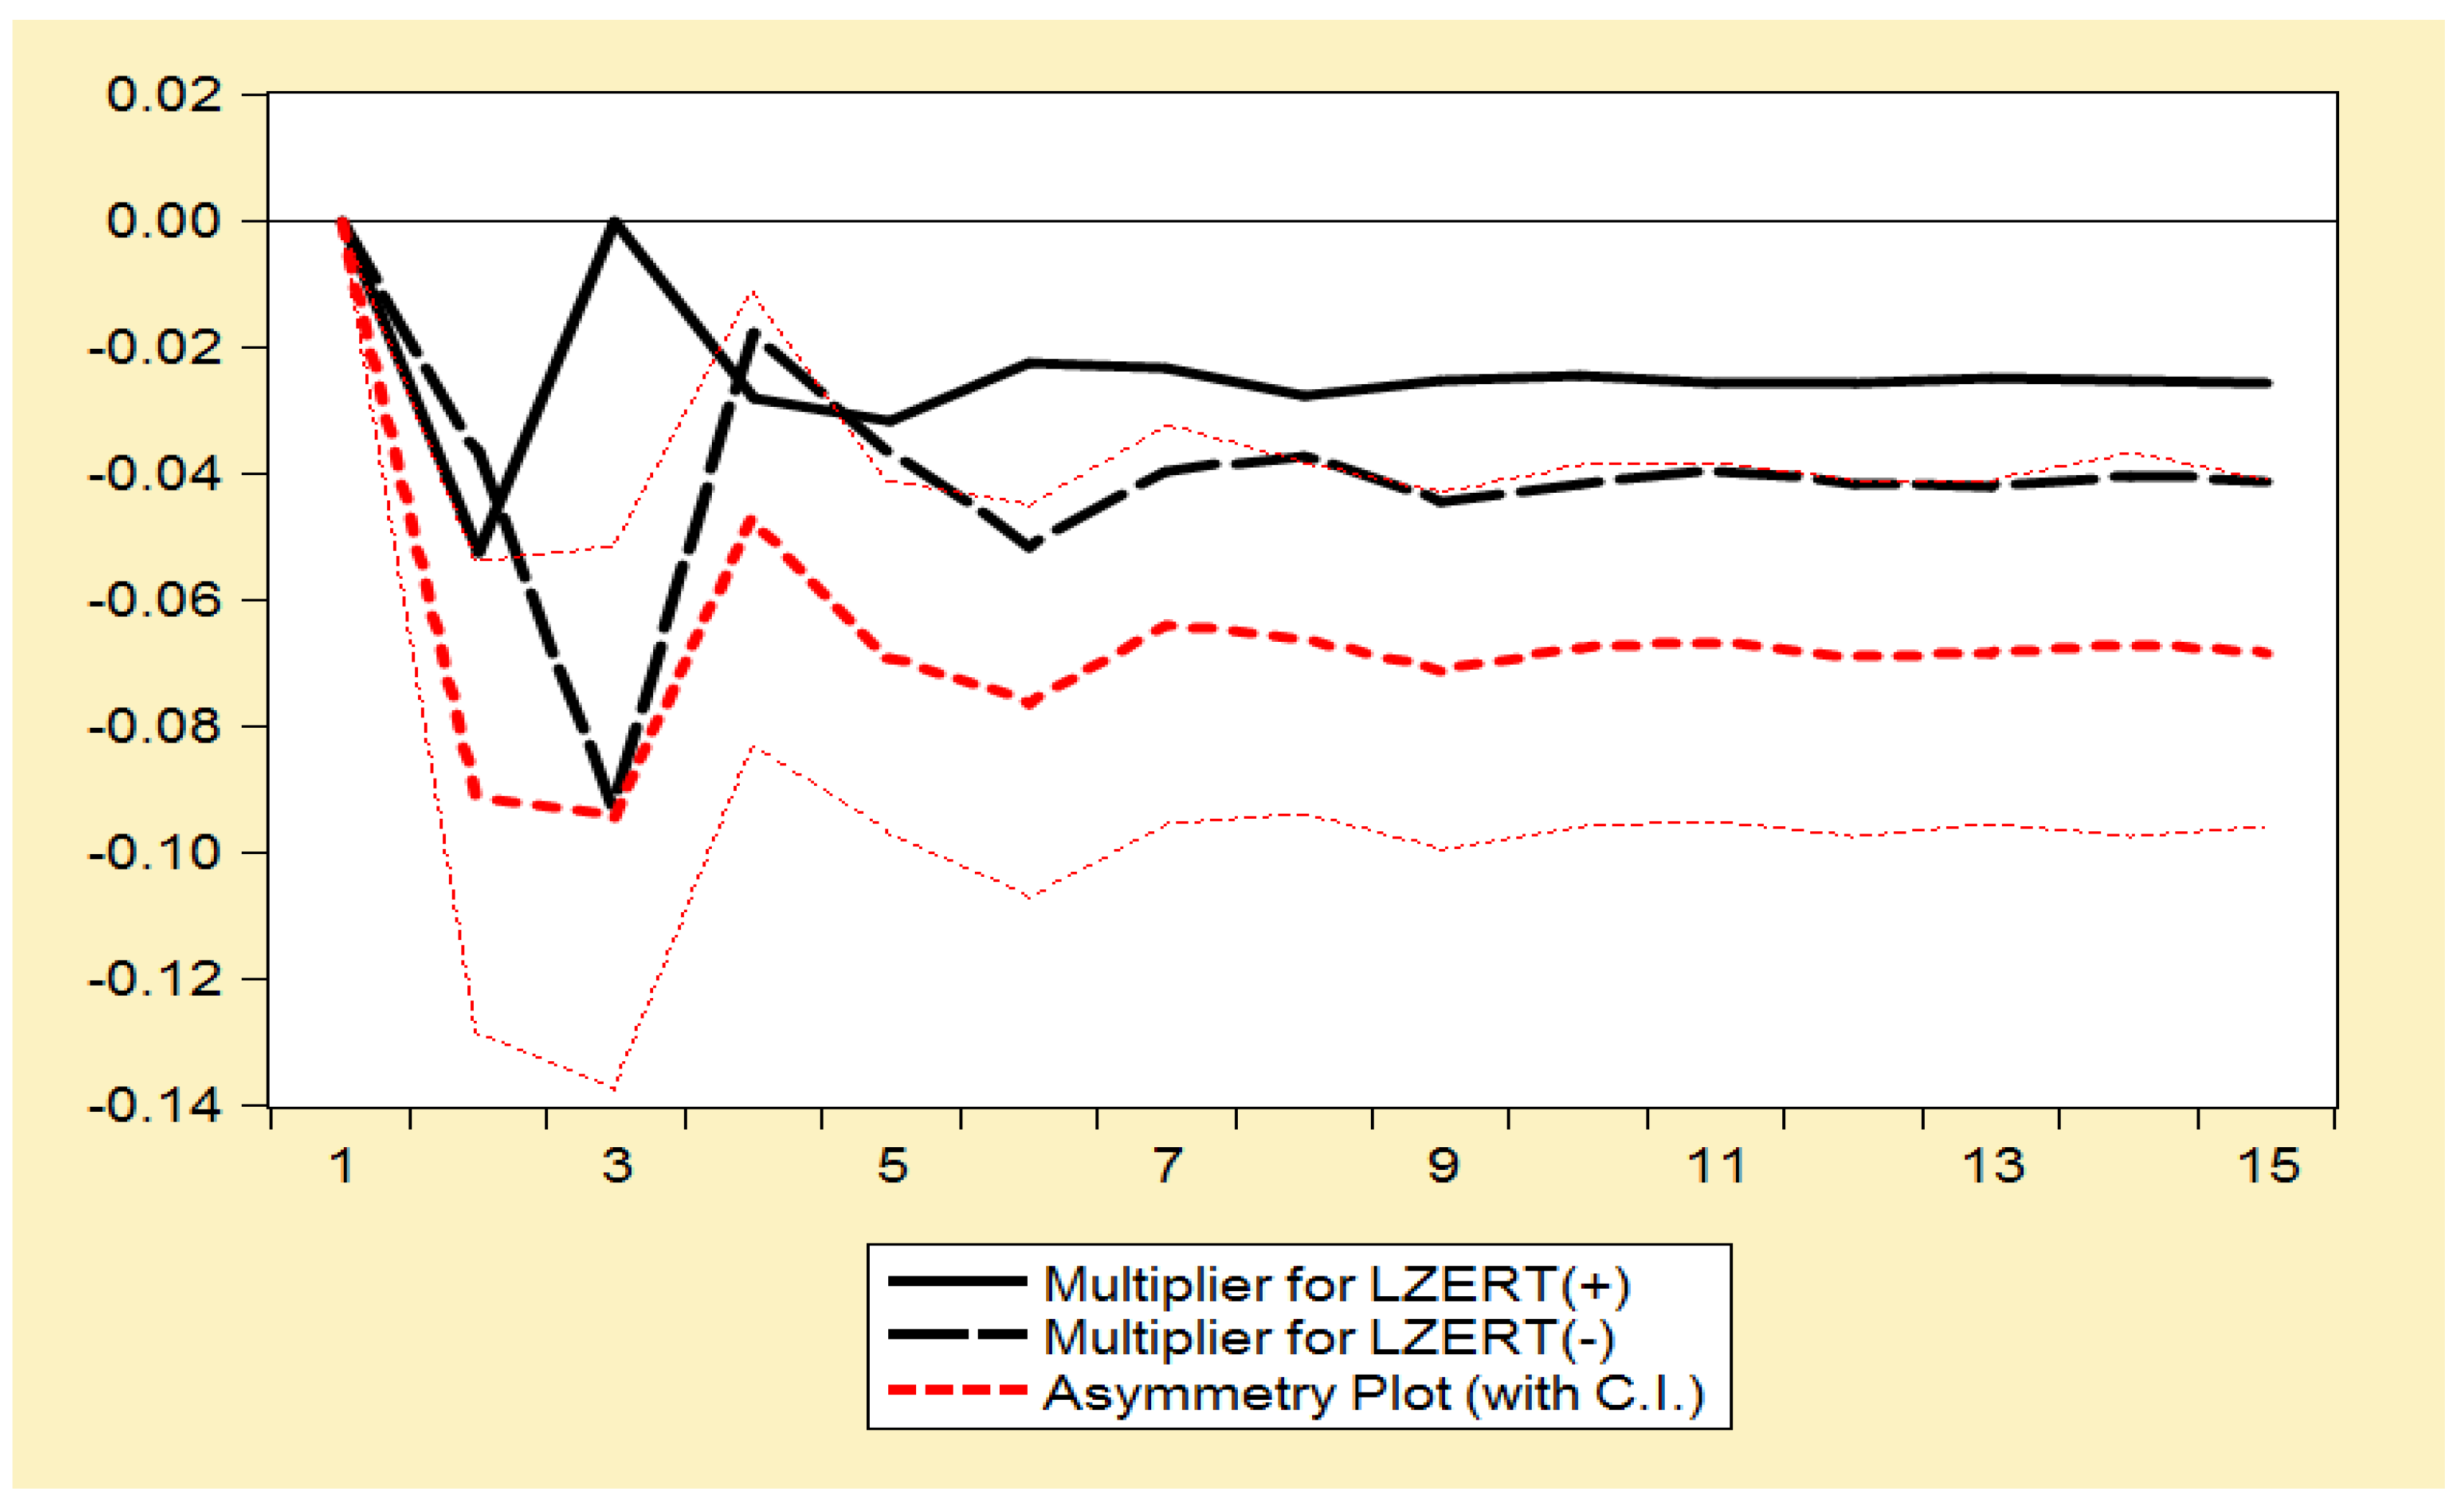
4.7. Testing Asymmetry in the Series
5. Conclusions and Policy Suggestions
Author Contributions
Funding
Informed Consent Statement
Data Availability Statement
Conflicts of Interest
Abbreviations
References
- Yang, B.; Usman, M.; Jahanger, A. Do industrialization, economic growth and globalization processes influence the ecological footprint and healthcare expenditures? Fresh insights based on the STIRPAT model for countries with the highest healthcare expenditures. Sustain. Prod. Consum. 2021, 28, 893–910. [Google Scholar] [CrossRef]
- IEA. Global Energy Review 2021. Available online: https://www.iea.org/reports/global-energy-review-2021 (accessed on 15 February 2022).
- Kamal, M.; Usman, M.; Jahanger, A.; Balsalobre-Lorente, D. Revisiting the Role of Fiscal Policy, Financial Development, and Foreign Direct Investment in Reducing Environmental Pollution during Globalization Mode: Evidence from Linear and Nonlinear Panel Data Approaches. Energies 2021, 14, 6968. [Google Scholar] [CrossRef]
- Usman, M.; Kousar, R.; Makhdum, M.S.A.; Yaseen, M.R.; Nadeem, A.M. Do financial development, economic growth, energy consumption, and trade openness contribute to increase carbon emission in Pakistan? An insight based on ARDL bound testing approach. Environ. Dev. Sustain. 2022, 1–30. [Google Scholar] [CrossRef]
- Yang, B.; Jahanger, A.; Usman, M.; Khan, M.A. The dynamic linkage between globalization, financial development, energy utilization, and environmental sustainability in GCC countries. Environ. Sci. Pollut. Res. 2021, 28, 16568–16588. [Google Scholar] [CrossRef]
- Usman, M.; Makhdum, M.S.A. What abates ecological footprint in BRICS-T region? Exploring the influence of renewable energy, non-renewable energy, agriculture, forest area and financial development. Renew. Energy 2021, 179, 12–28. [Google Scholar] [CrossRef]
- Usman, M.; Khalid, K.; Mehdi, M.A. What determines environmental deficit in Asia? Embossing the role of renewable and non-renewable energy utilization. Renew. Energy 2021, 168, 1165–1176. [Google Scholar] [CrossRef]
- Ramzan, M.; Raza, S.A.; Usman, M.; Sharma, G.D.; Iqbal, H.A. Environmental cost of non-renewable energy and economic progress: Do ICT and financial development mitigate some burden? J. Clean. Prod. 2021, 333, 130066. [Google Scholar] [CrossRef]
- Jahanger, A.; Usman, M.; Murshed, M.; Mahmood, H.; Balsalobre-Lorente, D. The linkages between natural resources, human capital, globalization, economic growth, financial development, and ecological footprint: The moderating role of technological innovations. Resour. Policy 2022, 76, 102569. [Google Scholar] [CrossRef]
- Ahmad, U.S.; Usman, M.; Hussain, S.; Jahanger, A.; Abrar, M. Determinants of renewable energy sources in Pakistan: An overview. Environ. Sci. Pollut. Res. 2022, 29, 29183–29201. [Google Scholar] [CrossRef]
- WDI. World Bank (World Development Indicators). Available online: https://databank.worldbank.org/source/world-development-indicators# (accessed on 14 March 2022).
- Jahanger, A.; Usman, M.; Ahmad, P. A step towards sustainable path: The effect of globalization on China’s carbon productivity from panel threshold approach. Environ. Sci. Pollut. Res. 2021, 29, 8353–8368. [Google Scholar] [CrossRef]
- Dagar, V.; Khan, M.K.; Alvarado, R.; Usman, M.; Zakari, A.; Rehman, A.; Murshed, M.; Tillaguango, B. Variations in technical efficiency of farmers with distinct land size across agro-climatic zones: Evidence from India. J. Clean. Prod. 2021, 315, 128109. [Google Scholar] [CrossRef]
- Usman, M.; Balsalobre-Lorente, D.; Jahanger, A.; Ahmad, P. Pollution concern during globalization mode in financially resource-rich countries: Do financial development, natural resources, and renewable energy consumption matter? Renew. Energy 2022, 183, 90–102. [Google Scholar] [CrossRef]
- NEI, Statistics 2018. Available online: https://www.nei.org/resources/statistics (accessed on 15 February 2022).
- Qader, M.R.; Khan, S.; Kamal, M.; Usman, M.; Haseeb, M. Forecasting carbon emissions due to electricity power generation in Bahrain. Environ. Sci. Pollut. Res. 2021, 29, 17346–17357. [Google Scholar] [CrossRef] [PubMed]
- Sadiq, M.; Shinwari, R.; Usman, M.; Ozturk, I.; Maghyereh, A.I. Linking nuclear energy, human development and carbon emission in BRICS region: Do external debt and financial globalization protect the environment? Nucl. Eng. Technol. 2022, in press. [Google Scholar] [CrossRef]
- Baek, J. Do nuclear and renewable energy improve the environment? Empirical evidence from the United States. Ecol. Indic. 2016, 66, 352–356. [Google Scholar] [CrossRef]
- Bandyopadhyay, A.; Rej, S. Can nuclear energy fuel an environmentally sustainable economic growth? Revisiting the EKC hypothesis for India. Environ. Sci. Pollut. Res. 2021, 28, 63065–63086. [Google Scholar] [CrossRef]
- Lau, L.-S.; Choong, C.-K.; Ng, C.-F.; Liew, F.-M.; Ching, S.-L. Is nuclear energy clean? Revisit of Environmental Kuznets Curve hypothesis in OECD countries. Econ. Model. 2019, 77, 12–20. [Google Scholar] [CrossRef]
- Mahmood, N.; Danish; Wang, Z.; Zhang, B. The role of nuclear energy in the correction of environmental pollution: Evidence from Pakistan. Nucl. Eng. Technol. 2020, 52, 1327–1333. [Google Scholar] [CrossRef]
- Wang, Z.; Danish; Zhang, B.; Wang, B. Renewable energy consumption, economic growth and human development index in Pakistan: Evidence form simultaneous equation model. J. Clean. Prod. 2018, 184, 1081–1090. [Google Scholar] [CrossRef]
- Usman, M.; Hammar, N. Dynamic relationship between technological innovations, financial development, renewable energy, and ecological footprint: Fresh insights based on the STIRPAT model for Asia Pacific Economic Cooperation countries. Environ. Sci. Pollut. Res. 2021, 28, 15519–15536. [Google Scholar] [CrossRef]
- Rahman, M.M.; Alam, K.; Velayutham, E. Reduction of CO2 emissions: The role of renewable energy, technological innovation and export quality. Energy Rep. 2022, 8, 2793–2805. [Google Scholar] [CrossRef]
- Zhang, F. In the Dark: How Much Do Power Sector Distortions Cost South Asia? World Bank Publications: Washington, DC, USA, 2018. Available online: https://openknowledge.worldbank.org/bitstream/handle/10986/30923/9781464811548.pdf?sequence=8 (accessed on 10 March 2022).
- IEP. Pakistan Energy Demand Forecast (2021–2030) Report. 2021. Available online: https://www.pc.gov.pk/uploads/report/IEP_Report_FINAL.pdf (accessed on 24 March 2022).
- Usman, M.; Jahanger, A.; Makhdum, M.S.A.; Balsalobre-Lorente, D.; Bashir, A. How do financial development, energy consumption, natural resources, and globalization affect Arctic countries’ economic growth and environmental quality? An advanced panel data simulation. Energy 2021, 241, 122515. [Google Scholar] [CrossRef]
- Hassan, S.T.; Danish; Khan, S.-U.D.; Baloch, M.A.; Tarar, Z.H. Is nuclear energy a better alternative for mitigating CO2 emissions in BRICS countries? An empirical analysis. Nucl. Eng. Technol. 2020, 52, 2969–2974. [Google Scholar] [CrossRef]
- Hassan, S.T.; Khan, D.; Zhu, B.; Batool, B. Is public service transportation increase environmental contamination in China? The role of nuclear energy consumption and technological change. Energy 2022, 238, 121890. [Google Scholar] [CrossRef]
- Kartal, M.T. The role of consumption of energy, fossil sources, nuclear energy, and renewable energy on environmental degradation in top-five carbon producing countries. Renew. Energy 2022, 184, 871–880. [Google Scholar] [CrossRef]
- Rehman, A.; Ma, H.; Ozturk, I.; Radulescu, M. Revealing the dynamic effects of fossil fuel energy, nuclear energy, renewable energy, and carbon emissions on Pakistan’s economic growth. Environ. Sci. Pollut. Res. 2022, 1–11. [Google Scholar] [CrossRef] [PubMed]
- Saidi, K.; Omri, A. Reducing CO2 emissions in OECD countries: Do renewable and nuclear energy matter? Prog. Nucl. Energy 2020, 126, 103425. [Google Scholar] [CrossRef]
- Baek, J.; Pride, D. On the income–nuclear energy–CO2 emissions nexus revisited. Energy Econ. 2014, 43, 6–10. [Google Scholar] [CrossRef]
- Danish; Ulucak, R.; Erdogan, S. The effect of nuclear energy on the environment in the context of globalization: Consumption vs. production-based CO2 emissions. Nucl. Eng. Technol. 2021, 54, 1312–1320. [Google Scholar] [CrossRef]
- Usman, A.; Ullah, S.; Ozturk, I.; Chishti, M.Z.; Zafar, S.M. Analysis of asymmetries in the nexus among clean energy and environmental quality in Pakistan. Environ. Sci. Pollut. Res. 2020, 27, 20736–20747. [Google Scholar] [CrossRef]
- Sarkodie, S.A.; Adams, S. Renewable energy, nuclear energy, and environmental pollution: Accounting for political institutional quality in South Africa. Sci. Total Environ. 2018, 643, 1590–1601. [Google Scholar] [CrossRef] [PubMed]
- Bilal, A.; Li, X.; Zhu, N.; Sharma, R.; Jahanger, A. Green Technology Innovation, Globalization, and CO2 Emissions: Recent Insights from the OBOR Economies. Sustainability 2022, 14, 236. [Google Scholar] [CrossRef]
- Lin, B.; Ma, R. Green technology innovations, urban innovation environment and CO2 emission reduction in China: Fresh evidence from a partially linear functional-coefficient panel model. Technol. Forecast. Soc. Change 2022, 176, 121434. [Google Scholar] [CrossRef]
- Yang, B.; Jahanger, A.; Ali, M. Remittance inflows affect the ecological footprint in BICS countries: Do technological innovation and financial development matter? Environ. Sci. Pollut. Res. 2021, 28, 23482–23500. [Google Scholar] [CrossRef]
- Cheng, C.; Ren, X.; Wang, Z. The impact of renewable energy and innovation on carbon emission: An empirical analysis for OECD countries. Energy Procedia 2019, 158, 3506–3512. [Google Scholar] [CrossRef]
- Chen, Y.; Lee, C.-C. Does technological innovation reduce CO2 emissions?Cross-country evidence. J. Clean. Prod. 2020, 263, 121550. [Google Scholar] [CrossRef]
- Dogan, E.; Ozturk, I. The influence of renewable and non-renewable energy consumption and real income on CO2 emissions in the USA: Evidence from structural break tests. Environ. Sci. Pollut. Res. 2017, 24, 10846–10854. [Google Scholar] [CrossRef]
- Usman, M.; Makhdum, M.S.A.; Kousar, R. Does financial inclusion, renewable and non-renewable energy utilization accelerate ecological footprints and economic growth? Fresh evidence from 15 highest emitting countries. Sustain. Cities Soc. 2021, 65, 102590. [Google Scholar] [CrossRef]
- Dong, K.; Sun, R.; Jiang, H.; Zeng, X. CO2 emissions, economic growth, and the environmental Kuznets curve in China: What roles can nuclear energy and renewable energy play? J. Clean. Prod. 2018, 196, 51–63. [Google Scholar] [CrossRef]
- Huang, Y.; Haseeb, M.; Usman, M.; Ozturk, I. Dynamic association between ICT, renewable energy, economic complexity and ecological footprint: Is there any difference between E-7 (developing) and G-7 (developed) countries? Technol. Soc. 2022, 68, 101853. [Google Scholar] [CrossRef]
- Wan, X.; Jahanger, A.; Usman, M.; Radulescu, M.; Balsalobre-Lorente, D.; Yu, Y. Exploring the Effects of Economic Complexity and the Transition to a Clean Energy Pattern on Ecological Footprint From the Indian Perspective. Front. Environ. Sci. 2022, 9, 1–17. [Google Scholar] [CrossRef]
- Usman, M.; Anwar, S.; Yaseen, M.R.; Makhdum, M.S.A.; Kousar, R.; Jahanger, A. Unveiling the dynamic relationship between agriculture value addition, energy utilization, tourism and environmental degradation in South Asia. J. Public Aff. 2021, e2712. [Google Scholar] [CrossRef]
- GFPN. Global Footprint Network. Available online: https://www.footprintnetwork.org/our-work/ecological-footprint (accessed on 14 March 2022).
- BP (British Petroleum). Statistical Review of World Nuclear Energy. BP Database. Available online: https://www.bp.com/en/global/corporate/energy-economics/statistical-review-of-world-energy/nuclear-energy.html (accessed on 14 March 2022).
- WB. World Development Indicators. (Online). Available online: https://databank.worldbank.org/source/world-developmentindicators (accessed on 25 December 2021).
- OECD. OECD Stat. Environmental-Related Statistics Technologies Development of Environment-Related Technologies, % All Technologies. Available online: https://stats.oecd.org/Index.aspx?DataSetCode=PAT_IND# (accessed on 14 March 2022).
- De Leeuw, F. The Demand for Capital Goods by Manufacturers: A Study of Quarterly Time Series. Econometrica 1962, 30, 407. [Google Scholar] [CrossRef]
- Phillips, P.C.B.; Perron, P. Testing for a unit root in time series regression. Biometrika 1988, 75, 335–346. [Google Scholar] [CrossRef]
- Dickey, D.A.; Fuller, W.A. Distribution of the Estimators for Autoregressive Time Series with a Unit Root. J. Am. Stat. Assoc. 1979, 74, 427–431. [Google Scholar] [CrossRef]
- Zivot, E.; Andrews, D.W.K. Further Evidence on the Great Crash, the Oil-Price Shock, and the Unit-Root Hypothesis. J. Bus. Econ. Stat. 2002, 20, 25–44. [Google Scholar] [CrossRef]
- Gregory, A.W.; Hansen, B.E. Residual-based tests for cointegration in models with regime shifts. J. Econ. 1996, 70, 99–126. [Google Scholar] [CrossRef] [Green Version]
- Shin, Y.; Yu, B.; Greenwood-Nimmo, M. Modelling Asymmetric Cointegration and Dynamic Multipliers in a Nonlinear ARDL Framework. In Festschrift in Honor of Peter Schmidt: Econometric Methods and Applications; Sickles, R.C., Horrace, W.C., Eds.; Springer: New York, NY, USA, 2014; pp. 281–314. [Google Scholar]
- Pesaran, M.H.; Shin, Y.; Smith, R.J. Bounds testing approaches to the analysis of level relationships. J. Appl. Econom. 2001, 16, 289–326. [Google Scholar] [CrossRef]
- Hashmi, S.M.; Chang, B.H.; Shahbaz, M. Asymmetric effect of exchange rate volatility on India’s cross-border trade: Evidence from global financial crisis and multiple threshold nonlinear autoregressive distributed lag model. Aust. Econ. Pap. 2021, 60, 64–97. [Google Scholar] [CrossRef]
- Broock, W.A.; Scheinkman, J.A.; Dechert, W.D.; LeBaron, B. A test for independence based on the correlation dimension. Econ. Rev. 1996, 15, 197–235. [Google Scholar] [CrossRef]
- Majeed, M.T.; Ozturk, I.; Samreen, I.; Luni, T. Evaluating the asymmetric effects of nuclear energy on carbon emissions in Pakistan. Nucl. Eng. Technol. 2021, 54, 1664–1673. [Google Scholar] [CrossRef]
- IAEA. Nuclear Power and the Paris Agreement. International Atomic Energy Agency (IAEA), Vienna. Available online: https://www.iaea.org/node/41617 (accessed on 25 March 2022).
- Khalid, K.; Usman, M.; Mehdi, M.A. The determinants of environmental quality in the SAARC region: A spatial heterogeneous panel data approach. Environ. Sci. Pollut. Res. 2021, 28, 6422–6436. [Google Scholar] [CrossRef] [PubMed]
- Usman, M.; Balsalobre-Lorente, D. Environmental concern in the era of industrialization: Can financial development, renewable energy and natural resources alleviate some load? Energy Policy 2022, 162, 112780. [Google Scholar] [CrossRef]
- Balsalobre-Lorente, D.; Ibáñez-Luzón, L.; Usman, M.; Shahbaz, M. The environmental Kuznets curve, based on the economic complexity, and the pollution haven hypothesis in PIIGS countries. Renew. Energy 2022, 185, 1441–1455. [Google Scholar] [CrossRef]
- Usman, M.; Kousar, R.; Yaseen, M.R.; Makhdum, M.S.A. An empirical nexus between economic growth, energy utilization, trade policy, and ecological footprint: A continent-wise comparison in upper-middle-income countries. Environ. Sci. Pollut. Res. 2020, 27, 38995–39018. [Google Scholar] [CrossRef]
- Jahanger, A.; Usman, M.; Balsalobre-Lorente, D. Autocracy, democracy, globalization, and environmental pollution in developing world: Fresh evidence from STIRPAT model. J. Public Aff. 2021, e2753. [Google Scholar] [CrossRef]
- Komal, R.; Abbas, F. Linking financial development, economic growth and energy consumption in Pakistan. Renew. Sustain. Energy Rev. 2015, 44, 211–220. [Google Scholar] [CrossRef]
- Usman, M.; Kousar, R.; Makhdum, M.S.A. The role of financial development, tourism, and energy utilization in environmental deficit: Evidence from 20 highest emitting economies. Environ. Sci. Pollut. Res. 2020, 27, 42980–42995. [Google Scholar] [CrossRef]
- Rosa, P.; Sassanelli, C.; Urbinati, A.; Chiaroni, D.; Terzi, S. Assessing relations between Circular Economy and Industry 4.0: A systematic literature review. Int. J. Prod. Res. 2020, 58, 1662–1687. [Google Scholar] [CrossRef] [Green Version]
- UNEP. Towards a Green Economy: Pathways to Sustainable Development and Poverty Eradication—A Synthesis for Policy Makers. Available online: www.unep.org/greeneconomy. (accessed on 20 March 2022).
- Usman, M.; Jahanger, A. Heterogeneous effects of remittances and institutional quality in reducing environmental deficit in the presence of EKC hypothesis: A global study with the application of panel quantile regression. Environ. Sci. Pollut. Res. 2021, 28, 37292–37310. [Google Scholar] [CrossRef]
- Ramzan, M.; Iqbal, H.A.; Usman, M.; Ozturk, I. Environmental pollution and agricultural productivity in Pakistan: New insights from ARDL and wavelet coherence approaches. Environ. Sci. Pollut. Res. 2022, 29, 28749–28768. [Google Scholar] [CrossRef] [PubMed]
- Intisar, R.A.; Yaseen, M.R.; Kousar, R.; Usman, M.; Makhdum, M.S.A. Impact of Trade Openness and Human Capital on Economic Growth: A Comparative Investigation of Asian Countries. Sustainability 2020, 12, 2930. [Google Scholar] [CrossRef] [Green Version]


| Authors | Countries | Duration | Variables | Techniques | Outcomes |
|---|---|---|---|---|---|
| (A) Nexus between nuclear energy and environment | |||||
| Hassan et al. [29] | China | 1985–2018 | NEC, TECH, CO2 | ARDL regression | NEC is a clean energy source, while TECH is also helpful for decreasing environmental degradation. |
| Kartal [30] | Top-five carbon generating nations | 1965–2019 | NREC, NEC, REC, CO2 | MARS regression | NREC, NEC, and REC usage have mixed environmental pollution effects. |
| Saidi and Omri [32] | 15 OECD nations | 1990–2018 | NEC, REC, CO2 | FMOLS | Both NEC and REC reduce environmental degradation for the panel estimations. |
| Baek and Pride [33] | 6 nations | 1990–2007 | NEC, INC, CO2 | MCVAR | NEC reduces environmental poverty in all nations, while INC only increases environmental damages in some economies. |
| Dong et al. [44] | China | 1993–2016 | NEC, REC, NREC, CO2 | Granger causality | The outcomes also show that NEC and REC significantly reduce CO2 emissions while NREC enhances them. |
| Hassan et al. [28] | BRICS nations | 1993–2017 | NEC, REC, CO2 | CUP-FM, CUP-BC | NEC reduces environmental pollution while REC corrects environmental degradation in panel countries. |
| Ulucak and Erdogan [34] | 15 OECD nations | 2005–2016 | NEC, CO2 | D-K regression | NEC is helpful to reduce production-based environmental pollution. |
| (B) The technological innovation-environment nexus | |||||
| Rahman et al. [24] | 22 developed nations | 1990–2018 | REC, CO2, TECH | NARDL, PMG | Bidirectional causality exists among REC and CO2, TECH and CO2, GDP and REC, and REC and TECH. |
| Bilal et al. [37] | OBOR nations | 1991–2019 | TECH, CO2 | DSUR | TECH reduces the environmental damages only in OBOR. |
| Jahanger et al. [9] | 73 developing nations | 1990–2016 | NR, FD, TECH, GDP, EFP | PMG | NR and FD increase environmental pollution while TECH reduces environmental degradation. Furthermore, The EKC hypothesis for the environment is valid for developing nations. |
| Huang et al. [45] | E-7 and G-7 nations | 1995–2018 | ICT, ECX, HC, REC, EFP | AMG, and CCEMG | ICT, ECX, and HC upsurge the pollution level while REC significantly reduces it. |
| Yang et al. [39] | BICS | 1990–2016 | RMTT, FD, TECH, EFP | AMG and CCEMG | RMTT and FD significantly worsen the environment, while TECH is a vital factor in reducing pollution levels. |
| Chen and Lee [41] | 96 countries | 1996–2018 | TECH, CO2 | Spatial econometric | TECH has no significant mitigation effect on CO2 |
| (C) The renewable energy utilization-environment nexus | |||||
| Dogan and Ozturk [42] | USA | 1980–2014 | REC, NREC, CO2 | ARDL | Increases in REC mitigate environmental degradation, whereas increases in NREC contribute to environmental pollution. |
| Usman and Makhdum [6] | BRICS-T | 1990–2018 | NREC, FD, REC, EFP | AMG, and CCEMG | NREC and FD lead to produce environmental while FR and REC significantly improve environmental quality. |
| Usman et al. [7] | 20 Asian nations | 1990–2014 | GDP, NREC, REC, EFP | AMG | GDP and NREC significantly enhance the environmental damages, while REC reduces the total environmental damages. |
| Usman et al. [43] | 15 highest emitting nations | 1990–2017 | FD, REC, TRD, GDP, NREC, EFP | AMG | FD, REC and TRD significantly minimize environmental pollution, while GDP and NREC are more responsible for environmental degradation. |
| Wan et al. [46] | India | 1990–2018 | ECX, GLO, REC, GDP, NREC, EFP | ARDL | ECX, GLO, and REC play a dominant role in abating environmental damages, while GDP and NREC are more accountable for cumulative the pollution level |
| Usman et al. [47] | 7 South Asian countries | 1995–2017 | CO2, AGR, TOU, GDP, REC, NREC | FMOLS, and DOLS | AGR, GDP, NREC, and TOU increase the pollution level. However, REC has the ability to protect the environment. |
| Variables | Description | Unit of Measurement | Data Sources |
|---|---|---|---|
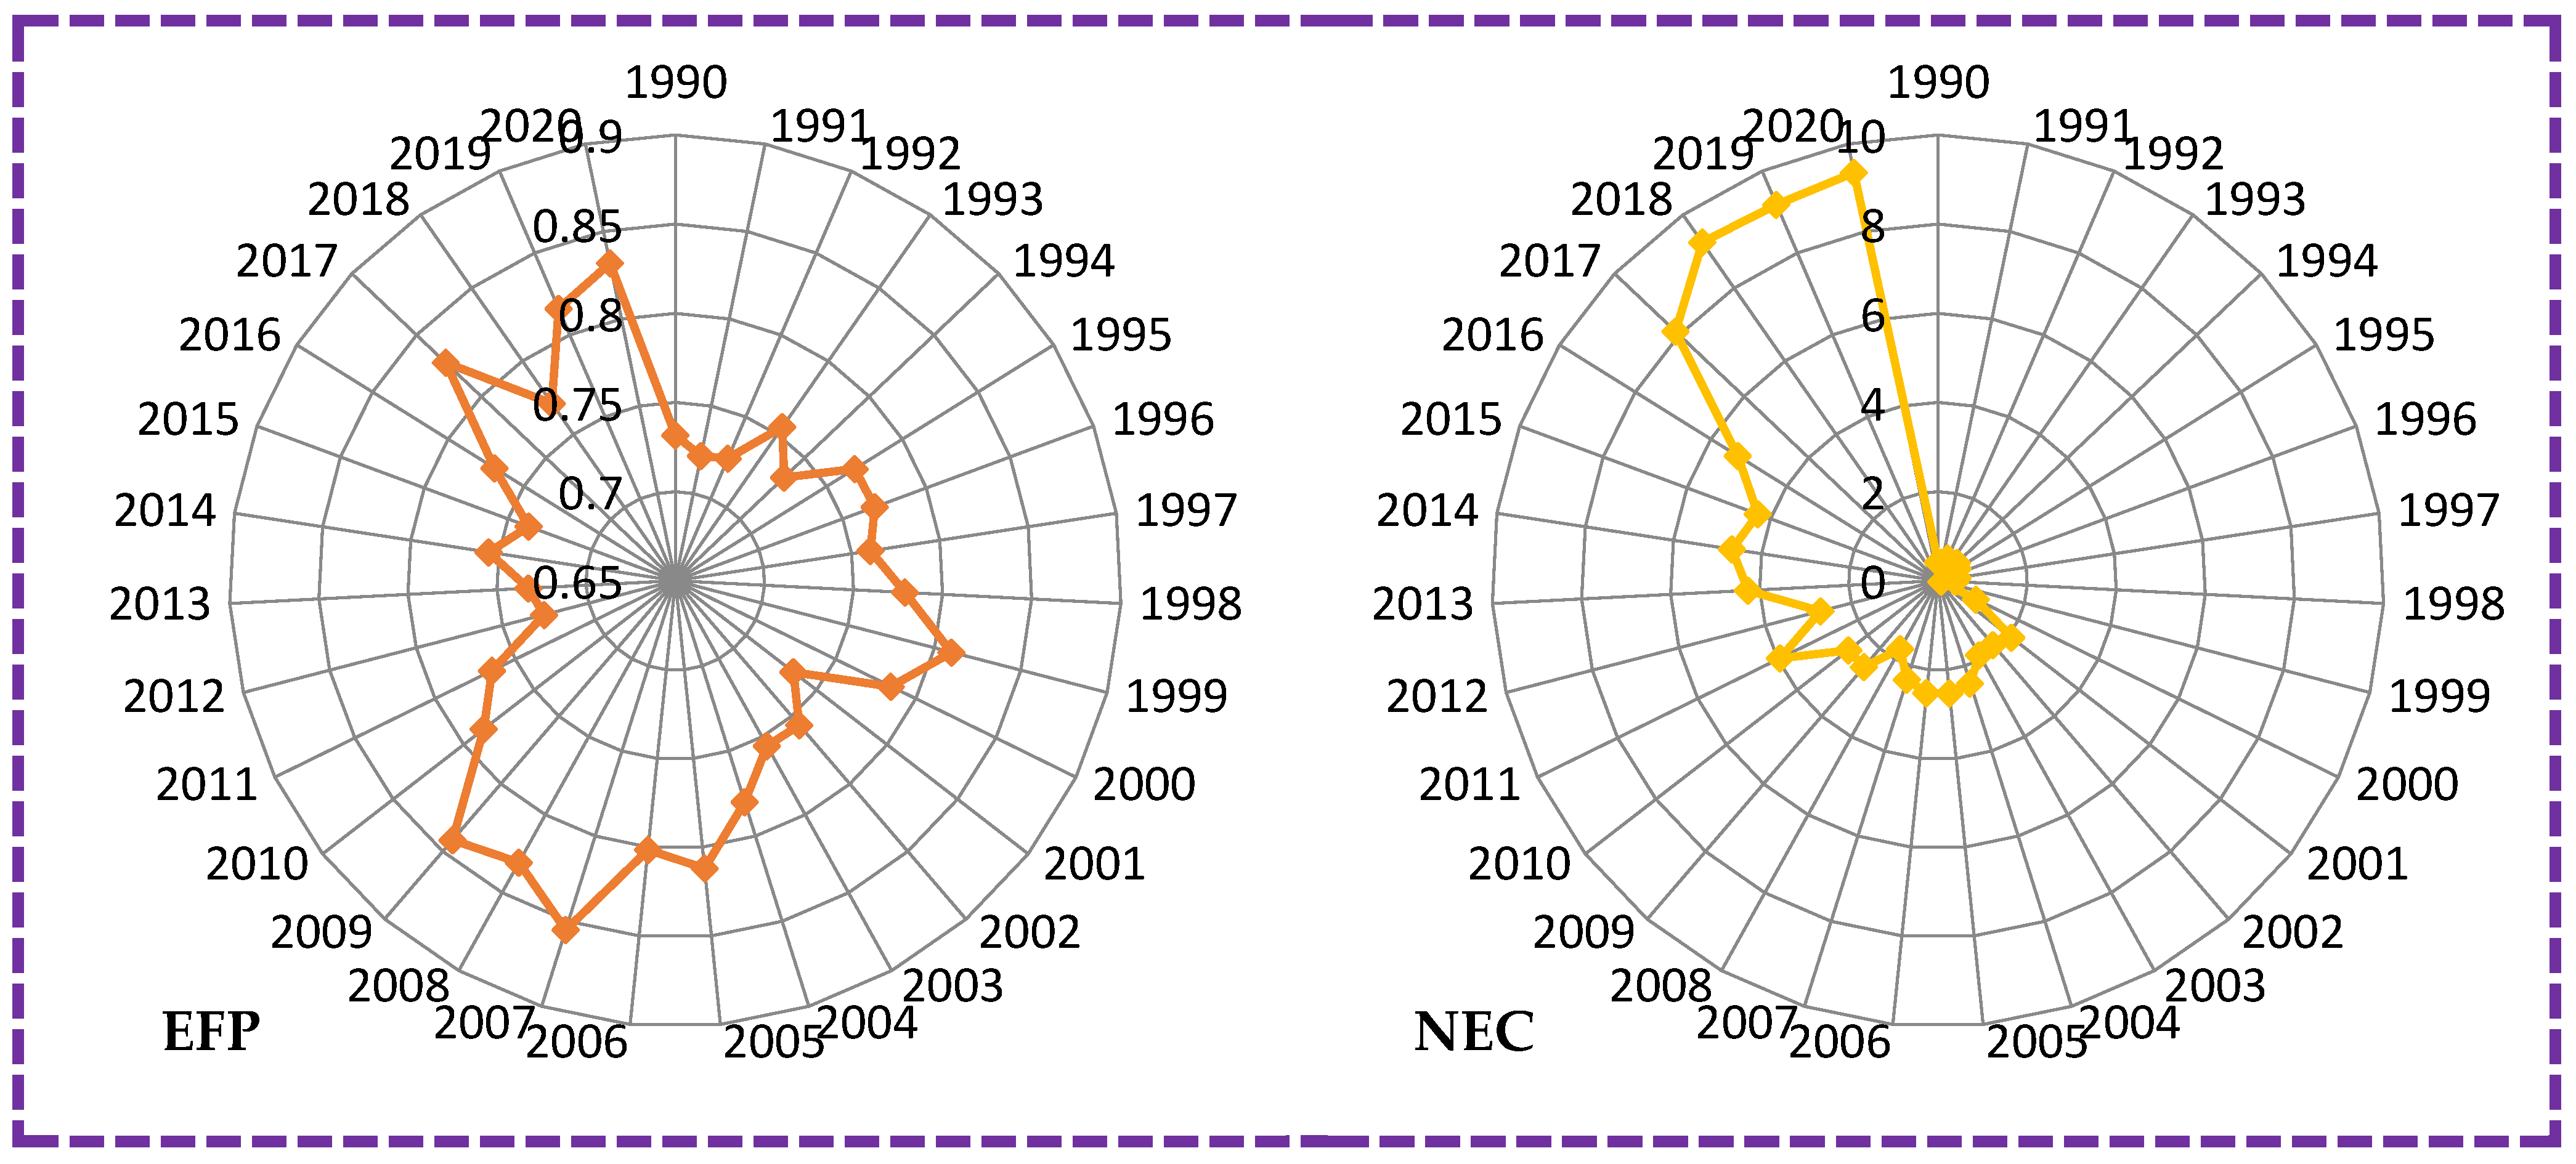
| EFP | Ecological footprint | Global hectares per person (GHpc) | GFPN [48] |
| NEC | Nuclear energy use | Terawatt hours (TWh) | BP [49] |
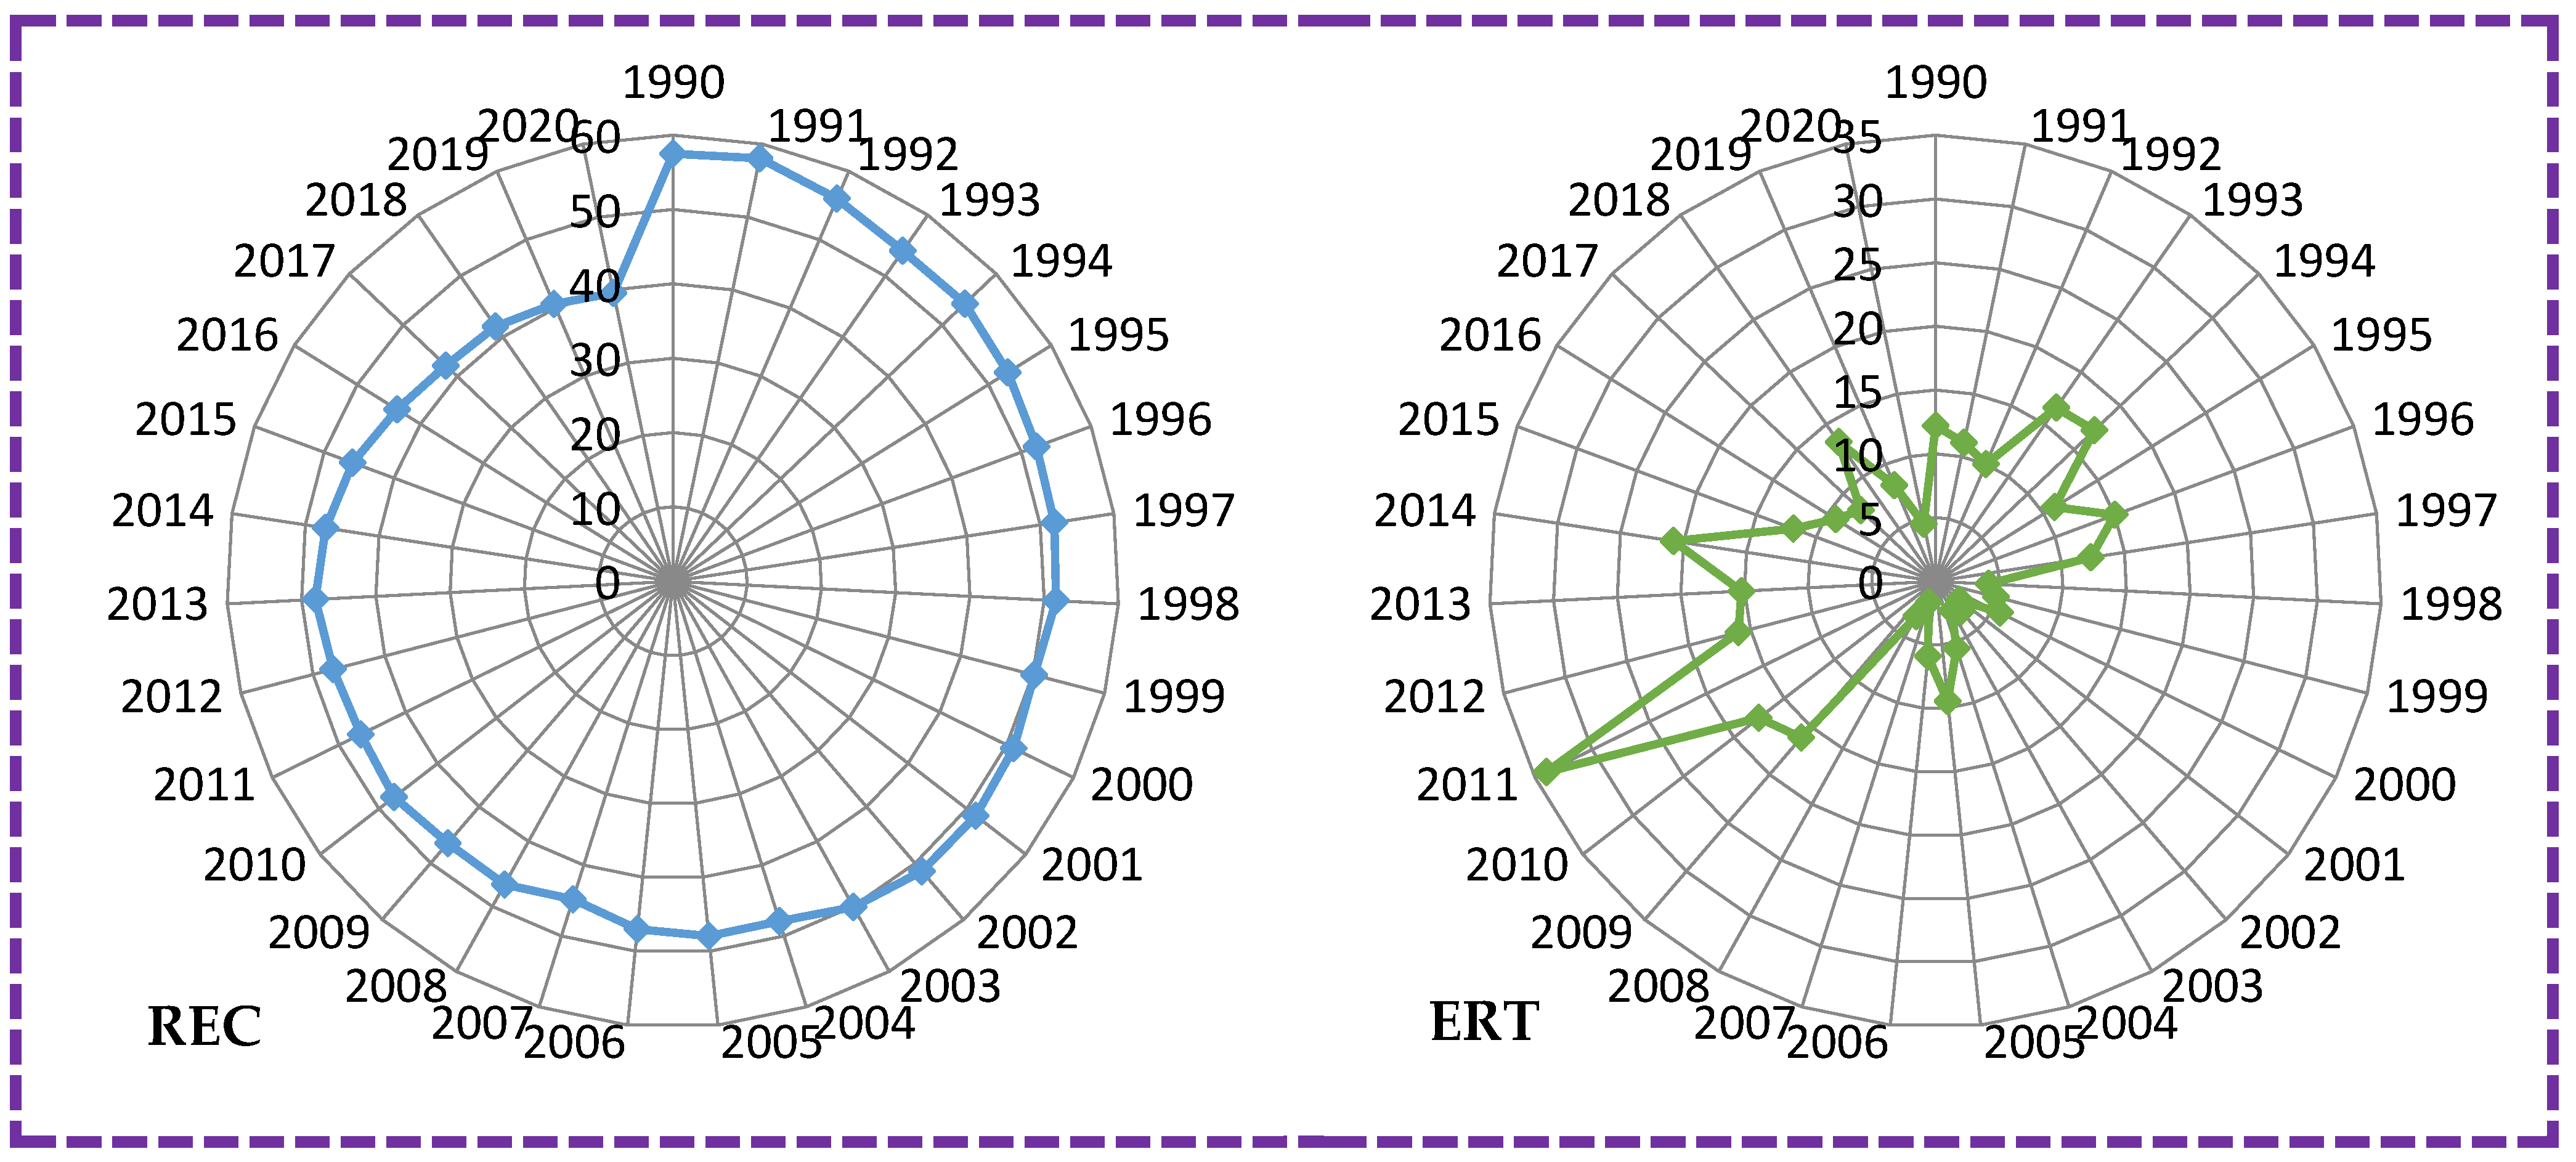
| REC | Renewable energy use | % of total final energy use | WDI [50] |
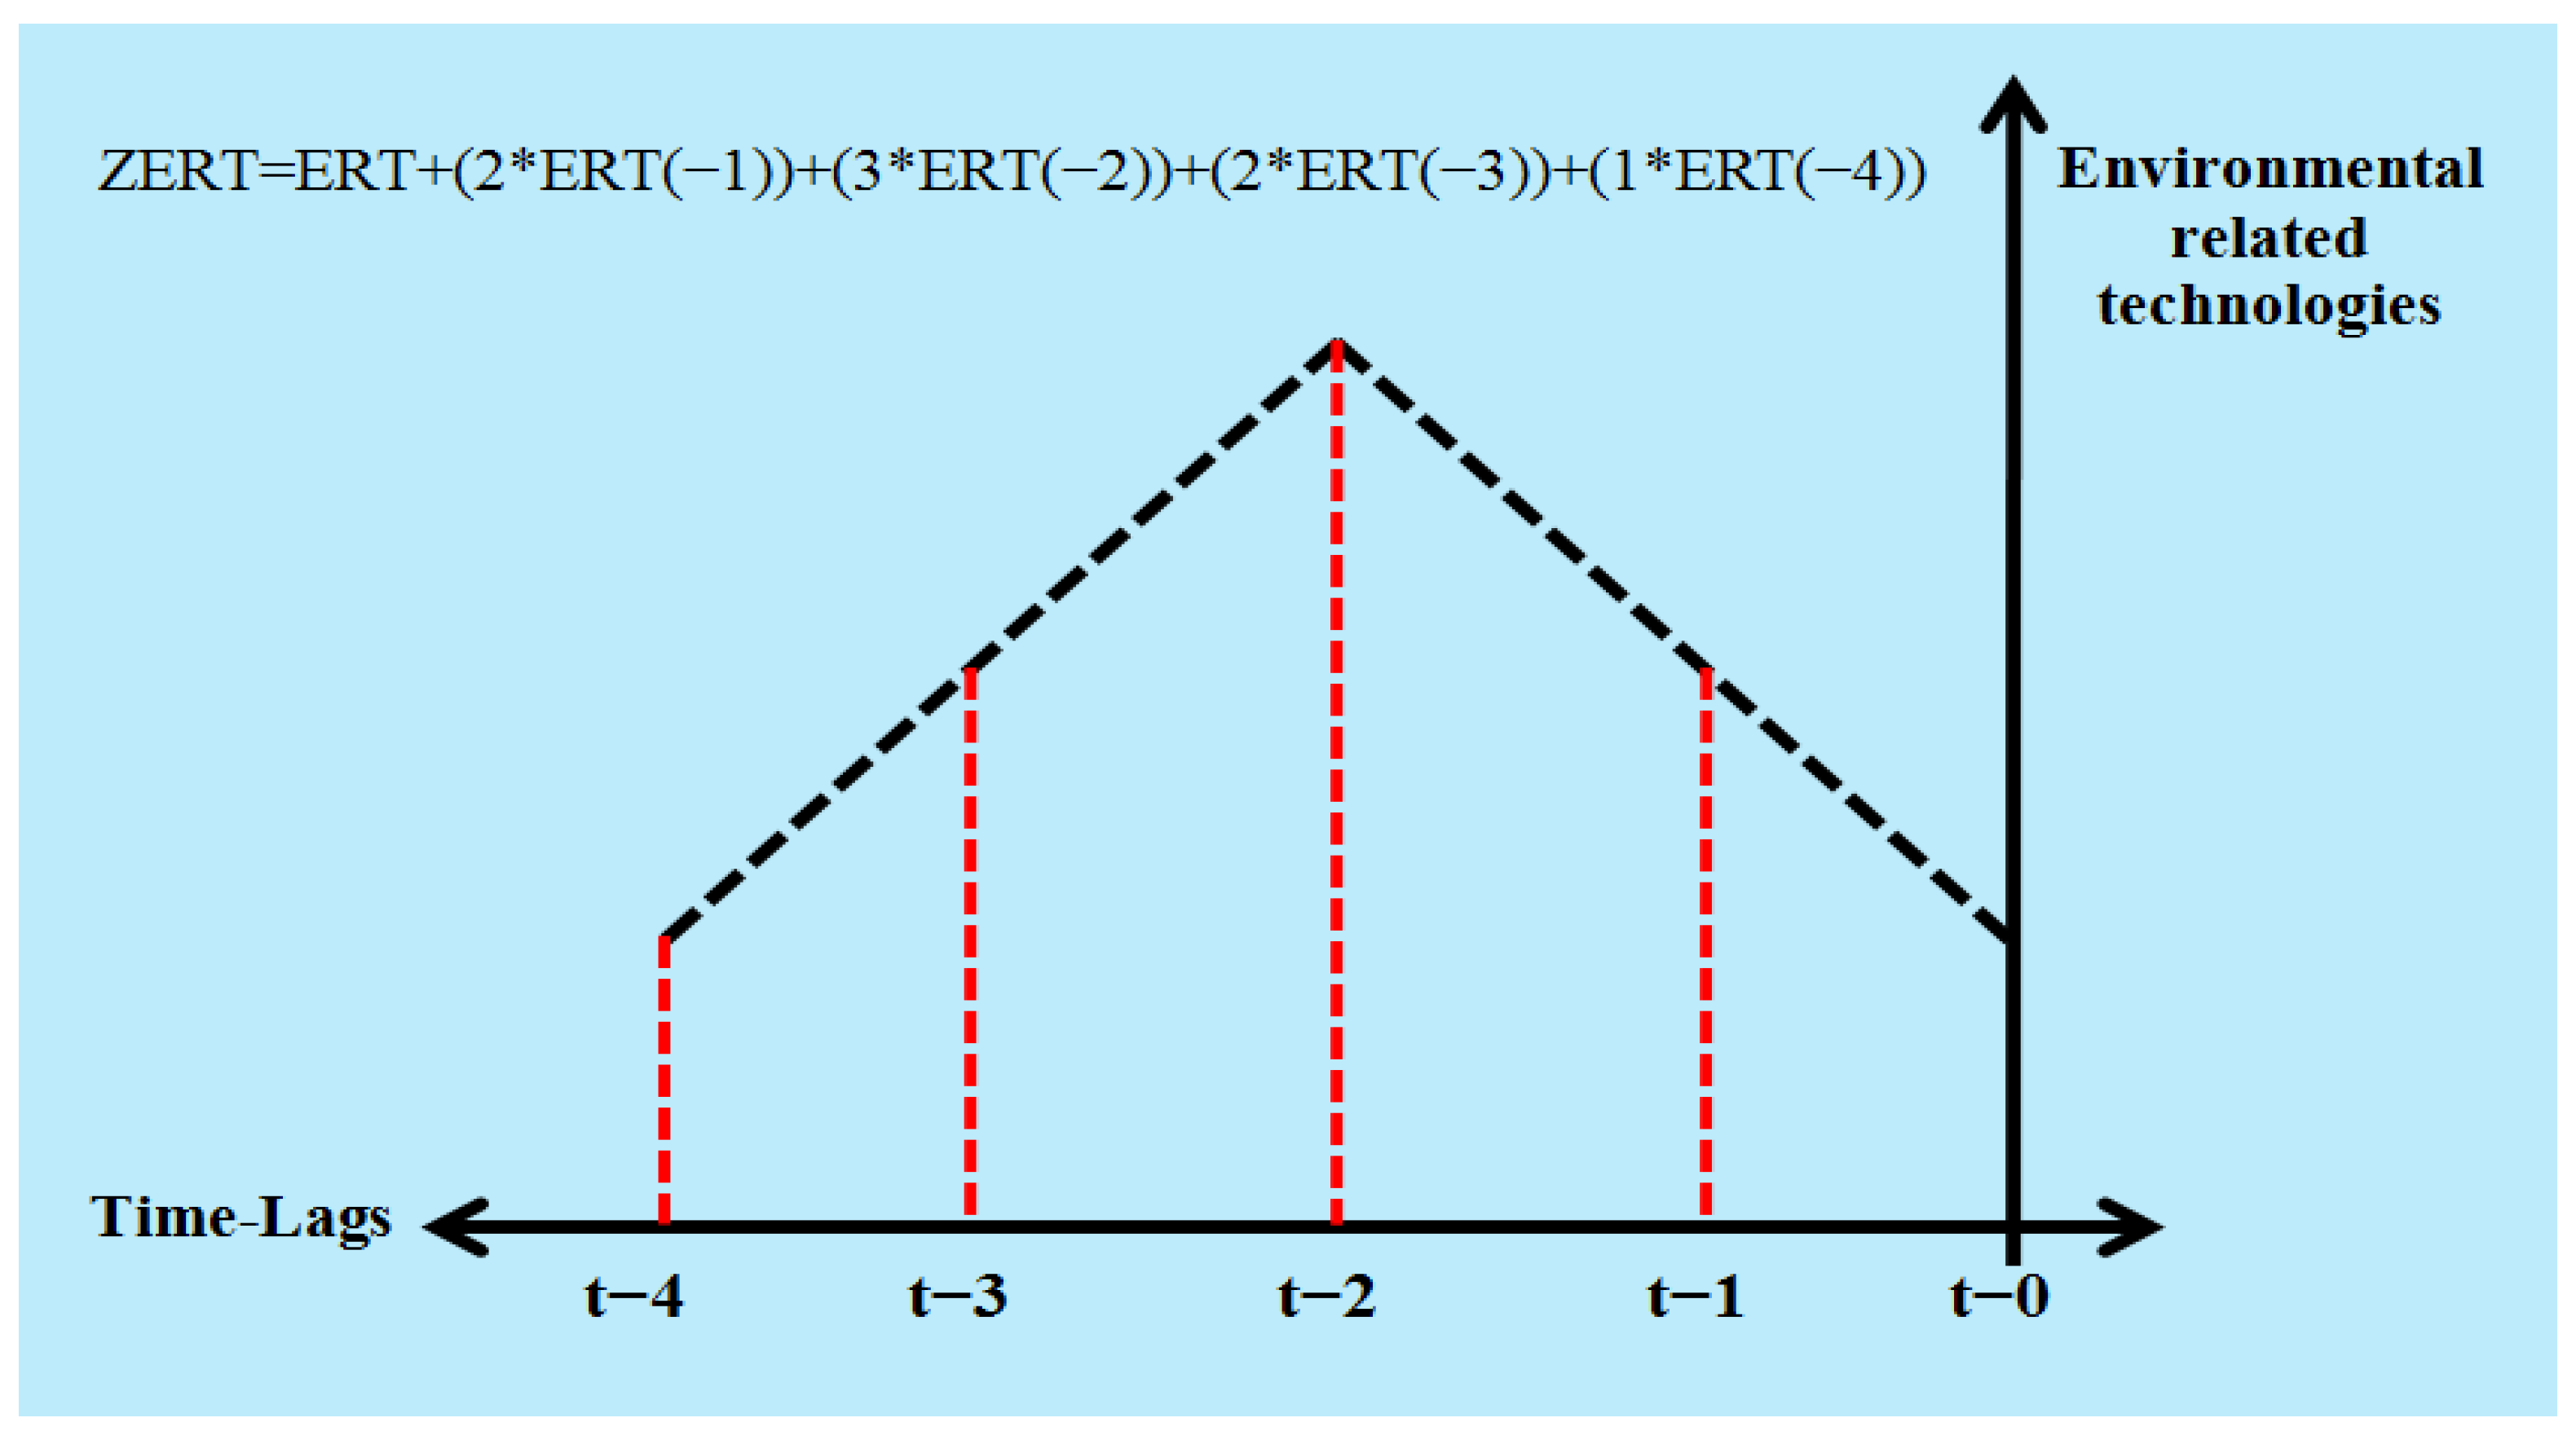
| ERT | Environmental-related technologies | % all technologies | OECD [51] |
| Stats. ↓ | EFP | NEC | REC | ERT |
|---|---|---|---|---|
| Mean | 0.774950 | 2.861441 | 48.84400 | 10.61390 |
| Median | 0.769267 | 2.317931 | 47.96210 | 9.997000 |
| Maximum | 0.855196 | 9.344590 | 58.09129 | 34.00000 |
| Minimum | 0.721552 | 0.079549 | 39.58050 | 1.740000 |
| Std. Dev. | 0.038000 | 2.787288 | 4.713678 | 6.862642 |
| Skewness | 0.443361 | 1.250832 | 0.004354 | 1.209785 |
| Kurtosis | 2.159690 | 2.553658 | 2.491649 | 2.357836 |
| Jarque–Bera | 1.927676 | 8.479612 | 0.333892 | 14.74271 |
| Probability | 0.381426 | 0.014410 | 0.846245 | 0.000629 |
| Sum | 24.02345 | 88.70468 | 1514.164 | 329.0310 |
| Sum Sq. Dev. | 0.043319 | 233.0693 | 666.5627 | 1412.876 |
| Observations | 31 | 31 | 31 | 31 |
| Variables | LEFP | LNEC | LREC | LERT |
|---|---|---|---|---|
| LEFP | 1.0000 | |||
| ----- | ||||
| ----- | ||||
| LNEC | 0.46565 * | 1.0000 | ||
| [4.4838] | ----- | |||
| (0.0000) | ----- | |||
| LREC | −0.61935 * | −0.62735 * | 1.0000 | |
| [−4.2481] | [−6.9323] | ----- | ||
| (0.0002) | (0.0000) | ----- | ||
| LZERT | −0.36571 * | 0.42399 * | 0.59357 * | 1.0000 |
| [−2.1161] | [4.1292] | [5.1059] | ----- | |
| (0.0430) | (0.0000) | (0.0000) | ----- |
| Intercept | Intercept and Trend | |||||||
|---|---|---|---|---|---|---|---|---|
| Series ↓ | Level | First Difference | Level | First Difference | ||||
| t-Stats | Prob. | t-Stats | Prob. | t-Stats | Prob. | t-Stats | Prob. | |
| Augmented Dickey–Fuller (ADF) | ||||||||
| LEFP | −2.3218 | 0.1722 | −6.5325 * | 0.0000 | −2.5419 | 0.3073 | −6.4104 * | 0.0002 |
| LNEC | −1.2546 | 0.6370 | −6.7926 * | 0.0000 | −3.6067 ** | 0.0462 | −6.6743 * | 0.0000 |
| LREC | 0.0233 | 0.9536 | −4.9341 * | 0.0004 | −1.5852 | 0.7749 | −4.8484 * | 0.0028 |
| LZERT | −2.2909 | 0.1829 | −3.8836 * | 0.0072 | −3.4228 *** | 0.0709 | −3.9706 ** | 0.0244 |
| Phillips and Perron (PP) | ||||||||
| LEFP | −2.2954 | 0.1798 | −6.5155 * | 0.0000 | −2.6617 | 0.2582 | −6.3952 * | 0.0001 |
| LNEC | −1.1073 | 0.6997 | −7.8308 * | 0.0000 | −3.6067 ** | 0.0462 | −7.7041 * | 0.0000 |
| LREC | −0.0352 | 0.9478 | −4.9518 * | 0.0004 | −1.8498 | 0.6551 | −4.8689 * | 0.0027 |
| LZERT | −1.5260 | 0.5049 | −5.2419 * | 0.0000 | −1.6186 | 0.7574 | −4.8836 * | 0.0009 |
| Without Trend | With Trend | |||||||||||
|---|---|---|---|---|---|---|---|---|---|---|---|---|
| Series ↓ | Level | First Difference | Level | First Difference | ||||||||
| t-Stats | Break | t-Stats | Break | t-Stats | Break | t-Stats | Break | |||||
| LEFP | −4.163 | 2010 | −7.041 * | 2014 | −2.686 | 1996 | −6.914 * | 2013 | ||||
| LNEC | −3.691 | 2001 | −8.025 * | 2000 | −3.758 | 1997 | −5.689 * | 2002 | ||||
| LREC | −2.361 | 2008 | −6.341 * | 2015 | −2.603 | 2015 | −5.697 * | 2013 | ||||
| LZERT | −4.562 | 2010 | −8.285 * | 2016 | −2.223 | 2001 | −5.702 * | 2012 | ||||
| Critical values | 1% | 5% | 10% | 1% | 5% | 10% | ||||||
| −5.34 | −4.93 | −4.58 | −4.93 | −4.42 | −4.11 | |||||||
| Series → | LEFP | LNEC | LREC | LZERT |
|---|---|---|---|---|
| Dimension ↓ | BDS Statistic | BDS Statistic | BDS Statistic | BDS Statistic |
| Dimension (2) | 0.043440 * | 0.126780 * | 0.132519 * | 0.149008 * |
| Dimension (3) | 0.072549 * | 0.205875 * | 0.209808 * | 0.237795 * |
| Dimension (4) | 0.122108 * | 0.247628 * | 0.269916 * | 0.276675 * |
| Dimension (5) | 0.114545 * | 0.265946 * | 0.292631 * | 0.277459 * |
| Dimension (6) | 0.141157 * | 0.270388 * | 0.301010 * | 0.249608 * |
| Tests | Test Statistic | Breakpoint | Break Year | Asymptotic Critical Values | ||
|---|---|---|---|---|---|---|
| 1% | 5% | 10% | ||||
| ADF | −8.02 * | 17 | 2006 | −5.77 | −5.28 | −5.02 |
| Zt | −8.18 * | 17 | 2006 | −5.77 | −5.28 | −5.02 |
| Za | −38.79 * | 17 | 2006 | −63.64 | −53.58 | −48.65 |
| Test Statistic | Value | k |
|---|---|---|
| F-statistic | 8.145229 | 6 |
| Critical Value Bounds | ||
| Significance | I(0) Bound | I(1) Bound |
| 10% | 2.12 | 3.23 |
| 5% | 2.45 | 3.61 |
| 2.5% | 2.75 | 3.99 |
| 1% | 3.15 | 4.43 |
| Variable | Coefficient | Std. Error | t-Statistic | Prob. |
|---|---|---|---|---|
| Long Run results | ||||
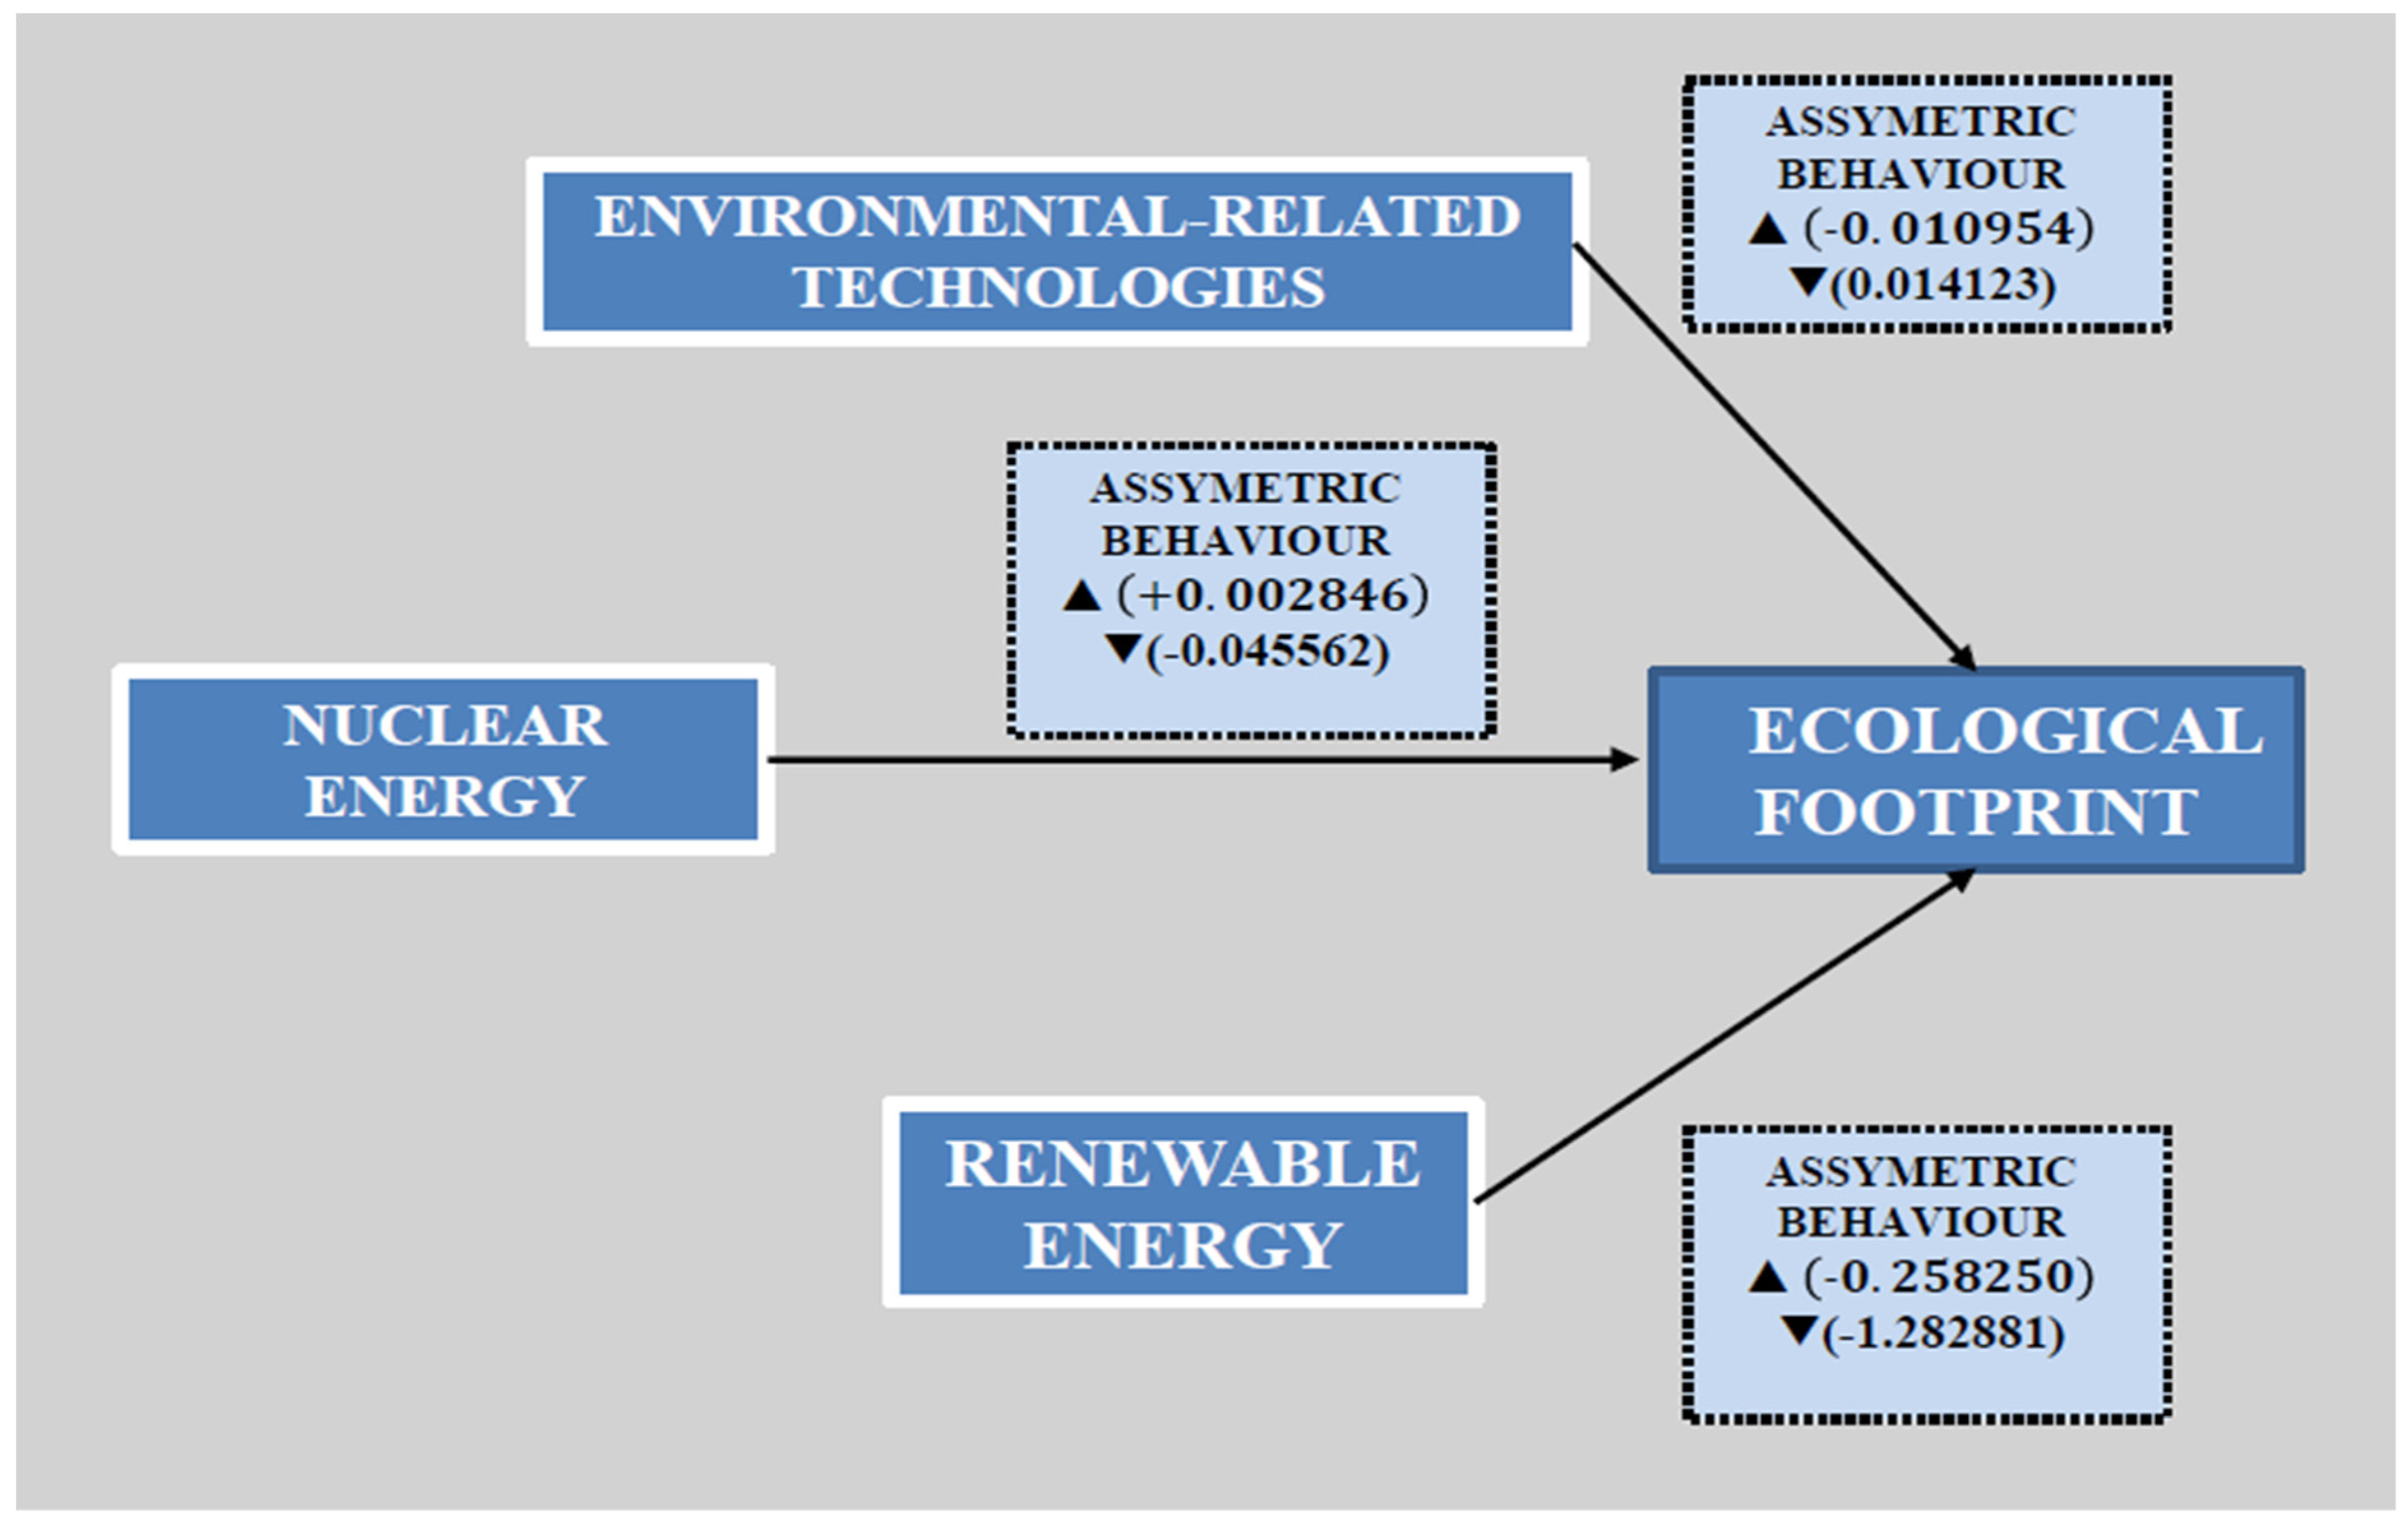
| LNEC_POS | 0.002846 | 0.016179 | 0.175934 | 0.8626 |
| LNEC_NEG | −0.045562 ** | 0.020076 | −2.269412 | 0.0374 |
| LREC_POS | −0.258250 * | 0.058292 | −4.430251 | 0.0006 |
| LREC_NEG | −1.282881 * | 0.242106 | −5.298844 | 0.0001 |
| LZERT_POS | −0.010954 * | 0.003025 | −3.620971 | 0.0023 |
| LZERT_NEG | 0.014123 *** | 0.007592 | 1.860209 | 0.0813 |
| C | −0.425000 * | 0.046088 | −9.221428 | 0.0000 |
| Short-run results | ||||
| D(LNEC_POS) | 0.003043 | 0.017355 | 0.175363 | 0.8630 |
| D(LNEC_NEG) | −0.048716 ** | 0.022672 | −2.148736 | 0.0473 |
| D(LREC_POS) | −0.062283 | 0.618435 | −0.100710 | 0.9210 |
| D(LREC_NEG) | −1.371694 * | 0.327453 | −4.188977 | 0.0007 |
| D(LZERT_POS) | −0.011712 ** | 0.004259 | −2.750141 | 0.0142 |
| D(LZERT_NEG) | −0.023483 *** | 0.013221 | −1.776230 | 0.0947 |
| CointEq. (−1) | −0.569229 * | 0.179137 | −3.177614 | 0.0001 |
| R-squared | 0.810601 | Mean dependent var | −0.245006 | |
| Adjusted R-squared | 0.715901 | S.D. dependent var | 0.046484 | |
| S.E. of regression | 0.024777 | Akaike info criterion | −4.284125 | |
| Sum squared resid | 0.009822 | Schwarz criterion | −3.845330 | |
| Log likelihood | 62.55156 | Hannan-Quinn criter. | −4.162422 | |
| F-statistic | 8.559699 | Durbin-Watson stat | 2.351585 | |
| Prob(F-statistic) | 0.000157 | |||
| Tests | F-Statistic | Prob. |
|---|---|---|
| ARCH test for Heteroskedasticity | 0.307293 | 0.5852 |
| Breusch–Pagan–Godfrey test for Heteroskedasticity | 0.976755 | 0.5969 |
| Breusch–Godfrey LM Test for Autocorrelation | 0.727969 | 0.4834 |
| Jarque–Bera for Normality | 0.594470 | 0.7428 |
| Ramsey RESET test for Model Specification | 1.410686 | 0.2534 |
| Variables | F-Statistic | Prob. | Decision |
|---|---|---|---|
| Long-run asymmetry findings | |||
| Nuclear energy consumption | 31.60802 ** | 0.0302 | Significant asymmetric relationship |
| Renewable energy consumption | 51.32221 ** | 0.0189 | Significant asymmetric relationship |
| Environmental related technologies | 26.11786 ** | 0.0362 | Significant asymmetric relationship |
| Short-run asymmetry findings | |||
| Nuclear energy consumption | 13.69939 *** | 0.0659 | Significant asymmetric relationship |
| Renewable energy consumption | 2.065317 | 0.2872 | No significant asymmetric relationship |
| Environmental related technologies | 73.25439 ** | 0.0134 | Significant asymmetric relationship |
Publisher’s Note: MDPI stays neutral with regard to jurisdictional claims in published maps and institutional affiliations. |
© 2022 by the authors. Licensee MDPI, Basel, Switzerland. This article is an open access article distributed under the terms and conditions of the Creative Commons Attribution (CC BY) license (https://creativecommons.org/licenses/by/4.0/).
Share and Cite
Usman, M.; Jahanger, A.; Radulescu, M.; Balsalobre-Lorente, D. Do Nuclear Energy, Renewable Energy, and Environmental-Related Technologies Asymmetrically Reduce Ecological Footprint? Evidence from Pakistan. Energies 2022, 15, 3448. https://doi.org/10.3390/en15093448
Usman M, Jahanger A, Radulescu M, Balsalobre-Lorente D. Do Nuclear Energy, Renewable Energy, and Environmental-Related Technologies Asymmetrically Reduce Ecological Footprint? Evidence from Pakistan. Energies. 2022; 15(9):3448. https://doi.org/10.3390/en15093448
Chicago/Turabian StyleUsman, Muhammad, Atif Jahanger, Magdalena Radulescu, and Daniel Balsalobre-Lorente. 2022. "Do Nuclear Energy, Renewable Energy, and Environmental-Related Technologies Asymmetrically Reduce Ecological Footprint? Evidence from Pakistan" Energies 15, no. 9: 3448. https://doi.org/10.3390/en15093448