Article

Domestic Energy Efficiency Scenarios for Northern Ireland

by
Oluwatobiloba Stephanie Ogunrin
*,
Inna Vorushylo
,
Oghenovo Okpako
and
Neil Hewitt
Centre for Sustainable Technologies, Ulster University, Jordanstown, Newtownabbey, Antrim BT37 0QB, Northern Ireland, UK
*
Author to whom correspondence should be addressed.
Energies 2022, 15(9), 2985; https://doi.org/10.3390/en15092985
Submission received: 16 March 2022 / Revised: 5 April 2022 / Accepted: 15 April 2022 / Published: 19 April 2022
(This article belongs to the Topic Sustainable Built Environment)

Abstract

:
Building fabric retrofitting is an important first step in improving building energy efficiency. The United Kingdom’s (UK) housing stock is one of the most inefficient in Europe, and Northern Ireland has the second-highest level of fuel poverty in the UK. This Northern Irish case study developed three fabric retrofit scenarios that estimate potential demand reductions, CO2 emissions removals and retrofit costs. The first scenario reduces domestic demand by 10% and removes 6% of domestic emissions. The second scenario is more ambitious than the first, and results in an 18% reduction in demand and 12% of emissions removed. The third scenario proposes fabric retrofitting to PassivHaus standard and results in a 42% reduction in demand and 27% of emissions removed. Furthermore, retrofit schemes can provide up to approximately 350,000 jobs annually between 2022 and 2050 for the Northern Irish population. This study demonstrates how fabric retrofit scenarios can be streamlined to the unique features of a housing stock. It shows that fabric retrofit research is important for the formulation of energy efficiency policy and emphasises that domestic sector retrofitting will yield socioeconomic and environmental benefits locally and internationally.

1. Introduction

Energy efficiency is one of the key measures needed to achieve the net zero targets announced by the UK and many other governments worldwide [1]. Domestic emissions account for two-thirds of the total emissions and the UK’s housing stock is one of the most inefficient in Europe [2].
The UK’s Standard Assessment Procedure (SAP) rates the energy and environmental performance of houses from bands A to G (with A and G being the most and least efficient, respectively) [3]. The creation of energy efficiency strategy is a devolved power, but the UK government publishes general guidance for all regions [2,4,5]. The UK government sets energy efficiency targets focusing on improving the efficiency, and consequently averages the SAP ratings of the housing stocks across all regions. In 2017, the Clean Growth Strategy stipulated that all UK homes reach an SAP rating of C by 2035, and all fuel-poor and rented households reach an average SAP rating of C by 2030 [2].
Presently, the UK is targeting net zero greenhouse emissions by 2050, with current building regulations reflecting fabric and heating system standards [6]. Thus, advancing the energy efficiency of UK buildings has been listed as a national infrastructure priority, with the highest possible standards implemented for proposed energy efficiency upgrades of existing buildings and new-build constructions [4,7].
Existing studies on the impact of retrofit on existing housing show that retrofitting can yield considerable reductions in domestic demand and carbon emissions, can provide socioeconomic benefits and can provide insights for existing building regulations updates. In 2010, approximately 4 million jobs were saved and created due to the construction of 125,000 new energy-efficient homes in the United States through a scheme facilitated by the American Recovery and Reinvestment Tax Act [1]. There were significant savings in energy bills, which low-income/fuel-poor households benefitted from. Various energy efficiency schemes across Europe, such as the scheme funded by the KredEx Revolving Fund in Estonia and the INTENSE project in South Moravia, have shown that energy efficiency can improve the economic and environmental value of entire neighbourhoods [8].
Rosenow et al.’s 2018 study considers insulation (loft, wall and floor), glazing, boiler upgrades, heat networks, heat pumps and household appliances [9]. They find that the demand of the existing UK housing stock can be cost-effectively and technically reduced by one quarter and one half of the current demand by 2035, respectively [9].
Colclough et al. investigated the post-occupancy performance of social houses renovated to the Nearly Zero Energy Building (nZEB) standard in south-east Ireland [10]. These renovations featured increased fabric insulation, ventilation and heating system upgrades and the addition of solar panels. The occupants reported increased levels of comfort, which reinforces the benefits of highly energy-efficient fabrics and heating systems. The Energiesprong project develops net zero energy homes and their retrofit projects include the transformation of houses in Nottingham and Essex, among others [11]. Their projects demonstrate that fabric retrofit, including increased insulation, high-performance double-glazed windows, can facilitate improved thermal comfort [11].
Furthermore, high fabric energy efficiency has the potential to reduce future heat demand if superior standards of energy efficiency are enforced in new homes [4]. New builds would need first-rate levels of insulation, airtightness and ventilation, triple glazed windows and external shading, low carbon heating, water management and cooling, and flood resilience [4]. Consequently, passive house standards may be incorporated into new-build regulations. The Committee on Climate Change (CCC) Sixth Carbon Budget advice states that new homes would need passive shading measures and mechanical heat recovery and ventilation to reduce future overheating [12]. It provides a more detailed analysis on the distribution of low-carbon heating systems among new homes across all UK regions.
Nevertheless, the impact of the proposed energy efficiency measures for new homes on future domestic demand and emissions remains unclear for future UK homes. Investigations into the impact of fabric energy efficiency on existing and new domestic buildings should be carried out with consideration of local context [4]. Nonetheless, most UK-based studies on energy efficiency upgrades are largely based on the English housing stock, and do not consider the individual residential characteristics of the other regions.
Among all UK regions, Northern Ireland (NI) has distinct domestic energy efficiency needs. NI building thermal standards are the most outdated in UK as they were last updated in 2014, while those of Wales, England and Scotland were updated in 2016, 2018 and 2020, respectively [6,13,14,15]. Glazing standards were updated in 2002 for the rest of the UK, while these standards were not updated until 2006 in NI [16]. The average SAP rating of NI housing stock, rating D (66.32), is the highest in the UK; this is due to the large share of social houses in the region. However, NI’s average SAP rating is only slightly higher than that of English housing stock (rating D: 63.21) which is in second place [17,18,19,20,21]. Houses in NI have larger floor areas than houses in other regions; the mean domestic floor areas for Northern Irish, English, Scottish and Welsh housing stocks are 107 m2, 90 m2, 104 m2 and 79 m2, respectively [19,21,22]. Consequently, the costs of domestic retrofit schemes in NI would be potentially higher than in the rest of the UK.
Additionally, the level of fuel poverty in NI is the second-highest in the UK as 18% of all NI households are fuel poor [12,23,24]. Each region is responsible for developing its own fuel poverty strategy [24]. While England aims to improve all of its fuel-poor homes to a SAP rating of C or higher by 2030, the Scottish government states that reaching EPC C will not be sufficient to lift all houses out of fuel poverty [24,25]. Therefore, the Scottish government proposes that the fuel-poor households in its stock would reach an SAP rating of C by 2030 and an SAP rating of B by 2040 where technically and economically feasible [25]. The Welsh fuel poverty strategy states that the energy efficiency of Welsh fuel-poor houses will be improved by 2035; however, it is unclear which target SAP rating has been set [26]. In Northern Ireland, the most recent fuel poverty strategy was published in 2011 [27]. The strategy states that improved energy efficiency is one of the tools needed to eradicate fuel poverty. However, no clear targets towards fuel poverty mitigation are indicated, and the NI fuel-poor strategy has not been updated since 2011.
Nevertheless, existing energy efficiency programmes in NI are mainly targeted at fuel poverty; examples include the Warm Homes Scheme, the Affordable Warmth Scheme and the Northern Ireland Sustainable Energy Programme (NISEP). Through recent programmes, 9000 cavity walls were fully insulated and 66,000 lofts were topped up with insulation between 2016 and 2018 [23]. Energy efficiency schemes are run by local authorities and government departments such as the Northern Ireland Housing Executive (NIHE) and the Department of Communities [17]. Still, more efforts are needed towards creating energy efficiency programmes for NI.
In 2020, the Zero-In on NI Heat networking project initiated conversations on barriers and opportunities for heat decarbonisation in NI among market experts and consumers [28]. The project revealed that consumers are willing to facilitate heat-sector decarbonisation, and government leadership is important in this transition. Currently, all energy efficiency schemes in NI implement retrofit measures for about 16,500 buildings per year [29]. Still, existing studies indicate that more houses would need to be retrofitted annually to achieve significant domestic energy efficiency improvements that align with national UK targets [12,29,30]. As such, there should be more emphasis on developing more energy efficiency schemes and producing a strategy that can drive improvements in the energy efficiency of existing and new domestic fabrics.

Energy Efficiency Potential across NI

The Department for the Economy (DfE) released the latest energy strategy for NI in December 2021 [30]. The strategy states that up to GBP 2.4 billion will be spent on reducing energy use via the introduction of low carbon heating and investing in energy efficiency measures in the domestic sector between 2021 and 2030. During this period, 50,000 buildings (approximately thrice the current number of buildings retrofitted annually in NI) will need to be retrofitted annually. Additionally, a large pilot domestic retrofit scheme will be launched in 2022; this scheme will consider the requirements for heat pumps and be aligned with current and other pilot retrofit programmes. While this new strategy gives some general direction for energy efficiency improvements in NI, it does not provide a much-needed comprehensive framework on domestic energy efficiency implementation.
In 2014, the Department for Communities (DfC) opened a consultation for a new fuel poverty strategy for NI [31]. The new strategy would address the Warm Home Scheme delivery model, qualification criteria and available energy efficiency measures. This strategy is yet to be published. National Energy Action (NEA) and Energy Action Scotland (EAS) have recently published a report with some recommendations for fuel poverty mitigation in NI [32]. The report states that all NI fuel-poor homes can be upgraded to SAP rating C between 2025 and 2030 at a cost of GBP 440 million. However, there are no details on how this can be achieved.
The DfE’s new energy strategy aims to tackle fuel poverty by implementing measures that will cause carbon emission and energy bill reductions [30]. Still, there is insufficient detail on what measures would be applied, what percentage of the fuel-poor housing stock would receive these measures, a target SAP rating and a retrofit timeline.
The CCC’s Sixth Carbon Budget (6CB) advice suggests an 11% reduction in total domestic demand and 4% removal of emissions (based on 2016 levels) in NI by 2050. This can be achieved if fabric retrofit measures are implemented in 410,000 existing NI dwellings (including fuel-poor households) by 2050 [12,33]. However, the 6CB dataset does not provide a comprehensive breakdown of the number of NI houses (in terms of age or type) to receive the recommended retrofit measures. New builds will be zero-carbon; nevertheless, there is insufficient detail on what measures would be applied to the building envelopes of new buildings.
The NIHE’s 2019 report on the cost of improving the SAP rating of NI dwellings indicates that 23,200 F- and G-rated occupied and vacant houses can be improved to rating E via fabric retrofit at a total cost of approximately GBP 87 million, with an average cost of GBP 3700 per house [34]. Although this study presents the costs of improving the efficiency of NI houses with the lowest SAP ratings, it does not investigate the impact of energy efficiency programmes for houses of EPC bands D and E. Furthermore, this study does not consider the impact of its recommended improvements on the SAP rating of the entire NI housing stock and there is no analysis for future housing stock.
Another 2019 NIHE study outlines eight scenarios specifying fabric and heating system upgrades [35]. A total of 632,000 houses received at least one retrofit measure, at a total cost of GBP 2.4 million with an average cost of GBP 3133 per house. The average SAP rating for the domestic stock increased from 65.8 to 73.8 (from band D to band C). However, this study did not specify the impacts of these scenarios on heat demand or carbon emissions. Additionally, there is no consideration of future domestic heat demand, carbon emissions and new builds.
ARUP’s most high-reaching scenario for NI aligns with UK net zero targets. It suggests a 55% reduction in energy demand by 2050 and states that NI policy must promote the retrofitting of a maximum of 50,000 buildings per year [29]. Although ARUP presents an analysis that considers the effect of potential NI energy efficiency policy outlines on domestic retrofitting, the study does not give a detailed breakdown of how retrofitting can be achieved. The number of houses to be retrofitted and changes in demand per measure are not clearly represented, and this limits the feasibility of the study. The 2021 NIHE report on the cost of carbon savings in Northern Ireland’s housing stock states that 390,000 dwellings can be improved to band C at a total cost of GBP 2.4 billion, with an average cost of GBP 6200 per dwelling [36]. Moreover, 3.2 tonnes/year of CO2 emissions can be removed with improvement to band C. Additionally, 586,000 houses can be improved to band B at a cost of GBP 9.2 billion and at an average cost of GBP 15,600 per house. However, this study is not sufficiently detailed to suggest a defined pathway for NI domestic energy efficiency. Moreover, there is no breakdown of the archetypes recommended for retrofit or impacts of the suggested scenarios on domestic heat demand.
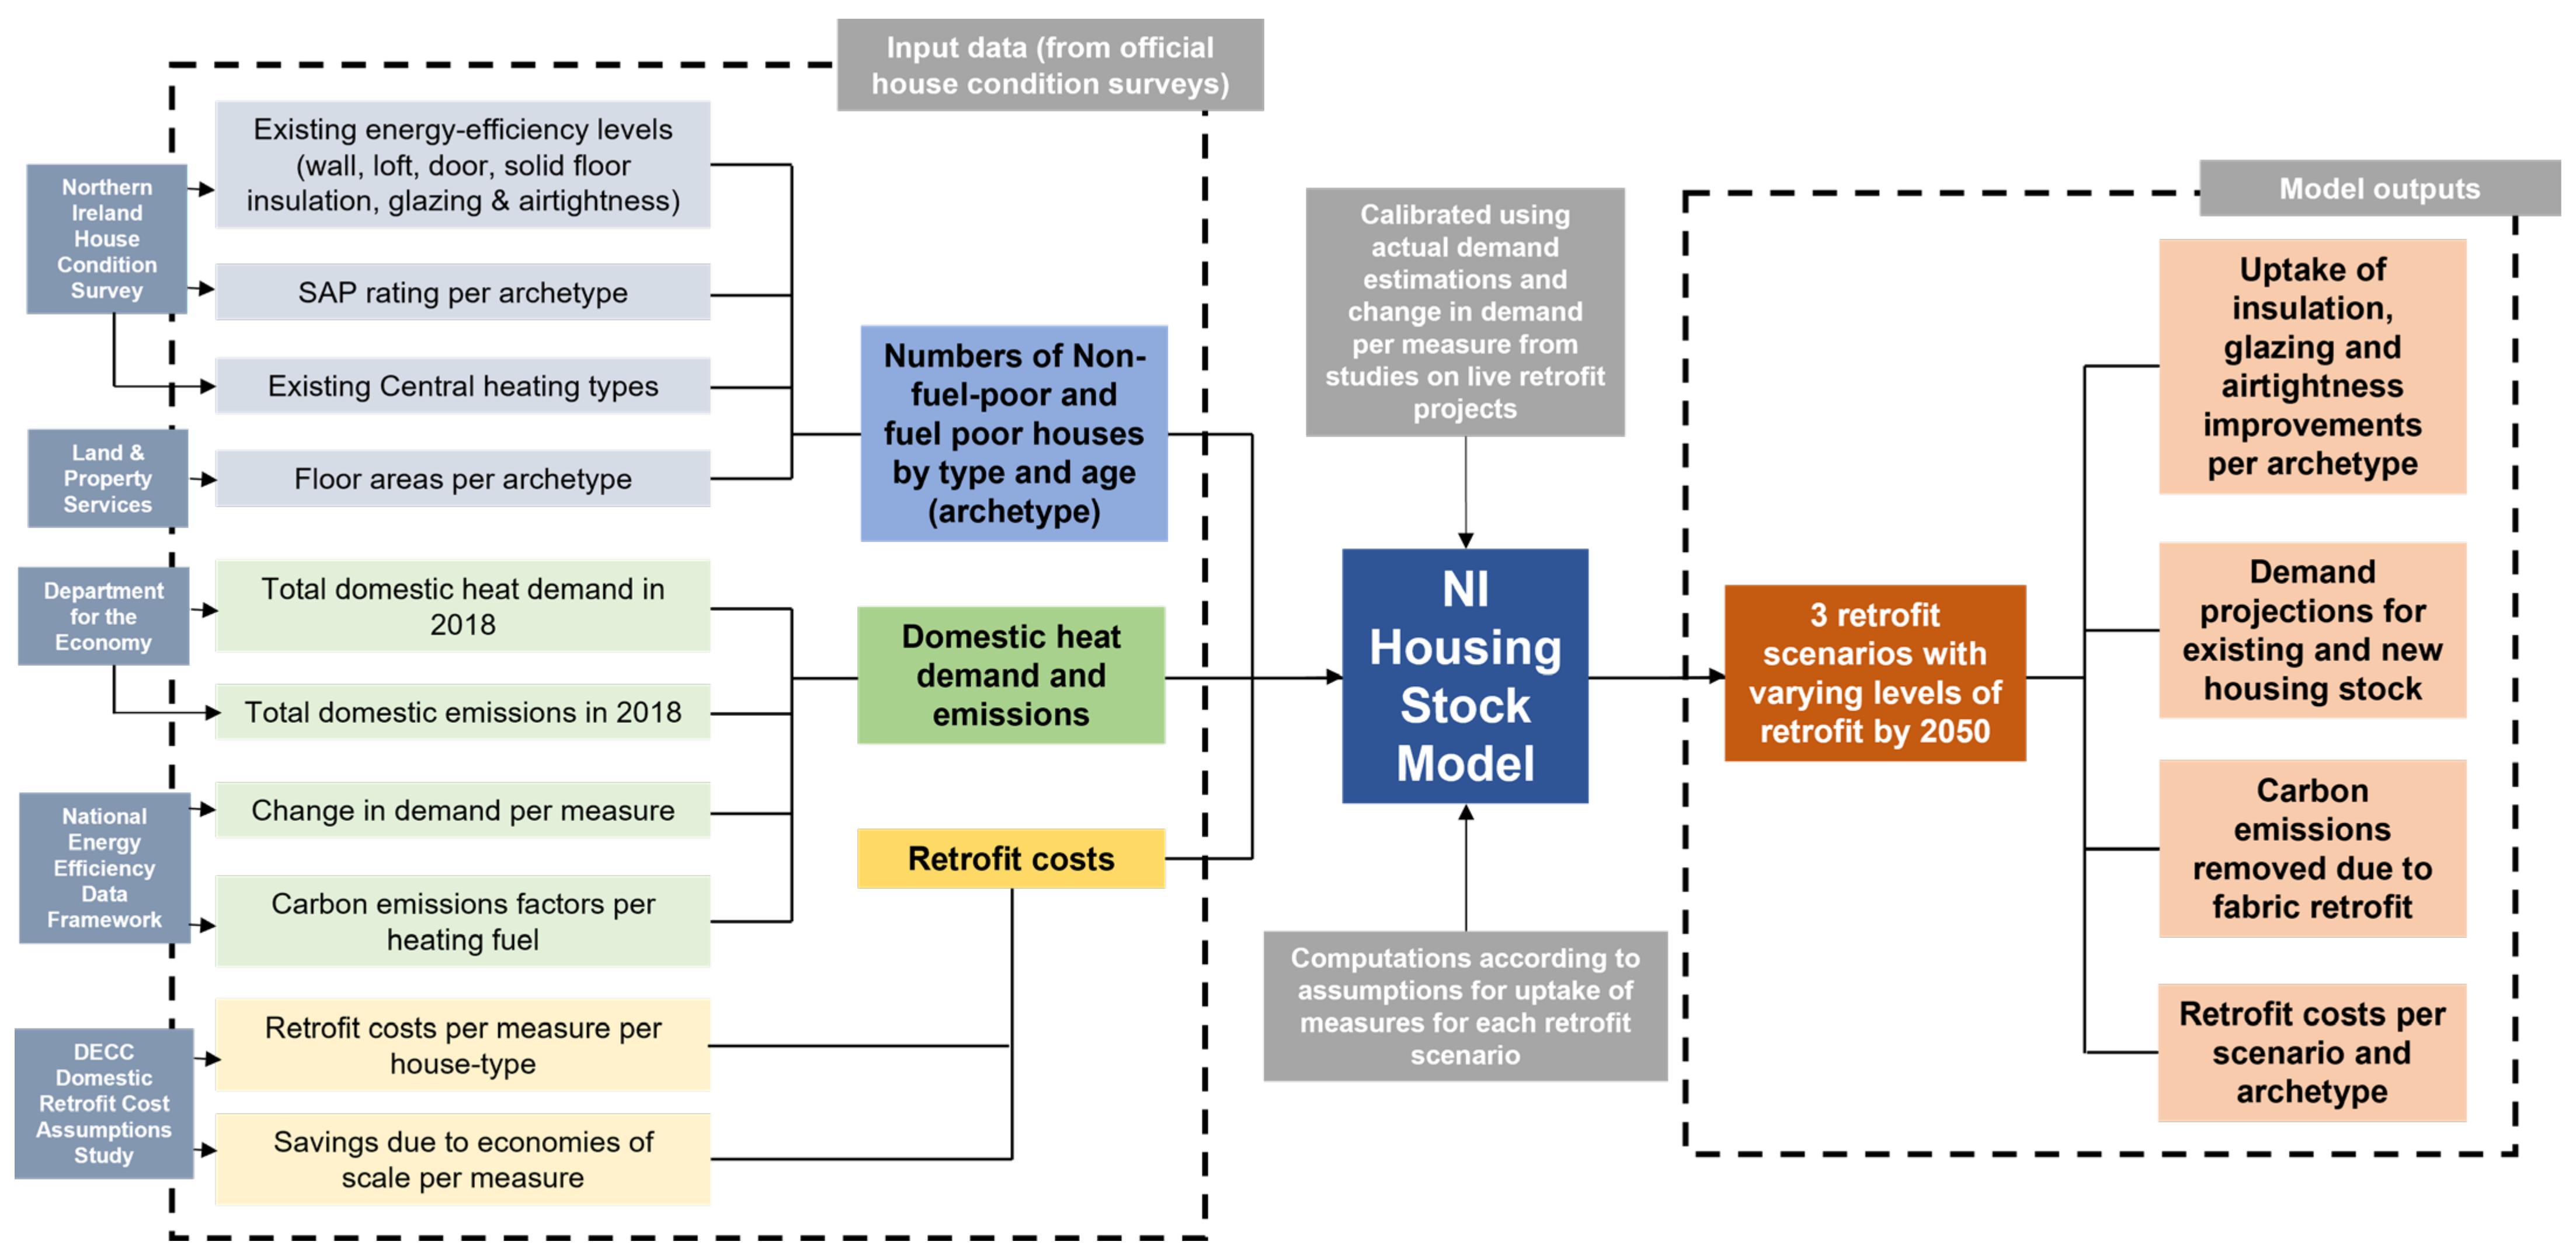
The novelty of this study is the initiation of a comprehensive framework for achieving fabric energy efficiency in NI through the implementation of measures and prescribing specific numbers of existing and new households. It outlines three varying levels of retrofit with corresponding changes in demand and carbon emissions that consider government guidance for NI housing stock (including fuel-poor households). Additionally, this study provides a retrofit cost breakdown per scenario and presents the socioeconomic impacts.

2. Materials and Methods

2.1. NI Housing Stock Model

For the purposes of this study, an NI building stock model was developed. It is a data-driven model that features the 2018 NI housing stock, disaggregated into 25 different domestic archetypes (houses by age and type). The model’s inputs were actual data obtained from the Land and Property Services (LPS), the NIHE and the Northern Ireland Statistics and Research Agency (NISRA) [18,37,38,39,40]. Figure 1 shows a diagrammatic representation of the methodology.
The input data were based on estimations of the number and percentages of the following parameters:
  • Non-fuel-poor and fuel-poor households by age and type (archetype) (current and future projections): There are five house types (bungalow, terraced, semi-detached, detached and flat/apartment) and five age bands for each house type (pre-1919, 1919–1944, 1945–1964, 1965–1980 and post-1980).
  • SAP ratings per archetype.
  • Floor areas per archetype.
  • Wall, loft, door and solid floor insulation levels per archetype.
  • Glazing and airtightness levels per archetype.
  • Total domestic heat demand in 2018.
  • Total emissions due to domestic heating.
  • Change in demand per measure.
  • Carbon emissions factors per heating fuel.
  • Retrofit costs per measure per house type.
  • Central heating types per archetype in alignment with existing levels of wall, loft, door and solid floor insulation as well as glazing and airtightness.
The model outputs were generated by applying relevant derivation formulas based on retrofit scenario objectives. Outputs include:
  • 2050 projections on the uptake of insulation, glazing and airtightness improvements per archetype under three different levels of retrofit (or retrofit scenarios).
  • 2050 demand projections (for entire existing and future housing stock and per archetype).
  • Carbon emissions removed due to retrofit improvements by 2050 (for entire housing stock and per archetype).
  • Retrofit costs (per scenario and archetype).
It is estimated that 84% of the entire NI housing stock of 786,362 houses requires one or more retrofit measures (see Table 1).
The model was calibrated and validated by accounting for the actual heat demand estimations for the base year derived from NI energy consumption data from the Department for the Economy [41]. Additional calibration was performed using data derived from the change in demand per measure from the National Energy Efficiency Data Framework (NEED), as updated in the 6CB analysis [33]. The estimated changes in demand per measure were derived for the NI context by deriving the change in demand per measure per square metre of domestic floor area. These derivations were applied to the NI housing stock by accounting for floor areas per archetype in the NI housing stock.

2.2. Estimations of Existing Levels of Energy Efficiency in NI

2.2.1. Wall Insulation

Wall insulation retrofit has been termed a critical first step in preparing houses for low-carbon heating technologies [42]. As wall insulation can potentially result in a 9% reduction in domestic heat consumption (see Table 2), this measure can bring one of the most significant energy efficiency improvements and fuel poverty reduction [33,43].
Generally, the state of partially filled and uninsulated cavity walls in Northern Ireland is substandard; approximately 90% have issues with mould and damp [45]. The leading cause of mould growth on walls is excess humidity, and inadequate insulation catalyses mould growth [45,46]. Therefore, partially filled and uninsulated cavity walls recommended for retrofit are assumed hard to treat in the NI housing stock model [16]. If properly installed, insulation can help reduce the occurrence of mould in addition to facilitating heating demand and cost reductions (which can help with tackling fuel poverty) [47,48].
Of the entire 2018 NI housing stock, 69% of houses have full cavity wall insulation, and 17% houses have no wall insulation (8% and 9% have solid walls and cavity walls, respectively) [18,39,40]. The percentages of houses with partial cavity wall insulation and external/internal solid wall insulation are 8% and 7%, respectively [40]. Furthermore, 1919–1965 houses with cavity walls are classed as having uninsulated cavities, as pre-1965 cavity wall insulation was substandard [18].

2.2.2. Loft Insulation

A total of 52% of houses have lofts with insulation greater than 150 mm; 29% of houses have lofts with insulation less than 150 mm. 1% of houses have no loft insulation and another 1% have loft insulation of unknown thickness. The remaining 17% of houses have no lofts because they have been converted to a room with stairs or the pitch of the roof was too shallow for insulation installation [18]. Flats/apartments on the top floor would need loft insulation top-up, and not a complete installation.
Houses requiring a complete loft insulation installation have the highest numbers without central heating among all houses that need to be retrofitted (see Figure 2). Houses without central heating are most likely vacant [18]. Nevertheless, vacant houses should not be excluded from retrofit schemes. Unoccupied houses are essential to the operation of the housing market; when they have been empty for over six months, they are termed vacant and can become problematic [49]. In 2019–2020, there were 16,802 applicants seeking housing from the Housing Executive [50]. Vacant homes should be included in retrofit schemes as they can converted into social homes beneficial to homeless persons [49,50].

2.2.3. Glazing and Door Insulation

Of the NI housing stock, 26% has post-2006 double glazing, 61% has pre-2006 double glazing, 9% has partial double glazing and 3% has single glazing. Higher standards of window construction were not implemented in NI till 2006; however, in other UK regions, these standards were implemented in 2002 [16,51].
Most single-glazed houses are heated by oil, gas and solid fuels (see Figure 2). Roughly 60–65% of households heated with solid fuels are low-income [18]. From April 2021 to March 2022, 14 NISEP schemes will be implemented to improve the energy efficiency of low-income houses, but none of them considers glazing [52]. Glazing can afford a modest but appreciable reduction (2–4%) in heat demand (see Table 2) and should be included in similar schemes [33]. There is limited/no data on the level of door insulation in NI. Therefore, this study recommends that all houses with single and pre-2006 double glazing should have their external doors insulated.

2.2.4. Airtightness

Prior to 2006, the Northern Ireland Building Regulations did not specify detailed standards for residential airtightness [53]. The Air Tightness Testing and Measurement Association (ATTMA) air permeability and pressure testing procedure states that for every site development, the pressure test must be performed on three units of each house type or 50% of all units of each house type, whichever is less [13,54]. The maximum air permeability for a building should be 10 m3/(h·m2) at 50 Pa [13]. Consequently, the infiltration rate in air changes per hour (ac/h) is estimated as 0.15 ac/h for houses that have an air permeability of >5 m3/(h·m2) [54].
Each house type should be tested, but the current trend is such that not all houses are tested despite the stipulated compulsory procedure [55]. By 2006, air permeability and pressure standards and testing became mandatory in NI [13]. Therefore, all pre-2006 houses are estimated to need improved airtightness. Approximately 84% of the NI housing stock (pre-1919–2006 houses) has the potential for improved airtightness; the other 16% (post-2006 houses) is estimated to have infiltration rates according to current NI building standards [18,56]. The ATTMA air permeability test should be carried out on pre-2006 housing stock before retrofit.

2.2.5. Solid Floor Insulation

The potential for solid floor insulation lies with pre-2000 houses, where pre-1991 houses have uninsulated solid floors, and 1992–1999 houses have solid floors with limited insulation [57]. As such, 22% of existing houses (pre-2000 houses) have solid floors with no/limited insulation, and 78% of houses built between 2000 and post-2007 have insulated solid floors.
Most houses requiring solid floor insulation are heated by oil and solid fuels (see Figure 2). As roughly 60–65% of households heated with solid fuels are low-income, a substantial percentage of low-income houses have the potential for solid floor insulation [18]. Current NISEP schemes do not consider improving floor insulation [52].
Solid floor insulation can afford an 8% reduction in heat demand and should be included in NI retrofit programmes, especially for low-income households (see Table 2) [33]. At present, data on NI houses with suspended timber floors are unavailable.

2.2.6. Domestic Demand and Carbon Emissions

NI’s annual domestic heat energy consumption in 2018 was 12,764 GWh for oil, gas, coal, electricity and renewable fuels [58]. The annual space heating demand was derived as 6932 GWh with an average demand per household of 8815 kWh. Additionally, the NI domestic sector produced 2.63 MtCO2e in 2018 [59]. Oil is the most-used heating fuel (64%), and gas is the second most-used domestic heating fuel (24%). With a fuel share of 24% for gas fuel, 76% of domestic stock can be estimated as being off-gas grid houses (see Figure 3) [18]. Thus, only approximately 196,000 houses are on the gas grid, which is a 5% increase in the number of houses connected to the gas grid in 2016 [18]. A third gas extension is underway in NI, and it is projected that 60% of the entire NI housing stock would be within the gas grid area. However, new investments in distribution network developments and connections of houses to the grid will be needed if the gas grid will be used for heating supply by 2050 [28].

2.3. Development of Scenarios

2.3.1. Scenario Development Approach

Three domestic retrofit scenarios were developed: Central, High-Level and Passive House, with a base year of 2018 and end year of 2050 (see Figure 4). The NI housing stock will comprise 880,520 houses by 2050 [60,61].
According to Gillich et al., there are usually deviations between the modelled and actual changes in demand resulting from energy efficiency measures [62]. Such deviations were investigated in the change in demand per domestic energy efficiency measure for the CCC’s Fifth Carbon Budget Advice [62]. However, this study derived changes in demand per measure using the National Energy Efficiency Data Framework (NEED) as updated in the 6CB analysis [33]. As there is currently no NEED for NI, relative estimations based on the 6CB’s NEED dataset were applied in this study.
In every scenario, the average new build demand was estimated by accounting for demand reductions due to the installation of fundamental measures (cavity wall insulation and roof insulation top-up, post-2006/triple glazing and airtightness), on the current average demand per house. Demand reductions align with the level of retrofit of each scenario and it is assumed that these measures are built into the new house during construction.
Flats/apartments with electric heating were excluded from the demand and emissions reductions across all scenarios, as the average demand of this subcategory is approximately 5000 kWh [41]. Therefore, the heating demand for this archetype is likely to not reduce due to the rebound effect (see Table A1 and Table A3 for change in demand per measure). Annual demolition rates were considered but were discovered to have insignificant impacts on the results. This study estimated NI net stock losses (conversions, closures and demolitions) over the recommended retrofit period (2022–2050) to be −2% [63].

Central Scenario

The Central Scenario aligns with the CCC’s 6CB Balanced Pathway Scenario in terms of measures and percentages of houses proposed for retrofit. It presents a modest and balanced pathway for domestic retrofit in NI, recommending different percentages of the existing housing stock for retrofit to current building regulations (see Table 3, Table 4, Table A1 and Table A2).
Additionally, new buildings constructed in the period of retrofit are built to current building regulations. The uptake of five basic retrofit measures—wall, floor and loft insulation, double glazing and airtightness—are recommended in the Central Scenario (see Figure 4). Over half of houses with uninsulated solid walls, and all houses with partially filled cavity walls and uninsulated cavity walls, are fully insulated by 2050. In addition, 1919–1980 houses with uninsulated solid walls are recommended for external insulation. Differently, pre-1919 houses with uninsulated solid walls are recommended for internal insulation, as owners of pre-1919 houses prefer to preserve the external appearance of their houses [16]. All pre-1919–1964 houses with partial cavity walls and pre-1919–1980 uninsulated cavity walls are fully insulated. There are no post-1980 houses with solid walls, as cavity wall construction was mandated for new builds by regulations in the 1980s [45].
All lofts requiring an insulation top-up or a complete installation are retrofitted by 2050. Houses with no loft insulation and insulation less than 100 mm are recommended for a complete installation. Other houses are proposed for a top-up to the recommended level of 270 mm [65]. All houses with single glazing and 25% of all houses with pre-2006 double glazing are retrofitted with post-2006 double glazing by 2050. All archetypes in the housing stock require glazing retrofits. However, fuel-poor flats/apartments only require improvement from pre-2006 double glazing to post-2006 double glazing, as there is no flat/apartment with single glazing in this category. As recommended by Element Energy’s supplementary workbook, the model assumes that window units would be replaced every 20 years to preserve their capacity to conserve energy [66].
A total of 25% of all houses with the potential for solid floor insulation receive solid floor insulation between 2022 and 2050. Most houses retrofitted with solid floor insulation present the highest percentage (97%) of houses off the gas grid retrofitted by 2050. All houses with the potential for improved airtightness are retrofitted by 2050. The distribution of houses with the potential for improved airtightness is similar to that of houses receiving wall insulation retrofits, with 74% off the gas grid. Table 4 represents the annual rate of retrofit (houses/year) for each measure if this scenario is evenly implemented between 2022 and 2050.

2.3.2. High-Performance Scenarios: High-Level and Passive Scenarios

The High-Level Scenario is more ambitious than the Central Scenario, recommending that all of the 2018 housing stock requiring any of the five basic measures be retrofitted by 2050 (see Figure 4). However, all single and pre-2006 double glazing is improved to triple glazing, which is a high-performance measure suitable for a more advanced retrofit (see Table A1 and Table A2) [33]. Additionally, houses built between 2018 and 2020 that have post-2006 double glazing are recommended for a triple glazing retrofit. The Passive House Scenario is the most ambitious of all three scenarios and investigates the impact of retrofitting the stock to passive house standards by 2050 (see Table 3, Table A1, Table A2, Table A3 and Table A4, Figure 4). All measures, with an additional measure of external door insulation, are installed as needed in all houses requiring a retrofit. In these high-performance scenarios, new builds are built to the retrofit standard of each scenario.

2.3.3. Fuel Poverty Scenario

In 2018, there were 131,000 fuel-poor houses in NI [23]. The relative poverty threshold in NI is GBP 328 per week, indicating an annual income of approximately GBP 16,000 [67]. There are three variations of fuel poverty based on the percentage of its income that a household spends on heating fuel: marginal (10–15%), severe (15–20%) and extreme (greater than 20%) [68].
This study considers all fuel-poor houses; only 15% of them are on the gas grid (74% are heated by oil) [18]. The current state of the energy efficiency of fuel-poor houses was estimated by considering 2016 NIHCS data on the different levels of wall insulation, loft insulation and glazing data (see Table 1). As the 2016 NIHCS has no information on fuel-poor households and floor insulation, airtightness and door insulation, the same assumptions used to disaggregate the energy efficiency measures of the general housing stock were used to disaggregate the energy efficiency measures for fuel-poor houses. The average SAP rating of fuel-poor houses is 58.65 (band D). This study recommends that all fuel-poor houses are retrofitted to the level of retrofit of each scenario by 2030, in line with general UK guidance.

3. Results and Discussion

3.1. Change in Demand and Emissions across All Scenarios

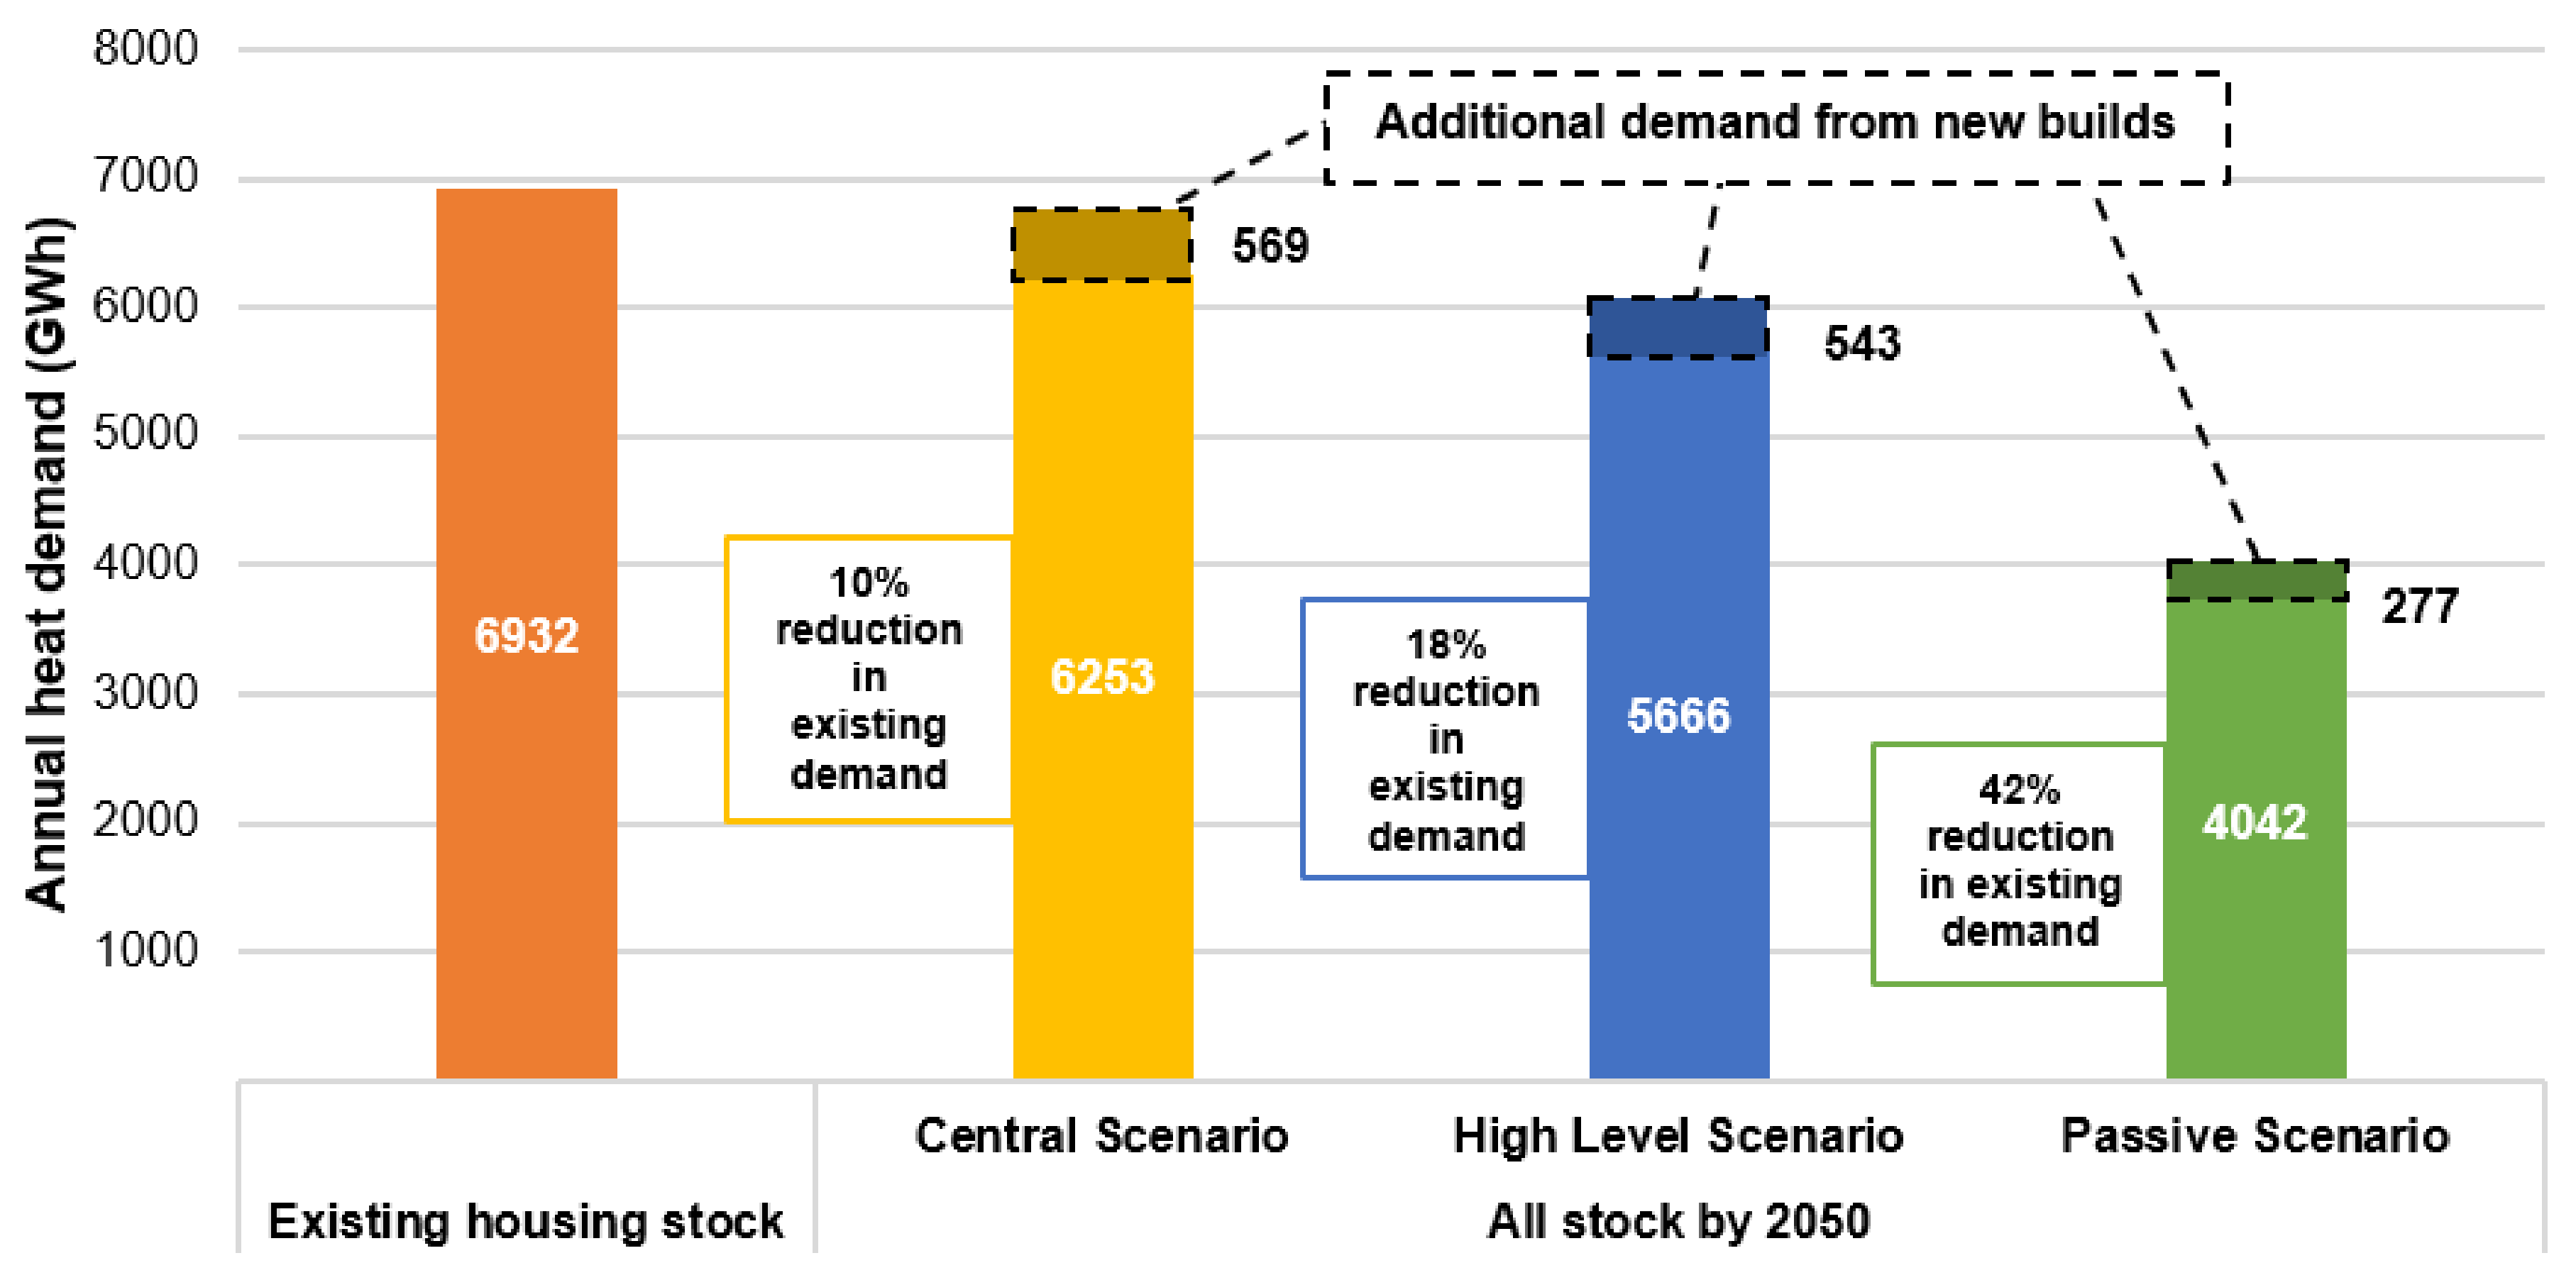
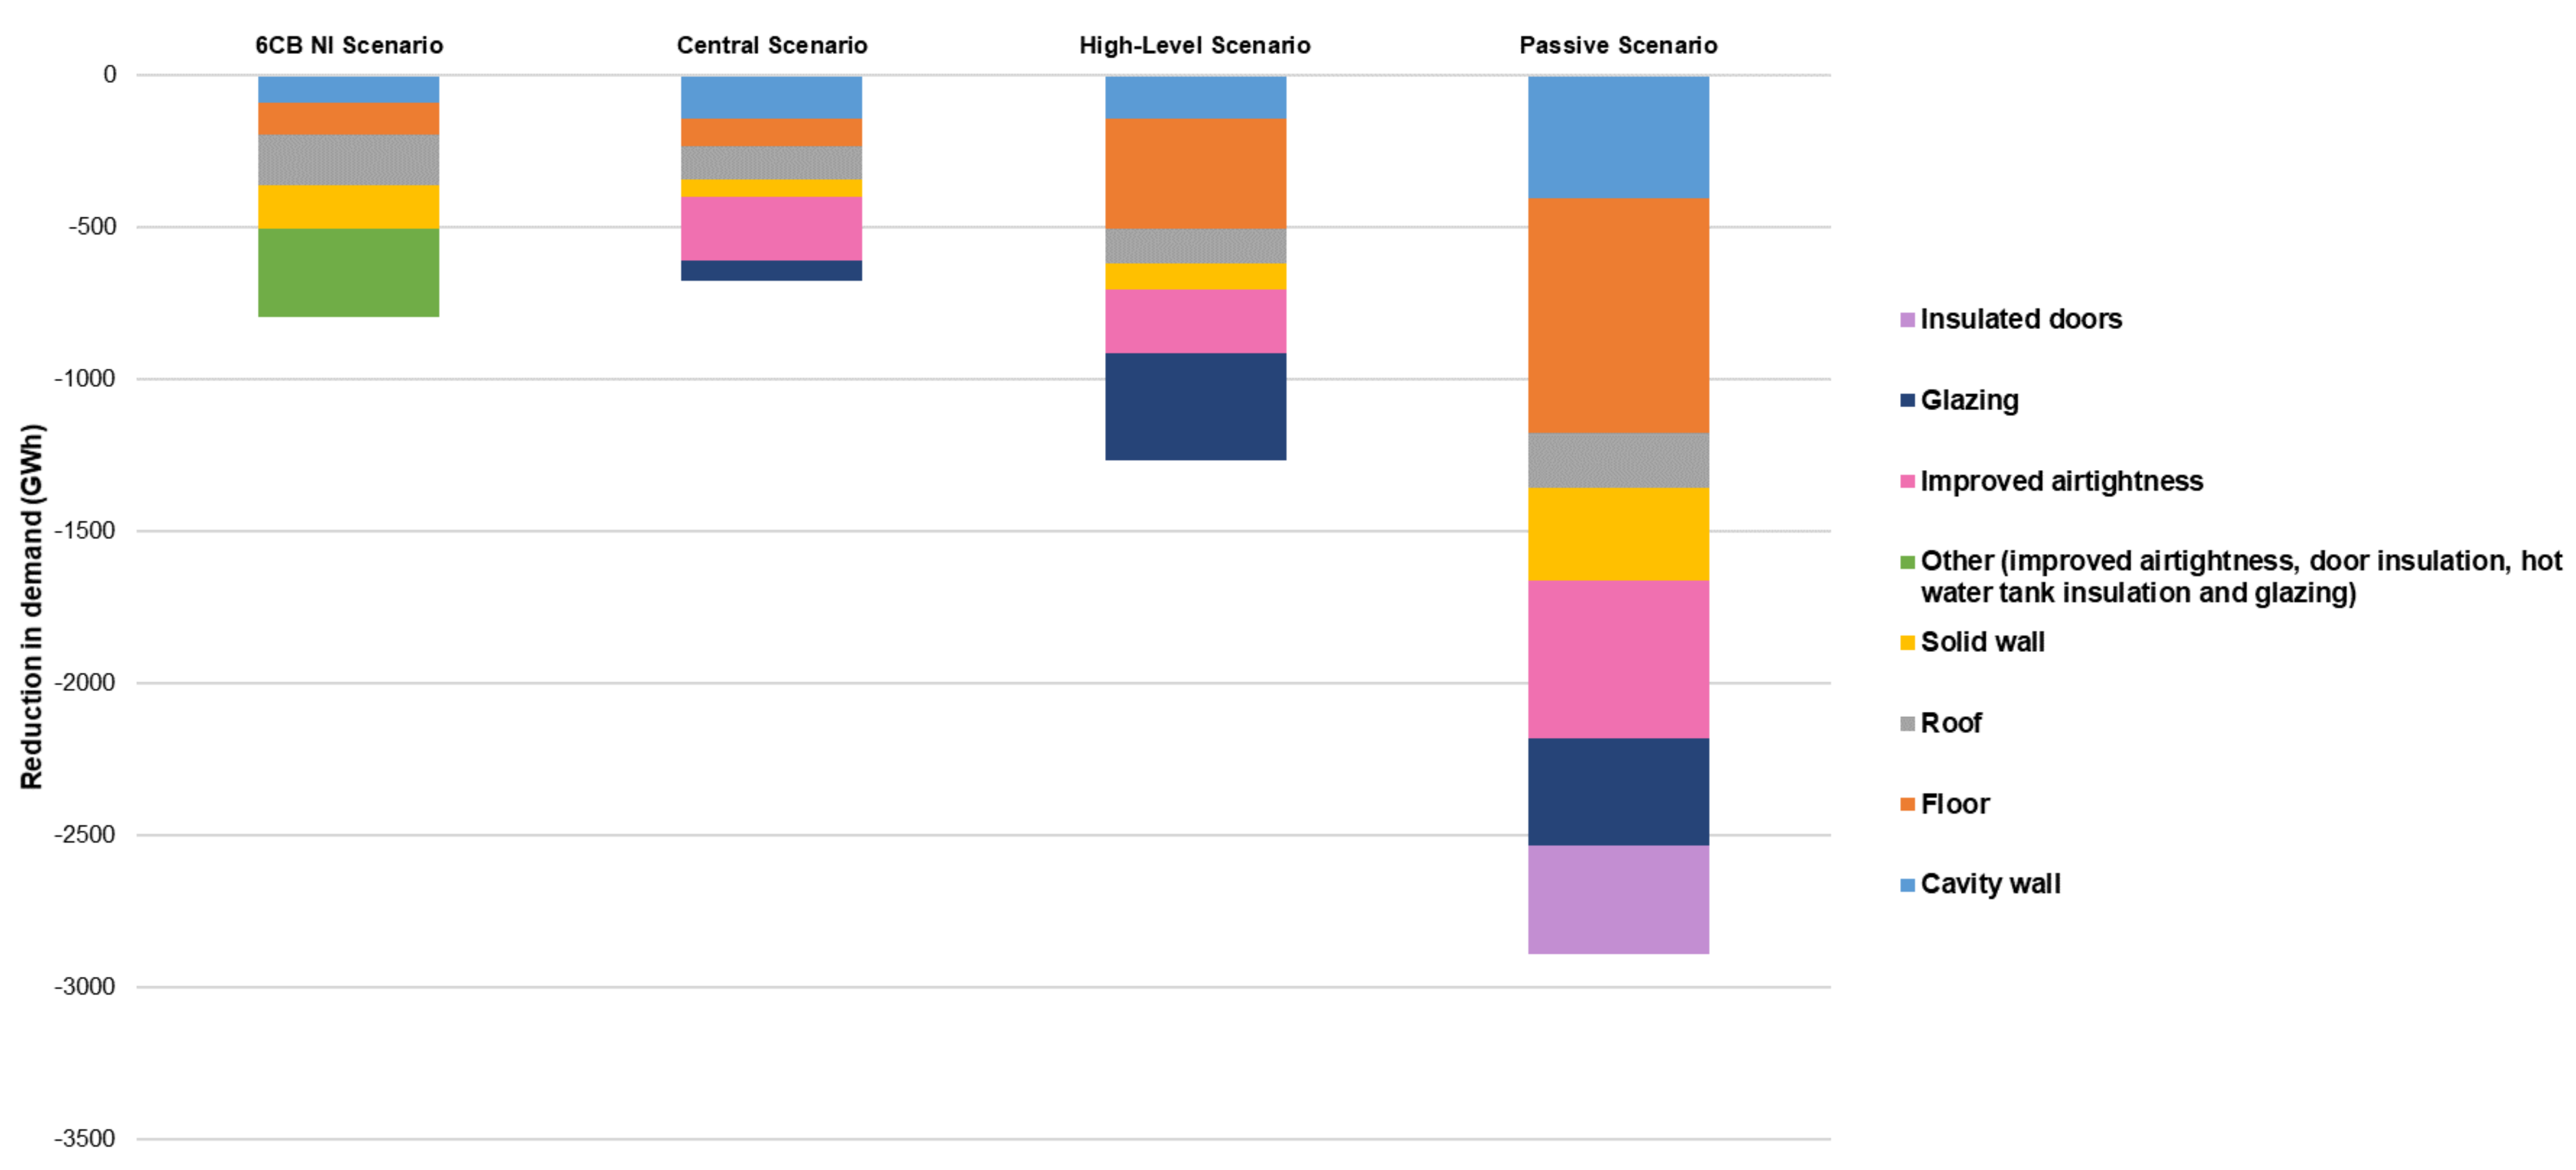
There is a 10% reduction in the heat demand of the existing housing stock by 2050 (see Figure 5 and Figure 6). This reduction is slightly lower than the 6CB’s estimated 11% reduction in NI’s existing domestic demand by 2050 from 2018 levels due to retrofitting only [
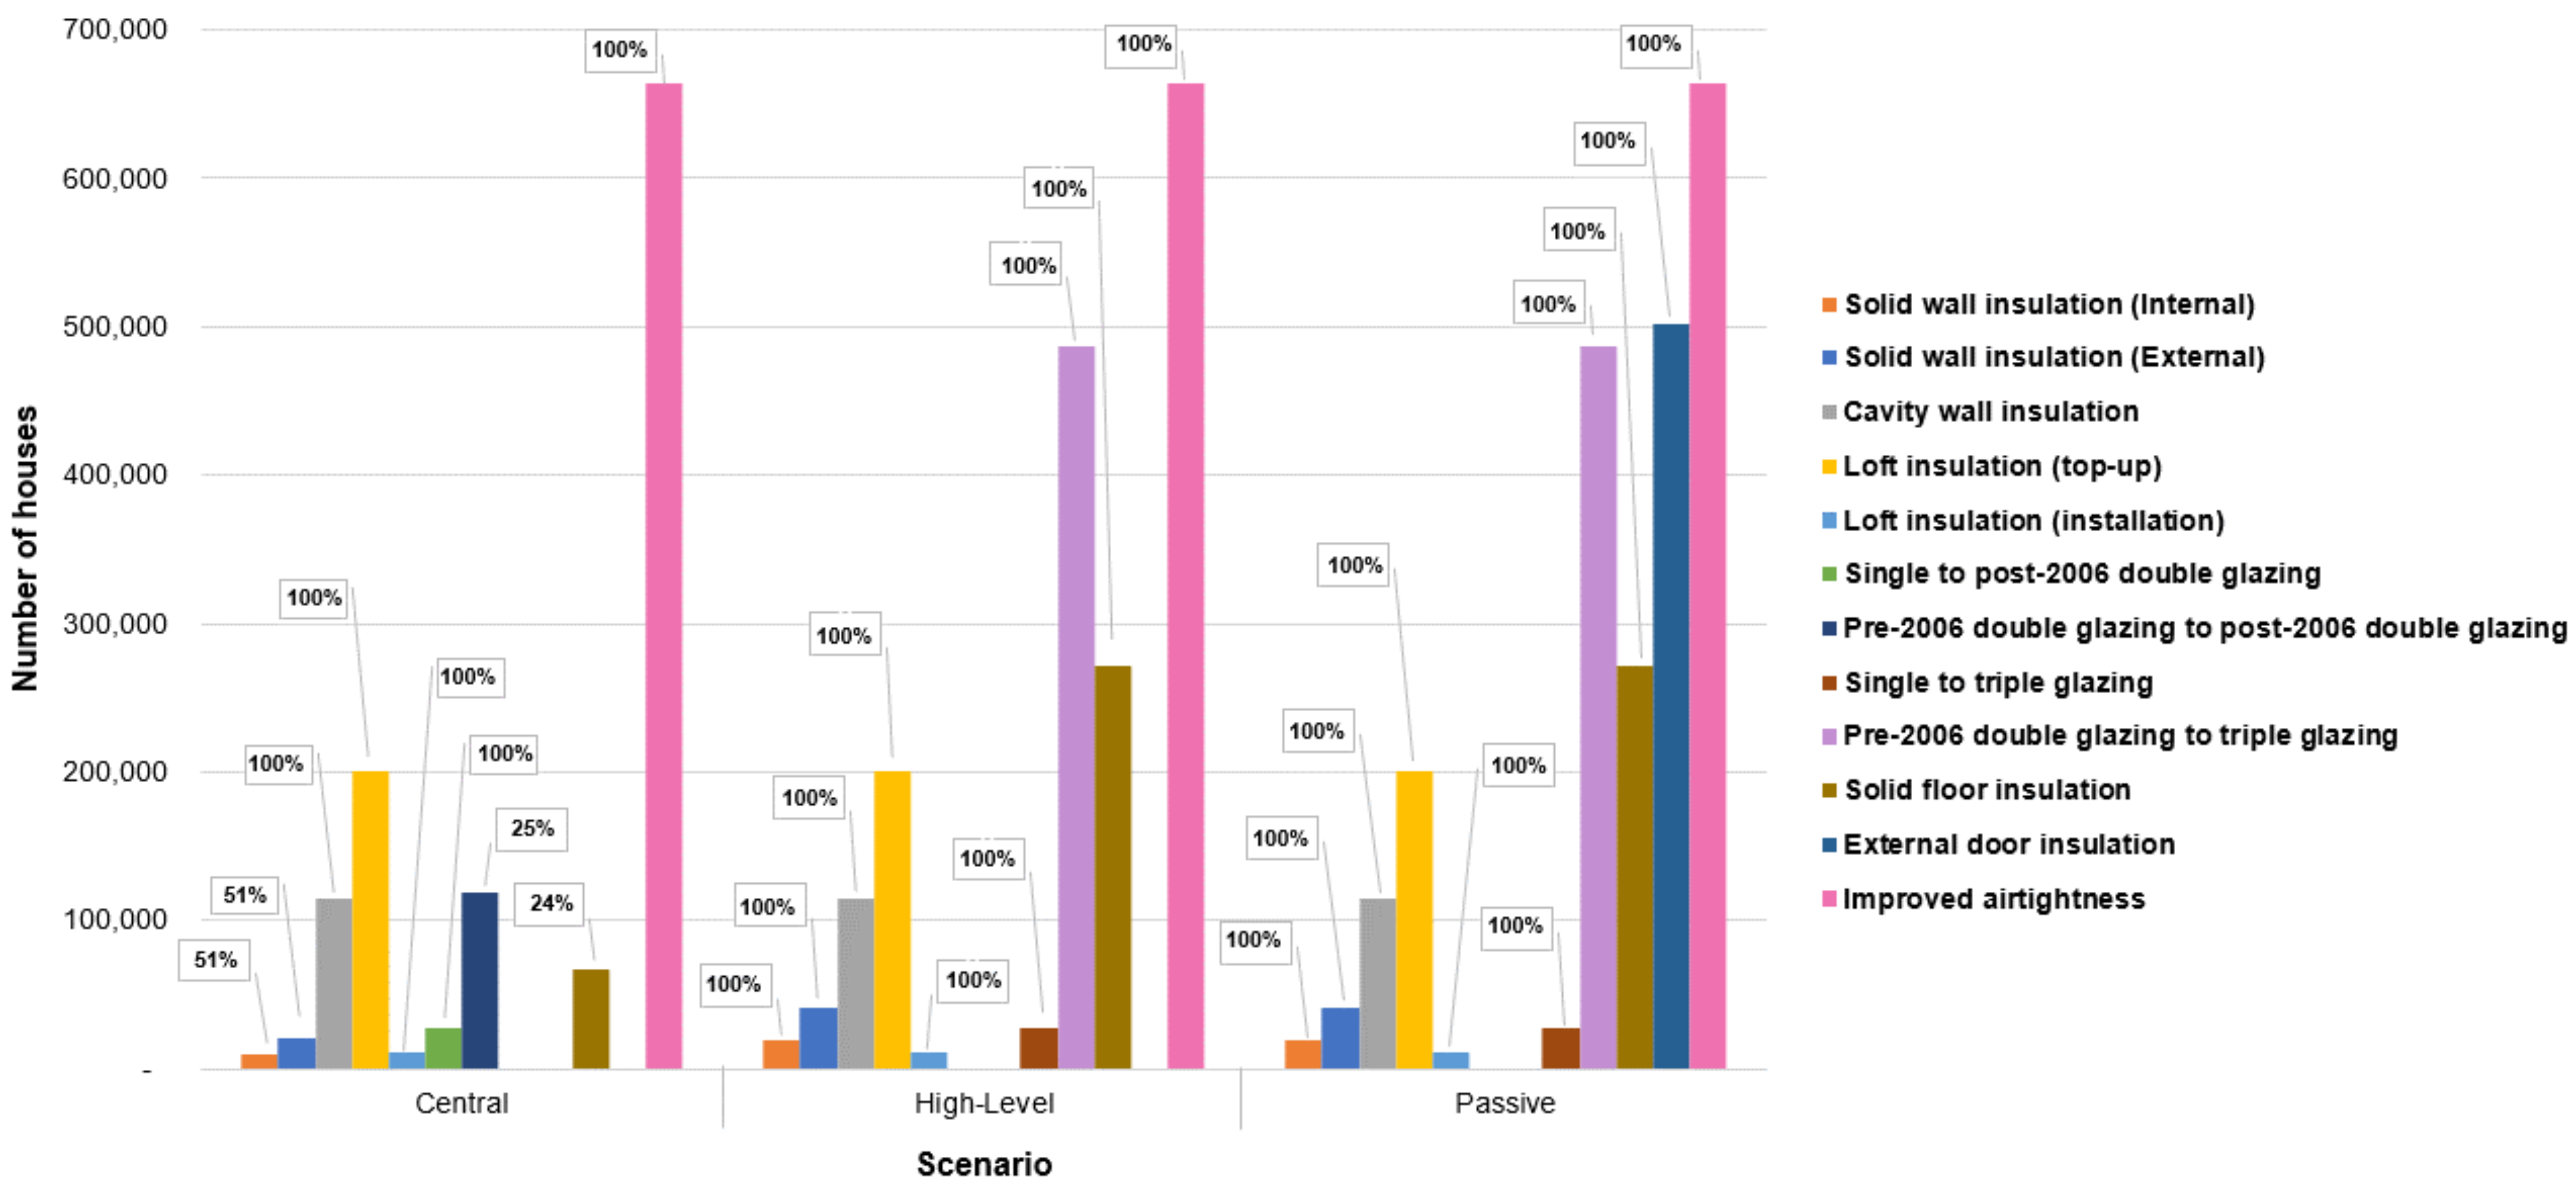
66]. The highest changes in demand come from improved airtightness, because almost all of the existing housing stock is recommended for airtightness retrofitting. Other significant changes in demand come from cavity wall and solid floor insulation, which are recommended for approximately all houses needing these measures.
The highest percentage reduction in demand comes from solid wall insulation (see Table 2). However, houses with solid walls are the least efficient in the stock; they are also often heritage houses [69,
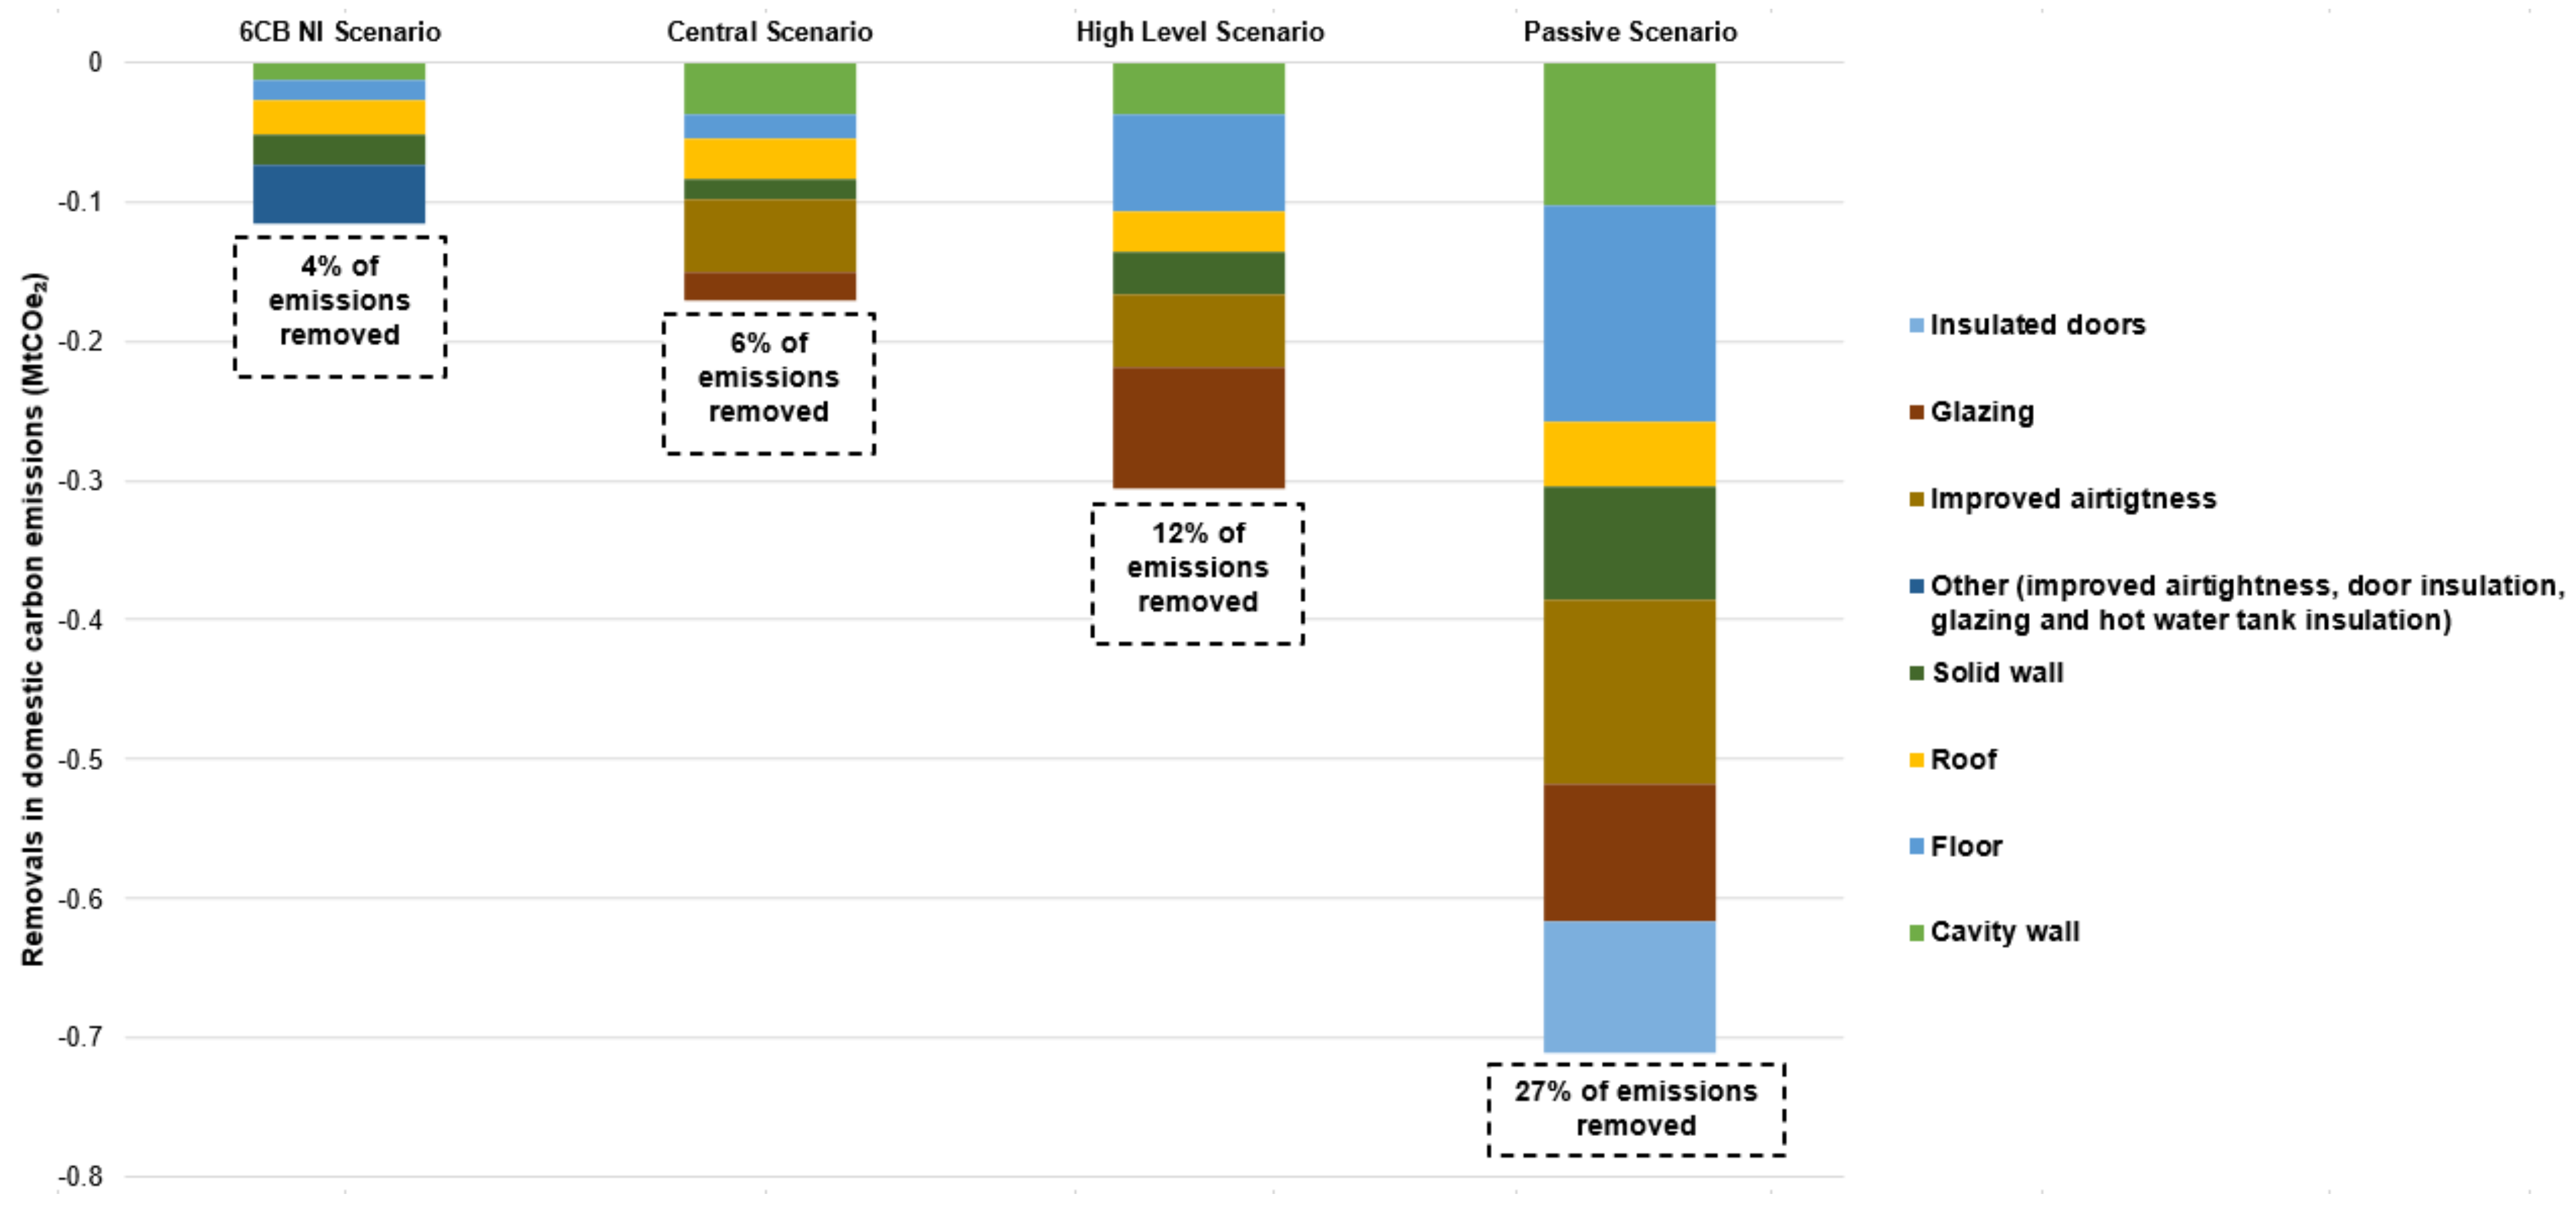
70]. This makes them difficult and expensive to insulate. Therefore, a low uptake of solid wall insulation is recommended, and this limits the potential of this measure. Around 6% of domestic carbon emissions are removed by 2050. However, the 6CB advice suggests that 4% of domestic emissions are removed by 2050 (see Figure 7). The CCC’s percentage of emissions removed might be less due to dissimilarities between the breakdown of heating types in houses recommended for retrofit by this study and the CCC’s study. The highest removals of carbon emissions come from improving airtightness, cavity wall insulation and loft insulation top-up.
In the High-Level Scenario, there is an 18% reduction in the heat demand of the existing housing stock by 2050 (see Figure 5 and Figure 6), which is significantly above the 6CB’s estimated 11% reduction in NI’s existing domestic demand by 2050 [66]. The highest changes in demand come from houses retrofitted with solid floor insulation. Solid floor insulation incurs the third-highest reductions in demand and is applied to about half of the total number of houses requiring retrofits. Other significant changes in demand come from pre-2006 double glazing to triple glazing improvements and improved airtightness. Around 12% of domestic emissions can be removed in this scenario; the highest removals of carbon emissions come from improving pre-2006 double glazing to triple glazing, solid floor insulation and improving airtightness (see Figure 7).
The Passive Scenario results in a 42% reduction in the heat demand of the existing housing stock by 2050 (see Figure 5 and Figure 6). In the Passive Scenario, the highest changes in demand come from houses retrofitted with solid floor insulation. Other significant changes in demand come from improved airtightness and cavity wall insulation. Furthermore, this scenario estimates that 27% of the current emissions can be removed by 2050; the highest removals in carbon emissions come from solid floor insulation, improved airtightness uptake and cavity wall insulation in this scenario (see Figure 7).

3.2. General Cost Impacts and Potential Improvements in SAP Rating

The Central Scenario costs approximately GBP 2 billion (see Table 5). Overall, cavity wall insulation, upgrading pre-2006 to post-2006 double glazing and solid floor insulation are the costliest measures to implement. Furthermore, the bungalow and the flat/apartment are the most and least expensive house types to retrofit, respectively. Although the detached house has the largest floor area, the bungalow has the highest building cost per square metre of all house types because it occupies a high value of land for its floor area [71]. The average cost of retrofit across all house types is GBP 3700, with bungalows and flats showing the highest and lowest average costs of GBP 5500 and GBP 1900, respectively. These costs are broadly in line with other studies and assumptions mentioned earlier.
However, the 6CB Balanced Pathway Scenario shows that the average household will need a GBP 9000 investment in retrofit [66]. Houses are recommended for a range of retrofit packages costing between GBP 1000 and 10,000, depending on their retrofit needs [66]. The CCC considers additional energy efficiency improvements such as heating system upgrades, which accounts for a higher average cost of retrofit per house than those in this study. This study’s Central Scenario only proposes fabric retrofit measures with average costs of GBP 50–7400 per house.
The implemented measures and accompanying SAP points in the Central Scenario are outlined by building regulations [21]. In the Central Scenario, 23,000 existing houses receive at least one retrofit measure annually by 2050. Thus, the average SAP rating for existing and new NI housing stock increases to 73 (band C) by 2050 (the average SAP points for a new build is estimated as 86 (band B)) [22]. If Northern Ireland aims at improving domestic energy efficiency in line with other regions, the Central Scenario must be delivered through accelerated schemes implementing the retrofit of 75,000 houses annually with at least one measure by 2030.
The NIHE’s cost of improving 23,200 occupied and vacant F- and G-rated dwellings to band E through envelope and heating system retrofitting is GBP 87 million, with an average cost of approximately GBP 3700 per dwelling [34]. This study estimates a similar average cost of retrofit (GBP 3700) with approximately 670,000 houses being recommended for retrofitting with measures including costly and potent measures such as solid wall and solid floor insulation.
Additionally, the NIHE suggests the average SAP rating for the domestic stock will increase from band D to band C, with oil and gas heating installations and fabric (easy-to-treat cavity wall insulation, loft insulation and double glazing) upgrades of 632,000 homes at total and average costs of GBP 2.4 million and GBP 3133, respectively [35]. However, this present study recommends that the NI stock can achieve an average SAP rating of C by 2050 due to fabric retrofitting only, at an average cost of GBP 3700.
The High-Level Scenario costs GBP 5.9 billion; the measures that are most expensive to implement between 2022 and 2050 are upgrading pre-2006 to triple glazing, solid floor insulation and cavity wall insulation (see Table 6). The individual costs of applying all measures to all house types rise due to the increased costs of improving glazing specifications. Consequently, the average cost of retrofit across all house types rises to approximately GBP 4500, with bungalows and flats showing the highest and lowest average costs of GBP 7000 and GBP 2000, respectively.
The Passive Scenario costs GBP 10.7 billion, and the measures that are most expensive to implement between 2022 and 2050 are upgrading pre-2006 double glazing to triple glazing, solid floor insulation and external solid wall insulation (see Table 7). Wall insulation is the most expensive retrofit measure to implement per house (with an average cost of approximately GBP 38,000). This high cost is due to the extremely airtight construction, minimal thermal bridging and significant thickness of the insulation required (the thickness of a passive wall would range between 300 and 500 mm) [73]. The detached house and the terraced house are the most and least expensive house types to retrofit, respectively. The detached house has the highest number of windows and largest floor area among other house types [74]. Therefore, the cost of installing triple glazing and loft installation to passive house standard in the detached house is impacted by its size, making it more expensive than other house types. The terraced house is the cheapest house type to retrofit to passive house standards of all five house types, as it has the lowest average wall area of all house types (see Table 8). The average cost of retrofit across all house types rises to approximately GBP 11,000, with detached houses and flats showing the highest and lowest respective average costs of GBP 15,000 and GBP 6000.
Across all scenarios, the cheapest overall costs are attributed to improved airtightness and loft insulation installations, while the cheapest measures per house are loft insulation top-up and improved airtightness (see Table 5, Table 6 and Table 7). Cheaper measures such as improved airtightness and loft insulation top-ups can be installed by homeowners themselves; the airtightness of a flat/apartment can be improved at costs as low as GBP 12 (see Table 8). Additionally, external solid wall insulation remains the most expensive measure to implement per house.

3.3. Cost Impacts and Improvement in SAP Rating for Fuel-Poor Households

In the Central Scenario, the total cost of retrofitting all fuel-poor households by 2030 is GBP 930 million, which is 45% of the scenario’s overall cost (see Table 5). In the High-Level Scenario, the cost of retrofitting all fuel-poor houses by 2030 rises to GBP 1.1 billion due to pre-2006 double glazing to triple glazing retrofitting (see Table 6). This cost accounts for 18% of the total cost of the scenario. In the Central and High-Level Scenarios, cavity wall insulation, solid floor insulation and pre-2006 double glazing to post-2006 double glazing retrofitting maintain the highest gross retrofit costs among all measures applied to the fuel-poor housing stock.
In the Passive Scenario, the cost of retrofitting all fuel-poor houses rises to approximately GBP 1.8 billion due to the scenario’s ambitious retrofit standard (see Table 7). This accounts for 17% of the total cost of the Passive Scenario. In this scenario, the overall costs of implementing pre-2006 double glazing to triple glazing, solid floor and external solid wall insulation retrofit in the fuel-poor housing stock are the highest among all of the costs of the passive retrofit measures. In the High-Level and Passive Scenarios, the percentage costs of retrofitting all fuel-poor houses based on the total scenario cost decreases due to the higher numbers of non-fuel-poor houses retrofitted by 2050. The average retrofit costs per house and measure for the general housing stock remain the same for the fuel-poor housing stock.
The average SAP rating for the NI fuel housing stock can improve from band D to band C (an average SAP rating of 72) by 2030. To achieve this, at least 12,300 fuel-poor houses would need to receive at least one retrofit measure between 2022 and 2030. This number is slightly less than the average number of houses currently retrofitted annually in NI, indicating that NI currently has the potential to eradicate fuel poverty over the next 10 years.

3.4. Impacts of Scenario Outputs

3.4.1. Economic Impacts

The retrofit costs across all scenarios were analysed according to the costs of labour and materials used in the construction industry [74]. In the Central and High-Level Scenarios, loft insulation costs may be broken down into 47% and 53% for materials and labour/transport, respectively, as one square metre of 100 mm insulation thickness costs GBP 1.
In the Passive Scenario, 93% of the loft insulation retrofit cost is claimed by labour. The labour costs for loft insulation are significantly higher than in the other two scenarios, due to the specialist level of skill required to install this measure to the passive house standard [75]. For insulated doors, it is estimated that 81% of the retrofit costs are allocated to materials, as the addition of insulation increases the unit price of the door [33].
Across all scenarios, 31% and 69% of the glazing retrofit costs are allocated to labour and materials, respectively, according to Building Cost Information Service (BCIS) index specifications. The airtightness improvement costs are only associated with materials [74]. Approximately half of solid wall insulation costs are claimed by labour costs, while the remainder is allocated to materials (53%, 48% and 49% in the Central, High-Level and Passive Scenarios, respectively). For internal wall insulation, 70% of the cost per house is spent on labour; for external wall insulation, the BCIS index specifies that 38% is spent on labour [76].
For cavity wall insulation, most of the retrofit cost is spent on labour (97% in the Central and High-Level scenarios, and 98% in the Passive Scenario), as insulation materials cost GBP 2/m2. Similarly, most of the solid floor insulation costs are allocated to labour (97% in the Central and High-Level Scenarios, and 99% in the Passive Scenario). Labour costs for solid floor insulation are considerable due to the rigorous installation process. Typically, solid floors are either overlaid with expensive hi-tech insulation materials, or the concrete must be broken up and reinstated with new rigid insulation below the screed [77].
Overall, in the Central Scenario, circa 70% and 30% is attributed to labour and materials, respectively. In the High-Level Scenario, the retrofit costs are split roughly halfway between labour (54%) and materials (46%). In the Passive Scenario, approximately 60% and 40% of the retrofit costs are assigned to labour and materials, respectively. A cumulative 5%, 3% and 2% saving due to economies of scale may be applied to the Central, High-Level and Passive Scenarios. Savings due to economies of scale are attributed to 5–10% savings from the labour and transport required for installing wall insulation in over 10 houses [74].
Fabric retrofit solutions facilitate job creation and employment opportunities [2]. The potential number of construction-related jobs that could be generated annually between 2022 and 2050 is 72,000, 170,000 and 348,000 from the Central, High-Level and Passive Scenarios, respectively. This general estimation is based on the mean weekly earnings and the number of weekly and annual working hours in the NI construction industry. In the NI construction sector, the mean weekly earnings and working hours are GBP 590 and 43 h (including overtime), respectively; the average number of hours worked in a year is estimated as 1367 [78,79,80].
In NI, the rate of unemployment for people over 16 has increased and the proportion of people aged 16–64 who were not working and not looking for or available to work decreased in the last year [81]. The Central, High-Level and Passive Scenarios can contribute total labour costs of GBP 1.4 billion, GBP 3.2 billion and GBP 6.6 billion, respectively, to NI’s local economy. Therefore, there is substantial potential for job creation through these massive retrofit programmes in NI, implying economic benefits worth exploring. Furthermore, the demand for retrofit materials can lead to further employment in the manufacturing sector. Materials may be sourced internationally or locally, but labour costs will be of economic benefit to the local NI context.
Table 5 shows that across all scenarios, the cost of implementing all retrofit measures to each house type in each scenario is generally cheaper than its corresponding new build cost. However, the cost of retrofitting a terraced house to passive house standards is more expensive than the cost of rebuilding it. In this case, it would be better to rebuild a highly energy-inefficient terraced house than retrofit it to passive house standards.

3.4.2. Socio-Environmental Impacts

Retrofitting will reduce the heat demand and energy bills per household, making heat more affordable for all income classes, especially those in fuel poverty. This study shows that if all measures are applied across all house types, the demand required to heat a bungalow, terraced house, semi-detached house, detached house and flat can be reduced by up to 11%, 11%, 9%, 8% and 8%, respectively, in the Central Scenario (see Table 9). The more ambitious scenarios can yield greater reductions in demand per house type. The highest percentage of house types requiring retrofits is attributed to the terraced houses. The most ambitious Passive Scenario can result in up to a 48% reduction in the heat demand of a terraced house, if all passive measures are applied.
Fuel-poor people live in cold, damp homes during winter and this can be fatal [82]. If more homes are well heated, the rate of deaths from extremely cold indoor conditions will reduce. With better levels of retrofit, domestic building envelopes would be better insulated, and thermal comfort levels would improve. Higher levels of thermal comfort and, hence, better quality of indoor air can reduce rates of cardiovascular disease, asthma and cancer [83].
Retrofitting the building envelope eases the transition to a low-carbon heating system. Building envelope retrofitting may help initiate positive consumer attitudes towards adopting low-carbon technologies [84]. Currently, NI consumers do not have adequate education and support to invest in energy efficiency measures [28]. This study provides information on energy savings and the cost of retrofit, which consumers will find useful.
Some relatively affordable measures such as glazing and airtightness improvements, which have some appreciable impacts on heating demand, can be included in existing and future government retrofit schemes. This would encourage NI homeowners to invest in improving the energy efficiency of their dwellings. Improved domestic energy efficiency would lead to reduced carbon emissions, contributing towards climate change mitigation in NI. Although the 6CB advice specifies that 4% of NI’s residential emissions can be removed from 2018 levels by 2050, this study shows that higher amounts can be removed (6–27%) by improving the efficiency of the building fabric. Additionally, with well-insulated houses in NI, a lessened reliance on high-carbon heating fuels, especially oil, is feasible.

3.5. Conclusions and Recommendations

This study investigated the socioeconomic and environmental impacts of different levels of domestic fabric retrofit in the context of Northern Ireland. The study makes the following recommendations, which are applicable in other contexts and were illustrated by this Northern Irish case study.
Firstly, different archetypes will have techno-economic variations, which should be considered in the application of fabric retrofit when retrofit programmes are developed and executed. In the NI context, flats and terraced houses are the cheapest to retrofit to passive house standards among the different archetypes. However, it is cheaper to rebuild a highly energy-inefficient terraced house than to retrofit it to passive house standards. Terraced houses and flats/apartments have the highest and lowest numbers, respectively, requiring most retrofit measures such as wall insulation, loft insulation top-ups, solid floor insulation, glazing, and airtightness improvements. These two house types have the lowest costs of retrofit across all scenarios, and this can inform the creation of current and future energy efficiency grants.
Secondly, the installation costs of retrofit measures should be an important consideration for the creation of energy efficiency schemes, especially those targeted at fuel poverty. In NI, cavity wall insulation, solid floor insulation and upgrading pre-2006 double glazing to post-2006 double glazing/triple glazing are the costlier measures. Policy can encourage the creation of grants/schemes to offset some of the cost of these measures for owners of house types (bungalows, detached houses and semi-detached houses) with high retrofit costs. Current and future energy efficiency programmes for low-income households can make provision for solid floor insulation and glazing improvements. Similar considerations can be made for households in fuel poverty. The following categories of fuel-poor households show the highest numbers needing the assigned measure:
  • 1965–1980 bungalows—external solid wall insulation.
  • Pre-1919 semi-detached houses—internal solid wall and cavity wall insulation.
  • 1980 bungalows—loft insulation top-up.
  • 1965–1980 terraced house—loft insulation installation.
  • Pre-1919-post 1980 terraced houses—solid floor insulation, glazing and airtightness improvements.
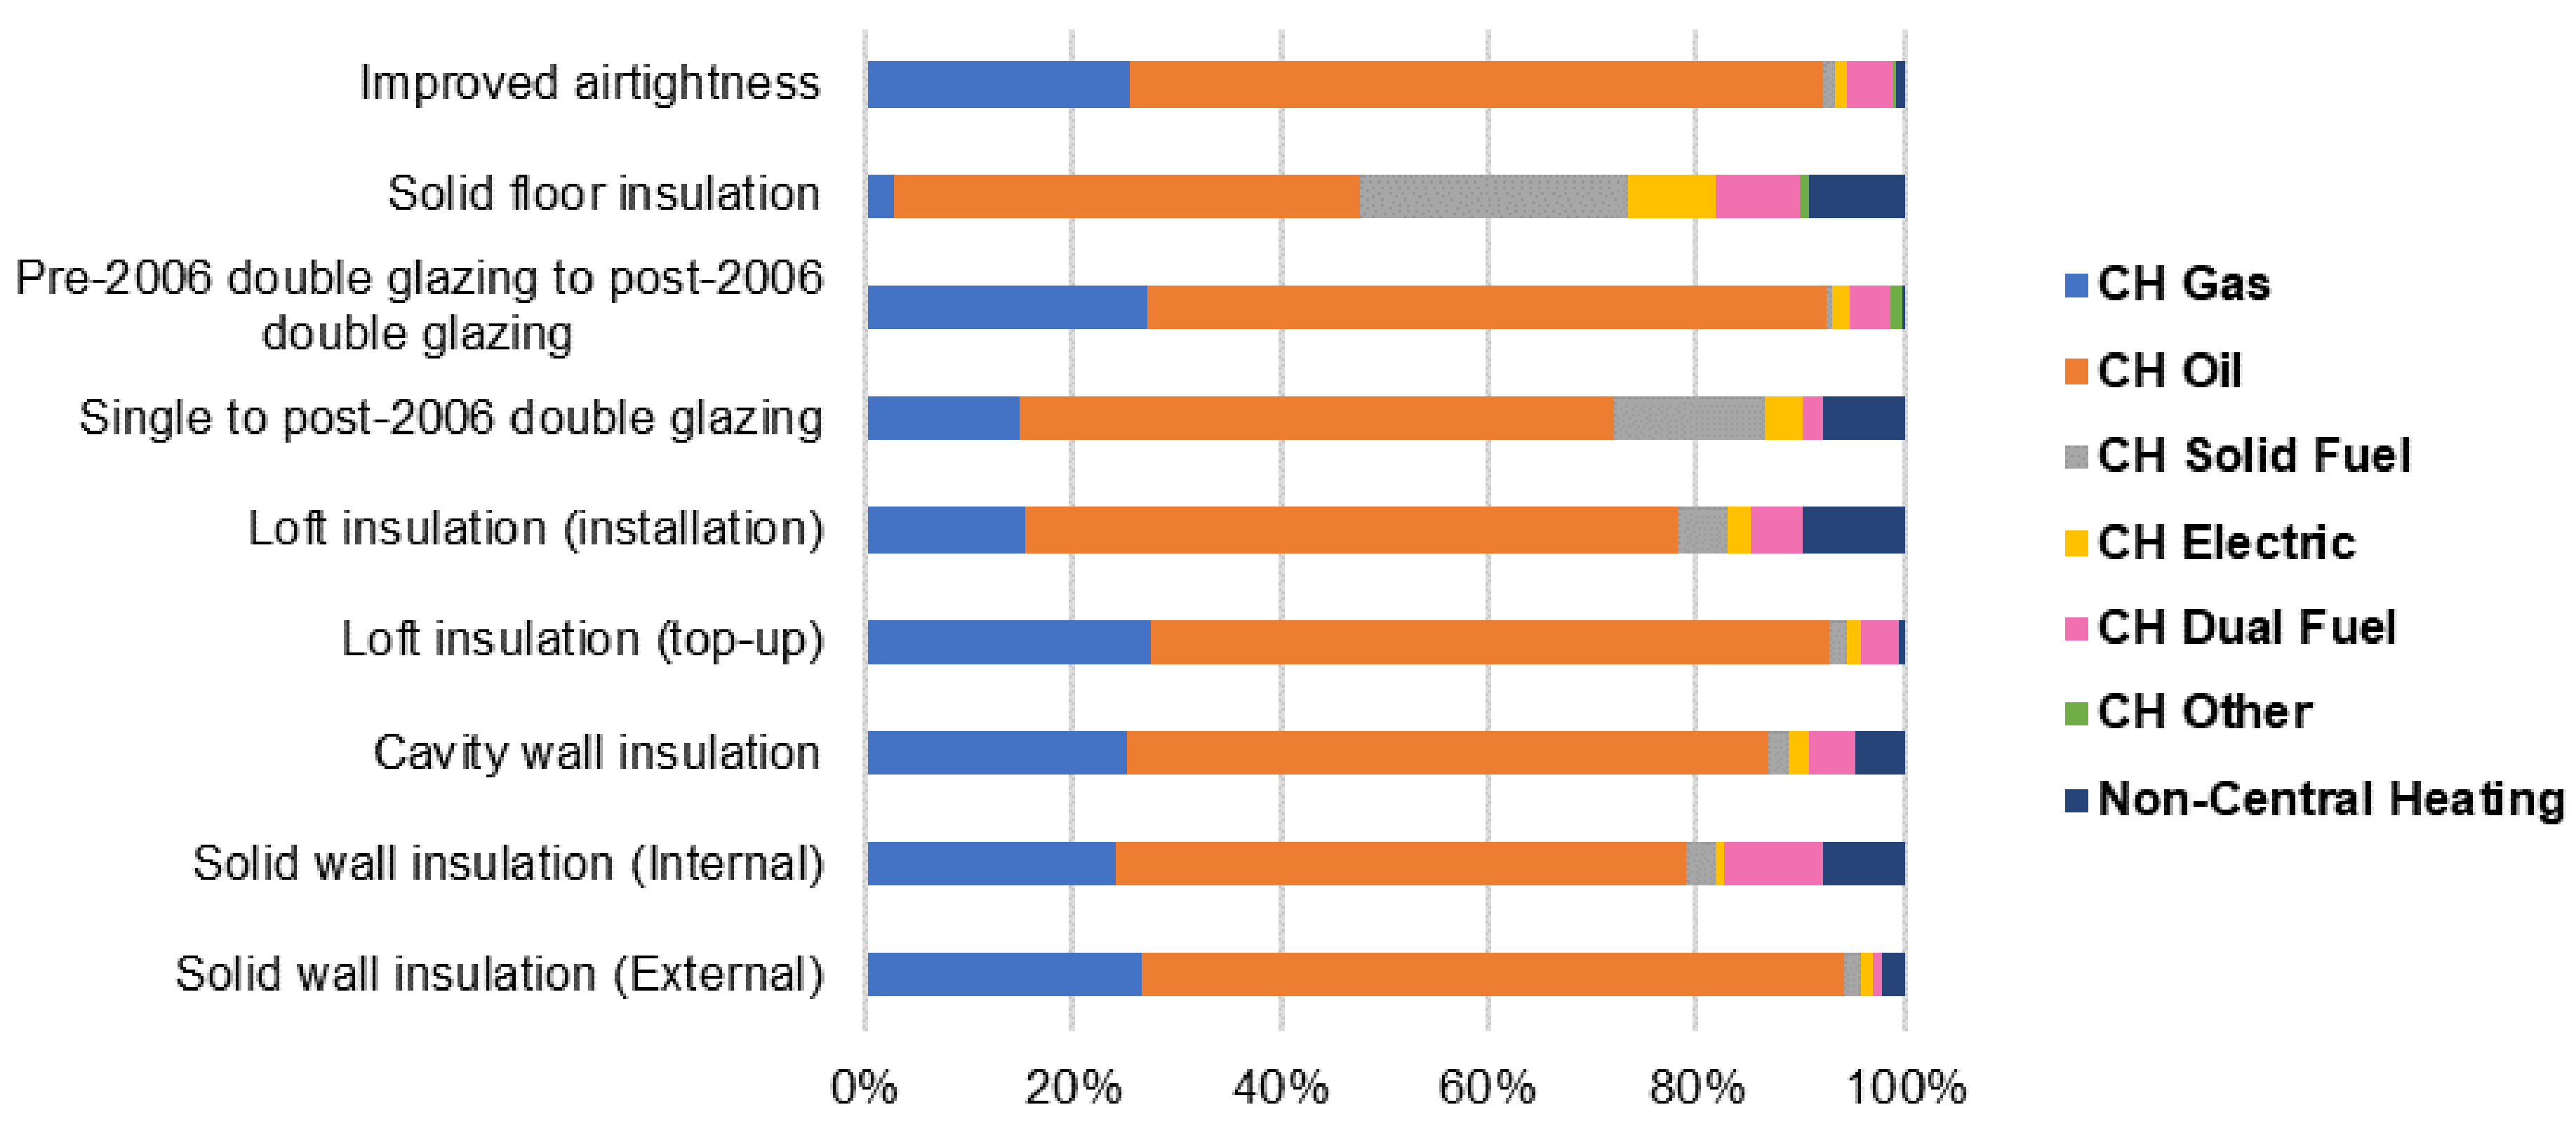
Approximately 85% of all fuel-poor houses recommended for retrofitting are off the gas grid.
Similarly, some measures that have greater environmental impacts than others can be easily implemented by homeowners due to cheap material and installation costs and ease of installation. Local policy can encourage the implementation of such measures first and at a higher rate than others. Airtightness improvements, cavity wall insulation, loft insulation top-up, solid floor insulation and glazing improvements yield greater potential for reductions in demand and emissions than other measures in the NI context. A total of 23,000 houses can be retrofitted annually from 2022 to 2050 with a range of measures with average costs of GBP 60 to GBP 8000.
Airtightness improvement and loft insulation top-up have the cheapest costs per house among these potent measures and can be easily implemented without professional help [72,74]. Loft insulation installation is required by an evident percentage of vacant houses, which can be retrofitted to provide high-quality living spaces. Policy should facilitate incentives encouraging homeowners to invest in airtightness upgrades and loft insulation top-ups. An airtightness test should be carried out on every house built pre-2006 before airtightness upgrades are carried out.
Finally, local authorities can create and accomplish high-reaching energy efficiency programmes and targets, while using national guidance as a springboard. The development of energy efficiency frameworks can inform building regulations for existing and new buildings. This would encourage the uptake of optimally energy-efficient domestic fabrics, which can improve quality of life and aid an easy transition to low-carbon heating. This study’s NI scenarios demonstrate that the heat demand and resulting emissions of the existing housing stock can be reduced further than UK government advice shows by 2050. However, if NI must achieve this, 23,000 houses will have to be retrofitted with at least one measure from now till 2050. Consequently, more efforts towards the creation of energy efficiency schemes in NI are needed. NI currently has the potential to abate fuel poverty between 2022 and 2030. The average SAP rating of NI’s fuel-poor housing stock can improve from band D to band C by 2030, if 12,300 fuel-poor houses are retrofitted with at least one measure between 2022 and 2030.
Around 74% of the houses recommended for retrofitting are off the gas grid, indicating that retrofitting is a critical first step in preparing the NI housing stock for the uptake of low-carbon heating systems. The improvement of the energy efficiency of domestic envelopes should be prioritised as the first step towards achieving net zero targets in NI. The scenarios’ cost estimations suggest a guide to the amount of public funds that can be assigned to energy efficiency programmes for all households. Finally, this study’s findings can inform revisions of NI building regulations towards local and UK-wide decarbonisation targets.

Author Contributions

I.V. and N.H. conceived the basic idea for this study. I.V. and O.S.O. verified the analytical methods. O.S.O. performed the computations and produced the original draft. I.V. and O.O. reviewed and edited the manuscript. N.H. and I.V. supervised the findings of this work. All authors have read and agreed to the published version of the manuscript.

Funding

This work was supported by the Science Foundation Ireland (SFI) under the Investigator Award under Grant SFI/15/IA/3058. The SFI Investigators Programme supports world-class research ability in science, technology, engineering and mathematics (STEM) areas, which buttress enterprise competitiveness and societal development in Ireland.

Data Availability Statement

To access the Northern Ireland domestic energy efficiency model developed for this study, please contact the first author, O.S.O., using the email address s.ogunrin@ulster.ac.uk.

Acknowledgments

This study was conducted as part of the Science Foundation Ireland (SFI) and Department for the Economy (DFE) research project ‘Energy storage and demand-side flexibility within future electricity markets’, which is run by University College Dublin and Ulster University. Thanks to Andrew Munn, Caroline Best and Jahnet Brown from the Northern Ireland Housing Executive for their assistance in securing the data needed for this study.

Conflicts of Interest

The authors declare no conflict of interest.

Appendix A

Table A1. Change in demand (kWh/m2) per measure per house type (applicable to Central, High-Level and Passive Scenarios).
BungalowTerraced HouseSemi-Detached HouseDetached HouseFlat/ApartmentU-Value (W/m2k2)
Solid wall insulation (external)−19−17−23−18−250.28
Solid wall insulation (internal)−16−15−19−15−210.28
Cavity wall insulation−14−8−13−14−180.28
Loft insulation top-up−4−3−2−3−60.16
Loft insulation−18−11−10−10−230.16
Single to post-2006 double glazing−9−7−7−9−81.60
Pre-2006 to post-2006 double glazing−4−3−3−4−41.60
Single to triple glazing−12−9−9−12−100.80
Pre-2002 to triple glazing−7−5−5−7−60.80
Solid floor insulation−14−12−12−10−120.22
Insulated door−4−3−3−2−21.80
Airtightness (air changes per hour)−4−3−3−2−30.15
Source: [6,13,33,75].
Table A2. Cost of retrofit per measure per house type (applicable to Central, High-Level and Passive Scenarios).
Bungalow (GBP)Terraced House (GBP)Semi-Detached House (GBP)Detached House (GBP)Flat/Apartment (GBP)
Solid wall insulation (external)12,7557757783991024647
Solid wall insulation (internal)81994177667769632440
Cavity wall insulation10,2495471551688092281
Loft insulation top-up235230235290256
Loft wall insulation315285300395-
Single glazing to post-2006 double glazing55444302499859642520
Pre-2006 double glazing to post-2006 double glazing55444302499859642520
Single glazing to triple glazing67915266612373063087
Pre-2002 double glazing to triple glazing67915266612373063087
Solid floor insulation99883707384860091491
Insulated door1680168016801680840
Airtightness4833696413
Source: [33].
Table A3. Change in demand (kWh/m2) per measure per house type (applicable to Passive Scenario).
BungalowTerraced HouseSemi-Detached HouseDetached HouseFlat/ApartmentU-Value (W/m2k2)
Solid wall insulation (external)−54−49−63−50−700.1
Solid wall insulation (internal)−46−41−54−42−420.1
Cavity wall insulation−40−23−36−39−510.1
Loft insulation top-up−7−4−4−4−90.1
Loft wall insulation−29−17−15−17−380.1
Solid floor insulation−31−26−27−22−260.1
Insulated door−8−8−7−4−50.8
Airtightness (air changes per hour)−9−7−8−6−70.6
Source: [73,75].
Table A4. Cost of retrofit per measure per house type (applicable to Passive Scenario).
Bungalow (GBP)Terraced House (GBP)Semi-Detached House (GBP)Detached House (GBP)Flat/Apartment (GBP)
Solid wall insulation (external)46,37236,35741,27358,91621,493
Solid wall insulation (internal)30,60523,99627,24038,88514,185
Cavity wall insulation12,525982011,14815,9145805
Loft insulation top-up1798141016002284833
Loft wall insulation2514201923913512-
Single to triple glazing67915266612373063087
Pre-2002 to triple glazing67915266612373063087
Solid floor insulation21,9738155846613,2213281
Insulated door1680168016801680840
Airtightness (air changes per hour)1218317315932
Source: [33,75,85].

References

  1. United Nations. Good Practices-For Energy-Efficient Housing in the UNECE Region; United Nations: New York, NY, USA; Geneva, Switzerland, 2013. [Google Scholar]
  2. House of Commons. Energy Efficiency: Building towards Net Zero-Twenty-First Report of Session 2017–19; House of Commons: London, UK, 2019.
  3. HM Government. Available online: https://www.gov.uk/guidance/standard-assessment-procedure (accessed on 20 September 2021).
  4. Committee on Climate Change. UK Housing: Fit for the Future? Committee on Climate Change: London, UK, 2019.
  5. HM Government. Available online: https://www.gov.uk/topic/government/devolution (accessed on 20 September 2021).
  6. HM Government. The Building Regulations 2010-Conservation of Fuel and Power: Approved Document L1B; HM Government: London, UK, 2016.
  7. Dowson, M.; Poole, A.; Harrison, D.; Susman, G. Domestic UK Retrofit Challenge: Barriers, Incentives and Current Performance leading into the Green Deal. Energy Policy 2012, 82, 3570–3581. [Google Scholar] [CrossRef] [Green Version]
  8. Lewis, O.J.; Ni Hogain, S.; Borghi, A. Cities of Tomorrow–Action Today. URBACT II Capitalisation. Building Energy Efficiency in European Cities; URBACT: Saint-Denis, France, 2013.
  9. Rosenow, J.; Guetier, P.; Sorrell, S.; Eyre, N. The remaining potential for energy savings in UK households. Energy Policy 2018, 121, 542–552. [Google Scholar] [CrossRef] [Green Version]
  10. Colclough, S.; Hegarty, R.O.; Murray, M.; Lennon, D.; Rieux, E.; Colclough, M.; Kinnane, O. Post Occupancy Evaluation of 12 Retrofit nZEB dwellings: The impact of high in-use temperatures on the predictive accuracy of the nZEB Energy Standard. Energy Build. 2022, 254, 111563. [Google Scholar] [CrossRef]
  11. Energiesprong. Available online: https://www.energiesprong.uk/projects (accessed on 5 November 2021).
  12. Committee on Climate Change. The Sixth Carbon Budget: The UK’s Path to Net Zero; Committee on Climate Change: London, UK, 2020.
  13. Department of Finance. Available online: http://www.buildingcontrol-ni.com/regulations/technical-booklets (accessed on 19 August 2021).
  14. Welsh Government. Available online: https://gov.wales/building-regulations-guidance-part-l-conservation-fuel-and-power (accessed on 28 October 2021).
  15. Scottish Government. Available online: https://www.gov.scot/publications/building-standards-technical-handbook-2020-domestic/ (accessed on 28 October 2021).
  16. Foaad, T.; Walker, I.; Rivers, W. Review of Carbon Savings from Residential Energy Efficiency; Element Energy Limited: Cambridge, UK, 2013. [Google Scholar]
  17. Committee on Climate Change. Reducing Emissions in Northern Ireland; Committee on Climate Change: London, UK, 2019.
  18. Northern Ireland Housing Executive. Northern Ireland House Condition Survey; Northern Ireland Housing Executive: Belfast, UK, 2016.
  19. Ministry of Housing, Communities & Local Government. English Housing Survey-Headline Report, 2016–2017; Ministry of Housing, Communities and Local Government: London, UK, 2018.
  20. Welsh Government. Welsh Housing Conditions Survey 2017–18: Energy Efficiency of Dwellings; Welsh Government: Cardiff, UK, 2019.
  21. Scottish Government. Available online: https://www.gov.scot/publications/energy-efficiency-standard-social-housing-eessh-scottish-government-guidance-social/ (accessed on 21 January 2020).
  22. Ministry of Housing, Communities & Local Government. Energy Performance of Buildings Certificates Statistical Release: Q2 2019: England and Wales; Ministry of Housing, Communities & Local Government: London, UK, 2019.
  23. Northern Ireland Housing Executive. Estimates of Fuel Poverty in Northern Ireland in 2017 and 2018; Northern Ireland Housing Executive: Belfast, UK, 2019.
  24. Hinson, S.; Bolton, P. Fuel Poverty; House of Commons Library: London, UK, 2021.
  25. Scottish Government. Fuel Poverty for Scotland 2018; The Scottish Government: Edinburgh, UK, 2018.
  26. Welsh Government. Tackling Fuel Poverty 2022 to 2035—A Plan to Support People Struggling to Meet the Cost of Their Domestic Energy Needs; The Welsh Government: Cardiff, UK, 2021.
  27. Department for Communities. A New Fuel Poverty Strategy for Northern Ireland; Department for Communities: Belfast, UK, 2011.
  28. Vorushylo, I.; Ogunrin, S.; Ghosh, R.; Brandoni, C.; Hewitt, N.J. Zero-In on NI-Heat; UKERC: London, UK, 2020. [Google Scholar]
  29. ARUP. Research into the Future of Energy Efficiency Policy in Northern Ireland; ARUP: Belfast, UK, 2020. [Google Scholar]
  30. Department for the Economy. The Path to Net Zero Energy; Department for the Economy: Belfast, UK, 2021.
  31. Department for Communities. Available online: https://www.communities-ni.gov.uk/consultations/achieving-affordable-warmth-consultation (accessed on 3 December 2021).
  32. National Energy Action. Every Home Should Be a Warm and Safe Place-Fuel Poverty Monitor 2021; National Energy Action (NEA): Newcastle upon Tyne, UK, 2021. [Google Scholar]
  33. Raslan, R.; Symonds, P.; Schwartz, Y. Analysis Work to Refine Fabric Energy Efficiency Assumptions for Use in Developing the Sixth Carbon Budget; University College London: London, UK, 2020. [Google Scholar]
  34. Northern Ireland Housing Executive. Cost to Improve Dwellings with SAP Rating F or G to SAP Rating E; Northern Ireland Housing Executive: Belfast, UK, 2019.
  35. Northern Ireland Housing Executive. Cost to Make Dwellings in Northern Ireland Energy Efficient; Northern Ireland Housing Executive: Belfast, UK, 2019.
  36. Northern Ireland Housing Executive. Cost of Carbon Savings in Northern Ireland’s Housing Stock; Northern Ireland Housing Executive: Belfast, UK, 2021.
  37. Department of Finance. Domestic Property Data; Department of Finance: Belfast, UK, 2020.
  38. Northern Ireland Housing Executive. Northern Ireland House Condition Survey 2006 Main Report; Northern Ireland Housing Executive: Belfast, UK, 2007.
  39. Northern Ireland Housing Executive. Northern Ireland House Condition Survey; Northern Ireland Housing Executive: Belfast, UK, 2013.
  40. Northern Ireland Housing Executive. External Wall Insulation Pilot Scheme; Northern Ireland Housing Executive: Belfast, UK, 2014.
  41. Department for the Economy. Energy in Northern Ireland 2020; Department for the Economy: Belfast, UK, 2020.
  42. Lingard, J. Residential Retrofit in the UK: The optimum retrofit measures necessary for effective heat pump use. Build. Serv. Eng. Res. Technol. 2020, 42, 279–292. [Google Scholar] [CrossRef]
  43. Energy Saving Trust. Available online: https://energysavingtrust.org.uk/why-outside-grid-does-not-mean-outside-help/ (accessed on 13 August 2021).
  44. Department for Business, Energy & Industrial Strategy. Available online: https://www.gov.uk/government/statistics/national-energy-efficiency-data-framework-need-impact-of-measures-data-tables-2019 (accessed on 4 February 2021).
  45. Ross, J. Cavity Wall Insulation Inspection Report; Northern Ireland Housing Executive: Belfast, UK, 2014.
  46. Centre for Sustainable Energy. Available online: https://www.cse.org.uk/advice/advice-and-support/damp-condensation (accessed on 4 November 2021).
  47. Centre for Sustainable Energy. Available online: https://www.cse.org.uk/resources/index/category:advice-leaflets (accessed on 13 August 2021).
  48. National Insulation Association. A Guide to Solid Wall Insulation; National Insulation Association: Bedfordshire, UK, 2015.
  49. Ceranic, B.; Markwell, G.; Dean, A. ‘Too many empty homes, too many homeless’-A novel design and procurement framework for transforming empty homes through sustainable solutions. Energy Proc. 2017, 111, 558–567. [Google Scholar] [CrossRef]
  50. Boyle, F. Homelessness Service User Journeys; Northern Ireland Housing Executive: Belfast, UK, 2021.
  51. Department of Finance and Personnel. Building Regulations (Northern Ireland) 2000 Amendment of Part F Conservation of Fuel and Power; Department of Finance: Belfast, UK, 2006.
  52. Housing Advice NI. Available online: https://www.housingadviceni.org/grants-financial-assistance/energy-efficiency (accessed on 18 August 2021).
  53. Northern Ireland Building Control. Available online: http://www.buildingcontrol-ni.com/regulations/historical-booklets (accessed on 23 July 2021).
  54. Ministry of Housing, Communities & Local Government. Available online: https://www.gov.uk/government/collections/approved-documents (accessed on 23 August 2021).
  55. Love, J.; Oreszczyn, T.; Lowe, R.; Elwell, C. ‘Hitting the target and missing the point’: Analysis of air permeability data for new UK dwellings and what it reveals about the testing procedure. Energy Build. 2017, 155, 88–97. [Google Scholar] [CrossRef]
  56. Northern Ireland Housing Executive. Northern Ireland House Condition Survey; Northern Ireland Housing Executive: Belfast, UK, 2008.
  57. McNally, Y. An Investigation into Energy Saving via Retrofit Compared to Replacement Housing. Ph.D. Thesis, Ulster University, Belfast, UK, 2014. [Google Scholar]
  58. Department for Business, Energy & Industrial Strategy. Available online: https://www.gov.uk/government/collections/total-final-energy-consumption-at-sub-national-level (accessed on 3 November 2021).
  59. Department for the Economy. Available online: https://www.economy-ni.gov.uk/consultations/consultation-policy-options-new-energy-strategy-northern-ireland (accessed on 4 August 2021).
  60. Northern Ireland Statistics and Research Agency. Available online: https://www.nisra.gov.uk/publications/northern-ireland-household-projections-2016-based (accessed on 3 December 2021).
  61. Northern Ireland Statistics and Research Agency. Available online: https://www.nisra.gov.uk/publications/2019-mid-year-population-estimates-northern-ireland (accessed on 3 December 2021).
  62. Gillich, A.; Saber, E.; Mohareb, E. Limits and uncertainty for energy efficiency in the UK housing stock. Energy Policy 2019, 113, 110889. [Google Scholar] [CrossRef]
  63. Antrim & Newtownabbey Borough Council. Local Development Plan 2030: Topic Paper 1: Housing Growth; Antrim and Newtownabbey Borough Council: Newtownabbey, UK, 2021.
  64. Environmental Change Institute. 40% House; Environmental Change Institute: Oxford, UK, 2006. [Google Scholar]
  65. Department of Energy & Climate Change. Available online: https://assets.publishing.service.gov.uk/government/uploads/system/uploads/attachment_data/file/587334/DECC_factsheet_11.11.16_LOFT_INSULATION_LOCKED.pdf (accessed on 16 August 2021).
  66. Element Energy. Development of Trajectories for Residential Heat Decarbonisation to Inform the Sixth Carbon Budget; Element Energy: Cambridge, UK, 2020. [Google Scholar]
  67. Department for Communities. Available online: https://www.communities-ni.gov.uk/topics/family-resources-survey#toc-1 (accessed on 18 August 2021).
  68. Walker, R.; Liddell, C.; McKenzie, P.; Morris, C.; Langdon, S. Fuel poverty in Northern Ireland: Humanising the plight of vulnerable households. Energy Res. Soc. Sci. 2014, 4, 89–99. [Google Scholar] [CrossRef]
  69. Historic England. Energy Efficiency and Historic Buildings; Historic England: Swindon, UK, 2016.
  70. Moran, F.; Blight, T.; Natarajan, S.; Shea, A. The use of Passive House Planning Package to reduce energy use and CO2 emissions in historic dwellings. Energy Build. 2014, 75, 216–227. [Google Scholar] [CrossRef]
  71. Piddington, J.; Nicol, S.; Garrett, H.; Custard, M. The Housing Stock of The United Kingdom; BRE Trust: Watford, UK, 2020. [Google Scholar]
  72. Energy Saving Trust. Available online: https://energysavingtrust.org.uk/home-insulation/roof-and-loft (accessed on 1 December 2021).
  73. Hines, J.; Godber, S.; Butcher, B.; Sidall, M.; Jennings, P.; Grant, N.; Clarke, A.; Mead, K.; Parsons, C. How to Build a PassivHaus: Rules of Thumb; PassivHaus Trust: London, UK, 2015. [Google Scholar]
  74. Department for Business, Energy & Industrial Strategy. DECC Domestic Retrofit Cost Assumptions Study v8; Department for Business, Energy & Industrial Strategy: London, UK, 2016.
  75. Committee on Climate Change. The Costs and Benefits of Tighter Standards for New Buildings; Currie & Brown: London, UK, 2019. [Google Scholar]
  76. Salem, R.; Bahadori-Jahromi, A.; Mylona, A.; Godfrey, P.; Cook, D. Retrofit of a UK Residential Property to achieve Nearly Zero Energy Building Standard. Adv. Environ. Res. 2018, 7, 13–28. [Google Scholar]
  77. Sweett Group. Retrofit for the Future: Analysis of Cost Data—For the Technology Strategy Board Final Report; Sweett Group: London, UK, 2014. [Google Scholar]
  78. Northern Ireland Statistics and Research Agency. Northern Ireland Quarterly Construction Bulletin; Northern Ireland Statistics and Research Agency: Belfast, UK, 2018.
  79. Northern Ireland Statistics and Research Agency. Employee Earnings in Northern Ireland; Northern Ireland Statistics and Research Agency: Belfast, UK, 2021.
  80. Organisation for Economic Co-Operation and Development. Average Hours Actually Worked per Worker; Organisation for Economic Co-Operation and Development: Paris, France, 2021. [Google Scholar]
  81. Northern Ireland Statistics and Research Agency. Northern Ireland Labour Market Report; Northern Ireland Statistics and Research Agency: Belfast, UK, 2021.
  82. NEA Northern Ireland. Available online: https://www.nea.org.uk/northernireland/northern-ireland-news-updates/130-percent-increase-winter-deaths-ni/ (accessed on 28 June 2020).
  83. World Health Organisation. WHO Housing and Health Guidelines; World Health Organisation: Geneva, Switzerland, 2018. [Google Scholar]
  84. Energy Technologies Institute. Smart Systems and Heat-Consumer Challenges for Low Carbon Heat; Energy Technologies Institute: Loughborough, UK, 2015. [Google Scholar]
  85. Baeli, M.; Pelsmakers, S. The Cost of Retrofitting to PassivHaus Standards-Three Case Studies of UK Pre-1919 Houses; Passive and Low Energy Architecture: Leuven, Belgium, 2011. [Google Scholar]
Figure 1. Diagrammatic description of this study’s methodology.
Energies 15 02985 g001
Figure 2. Heating fuel shares among houses requiring different retrofit measures.
Energies 15 02985 g002
Figure 3. Breakdown of house archetypes based on gas heating availability.
Energies 15 02985 g003
Figure 4. Uptake of measures across all scenarios by 2050.
Energies 15 02985 g004
Figure 5. Demand reductions across all scenarios.
Energies 15 02985 g005
Figure 6. Reductions in heat demand per measure across all scenarios compared with those of the 6CB NI Central Scenario.
Energies 15 02985 g006
Figure 7. Removal of emissions per measure across all scenarios compared with those of the 6CB NI Central Scenario.
Energies 15 02985 g007
Table 1. Breakdown of houses that require retrofitting based on total number of entire housing stock and total number of houses in fuel poverty.
General HousesFuel-Poor Houses
Wall Insulation
Full cavity wall insulation69%45%
Partial cavity wall insulation8%9%
External/internal solid wall insulation7%11%
No solid wall insulation8%15%
No cavity wall insulation9%19%
Number of houses with PCI retrofitted 2016–20180%-
Number of houses with no cavity wall insulation retrofitted 2016–20181%-
Loft Insulation
Greater than 150 mm loft insulation52%43%
100–150 mm loft insulation26%38%
Less than 100 mm insulation3%12%
Unknown thickness1%2%
No loft insulation1%3%
Unable to install loft insulation17%-
Number of lofts with less than 150 mm thickness topped up 2016–20188%-
Glazing *
Post-2006 double glazing26%
Pre-2006 double glazing61%
Partial double glazing9%
Single glazing3%
Solid Floor Insulation *
Insulated65%
Limited and no insulation22%
No insulation12%
Airtightness *
Potential for improved airtightness84%
No potential for improved airtightness16%
External Doors *
Potential for door insulation65%
No potential for door insulation35%
Note: * indicates where average energy efficiency levels have been assumed for the entire stock due to unavailability of data.
Table 2. Percentage reduction in demand due to different retrofit measures according to current building standards.
BungalowTerraced HouseSemi-Detached HouseDetached HouseFlat/ApartmentMean
Solid wall insulation (external)11%12%15%14%17%14%
Solid wall insulation (internal)9%10%13%12%15%12%
Cavity wall insulation8%6%9%11%6%8%
Loft insulation top-up3%3%2%2%4%3%
Loft insulation6%5%3%4%8%5%
Single to post-2006 double glazing5%5%5%7%5%5%
Pre-2006 to post-2006 double glazing2%2%2%3%3%2%
Single to triple glazing7%7%6%9%7%7%
Pre-2002 to triple glazing4%4%3%5%4%4%
Solid floor insulation8%8%8%8%8%8%
Insulated door2%2%2%2%2%2%
Airtightness (air changes per hour)2%2%2%2%2%2%
Source: [33,44].
Table 3. Comparison between standard thermal guidelines for retrofit and proposed ultra-high/passive house standards for new builds.
Current Building RegulationsPassive House Standards
MeasureU-Value (W/m2k2)MeasureU-Value (W/m2k2)
Full cavity wall insulation0.28Full cavity wall insulation0.1
Full external/internal solid wall insulation0.28Full external/internal solid wall insulation0.1
Roof/loft insulation0.16Roof/loft insulation0.1
Double glazing1.6Triple glazing0.8
Floor0.22Floor0.1
Door1.8Door0.8
Airtightness (air changes per hour)0.15Airtightness (air changes per hour)0.6
Source: [6,64].
Table 4. Comparison between current number of houses retrofitted per year in NI and the annual rate of retrofit (house/year) for each measure if all scenarios were evenly implemented between 2022 and 2050.
Current Number of Houses Retrofitted per Year in NI16,500
Retrofit MeasureAnnual Rate of Retrofit (House/Year) between 2022–2050
CentralHigh-LevelPassive
Solid wall insulation–external7301400
Solid wall insulation–internal330650
Cavity wall insulation4000
Loft insulation top-up6900
Loft insulation installation1200
Single glazing to post-2006 double glazing (triple glazing in high-level and passive scenarios)950
Pre-2006 double glazing to post-2006 double glazing (triple glazing in high-level and passive scenarios)410017,300
Insulated doors--17,300
Solid floor insulation23009350
Airtightness improvement22,900
Table 5. Retrofit cost breakdown for the Central Scenario.
Central Scenario MeasuresTotal Cost (GBP) of Retrofit for All House Types by 2050% of Total Retrofit CostTotal Number of All Houses Retrofitted by 2050Average Retrofit Cost (GBP) per House per MeasureAverage Number of All Houses Retrofitted per Year 2022–2050Cost (GBP) of All Houses Retrofitted per Year 2022–2050Number of Fuel-Poor Houses Retrofitted by 2030Cost (GBP) of Retrofit per Measure for Fuel-Poor House Types by 2030
Cavity wall insulation724,607,75235.4%114,2586342394024,986,39227,449174,076,489
Pre-2006 double glazing to post-2006 double glazing581,047,24228.4%118,4214907408320,036,12380,450394,739,456
Solid floor insulation298,641,34514.6%66,7174476230110,298,05345,466203,520,371
Solid wall insulation (external)157,255,5287.7%21,15274357295,422,683914067,951,384
Single to post-2006 double glazing133,731,1896.5%27,46848699474,611,478468422,805,326
Loft insulation (top-up)51,439,1502.5%200,77425678021,999,03250,35412,901,056
Solid wall insulation (internal)59,548,7472.9%967261573342,053,382650640,058,270
Improved airtightness30,514,8931.5%663,7394622,8881,052,238110,6565,087,305
Loft insulation (installation)11,647,7290.6%35,234331362119,70520,3076,713,187
Total2,048,433,576 70,579,087 927,852,844
Source: [33,72].
Table 6. Retrofit cost breakdown for the High-Level Scenario.
High-Level Scenario MeasuresTotal Cost (GBP) of Retrofit for All House Types by 2050% of Total Retrofit CostTotal Number of All Houses Retrofitted by 2050Average Retrofit Cost (GBP) per House per MeasureAverage Number of All Houses Retrofitted per Year 2022–2050Cost (GBP) of All Houses Retrofitted per Year 2022–2050Number of Fuel-Poor Houses Retrofitted by 2030Cost (GBP) of Retrofit per Measure for Fuel-Poor House Types by 2030
Cavity wall insulation724,607,75212.2%114,2586342394024,986,39227,449174,076,489
Pre-2006 double glazing to triple glazing3,138,337,45352.9%490,315640116,803107,552,70080,450514,934,832
Solid floor insulation1,213,484,61920.4%271,0934476934841,844,36045,466203,520,371
Solid wall insulation (external)486,600,8638.2%41,15311,824141916,779,4099140108,071,379
Single to triple glazing163,768,3802.8%27,46859629475,647,256468427,927,601
Loft insulation (top-up)51,439,1500.9%200,77425678021,999,03250,35412,901,056
Solid wall insulation (internal)115,858,3122.0%18,81861576493,995,094650640,058,270
Improved airtightness30,514,8930.5%663,7394622,8881,052,238110,6565,087,305
Loft insulation (installation)11,647,7290.2%35,234331362119,70520,3076,713,187
Total5,936,259,152 203,976,187 1,093,290,490
Source: [33,72].
Table 7. Retrofit cost breakdown for the Passive Scenario.
Passive Scenario MeasuresTotal Cost (GBP) of Retrofit for All House Types by 2050% of Total Retrofit CostTotal Number of All Houses Retrofitted by 2050Average Retrofit Cost (GBP) per House per MeasureAverage Number of All Houses Retrofitted per Year 2022–2050Cost (GBP) of All Houses Retrofitted per Year 2022–2050Number of Fuel-Poor Houses Retrofitted by 2030Cost (GBP) of Retrofit per Measure for Fuel-Poor House Types by 2030
Cavity wall insulation1,327,979,57712.4%114,25811,623394045,792,24927,449319,027,807
Pre-2006 double glazing to triple glazing2,948,271,83027.6%490,315601316,803101,039,03880,450483,749,081
Solid floor insulation2,767,155,00225.9%271,09310,207934895,419,28245,466464,095,220
Solid wall insulation (external)1,551,955,87714.5%41,15337,712141953,515,9389140344,680,875
Single to triple glazing163,768,3801.5%27,46859629475,647,256468427,927,601
Loft insulation (top-up)275,291,2722.6%200,7741371780210,698,39150,35469,043,677
Solid wall insulation (internal)643,501,1486.0%18,81834,19664922,189,5846506222,491,958
Improved airtightness76,221,7190.7%663,73911522,8882,628,336110,65612,707,341
Loft insulation (installation)134,564,8681.3%35,23438193621,382,94320,30777,556,679
Insulated doors811,499,5597.6%501,151161917,28127,982,72185,134137,855,560
Total10,700,209,233 366,295,737 1,840,107,992
Source: [33,72].
Table 8. Retrofit cost breakdown per house type per scenario.
ScenarioMeasureBungalow (GBP)Terraced House (GBP)Semi-Detached House (GBP)Detached House (GBP)Flat/Apartment (GBP)Mean
(GBP)
CentralCavity wall insulation941348534957797224605931
Pre-2006 double glazing to Post-2006 double glazing554443024998596425204666
Solid floor insulation894535833458464413544397
Solid wall insulation (external)10,52365906659739048657205
Single to post-2006 double glazing554443024998596425204666
Loft insulation (top-up)280230235290305268
Solid wall insulation (internal)877141787866674426576043
Improved airtightness463263591242
Loft insulation (installation)375285300395-271
Total cost for all measures49,44228,35533,53439,42316,69333,489
Average cost of retrofit per house type for all measures549431513726438018553721
High-LevelCavity wall insulation941348534957797224605931
Pre-2006 double glazing to triple glazing846352666123730630876049
Solid floor insulation894535833458464413544397
Solid wall insulation (external)20,3797735938617,003486511,874
Single to triple glazing679152666123730630875715
Loft insulation (top-up)280230235290305268
Solid wall insulation (internal)877141787866674426576043
Improved airtightness463263591242
Loft insulation (installation)375285300395-271
Total cost for all measures63,46531,42838,51151,72017,82740,590
Average cost of retrofit per house type705234924279574719814510
PassiveCavity wall insulation12,258945710,62916,037706311,089
Pre-2006 double glazing to triple glazing679152666123730630875715
Solid floor insulation21,0257456791911,199300710,121
Solid wall insulation (external)40,21533,11336,47752,01824,91037,347
Single to triple glazing679152666123730630875715
Loft insulation (top-up)1911139515164748841236
Solid wall insulation (internal)35,51026,58436,29642,34018,54431,855
Improved airtightness1147915814831106
External door insulation16801680168016808401512
Loft insulation (installation)2481201822629444-3241
Total cost for all measures123,77692,315109,182147,95261,453107,936
Average cost of retrofit per house type12,878923210,91814,795614510,794
BCIS new build cost258,30386,602134,640323,50698,952-
Note: Although the costs per square metre of measures are standard, houses from different age bands were considered for chosen archetypes. These archetypes have different geometric features such as floor areas and number of windows; consequently, the average costs of retrofit per house type are different.
Table 9. Percentage demand reduction per retrofitted house type.
BungalowTerraced HouseSemi-Detached HouseDetached HouseFlat/Apartment
Central Scenario−11%−11%−9%−8%−8%
High-Level Scenario−20%−19%−16%−17%−18%
Passive Scenario−44%−48%−38%−35%−39%
Publisher’s Note: MDPI stays neutral with regard to jurisdictional claims in published maps and institutional affiliations.

