Article

Research on Ecological Compensation Mechanism for Energy Economy Sustainable Based on Evolutionary Game Model

School of Economics and Management, Southeast University, Nanjing 211189, China
*
Author to whom correspondence should be addressed.
Energies 2022, 15(8), 2895; https://doi.org/10.3390/en15082895
Submission received: 12 February 2022 / Revised: 30 March 2022 / Accepted: 11 April 2022 / Published: 14 April 2022
(This article belongs to the Topic Building Energy and Environment)

Abstract

:
Energy and the environment are important foundations for sustainable economic development. In order to realize the sustainable development of energy economy, clarify the respective responsibilities of the government and enterprises, and explore the internal mechanism of ecological compensation, this paper constructs an evolutionary game model by means of social benefits, ecological compensation, supervision costs, government subsidies, enterprise punishment, enterprise additional income, enterprise emission reduction costs and other means, through the government’s supervision and non-supervision behavior, as well as the cooperation and non-cooperation behavior of enterprises, and analyzes the model parameters and game results. The research shows that: (1) due to the delay effect of technical progress of pollutant discharge, in the long run, the cost of enterprise emission reduction must be less than its benefits. (2) Social benefits brought by government regulation must exceed half of ecological compensation. (3) Government subsidy should not be higher than ecological compensation. Then, taking Inner Mongolia coal mine as an example, the field investigation is carried out from the three aspects of atmosphere, water, and soil, and the ecological environment loss of the mining area is preliminarily calculated based on the national technical specification for ecological environment assessment. Based on the above results, it shows that: (1) From the perspective of the government, social benefit must exceed USD 10.69 million annually; (2) from the perspective of enterprises, government subsidy should be lower than USD 21.38 million annually. In short, ecological compensation mechanism for coal resource development should include two parts: resource consumption reduction and environmental restoration; take the ecological compensation threshold as the standard, strictly eliminating declining enterprises, stimulating technological innovation, weakening the government subsidy, relying on non-governmental organizations to enlarge the social benefits brought by government supervision.

1. Introduction

Energy production and consumption can be regarded as “synchronous indicators” to measure the economic and social development of a country or region, which can accurately and directly reflect the economic operation [1,2,3]. There is a high correlation between energy consumption and economic growth [4,5,6]. According to the statistics of the International Energy Agency, China has always been in the forefront of the world in the field of energy production and consumption, which not only effectively promotes the development process of industrialization, urbanization, and modernization, but also plays an important role in improving people’s living standards. China’s latest energy statistical yearbook shows that coal resources are still dominant in the energy structure. From 2000 to 2020, although its proportion decreased from 68.5% to 56.8%, the total consumption is growing at a high speed. With the continuous increase of total energy consumption, China’s environmental quality is also facing severe challenges, and various environmental pollution problems occur frequently, which has attracted great attention [7,8]. Comprehensively promoting the construction of a safe and efficient energy system is not only a powerful starting point for China’s high-quality economic and social development in the new era, but also an important embodiment of coping with global climate change and fulfilling the responsibility of a big country [9,10]. Therefore, China should start with coal resources and urgently solve the contradiction between economic growth and ecological environment deterioration.
Coal resource mining is a complex system with diversified operation modes and information collection tools [11,12], which is compatible with economy, society, and environment, and provides power for social and economic development [13]. At the same time, it also brings some negative effects, which are closely intertwined. In addition, the current method is to control after it is polluted [14]. The instability of its management has greatly increased the loss process of ecological environment and resource exploitation, and the loss of ecological services and ecological compensation cost have also increased [15]. An effective ecological compensation mechanism must be established to fundamentally change the stage of environmental deterioration in the mining area and put the ecological environment management on the track of the virtuous circle. The negative impact of modern human activities on the natural environment is becoming more and more serious, resulting in the gradual decline of the ecological environment [16]. Therefore, restoring the ecological environment through various means and methods is the requirement of modern society [17]. In view of the deterioration of the ecological environment caused by the development of coal resources, the current common practice is to make necessary ecological compensation. The specific accounting methods are mainly reflected in the damaged value of the ecosystem, the damage of the residents in the mining area, and the cost of environmental governance in the mining area [18]. The development of mineral resources will cause serious damage to the ecosystem, so the damaged value of the ecosystem can be calculated as the compensation standard [19]. The loss of eco-environmental value caused by the development of mineral resources covers many aspects: for example, the loss of pollution load value is mainly calculated according to the pollution control cost of air, water, and solid waste in the mining area. The loss of land stress value mainly refers to the loss of opportunity cost caused by soil collapse in the mining area and the loss of nutrient elements such as nitrogen, phosphorus, and potassium caused by erosion. This paper will calculate ecological compensation based on the above methods.
Ecological compensation, mainly includes compensation scope, compensation subject, compensated subject, etc., [20]. Since the research core of this paper is to solve how to reduce the negative impact of coal energy production on the ecological environment, the following will focus on the compensation subject. As far as the government is concerned, on the one hand, it is the direct beneficiary of mineral resources development. On the other hand, a specific institution that can represent the regional public interest is needed to perform the duties of supervision and compensation. Therefore, the government is the responsible compensation subject [21,22]. As far as mining enterprises are concerned, they are not only the direct destroyer of the ecological environment, but also obtain huge profits from it. There is no doubt that they should bear the responsibility of compensation to ensure that the damaged ecological environment can be restored to the state before development [23,24]. So, in the process of ecological compensation, the problem is how to clarify the respective responsibilities of the government and enterprises, and how to grasp the strength of ecological compensation? How to formulate the elimination standards of enterprises that do not meet the requirements? Is there a restrictive relationship between different policies, such as government subsidies and ecological compensation? The solution of the above problems is very important to build a reasonable ecological compensation mechanism and promote a virtuous cycle of energy economy.
As ecological compensation involves many stakeholders, there is both competition and cooperation among various stakeholders, and the relationship is complex. How to clarify the responsibilities of various stakeholders is closely related to the final implementation effect of ecological compensation. Based on this, game theory has become the preferred tool for scholars. For example, Wei and Luo [25] study how local governments balance the sustainable development of local economy and the effective protection of water resources from an ecological perspective, and how to maximize the profits of local enterprises in the ecological compensation system. Xu and Yi [26] studied the corresponding proportional compensation between the upstream and downstream of the same basin and the feedback Nash equilibrium strategy of investment compensation from the different compensation modes between the government and enterprises. Shen and Gao [27] studies the decision-making behavior and influencing factors of ecological compensation in its basin, and believes that the increase of environmental tax rate has a significant impact on the decision-making behavior of local governments with low initial probability, and the improvement of supervision ability can promote local governments and polluting enterprises to reach a stable state faster.
It can be found from the literature summary that the research objects of ecological compensation mostly focus on water resources and the upstream and downstream of rivers, and less on the ecological compensation in the process of coal resource development. In addition, environmental pollution has a delay effect, and the existing literature mostly studies the problem from a static perspective, thus the dynamic balance of ecological compensation is often ignored. More importantly, there is little case on field research, and the combination of theory and practice is not really achieved. Most of the proposed schemes are general suggestions, which are not practical and targeted, so there are still some doubts about whether those problems can be really solved. Based on this, this paper explores the dynamic equilibrium point of ecological compensation by studying the dynamic game process between the government and coal resource enterprises, and puts forward targeted ecological compensation suggestions with the help of field research data, so as to provide important reference value for building a reasonable ecological compensation mechanism.

2. Materials and Methods

2.1. Establishment of Evolutionary Game Model

2.1.1. Participants and Strategy Selection

Evolutionary game model can explain why the group reaches the current state by analyzing the dynamic evolution process, and can ensure the equilibrium of evolutionary stability strategy. In order to deeply analyze strategic choice behavior, the participants of this model are the government and enterprises. The government refers to the complex of the central government and local governments, including the Environmental Protection Bureau, Environmental Protection Stations, and other institutions, which formulate and implement environmental protection policies and pollution discharge indicators, collect fines and grant subsidies through supervision. Enterprises refer to various industrial units that explore coal resources and produce various pollutants.
In economics, market failure determines the indispensable and important position of the government in environmental protection. There is a certain cost in supervision, but sometimes the government will relax supervision for pursuing economic growth. Therefore, the government has two strategies: regulation and non-regulation. The goal of enterprises is to maximize economic benefits, achieve emission indicators through technological progress, and obtain certain subsidies. If not, a fine will be imposed for ecological compensation. Therefore, enterprises also have two strategies: cooperation and non-cooperation.

2.1.2. Model Assumptions

Hypothesis 1 (H1).
In this model, the government and enterprises are the two subjects of the game, and there is no information asymmetry between them.
Hypothesis 2 (H2).
In this model, the government implements supervision to achieve environmental protection or it can only focus on economic growth and ignore supervision. In order to maximize benefits, enterprises may take cooperative or uncooperative action feedback.
Hypothesis 3 (H3).
If the probability of government regulation is x, the probability of non-regulation is 1-x. If the probability of enterprises cooperating with government supervision is y, the probability of non-cooperating is 1-y. The values of x and y are between 0 and 1.
Hypothesis 4 (H4).
The government’s supervision cost is C, and the social benefit is B, but it is -B when the supervision does not work. The government collects fines P from enterprises for ecological compensation.
Hypothesis 5 (H5).
Under the condition of government supervision, if the enterprise cooperates with the government to implement environmental protection, it will receive subsidy R. The cost of reducing pollutant discharge by introducing advanced equipment is D, and the sum of production cost saved by adopting pollutant discharge technology and additional benefits brought by good reputation is S. If the enterprise does not take environmental protection measures, it will be imposed a fine P for ecological compensation.
According to the above assumptions, the following game matrix is obtained, as shown in Table 1.

2.1.3. Model Derivation

According to the model hypothesis and game matrix, the replication dynamic equations of the government and enterprises can be obtained respectively.
(1) Expectation and replication dynamic equation under different strategies adopted by the government
Expectation of the government under the regulation:
U G 1 = y ( B C ) + ( 1 y ) ( P B C ) = 2 B y P y B C
Expectation of the government under the non-regulation:
U G 2 = y × 0 + ( 1 y ) × 0 = 0
Average expectation of the government:
U G ¯ = x U G 1 + ( 1 x ) U G 2
The replication dynamic equation of the government:
F ( x ) = d x d t = x ( U G 1 U G ¯ ) = x ( 1 x ) ( U G 1 U G 2 ) = x ( 1 x ) ( 2 B y P y B C )
(2) Expectation and replication dynamic equation under different strategies adopted by enterprises
Expectation of enterprises under the cooperation:
U E 1 = x ( R + S D ) + ( 1 x ) ( S D ) = R x + S D
Expectation of enterprises under the non-cooperation:
U E 2 = x × ( P ) + ( 1 x ) × 0 = P x
Average expectation of enterprises:
U E ¯ = y U E 1 + ( 1 y ) U E 2
The replication dynamic equation of enterprises:
F ( y ) = d y d t = y ( U E 1 U E ¯ ) = y ( 1 y ) ( U E 1 U E 2 ) = y ( 1 y ) ( R x P x + S D )
By combining Equations (4) and (8), the replicated dynamic equations of the government and enterprises can be obtained:
F ( y ) = y ( 1 y ) ( R x P x + S D ) F ( x ) = x ( 1 x ) ( 2 B y P y B C )

2.2. Accounting Method of Ecological Compensation (P)

Based on the field investigation of manlailiang coal mine in Inner Mongolia, its type mainly is coking coal, with low ash content, medium sulfur content and medium selectivity. The total area of the mining area is about 19 square kilometers, and the vertical and horizontal changes of coal seams and coal quality are obvious, and the metamorphic degree is gradually deepened from top to bottom in the vertical zoning. From the perspective of feasibility, the ecological compensation of the mining area mainly involves several aspects such as atmosphere, water, and soil.

2.2.1. Layout of Monitoring/Sampling Points

Monitoring and sampling points mainly includes atmosphere, surface water, groundwater, soil and so on. In this paper, geographic information system (GIS) is used to mark each sampling point, as shown in Figure 1 below.
Atmosphere: Two atmospheric environment monitoring points are set up around the industrial square in the mining area.
Surface water: According to the distribution of the water system in the study area and the discharge of coal mine wastewater, the water quality of the collapsed water area and the impact of coal mine wastewater are studied [28]. A monitoring section is set up before the outlet of the collapsed area that receives wastewater enters the outer river, in the collapsed area after the water outlet entered the outer river. One cross-section was set up at 500 m in the upstream and downstream of the river channel to monitor the water quality of the subsidence area, and the upstream monitoring point data were used for comparison [29].
Groundwater: Samples of shallow groundwater in the coal mine field were taken for monitoring. In the industrial square, waste rock hill, and nearby villages, one civil water well was selected for sampling, making a total of three sampling points.
Soil: One soil sampling point was set up at the bottom of the gangue dump and nearby villages to analyze the heavy metal content of the soil, making a total of two sampling points; along the time sequence of the surface subsidence of coal mining, soil samples were taken at the edge of the subsidence area to analyze the soil. In terms of physical properties, a total of 11 sampling points were set; in addition, another 38 monitoring sampling points were set up in other farmlands within the boundary of the minefield to analyze the content of heavy metals in the soil. There were a total of 51 sampling points in the soil.

2.2.2. Test Items and Methods

Atmosphere: According to the “Ambient Air Quality Standards” and the characteristics of mine waste discharge, the monitoring items of the ambient air current situation in the industrial square and its vicinity are determined as SO2 daily average concentration and SO2 hourly average concentration. Air samples were collected in the industrial square and its vicinity for seven consecutive days, from 23–29 July 2020. The time is in accordance with the time specified in the “Ambient Air Quality Standard”.
Soil: Bulk density can reflect the degree of soil tightness and is the most important indicator of soil subsidence and deformation. Therefore, physical properties mainly analyze soil bulk density and water content, and heavy metals mainly analyze six types of Cd, Cr, Pb, As, Cu, and Zn. Sampling was carried out in three times, one on 1 August 2020, a small amount of comprehensive monitoring, one sample for each type, a total of 3 points; the second time was conducted on 24 April 2020, focusing on sampling and analyzing the physical properties of the soil. A total of 11 points were set up along the direction of mining subsidence; the third time was conducted on 7 August 2020, focusing on the analysis of heavy metal content, and 51 points were relatively evenly distributed within the mining area.
Surface and Groundwater: The monitoring element refers to the “Surface Water Quality Standard” (GB3838-2002), which combines the characteristics of coal mine wastewater with known pollution factors in surface water bodies, as well as confirmed test factors, including the output of domestic sewage and the concentration of BOD5, COD, NH3-N, sampling for two consecutive days, mixed sampling once a day.

2.2.3. Test Instrument Selection

Main instruments: multi-parameter water quality analyzer (Pro2030, the United States), X-diffraction fluorescence spectrometer (BRUKER S1 TURBOSD, Karlsruhe, Germany), multi-function noise tester (AR.27-628 series, China), soil profile moisture rapid tester (IMKO-PICO-BT, Ettlingen, Germany), and so on.

2.2.4. Design of Ecological Compensation of Coal Resources Mining

Generally speaking, compensation must be paid first, and the degree of damage is the calculation assumption of the environmental compensation standard (Sergeev et al., 2017). Ecological destroyers must make up for the losses caused by the destruction of the ecological environment. The ecological compensation standard in the proposal is to compensate the losses caused by ecological damage and environmental pollution. According to the technical specifications for ecological environment assessment issued by China in 2015, the value of ecological environment loss of atmosphere, water, and soil is estimated.
Ecological compensation P:
P = E C a i r + E C w a t e r + E C s o i l
Air pollution loss:
E C a i r = ( A i × d i )
In the Equation (11), Ai represents the total amount of air pollution in type i and di represents the unit treatment cost of the corresponding pollution type.
Water pollution loss:
E C w a t e r = ( W i × c i ) + W i × m
In the Equation (12), Wi represents the total amount of water pollution in type i and ci represents the unit treatment cost of the corresponding pollution type; m represents the market price of water resources transaction.
Soil value loss:
E C s o i l = θ × O / ( 10 4 × r × h )
In the Equation (13), θ represents the total amount of soil conservation and O represents opportunity cost per unit soil area; r represents soil bulk density and h represents soil depth.

3. Results

3.1. Equilibrium Points and Strategy Selection of Evolutionary Game Model

If Equation (9) is 0, five equilibrium points can be obtained, that are (0, 0), (0, 1), (1, 0), (1, 1), (x*, y*). By calculating the partial derivatives of x and y respectively, the corresponding Jacobean matrix can be obtained, and further different stability strategy points can be chosen.
det A = ( 1 2 x ) ( 2 B y P y B C ) x ( 1 x ) ( 2 B P ) ( R P ) y ( 1 y ) ( 1 2 y ) ( R x P x + S D )
By substituting the five equilibrium points into Equation (10) and combining their positive and negative characteristics, the following results can be obtained, as shown in the Table 2.

3.2. Calculation of Ecological Compensation for Coal Resource Development

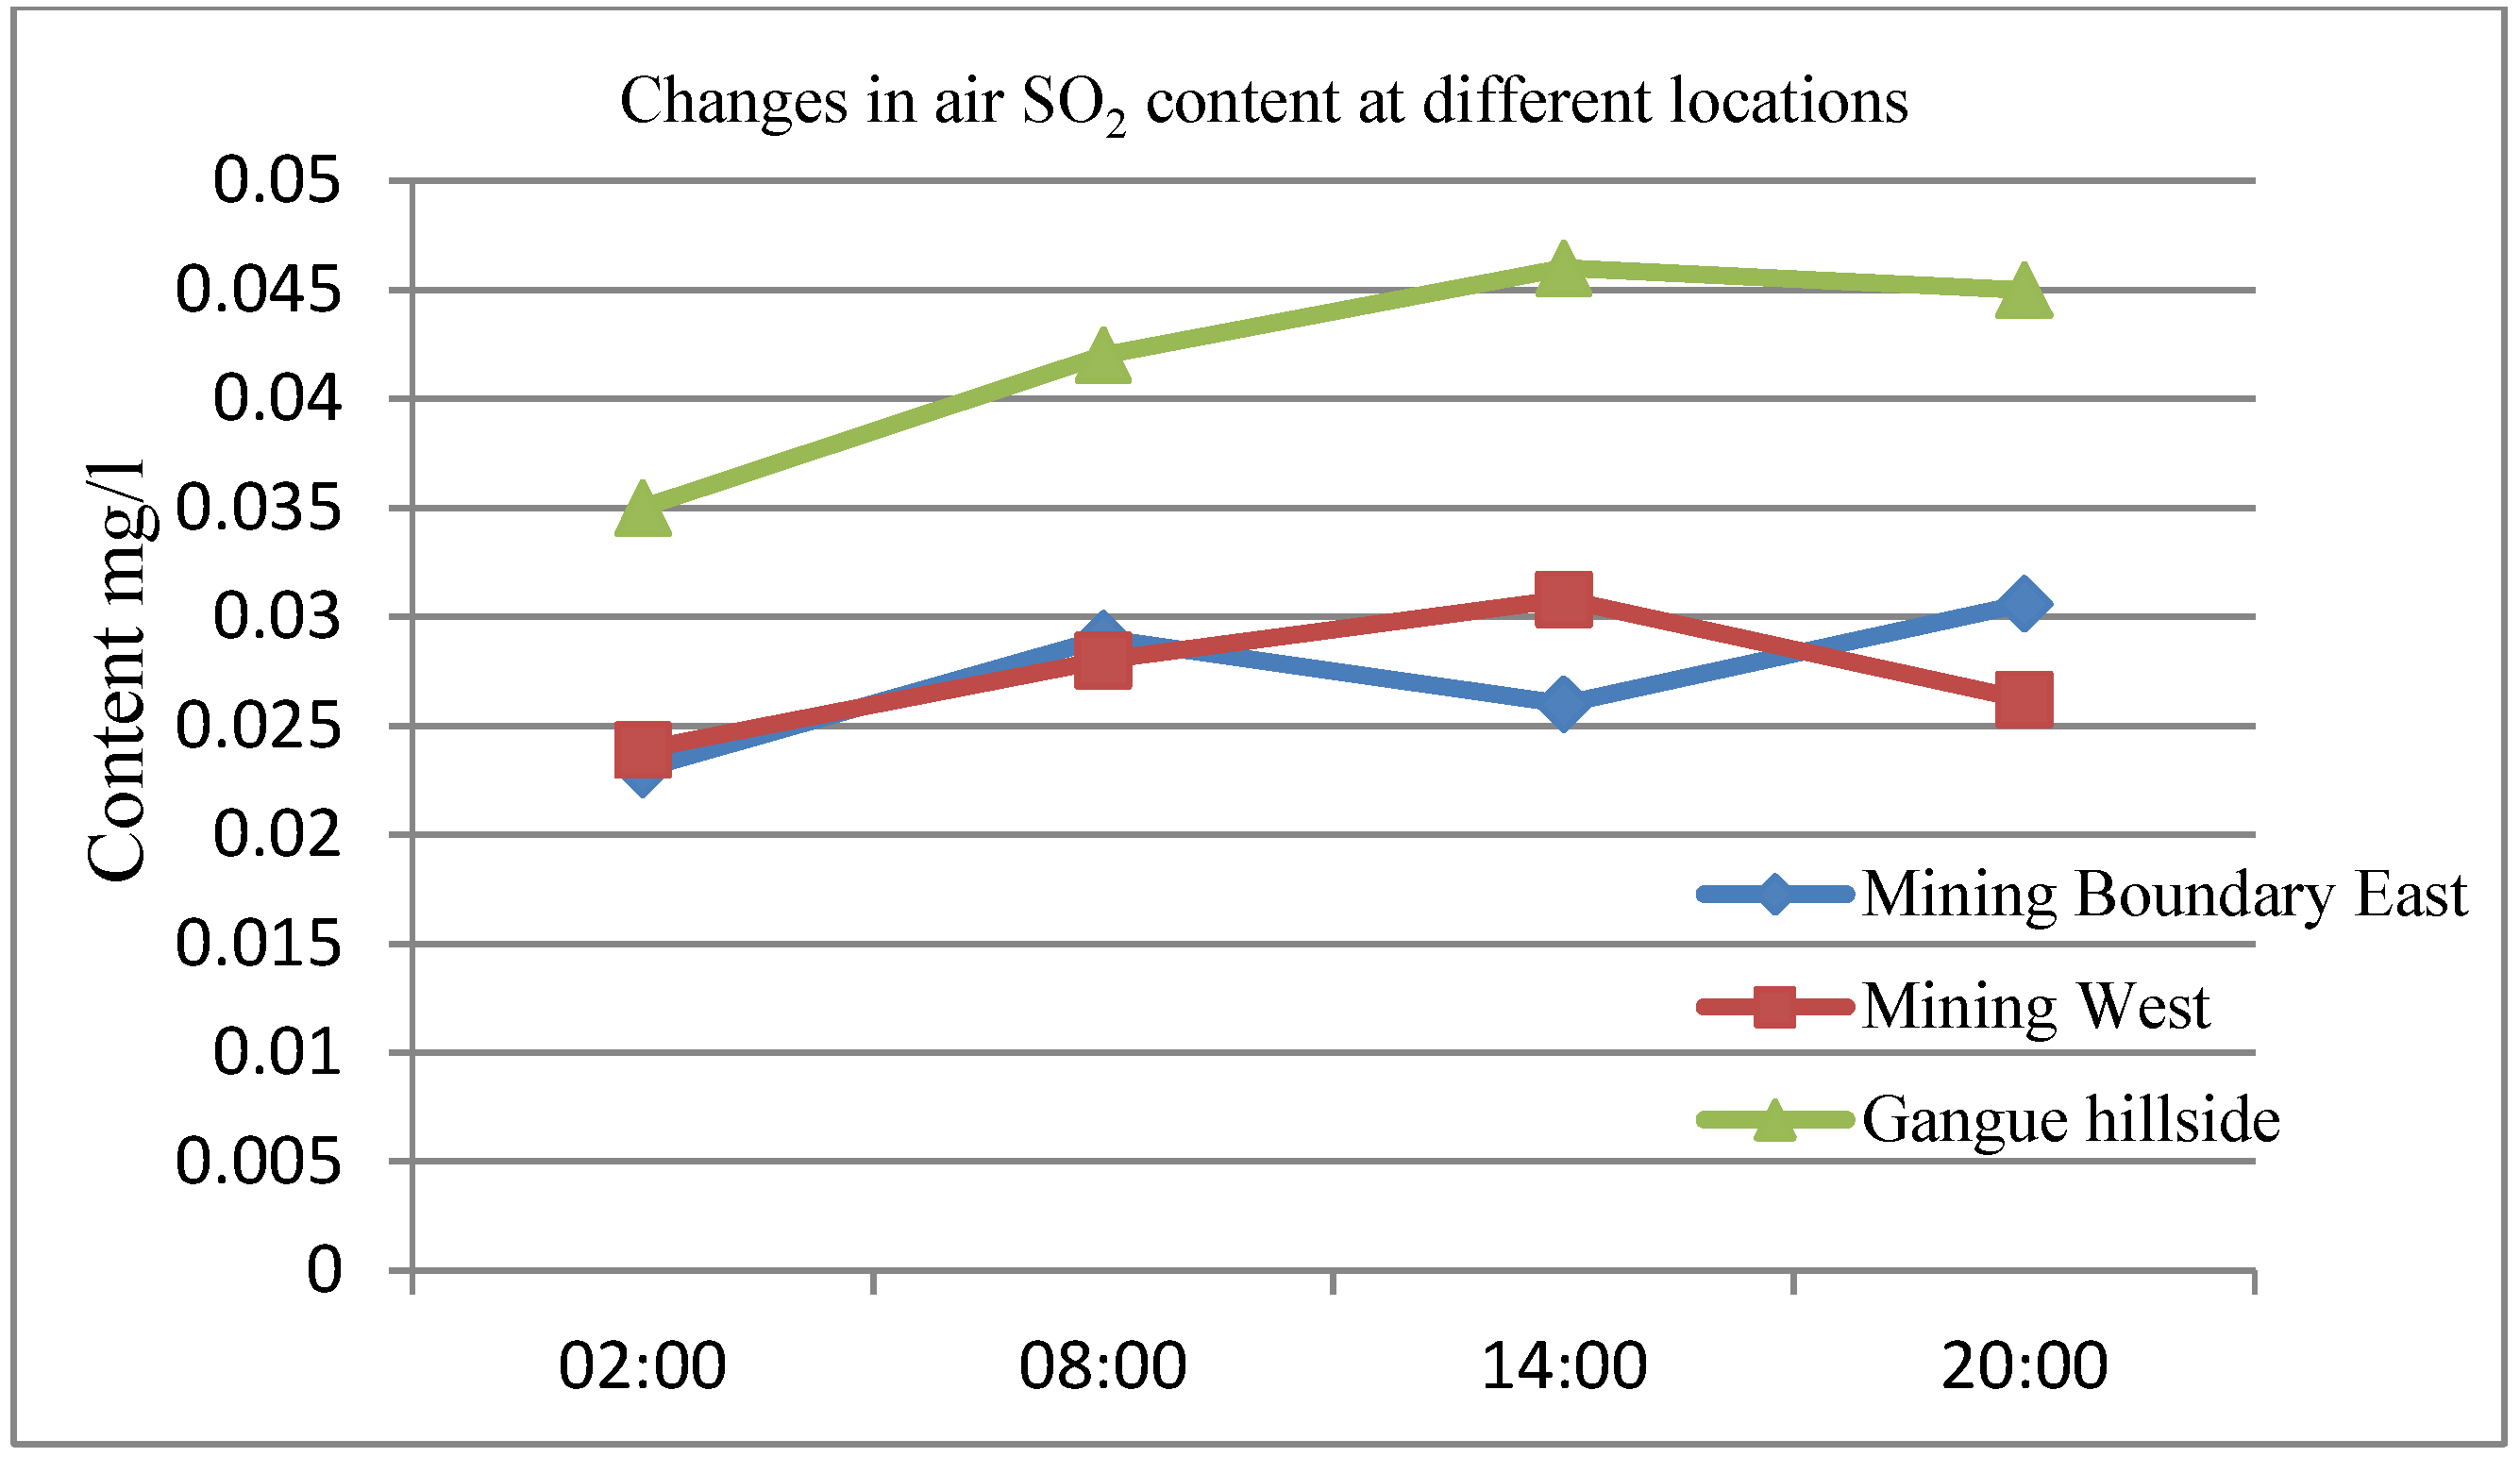
3.2.1. The Impact of Coal Resource Development on the Atmospheric Environment

SO2 is monitored four times a day, and the statistical results are shown in Table 3. Due to the influence of temperature and airflow, the overall change of SO2 in a day shows an increasing trend during the day and decreasing trend at night, as shown in Figure 2. The content of gangue hillside is significantly higher than that outside the mine boundary. Although it does not reach the level of pollution, it already had an impact on the environment. To simplify the calculation, the average value of concentration change is 0.01 mg/L, and the air sampling depth is 1.5 m, and the treatment cost of sulfur dioxide per kilogram is USD 0.19. Therefore, air pollution loss is USD 0.21 million annually.

3.2.2. The Impact of Coal Resource Development on the Soil and Surface Subsidence

Soil bulk density is an index that reflects the degree of soil tightness and indirectly expresses soil porosity, which is the main physical property affected by coal mining. The soil moisture content comprehensively reflects the physical properties of the soil. Therefore, 11 sampling points were set up along the edge of the collapsed basin to determine the soil moisture content and bulk density. The average water content of the monitoring points is 10.12%, and the average soil bulk density is 1.16 g/cm3.
Figure 3 shows the change in bulk density of each point the sampling points were in the order of coal mining collapse, with the first collapse in the middle near the industrial square, and the shorter the collapse time toward the north and south. It can be seen from the figure that the longer the time collapses, the lower the soil water content at the edge of the collapsed basin, and the soil bulk density tends to increase. It shows that the impact of coal mining subsidence on the physical properties of soil is mainly reflected in the fact that the soil at the edge of the basin tends to be compact, and the soil moisture content decreases, and it tends to be significant over time.
MSPS mining subsidence prediction software is used to predict the evolution process of the surface subsidence of coal mine A, and the surface subsidence area statistics are shown in Table 4. The results show that the mining process of coal resources produces a small amount of disturbance to various environmental factors, but nonetheless, both are within the national control standards. The main influence is the slight influence of pH value and f tunnel water on the surface water. The spontaneous combustion of coal gangue SO2 and silicified ore has little influence on the surrounding atmosphere; the noise near the wind farm has little influence; the minor influence on the surrounding soil and farmland is flying Pb field ash; surface subsidence leads to an increase in soil volume and a decrease in water content. The biggest problem with the impact of coal mining on the ecological environment is that the mountain crust causes a change in the shape of the ground, which greatly increases the pit surface and reduces the arable land.
According to the statistical bulletin of national economic and social development, the output value of grass per square kilometers is USD 0.15 million. The annual soil conservation is 65,000 tons, and the average soil bulk density is 1.2 t/m3. Therefore, soil value loss is USD 0.53 million annually.

3.2.3. The Impact of Coal Resource Development on the Water

The output of domestic sewage in coal mine is 717 m3/d, and the main pollutants are BOD5, COD, NH3-N, etc., whose discharge concentrations are 80 mg/L, 20 mg/L, and 150 mg/L respectively. The price of industrial water is 0.65 USD/m3, and the charging standard for sewage discharge is USD 0.11 per pollution equivalent. Therefore, water pollution loss is USD 0.36 million annually. Therefore, the total ecological environment loss is about USD 1.09 million annually.
In order to eliminate the impact of COVID-19 on the price of coking coal, this paper takes the average market price of USD 188.6 per ton in 2015–2020 years. The annual coal output of Inner Mongolia is about 1 million 200 thousand tons, and the coal resource tax rate is 9%, so the mining area needs to pay USD 20.28 million per year. Coupled with the loss of ecological value, it can be concluded that the total cost of ecological compensation is about USD 21.38 million per year.

4. Discussion

4.1. Analysis of Parameters and Results in Evolutionary Game Model

4.1.1. Analysis of Parameters

(1) Social benefit B must exceed half of ecological compensation P.
For the government, if y = (B + C)/(2B − P), F(x) is 0, which is means the model is always in a stable state. Otherwise, there are two stable points x = 0 and 1. Since y is greater than 0 and less than 1, B is greater than C + P, whose economic significance is that the social benefits of government supervision must be greater than the sum of supervision cost and ecological compensation. At the same time, since B + C is greater than zero, B must be greater than half of P, that is, the social benefits of government supervision must exceed half of ecological compensation. If the cost of government regulation is higher than social benefits, the government tends not to regulate in the long-term game.
(2) Considering the delayed effect of technological progress of pollutant discharge, in the long run, the cost D of reducing pollutant discharge must be less than the additional benefit S.
For enterprises, if x = (D − S)/(R − P), F(y) is 0, which means the model is always in a stable state. Otherwise, there are two stable points y = 0 and 1. Since x is greater than 0 and less than 1, R + S are greater than D + P, whose economic significance is that the sum of government subsidies and additional benefits brought by the cooperation of enterprises must be greater than the sewage cost and ecological compensation.
(3) Government subsidy R should not be higher than ecological compensation P.
Generally, S is greater than D, so P must be greater than R, that is, ecological compensation should be greater than government subsidies to enterprises. If the emission cost and punishment of enterprises are greater than government subsidies and cooperation benefits, enterprises tend to implement non-cooperation strategies in the long-term game.

4.1.2. Analysis of Evolutionary Game Results

Based on the results in Table 2, the game evolution trajectory of government and enterprises can be obtained, as shown in Figure 4.
Figure 4 shows the evolution direction of the game when the initial state falls in different regions. When it is in region③, the game converges to (0, 0), which is non-regulation and non-cooperation. When it is in region①, the game converges to (1, 1), which is regulation and cooperation. When it is in region②, the game converges to (1, 0), which is regulation and non-cooperation. When it is in region④, the game converges to (0, 1), which is non-regulation and cooperation.
The initial state of the game determines the final convergence result. Therefore, in order to achieve the optimal regulation and cooperation state, it is bound to expand the probability that the initial state falls in region 1, that is, the smaller the value of x* or y*, the better. That is: (1) regulatory cost C↓, ecological compensation P↓, social benefit B↑; (2) government subsidy R↑, enterprise additional income S↑, enterprise sewage improvement cost D↓, ecological compensation or fine P↓. In short, from the perspective of the government, its regulatory cost C and ecological compensation P should be reduced as much as possible, and the social benefit B should be expanded at the same time. From the perspective of enterprises, government subsidy R and additional income s can stimulate enterprises to promote emission reduction technology, so as to reduce emission reduction cost D and avoid punishment P.

4.2. Equilibrium Results of Game Model in Specific Cases

Based on the above calculation results, the total cost of ecological compensation is about USD 21.38 million per year in manlailiang coal mine of Inner Mongolia. Combined with the parameter analysis of evolutionary game model, social benefit B must exceed USD 10.69 million annually and government subsidy R should be lower than USD 21.38 million annually.

5. Conclusions

The ecological compensation mechanism in the process of coal resources development should include both compensation for resource consumption and compensation for ecological environment damage.

5.1. Ecological Compensation Types

5.1.1. Resource Depletion Compensation Mechanism

At present, the mining compensation of coal resources is mainly realized through the resource tax system, which has the nature of development compensation to adjust the differential income of developers, and promote the price of resource market to be reasonable. To improve the compensation mechanism for resource consumption, it needs to start from the following aspects. First, a flexible and appropriate tax rate market mechanism should be established. To improve the flexibility of oil and gas resource tax rate, it should not only have a long-term and stable resource tax rate system, but also make dynamic adjustment to determine the short-term optimal tax rate and optimal development volume. Second, it needs to optimize the collection method of special coal tax, carry out classified collection, guide sustainable development, and improve utilization efficiency. Third, it must locate the resource tax to compensate the consumption cost of contemporary resources, establish the coal resource depletion compensation fund system according to local conditions, reasonably allocate the extraction proportion of resource tax, and achieve the purpose of earmarking.

5.1.2. Environmental Restoration Compensation Mechanism

First, an ecological environment deposit system should be established. For the possible environmental pollution risks caused by coal resource development and utilization enterprises, a certain compensation deposit should be charged, assessed according to the production and environmental maintenance of the enterprise, and then deducted or returned according to the actual situation. Second, the source of ecological compensation can be provided through transfer payment. The government has the identity of both coal resource owner and social manager. It needs to promote production through supervision and publicity, and maintain the environment and ecology through compensation and restoration. Third, in order to avoid occupying a large amount of exploration land without investment, the marketization of mining rights should be implemented, that is, responsible and powerful mining enterprises should be introduced through bidding, auction, and other forms.

5.2. Ecological Compensation Threshold

5.2.1. Strictly Implement the Elimination Mechanism of Declining Industries

The backward technology of emission reduction in China’s coal industry is still serious: the overall technical level is low and the production equipment is backward; the waste of coal resources is serious and the recovery rate is low; the insufficient washing rate of raw coal is also a prominent problem. While eliminating backward production capacity, enterprise should pay more attention to the development and application of high and new technology. Through fiscal and tax support, capital and project support and other policy guidance methods, the government will guide the declining industries to gradually withdraw from the existing leading industrial structure layout, so as to promote the optimal allocation of production factors. This mechanism is conducive to solving the problems of shrinking main business scale, insufficient operation, and decline in equipment utilization and so on.

5.2.2. Promote Technological Innovation Compensation Mechanism

The government should encourage enterprises to increase scientific research funds, ensure technological innovation in emission reduction, accelerate the transformation of enterprise achievements, promote new technologies and products, and improve the emission reduction efficiency of enterprises. Establishing a pollutant emission trading market as soon as possible so that “emissions” and “emission rights” can flow in the market and have the characteristics of commodities to some extent. Enterprises can reduce emissions and then sell the remaining emissions to the market to obtain additional economic benefits; this kind of transaction belongs to the flow and exchange of special commodities, so the emissions must flow to enterprises with high production capacity and economic efficiency, so as to achieve the purpose of better allocation of environmental resources.

5.2.3. Weaken the Government Subsidy Mechanism and Strengthen the Initiative of Enterprise for Ecological Compensation

Ecological compensation should be based on the technological innovation of enterprise emission reduction. On this basis, the government should give enterprises certain technical subsidies through administrative means, but the proportion of subsidies should not be too high. It is necessary to introduce more market mechanisms and guide public opinion to stimulate the enthusiasm of enterprises for ecological compensation by improving the brand value of enterprises and expanding product sales.

5.2.4. Rely on Non-Governmental Organizations to Enlarge the Social Benefits Brought by Government Regulation

Healthy Nongovernmental Organizations are an international trend to improve environmental compensation and environmental protection. According to Arrow’s Impossibility Theorem, it is difficult to reach many people who have suffered environmental damage, and it is difficult to take coordinated actions. Therefore, from the perspective of environmental victims, there are problems and difficulties in limiting environmental degradation and compensating for the environment. These environmental groups have broad, diverse, and complete social components, representing the collective interests of many different environments and pollution, and focusing on environmental degradation and environmental control measures. They can combine small-scale and insignificant forces to form a powerful and comprehensive ecological balance and environmental protection force in order to effectively deal with ecological and environmental pollution at the social level. This is the way our country should try and use coal production.

Author Contributions

Conceptualization, Y.Q. and W.W.; methodology, Y.Q.; software, Y.Q.; validation, Y.Q.; formal analysis, Y.Q. and W.W.; investigation, Y.Q.; resources, Y.Q.; data curation, Y.Q.; writing—original draft preparation, Y.Q.; writing—review and editing, Y.Q. and W.W.; visualization, Y.Q.; supervision, W.W.; project administration, W.W.; funding acquisition, W.W. All authors have read and agreed to the published version of manuscript.

Funding

This research was funded by Chinese National Social Sciences Fund (Major Research Plan 12&ZD207); Chinese National Natural Sciences Fund (71973023); Later support of Chinese National Social Science Fund (19FGLB010); Major Program of Jiangsu Social Science Foundation in China (19GLA003).

Institutional Review Board Statement

Not applicable.

Informed Consent Statement

Not applicable.

Data Availability Statement

All data, models generated or used during the study appear in the submitted article.

Conflicts of Interest

The authors declare that they have no competing interest.

References

  1. Acheampong, A.O.; Boateng, E.; Amponsah, M. Revisiting the economic growth–energy consumption nexus: Does globalization matter? Energy Econ. 2021, 102, 105472. [Google Scholar] [CrossRef]
  2. Kan, S.; Chen, B.; Chen, G. Worldwide energy use across global supply chains: Decoupled from economic growth? Appl. Energy 2019, 250, 1235–1245. [Google Scholar] [CrossRef]
  3. Sekerin, V.; Dudin, M.; Gorokhova, A.; Bank, S.; Bank, O. Mineral resources and national economic security: Current features. Min. Miner. Depos. 2019, 13, 72–79. [Google Scholar] [CrossRef]
  4. Xie, F.; Liu, C.; Chen, H.; Wang, N. Threshold Effects of New Energy Consumption Transformation on Economic Growth. Sustainability 2018, 10, 4124. [Google Scholar] [CrossRef] [Green Version]
  5. Chontanawat, J. Dynamic Modelling of Causal Relationship between Energy Consumption, CO2 Emission, and Economic Growth in SE Asian Countries. Energies 2020, 13, 6664. [Google Scholar] [CrossRef]
  6. Niu, S.; Zhang, X.; Zhao, C.; Niu, Y. Variations in energy consumption and survival status between rural and urban households: A case study of the Western Loess Plateau, China. Energy Policy 2012, 49, 515–527. [Google Scholar] [CrossRef]
  7. Li, X.Q.; Hu, Z.Y. Interaction between economic growth energy consumption and environmental pollution. Int. J. Environ. Pollut. 2020, 68, 162–177. [Google Scholar] [CrossRef]
  8. Han, X.; Sun, T.; Feng, Q. Study on environmental pollution loss measurement model of energy consumption emits and its application in industrial parks. Sci. Total Environ. 2019, 668, 1259–1266. [Google Scholar] [CrossRef]
  9. Kang, H.; Wang, G.; Wang, S. High-Quality Development of China’s Coal Industry. Eng. Sci. 2021, 23, 130–138. [Google Scholar] [CrossRef]
  10. He, J.; Fu, C.; Long, Y. Promoting the High-Quality Development of Central China through Energy Revolution: Theoretic Analysis and Implementation Paths. Chin. J. Eng. Sci. 2021, 23, 60–67. [Google Scholar] [CrossRef]
  11. Falshtynskyi, V.S.; Dychkovskyi, R.O.; Saik, P.B.; Lozynskyi, V.H.; Cabana, E.C. Formation of thermal fields by the energy-chemical complex of coal gasification. Nauk. Visnyk Natsionalnoho Hirnychoho Universytetu 2017, 5, 36–42. [Google Scholar]
  12. Skrypnyk, O.; Shapar, A.; Taranenko, O. Determining local wetness conditions within the mined lands using GIS. Min. Miner. Depos. 2020, 14, 53–58. [Google Scholar] [CrossRef]
  13. Cooper, G.; Cowan, D. Terracing Potential Field Data; ASEG Extended Abstracts; ASEG: Crows Nest, Australia, 2009. [Google Scholar]
  14. Guo, X.; Niu, D.; Xiao, B. Assessment of Air-Pollution Control Policy’s Impact on China’s PV Power: A System Dynamics Analysis. Energies 2016, 9, 336. [Google Scholar] [CrossRef] [Green Version]
  15. Song, W.; Deng, X. Effects of Urbanization-Induced Cultivated Land Loss on Ecosystem Services in the North China Plain. Energies 2015, 8, 5678–5693. [Google Scholar] [CrossRef]
  16. Lee, M.; Morris, W.; Leblanc, G.; Harris, J. Curvature analysis to differentiate magnetic sources for geologic mapping. Geophys. Prospect. 2012, 61, 572–585. [Google Scholar] [CrossRef]
  17. Li, X. Curvature of a geometric surface and curvature of gravity and magnetic anomalies. Geophysics 2015, 80, G15–G26. [Google Scholar] [CrossRef]
  18. Chang, Z.; Qiao, J.; Zhao, J.; Dong, Z.; Wang, J. Review on the key issues of basis and criteria of ecological compensation in China. Ecol. Sci. 2020, 39, 248–255. [Google Scholar]
  19. Li, S.; Wang, J.; Zhang, Z. Ecological compensation for mineral resources exploitation: A review. Chin. J. Ecol. 2019, 38, 1551–1559. [Google Scholar]
  20. Dong, Q.; Liu, X.Z. The Legal Norms of Ecological Compensation in Coastal Cities under Regional Cooperation. J. Coast. Res. 2020, 8, 552–555. [Google Scholar] [CrossRef]
  21. Gao, X.; Shen, J.; He, W.; Sun, F.; Zhang, Z.; Zhang, X.; Yuan, L.; An, M. Multilevel Governments’ Decision-Making Process and Its Influencing Factors in Watershed Ecological Compensation. Sustainability 2019, 11, 1990. [Google Scholar] [CrossRef] [Green Version]
  22. Gao, X.; Shen, J.; He, W.; Sun, F.; Zhang, Z.; Guo, W.; Zhang, X.; Kong, Y. An evolutionary game analysis of governments’ decision-making behaviors and factors influencing watershed ecological compensation in China. J. Environ. Manag. 2019, 251, 109592. [Google Scholar] [CrossRef] [PubMed]
  23. Xu, Z.; Liu, B.; Li, S.; Chen, Y.; Meng, Z. A standard compensation system on the environmental influences of Chinese coal resource development. Arab. J. Geosci. 2021, 14, 1–17. [Google Scholar] [CrossRef]
  24. Abuya, W.O. Mining conflicts and Corporate Social Responsibility: Titanium mining in Kwale, Kenya. Extr. Ind. Soc. 2016, 3, 485–493. [Google Scholar] [CrossRef]
  25. Wei, C.; Luo, C. A differential game design of watershed pollution management under ecological compensation criterion. J. Clean. Prod. 2020, 274, 122320. [Google Scholar] [CrossRef]
  26. Chen, Z.; Xu, R.; Yi, Y. A Differential Game of Ecological Compensation Criterion for Transboundary Pollution Abatement under Learning by Doing. Discret. Dyn. Nat. Soc. 2020, 2020, 1–13. [Google Scholar] [CrossRef]
  27. Shen, J.; Gao, X.; He, W.; Sun, F.; Zhang, Z.; Kong, Y.; Wan, Z.; Zhang, X.; Li, Z.; Wang, J.; et al. Prospect theory in an evolutionary game: Construction of watershed ecological compensation system in Taihu Lake Basin. J. Clean. Prod. 2021, 291, 125929. [Google Scholar] [CrossRef]
  28. Scofield, N.; Roggenthen, W.M. Petrologic evolution of plagioclase-rich cumulates from the Wichita Mountains, Oklahoma: Effects upon magnetic remanence properties. Geology 1986, 14, 908–911. [Google Scholar] [CrossRef]
  29. Seisuma, Z.; Kulikova, I. Distribution of metal concentrations in sediments of the coastal zone of the Gulf of Riga and open part of the Baltic Sea. Oceanology 2012, 52, 780–784. [Google Scholar] [CrossRef]
Figure 1. Layout of sampling and monitoring sample points.
Energies 15 02895 g001
Figure 2. Changes in air SO2 content at different locations.
Energies 15 02895 g002
Figure 3. Changes in soil bulk density.
Energies 15 02895 g003
Figure 4. Evolutionary game trajectory.
Energies 15 02895 g004
Table 1. Game matrix between the government and enterprises.
GovernmentEnterprises
CooperationNon-Cooperation
Regulation(B-C, R+S-D)(P-B-C, -P)
Non-regulation(0, S-D)(0, 0)
Table 2. Property of equilibrium points.
Equilibrium PointsValue of
Determinant
Sign
Characteristics
Trace of MatrixSign
Characteristics
Stability
(0, 0)(B+C)(D-S)+−(B+C+D-S)ESS
(0, 1)(B-C-P)(D-S)+B-C-P+D-S+Instable
(1, 0)(B+C)(R-P+S-D)+B+C+R-P+S-D+Instable
(1, 1)(B-C-P)(R-P+S-D)+−(B-C-P+R-P+S-D)ESS
(x*, y*)(B+C)(D-S) (B-C-P)(R-P+S-D)/
(2B-P)(R-P)
+00Saddle-point
Table 3. Evaluation results of the hourly average concentration range of SO2.
Monitoring PointsConcentration RangeSingle Factor IndexNumber of
Monitoring
Mining East0.018–0.0420.036–0.08428
Gangue hillside0.037–0.0520.064–0.10428
Mining West0.014–0.0370.028–0.07428
Table 4. Statistics of collapsed area of mine A in each period (m2).
YearsCollapse Depth (mm)
10–15001500–30003000–5000>5000
20135,918,660.59873,725.24457,703.631,012,279.10
20157,481,752.091,543,751.711,041,739.201,280,927.35
20177,427,833.441,943,836.271,497,840.371,830,113.19
20199,093,214.391,964,655.571,575,652.782,400,149.78
20208,708,807.662,174,142.652,265,369.822,804,318.26
Finally8,762,543.812,251,783.352,193,314.573,001,731.36
Publisher’s Note: MDPI stays neutral with regard to jurisdictional claims in published maps and institutional affiliations.

