1. Introduction
As we all know, high CO2 emissions pollute air, and this pollutant can endanger human health. Scientists agree CO2 emissions from human industrial activities pose a risk to the earth’s climate stability. Evidence shows a relationship between greenhouse gasses and global climate change. Reducing CO2 emissions directly affects a country’s economic structure, requiring a reduction in economic activity or a shift in energy-dependent processes, which can affect a country’s position and competitiveness on the international stage. Growth in CO2 emissions of developing countries implies developed countries need to reduce emissions. Such reductions lead to a reduction in economic growth along with corresponding increases in unemployment. Such social implications could lead to dissatisfaction among citizens. However, social issues are also a potential problem when pollutants are high as human health is endangered and quality is life sacrificed.
From a globalization perspective, the finance sector of China’s CO2 emissions have become increasingly close to the international carbon finance market. The United Nations Framework Convention on Climate Cooperation, as specified in the Kyoto Protocol and the Paris Agreement, assume varying degrees of responsibility among nations for reducing emissions. In the international CO2 emission rights trading market, the emission rights quotas held by various countries are limited. When conducting CO2 emission rights trading, companies can purchase certified emission reductions or emission permit quotas in a targeted manner. In the case of price changes, companies can consider the price of certified emission reductions and emission allowances, choose the type of purchase, and adjust the purchase amount.
Energy activities are usually the main source of carbon emissions, generating more than 90% of CO
2 emissions, of which total greenhouse gas emissions account for 75%. Most energy activities rely on the burning of fossil fuels and the emission of greenhouse gases, while CO
2 is mainly produced by burning fossil fuels. China is one of the countries that emit the most CO
2 in the world, and its emissions are second only to the United States. As China hopes to continue to develop its industry rapidly, it is indeed facing great challenges in reducing greenhouse gas (GHG) emissions to a predetermined target. In fact, there are some factors that can easily cause China’s GHG emissions to increase rather than decrease year by year. Petroleum, natural gas, coal, and other fossil fuels are currently the most important energy consumption products used in human activities and the leading contributors to greenhouse gas emissions. According to BP’s
World Energy Statistics Yearbook released by BP in July 2021, the global primary energy consumption in 2020 was 556.63 EJ (EJ = 1018 Joule), which was affected by the COVID-19 epidemic and other factors. Since 2019, energy consumption has decreased, and the consumption has decreased by 4.28 percentage points compared with 2009. (BP, 2021,
https://www.bp.com/content/dam/bp/business-sites/en/global/corporate/pdfs/energy-economics/statistical-review/bp-stats-review-2021-full-report.pdf (accessed on 12 December 2021)).
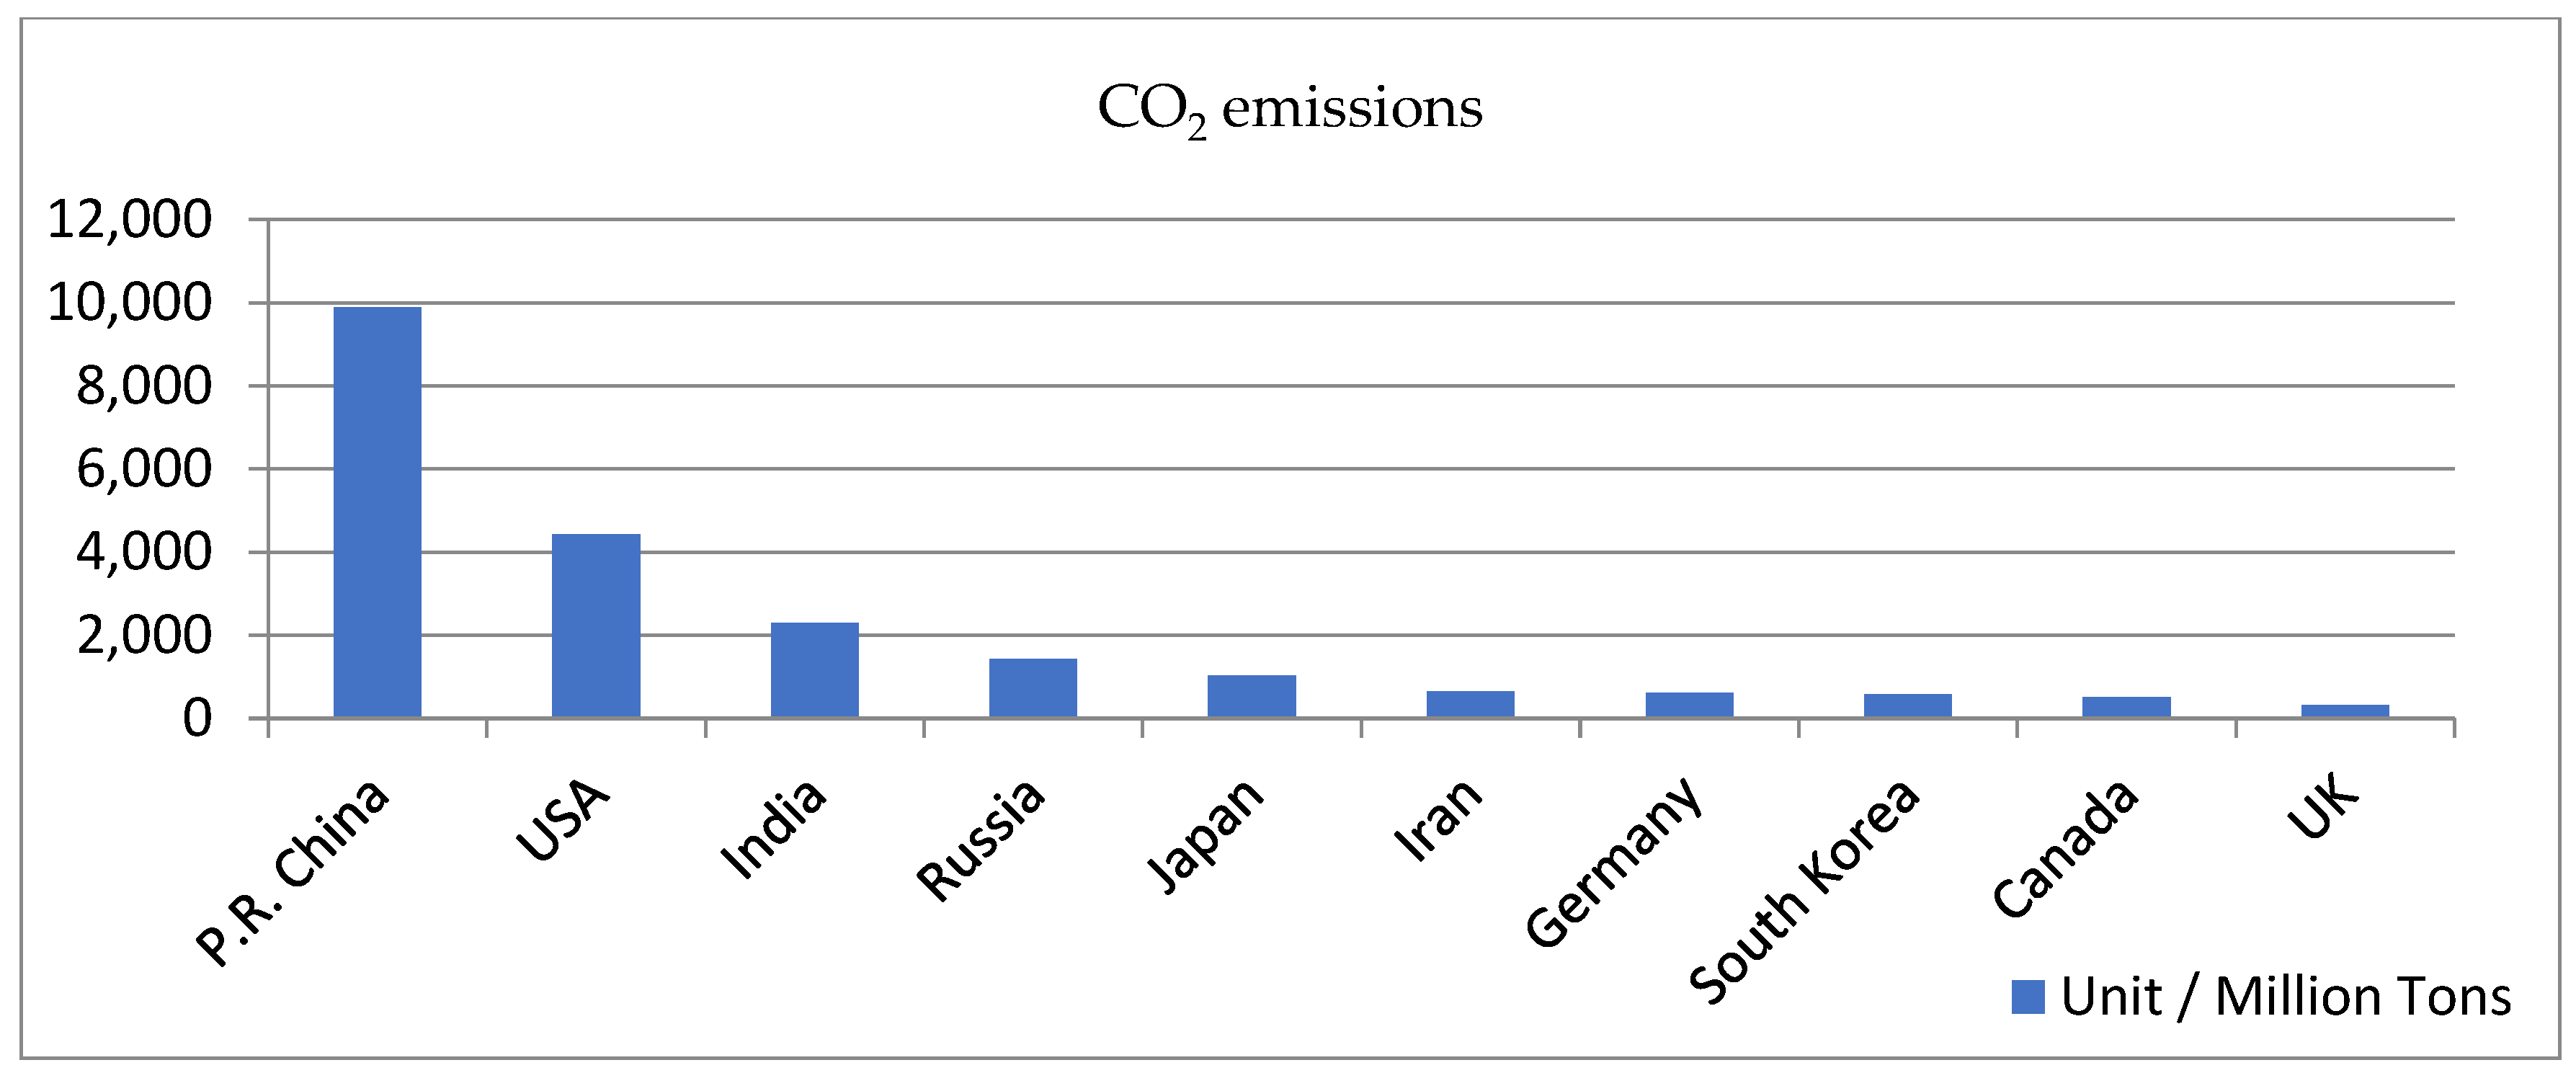
The largest emissions by country are from China, which is the leading energy consumer (
Figure 1 shows the world’s top 10 CO
2 emissions countries in order of emissions in 2020, BP, 2021). In 2020, China’s energy-related CO
2 emissions reach 98.9351 million tons, accounting for 30.66% of the world’s total emissions (National Bureau of Statistics of China, 2021,
http://www.stats.gov.cn/english (accessed on 16 December 2021)). Energy consumption in China for 2020 totaled 49,800 million tons of standard coal, that is a 2.2% rise from 2019. Coal decreased as a percentage of energy sources to 56.8%, a decrease of 0.9% from 2019. Clean energy consumption, including hydropower, natural gas, nuclear power, and wind power totaled 24.3%, which was an increase of 1.0% from 2019. From 2016, the clean energy sector increased 5.2% from 19.1% of the total (National Bureau of Statistics of PRC, 2021,
http://www.stats.gov.cn/english (accessed on 16 December 2021)). As the economy and society shift to high-quality development, China’s energy consumption structure is gradually improving. Affected by the epidemic in 2020, the global primary energy consumption growth rate was −4.28%, but China’s primary energy consumption grew by 2.41%. China’s share of global primary energy consumption rose from 20.64% in 2010 to 26.13% in 2020, while still facing increasing regulatory pressure.
Reduction of emissions is thus an important topic of research for academic researchers and government officials. The first step in reducing CO
2 emissions is to understand the main determinants and associated factors of CO
2 emissions. Previous studies have found numerous factors that impact CO
2 emissions. Such factors include trade openness, energy consumption (especially coal consumption), GDP (economic growth), urbanization, and financial development. The current study examines the specific case in the People’s Republic of China (PRC). Previous studies have mainly relied on the traditional method, Granger causality, which often ignores nonlinear and tail causal effects. A more detailed and flexible approach is the quantile causality perspective. To this end, we employ the Toda-Yamamoto Granger causality test by quantile regression (T-YGCQ, hereafter) proposed by Cheng et al. [
1] to investigate the major determinants of CO
2 emissions in the PRC. Such an approach can overcome the current gap in the research literature.
We organize the remainder of this study as follows. Previous literature is covered in
Section 2, followed by our theoretical model and discussion of the bootstrap Fourier Granger causality in quantiles test proposed by Cheng et al. [
1], in
Section 3. Empirical findings and their implications to policy are covered in
Section 4. Finally,
Section 5 includes conclusions.
2. Literature Review
Numerous factors affect CO
2 emissions as found in previous research. These include trade openness, power generation (especially coal consumption), financial development, GDP (economic growth), and urbanization. Trade openness increases international trade, which in turn leads to an expansion of manufacturing activity to meet demand. This leads to an increase in CO
2 emissions. Larch [
2] believes that carbon tariffs can reduce CO
2 emissions worldwide and that carbon leakage can be reduced by changing the composition of production within and between countries. This reduction comes at the cost of lowering world trade flows and lowering welfare, especially for developing countries. Rasiah et al. [
3] pointed out trade openness, alongside energy usage and economic growth has significantly influenced CO
2 emissions across selected ASEAN nations. Emission intensity of all sectors in the PRC surpass Japan, as Long [
4] found using a multiregional input-output model from 2000 to 2014. Annual consumer-related emissions were surpassed by production emissions. Environmental effects of foreign trade are negative—the “pollution paradise hypothesis”. This hypothesis holds that when the cost of compliance with domestic environmental regulations is high, developed countries increase the importation of “polluting products”. Thus, the polluting process is transferred to developing countries with weaker environmental regulations, which bear the consequences of environmental pollution. Cai et al. [
5] proposed a pollution paradise hypothesis verification model and conducted a comprehensive analysis, calculating CO
2 emissions in imports and exports. The results showed that the PRC has become a pollution paradise for 22 developed countries. To test influences on emissions from power production and economic expansion, Osobajo et al. [
6] employed Granger causality and panel cointegration tests to a pooled OLS regression and fixed effects method. Such data provides needed input on the efforts to move to a low-carbon economy. Jung et al. [
7] established a dynamic computable general equilibrium (CGE) model to study the relationship between population changes and CO
2 emissions in China, Japan, and South Korea. The results show that a country’s labor participation rate affects the production function, which is converted into GDP, and that GDP is positively correlated with CO
2 emissions.
On the other hand, trade openness allows countries to easily acquire (from other countries) and use new and clean technology, which is associated with low levels of CO
2 emissions. As Farhani et al. [
8] pointed out; the technology, composition, and scale of international trade are key inputs to emission levels. This perspective, the scale effect argument, asserts that increases in trade and economic growth lead to emission increases. Power consumption is the key ingredient as the theory of comparative advantage shows demand for low-cost goods leads to increased production and pollution. Such trade then leads to improvements in efficiency, through competitive pressures, that lower emissions. Thus, it is clear that increases in international trade increase the demand for power consumption. Simultaneously, the same trade activity pressures industries to become more competitive through efficiency. Sebri and Ben-Salha [
9] found that adopting renewable energy sources (lowering CO
2 emissions) among developing countries varies according to national income levels. The magnitude and direction of trade’s relationship with emissions is complex and not easily quantified. Zhang et al. [
10] studied real GDP and total primary energy consumption to determine how trade liberalization affects CO
2 emissions. They concluded that trade liberalization has a negative and significant impact on emissions. The empirical results of short-term causality show a one-way link between trade and energy. Real GDP and trade have Granger causality with CO
2 emissions. Mutascu and Sokic [
11] used samples and wavelet tools from the period 1960 to 2014 to explore the correlation between European Union (EU) trade openness and CO
2 emissions. The results suggest that countries would choose trade over reducing CO
2 emissions in the short- and long-term, strongly influenced by economic shocks, energy use, and economic growth. Li et al. [
12] used a random-effects model and 1996-2018 data to study CO
2 emissions from former socialist countries in Central Europe and East Asia. They found that improvements in energy efficiency and increased shares of agriculture, forestry and fisheries reduced CO
2 emissions per capita. An increase in the proportion of industry will increase CO
2 emissions per capita. Chen et al. [
13] used the quantile regression method to investigate panel data of 64 countries along with PRC “the Belt and Road Initiative” from 2001 to 2019 and studied whether increased trade openness would lead to more serious environmental problems. Published findings evidenced the indirect effect of increases in trade to emissions, while such impact varies with the level of CO
2 emissions.
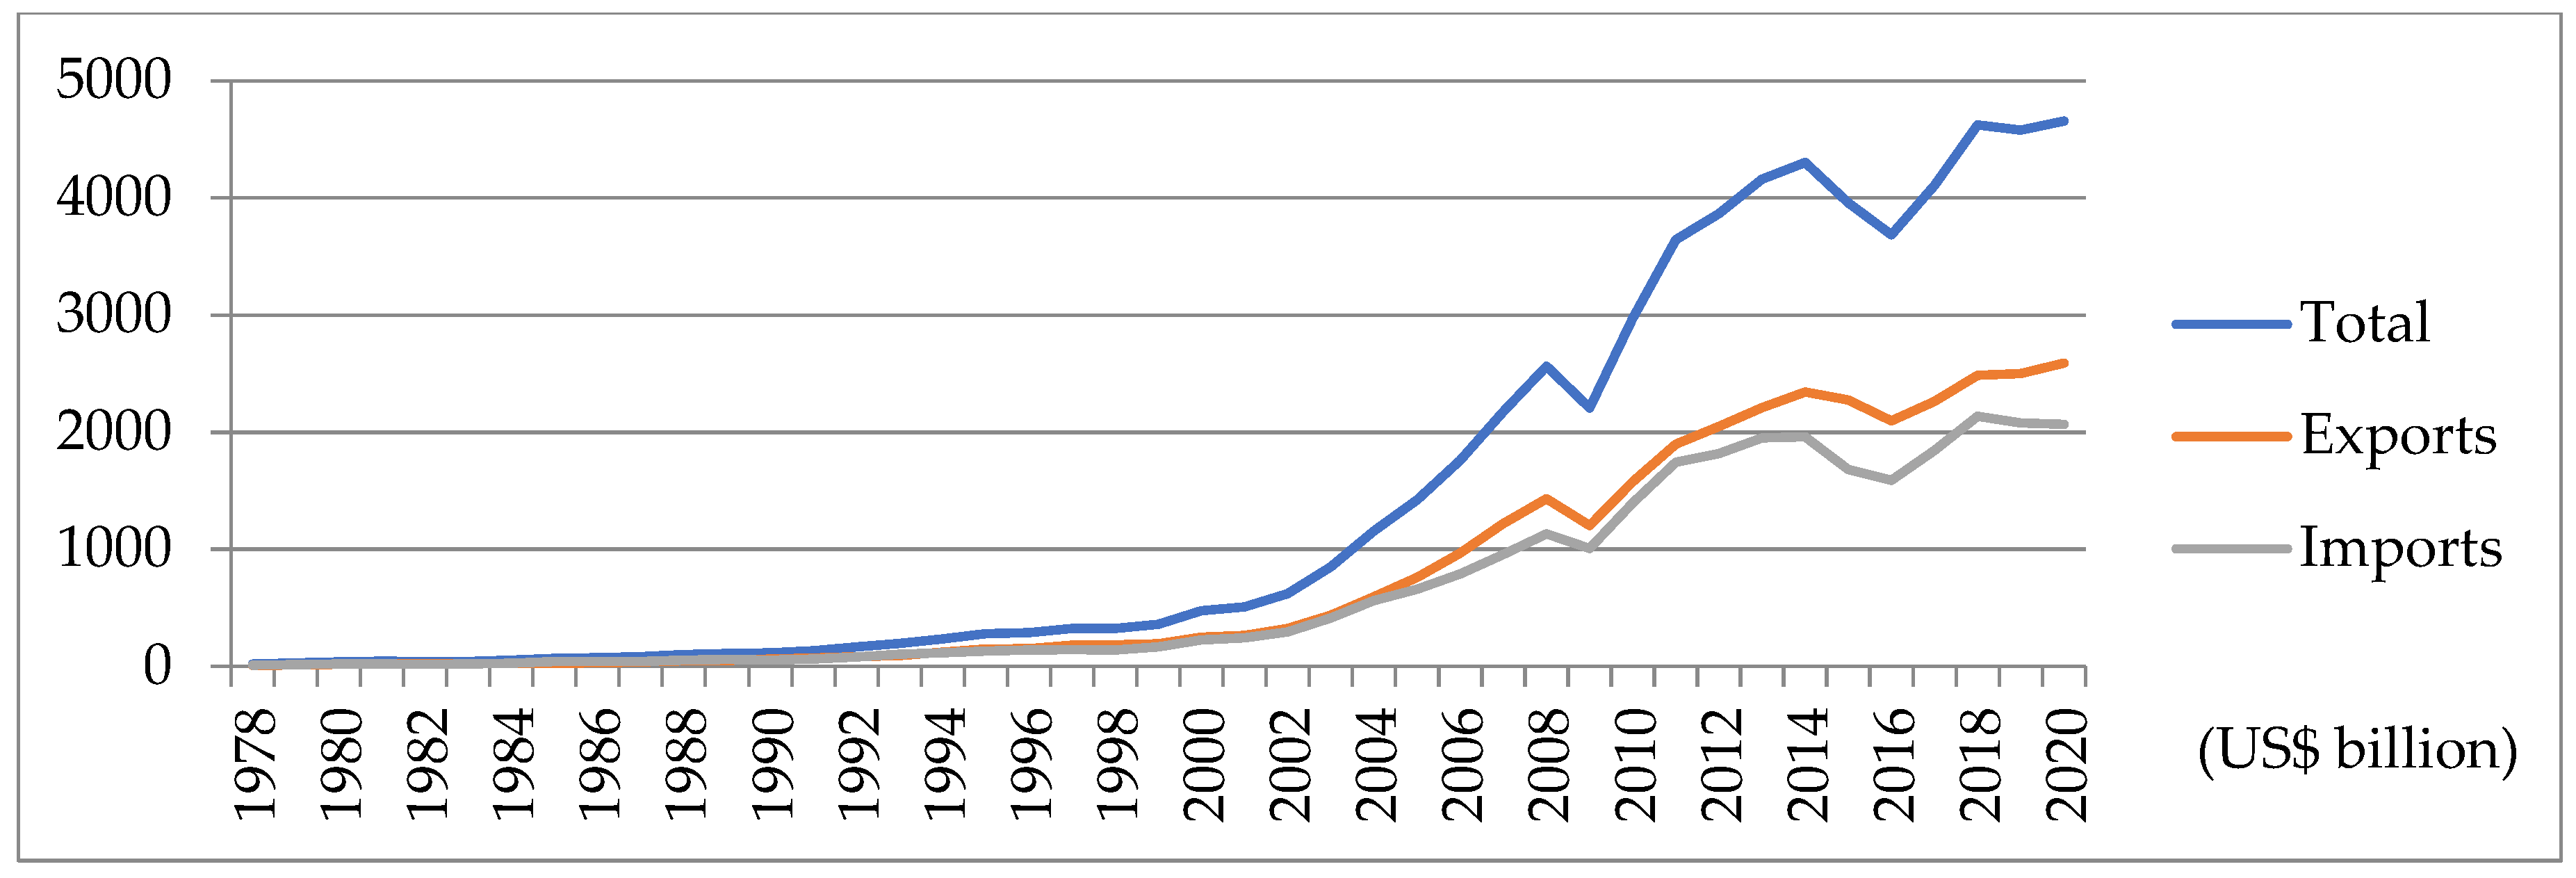
Table 1 shows the top 10 countries or regions in global trade, exports, and imports in 2020.
Figure 2 shows the trade changes after PRC character reform and opening up in 1978.
Existing studies have shown environmental decline and economic expansion follow an inverted U-shaped—also known as the Environmental Kuznets Curve (EKC). Researchers such as Grossman and Krueger [
14] and Selden and Song [
15] have examined this correlation, finding the early stages of economic expansion especially reflect this phenomenon. Results, however, show large variances in the levels and significance of the connections between economic growth and resulting emissions. Thus, the tension between increases in emissions from economic expansion and decreases in emissions from increased living standards and improved production efficiencies is currently unresolved. Li et al. [
16] conducted a spatial analysis of dust, SO
2, NOx, and CO
2 emissions in China, using local spatial correlation analysis, global spatial autocorrelation analysis, and a spatial lag model. Empirical findings suggest that urbanization and economic growth are key determinants of dust, NOx and CO
2 emissions. Fang et al. [
17] used energy-related CO
2 emissions (ECE) data from 143 countries around the world from 1990 to 2014, and used the coefficient of variation to analyze regional differences in ECE growth rates. Energy intensity growth rate and GDP growth rate are the three key determinants of ECE growth rates in most of the world. Growth rates in the non-OECD region were higher and trending upward, while ECE growth rates in the OECD region were lower and trending downward. To and Lee [
18] studied the relationship between Hong Kong’s economic development and energy consumption from 1970 to 2015, and their results showed that energy consumption was the determinant of the resulting greenhouse gas (GHG) emissions.
Using data from 1990 to 2000, Jiang et al. [
19] tested the degree of decoupling of transportation and CO
2 emissions in China and investigated the potential determinants of each mode of transportation. Transport energy efficiency played the most important role in accelerating the decoupling of transport-related CO
2 emissions from turnover across all modes of transport, while energy mixing effects hindered the evolution of decoupling for most of the observation periods. Badulescu et al. [
20] used a panel autoregressive distributed lag (ARDL) approach to investigate the role and impact of economic growth, environmental pollution, and non-communicable diseases on health spending between 2000 and 2014. The results show that, in all 28 EU countries, economic growth is the most important factor influencing both short- and long-term health spending. The impact of CO
2 emissions on healthcare spending varies, being negative in the short-term and positive in the long-term. Tseng [
21] used the Logarithmic Mean Divisia Index (LMDI) model to measure the decoupling effect of economic growth and CO
2 emissions, and explored the influencing factors of the fluctuation of CO
2 emissions in Inner Mongolia, China from 2005 to 2016. The results show that demographic factors, labor Productivity factors and labor factors have a positive impact on CO
2 emissions, and the decoupling between economic growth and CO
2 growth is weak. Carbonell Bojollo et al. [
22] experimentally investigated the relationship between soil and CO
2 emissions. The results show that extreme rainfall can cause large amounts of CO
2 to be released into the atmosphere. Hu et al. [
23] used the Logarithmic Mean Divisia Index (LMDI) and the Kaya identity method to analyze the impact of CO
2 emissions from PRC’s auto industry, and the results showed that R&D intensity and energy intensity are the two main factors affecting emission reductions the investment intensity effect is the biggest factor affecting CO
2 emissions.
Zhou et al. [
24] used data collected across 30 PRC provinces from 2007 to 2017, using spatial and nonlinear measurement methods and found increased power usage and financial developments are linked to economic expansion. They showed the need to support the transition to a low-carbon economy mainly through climate financing, which will help promote large-scale investment in clean energy, thereby significantly reducing CO
2 emissions. Polzin and Sanders [
25] studied the literature and quantitative data on available financing sources for clean energy and pointed out that the funding sources for the European low-carbon energy transition mainly include direct financing models such as private equity and green bonds, bank financing, and institutional investors. Patiño et al. [
26] studied the relationship between CO
2 emissions, energy consumption, and GDP in Colombia using the seemingly unrelated regression equations method and data from the period 1971–2017. The results suggest that economic growth is associated with an increase in these environmental pressures. Energy consumption’s efficiency is raised in a low-carbon economy with the goal of lowering greenhouse gas emissions while still obtaining economic growth. This combination of social and economic growth along with increased ecological and environmental protection is obtained through technological and institutional innovation and transformation, thus overcoming the contradictions between environmental issues and development. Another link that has been examined is that of emissions and urbanization. In 1950, urbanization was 30% but has grown to 50% today and is predicted to grow to 60% by 2030. The link of emissions to urbanization has been examined by researchers such as Poumanyvong and Kneko [
27] who used a Stochastic Impacts on Population, Affluence, and Technology (STIRPAT) model with data from a balanced panel of 199 countries, from 1975 to 2005. They attempted to quantify the link by considering a range of development stages and the unique profiles for different stages. They found energy use is lower in low-income groups and increases in middle- and high-income groups, while especially pronounced in the middle-income group.
Martínez Zarzoso and Maruotti [
28] analyzed the impact of urbanization on carbon dioxide emissions in developing countries between 1975 and 2003. It takes into account the dynamics and existing heterogeneity of sample countries by examining the effects of urbanization. The results show that the relationship between urbanization and CO
2 emission is inverted “U-shaped”. In fact, the emission urbanization elasticity is positive for low urbanization levels, which is consistent with the higher environmental impacts observed in less developed regions. Ponce de Leon Barido and Marshall [
29] studied the impact of urbanization and environmental policies on CO
2 emissions at the national level. Zheng et al. [
30] explored the CO
2 emissions of 73 Chinese cities during the data period from 2002 to 2012 using a linear mixed-effects regression method with quadratic term Stochastic Impacts on Population, Affluence, and Technology (STIRPAT) model related factors. The study found that there is heterogeneity in the cross-city distribution of per capita CO
2 emissions and the relationship between carbon dioxide emissions and per capita GDP has a nonlinear structure. The empirical results show that population size, urbanization level, energy consumption structure, the proportion of secondary industry and economic level generally have a positive impact on PRC’s urban CO
2 emissions. Xing et al. [
31] used the Asia-Pacific Integrated Model (AIM/Enduse) to estimate the mitigation potential of energy transitions and sustainable policies, and study the growth in energy use due to rising incomes and urbanization. The results show that both income and education level have significant effects on household energy choices in both rural and urban areas. Sutthichaimethee and Kubaha [
32] used the VARIMAX-ECM model to predict Thailand’s CO
2 emissions from 2018 to 2029 and found that short- and long-term urbanization rates, net exports, industrial structure, and GDP affect CO
2 emissions. Wang et al. [
33] also showed that the relationship between urbanization and CO
2 emissions varied by income level and economic development. Further expanding on this thread, McGee and York [
34] included emissions panel data along with percentages of individuals residing in urban areas and a range of structural factors across less-developed countries (1960–2010). Those findings indicated lower urbanization leads to lower emissions to a greater degree compared to higher urbanization’s relationship to increased emissions. They assert deurbanization leads to disruptions in production and distribution of goods and services with reduced access to power sources. Thus, patterns of migration flows from rural to urban settings can impact emission levels, making deurbanization patterns important to any serious analysis.
Cointegration models along with Granger causality are often used to independently test short- and long-term connections among power consumption, emissions, and urbanization [
35,
36,
37]. Evidence supports short-term causal connections from urbanization to energy consumption and urbanization to CO
2 emissions. Energy use and urbanization combine to raise emissions in the long-term [
38]. Dynamic causal connections that include variables such as emissions, energy, trade openness, urbanization, consumption, and growth have been examined by Khoshnevis Yazdi and Dariani [
39] with the pooled mean group (P.M.G.) method for data from 1980 to 2014 in Asian nations. Urbanization was found to raise power consumption and emissions, while the quality of the environment was considered a normal good over the long-term. Bidirectional causality between economic growth, urbanization, and emissions was shown using the Granger causality test. These results advance the literature and draw attention to more nuanced analyses to better assist policymakers.
Chen et al. [
40] also described an inverted “U-shaped” relationship from data collected in western PRC (188 prefecture-level cities). In eastern regions of the sample, more natural gas was used, compared to more coal in the west. The project of natural gas transmission from west to east has been overlooked by researchers investigating this unusual finding. This shift in natural gas could lead to higher emissions in the west as coal displaces natural gas moving east. Using time series data from Pakistan (1972–2014), Ali et al. [
41] reported on urbanization’s influence on emissions in Pakistan. In both the long- and short-term, emissions increased with urbanization, as quantified by an ARDL (auto-regressive distributed lag) bounds testing approach and the VECM model that were used for causal analysis. Policy implications from such an approach suggested reducing car emissions through increases in public transportation systems. Such government planning and execution can increase green technology in urban settings.
Another examination of the PRC case was reported by Sarwar and Alsaggaf [
42] in their analysis of urbanization and income’s relation to carbon emissions in the case of China. Using panel data across 30 PRC provinces (1998–2016), urbanization exhibited a positive coefficient, while urban income exhibited a negative coefficient in relation to emissions. Traditional methods as reviewed here fail to take into account tail or nonlinear causality. Yumashev et al. [
43] used data from 2006 to 2017 to study the relationship between energy consumption, Human Development Index (HDI) and carbon dioxide emissions. The results show that the size and level of the HDI is influenced by urbanization, population growth, GDP, GNI and ‘clean’ energy consuming businesses. Wang et al. [
44] studied 30 provinces in PRC from 2006 to 2019 and using exploratory spatial data analysis (ESDA) methods, they analyzed the spatiotemporal patterns and aggregation characteristics of CO
2 emissions, as well as the effects of industrial structure, energy consumption, urban development, foreign trade, economic growth, and government management on CO
2 emissions. The eastern coastal provinces exhibit spatial agglomeration and CO
2 emission hotspots.
In the current study, we will revisit this issue to see what factors determine the CO
2 emissions in China using the Toda-Yamamoto Granger causality test by quantile regression (T-YGCQ, hereafter) proposed by Cheng et al. [
1] to investigate the major determinants of CO
2 emissions in PRC. We hope our study can bridge the gap in current literature.
3. Data, Theoretical Model, and Methodology
Using yearly PRC data (1969–2019), we included the following variables in the current study: CO2 emissions, coal consumption, financial development, urbanization, trade openness, and GDP. Data for financial development, urbanization, trade openness, and GDP were sourced from the National Bureau of Statistics of China. Trade openness measured the ratio of (export + import) over GDP, and financial development was measured as domestic credit to the private sector (constant 2010). Coal consumption and emission data came from the BP Statistic Review of World Energy (June 2019).
Following the previous studies [
45,
46] we can write the theoretical function for CO
2 emissions as follows:
where CO
2 is CO
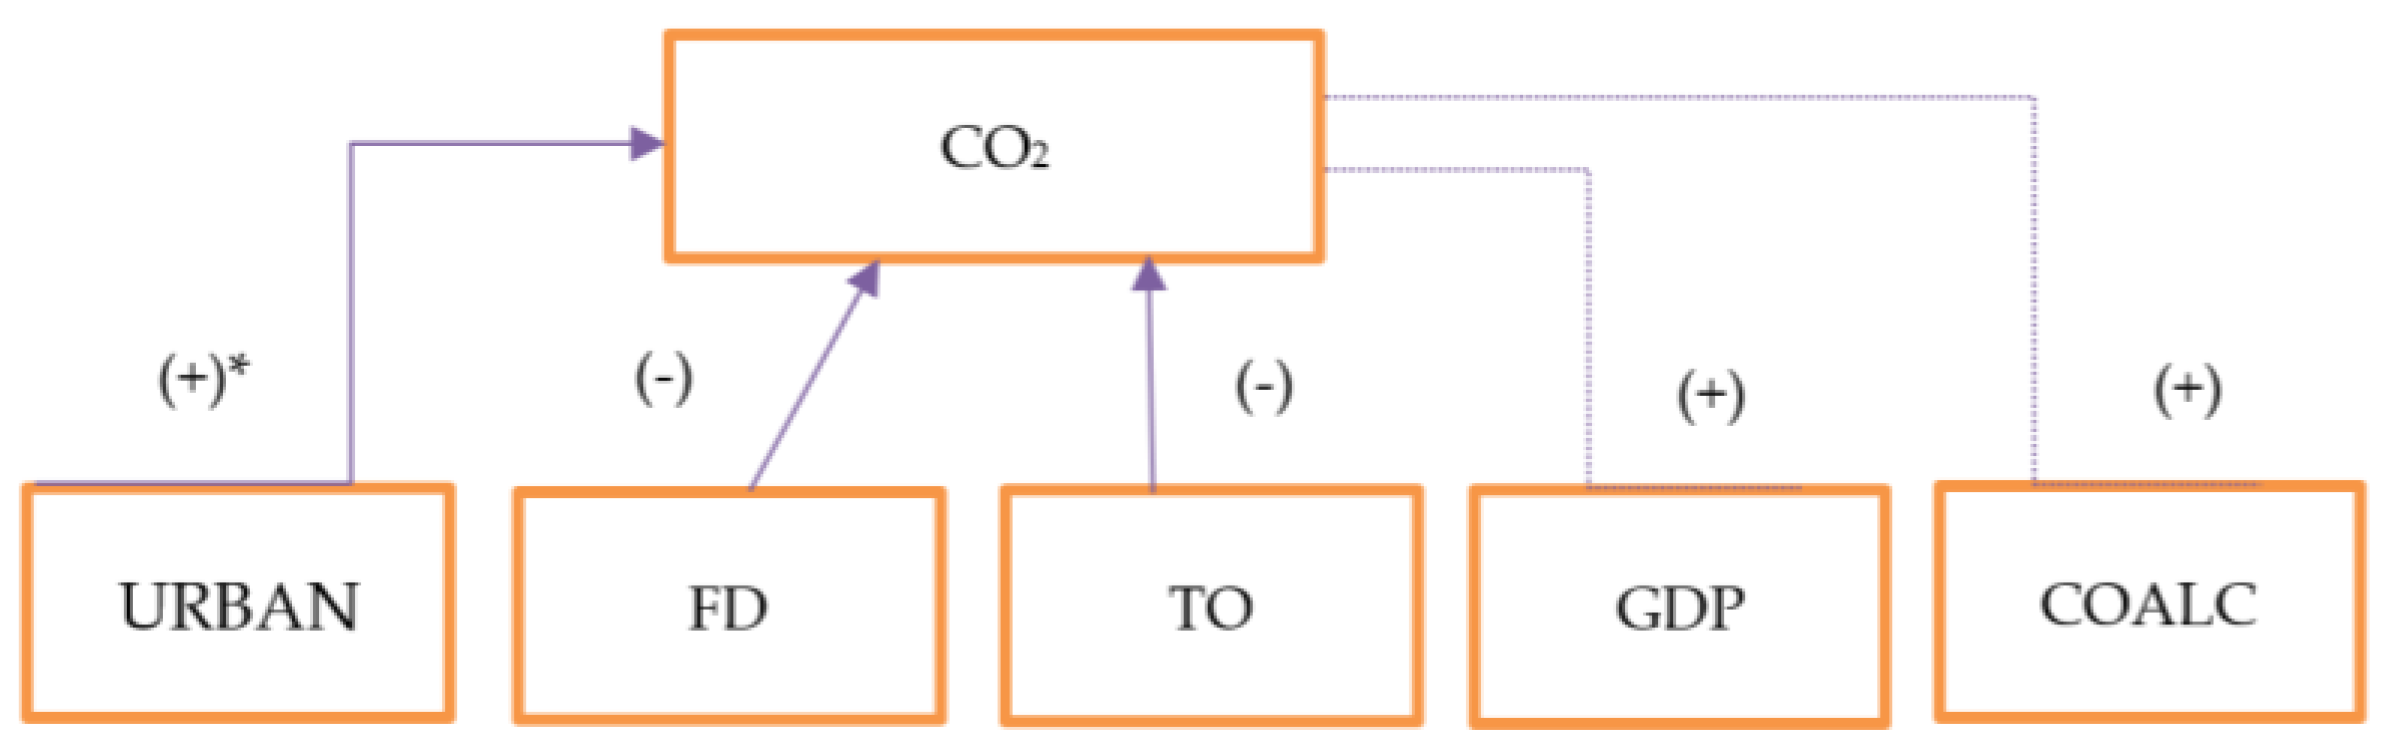
2 emissions, FD is financial development, TO is trade openness, GDP represents economic growth, Urban is urbanization, and Coalc is coal consumption. After taking partial derivates, we can get the hypothesized sign for each variable as shown in the following:
To test Granger causality running from each independent variable to CO
2 emissions, we used the Toda-Yamamoto Granger causality test by quantile regression (T-YGCQ, hereafter) proposed by Cheng et al. [
1] to test the nexus between CO
2 emissions and other variables such as financial development, trade openness, urbanization, coal consumption, and GDP. Because the traditional Granger causality approach [
47] lacks information on causal variables in the tails and nonlinear causalities, we turned to quantile causality in order to build a flexible and detailed description of causal relationships. We used causal relationship structural breaks, such as shown by Cai et al. [
5], Goh et al. [
48], and Lin et al. [
49] who included dummy variables in their models. Low-frequency components of a Fourier approximation have been shown to capture both gradual and sharp structural breaks, such as the work by Gallant [
50] and Gallant and Souza [
51]. Therefore, in our study, we employed the Fourier function instead of using dummy variables in our T-YGCQF (p + d) model. The b(t) was defined as follows:
We can incorporate this Fourier expansion into a testing equation and obtain the following Fourier Quantile equation:
where CO
2 emissions are our dependent variable, FD is financial development, GDP is economic growth, Coalc is coal consumption, Urban is urbanization, and TO is trade openness. We can test the Granger causality test from financial development to CO
2 emissions at different quantiles under the null hypothesis of
. The optimal lags (p*) of our model were selected based on the Akaike Information Criterion (AIC). Regarding the k in our Fourier function, we first set
, then we selected the optimal k* also based on AIC. The null hypothesis of no Granger causality is
and we can use the following Wald statistic:
where R is an indicator matrix of the parameters,
is the column stack of D, S the variance-covariance matrix of the unrestricted model, and ⊗ is the Kronecker product. Autoregressive conditional heteroskedasticity (ARCH) can result in non-normal data distribution, making the Wald statistic reject an asymptotic result, as observed by Hatemi-J and Uddin [
52]. To overcome this issue, we employed a simulation bootstrapping with 10,000 iterations and forming critical values at the 10%, 5%, and 1% levels. Additionally, a Wald test was used to test the null hypothesis:
4. Empirical Results and Policy Implications
To test the causal correlation between CO2 emissions, financial development, trade opening, coal consumption, economic growth (GDP), and urbanization from 1969–to 2019 in the PRC, we used the Fourier quantile Granger causality test.
First, we performed a traditional unit root test and next performed the Fourier quantile Granger causality in the quantile test. Summary results of the series can be seen in
Table 2. Jarque–Bera statistics indicate that CO
2 emissions, coal consumption, trade openness, financial development, urbanization, and GDP are all non-normally distributed.
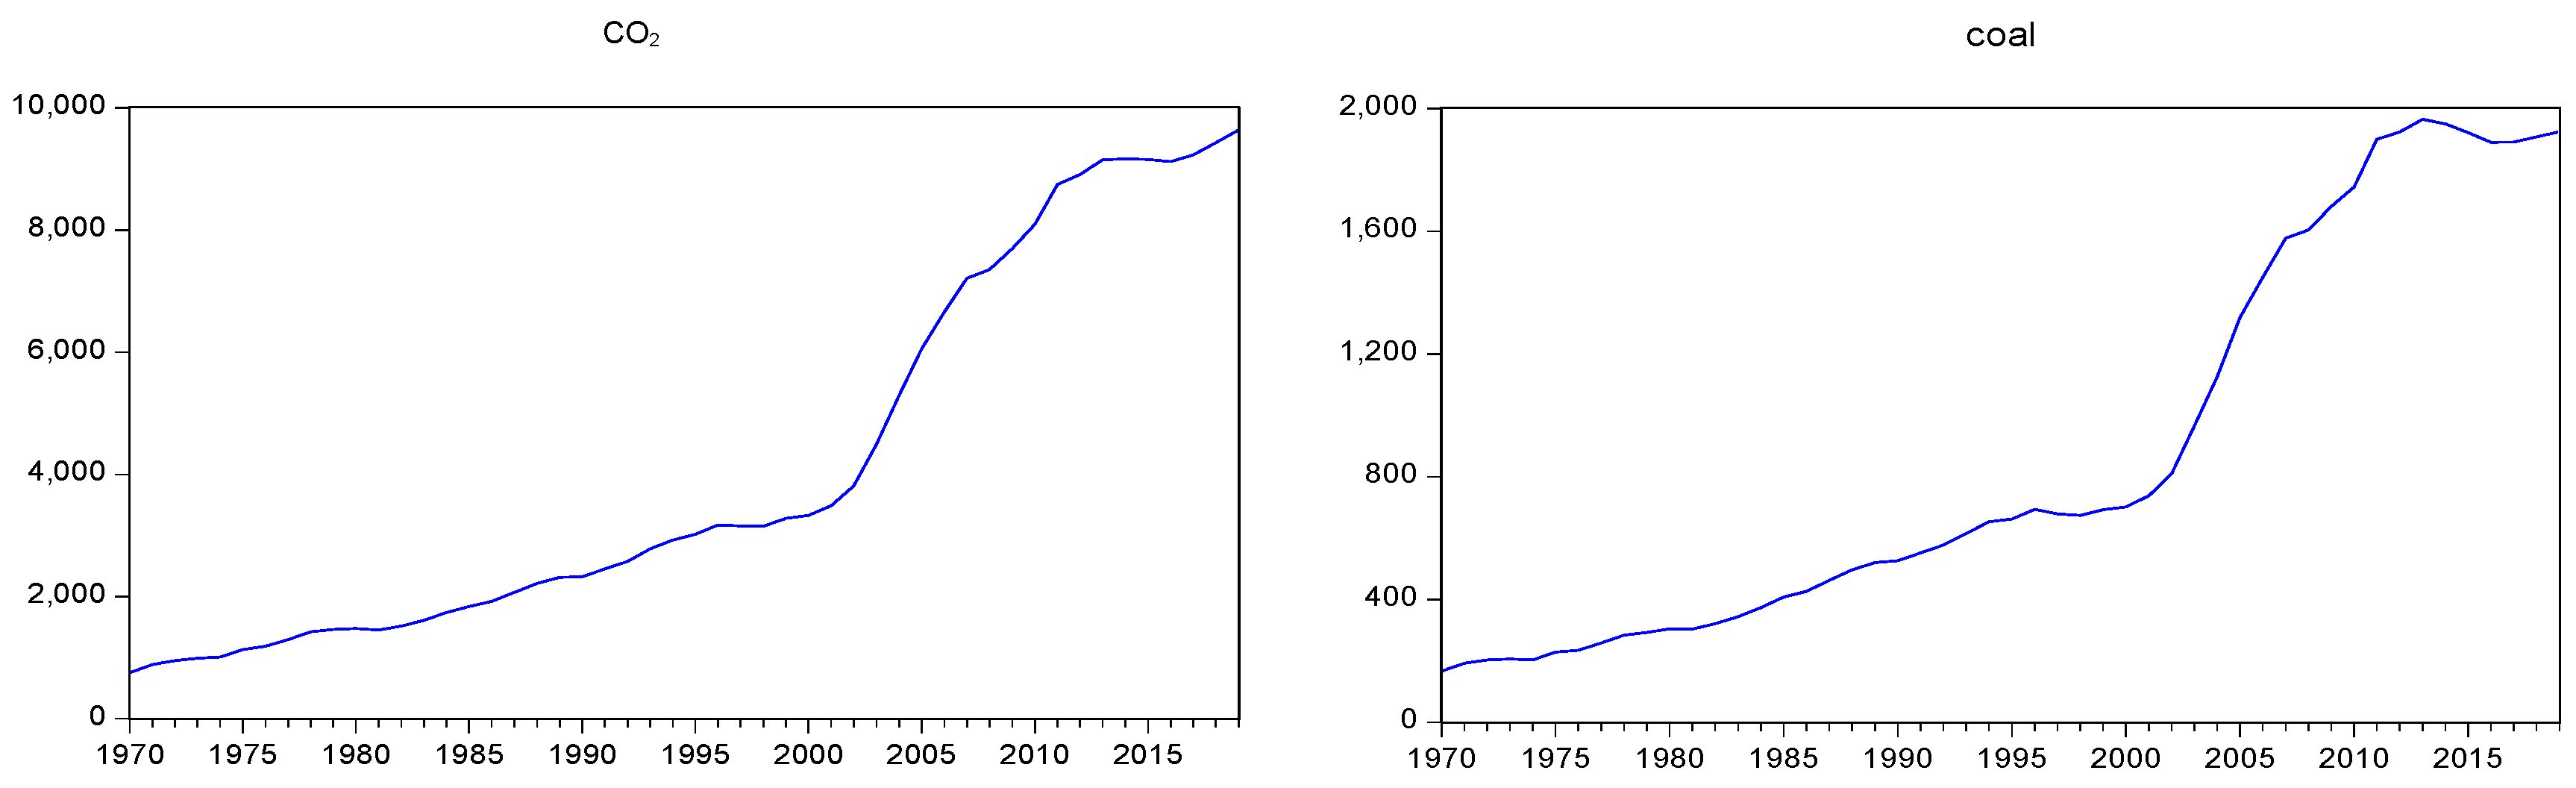
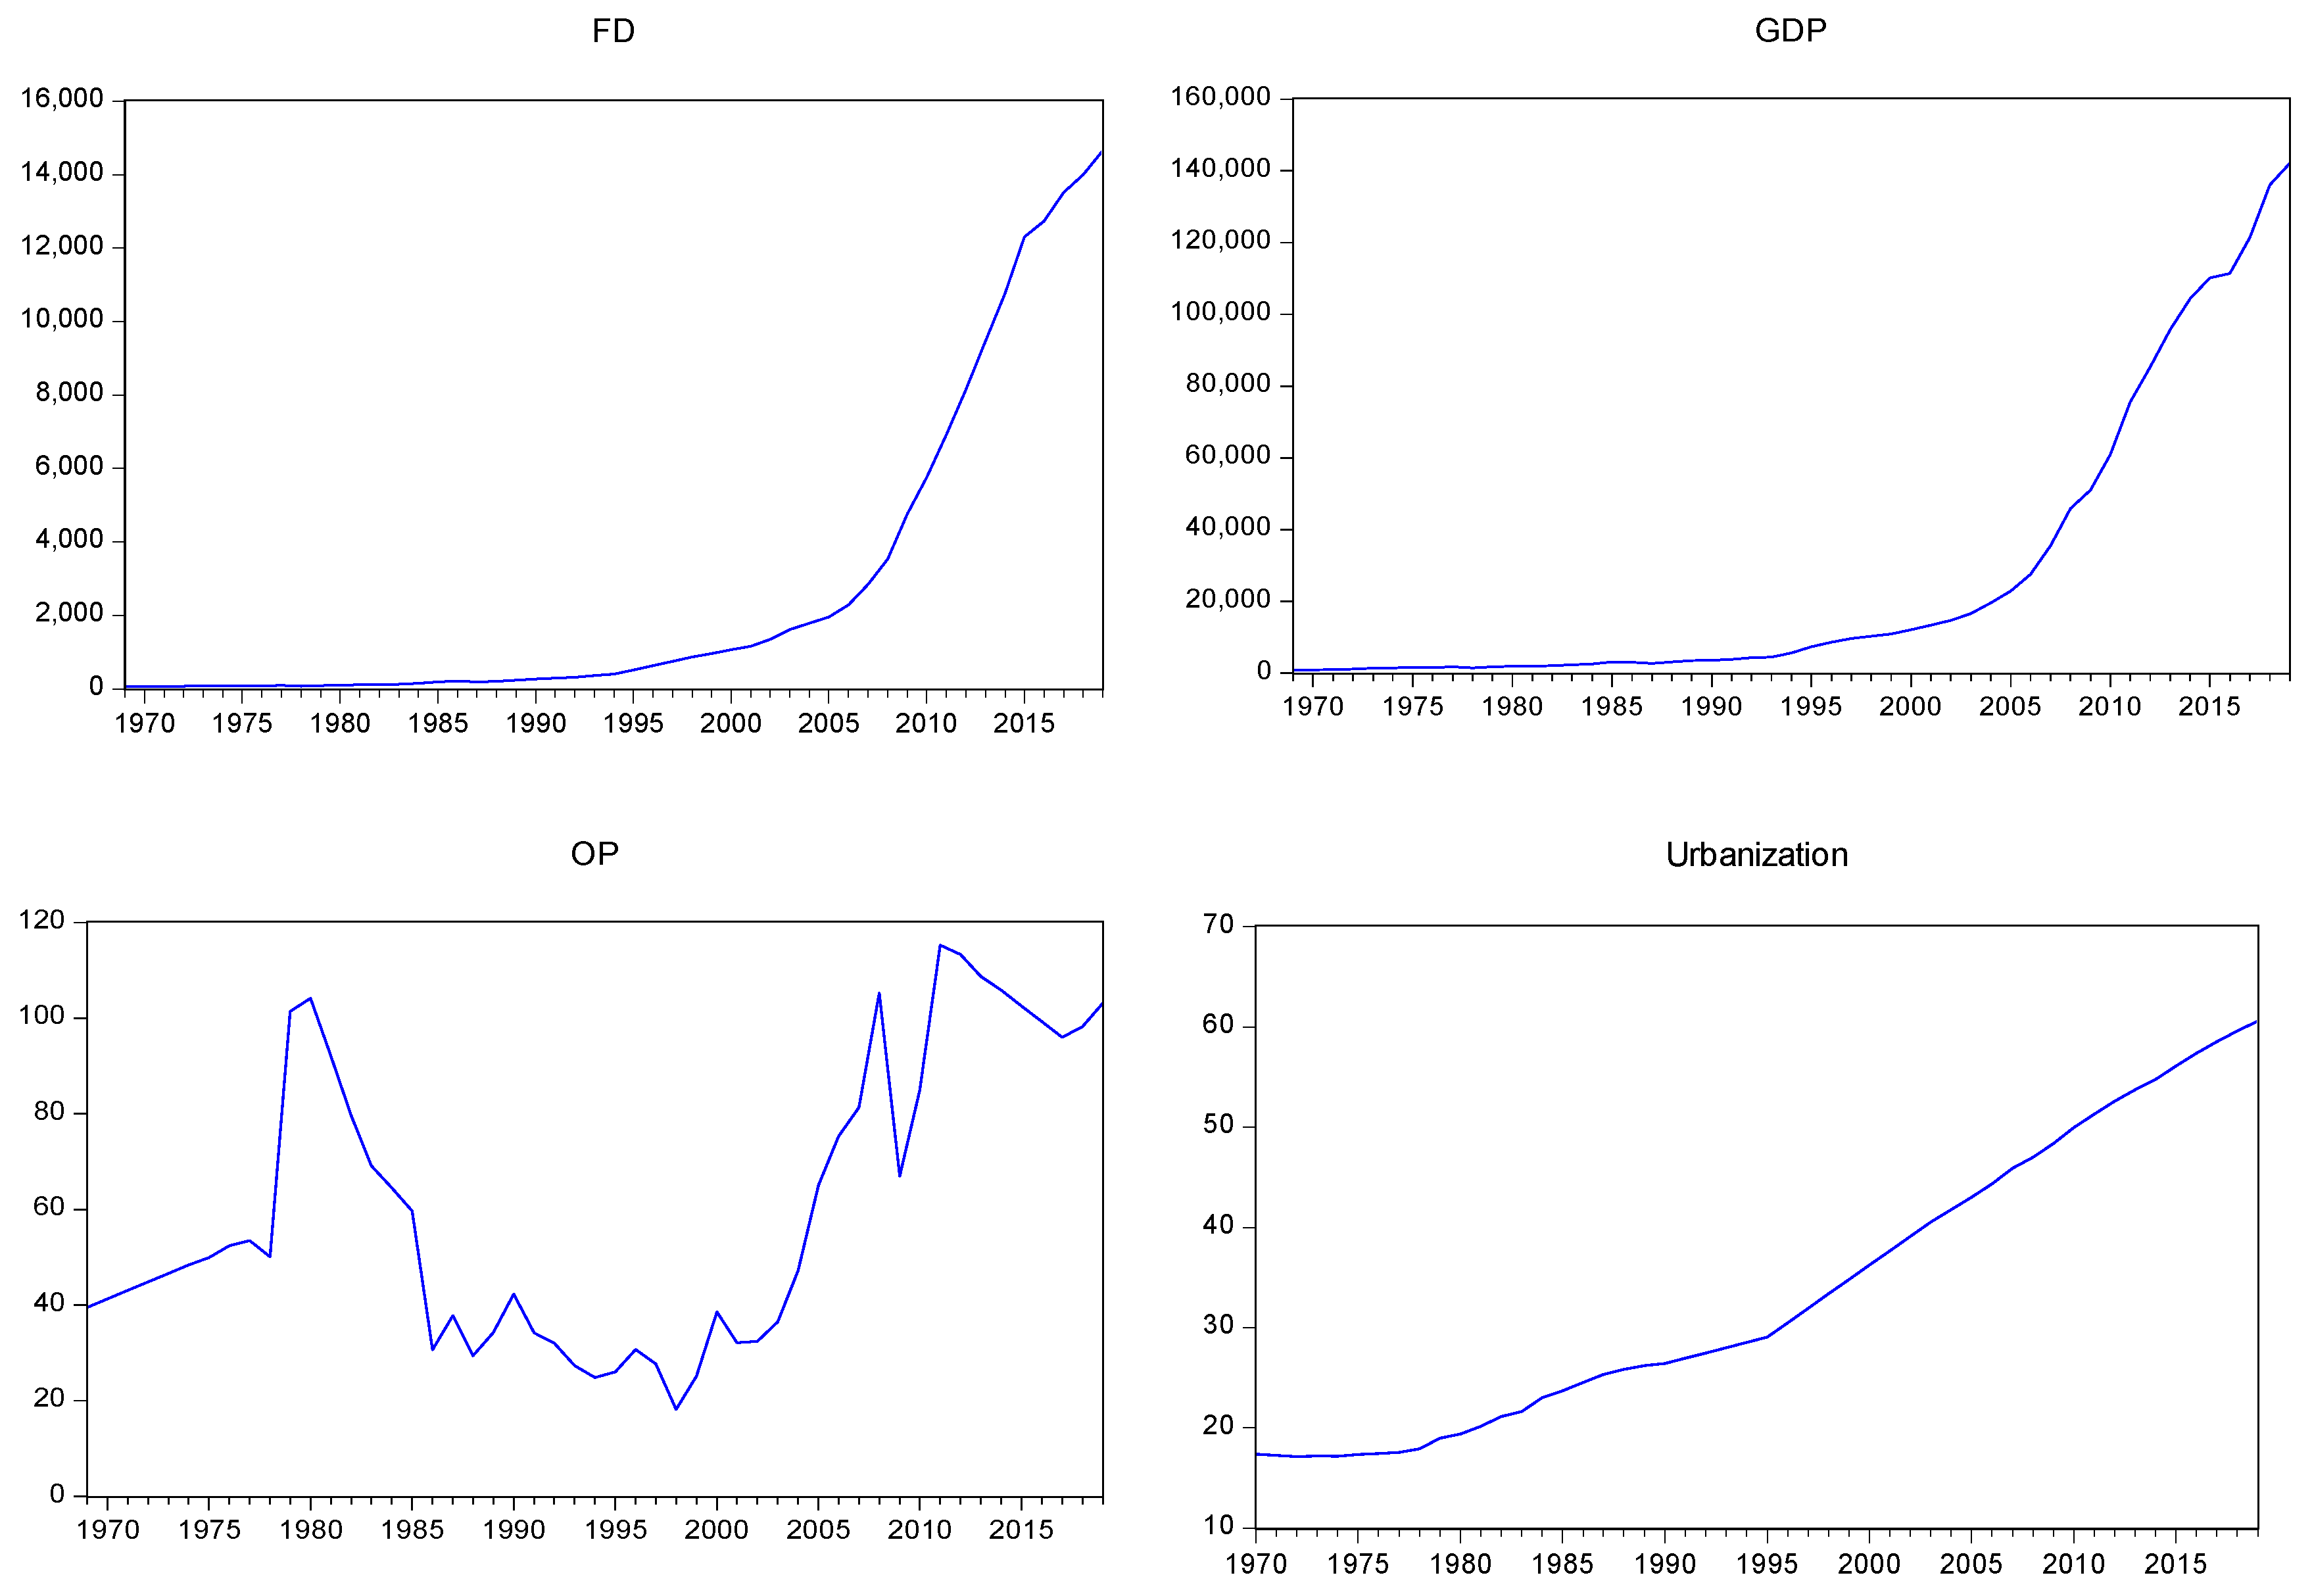
Figure 3 shows the plots of time series for those six variables. We found that five variables (CO
2 emissions, coal consumption, urbanization, financial development, and GDP) were all trending upward although trade openness shows some fluctuations during the research period.
4.1. Results from the Unit Root Test
The unit root test results including ADF, PP and KPSS are shown in
Table 3. The results show that CO
2 emissions, coal consumption, financial development, GDP, trade openness and urbanization are all non-stationary I(0) and the results of the first difference are all stationary I(1).
Figure 3 shows a line graph of the PRC’s variables (CO
2 emissions, Coal consumption, financial development, GDP, trade openness and urbanization) across a range of years.
4.2. Results from Cointegraion Test
We employed the new cointegration technique (known as the combined cointegration approach) developed by Bayer and Hanck [
53]. Combining previous cointegration methods (Johansen, Phillips and Ouliaris, Boswijk, and Banerjee), this newer technique results in Fisher F-statistics that is more reliable, see
Table 4 for results. Results from EG-JOH and EG-JOH-BO- BDM show cointegration of the variables.
Table 5 reports results of the traditional Granger causality test.
4.3. Granger Causality Test Results Based on Conventional and Quantile Models
To compensate for cointegration, we employed quantile VAR (
) in our Granger causality test (here
and
). Before estimating the model, we also tested for the existence of a Fourier function in our Equation (3), using the Wald test statistics. Wald statistics results equaled 45.527, less than its bootstrap critical values of 10% (equal to 69.322). The null hypothesis (
) was not rejected at the 10% confidence level (see
Table 6). Accordingly, the quantile Granger causality model was used without a Fourier function. Additionally, we used the traditional Granger causality test to make comparisons.
Empirical results indicated that urbanization, trade openness, and coal consumption Granger cause CO
2 emissions (see
Table 6 and
Figure 3). The Granger causality test [
47] does not describe tail causal relations and also misses nonlinear causalities; while a quantile causality approach does—providing better predictive power from more detailed descriptions. We therefore employed the Toda-Yamamoto Granger causality test, as specified by Nazlioglu et al. [
54], with quantile regression (QT-Y, hereafter). This approach was applied in testing the correlation between emissions determinants such as financial development, coal consumption, trade openness, economic growth, and urbanization for the RPC. To account for our sample size of 51, quantiles were set at 0.2, 0.4, 0.6, and 0.8, see
Table 7 for results. We found Granger causality running from financial development to CO
2 emission at all levels of quantiles (0.2, 0.4, 0.6, and 0.8), from trade openness to CO
2 emission at two levels of quantiles (0.4 and 0.6), and from urbanization to CO
2 emission at all level of quantiles (0.2, 0.4, 0.6 and 0.8). Regarding GDP (economic growth) and coal consumption, our test model did not find any causal relationship. We can conclude that the main determinants of PRC’s CO
2 emissions are financial development, trade openness and urbanization.
Results, based on the coefficients of the independent variables, show urbanization causes CO
2 emissions to go up at all 4 quantiles (0.2, 0.4, 0.6, and 0.8), and financial development reduces CO
2 emissions at all 4 quantiles. On the other hand, trade openness reduces CO
2 emissions at the middle quantiles (0.4 and 0.6). Though trade openness is not significant at the extreme quantile (0.2 and 0.8), trade openness also negatively impact CO
2 emissions. If we look at the signs of both GDP and coal consumption, we find they both increase CO
2 emissions though not significantly.
Figure 4 details results of relationships among emissions and determinants (i.e., urbanization, trade openness, financial development, coal consumption, and CO
2 emissions). This figure further confirms our empirical findings.
Apparently when urbanization increases, more construction will be built and more energy will be consumed. Therefore, urbanization causes CO
2 emissions to go up. The PRC is experiencing increasing urbanization, which impacts emissions and in turn increases public demand for renewable energy. This result is consistent with those of Poumanyvong and Kneko [
27], Wu et al. [
55], Ali et al. [
41], and Khoshnevis Yazdi and Dariani [
39] who found that the impact of urbanization on CO
2 emissions is positive. Since urbanization increases CO
2 emission, the PRC government should adopt low-carbon policies and encourage cities to remove air pollution pressure from the dependence of coal consumption in the past and then use coal consumption in a more efficient way.
Our findings suggest that financial development leads to a reduction in CO
2 emissions. Previous research has shown mixed results in relation to this link. The theoretical arguments for the impact of financial development on CO
2 emissions are compelling, although they conflict with our findings. Therefore, the direction of influence is an unresolved controversial topic. Regarding trade openness, we find that it reduces CO
2 emissions (negative sign and significant). This result is not consistent with that of Rasiah et al. [
3] who found that trade openness alongside energy usage and economic growth fund increase CO
2 emissions in selected ASEAN nations. On the other hand, trade openness allows countries to easily acquire (from other countries) and use new and clean technology, which is associated with low levels of CO
2 emissions. International trade’s influence on the environment is highly influenced by the three factors of scale, composition, and technology as pointed out by Farhani et al. [
8]. Higher emissions, the scale effect perspective argues, are linked to increases in international trade activity, which require higher levels of power consumption. Competitive trade environments mean dirty goods gain an advantage in price competition, which is accompanied by increases in local emissions. As exports increase local economic success, lowering emissions becomes a priority, as pointed out by Sebri and Ben-Salha [
9]. Thus, emissions have two distinct directions to move that depend on stages of development, trade economics, and local economic growth. The link between emissions and local economic expansion has been documented in a range of conflicting results in terms of signs, magnitudes and significance of the estimates of the emission-growth nexus.
Current research results show economic growth increases CO
2 emissions in the PRC. However, the results shown in
Table 6 demonstrate that though this relationship is positive, it is not significantly so. Finally, regarding the link between coal consumption and CO
2 emissions, we also found that coal consumption increases CO
2 emissions but that this is not significant in PRC. Apparently, our empirical results have shown that financial development, trade openness and urbanization are the major determinants of CO
2 emissions in PRC. The results quantify issues directly related to climate change. Previous recommendations focus on efforts to reduce CO
2 emissions such as utilizing coal efficiency; exploiting new energy including solar, nuclear, and wind energy; slowing urbanization; opening trade; and promoting financial development. Results among these variables can be seen in
Figure 4 (i.e., urbanization, coal consumption, and CO
2 emissions), further confirming empirical findings.
Results are consistent with Wang et al. [
56] and Fan et al. [
57] who reported urbanization increases energy consumption and emissions in all 30 PRC provinces. However, the specific province impact varies based on geographical location and economic structure. Urbanization increases both energy consumption and CO
2 emissions in the PRC, which is consistent with the findings of Jones [
58], Shen et al. [
59], Liu [
60], Minx et al. [
61], Jiang and Lin [
62], Zhang and Lin [
63], Khanna et al. [
64] and Zhou et al. [
65]. On the other hand, our results are consistent with those of Fan et al. [
66], Wei et al. [
67], Zhu et al. [
68] and Wang et al. [
69] who found urbanization affected different economies in opposite directions for nine Pacific Island countries and PRC, respectively.
4.4. Policy Implications
In terms of trade openness, PRC should: (1) actively attract foreign investment. The inflow of foreign investment will bring about technology spillover effects, which will help PRC’s manufacturers, improve their environmental protection technologies and reduce the production of CO2 and other pollutants in production and life. (2) Adjust the trade structure. In terms of export trade structure, actively promote the export of high value-added low-carbon industry products. Increase the proportion of service trade, give the service industry more capital investment and technical support, increase the added value of the service industry, and enhance the country’s service trade competitiveness. In terms of trade imports, support the import of polluting products and prohibit the import of foreign garbage and toxic products in order to reduce domestic CO2 emissions. (3) Speed the upgrading of the industrial structure and reduce the proportion of the secondary industry. On the one hand, the adjustment of PRC’s industrial structure is to improve the level of production technology and change the production methods of high energy consumption, low efficiency and low added value in traditional industries such as iron and steel, electricity, and petroleum. Traditional enterprises reduce production capacity through technological means. Another aspect is to increase efforts to establish high-end manufacturing, restrict or ban high-emission industries, and promote the development of low-carbon and environmentally-friendly enterprises. When focusing on issues of economic growth, focus on the “green effect” of economic growth. Emission reduction can be achieved through environmental governance focused on emission reduction targets while encouraging steady economic growth. Such an approach can increase urbanization, while implementing clean energy supply systems, provide a “green road” approach that speeds up the construction of green cities. This can lead to clean energy and the gradual reduction of fossil fuel dependence while optimizing the power grid such that clean energy can be used safely and efficiently. Advanced technologies can be introduced to gradually replace coal-based energy dependence along with a range of clean energy sources, such as solar and wind.
In terms of carbon finance, PRC should continue to promote the development of cooperation and linkage between the financial market and the carbon emission trading market, promote the innovation of various off-exchange and on-exchange derivatives based on CO2 emission rights. Promote financial institutions being active and secure participants in the carbon finance market. Build and enrich the participants in the carbon financial market. Develop carbon financial services such as the pledge of CO2 emission rights, carbon repurchase, carbon funds, and carbon trusts; and enhance the vitality of the carbon financial market. Specific suggestions are: (1) Improve the national carbon market system. First, we must strengthen laws and regulations on the carbon market. The “Interim Regulations on the Management of Carbon Emissions Trading” will be issued as soon as possible to improve the legislative level of PRC’s carbon trading regulations and systems and at the same time strengthen the carbon financial risk management and control mechanism and system construction to effectively curb speculation and avoid excessive market risk concentration and market manipulation. (2) Speed the construction of a national voluntary emissions reduction market for greenhouse gases. Complete the revision of the “Interim Measures for the Administration of Voluntary Greenhouse Gas Emission Reduction Transactions” as soon as possible and release them for implementation. At the same time, restore the CCER methodology, projects, emission reductions, verification and verification agencies, and transaction agencies to apply for filing and appropriately relax the verification and verification agencies for filing and conditions to alleviate the problem of insufficient supply of CCER. (3) Strengthen the cultivation of carbon intermediaries and investors. Encourage the development of “carbon investment banks”, “carbon audit institutions”, and various carbon intermediaries such as financing, investment, and services. Support large financial institutions to allow them to set up carbon finance functional departments or franchise agencies. and develop various types of carbon financial services. Preferential fiscal and taxation policies encourage and guide various carbon intermediaries to participate in the national carbon market business and jointly promote the development and construction of the national carbon market. Encourage local governments, financial institutions, investment institutions, etc. to set up carbon funds, carry out secondary market carbon product investment transactions, increase market activity, increase investment in emission reduction projects, forestry carbon sink projects, etc., and expand financing channels for owners. Accelerate the establishment of a national carbon market industry association, strengthen the self-discipline management of the intermediary industry, and introduce self-discipline rules and business guidelines for the carbon market to promote the standardized and healthy development of the national carbon market business. PRC carbon finance market has a low status in the world’s carbon market. PRC has no pricing power in global carbon market transactions. Once PRC national carbon trading market operates normally, it will become the world’s largest carbon market. Accelerate the pace of online trading on the national carbon trading market, and increase the scale and influence of PRC carbon trading market in the global carbon market. Under the premise of fair, common but differentiated responsibilities advocated by the Paris Agreement, PRC must cooperate with the world. Together, all countries adhere to multilateralism, firmly safeguard the global carbon trading mechanism that has been developed, and actively learn from the advanced experience of developed countries in the construction of carbon financial markets to build a carbon financial development system that meets national standards and has global influence.
In terms of urbanization: (1) Change the lifestyle of residents. In terms of consumption awareness, reduce the use of disposable products, give priority to purchasing energy-saving, environmentally-friendly and low-carbon products, strengthen the awareness of conservation, and eliminate waste and unreasonable consumption. In terms of travel, encourage public transportation + bicycle + walking, improve the public transportation system, open up the traffic microcirculation, realize intelligent travel information services, and gradually increase the proportion of electric and hybrid vehicles. In terms of home furnishing, promote personalized and intelligent home furnishings, adopt energy-saving and environmentally friendly home appliances, and improve the electrification level of end-use energy. In terms of housing, improve building energy efficiency standards, adopt advanced building envelopes and materials, strengthen natural ventilation and light utilization, implement differentiated designs from north to south, and reduce the use of glass curtain walls. (2) Improve urban energy supply methods. Promote the improvement of the city’s distributed integrated energy system. Select energy resources on the spot and adopt scientific energy installation ratios to maximize energy utilization and allocation efficiency. Provide a coordinated promotion of urban environmental governance while emphasizing that energy production is the new direction of urban renewal and urban energy development in PRC in the future. Through the integration of energy production, sewage treatment, garbage treatment and other municipal service facilities, implement energy supply projects. Prioritize urban pollution and waste by coordinating the use of local renewable energy sources such as wind, solar and geothermal energy. With fossil energy such as natural gas as the guarantee, coordinate the production and supply of terminal energy such as cold, heat, electricity, and gas to achieve multi-energy complementarity. (3) Optimize the urban development model. Accelerate urban renewal, optimize urban functions and layout, promote urban industrial upgrading, enhance cultural vitality and urban style, and build new smart cities. Develop job-housing balance, facilitate nearby work and travel, reduce urban congestion and environmental pollution, and improve residential areas. Intensify ecological environment governance, promote the industrial utilization of urban waste resources, promote the comprehensive utilization and recycling of various resources, and incorporate environmental governance and ecological protection into the urban planning and construction system. Construct ecological micro cycles to distribute, multimode, grid like features. Build a green and low-carbon micro cycle, achieve carbon neutrality in a small area, and reduce dependence on the city’s large-scale cycle.


