Article

Scalable IoT Architecture for Monitoring IEQ Conditions in Public and Private Buildings

by
Isidro Calvo
1,*,
Aitana Espin
1,*,
Jose Miguel Gil-García
2,
Pablo Fernández Bustamante
3,
Oscar Barambones
1,* and
Estibaliz Apiñaniz
4
1
System Engineering and Automation Department, Faculty of Engineering of Vitoria-Gasteiz, Basque Country University (UPV/EHU), 01006 Vitoria-Gasteiz, Spain
2
Department of Electronic Technology, Faculty of Engineering of Vitoria-Gasteiz, Basque Country University (UPV/EHU), 01006 Vitoria-Gasteiz, Spain
3
Department of Electrical Engineering, Faculty of Engineering of Vitoria-Gasteiz, Basque Country University (UPV/EHU), 01006 Vitoria-Gasteiz, Spain
4
Department of Applied Physics I, Faculty of Engineering of Vitoria-Gasteiz, Basque Country University (UPV/EHU), 01006 Vitoria-Gasteiz, Spain
*
Authors to whom correspondence should be addressed.
Energies 2022, 15(6), 2270; https://doi.org/10.3390/en15062270
Submission received: 4 March 2022 / Revised: 14 March 2022 / Accepted: 17 March 2022 / Published: 21 March 2022
(This article belongs to the Collection Featured Papers in Electrical Power and Energy System)

Abstract

:
This paper presents a scalable IoT architecture based on the edge–fog–cloud paradigm for monitoring the Indoor Environmental Quality (IEQ) parameters in public buildings. Nowadays, IEQ monitoring systems are becoming important for several reasons: (1) to ensure that temperature and humidity conditions are adequate, improving the comfort and productivity of the occupants; (2) to introduce actions to reduce energy consumption, contributing to achieving the Sustainable Development Goals (SDG); and (3) to guarantee the quality of the air—a key concern due to the COVID-19 worldwide pandemic. Two kinds of nodes compose the proposed architecture; these are the so-called: (1) smart IEQ sensor nodes, responsible for acquiring indoor environmental measures locally, and (2) the IEQ concentrators, responsible for collecting the data from smart sensor nodes distributed along the facilities. The IEQ concentrators are also responsible for configuring the acquisition system locally, logging the acquired local data, analyzing the information, and connecting to cloud applications. The presented architecture has been designed using low-cost open-source hardware and software—specifically, single board computers and microcontrollers such as Raspberry Pis and Arduino boards. WiFi and TCP/IP communication technologies were selected, since they are typically available in corporative buildings, benefiting from already available communication infrastructures. The application layer was implemented with MQTT. A prototype was built and deployed at the Faculty of Engineering of Vitoria-Gasteiz, University of the Basque Country (UPV/EHU), using the existing network infrastructure. This prototype allowed for collecting data within different academic scenarios. Finally, a smart sensor node was designed including low-cost sensors to measure temperature, humidity, eCO2, and VOC.

1. Introduction

Industry 4.0 brings shifts based on the introduction of modern technologies for increasing interconnectivity and smart automation [1]. Decentralized communication infrastructures, mainly those that are wireless, are increasingly adopted in these applications [2]. In this scenario, the Internet of Things (IoT) makes it possible to connect objects or things to the Internet, with the purpose of collecting data and controlling processes or machines remotely, by means of mesh structures that allow ubiquitous communications [3]. Indeed, the number of connected objects is increasing exponentially, reaching 20 billion connected “things” by 2020 [4]. These objects interact with each other, cooperating to achieve a goal. They are capable of generating large amounts of data, and it is necessary to create software that is capable of collecting the information from different locations to analyze them. The data rate grows about 40% each year [4], and it is not only the volume of data that increases, but also the speed and variety. Consequently, modern applications must deal with large amounts of data, which brings computational challenges for data storage, analysis, and visualization.
IoT systems are widely spread in very different fields. However, they have to meet various requirements: (1) dealing with heterogeneity, since different platforms are involved; (2) using resource-constrained devices, such as smart sensors; (3) applications that require spontaneous interaction; (4) ultra-large-scale networks and a large number of events; (5) dynamic network behavior requirements; (6) context-aware and location-aware applications; and (7) the need for distributed intelligence [5].
Currently, sustainability is gaining increasing importance and, consequently, society is becoming concerned about it. Sustainable development is based on three pillars: economic sustainability, environmental sustainability, and social sustainability. In September 2015, the 2030 UN Agenda for Sustainable Development was proposed, defining 17 Sustainable Development Goals (SDGs) that interlink the three aspects of sustainable development that were mentioned before [6].
The University of the Basque Country (UPV/EHU) launched an internal program, the Campus Bizia Lab (CBL), aimed at introducing the SDGs in the university. The present work, which is part of this initiative, addresses three specific SDGs: sustainable cities and communities, responsible consumption and production, and good health and well-being.
More specifically, this work aims at monitoring the environmental conditions at the university facilities to improve the sustainability of the buildings and well-being of the occupants. The problem that triggered this work was the detection of several thermal discomfort situations at the university facilities: On the one hand, some places were cold although the central heating system was on, requiring auxiliary electric radiators, which are less efficient. On the other hand, other locations were over-heated, so there was a consequent waste of energy as it was necessary to open the windows, which obviously has a bad effect on sustainability.
This is a common issue as nowadays, buildings utilize around 40% of global energy consumption and, consequently, there is a need for making these buildings more energy-efficient [7]. A combination of several approaches may help to detect and solve this problem, including better isolating materials, use of low-power appliances, and deployment of energy management systems. In this scenario, Indoor Environment Quality (IEQ) monitoring systems are necessary to detect energy-waste situations and contribute to developing solutions. Since this is a worldwide problem, it is important to achieve versatile and low-cost IEQ monitoring systems that are easy to implant in different buildings.
The problem of energy waste, typically found in offices and public buildings, was presented to the students of the B.Sc. Degree in Industrial Electronics and Automation Engineering for raising awareness about the SDGs, encouraging them to consider how they could contribute as future engineers to creating a more sustainable world by means of concrete activities. In particular, students developed a preliminary IEQ monitoring system based on IoT, which the instructors had simplified to just measure temperature values. This project was proposed as a Project Based Learning activity to the students [8]. These kinds of initiatives involve students from a perspective of learning through practice, making the entire scientific process more inclusive. For example, Andreotti et al. [9] present a metering hot box for analyzing insulation technologies at historic buildings, which was initially developed as an educational activity.
This work goes beyond, since it describes a full IoT scalable architecture aimed at monitoring indoor environmental quality inside public buildings, such as university faculties, which runs over existing communication infrastructures. The proposed system allows: (1) ensuring that temperature and humidity conditions are adequate, improving the comfort and productivity of the occupants; (2) introducing actions to avoid energy wasting, contributing to achieve the SDG; and (3) guaranteeing the quality of the air, a key concern with the COVID-19 worldwide pandemic. The proposed IEQ monitoring system, which may be adapted to monitor different environmental magnitudes, uses low-cost open-source hardware and software. A prototype for the proposed system was deployed at the Faculty of Engineering of Vitoria-Gasteiz to monitor the Indoor Air Quality (IAQ) by means of different low-cost sensors.
The presented system takes temperature and relative humidity measurements. These magnitudes allow detecting uncomfortable situations or locations in which energy is wasted. Later, it may be used to implement corrective actions aimed at guaranteeing the comfort of the University community while regulating the energy consumption, contributing to the sustainability of the buildings.
In addition, the quality of the air inside the facilities was monitored, as IAQ is directly related to human health. Actually, it has been found that exposure to high concentrations of air pollutants causes negative consequences in humans, from mild health issues such as a decrease in cognitive abilities and productivity [10], to more serious issues, including respiratory and cardiovascular illness, allergic symptoms, cancers, and premature mortality [11]. Moreover, due to the COVID-19 pandemic, air quality and constant ventilation are gaining importance in relation to preventing the spread of the virus in closed areas. For this aim, eCO2 and VOC were monitored. These measurements could help to decide when to take actions such as opening or closing the windows to increase ventilation [12].
The proposed monitoring system is based on the edge–fog–cloud paradigm [13]. This approach produces scalable and easily configurable architectures. This kind of architectures distribute the intelligence, computation, and storage in locations close to the source of data, but also provides connectivity to cloud services. This approach eases its deployment at university facilities or buildings with similar characteristics, such as office buildings or industrial facilities. These are places where people spend a great amount of their time, so it is very important to have good environmental conditions to improve their life quality.
The proposed system was deployed using the available communications infrastructure of the institution (UPV/EHU), avoiding the installation of ad hoc devices. Namely, the corporative WiFi is already deployed all over the facilities, covering almost every corner of the buildings. In order to separate the traffic originated by the IEQ monitoring system from the mainstream network traffic, caused by academic activity, a VLAN (Virtual Local Area Network) was used. At the application layer, the MQTT protocol was used due to its simplicity and the fact that this is one of the most popular protocols used at IoT systems. Low-cost open-source hardware was used; Arduino MKR WIFI 1010 boards powered with batteries were used as smart IEQ sensor nodes and a Raspberry Pi 3B+ was used as an IEQ Concentrator for collecting the data from all nodes. A PCB (Printed Circuit Board) was designed specifically to hold the selected low-cost sensors and Arduino boards. The achieved system is scalable, making it possible to have different amounts of nodes, with each node holding several sensors for measuring a broad number of variables. It is also remote-configurable since it is possible to change the configuration of the whole system directly from the central node.
The layout of the article is as follows. Section 2 summarizes related work. Section 3 describes in detail the design of the proposed architecture. Section 4 presents the validation of the prototype deployed at the Faculty of Engineering of Vitoria-Gasteiz and some measurements taken while in the validation process. Finally, some conclusions are drawn.

2. Related work

2.1. IEQ Monitoring Systems

During the last years, several works have presented different approaches aimed at evaluating the comfort in both residential and commercial buildings. The work in [14] presents a critical review of studies and investigated occupant comfort by means of environmental and non-environmental variables. Some studies collect subjective data related to how occupants perceive indoor environments, which is typically acquired via occupant satisfaction surveys [15]. However, most studies are based on IEQ parameters requiring IEQ monitoring systems, which measure physical environmental changes that can be quantified using diverse equipment.
Typically, IEQ consists of four major variables: air quality, thermal comfort, visual comfort, and acoustic comfort, and many different parameters have effects on each of them [10]. For air quality, the most measured parameters through the published studies are CO2, CO, PM10, PM2.5, and VOC [16]. The most common parameters for thermal comfort are temperature, relative humidity, and air currents, but clothing and physical activity also have great impact. Frequently, visual comfort is monitored by luminosity or light intensity, whereas acoustic comfort is evaluated by checking the noise level [10].
Some standards such as ASHRAE 55 [17], RESET Air [18], and ISO 7730 [19] define the appropriate range of values for these parameters. Table 1 summarizes those that apply to this work.
The monitoring of these parameters, especially CO2 and temperature, allows for adequately ventilating buildings, for example, by means of automatic ventilation systems that exchange low-quality air with fresh air, and this is key to reducing the spread of COVID-19 [12]. This problem is especially relevant in public buildings in winter since it is necessary to achieve a compromise between the indoors temperature and the quality of the air.
In this scenario, IEQ monitoring systems are essential for maintaining these parameters inside the accepted ranges. Moreover, this kind of system leads the way for implementing control actions such as controlling the heating system, ventilating the room, or purifying the air when necessary.
Much recent research about indoor environmental monitoring systems can be found in the literature. However, to date, all wireless gas sensor networks face a trade-off between sensor node cost and data quality because no suitable, low-cost technology for specific, quantitative chemical analysis is currently available [20]. Actually, the main obstacle is the current lack in suitable chemical analysis technologies to determine the concentration of gaseous air pollutants specifically and sensitively at low-cost, offering long-term, stable detection [21]. Some works explore the potential of electronic noses that make use of commodity gas sensors based on MOS and MEMS technologies. For example, TheOdor consists of two closed measuring boxes with sensors, each connected to and controlled by a Raspberry Pi [22].
The work in [23] discusses the possibilities of IoT systems for measuring some gases, as well as the major technologies available. This article summarizes different types of gas-sensors and communication technologies. For example, [24] presents a system that informs room occupants about bad air quality with ambient lights so that they take corrective actions. In this system, IEQ measures are taken with sensors attached to a Raspberry Pi. The work in [25] presents an indoor environmental system architecture with cloud connectivity that takes environmental measurements in public buildings by means of sensors directly attached to ZigBee nodes. Another IEQ monitoring system is presented in [21]. Their approach uses PSoC microcontrollers and Z-Wave communication technology. This system was tested in five rooms of a school. Similarly, a wireless sensor network, based on XBee technology, is proposed in [26] for monitoring air quality in a library. In [27], a wireless sensor network is used for measuring environmental data in open areas by positioning the nodes in different points of the city. Some works recommend the introduction of low-cost sensors for reducing the accumulation of CO2 in indoor environments in selected locations [28]. The actual worldwide COVID-19 pandemic has also led to indoor air quality monitoring studies like the one proposed in [11].
However, IEQ monitoring is not only useful for augmenting the comfort and health of the building occupants, but also for energy saving. By monitoring the environmental parameters of each room, it is possible to move from a centralized control of the heating system to individualized control of a room. This way, situations in which windows are open while the heating system is on can be avoided, saving huge quantities of energy while maintaining good environmental conditions and improving the sustainability objectives by taking concrete actions. In this direction, a wireless sensor network for controlling the air conditioning system is proposed in [29]. The energy performance along with the indoor environmental conditions of a university campus dormitory are analyzed in [30] by means of indoor environmental quality measurements. Also, Martin-Garín et al. [31] present a low-cost building monitoring system for different IEQ variables based on open-source platforms. In this case, data are stored on a flash memory card, but the authors do not provide much information about the communication technologies used; they only mention the use of WiFi technology to connect with the cloud.
Arduino-like boards have proven to be capable of being used as smart sensors. For example, [31,32,33] describe two setups for IEQ monitoring based on Arduino and XBee technology. Also, in [34], an Arduino-based system is presented for the measurement of several parameters involved in water quality. Some works use alternatives, for example the design presented in [31] is based on the ESP-8266 board, whereas an ad hoc PCB based on an Microchip ATmega328P is presented in [35].
The monitoring system presented in this paper is aimed at solving several of these issues, namely, reducing energy consumption, improving the comfort of the building occupants, and ensuring a healthy quality of air that can prevent students and staff from becoming infected with COVID-19.

2.2. Communication Technologies for IoT Applications

The number of connected devices is exponentially increasing within Industry 4.0 and Internet of Things (IoT) paradigms. These devices generate huge quantities of data that must be efficiently integrated by means of software applications. Moreover, these software applications must allow for the distributed collection of the measurements and be interoperable and scalable to introduce flexibility and reusability, in order to be used in different scenarios.
Some emerging technologies have been targeted for implementing cloud and fog computing IoT applications [36]. Recently, the introduction of these technologies and low-cost open-source hardware and software has allowed for the creation of affordable wireless monitoring systems. Since a distributed monitoring system requires a large amount of nodes, it is important that the cost of each node, as well as the energy consumption, is reduced. Many works based on low-cost devices can be found in the literature. Typically, they include single-board computers (SBC), such as Raspberry Pi, or low-cost smart sensors [22,24,37]. Some works, such as [38,39], are aimed at building low-cost systems for monitoring and eventually controlling microgrid systems. Other systems allow measuring relevant meteorological variables and acquiring photovoltaic data directly from the plants [40]. Similar approaches can be found for assessing hygrothermal conditions in historic buildings by means of different communication technologies [9,41].
Regarding communication technologies for Wireless Sensor Networks (WSN), the most typical technologies are Bluetooth, ZigBee, and WiFi. Bluetooth Low Energy (BLE) was created for expanding the use of Bluetooth to IoT applications, as it consumes less energy and is able to work with battery-powered elements. Many monitoring systems use this technology [42,43,44]. However, BLE requires the use of gateways for the transmission of the data in large networks, since it has a limited coverage. ZigBee also consumes very little energy and, consequently, it is a technology frequently used in monitoring systems [25,26,45,46], but it requires additional gateways for recollecting the data and sending it to the Internet. In addition, they require forming a mesh network with router nodes to cover large areas. Other works use Z-Wave technology, for example, [21] presents a smart node for sensing temperature, humidity, and CO2 concentration. Some approaches use a combination of several technologies, as in [47], which combines ZigBee, WiFi, and MQTT for building IoT applications.
Since WiFi infrastructure is already deployed in most corporative buildings, it is an interesting alternative for these kinds of systems. Even though it consumes more energy than other options, it does not require any extra inversion and is therefore a low-cost infrastructure. For this reason, many studies use this technology [48,49,50].
Several messaging application protocols aimed at IoT applications exist, and a comprehensive review is presented in [51]. The most common are MQTT (Message Queuing Telemetry Transport), CoAP (Constrained Application Protocol), AMQP (Advanced Message Queuing Protocol), HTTP (Hyper Text Transfer Protocol), XMPP (Extensible Messaging and Presence Protocol), and DDS (Data Distribution Service). MQTT and CoAP were specifically created for data recollecting applications. AMQP was created for quick and secure commercial transactions and HTTP for web applications that communicate through the Internet [52]. XMPP was created for solving heterogeneity problems on IoT applications and DDS for real-time messages [53]. XMPP and DDS are used for high performance applications that require with very strict QoS requirements, such as smart grids [54] or factory automation [55], and they are more complex to use than other alternatives. Finally, AMQP and HTTP were not created for IoT applications, and they use bigger message sizes, requiring more energy consumption and bigger latency than MQTT and CoAP [52].
MQTT and CoAP have similar characteristics in terms of message size and overhead, energy consumption and resource requirements, and bandwidth and latency. In these respects, CoAP is somewhat lighter than MQTT due to the fact that it uses UDP instead of TCP. However, MQTT is more reliable than CoAP, and this fact makes it more adequate. Finally, MQTT is also one of the simplest protocols available for creating this kind of application. For these reasons, MQTT has become the most popular and widespread IoT protocol for Machine-to-Machine (M2M) applications [56]. Actually, most IEQ monitoring systems found in the literature tend to use MQTT [37,49,57,58,59].
Several remote IEQ monitoring commercial systems can be found on the market [60,61,62]. However, the proposed solution is an open solution based on free open-source hardware and software. Thus, the source code may be easily adapted to alternative scenarios involving different measured values [63]. The selection of the technologies ensures high interoperability and scalability. Actually, new magnitudes could be easily added using different types of sensors: analogue, digital (by means of the SPI or I2C sensor buses). Besides, the existing university WiFi infrastructure was used through a private VLAN and MQTT communications.

3. Scalable IoT Architecture for IEQ Systems

This section describes in detail an IoT architecture for monitoring IEQ conditions. Namely, it describes an architecture that follows the edge–fog–cloud computing paradigm [3]. The hierarchical and collaborative edge–fog–cloud architectures provide tremendous benefits as they enable the distribution of intelligence and computation to achieve an optimal solution while satisfying the given constraints, e.g., delay energy tradeoff [13]. In edge and fog paradigms, computing and storage resources are located near the source of data, but these devices may also connect with cloud services. This approach produces diverse benefits such as scalability, ubiquity, reliability, and high-performance, among others.
The proposed architecture adapts the edge–fog–cloud paradigm to be used for monitoring IEQ conditions in wide buildings where there is WiFi infrastructure already deployed, which is quite common in public or private buildings.

3.1. Architecture Overview

This architecture has two types of nodes, the so-called smart IEQ sensor nodes, which are responsible for monitoring the measured variables next to their location, and the so-called IEQ concentrators, which are responsible for logging and analyzing the data acquired by a group of smart IEQ sensor nodes. The IEQ concentrator also provides connectivity to different cloud services such as data storage and analytics, visualization, or even usage predictions based on weather forecast.
Nowadays, these nodes may be implemented by means of low-cost open-source hardware such as single board computers as IEQ concentrators, e.g., Raspberry Pi, and single board microcontrollers as smart IEQ sensor nodes, e.g., Arduino or ESP8266 boards.
Figure 1 depicts the implementation of the proposed three-tier architecture. At the bottom, the edge layer, are the Smart IEQ sensors nodes, which are responsible for acquiring local values of the IEQ monitored variables such as temperature, humidity, concentration of diverse components such as CO2 or VOC components. In the middle, at the fog layer, are the IEQ Concentrators, which are responsible for collecting the values from a group of smart IEQ sensor nodes located in an area. These components are also responsible for configuring the smart sensors in one area, as well as providing local storage and basic data visualization. IEQ Concentrators are connected to cloud services located at the top layer for different tasks, including global time, data storage and analytics, visualization, weather forecast predictions aimed at reducing energy consumption, and so on.
Wireless technologies were used to implement the communication between the smart IEQ sensors and the IEQ Concentrator. This approach allows reaching almost every corner of buildings with WiFi coverage, which commonly reaches everywhere in public and private buildings. The MQTT protocol was used on top of TCP/IP since this is a versatile and easy-to-use alternative typically used for creating non-critical IoT applications. In addition, the use of the MQTT protocol allows us to adequately scale the IEQ monitoring system to different layouts and sizes.
This proposed architecture allows for implementing a set of functionalities, which are described below:
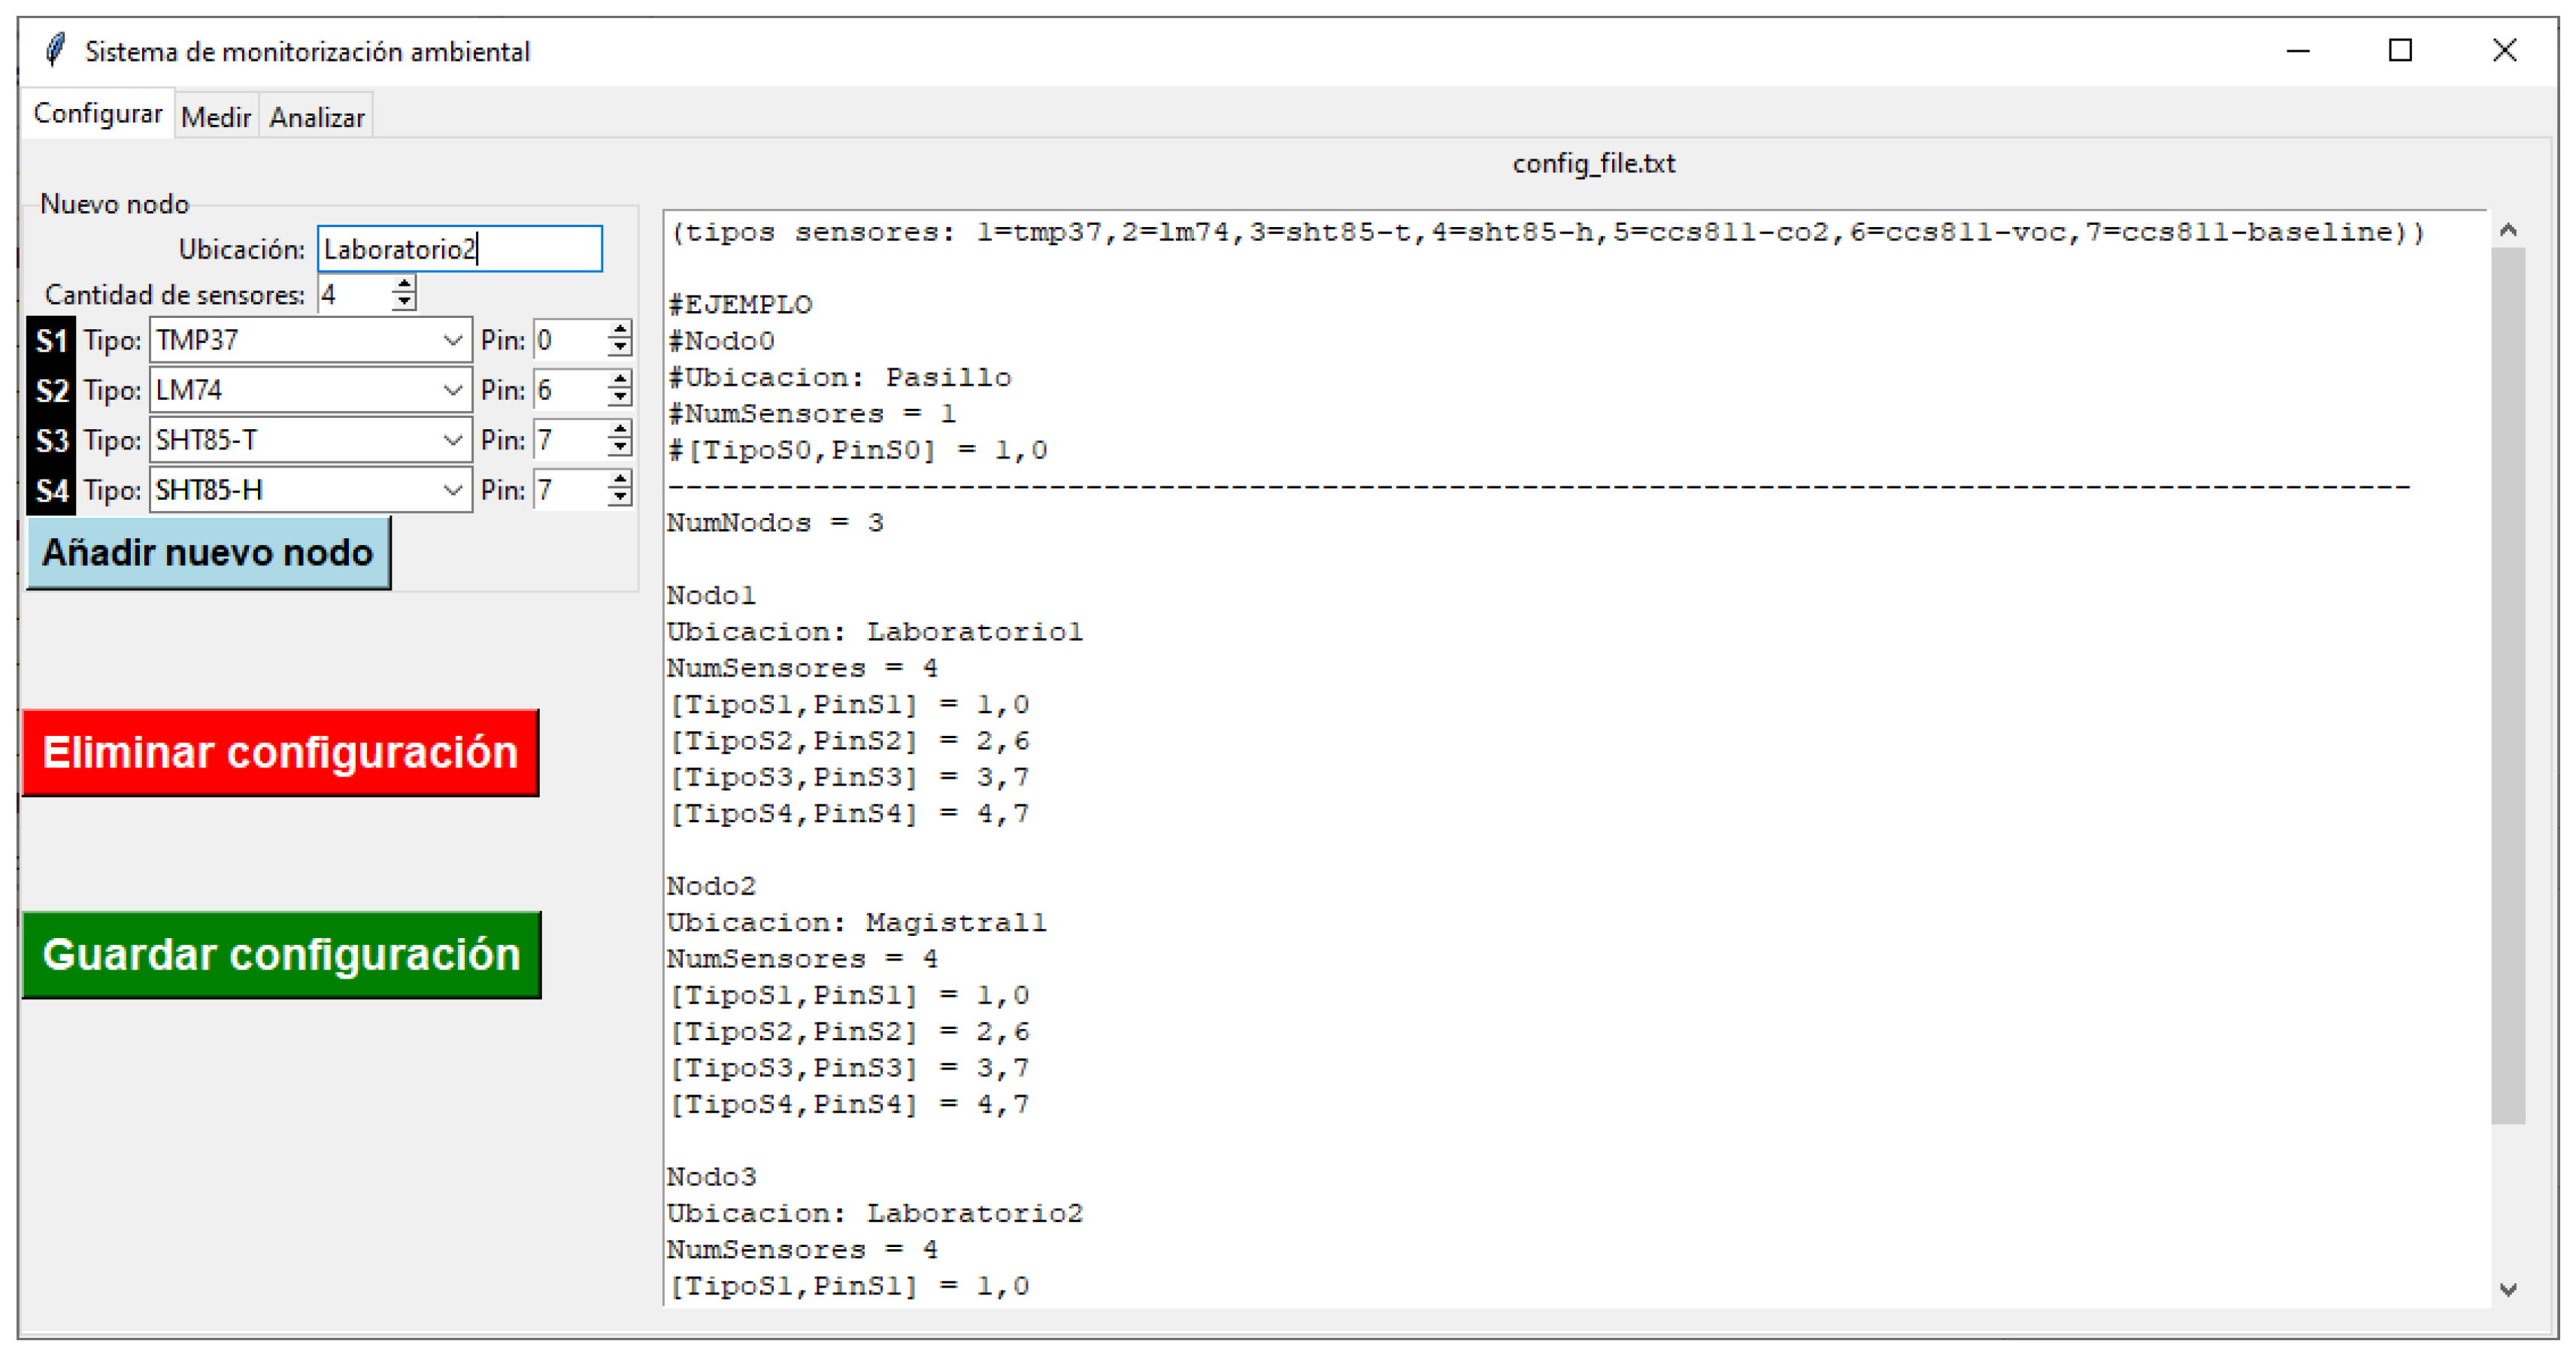
  • Centralized configuration: The configuration of the whole IEQ monitoring system is centralized at the cloud. However, IEQ Concentrators hold the local configuration of a set of smart IEQ sensor nodes. This approach introduces higher flexibility for changing the configuration of the smart IEQ sensor nodes since it is not necessary to reprogram them. In addition, it is possible to check the integrity of the IEQ monitoring system before its operation. At powering-up time, smart IEQ sensor nodes send a message that includes their identifier to the closest IEQ Concentrator, requesting configuration. Upon reception of the configuration, smart IEQ sensor nodes self-configure accordingly. The configuration of every smart sensor includes several parameters including location, quantity of attached sensors, and the characteristics of all specific sensors connected.
  • Variable sampling times: IEQ Concentrators use a local clock to interrogate IEQ sensor nodes accordingly. This clock is synchronized for all devices in the IEQ monitoring system (cloud and fog layers) by means of the NTP protocol, executed at the cloud. The proposed approach is adequate for sampling times in the range of minutes, which the authors consider adequate for IEQ monitoring systems since IEQ variables do not change abruptly. The IEQ Concentrators are responsible for sending MQTT messages to the smart IEQ sensors, indicating when they have to take the measures of the IEQ variables. Thus, upon reception of the corresponding MQTT topic, the smart IEQ sensor nodes take new measurements from the attached sensors and send the captured values to the next IEQ Concentrator by means of MQTT topics. This approach allows for synchronizing of the measures taken at different areas of the building, even when several IEQ Concentrators are in operation. In addition, it is possible to dynamically change the sampling time while the system is in operation, if necessary.
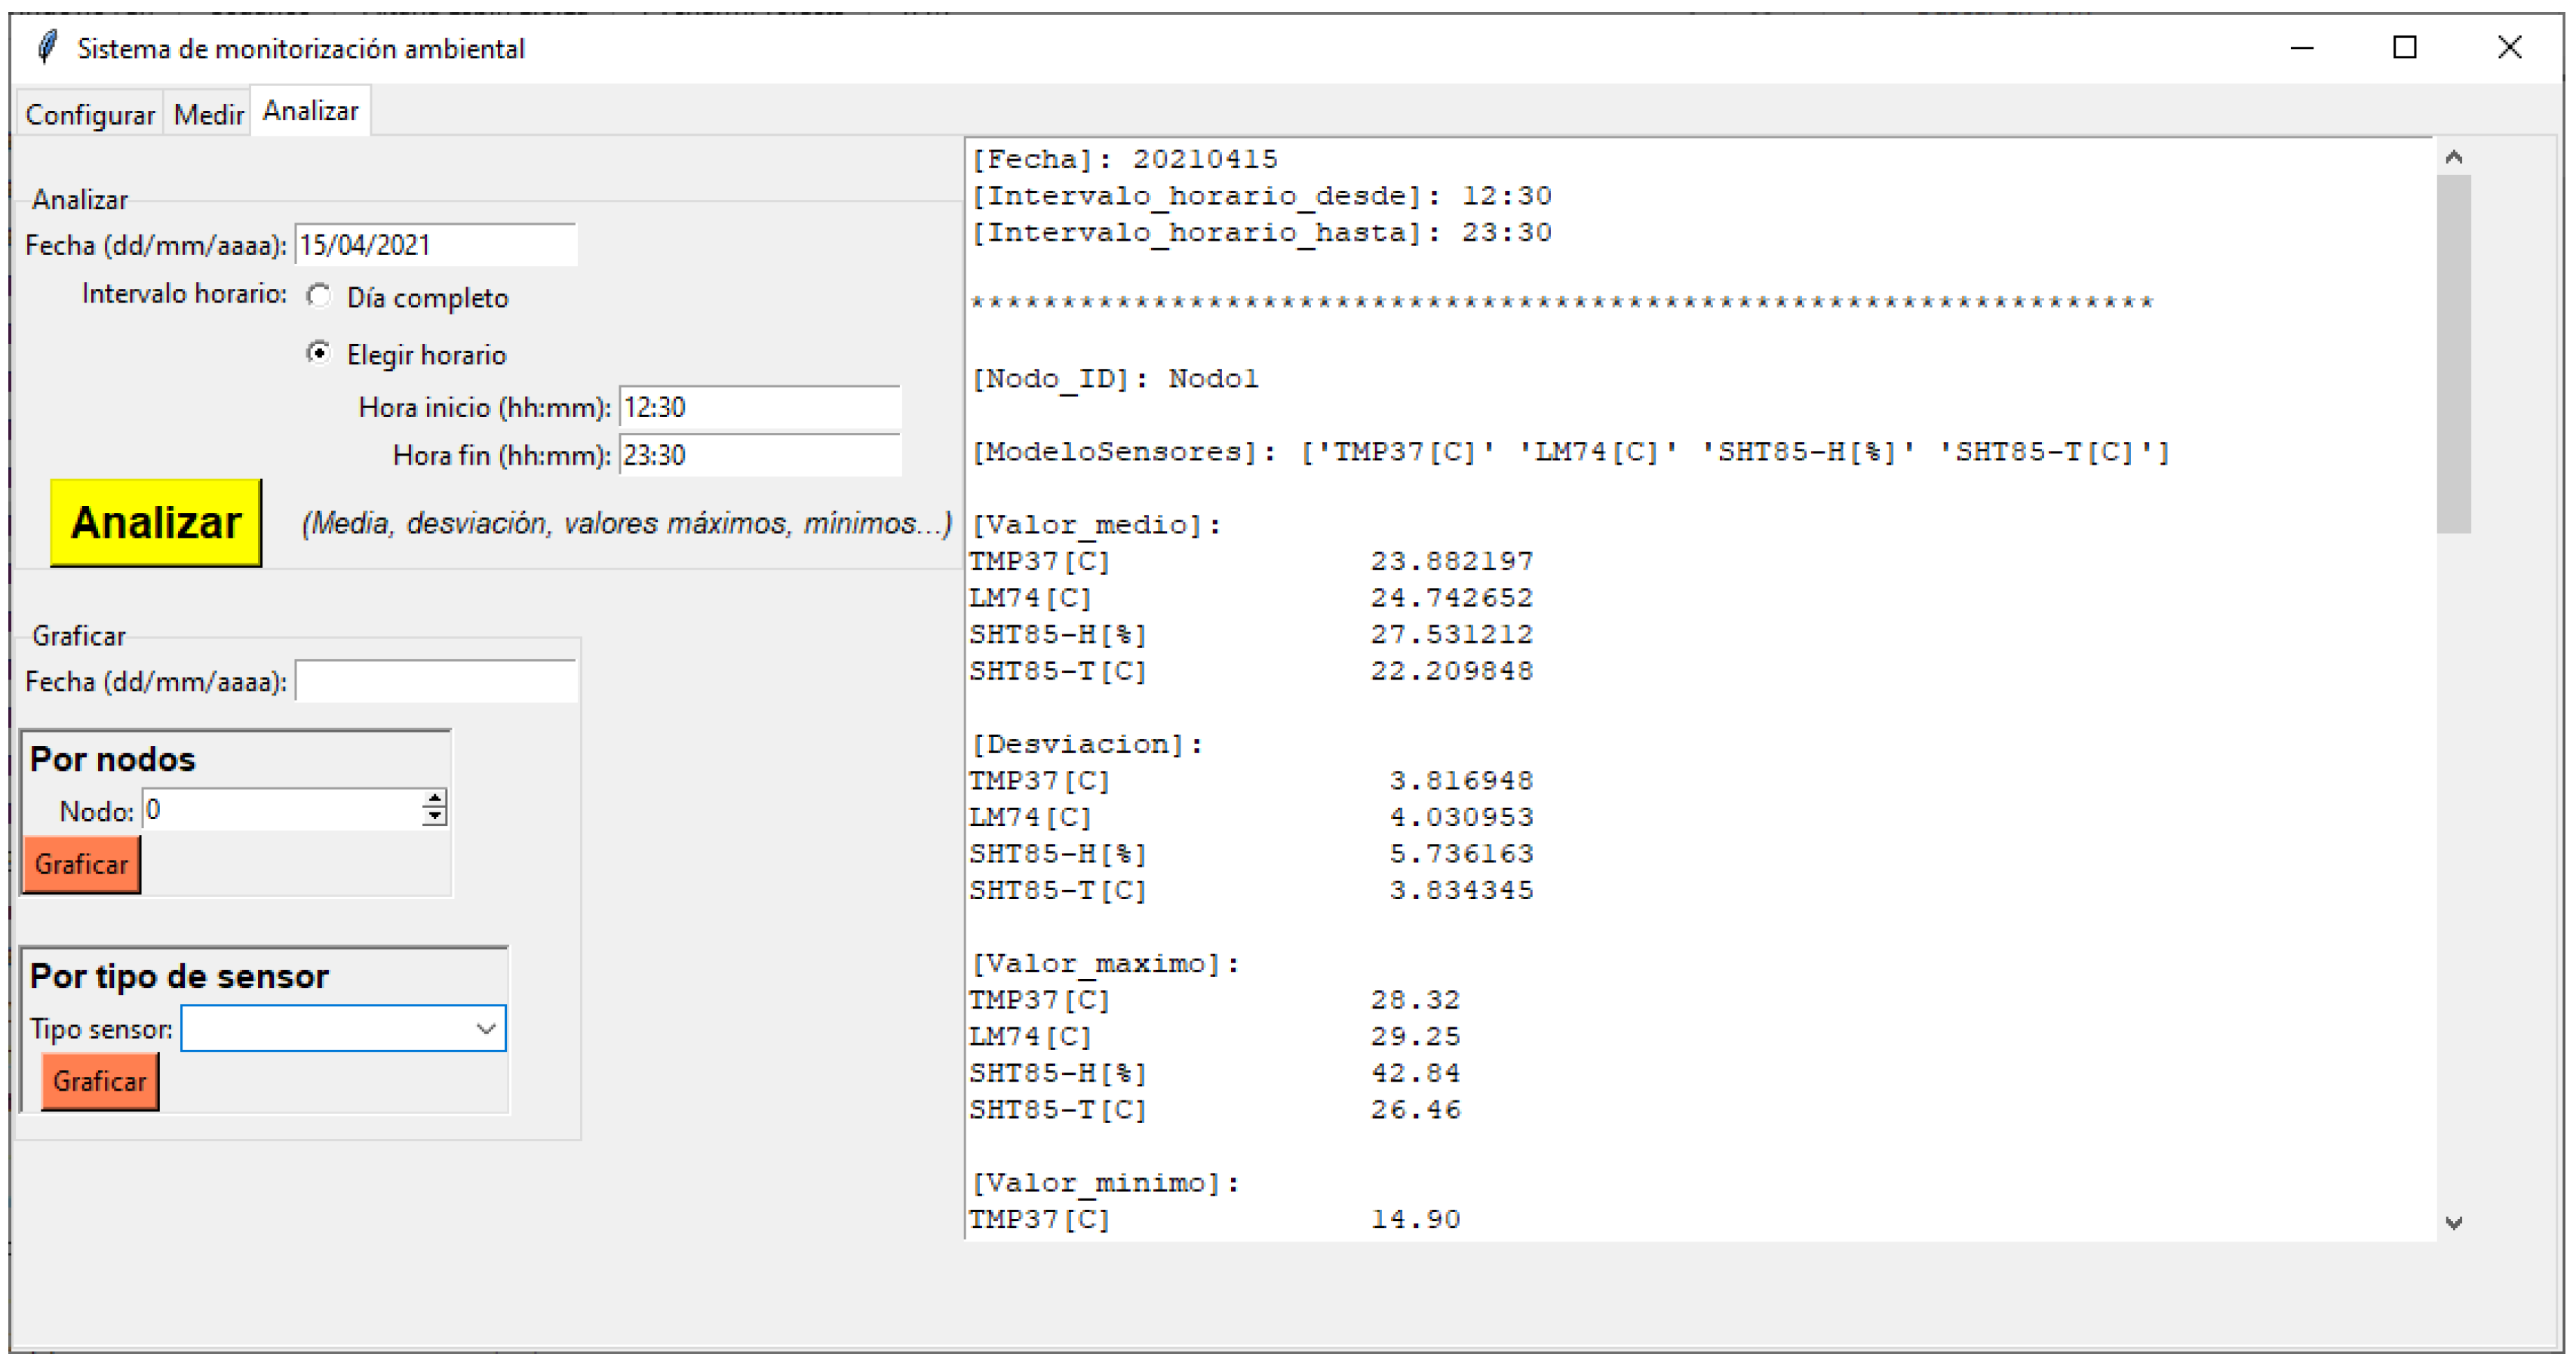
  • Local collection of data: The IEQ concentrator collects the data for on-line and off-line analysis from the attached smart IEQ sensor nodes. These nodes hold the selected sensors for measuring the IEQ parameters. Collected data are stored locally at the IEQ concentrator, which is responsible for sending them periodically to the cloud, where they are stored and analyzed for different purposes. IEQ concentrators allow both on-line and off-line basic analysis of the captured data, by means of an HMI application. This application allows different operations such as plotting the data of selected sensors, the calculation of typical values such as maximum, minimum, and mean values and standard deviations, and the percentage of valid measurements of each node and sensor for a selected day or time period.
  • Cloud services: IEQ concentrators act as gateways between fog and cloud services, by means of MQTT connectivity. Typically, the adoption of edge and fog paradigms allow dealing with the massive amounts of raw data of IoT applications. Cloud services allow for scaling the IEQ monitoring system to reach every corner of very large buildings or areas, such as a whole campus, centralizing all the information. This layer is composed by different services, e.g., the global time for all devices at the system, data storage for all devices, advanced data analytics and visualization, and usage recommendations for IEQ resources based on weather forecast and measured parameters, such as opening/closing the windows for better ventilation or switching off the heaters. Finally, these services are responsible for sending alarm messages to operators if the measured values are out of the specified bounds.

3.2. Communication Technologies

Since the system must cover whole buildings, such as a faculty or even several buildings on one campus, the distances among the smart IEQ sensor nodes used for acquiring the monitored variables may become quite large. For that reason, it would not be possible to connect the devices via Bluetooth without using gateways. Using Zigbee, or a combination of technologies, as in [47], would probably have also been adequate, but the final decision was to choose WiFi technology. This alternative requires a lower inversion since in public and private buildings, as in faculty facilities, it is typically deployed to reach every corner of the buildings. Moreover, it is recommended to use a VLAN (Virtual Local Area Network) intranet to separate the IEQ monitoring traffic from mainstream Internet traffic. Thus, the VLAN network allows IEQ concentrators to collect the values acquired by the smart IEQ sensor nodes. These nodes may use a different connection to access the cloud services located on the Internet. In addition, the use of this VLAN improves the security of the IEQ monitoring system as only restricted devices may connect to the network.
As shown in Figure 1, MQTT is used between the edge and fog layers for establishing the connectivity among the smart IEQ sensor nodes and the IEQ concentrators and also between the fog and cloud layers, to connect the IEQ concentrators with cloud services. This protocol was chosen due to its good performance in non-time-critical applications (such as IEQ systems) with small size messages. Also, it was considered as easy to use in IoT applications. Actually, MQTT is the most common communication choice for building M2M IoT applications [55].
The MQTT protocol runs over TCP/IP and follows the publish/subscribe paradigm. The use of the TCP protocol ensures that messages arrive correctly and in the same order that they were sent. It provides connectivity among several devices by means of a MQTT broker. Some applications publish messages, delivered to the broker by means of a topic. The broker is responsible for sending the messages to all applications that are subscribed to that specific topic. Moreover, topics can be divided into subtopics and the subscription to the entire topic or only a subtopic is possible. It is convenient to use fixed IP addresses to identify every device in the IEQ system.
Table 2 summarizes the protocol stack used at the proposed architecture, with IEEE802.11 as the standard for WiFi technology and IEEE802.1Q as the standard for VLAN.

Message Model at the Edge/Fog Layer

Figure 2 summarizes the MQTT topics used for connecting IEQ concentrators with the smart IEQ sensor nodes. The IEQ concentrator holds the MQTT broker for connecting all IEQ sensor nodes in the area. Note that published topics are shown in orange, whereas subscribed topics are shown in blue. These topics are associated with the following operations:
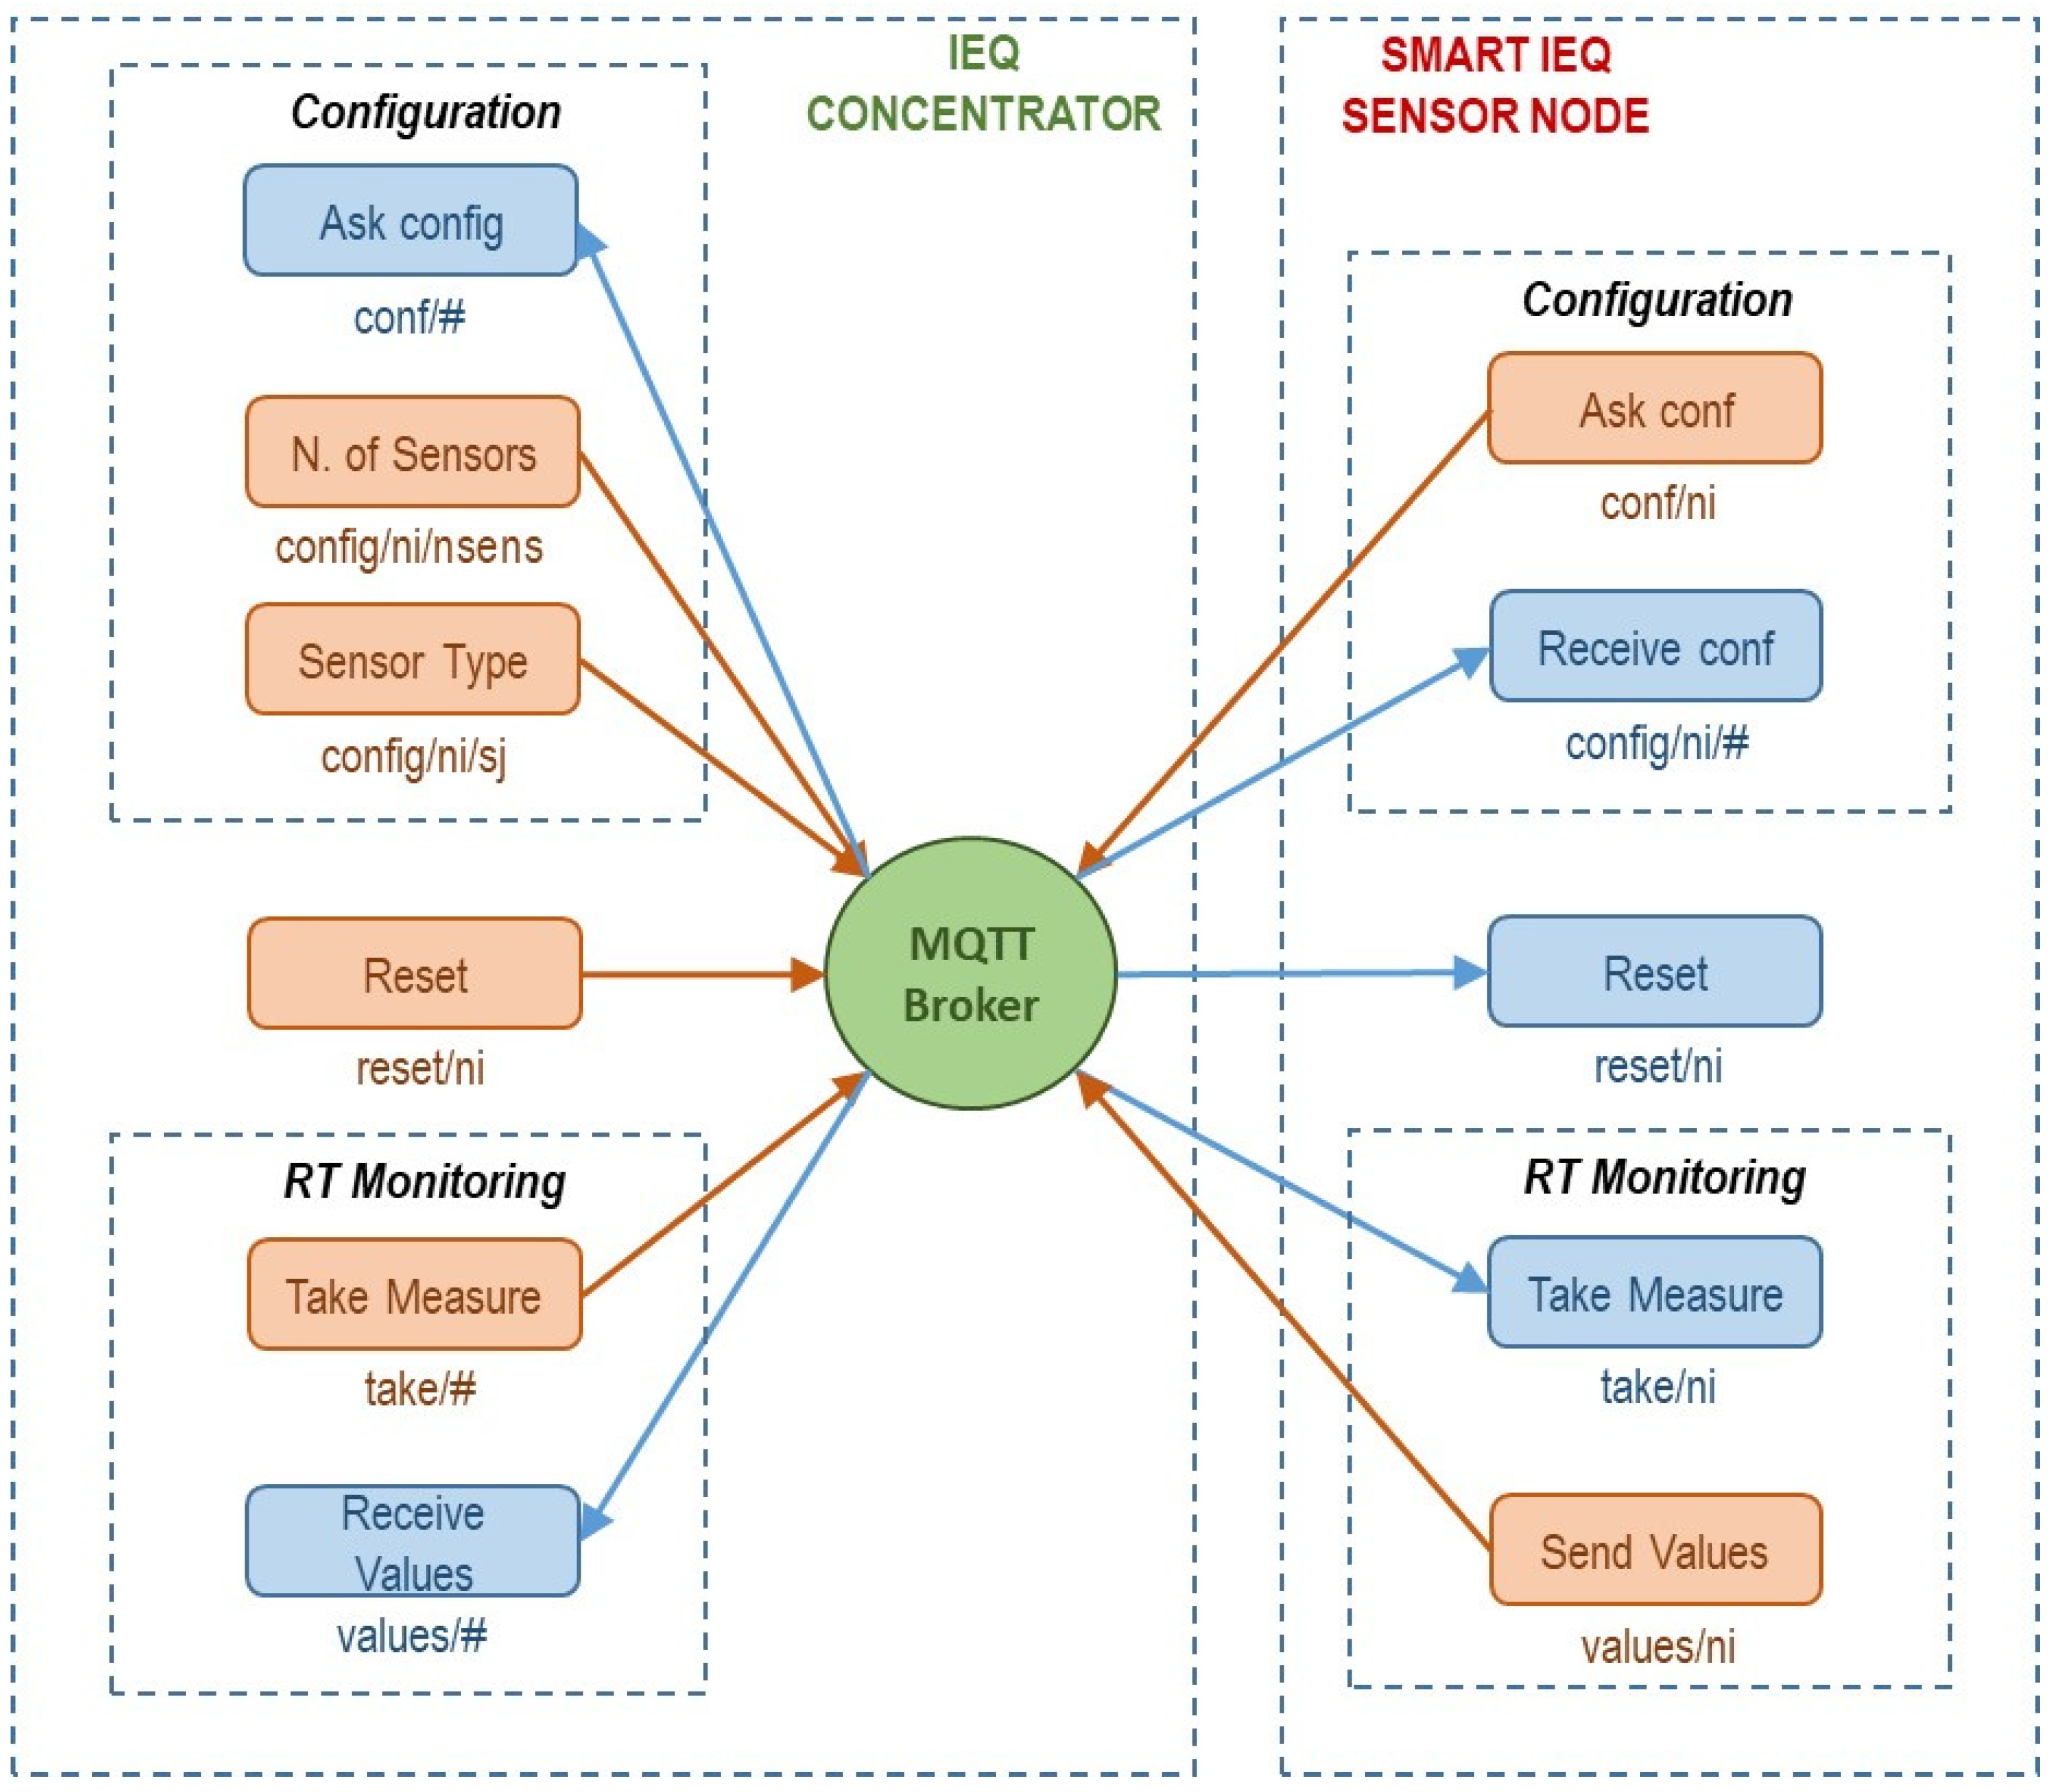
  • Configuration of smart IEQ sensor nodes: The configuration of one smart IEQ node is initiated at startup time, which requests its configuration by means of a topic, conf/ni, where i represents the node identifier number, fixed for every IEQ sensor node. Upon the reception of this topic, the IEQ concentrator sends the available configuration for that specific node. Smart IEQ sensor nodes have specific sensors attached in different layouts. So, the IEQ concentrator sends the configuration for a specific node by means of several published topics; the config/ni/nsens topic indicates the number of attached sensors, whereas the specific configuration for each sensor is sent by the config/ni/sj topic, which specifies the type of sensor attached to the pin j in the node i. These topics are received by the smart IEQ sensor nodes, which self-configure accordingly.
  • Reset of one/all IEQ sensor nodes: Occasionally, several issues may induce operating problems at the IEQ monitoring system. For this reason, the authors designed a procedure for resetting one or all attached sensors. This operation is initiated by the IEQ concentrator when it detects one of these problems. The reset/ni topic, published by the concentrator, is received by one specific smart IEQ node, triggering the reset procedure. The reset/all topic was also included to simultaneously reset all connected smart IEQ nodes.
  • Monitoring IEQ sensor nodes: The IEQ concentrator holds the local clock and is responsible for monitoring the IEQ variables periodically according to the specified configuration. The IEQ concentrator publishes the MQTT take/# topic to indicate to all smart IEQ sensors to take measures of all the attached sensors according to their configuration. This approach allows for simultaneously taking the measures at all distributed IEQ nodes. Since IEQ parameters change slowly, monitoring periods in the range of minutes may be adequate. Smart IEQ nodes send the IEQ values taken by publishing the corresponding values/ni topics, where i is the number identifier for every node. The IEQ concentrator subscribes to all the topics published by the connected smart IEQ sensor nodes.

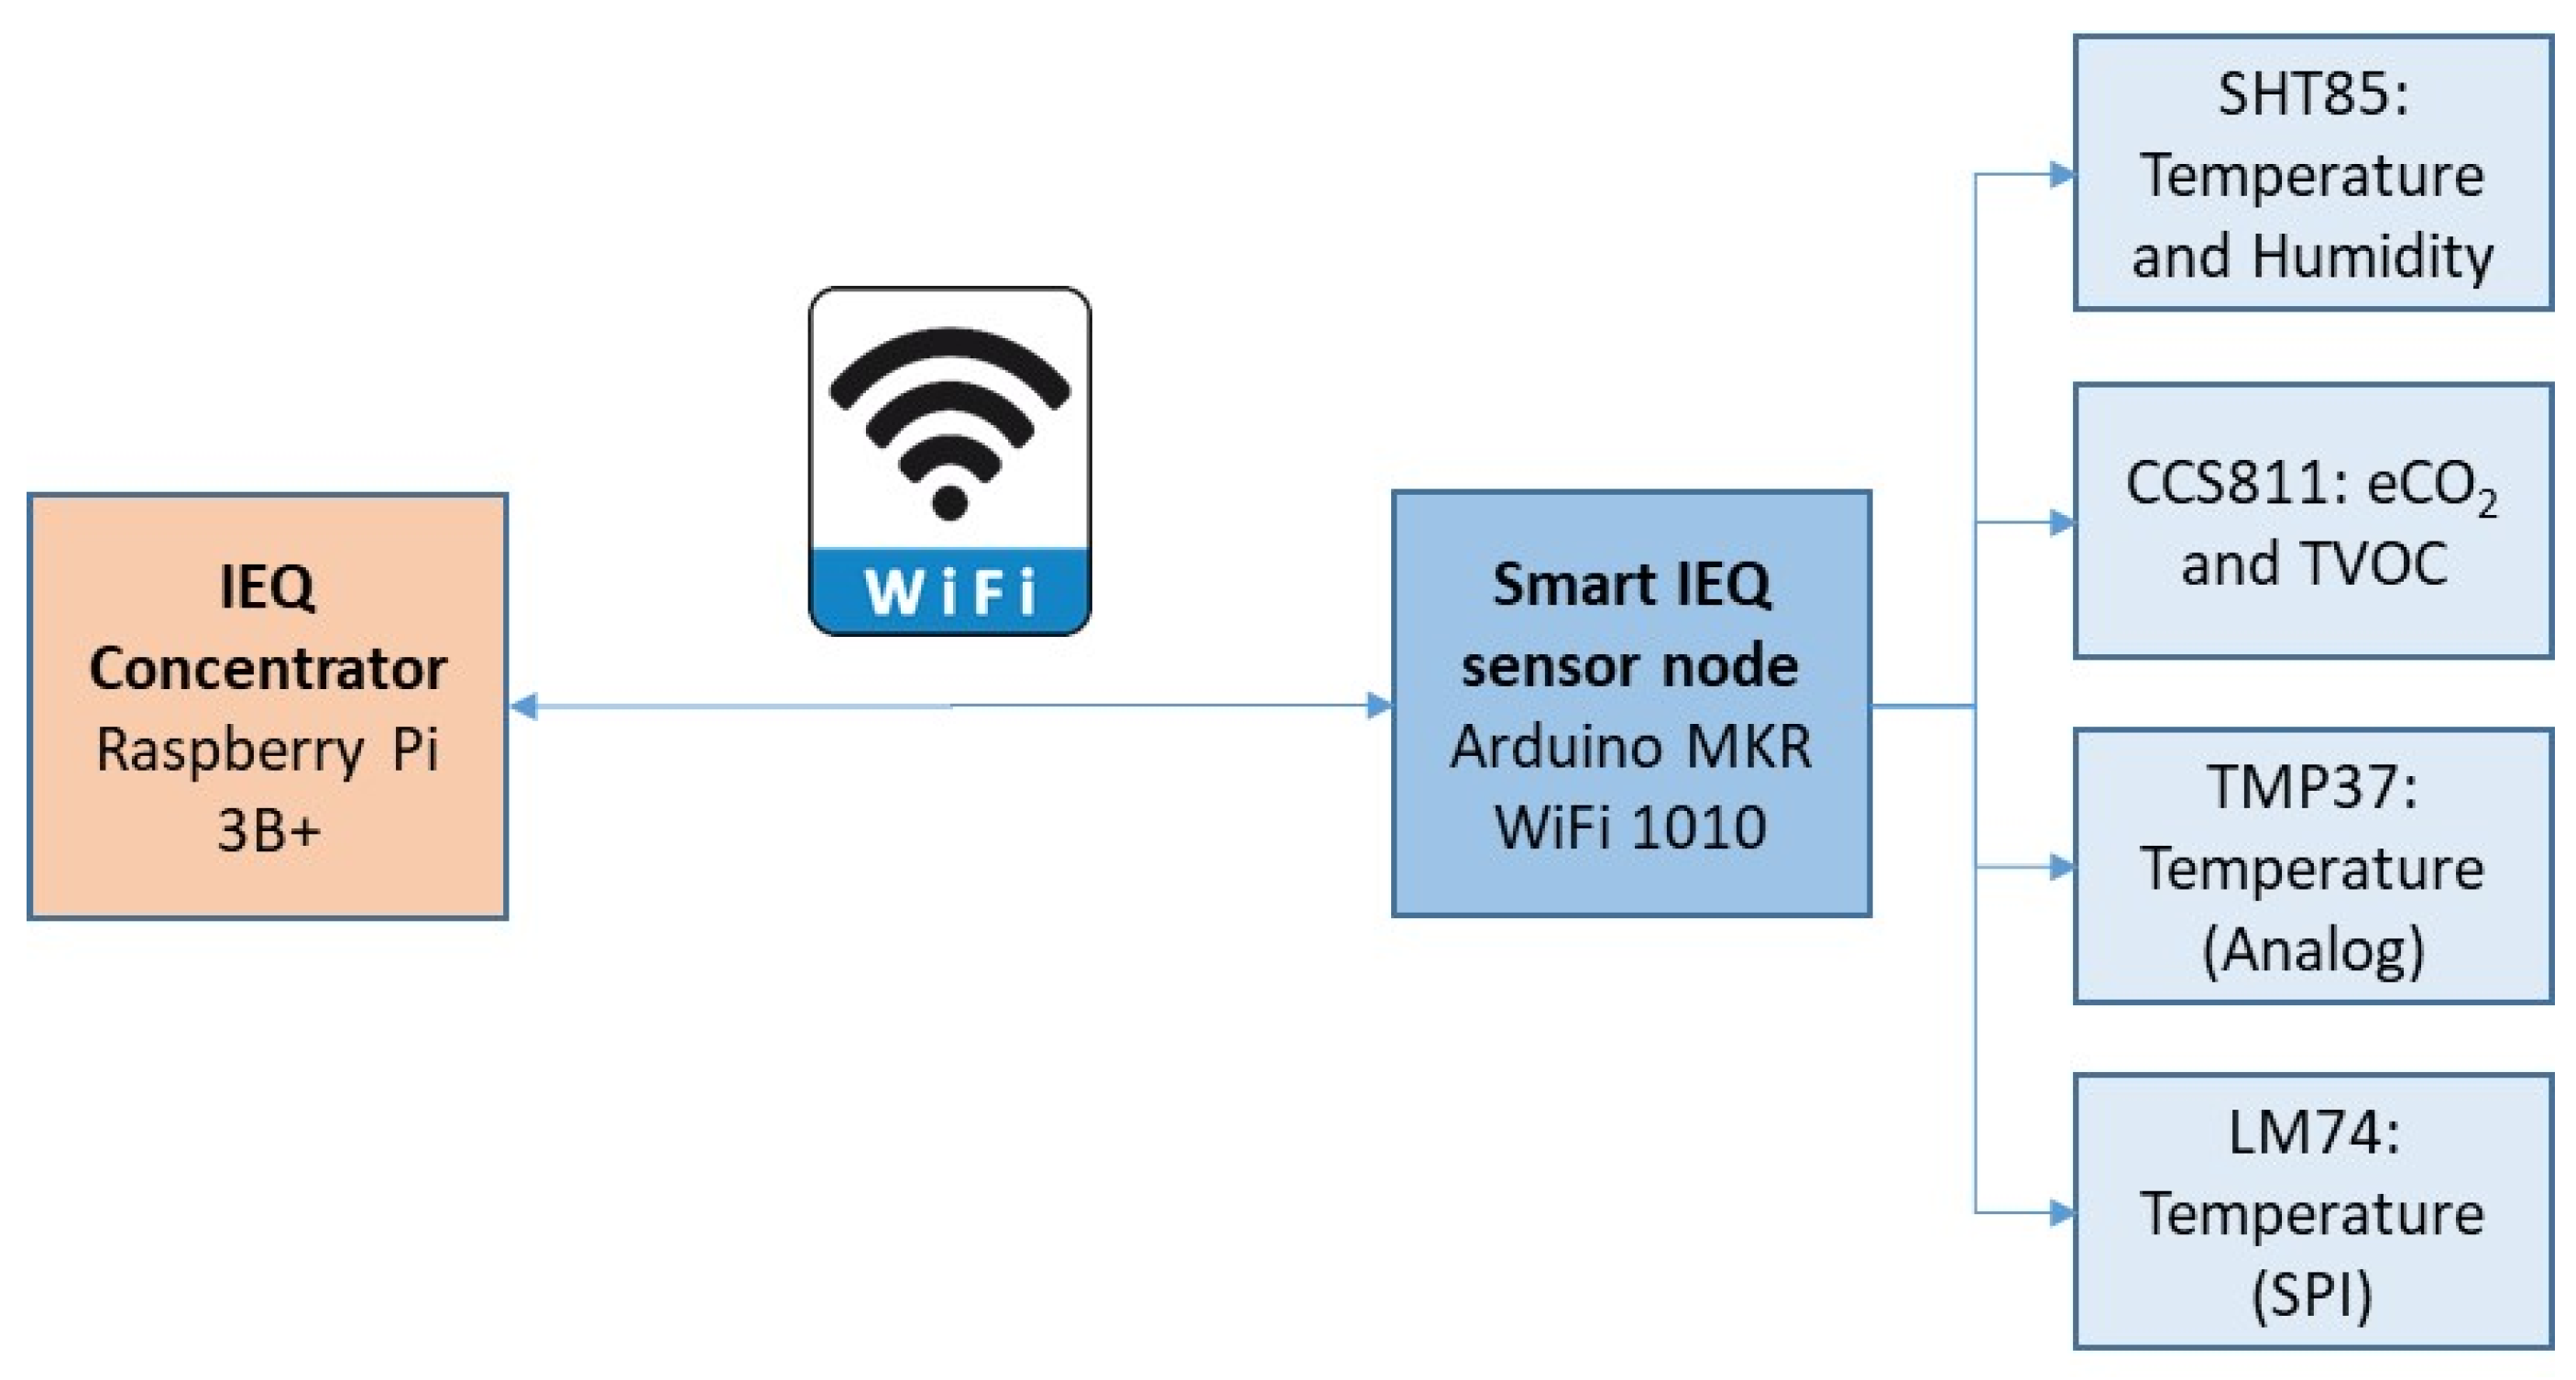
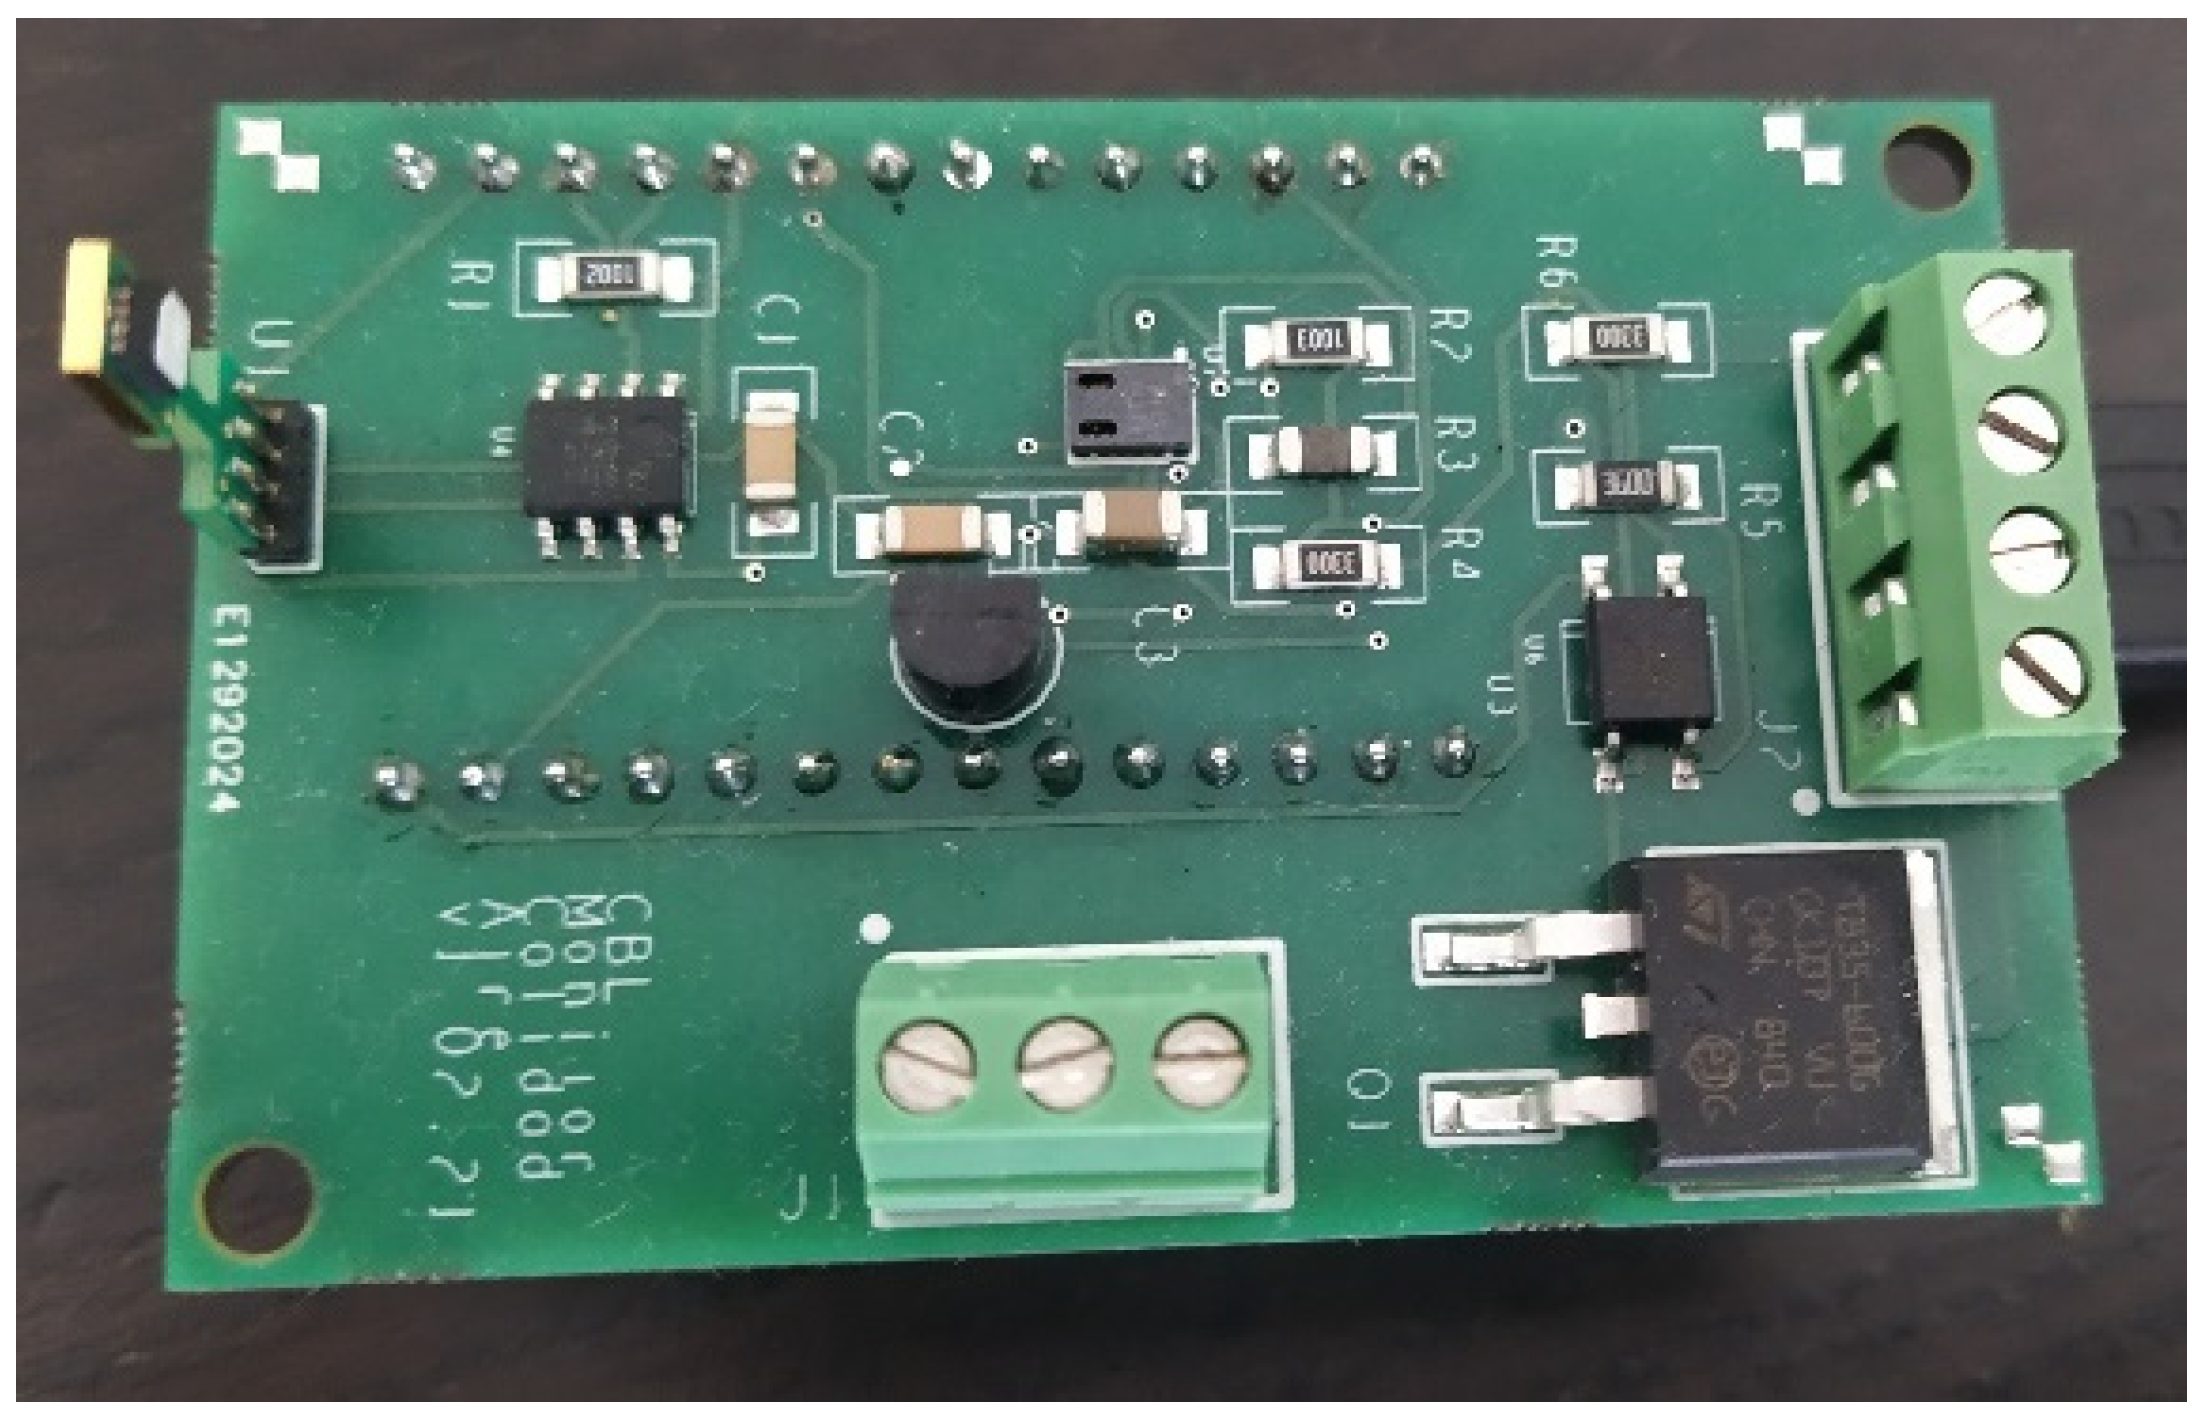
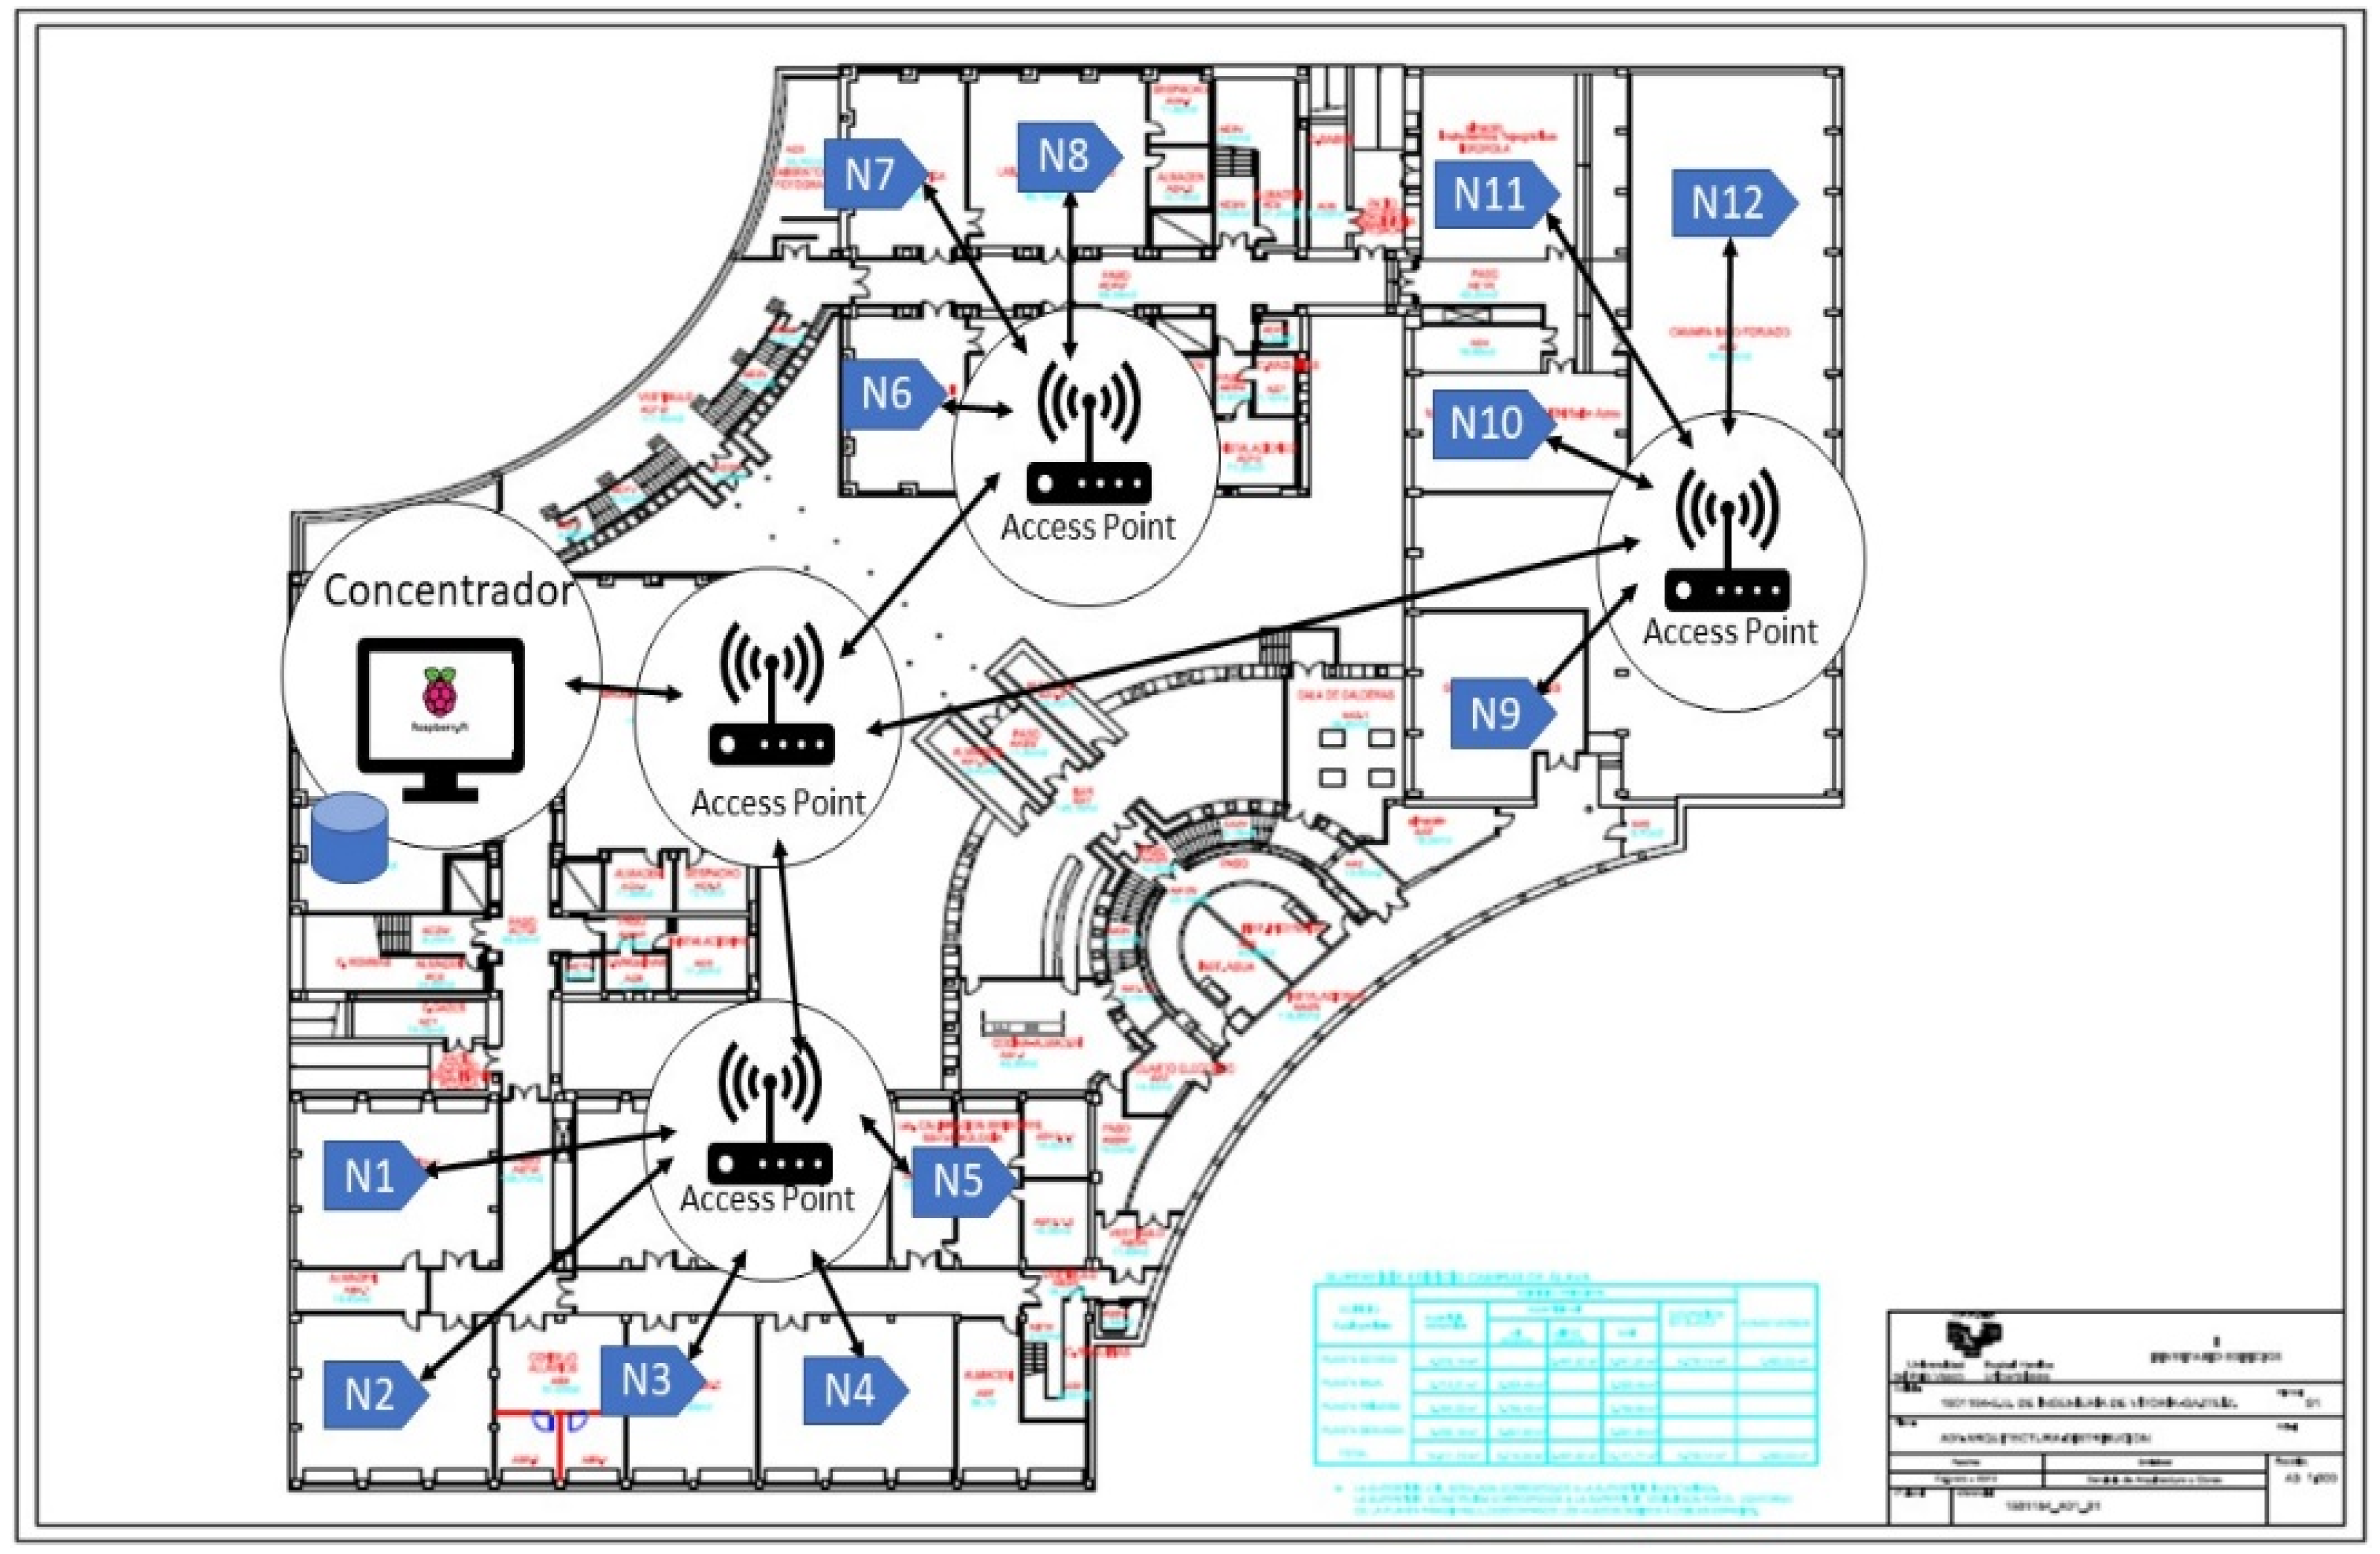
3.3. Prototype of the IEQ Monitoring System

A prototype for the IEQ monitoring system was implemented with low-cost open-source hardware. This prototype addresses the edge and fog layers. Namely, a single board computer was used as IEQ Coordinator. The design of the Smart IEQ sensor nodes was based on microcontrollers that acquire the data from the selected sensors, preprocess them, and send the data to the IEQ Coordinator by means of the protocols shown in Table 1. The authors also designed a Printed Circuit Board (PCB), which integrates the microcontroller with the selected sensors in a compact way.
In the prototype, the IEQ concentrator was implemented with a Raspberry Pi 3B+ with a 32 GB SD card that had the Raspberry Pi OS operating system preinstalled. This node stores the collected data locally for further analysis of text files on the SD card.
The IEQ concentrator is always connected to the power supply for higher availability. The use of WiFi connectivity allows deploying all nodes anywhere in the faculty premises for acquiring the IEQ measurements with WiFi coverage. Thus, the number of smart IEQ sensor nodes connected to the IEQ monitoring system can be easily scaled. In this prototype, the smart IEQ sensor nodes are supplied with commercial USB power banks to improve the autonomy of the nodes. In order to reduce energy consumption, smart sensors are asleep between measurements.
This prototype is aimed at monitoring the IEQ parameters at several locations such as classrooms, laboratories, and other common spaces found at the university faculty. The core of the smart IEQ sensor nodes is a microcontroller unit, which is responsible for preprocessing the sensor measurements and sending them to the IEQ coordinator. In particular, an Arduino MKR WiFi 1010 board was used since it already embeds WiFi technology and provides enough computing capability for acquiring and preprocessing the acquired values of the sensors. In addition, this platform is not complex to program. The quantity and types of sensors is configurable, and it may vary depending on the node. Figure 3 shows the hardware diagram for the IEQ monitoring system prototype. This figure shows only one smart IEQ sensor node connected to the IEQ concentrator.
The parameters measured in the monitoring system prototype are: temperature (°C), relative humidity (%), eCO2 (ppm), and TVOC (ppb). Temperature and relative humidity provide information for thermal comfort. These are the key parameters to compare with the energy spending in order to balance thermal comfort and energy consumption. Equivalent CO2 (eCO2) and Total Volatile Organic Compounds (TVOC) provide information about the quality of the air indoors, which is a key issue for avoiding the spread of the COVID-19. By monitoring these four parameters, it is possible to detect situations in which energy is wasted and ensure thermal comfort and good air quality.
After analyzing the characteristics and price of different sensors available on the market, the prototype nodes implement the sensors shown in Table 3. The authors wanted to validate the approach with different types of sensors. For that reason, analog and digital sensors were chosen, and among the digital sensors, two different sensor buses—SPI and I2C—were used. More specifically, two different low-cost sensors were selected for temperature measurements, one analog and another digital (TMP37 and LM74, respectively). The selected humidity sensor, SHT85, is also able of measuring temperature with high precision, but as its price is higher, only a few nodes contained this sensor. It was deployed at selected locations of the building in which humidity is especially important. In terms of air quality, a sensor that measures eCO2 instead of CO2 was selected due to its lower cost. This sensor also measures TVOC. Although they are not as exact as real CO2 sensors, they have shown to provide an estimation of the evolution of the CO2 value, which is very interesting in classrooms. Figure 4 shows the Printed Circuit Board (PCB) designed for holding the selected sensors.
Table 4 shows the cost for all the components used to build the IEQ monitory system prototype. The cost for the IEC Concentrator is about 60 €. The cost for each smart IEC sensor node is around 135 €. This prototype included six PCBs, which were built by an external manufacturer. The manufacturing process included the component assembly with the TMP37, LM74, and CSS811 sensors. Obviously, this price may reduce when larger series are manufactured. Table 4 shows the cost for a basic smart IEC sensor node (135 €), which includes the TMP37, LM74, and CSS811 sensors. Due to the higher price of the SHT85 sensor, it was left as an optional choice, being included in only one smart IEC sensor node of the prototype.

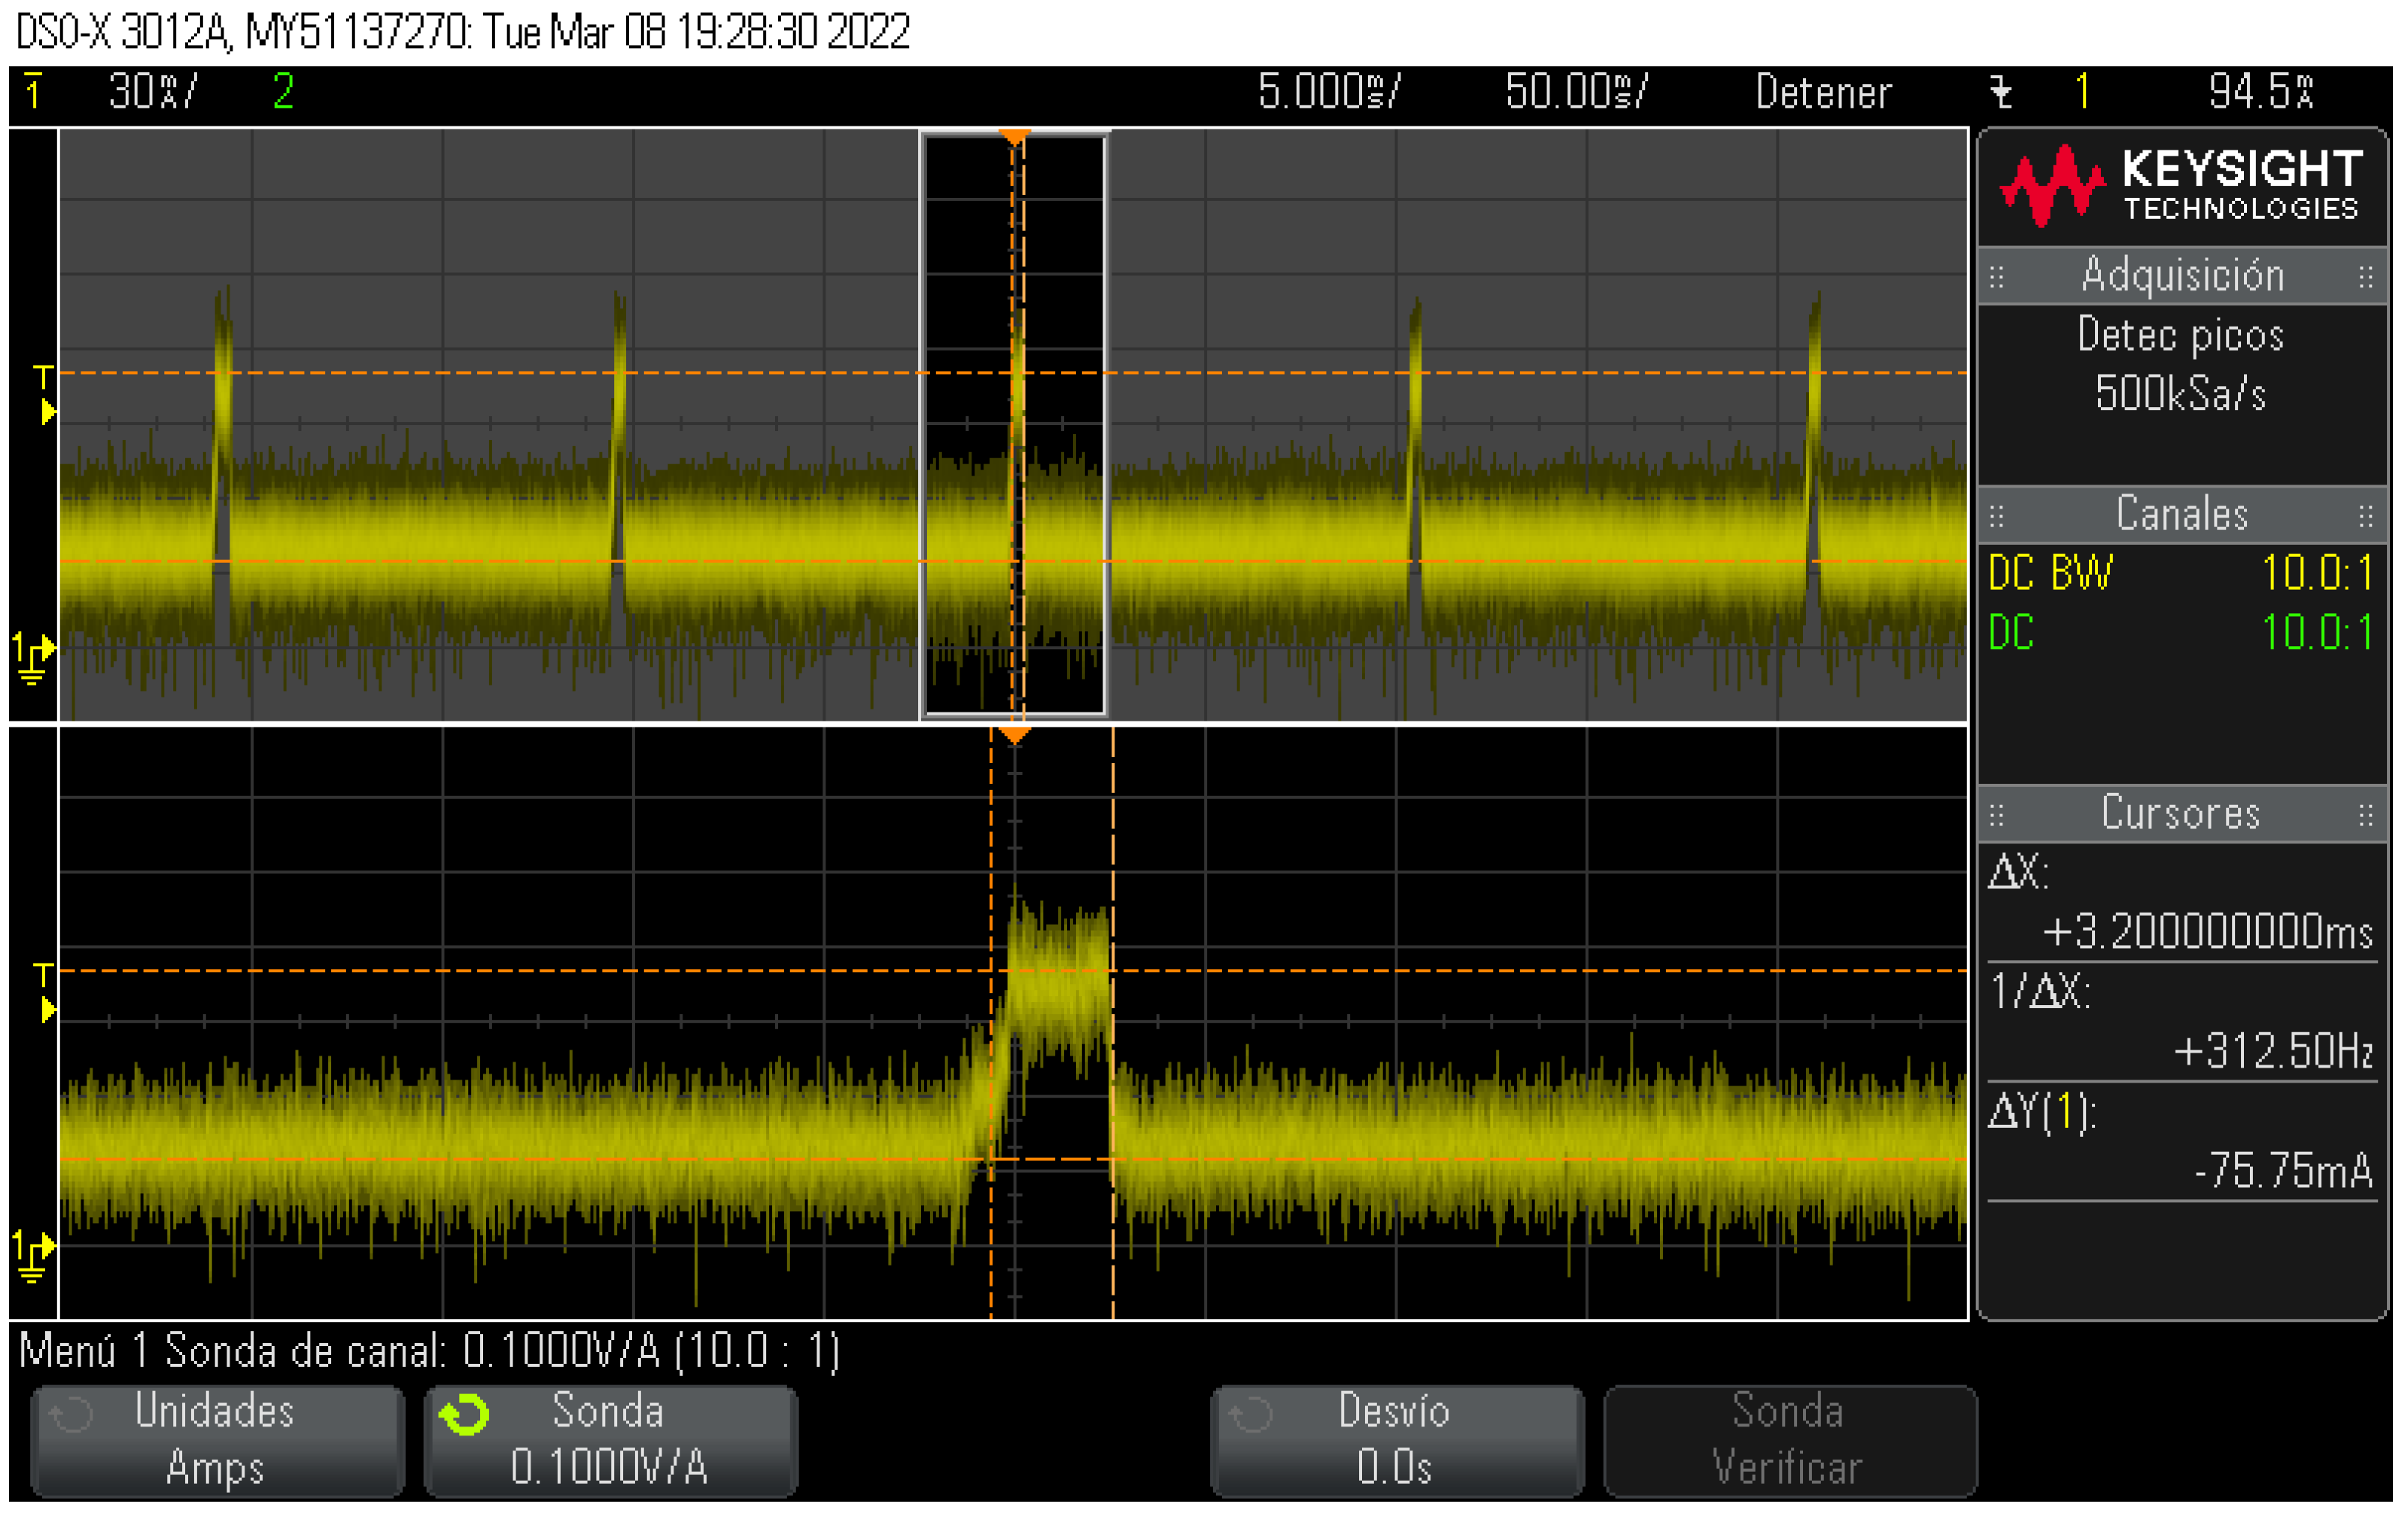
3.4. Power Consumption Analysis of the Smart IEQ Sensor Node

The smart IEQ sensor nodes run an Arduino sketch, which is responsible for acquiring the data from the sensors at the PCB, preprocessing it, and establishing the communication (with WiFi and MQTT protocols) with the IEQ Concentrator by means of the topics shown in Figure 2.
This subsection is devoted to briefly analyzing the current drawn at the Smart IEQ sensor node when in operation. This information is valuable for dimensioning the capacity of the batteries for continuous operation, as well as to make both students and staff aware of the sustainability issues of the deployed IoT system by analyzing the energy consumption of every device.
For this purpose, an oscilloscope with a current probe was used for monitoring the power drawn when the smart IEQ sensor node was in operation. Figure 5 shows the oscilloscope capture.
The oscilloscope capture (Figure 5) shows when WiFi transmission occurs as current peaks. The sensors included in the PCB are responsible for part of the total consumption of the IEQ device. In particular, the authors measured that only the eCO2 sensor (CCS811) is responsible for 20 mA of the total consumption. In this scenario, there are different states for the IoT device, corresponding to three power consumption levels: (1) WiFi communications, which are the current peaks, (2) in run mode without transmission, which is the power drawn by the Arduino MKR WiFi 1010 board and all included sensors, and (3) in deep sleep mode (not shown in Figure 5).
The WiFi communications, shown as current peaks in Figure 5, have been zoomed at the bottom of the Figure. Table 5 summarizes the power consumption for these identified states. This information may be used for dimensioning the batteries in order to adjust their capacity to the autonomy requirements.

3.5. HMI Application

Free open-source software (FOSS) technologies were used to implement the IEQ monitoring system. This approach allows for changing the software easily in order to adapt it to new requirements.
This subsection presents a simple but intuitive HMI application aimed at easily managing the IEQ monitoring system. This application was created with Python programming language since it is a very versatile programming environment that provides good plotting capabilities. This application was designed for stand-alone operation at the IEQ concentrator. Independently of this application, the IEQ concentrator also acts as gateway for uploading the monitored data, connecting it to more sophisticated cloud services by means of MQTT communications.
Although the HMI application provides basic functionalities, it may be used for implementing a system that may operate in an autonomous way without the need of cloud services. More specifically, it permits the following operations: (1) centralizing the configuration of the IEQ monitoring system in a location of the building and checking the integrity of the connected sensors, (2) starting/stopping periodic monitoring, which executes the measuring operations, (3) showing and storing the real-time measured data, and (4) analyzing and plotting historical data for basic analysis. The application also includes an alarm system. These alarms are generated when nodes are not working properly, so that the problem can be quickly identified and solved. This application stores the data captured from all smart IEQ sensor nodes in text files. This approach allows for exporting the stored data to common applications, such as Excel or MATLAB, for more advanced analysis. Figure 6 and Figure 7 show snapshots of the HMI application in different scenarios; namely, configuration tasks for the IEQ monitoring system (Figure 6) and analyzing stored data (Figure 7).
Cloud services extend the functionality of this application by providing deeper analysis, based on larger data collections, which are stored at the cloud. These services may be accessible from anywhere in the Internet, and as shown in Figure 1, allow to collect monitoring data from diverse areas which are locally managed by different IEQ concentrators.

4. Validation of the Prototype

The prototype of the IEQ monitoring system was deployed at the Faculty of Engineering of Vitoria-Gasteiz (UPV/EHU). The system was tested at different situations (master classes, laboratory sessions, and exams) using different sampling periods obtaining positive performance results. For validation purposes, just one IEQ concentrator was used to collect the data from several smart IEQ sensor nodes. The IEQ concentrator was located in an office, whereas the smart IEQ sensor nodes were distributed in the whole faculty building in different locations, as shown in Figure 8. The institutional WiFi/VLAN infrastructure was used; this approach allowed us to reach almost every corner of the faculty. In addition, the use of a separate VLAN for IEQ monitoring purposes improves the security of the system against potential cyberattacks since the smart IEQ sensor nodes are not connected to the Internet. Thus, several WiFi access points (AP) are available and every IEQ sensor connects to the closest AP. The entire faculty building is covered with WiFi connectivity and therefore nodes could be located anywhere. This is a common scenario in university buildings, as well as in other public or private facilities.
For validation purposes, the prototype of the IEQ monitoring system was tested in different scenarios by taking diverse IEQ parameters with different sensors. All tests were executed with a sampling period of 5 min. The selected scenarios were:
  • In a staff office
  • In a laboratory during several laboratory classes
  • In a classroom during an exam

4.1. In a Staff Office

This test shows how this system may be used for monitoring the IEQ conditions in a staff office. Four different smart IEQ sensor nodes were distributed in the office in different locations, monitoring temperature (LM74), relative humidity (SHT85), eCO2, and TVOC (CCS811). This test was carried out during almost 8 h, as shown in Figure 9. IEQ monitoring data were acquired in the month of June of 2021.
Smart IEQ sensor nodes produce different values depending on location. Some of them were closer to the windows, door, electronic devices, or human beings. The captured results show that the IEQ parameters were in adequate ranges. The values captured for the CO2 concentration show that its value is different depending on the location (see Figure 9c). For example, Node 4 (red in Figure 9c), was located close to the window, whereas the other nodes were closer to the staff. It can be appreciated that the values for Node 1 (blue in Figure 9c) fell during some instances of staff opening the door and windows to create air currents.

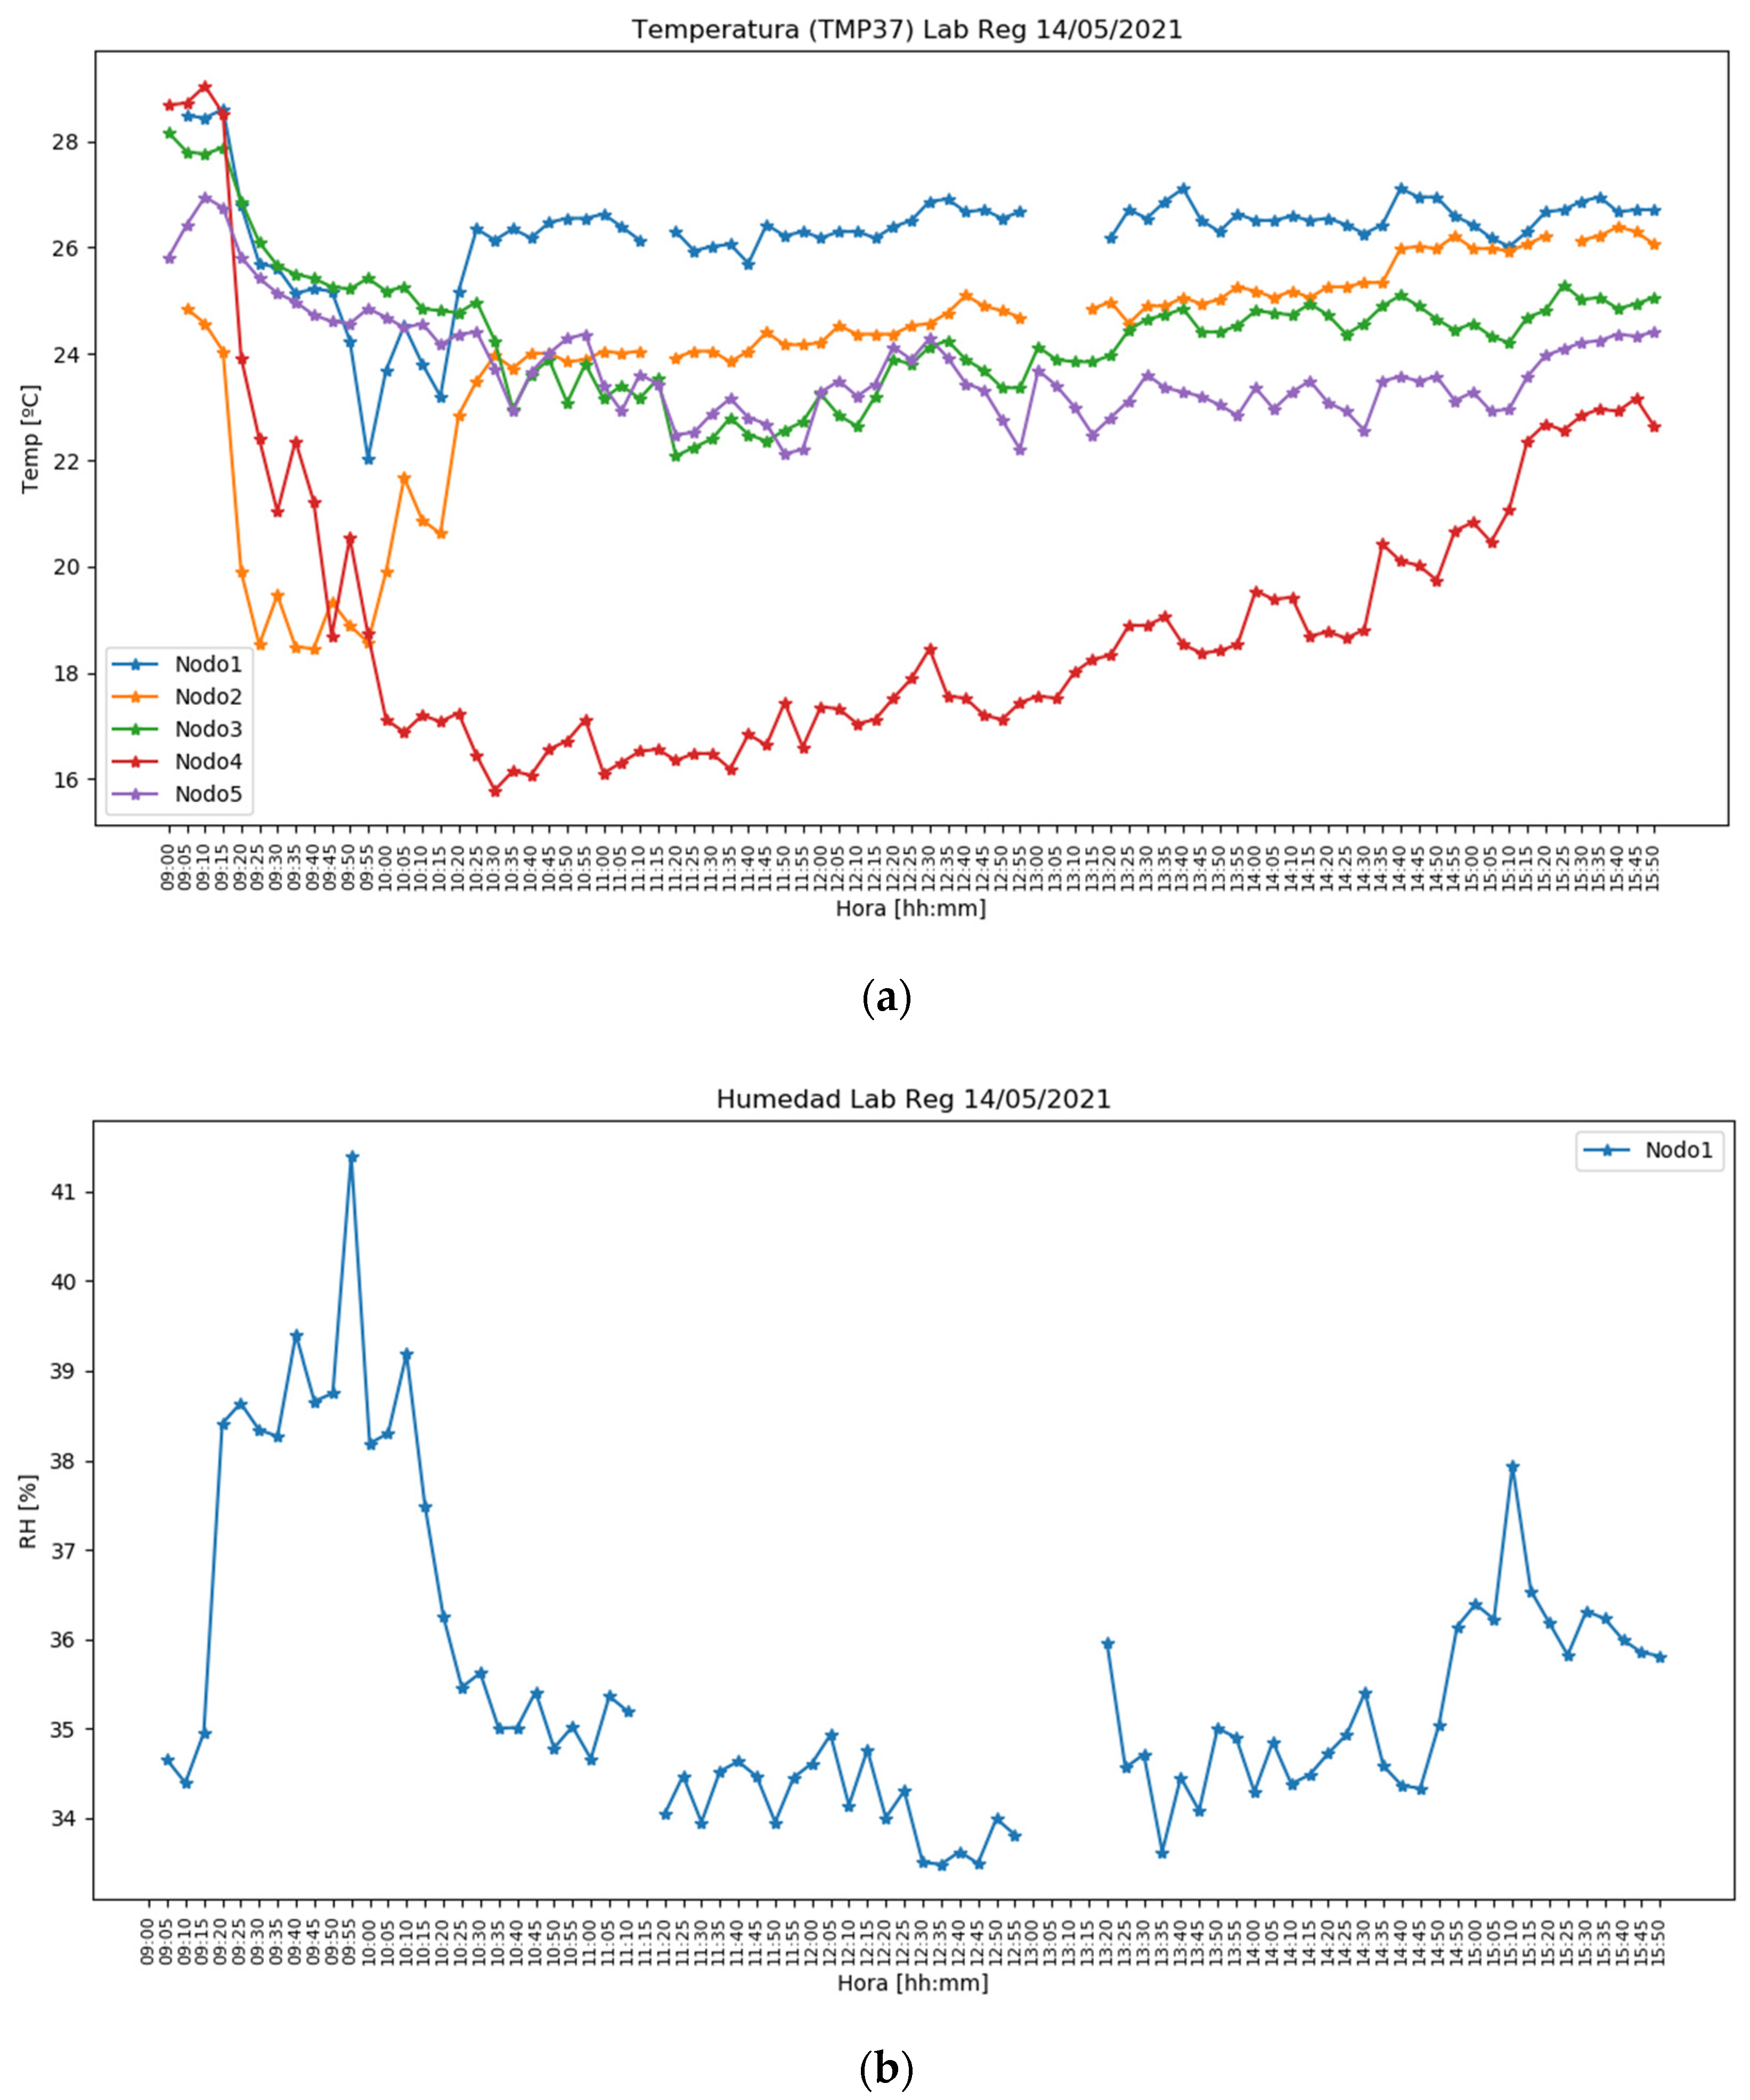
4.2. In a Laboratory during Several Laboratory Classes

This test was carried out in a laboratory in May 2021. This laboratory is used for teaching purposes. The laboratory was occupied with three consecutive laboratory sessions of two hours, from 9:00 to 11:00; from 11:00 to 13:00; and from 13:00 to 15:00. The windows were always open. This test was aimed at measuring temperature and humidity parameters in the laboratory for evaluating the thermal comfort of the students.
Five smart IEQ sensor nodes were located at different places. All five IEQ nodes acquired temperature (TMP37) but only one of them could also measure relative humidity (SHT85). Node 4 (red in Figure 10a) was next to the window, whereas the others were distributed along the laboratory.
The obtained results show that the temperature conditions in the laboratory changed considerably, depending on where the nodes were located. In the morning, at 9:00, the overall temperature was between 25 and 28 degrees, but it reached 16 degrees next to the window. Also, it can be appreciated that Node 4 (red in Figure 10a) provides the closest value to the external temperature, which increased during the day.
The IEQ monitoring system also acquired the values for the relative humidity (Figure 10b), which was always in the range from 33% to 41 % and is considered acceptable (but slightly dry) inside buildings.
Finally, it can be appreciated that there are some missing values in both figures. This happened at approximately 11:15 and 13:00. The cause for this issue was that the WiFi communication was lost for some time at these points. However, the system was able to reconnect automatically.

4.3. In a Classroom during an Exam

This test was carried out during an exam taken in the afternoon on 31 May 2021. The exam took two and a half hours, from 16:00 to 18:30. In this case, the IEQ monitoring system acquired eCO2 and temperature values, using the CSS811 and TMP37 sensors, respectively. The results of this test are shown in Figure 11. In this test, four smart IEQ sensor nodes were located at different positions in the exam classroom. The acquired temperature values can be considered adequate, since they are always over 24 and below 28 degrees.
Regarding the values for the eCO2, they are continuously increasing, although the windows were open in the exam. Calibration errors could occur since the CSS811 sensor has not proven to be very precise. Regardless, the acquired IEQ values recommend introducing additional actions in this scenario, such as introducing auxiliary ventilation systems for improving the quality of the air.

4.4. Discussion

The values of different parameters acquired from different smart IEQ smart nodes are correctly received and plotted with the HMI application. Only sometimes was the connection lost due to a low WiFi signal but it was rapidly reconnected with almost null data loss. It is also reflected that depending on the position of the node, the values are different, due to the effect of windows, doors, electronic devices, or the presence of humans.
The designed IEQ monitoring system works properly and can be used to obtain data for detecting uncomfortable situations as well as promoting acting to reduce energy consumption and improving the health conditions of students and staff. These measurements were taken in the months of May and June. In this case, the reason for the high temperatures was the outside temperature and not the heating system. The acquired values were inside the accepted range of values most of the time. However, although the authors consider that the presented approach is adequate, it could be convenient to replace the CSS811 sensor with one that is more precise (and more expensive) for measuring the CO2 concentration.
In summer, the actions that could be taken for improving the values could be opening/closing windows, turning off emission sources, or reducing the amount of people inside a room. If necessary, adding an air conditioning system or/and air purifier could be considered. In winter, the heating system should be adequately managed.

5. Conclusions and Future Work

This paper introduces a scalable IoT architecture based on the edge–fog–cloud paradigm for monitoring the Indoors Environmental Quality (IEQ) parameters in public and private buildings. These systems allow for (1) ensuring the thermal comfort of the occupants, also improving their productivity, (2) introducing actions to reduce energy consumption, contributing to achieving Sustainable Development Goals (SDG), and (3) guaranteeing air quality, which is a key concern, as the COVID-19 pandemic has shown. These problems occur frequently in public or private buildings as well as in industrial facilities.
The proposed architecture implements the edge and fog layers by means of different devices: smart IEQ sensor nodes at the edge layer, which acquire IEQ parameters locally, and IEQ concentrators at the fog layer, which collect the data from several smart IEQ sensor nodes in one specific area and connect with cloud services. Edge–fog–cloud architectures have proven to be adequate for dealing with large amounts of distributed nodes in Industry 4.0 applications. This work presents its application for monitoring IEQ conditions in buildings or groups of buildings, such as those on a university campus. The hierarchical structure of the architecture, as well as the use of TCP/IP technologies, allows for scaling the system to reach different amounts of nodes. Thus, IEQ Concentrators are responsible for collecting the data from specific areas, producing a system that may operate autonomously. In addition, IEQ parameters evolve relatively slowly, so sampling times in the range of minutes are adequate. Thus, since the network traffic of the system is relatively low and non-time-critical, a large number of devices can be introduced. The proposed system uses cooperative network infrastructures that are already deployed for transmitting the monitored data, which is a cost-effective approach.
This system uses open-source hardware and software technologies, low-cost sensors, and selected popular communication technologies (WiFi, VLAN, TCP/IP and MQTT) over already deployed communication infrastructures. The combination of all these features produces a low-cost monitoring system that may be easily adapted to measure selected IEQ parameters. The proposed architecture allows several levels of connectivity. Single board computers, such as Raspberry Pi 3B+, were used as IEQ concentrators, whereas microcontroller boards, namely Arduino MKR WiFi 1010 boards, were used for the smart IEQ sensor nodes. Also, a PCB board was specifically designed including different low-cost sensors for measuring the IEQ parameters. Diverse state-of-the-art communication technologies for IoT applications were used, namely WiFi, VLAN, Internet, and MQTT. This architecture could be used for monitoring other systems with sampling periods in the range of minutes, by changing the sensors and fixing the configuration of the acquisition system.
The proposed IEQ monitoring system is aimed at detecting uncomfortable situations in buildings. Also, it may help to enforce the SDGs by addressing future actions to improve the efficiency of the heating and air conditioning systems. Inadequate environmental conditions may cause a reduction in the productivity of building occupants and may even lead to several diseases as occupants spend long periods indoors. Besides, with the advent of the COVID-19 pandemic, monitoring the quality of the air indoors has become an important issue as the SARS-CoV-2 virus is spread through the air. In this scenario, monitoring diverse variables such as temperature, relative humidity, eCO2, and TVOC may help to keep these issues under control.
A prototype of the proposed system was deployed at the Faculty of Engineering of Vitoria-Gasteiz (UPV/EHU). The proposed IEQ monitoring system is based on low-cost hardware and software components. It was designed to be flexible and highly configurable, in order to be deployed at buildings of different types and sizes with varied characteristics. This implementation turned out to be successful and cost-effective.
The IEQ monitoring system has been successfully tested, proving that it is able to collect measurements from nodes distributed around different points of the faculty. For testing purposes, several academic scenarios and configurations were chosen, achieving positive results. Namely, IEQ parameters were monitored in a staff office, in a teaching laboratory during several laboratory classes, and in a classroom during an exam. The system showed that the working conditions of the staff were adequate and that sometimes the relative humidity at the laboratories could be slightly low, and identified some situations that may require better ventilation.
Currently, the authors are working on detecting possible actions that may improve the IEQ conditions for the occupants at the faculty. For this purpose, they are developing automatic systems that may start/stop when needed, such as IoT automatic valves and auxiliary ventilation systems, for improving both thermal conditions and the quality of the air. Also, the authors have detected that some sensors do not operate very precisely sometimes, specifically the CSS811 sensor, so they are looking to find a replacement. Finally, the authors are currently developing advanced cloud services aimed at analyzing larger series of data.

Author Contributions

Conceptualization, I.C. and E.A.; methodology, I.C., J.M.G.-G. and O.B.; software, A.E. and I.C.; validation, A.E. and I.C.; formal analysis, I.C., J.M.G.-G. and P.F.B.; investigation, A.E., P.F.B. and I.C.; writing—original draft preparation, A.E. and I.C.; writing—review and editing, I.C. and J.M.G.-G.; visualization, A.E. and I.C.; supervision, I.C.; project administration, I.C., O.B. and E.A.; All authors have read and agreed to the published version of the manuscript.

Funding

The authors wish to express their gratitude, for supporting this work, to the Fundación Vital through project VITAL21/05 and the University of the Basque Country (UPV/EHU), through the Campus Bizia Lab (CBL) program. Partial support has been also received from the Basque Government, through project EKOHEGAZ (ELKARTEK KK-2021/00092), the Diputación Foral de Álava (DFA) through the project CONAVANTER, and the UPV/EHU through the GIU20/063 grant.

Institutional Review Board Statement

Not applicable.

Informed Consent Statement

Not applicable.

Data Availability Statement

Not applicable.

Acknowledgments

The authors wish to express their gratitude to the University of the Basque Country (UPV/EHU), for supporting this work through the Campus Bizia Lab (CBL) program and the Basque Government, through the project EKOHEGAZ (ELKARTEK KK-2021/00092), the Diputación Foral de Álava (DFA) through the project CONAVANTER, and to the UPV/EHU through the project GIU20/063. Also, they express gratitude to Fundación VITAL for supporting this work with VITAL21/05 project.

Conflicts of Interest

The authors declare no conflict of interest.

References

  1. Chen, B.; Wan, J.; Shu, L.; Li, P.; Mukherjee, M.; Yin, B. Smart Factory of Industry 4.0: Key Technologies, Application Case, and Challenges. IEEE Access 2017, 6, 6505–6519. [Google Scholar] [CrossRef]
  2. Candell, R.; Kashef, M.; Liu, Y.; Lee, K.B.; Foufou, S. Industrial wireless systems guidelines: Practical considerations and deployment life cycle. IEEE Ind. Electron. Mag. 2018, 12, 6–17. [Google Scholar] [CrossRef]
  3. Mazon Olivo, B.; Pan, A. Internet of Things: State-of-the-art, Computing Paradigms and Reference Architectures. IEEE Lat. Am. Trans. 2021, 20, 49–63. [Google Scholar] [CrossRef]
  4. Parkinson, T.; Parkinson, A.; de Dear, R. Continuous IEQ monitoring system: Context and development. Build. Environ. 2019, 149, 15–25. [Google Scholar] [CrossRef] [Green Version]
  5. Calvo, I.; Gil-García, J.M.; Recio, I.; López, A.; Quesada, J. Building IoT Applications with Raspberry Pi and Low Power IQRF Communication Modules. Electronics 2016, 5, 54. [Google Scholar] [CrossRef] [Green Version]
  6. Dalampira, E.-S.; Nastis, S.A. Mapping Sustainable Development Goals: A network analysis framework. Sustain. Dev. 2020, 28, 46–55. [Google Scholar] [CrossRef]
  7. Yang, L.; Yan, H.; Lam, J.C. Thermal comfort and building energy consumption implications—A review. Appl. Energy 2014, 115, 164–173. [Google Scholar] [CrossRef]
  8. Calvo, I.; Gil-García, J.M.; Apiñaniz, E.; Escudero, C.; García-Adeva, A.J.; Mesanza, A.; Gastón, M. Design of a PBL experience in the field of sustainability for industrial informatics. Adv. Intell. Syst. Comput. 2021, 1266, 338–347. [Google Scholar] [CrossRef]
  9. Andreotti, M.; Calzolari, M.; Davoli, P.; Pereira, L.D.; Lucchi, E.; Malaguti, R. Design and construction of a new metering hot box for the in situ hygrothermal measurement in dynamic conditions of historic masonries. Energies 2020, 13, 2950. [Google Scholar] [CrossRef]
  10. Coulby, G.; Clear, A.; Jones, O.; Godfrey, A. A scoping review of technological approaches to environmental monitoring. Int. J. Environ. Res. Public Health 2020, 17, 3995. [Google Scholar] [CrossRef]
  11. Pietrogrande, M.C.; Casari, L.; Demaria, G.; Russo, M. Indoor air quality in domestic environments during periods close to italian COVID-19 lockdown. Int. J. Environ. Res. Public Health 2021, 18, 4060. [Google Scholar] [CrossRef] [PubMed]
  12. Burridge, H.C.; Bhagat, R.K.; Stettler, M.E.J.; Kumar, P.; De Mel, I.; Demis, P.; Hart, A.; Johnson-Llambias, Y.; King, M.F.; Klymenko, O.; et al. The ventilation of buildings and other mitigating measures for COVID-19: A focus on wintertime. Proc. R. Soc. A 2021, 477, 20200855. [Google Scholar] [CrossRef] [PubMed]
  13. Firouzi, F.; Farahani, B.; Marinšek, A. The convergence and interplay of edge, fog, and cloud in the AI-driven Internet of Things (IoT). Inf. Syst. 2021, in press. [Google Scholar] [CrossRef]
  14. Andargie, M.S.; Touchie, M.; O’Brien, W. A review of factors affecting occupant comfort in multi-unit residential buildings. Build. Environ. 2019, 160, 106182. [Google Scholar] [CrossRef]
  15. Corgnati, S.P.; Filippi, M.; Viazzo, S. Perception of the thermal environment in high school and university classrooms: Subjective preferences and thermal comfort. Build. Environ. 2007, 42, 951–959. [Google Scholar] [CrossRef]
  16. Saini, J.; Dutta, M.; Marques, G. Indoor air quality monitoring systems based on internet of things: A systematic review. Int. J. Environ. Res. Public Health 2020, 17, 4942. [Google Scholar] [CrossRef] [PubMed]
  17. ANSI/ASHRAE Standard 55-2010; Thermal Environmental Conditions for Human Occupacy. American Society of Heating, Refrigerating and Air-Conditioning Engineers, Inc.: Atlanta, GA, USA, 2011. Available online: http://arco-hvac.ir/wp-content/uploads/2015/11/ASHRAE-55-2010.pdf (accessed on 7 March 2022).
  18. RESET Air Standard for Commercial Interiors v2.0, RESETTM. Available online: https://www.reset.build/standard/air (accessed on 7 March 2022).
  19. ISO 7730:2005 Ergonomics of the Thermal Environment—Analytical Determination and Interpretation of Thermal Comfort Using Calculation of the PMV and PPD Indices and Local Thermal Comfort Criteria. Available online: https://www.iso.org/standard/39155.html (accessed on 7 March 2022).
  20. Yi, W.; Lo, K.; Mak, T.; Leung, K.; Leung, Y.; Meng, M. A Survey of Wireless Sensor Network Based Air Pollution Monitoring Systems. Sensors 2015, 15, 31392–31427. [Google Scholar] [CrossRef] [PubMed] [Green Version]
  21. Perez, A.O.; Bierer, B.; Scholz, L.; Wöllenstein, J.; Palzer, S. A wireless gas sensor network to monitor indoor environmental quality in schools. Sensors 2018, 18, 4345. [Google Scholar] [CrossRef] [Green Version]
  22. Dang, C.T.; Seiderer, A.; André, E. Theodor: A step towards smart home applications with electronic noses. In Proceedings of the ACM International Conference Proceeding Series, 5th international Workshop on Sensorbased Activity Recognition and Interaction, iWOAR 2018, Berlin, Germany, 20–21 September 2018. [Google Scholar] [CrossRef]
  23. Gomes, J.B.A.; Rodrigues, J.J.P.C.; Rabêlo, R.A.L.; Kumar, N.; Kozlov, S. IoT-enabled gas sensors: Technologies, applications, and opportunities. J. Sens. Actuator Netw. 2019, 8, 57. [Google Scholar] [CrossRef] [Green Version]
  24. Seiderer, A.; Aslan, I.; Dang, C.T.; André, E. Indoor air quality and wellbeing—Enabling awareness and sensitivity with ambient IOT displays. In Proceedings of the 15th European Conference on Ambient Intelligence, AmI 2019, Rome, Italy, 13–15 November 2019; Volume 11912, pp. 266–282. [Google Scholar] [CrossRef]
  25. Yang, C.-T.; Chen, S.-T.; Den, W.; Wang, Y.-T.; Kristiani, E. Implementation of an Intelligent Indoor Environmental Monitoring and management system in cloud. Future Gener. Comput. Syst. 2019, 96, 731–749. [Google Scholar] [CrossRef]
  26. Zhang, X.; Zhao, Y.; Zhao, W.; Xu, W.; Ji, W. A wireless sensor networks-based intelligent system for library air quality monitoring. Int. J. Online Eng. 2016, 12, 76–79. [Google Scholar] [CrossRef] [Green Version]
  27. Youness, A.; Mustapha, H.; Sultan, A.A.; Ahmed, A.S. Low-cost data acquisition station for microclimate detection and public health risks management: A case study of Casablanca. Int. J. Online Biomed. Eng. 2020, 16, 31–40. [Google Scholar] [CrossRef]
  28. Schiavon, M.; Adami, L.; Magaril, E.; Ragazzi, M. Indoor CO2: Potential criticalities and solutions. In Proceedings of the MATEC Web of Conferences, 9th International Conference on Manufacturing Science and Education: Trends in New Industrial Revolution, Sibiu, Romania, 5–7 June 2019; Volume 290, p. 12026. [Google Scholar] [CrossRef]
  29. He, Y.; Tan, M. Implementation of air-conditioning control technology based on wireless sensor. Int. J. Online Eng. 2017, 13, 91–99. [Google Scholar] [CrossRef] [Green Version]
  30. Barmparesos, N.; Papadaki, D.; Karalis, M.; Fameliari, K.; Assimakopoulos, M.N. In situ measurements of energy consumption and indoor environmental quality of a pre-retrofitted student dormitory in Athens. Energies 2019, 12, 2210. [Google Scholar] [CrossRef] [Green Version]
  31. Martín-Garín, A.; Millán-García, J.A.; Baïri, A.; Millán-Medel, J.; Sala-Lizarraga, J.M. Environmental monitoring system based on an Open Source Platform and the Internet of Things for a building energy retrofit. Autom. Constr. 2018, 87, 201–214. [Google Scholar] [CrossRef]
  32. Karami, M.; McMorrow, G.V.; Wang, L. Continuous monitoring of indoor environmental quality using an Arduino-based data acquisition system. J. Build. Eng. 2018, 19, 412–419. [Google Scholar] [CrossRef]
  33. Salamone, F.; Belussi, L.; Danza, L.; Galanos, T.; Ghellere, M.; Meroni, I. Design and development of a nearablewireless system to control indoor air quality and indoor lighting quality. Sensors 2017, 17, 1021. [Google Scholar] [CrossRef]
  34. Menacho, A.; Castro, M.; Pérez, C. Arduino-based water analysis pocket lab. In Proceedings of the 2021 World Engineering Education Forum/Global Engineering Deans Council, WEEF/GEDC 2021, Madrid, España, 15–18 November 2021. [Google Scholar] [CrossRef]
  35. Ali, A.S.; Coté, C.; Heidarinejad, M.; Stephens, B. Elemental: An Open-Source Wireless Hardware and Software Platform for Building Energy and Indoor Environmental Monitoring and Control. Sensors 2019, 19, 4017. [Google Scholar] [CrossRef] [Green Version]
  36. Al-Fuqaha, A.; Guizani, M.; Mohammadi, M.; Aledhari, M.; Ayyash, M. Internet of Things: A Survey on Enabling Technologies, Protocols, and Applications. IEEE Commun. Surv. Tutor. 2015, 17, 2347–2376. [Google Scholar] [CrossRef]
  37. Paniagua, E.; Macazana, J.; Lopez, J.; Tarrillo, J. IoT-based temperature monitoring for buildings thermal comfort analysis. In Proceedings of the 2019 IEEE 26th International Conference on Electronics, Electrical Engineering and Computing, INTERCON 2019, Lima, Peru, 12–14 August 2019. [Google Scholar] [CrossRef]
  38. Vargas-Salgado, C.; Aguila-Leon, J.; Chiñas-Palacios, C.; Hurtado-Perez, E. Low-cost web-based Supervisory Control and Data Acquisition system for a microgrid testbed: A case study in design and implementation for academic and research applications. Heliyon 2019, 5, e02474. [Google Scholar] [CrossRef] [Green Version]
  39. Portalo, J.M.; González, I.; Calderón, A.J. Monitoring system for tracking a pv generator in an experimental smart microgrid: An open-source solution. Sustainability 2021, 13, 8182. [Google Scholar] [CrossRef]
  40. De Melo, G.C.G.; Torres, I.C.; de Araújo, Í.B.Q.; Brito, D.B.; Barboza, E.A. A low-cost iot system for real-time monitoring of climatic variables and photovoltaic generation for smart grid application. Sensors 2021, 21, 3293. [Google Scholar] [CrossRef] [PubMed]
  41. Lucchi, E.; Pereira, L.D.; Andreotti, M.; Malaguti, R.; Cennamo, D.; Calzolari, M.; Frighi, V. Development of a compatible, low cost and high accurate conservation remote sensing technology for the hygrothermal assessment of historic walls. Electronics 2019, 8, 643. [Google Scholar] [CrossRef] [Green Version]
  42. Kanal, A.K.; Kovacshazy, T. IoT solution for assessing the indoor air quality of educational facilities. In Proceedings of the 2019 20th International Carpathian Control Conference ICCC 2019, Krakow-Wieliczka, Poland, 26–29 May 2019. [Google Scholar] [CrossRef]
  43. Arroyo, P.; Meléndez, F.; Suárez, J.I.; Herrero, J.L.; Rodríguez, S.; Lozano, J. Electronic nose with digital gas sensors connected via bluetooth to a smartphone for air quality measurements. Sensors 2020, 20, 786. [Google Scholar] [CrossRef] [PubMed] [Green Version]
  44. Sakuma, Y.; Nishi, H. Estimation of building thermal performance using simple sensors and air conditioners. Energies 2019, 12, 2950. [Google Scholar] [CrossRef] [Green Version]
  45. Jin-Feng, L.; Shun, C. A low-cost wireless water quality auto-monitoring system. Int. J. Online Eng. 2015, 11, 37–41. [Google Scholar] [CrossRef] [Green Version]
  46. Baig, F.; Mahmood, A.; Javaid, N.; Razzaq, S.; Khan, N.; Saleem, Z. Smart home energy management system for monitoring and scheduling of home appliances using zigbee. J. Basic Appl. Sci. Res. 2013, 3, 880–891. [Google Scholar]
  47. Froiz-Míguez, I.; Fernández-Caramés, T.M.; Fraga-Lamas, P.; Castedo, L. Design, implementation and practical evaluation of an iot home automation system for fog computing applications based on MQTT and ZigBee-WiFi sensor nodes. Sensors 2018, 18, 2660. [Google Scholar] [CrossRef] [Green Version]
  48. Mois, G.; Sanislav, T.; Folea, S.C. A Cyber-Physical System for Environmental Monitoring. IEEE Trans. Instrum. Meas. 2016, 65, 1463–1471. [Google Scholar] [CrossRef]
  49. Azemi, S.N.; Loon, K.W.; Amir, A.; Kamalrudin, M. An IoT-Based Alarm Air Quality Monitoring System. J. Phys. Conf. Ser. 2021, 1755, 012035. [Google Scholar] [CrossRef]
  50. Jamal, A.; Al Narayanasamy, D.D.; Mohd Zaki, N.Q.; Abbas Helmi, R.A. Large Hall Temperature Monitoring Portal. In Proceedings of the 2019 IEEE International Conference on Automatic Control and Intelligent Systems, I2CACIS 2019, Selangor, Malaysia, 29 June 2019. [Google Scholar] [CrossRef]
  51. Al-Masri, E.; Kalyanam, K.R.; Batts, J.; Kim, J.; Singh, S.; Vo, T.; Yan, C. Investigating Messaging Protocols for the Internet of Things (IoT). IEEE Access 2020, 8, 94880–94911. [Google Scholar] [CrossRef]
  52. Naik, N. Choice of effective messaging protocols for IoT systems: MQTT, CoAP, AMQP and HTTP. In Proceedings of the 2017 IEEE International Symposium on Systems Engineering, ISSE 2017, Vienna, Austria, 11–13 October 2017. [Google Scholar] [CrossRef] [Green Version]
  53. Jaikar, S.P.; Iyer, K.R. A Survey of Messaging Protocols for IoT Systems. Int. J. Adv. Manag. Technol. Eng. Sci. 2018, 8, 510–514. [Google Scholar]
  54. Alaerjan, A.; Kim, D.K.; Ming, H.; Kim, H. Configurable DDS as uniform middleware for data communication in smart grids. Energies 2020, 13, 1839. [Google Scholar] [CrossRef] [Green Version]
  55. Calvo, I.; Pérez, F.; Etxeberria-Agiriano, I.; García de Albéniz, O. Designing High Performance Factory Automation Applications on Top of DDS. Int. J. Adv. Robot. Syst. 2013, 10, 205. [Google Scholar] [CrossRef] [Green Version]
  56. Mishra, B.; Kertesz, A. The use of MQTT in M2M and IoT systems: A survey. IEEE Access 2020, 8, 201071–201086. [Google Scholar] [CrossRef]
  57. Delgado, A.; Huamaní, E.L.; Aguila-Ruiz, B. Design of an IoT domotic system using the MQTT protocol. Int. J. Adv. Trends Comput. Sci. Eng. 2020, 9, 4811–4818. [Google Scholar] [CrossRef]
  58. Cavalcante, T.L.; Louzada, D.R.; da Silva, A.; Monteiro, E.C. Multiparametric measuring system for atmospheric monitoring. J. Phys. Conf. Ser. 2021, 1826, 012020. [Google Scholar] [CrossRef]
  59. Vanus, J.; Gorjani, O.M.; Bilik, P. Novel proposal for prediction of CO2 course and occupancy recognition in intelligent buildings within IoT. Energies 2019, 12, 4541. [Google Scholar] [CrossRef] [Green Version]
  60. Industrial Wireless Remote Temperature Monitoring Systems|E-Control Systems. Available online: https://econtrolsystems.com/ (accessed on 7 September 2021).
  61. Laboratory Temperature Monitoring Systems—Sensoscientific. Available online: https://sensoscientific.com/laboratory-temperature-monitoring-systems/ (accessed on 7 September 2021).
  62. Remote Temperature & Humidity Monitoring|ControlByWeb. Available online: https://www.controlbyweb.com/temperature/ (accessed on 7 September 2021).
  63. Kaliwo, A.; Pinifolo, J.; Mikeka, C. Real-Time, Web-based Temperature Monitoring System for Cold Chain Management in Malawi. J. Wirel. Netw. Commun. 2017, 7, 53–58. [Google Scholar]
  64. Analog Devices, Low Voltage Temperature Sensors, TMP35/TMP36/TMP37. Available online: https://www.analog.com/media/en/technical-documentation/data-sheets/TMP35_36_37.pdf (accessed on 28 February 2022).
  65. Texas Instruments, LM74 SPI/Microwire 12-Bit Plus Sign Temperature Sensor. Available online: https://www.ti.com/product/LM74#tech-docs (accessed on 28 February 2022).
  66. Sensirion, Datasheet SHT85 Humidity and Temperature Sensor. Available online: https://sensirion.com/media/documents/4B40CEF3/61642381/Sensirion_Humidity_Sensors_SHT85_Datasheet.pdf (accessed on 28 February 2022).
  67. AMS, CCS811 Ultra-Low Power Digital Gas Sensor for monitoring Indoor Air Quality. Available online: https://cdn.sparkfun.com/assets/learn_tutorials/1/4/3/CCS811_Datasheet-DS000459.pdf (accessed on 28 February 2022).
Figure 1. Overall architecture of the wireless acquisition system.
Energies 15 02270 g001
Figure 2. MQTT topics used for connecting IEQ concentrators with smart IEQ sensor nodes. The numbers i = 1, 2, 3… represent the node identifier; the number j = 1, 2, 3… represent the sensors attached to the nodes. Finally, the symbol # means being subscribed to all subtopics. Published topics are in the orange color, whereas subscribed topics are in the blue color.
Energies 15 02270 g002
Figure 3. Hardware diagram for the IEQ monitoring system prototype.
Energies 15 02270 g003
Figure 4. Designed PCB for the smart IEQ sensor node.
Energies 15 02270 g004
Figure 5. Power drawn at the smart IEQ sensor node when in operation.
Energies 15 02270 g005
Figure 6. HMI application: Configuration of the IEQ monitoring system.
Energies 15 02270 g006
Figure 7. HMI application: Basic analysis of historical data.
Energies 15 02270 g007
Figure 8. Distribution of the smart sensors at the Faculty of Engineering of Vitoria-Gasteiz (UPV/EHU).
Energies 15 02270 g008
Figure 9. (a) Temperature measurements (LM74 sensors); (b) Relative humidity measurements (SHT85); (c) eCO2 measurements (CCS811); (d) TVOC measurements (CCS811).
Energies 15 02270 g009
Figure 10. (a) Temperature measurements (TMP37); (b) Relative humidity measurements (SHT85).
Energies 15 02270 g010
Figure 11. (a) eCO2 measurements (CCS811); (b) Temperature measurements (TMP37).
Energies 15 02270 g011
Table 1. Accepted range of values for environmental parameters according to different standards.
VariableAppropriate ValuesStandard
CO2Less than 1000 ppmASHRAE
VOCLess than 250 ppbRESET Air
Temperature (1.2 m)Between 23.3 and 27.8 °CASHRAE
Relative humidityLess than 65%ASHRAE
Table 2. Summary of protocol stack.
TCP/IP LayersIoT Protocols
ApplicationMQTT
TransportTCP
InternetIPv4
Data LinkIEEE802.11 (WiFi)
IEEE802.1Q (VLAN)
Table 3. List of sensors at the prototype.
SensorParameter(s)A/DVendorLink
TMP37TemperatureAnalogAnalog Devices[64]
LM74TemperatureDigital (SPI)Texas Instruments[65]
SHT85Temperature and humidityDigital (I2C)Sensirion[66]
CCS811eCO2 and TVOCDigital (I2C)AMS[67]
Table 4. Total cost for the IEQ monitoring system components.
ComponentUnit Cost (€)
IEC Concentrator
Raspberry Pi 3B+30
Raspberry Pi Case7
SD Card 32 GB13
RPi Power adapter10
TOTAL cost for IEC Concentrator60
Smart IEC sensor nodes
Arduino MKR WiFi 101030
Battery 10,000 mAh15
PCB and component assembly (including TMP37, LM74 and CSS811 sensors)90
TOTAL cost for basic Smart IEC sensor node135
Sensors
TMP37 (Temperature)1
LM74 (Temperature)2
CSS811 (CO2 and VTOC)10
SHT85 (Temperature and relative humidity)25
Table 5. Summary of energy consumption for smart IEQ sensor node.
Operation StateCurrent [mA]
WiFi transmission110
Run mode, no transmission42
Deep sleep mode30
Publisher’s Note: MDPI stays neutral with regard to jurisdictional claims in published maps and institutional affiliations.

