1. Introduction
Generally, outdoor insulator surfaces are covered by environmental pollutants due to natural (deposition of salts in coastal areas by condensation, growing of contaminants, such as algae or fungi, in humid areas) or industrial sources, or even both. After long-term service, these continuously contaminated insulators start to deteriorate and, as the surface becomes wet because of light rain, mist, or dew, the polluted surface starts to conduct [
1,
2,
3]. Due to the different chemical nature of the pollutants deposited on an insulator surface, the dielectric strength of the insulator is degraded, and sometimes it falls below the flashover withstand value; insulator flashover may happen at operating voltages only [
4,
5]. With growing system voltages, the occurrence of flashover due to pollution has become a severe problem in transmission lines and may cause subsequent line outages and total blackouts, leading to catastrophe in a region. Therefore, reliable insulation is essential for the safe and effective operation of an electric power system and, thus, for the socioeconomic integrity of a nation. Although the phenomenon of pollution-induced flashover has been studied over the last hundred years, still, the behavior of insulators under pollution is not completely understood.
K. Stimper [
6] pointed out the various reasons for the flashover of insulators. He noted that a greater amount of dirt collects on the under-surface of insulators, and the corrugations of which are designed on the bottom surface; hence, a greater percentage of the surface area is contaminated, which leads to insulator flashover. The different components of contaminants, namely electronic conductors, ionic conductors, and non-conductors, are all listed in [
7,
8]. Based on their results, one can say that not only the electronic and ionic conductor but also the non-conductive deposits on the insulators can affect the electrical properties of insulators. They contribute indirectly to the surface deterioration, if only by providing a nucleus in the presence of water for condensation. They do not only increase the absorption of moisture but also restrict its removal. A solid deposit, usually metals and carbon products, transports current by free electrons, which move from molecule to molecule and, thus, reduce the breakdown strength of the insulation surface [
9]. J. S. Forrest and B. F. Hampton [
8,
10] suggested that the electrolytic layer permits the flow of current through the insulator surface, heating as well as drying the pollution layer by rapid evaporation of the moisture at the local hot spot. Likewise, many types of research have been carried out related to the testing of insulators. In these studies, the performance of insulators in typical/distinct locations, such as at high-altitude districts, coastal areas, agricultural lands, desert areas, highway regions, industrial areas, and tropical wet climate areas (where biological contaminants, such as fungi, algae, and lichen, are prominent sources of pollution) were studied [
11,
12,
13,
14].
Different methods have been adopted to investigate the problem of the pollution-induced failure of high-voltage insulators, such as natural testing at the field stations, artificial pollution flashover test in the laboratories, simulation, and analytical and mathematical modeling approaches to predict the polluted insulator flashover voltage. The natural pollution flashover test method is more realistic but less precise because it requires much time to test the insulators and it is not an economical process [
15,
16,
17,
18,
19]. Hence, more focus on artificial pollution testing and, in addition, the mathematical approaches for predicting the flashover performance of the insulators, is preferred, which can be more precise, accurate, and economical.
The present study has two objectives; the first one is to investigate the performance of cap-and-pin insulators polluted artificially with agricultural and biological contaminants by laboratory experimentation. The other is to develop models to predict the flashover voltages of insulators working in regions having these two specific types of contaminants.
2. Statistical Models
Modeling of flashover has been used in the insulator field over the years. Using the dimensional analysis technique, researchers derived the mathematical expression between flashover voltage and equivalent salt deposit density (
ESDD) [
20]. Various works report combined experiments and regression analysis for estimating flashover performance of different insulators by taking different parameters as variables, such as leakage distance, surface resistance, wind speed, temperature, humidity, etc. [
21,
22,
23].
Regression analysis is one of the statistical techniques most used to study the nature of interdependency between variables. The applications of regression are used in multiple fields, including economics, commerce, and science and engineering. Statistical variables are distinguished either as a response (dependent) or a regressor (independent) variable. In this work, the regressor variables are
ESDD, non-soluble deposit density (
NSDD), atmospheric pressure, and relative humidity. The soluble component of the contamination consists of different types of salinity, which can be expressed as the equivalent salt deposit density (in mg/cm
2). The insoluble component of the contamination can be expressed as a non-soluble deposit density (in mg/cm
2). These two approaches have been widely used to determine the severity of the contamination [
21,
22]. Flashover voltage (
FOV) in kV is the response variable.
All statistical models proposed in the present work are aimed to predict the flashover voltage for different values of the
ESDD (light-to-heavy contamination level),
NSDD, and their combination for a standard cap-and-pin-type insulator. As per the data, [
20,
21,
22,
23,
24,
25,
26] relate regression models that can be classified either as linear or non-linear. The generalized form of linear regression is given by Equation (1), as follows:
where,
y is the response variable,
bo is the intercept,
bi is the slope,
xi is the regressor or independent variable, and
ei is the error term (residuals).
In this work, correlation analysis between the experimental values of the contaminated flashover voltage and
ESDD has been performed. The trend is exponential and can be expressed as.
It is noted that the relationship between
ESDD and
FOV is non-linear. Similarly, the behavior of
FOV to
NSDD is non-linear.
where
A and
B are the coefficients related to the shape and material of the insulator, and a and b are the exponents that define the influence of
ESDD and
NSDD, respectively, on the flashover voltage of the insulator.
To account for the non-linearity, the transformation of the equations by taking the natural log on both sides was done to perform linear regression analysis.
In the interest of examining the effect of both ESDD and NSDD by taking them as two separate regressor variables with atmospheric pressure, and relative humidity as another regressor, multiple regression has also been used in this work to develop the fourth model (model IV). The developed regression model is valid only when these certain basic assumptions are satisfied. The three basic assumptions to be checked are as follows:
Normal distribution of errors. This aspect is inferred through the normal probability plot of residuals. Corresponding to the normal probability plot of residuals, the residual points should lie approximately in a straight line. If this is satisfied, then the data points can be assumed to be normally distributed [
25,
26].
Zero mean and constant variance of errors. This is ensured through the plot of residuals and predicted data. If the plot between residuals and predicted values does not show any specific shape, the residual plot is assumed to be structured and the assumptions of constant variance to be satisfactory [
25,
26].
Errors are uncorrelated, which is observed through the plot of the residuals against run order. Ideally, a horizontal band would enclose all residuals and would fluctuate arbitrarily within the band [
25,
26].
In all the models developed in this work, the validity of assumptions was checked and found to be acceptable.
3. Samples, Experimental Details, and Test Procedure
3.1. Test Samples
In this work, the tests were conducted using standard cap-and-pin-type porcelain disc insulators, which are widely used in overhead electric power lines in India. The diameter of the disc outer rib was 254 mm, its height was 146 mm, the leakage distance was 305 mm, and the total surface area was 1599 cm2.
3.2. Experimental Setup
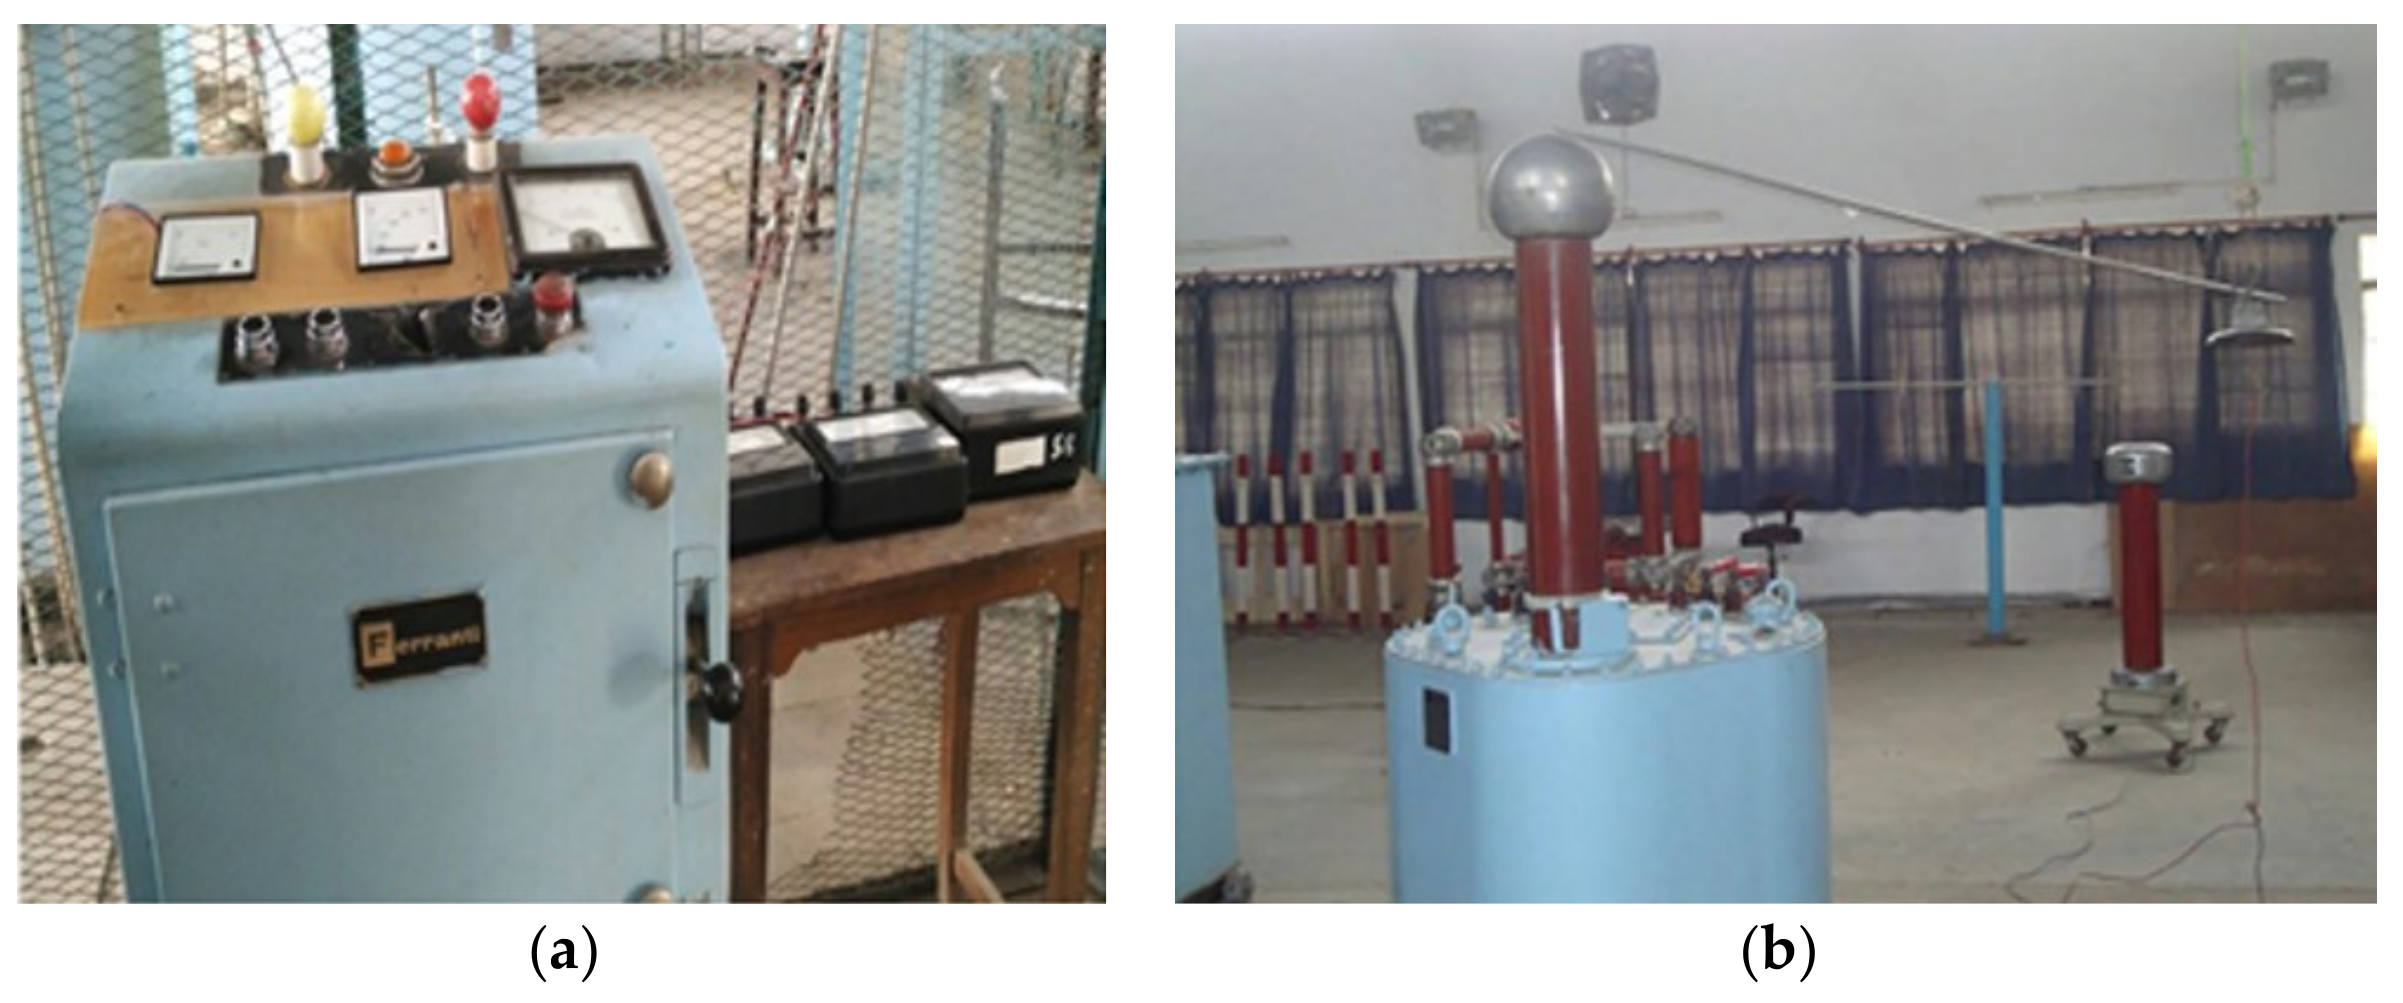
The pollution flashover tests were carried by using a 391-V/150-kV, 50-Hz, 30-kVA testing transformer, with 15 Amp of short circuit current at maximum excitation. The input power to the test transformer was supplied by a voltage regulator. The test transformer and voltage regulator are connected by cables using controlling feeders. A voltmeter (accuracy of ±3%) connected on the primary side of the transformer was used to measure low-side voltages.
Figure 1 shows the test setup, which satisfies the requirements of the pollution flashover test [
4,
15].
3.3. Test Procedure
3.3.1. Sample Preparation and Polluting
As per IEC 60507 standard [
27], the sample insulators were pre-treated to make them suitable for testing. All the samples were cleaned and washed with de-ionized water to ensure removing of all traces of dirt and grease and then left to dry naturally indoor to avoid dust particles.
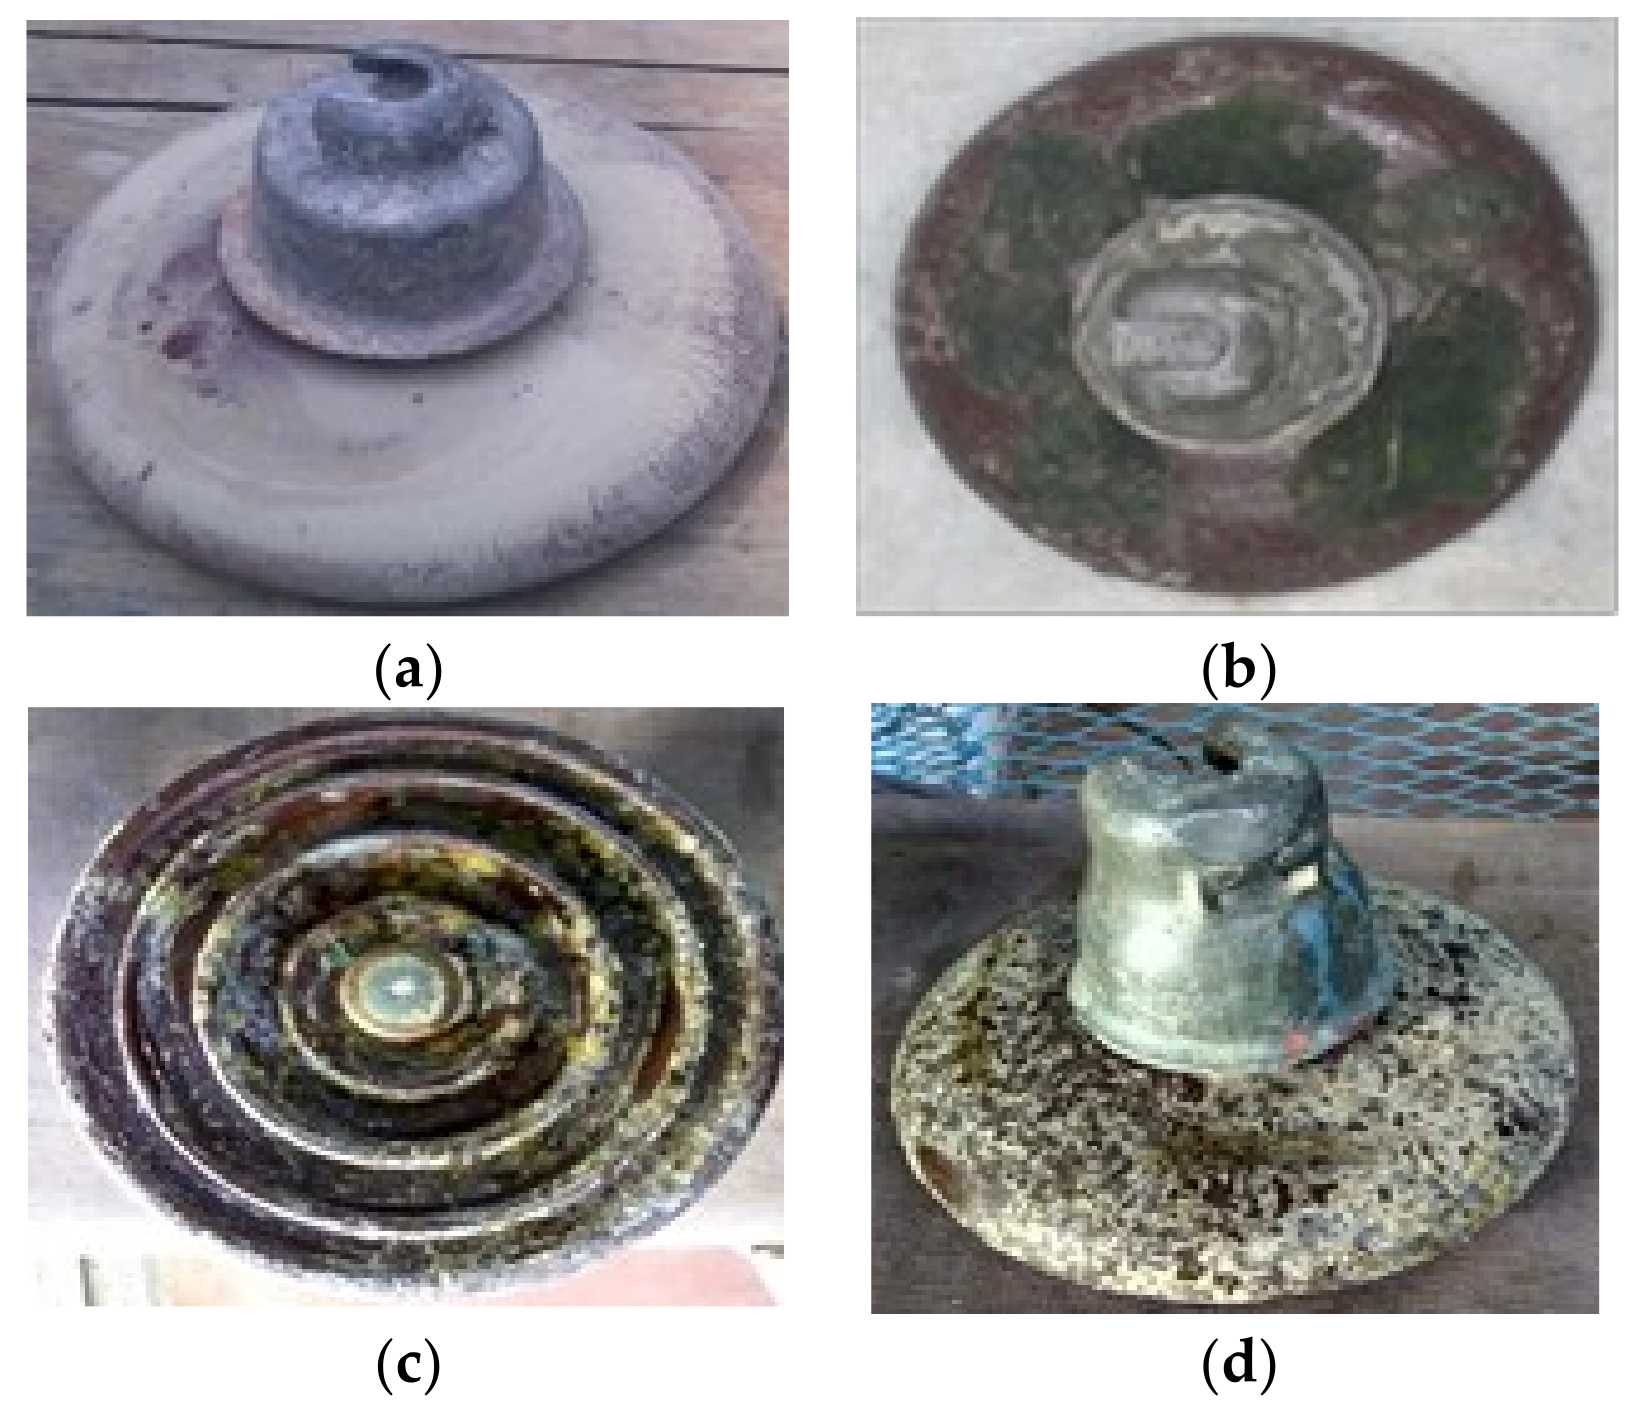
The behavior of agricultural contaminants and biological contaminants on the high voltage insulators was also investigated in this study; for this purpose, the chemical salts, which have been mainly used as agricultural fertilizers, such as NaCl, K2SO4, NaHCO3, CaSO4, KHCO3, MgSO4, ferrous ammonium sulphate, cultivated field dust, and urea were selected as agricultural contaminants. Among the agricultural pollutants NaCl, K2SO4, NaHCO3, KHCO3, MgSO4, ferrous ammonium sulphate are soluble salts, while CaSO4 and dust are partially soluble. The collected field dust is comprised of various sizes of particulate ranging from 10 microns to 100 microns (PM10 to PM100). The biological group contained algae and fungi, as they contained inert particles, both of which are partially soluble. To pollute the sample insulators, one of the standard techniques used is the solid layer method of artificial pollution, which was used in this work. For this, a contamination slurry was prepared by adding a particular set of salts to two liters of demineralized water. Then the pre-treated insulator samples were dipped carefully into the slurry for about 6 h, so the samples received an approximate uniform pollution layer and conductivity up to a certain value, after which they were removed. The same procedure was applied to every group of salt.
For the algal growth (biological pollutant) on the sample insulator, a clump of algae was taken, then the slurry was prepared with the algae (one part) and water (four parts), and one cup of yogurt was also added to thicken the mixture. The prepared mixture was then applied to the samples with the help of a brush. Then, the samples were kept in high humidity (75–85%) and sunlight. For the better growth of the algae, the sample was misted regularly (for about one-and-a-half months) until they were fully covered with algae.
To induce fungal growth on sample insulators, their surfaces were covered with a mixture of molded bread, yeast mixed in mild-warm water, and milk, with the help of a brush. Mixture-covered samples were then kept in the dark and placed into watered bowls to maintain the required humidity. After 10 days, the samples were covered with fungi. All the prepared samples are shown in
Figure 2.
3.3.2. Wetting
Before the wet flashover test, the artificially polluted samples were left to dry in the sunlight. After complete drying, they were suspended vertically in an open atmosphere under natural fog and dew for wetting. Night-to-morning fog, in December and January (the temperature range was 9–11 °C), was allowed, as all the tests were conducted during this period.
4. Measurement System
4.1. Flashover Voltage Measurement
In order to obtain the wet flashover voltage, all the flashover tests were conducted in the morning hours when the applied pollution layer was completely wetted (The temperature range varied between 13–16 °C). The samples were hung vertically with the help of a metallic hook connected to the roof of the laboratory, using a rope (see
Figure 1).
A conductor with a diameter of 10 mm was used to connect the cap of the insulator and the transformer’s terminal. The pin of the insulator was grounded. Voltage was applied across the samples and increased at a constant rate using a voltage regulator, shown in the test arrangement, until a flashover occurred. The flashover voltage was read from the low-voltage side of the voltmeter and the corresponding high voltage was calculated with the help of the calibration curve [
4,
15]. The same procedure was repeated for every pollution sample. The mean of four measurements for the same contamination set was taken as the final measured value of flashover.
4.2. Pressure, Temperature, and Humidity Measurement
The pressure was measured with the help of a barometer. Dry- and wet-bulb thermometers were used to record the temperature in the laboratory to with an accuracy of ±0.2 degrees Celsius. These temperatures were used to obtain the absolute humidity from the humidity curve and the relative humidity was calculated from the absolute humidity [
15,
23].
4.3. Pollution Severity Measurement
As discussed in
Section 2,
ESDD and
NSDD have been widely used as pollution severity indicators. To obtain
ESDD, the deposit from the whole surface of the insulator was collected into a plastic tub by washing with 100 mL of distilled water and a small, fur brush. The pollutants were mixed with washing water properly and complete saturation was ensured. The collected suspension was then poured into a beaker with the help of the flask and the conductivity of the suspension was measured using an HQ40d portable conductivity meter. The temperature was also recorded. These two parameters were used to calculate the
ESDD. The formula that was used to calculate the
ESDD is given as [
4].
where
V is the wash-water volume in mL;
A is the area of the contaminated surface in cm
2; σ is the washed suspension conductivity in mS/cm;
Ct is the temperature coefficient, ~0.02/°C; and
T is the solution temperature in °C.
To calculate
NSDD, the collected suspension was filtered (using a fine filter paper and funnel) after conductivity measurement. The filter paper with non-soluble parts was dried in an oven and weighed with and without contaminants. By obtaining both initial and final weighted values of the filter paper,
NSDD was calculated using the formula:
where
is the weight of filter paper with pollutants under the dry condition in mg;
is the weight of filter paper without pollutants under the dry condition in mg; and
A is the surface area of the insulator in cm2.
5. Experimental Results Analysis and Discussion
5.1. Analysis of Experimental Results of AC-Contaminated Flashover Voltage
The experimental test on AC pollution flashover performance of the cap-and-pin-type insulators under mentioned contaminants was carried out as described above. The obtained experimental results are displayed in
Table 1. It can be seen from
Table 1 that:
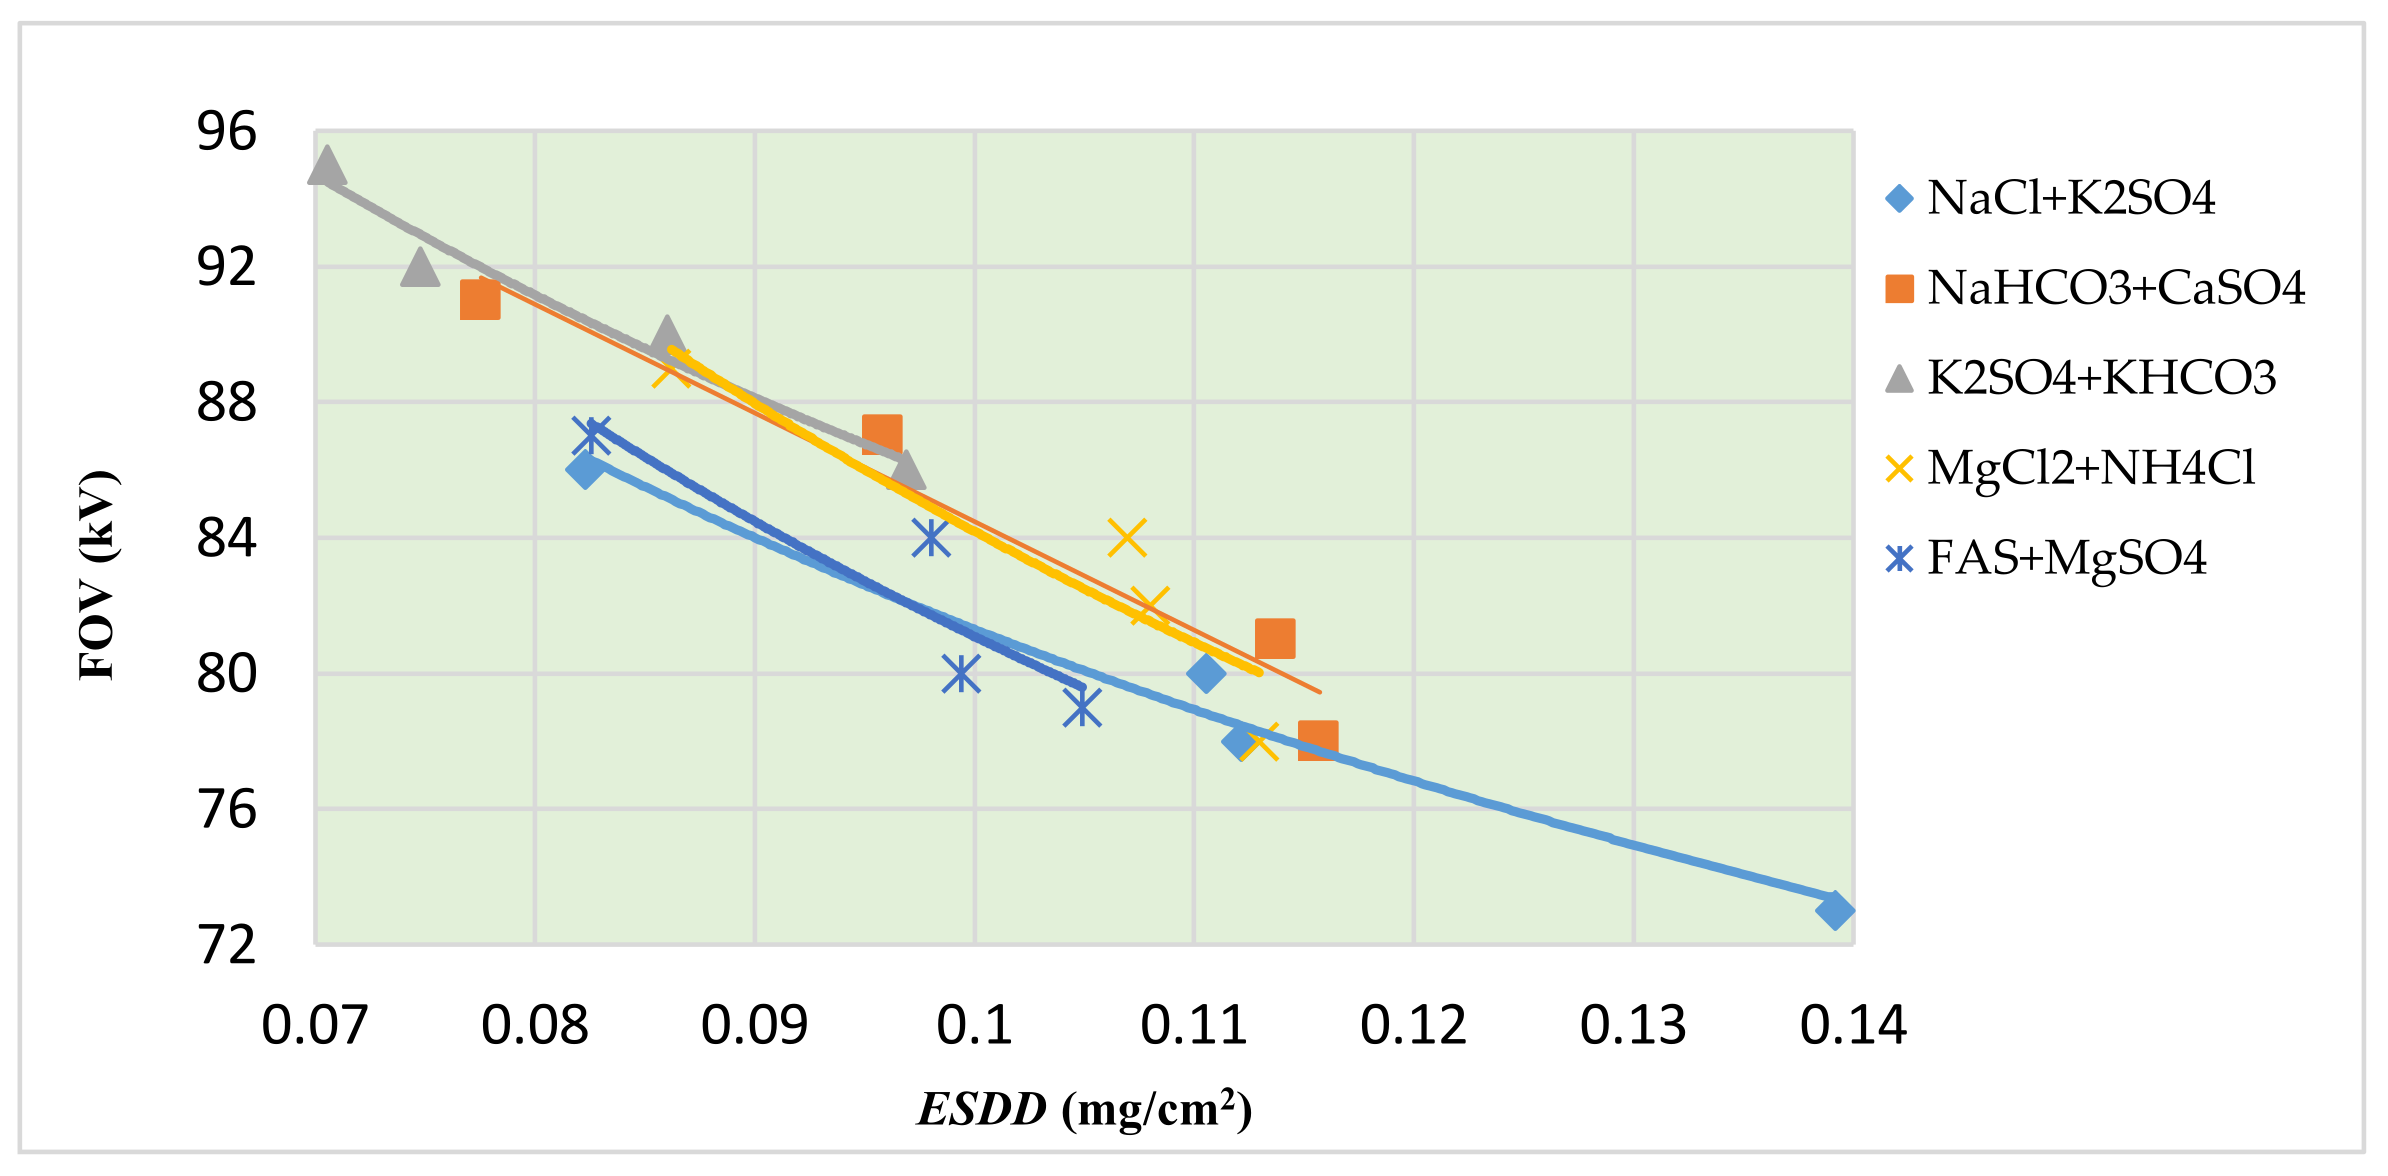
Since the various international standard classifies the severity of pollution range on high voltage insulators in terms of ESDD between very-light to extremely-severe levels i.e., from 0.0 to 1.0 mg/cm2, the concentration of pollutants and their combination were taken as per the specified ESDD level. Due to strong winds and sand storms, the dust from agricultural fields are transported to the line insulators. Moreover, when agricultural fields have been plowed for cultivation, the field dust, with the help of air or wind, settles down on the line insulators that pass through these agricultural fields. Under dry conditions, these (dust plus other particles) deposited pollutants do not much affect the dielectric strength of the high-voltage insulators; but, if these pollutants get wet in any way, such as by fog, light rain, dew, etc., they can greatly reduce the insulating capacity of the insulator. As, in the literature. Various kinds of pollutants are described, including agricultural and biological pollution that can influence the FOV performance of high voltage insulators, agricultural salts and biological pollutants were chosen as insulator pollution, here.
The tested agricultural pollutants were primarily of conductive salts and soluble in water. However, the insulators polluted with these contaminants had lower conductivity. Whereas the existing research and theoretical analysis indicate that, if pollutants are soluble, they should have higher conductivity [
4,
28]. Other than this, as the concentration of the contaminant will increase, the conductivity should also increase and the flashover voltage should decrease. Despite this fact, in this work, the flashover of the insulators contaminated with agricultural pollutants (3 to 9 in
Table 1) occurred at slightly higher values than those with partially soluble biological contaminants, because of the low level of
NSDD measured on the insulators polluted with agricultural contaminants. The variations of
FOV with
ESDD for soluble agricultural pollutants are shown in
Figure 3.
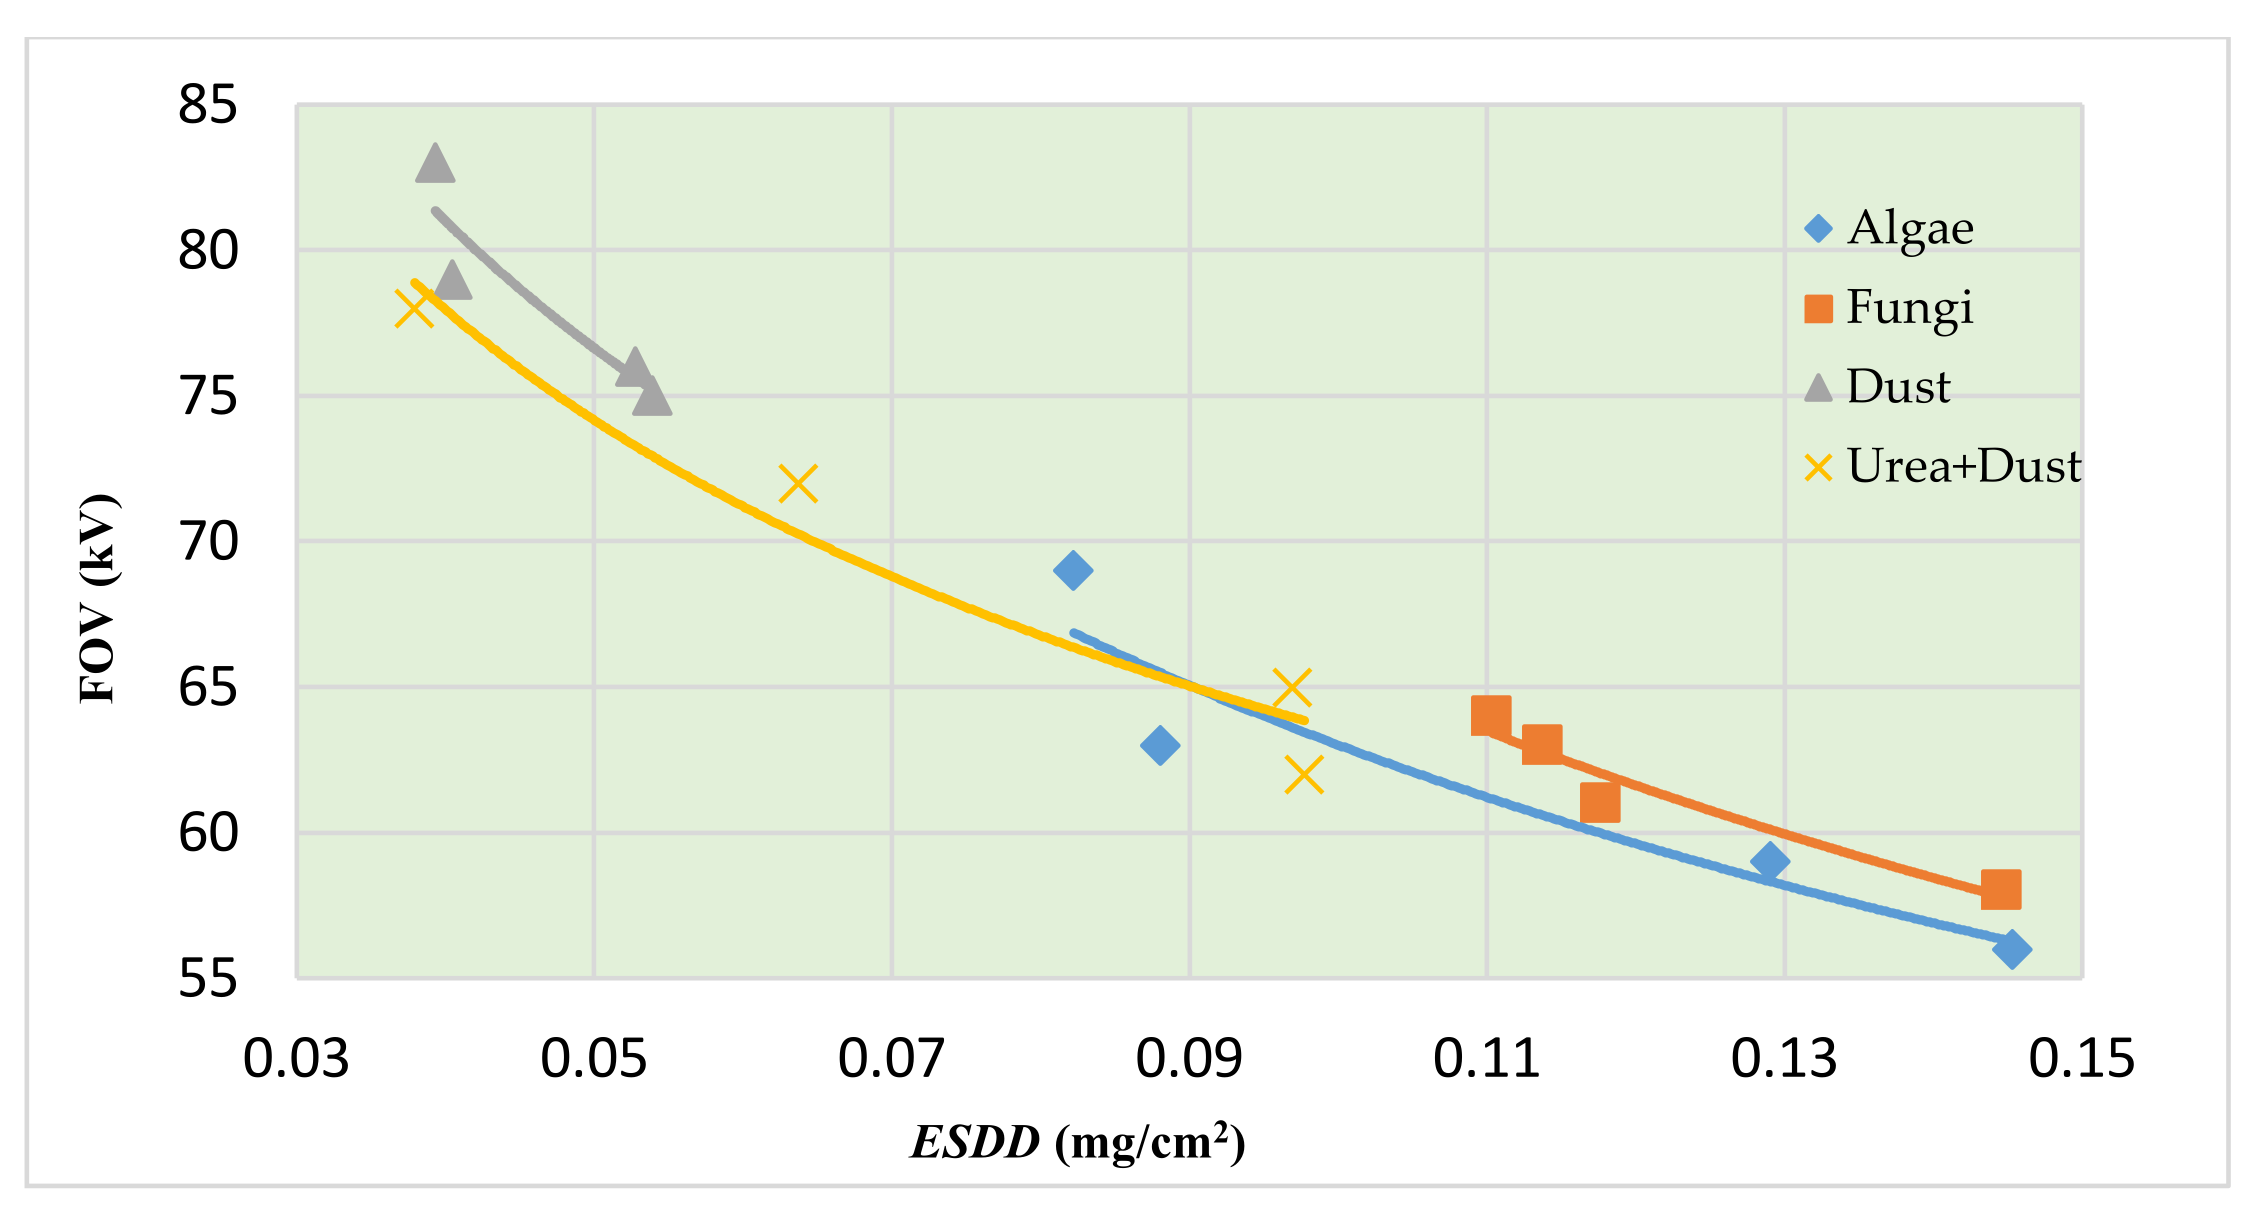
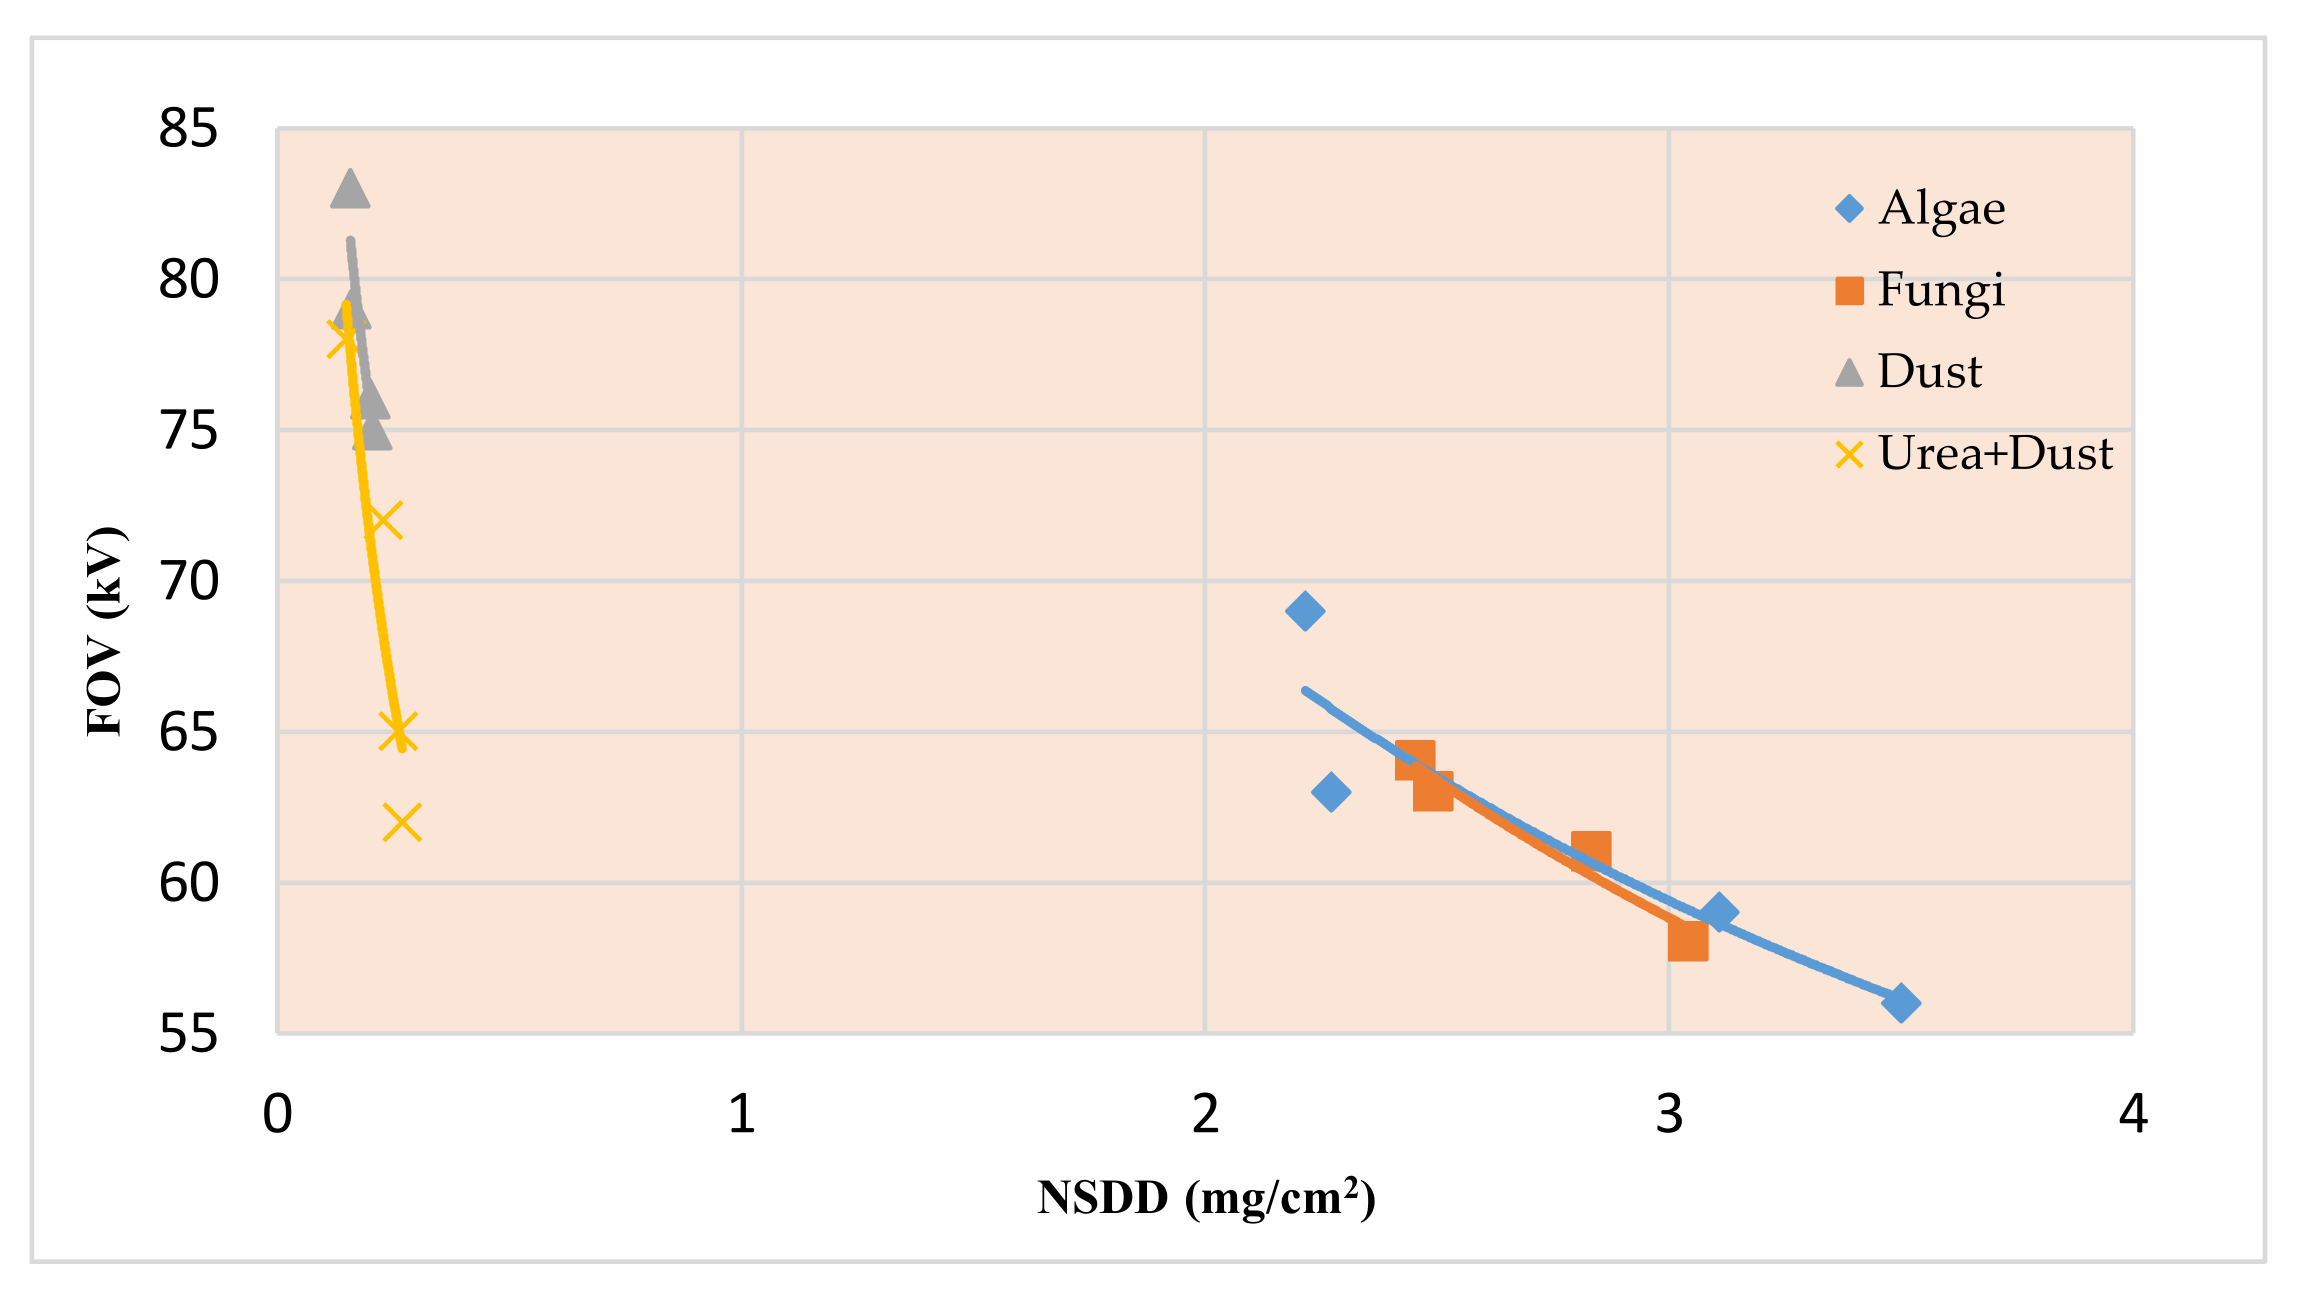
Under wet conditions, the algae- and fungi-polluted (sets 1 and 2 of the contaminants in
Table 1) insulators, at the same concentration, attained higher surface conductivity than agricultural pollutants, even though these are partially soluble in water and do not contain highly conductive constituents. The main reason behind this is that such types of contaminants have higher water-retaining capability. Due to this property of the non-soluble contaminants deposited on the insulator surface, a larger amount of leakage current could flow for long periods through the insulator surface. Thus, we can say that the higher values of
NSDD could significantly lower the flashover voltages of the insulator. Flashover voltage variations with
ESDD and
NSDD for partially soluble pollutants are shown in
Figure 4 and
Figure 5 respectively. The soluble parts in these contaminants may be attributable to the environment in which they grew; that is, to the material and salts involved in growing these contaminants, and to pH, temperature, pressure, humidity, etc.
Yet, both the agricultural and biological contaminants had a quite high degree of pollution, which is expressed in terms of the
ESDD and
NSDD, and presented in
Table 1. Additionally, the
FOV decreased with an increase in
ESDD and
NSDD. Thus, both types of pollutants could greatly affect the flashover performance of the insulators. For many years, the use of fertilizers over manure has been increasing to enhance the fertility of soil and grow increasingly more crops. Thus, to secure the insulators on lines crossing over agricultural fields from the negative impact of highly conductive fertilizer salts, condition monitoring of the insulators necessary.
The standard deviation of all the test results was lower than 16%, which means that the dispersion degree of the data achieved by the tests was small and thus the method is acceptable.
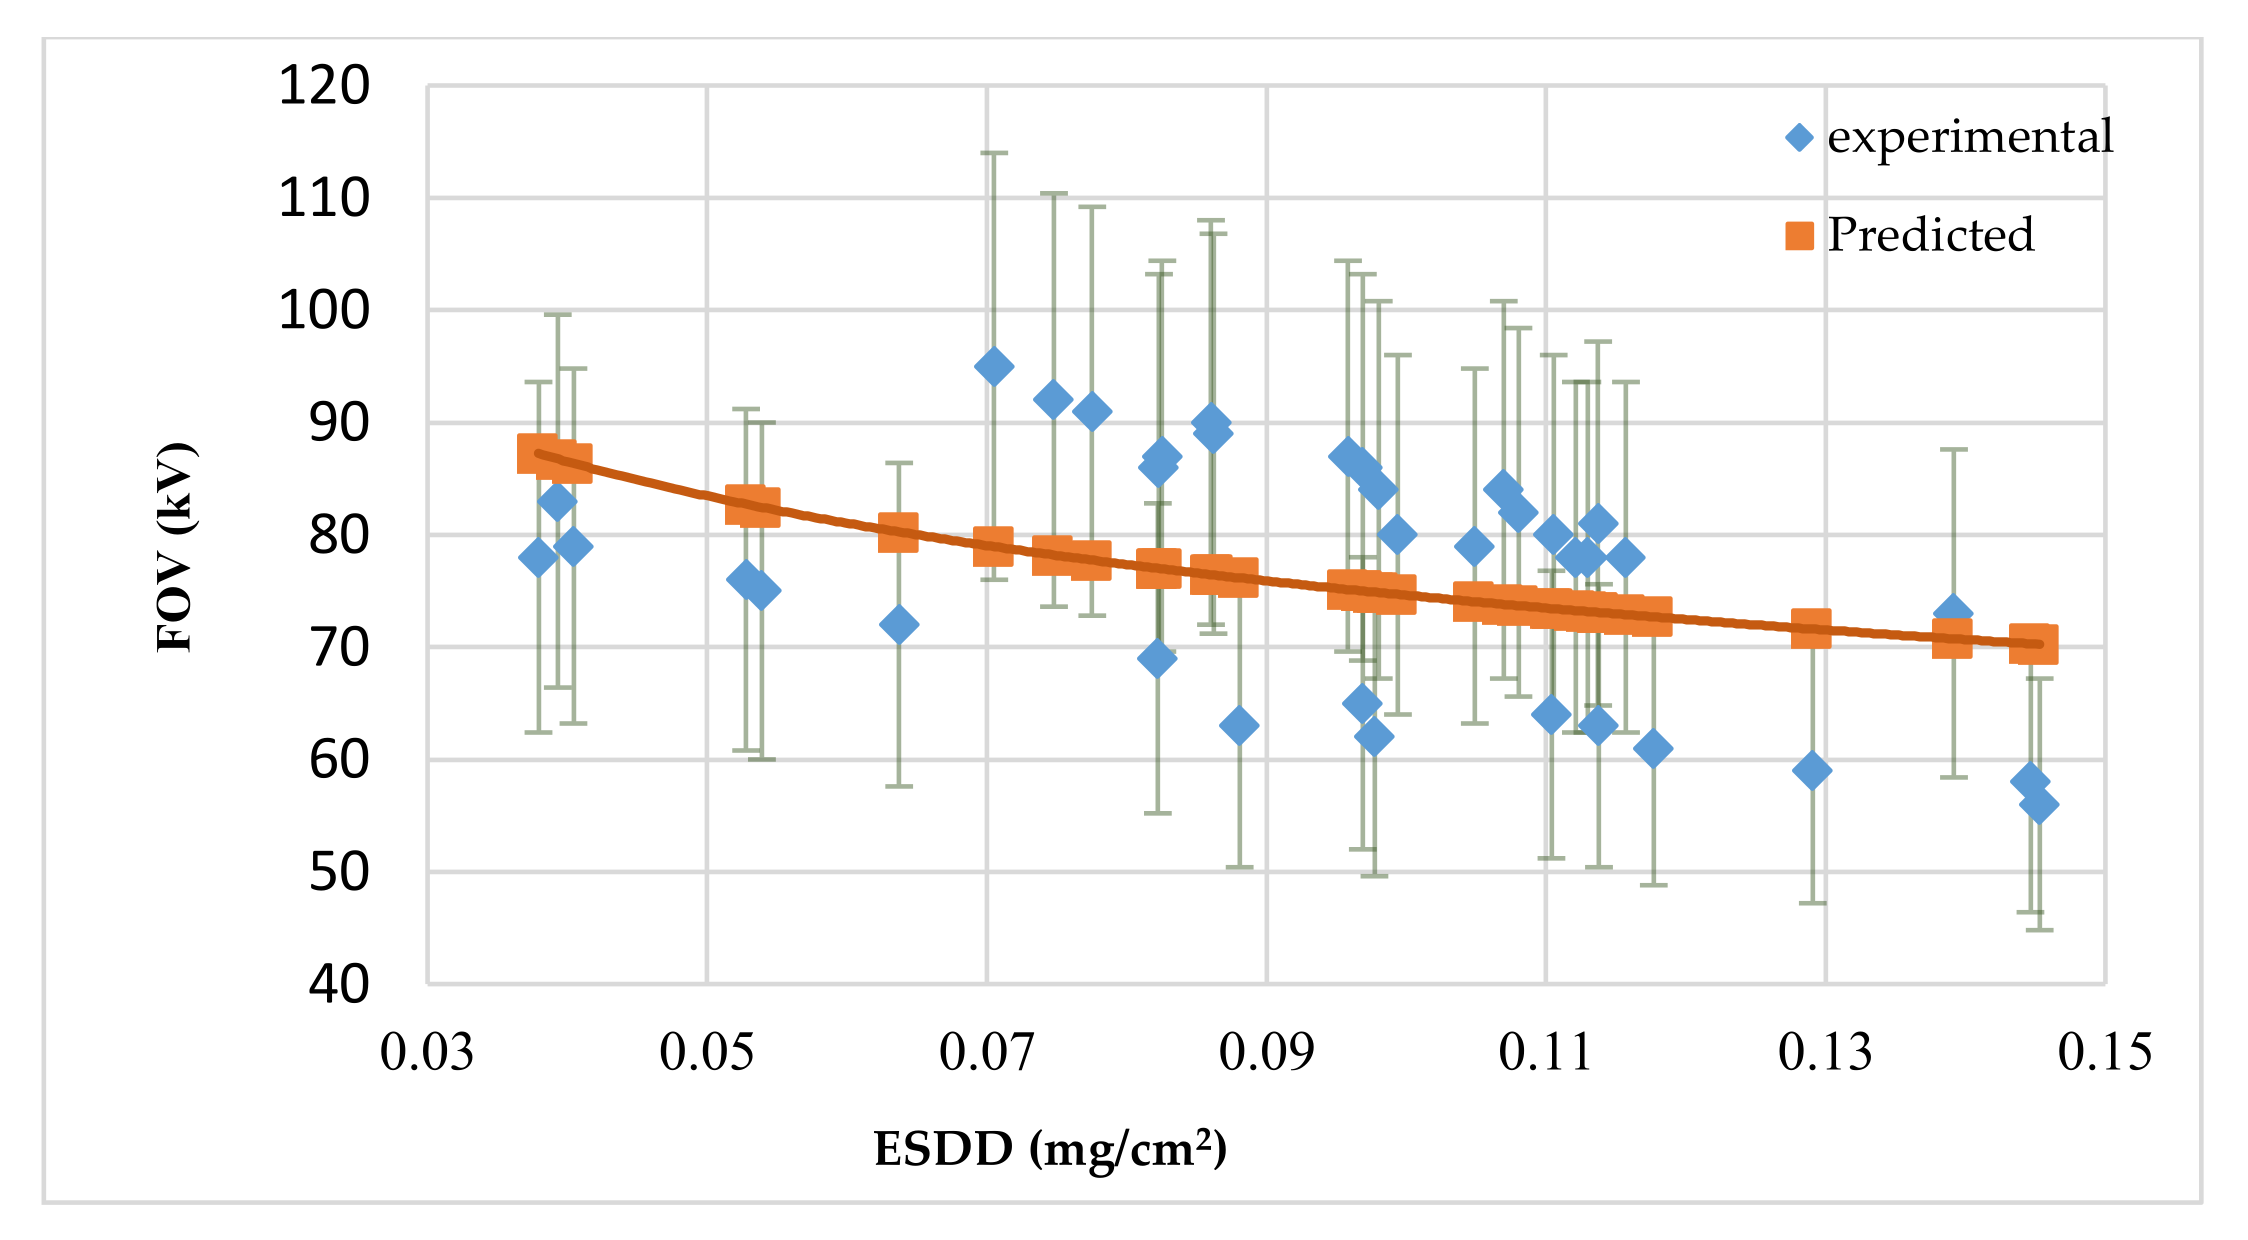
5.2. Flashover Voltage Model Based on ESDD
Flashover voltages for distinct values of
ESDD lay in the range of 0.038 to 0.145 mg/cm
2 and were obtained experimentally by using the aforesaid contaminants. According to the correlation curve fitting analysis, the
FOV and
ESDD were shown to have a negative power function, so the logarithmic values of
ESDD were used as regressors and
FOV as a response. Based on these values, Minitab was used for statistical analysis and to develop model 1 to predict the flashover voltage. The details of the statistical model are given in
Table 2.
Where:
S—standard deviation
R2—residual sum of squares
R2 (adj)—the adjusted residual sum of squares
R2 (pred)—predicted residual sum of squares
SE Coef—standard error coefficient
T-Value—standard ‘T’ statistic
p-Value—probability of testing the significance of the null hypothesis
F—standard ‘F’ statistic
DF—degrees of freedom
SS—sum of squares
MS—mean-sum of squares
The developed models were validated by the following method
Generally, the coefficient of determination (R-Sq) lies within a range of zero and one. When the value of R-Sq is high, that is, close to unity, it indicates that the model fits the data well. For this model, R-Sq = 0.1469, which means that the variability of the model was 14.69% of the data accounted for the model. R-Sq can be increased by adding more regressors to the model, but it does not compulsorily mean that such model is superior to its predecessor.
Another model coefficient, which is used to assure the closeness of the relationship between response and regressor, is the multiple correlation coefficient (R). It has a range between −1 and +1. A high value of R means a strong relationship and a small value means a weak relationship. In this model R = 0.383, which indicated that the relationship between FOV and ESDD was fairly strong, and that the model developed was quite significant for the given data set.
Similarly, the coefficient of adjustment of R-Sq (R-Sq(adj)) measures the proportion of the variation in the response variable. For this model, R-Sq(adj) = 0.1219, which means that the model had a 12.20% ability to explain the variability in the response variable. However, the statistical results of the model had low R-Sq values, meaning few data points lay on the model curve; still, it gives the best-fitting curves based on the least sum of squares. On the other hand, the results showed a low
p-value, which indicated that the model still had a quite significant relationship between
FOV and
ESDD.
Figure 6 shows the fitness of the model values’ curve of
FOV for the given data set of the
ESDD with the experimental
FOV values. The results found were reasonable and the close curves indicated the fitness of the model with the experimental data, which means that this model had suitable validity for
FOV prediction for the tested contaminants.
5.3. Flashover Voltage Model Based on NSDD
The values of
NSDD and their corresponding flashover voltages were collected from experiments on cap-and-pin-type porcelain insulators under partially soluble agricultural and biological contamination conditions. Like the
ESDD,
NSDD also shows the non-linearity of the flashover voltage. So, here are, also, the logarithmic values of
NSDD, used as a regressor, and of
FOV, used as the response. Based on these values, model 2 was developed. The statistical details of the model are presented in
Table 3.
The data in
Table 3 shows that all R-Sq values are close to 0.99, which means that the flashover voltage and
NSDD were strongly correlated to each other. Other test parameters of the model in the above table, such as the high ‘F’ ratio and low
p-value, indicated the good correlation between
FOV and
NSDD. Thus, it can be concluded that the model had an acceptable performance with the input values of
NSDD in investigating the dependency of the
FOV on
NSDD, and
NSDD was also a good indicator of pollution monitoring at the control station.
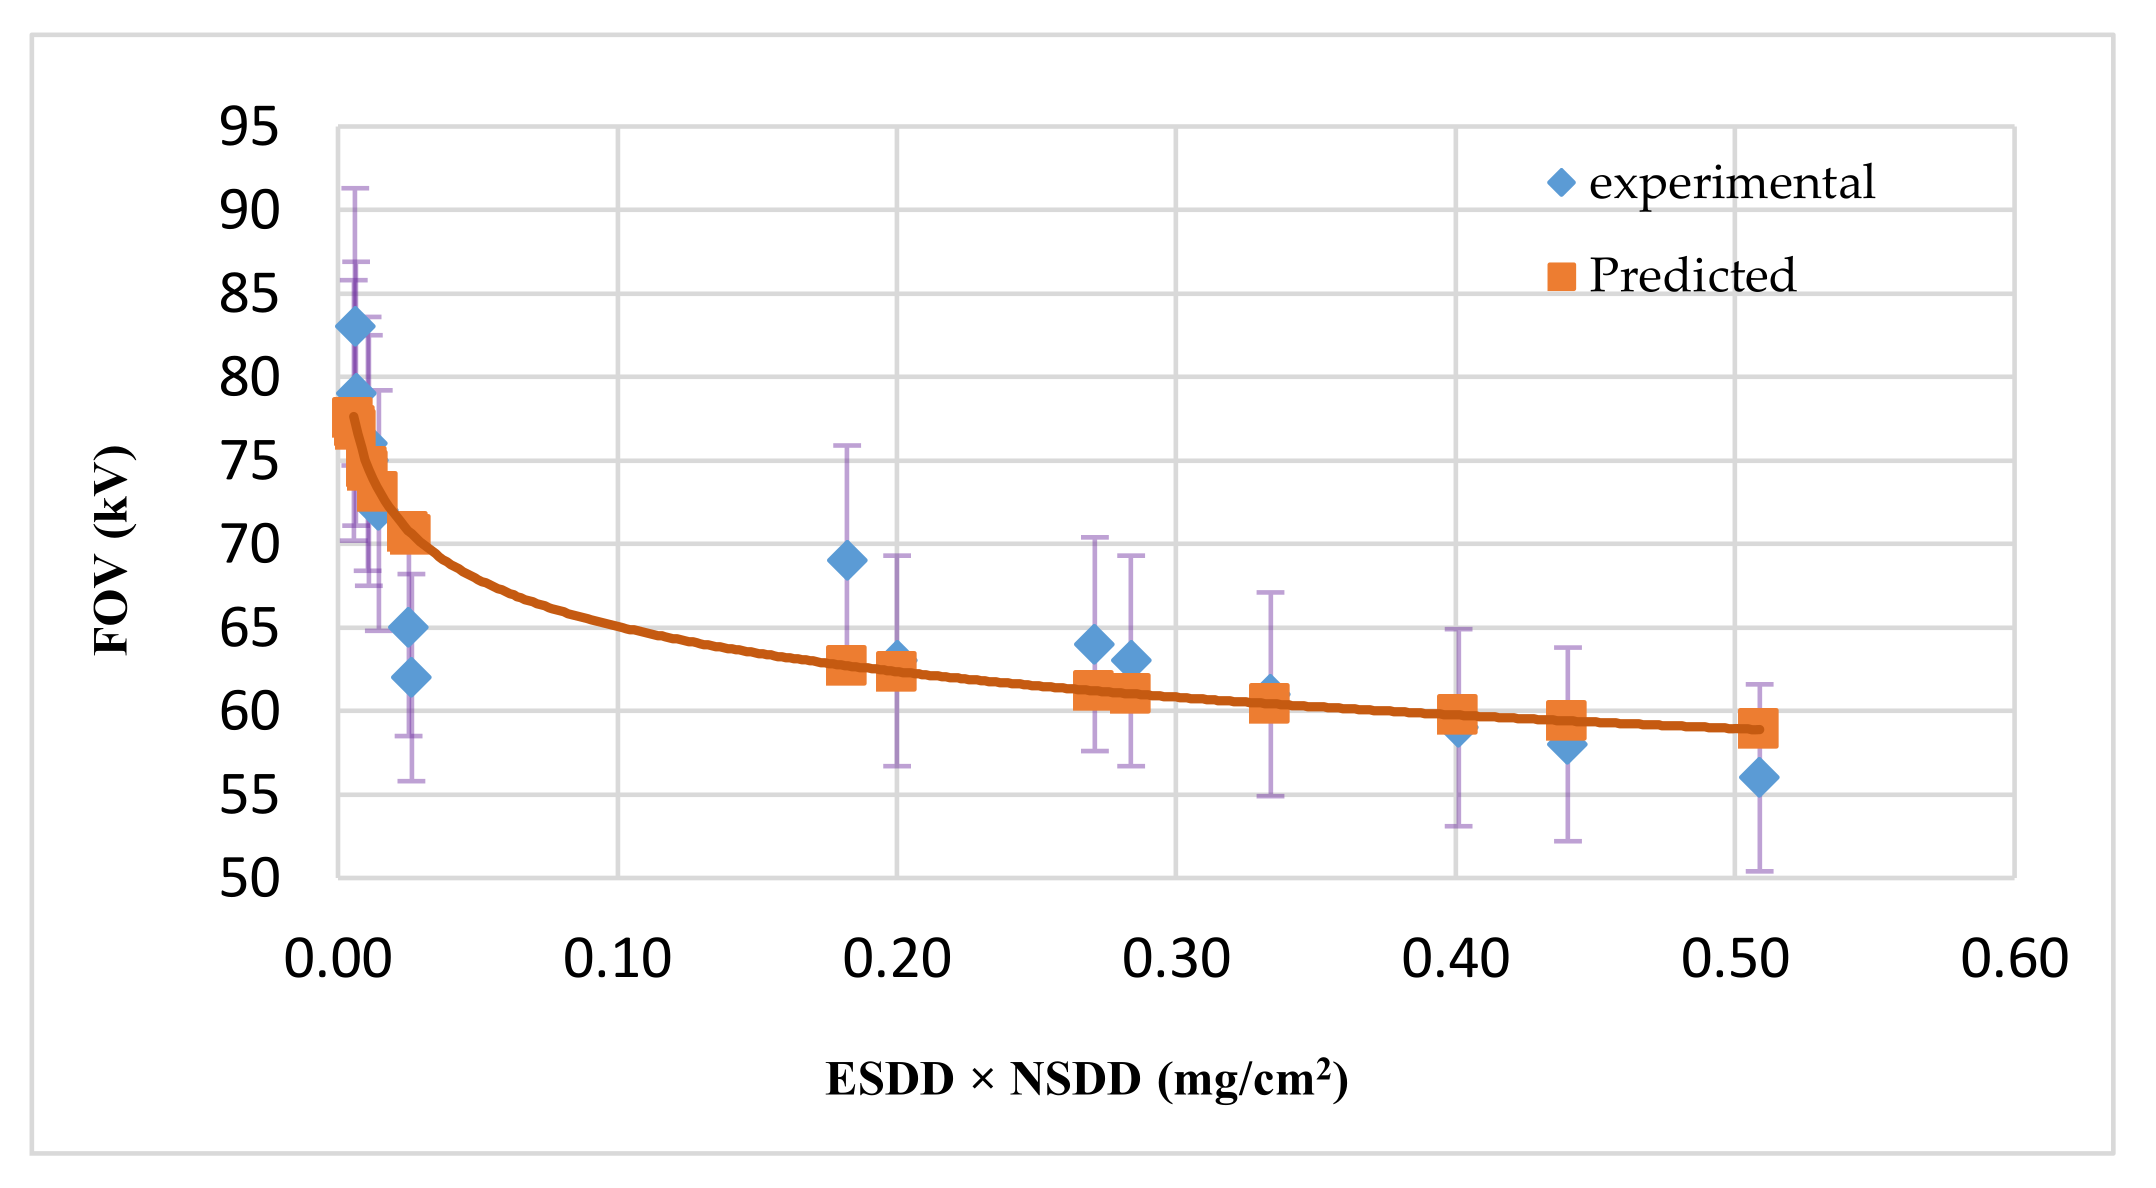
5.4. Flashover Voltage Model Based on the Combined Effect of ESDD and NSDD
It was found, in previous research, that both the
ESDD and
NSDD influence the pollution flashover voltage independently [
21]. However, here an attempt was made to develop the model by considering that the product of
ESDD and
NSDD for an individual set of data is a single regressor variable and that
FOV is the response variable. Therefore, the correlation between
FOV and the product of salt deposit densities can be expressed as follows:
where
C is a coefficient related to the geometrical configuration of insulators and c is an exponent representing the effect of the product of salt deposit densities on flashover voltages.
The details of the model displayed in
Table 4 can explain that the model found is highly significant and had a quite strong relationship between the product of salt deposit densities and the
FOV. Thus, we can say that the product of salt deposit densities may be taken into account to predict the flashover voltages of polluted insulators. Based on the least-square criteria that minimize the sum of squares of the deviation, standard deviation S was as minimal as possible (5.76%). The fitness curve of the prediction model’s values of flashover voltage with the experimental values is shown in
Figure 7, and all the points are within the limits of less than 10% error, meaning that the fitted model is valid in the present case.
Therefore, it is seen that the analysis of the
FOV performance of the insulators polluted with agricultural (soluble and partially soluble) and biological pollutants, with respect to
ESDD,
NSDD, and their products and ratios characteristics, lead to the following models, which can be used to predict flashover voltages and to design insulators for such particular environmental conditions. The model equations can be expressed as:
5.5. Flashover Voltage Model Based on ESDD, NSDD, Atmospheric Pressure, and Relative Humidity
From the review of the literature, it was found that climatic conditions, such as atmospheric pressure (
AP), air humidity, wind speed, and wind direction are equally important as salt deposit densities in monitoring and predicting the flashover voltage performances of field insulators. Here, one more mathematical model was developed by using multiple linear regressions. In this model
ESDD,
NSDD, atmospheric pressure, and relative humidity (
RH in %) were taken as regressor variables and
FOV as a response variable. During the experiment done to measure the
FOV,
ESDD, and
NSDD for the agricultural- and biological-pollution-contaminated insulators, atmospheric pressure and relative humidity of the air were also recorded. Thus, the experimental data collected for each variable was used as raw data to build the model. The multiple regression equation and other statistical parameters of the model for this case are summarized in
Table 5.
The model coefficients R-Sq, R-Sq(adj) and R-Sq(pred) were very close to unity. From this, it is clear that the model fit the data well and that there was a very strong relationship between the regressor variable and response variable. From the model equation in the table, we can predict the rate of response of FOV to the change in the predictor variables, meaning that the model was valid for the prediction of flashover voltages for high-humidity areas where algae and fungi can easily grow, and also for the regions where power lines pass over agricultural fields.
6. Conclusions
In this study, the influence of biological and agricultural contaminants on the flashover performance of porcelain insulators has been investigated, because the studies on this topic are very few. From the experiment, it is observed that the agricultural contaminants, comprising dust, soluble chemical salts, and inert particles, can reduce the flashover voltage of the insulators up to 16% for the given case when ESDD yield is in the range of 0.0379–0.1453 mg/cm2. The humidity and thickness of pollutants on the insulators are also important factors that determine the wet flashover voltage performance of the insulator. If the case where humidity on the insulator surface is found less, while the NSDD value on the insulator is high, it has been found that the insulator flashover performance falls at a higher rate than in the case where the humidity on the insulator surface is high and NSDD is low. It is due to the ambient air effect on the insulator; under high moisture and low humidity, it dries earlier, while the insulator surface with low moisture and high NSDD dries later because of the higher water retention capability of the inert particles (NSDD). Yet, due to the higher water retention capacity of the biological contaminants, they can more affect the insulator flashover performance than can agricultural contaminants. A relative humidity greater than 85% reduces the flashover voltage abruptly. It is also found that the conductivity of the contaminated insulator surface and ESDD have a non-linear relationship, in contrast to that with the amount of salt concentration. Similarly, the relationships of the ESDD, NSDD, temperature, and pressure with FOV are also found non-linear. By using regression analysis (simple and multiple) techniques, different models have been developed to widen the validity of theoretical models for evaluating and determining the flashover performance of porcelain insulators. The models evolved here are based on contamination severity approaches (ESDD and NSDD), temperature, atmospheric pressure, and relative humidity. For all the models developed, the model performance evaluation parameters i.e., the R-sq, multiple correction coefficients (R), and the p-values, determine the degree of relationship between the dependent and independent variables. The model based on ESDD only has R-sq = 0.1559, R (multiple) = 0.383, and p-value = 0.021; for the model that is based on NSDD, R-sq = 0.684, R (multiple) = 0.827, and p-value = 0.000; for the model based on the product of NSDD and ESDD, the values of the evaluation parameters are R-sq = 0.794, R (multiple) = 0.891, and p-value = 0.000; and, for last model, is R-sq = 0.965, R (multiple) = 0.953, and p-value = 0.000. Values of all these parameters for each developed model indicate that a good degree of relationship exists between experimental and predicted values for the given data set. As values of R-sq and R (multiple) are close to 1 and the p-value is less than 0.05 for all the models (which are the criteria for determining the accuracy and validity of the model), they fulfill, here, such criteria for the models developed in this study. It has been illustrated that the model equations developed for the selected pollutants can be used to estimate and predict the flashover voltage of insulators that are normally operating in tropical areas, where ambient humidity remains high throughout the year and such type of pollution is very common. This can be taken as an elementary reference value also with which to predict the flashover voltage of contaminated insulators.
Author Contributions
Conceptualization, S.K., M.T. and A.A.K.; Formal analysis, S.K., M.T., A.A.K., B.A. and L.M.-P.; Funding acquisition, M.T. and B.A.; Investigation, S.K., M.T. and A.A.K.; Methodology, S.K., M.T. and A.A.K.; Supervision, M.T. and A.A.K.; Validation, S.K. and M.T.; Writing—original draft, S.K.; Writing—review and editing, M.T., A.A.K., B.A. and L.M.-P. All authors have read and agreed to the published version of the manuscript.
Funding
This research was funded in part by Taif University Researchers Supporting Project Number (TURSP-2022/278), Taif University, Taif, Saudi Arabia, in part by the Smart City Development Consultancy Project and Collaborative Research Grant Scheme [CRGS/MOHD TARIQ/01 and CRGS/MOHD TARIQ/02] projects, Department of Electrical Engineering, Aligarh Muslim University, India.
Acknowledgments
The authors also acknowledge the technical support provided by the Hardware-In-the-Loop (HIL) Lab and High Voltage Lab, Department of Electrical Engineering, Aligarh Muslim University, India.
Conflicts of Interest
The authors declare no conflict of interest.
References
- Jiang, X.L.; Dong, B.B.; Hu, Q.; Yin, F.H.; Xiang, Z.; Shu, L.C. Effect of ultrasonic fog on AC flashover voltage of polluted porcelain and glass insulators. IEEE Trans. Dielectr. Electr. Insul. 2013, 20, 429–434. [Google Scholar] [CrossRef]
- Khatoon, S.; Khan, A.A.; Singh, S. A Review of the flashover performance of high voltage insulators constructed with modern insulating materials. Trans. Electr. Electron. Mater. 2017, 18, 246–249. [Google Scholar]
- Zhang, D.; Zhang, Z.; Jiang, X.; Yang, Z.; Liu, Y.; Bi, M. Study on the flashover performance of various types of insulators polluted by nitrates. IEEE Trans. Dielectr. Electr. Insul. 2017, 24, 167–174. [Google Scholar] [CrossRef]
- Khatoon, S.; Khan, A.A.; Sharma, A. Study the effect of contaminants on flashover performance of porcelain disc insulator by artificial pollution testing. In Proceedings of the IEEE International Conference on Recent Advances and Innovations in Engineering, Jaipur, India, 23 December 2016. [Google Scholar]
- Topalis, F.V.; Gonos, I.F.; Stathopulos, I.A. Dielectric behaviour of polluted porcelain insulators. IEE Proc. Gener. Transm. Distrib. 2001, 148, 269–274. [Google Scholar] [CrossRef] [Green Version]
- Stimper, K.; Middendorf, W.H. Mechanism of deterioration of electrical insulation surfaces. IEEE Trans. Electr. Insul. 1984, EI-19, 314–320. [Google Scholar] [CrossRef]
- Ramos, N.G.; Campillo, R.M.T.; Naito, K. A study on the characteristics of various conductive contaminants accumulated on high voltage insulators. IEEE Trans. Power Deliv. 1993, 8, 1842–1850. [Google Scholar] [CrossRef]
- Forrest, J.S.; Lambeth, P.J.; Oakeshott, D.F. Research on the performance of high voltage insulators in polluted atmospheres. Proc. IEE Part A Power Eng. 1960, 107, 172–187. [Google Scholar] [CrossRef]
- Ren, A.; Liu, H.; Wei, J.; Li, Q. Natural Contamination and Surface Flashover on Silicone Rubber Surface under Haze–Fog Environment. Energies 2017, 10, 1580. [Google Scholar] [CrossRef] [Green Version]
- Hampton, B.F. Flashover mechanism of polluted insulation. Proc. IEE 1964, 111, 985–990. [Google Scholar] [CrossRef]
- Shu, L.C.; Jiang, X.L.; Sun, C.; Tian, Y.; Farzaneh, M.; Li, Y.; Zhang, J. AC flashover performance of artificial iced and polluted insulators at high altitude districts. In Proceedings of the Thirteenth International Offshore and Polar Engineering Conference, Honolulu, HA, USA, 25 May 2003; pp. 403–408. [Google Scholar]
- Houlgate, R.G.; Swift, D.A. Composite Rod Insulators for AC Power Lines: Electrical Performance of Various Designs at a coastal testing Station. IEEE Trans. Power Deliv. 1990, 5, 1944–1955. [Google Scholar] [CrossRef]
- Gouda, O.E.; El Dein, A.Z. Simulation of overhead transmission lines insulators under desert environments. IET Gener. Transm. Distrib. 2013, 7, 9–13. [Google Scholar] [CrossRef]
- McAfee, R.D.; Heaton, R.D.; King, J.M.; Falster, A.U. A study of biological contaminants on high voltage porcelain insulators, I. Electr. Power. Syst. Res. 1997, 42, 35–39. [Google Scholar] [CrossRef]
- Khan, A.A.; Husain, E.; Masood, A. Effect of Contaminant pH and Natural Fog on Naturally Polluted Porcelain Disc Insulator in Northern Region of India. In Proceedings of the 2009 IEEE Conference on Electrical Insulation and Dielectric Phenomena, Virginia Beach, VA, USA, 18–21 October 2009; pp. 343–347. [Google Scholar] [CrossRef]
- Palangar, M.F.; Mirzaie, M. Improved mathematical model of polluted insulators nonlinear behaviour under ac voltage based on experimental test. Charact. Appl. Nanomater. 2019, 2, 541. [Google Scholar] [CrossRef]
- Zhang, Z.; Qiao, X.; Zhang, Y.; Tian, L.; Zhang, D.; Jiang, X. AC flashover performance of different shed configurations of composite insulators under fan-shaped non-uniform pollution. High Volt. IET 2018, 3, 199–206. [Google Scholar] [CrossRef]
- Ming, L.; Yangyang, L.; Jianlin, A.H. Influence of Sheds Damage on the AC Pollution Flashover Performance of Different Voltage Class Composite Insulators. IEEE Access 2020, 8, 84713–84719. [Google Scholar] [CrossRef]
- Al-Mahdawi, E. Experimental study of porcelain and toughened glass suspension insulators under desert contamination. Earth Environ. Sci. 2021, 779, 012060. [Google Scholar] [CrossRef]
- Prakash, N.B.; Parvathavarthini, M.; Madavan, R. Mathematical modelling on AC pollution flashover performance of glass and composite insulator. J. Electr. Eng. Technol. 2015, 10, 1796–1803. [Google Scholar] [CrossRef] [Green Version]
- Venkataraman, S.; Gorur, R.S. Extending the applicability of insulator flashover models by regression analysis. IEEE Trans. Dielectr. Electr. Insul. 2007, 14, 368–374. [Google Scholar] [CrossRef]
- Ahmad, A.S.; Ahmad, H.; Salam, M.A.; Saad, A. Regression technique for prediction of salt contamination severity on high voltage insulators. Proc. Annu. Report. Conf. Electr. Insul. Dielectr. Phenom. 2000, 1, 218–221. [Google Scholar] [CrossRef] [Green Version]
- Sahli, Z.; Mekhaldi, A.; Boudissa, R.; Boudrahem, S. Prediction parameters of dimensioning of insulators under non-uniform contaminated conditions by multiple regression analysis. Electric. Power. Syst. Res. 2011, 81, 821–829. [Google Scholar] [CrossRef]
- Zhang, Z.; You, J.; Zhang, D.; Jiang, X.L.; Hu, J.L.; Zhang, W. AC flashover performance of various types of insulators under fan-shaped non-uniform pollution. IEEE Trans. Dielectr. Electr. Insul. 2016, 23, 1760–1768. [Google Scholar] [CrossRef]
- Montagomery, D.C.; Peck, E.A.; Vining, G.G. Introduction to Linear Regression Analysis, 3rd ed.; John Wiley and Sons: New York, NY, USA, 2001. [Google Scholar]
- Rawlings, J.O.; Pantula, S.G.; Dickey, D.A. Applied Regression Analysis: A Research Tool, 2nd ed.; Springer: Berlin/Heidelberg, Germany, 1999. [Google Scholar]
- IEC 60507; Artificial Pollution Tests on High-Voltage Ceramic and Glass Insulators to Be Used on A.C. Systems. IEC: London, UK, 2012.
- Atkins, P.; Julio, D.P. Physical Chemistry, 8th ed.; Oxford University Press: Oxford, UK, 2006. [Google Scholar]
- Salam, M.A.; Mohammed, N.; Nadir, Z.; Maqrashi, A.A.; Al Kaf, A. Measurement of conductivity and equivalent salt deposit density of contaminated glass plate. Proc. IEEE Int. Conf. 2004, 3, 268–270. [Google Scholar] [CrossRef]
| Publisher’s Note: MDPI stays neutral with regard to jurisdictional claims in published maps and institutional affiliations. |
© 2022 by the authors. Licensee MDPI, Basel, Switzerland. This article is an open access article distributed under the terms and conditions of the Creative Commons Attribution (CC BY) license (https://creativecommons.org/licenses/by/4.0/).


