
Modeling of Double Stage Photovoltaic Inverter System with Fast Delayed Signal Cancellation for Fault Ride-Through Control Application in Microgrids


Department of Electrical Power Engineering, Durban University of Technology, Durban 4001, South Africa
*
Author to whom correspondence should be addressed.
Energies 2022, 15(3), 701; https://doi.org/10.3390/en15030701
Submission received: 9 December 2021
/
Revised: 20 December 2021
/
Accepted: 28 December 2021
/
Published: 19 January 2022
(This article belongs to the Special Issue Advances in Power System Analysis and Control)
Abstract
:This research presents a secondary control for a grid-supporting microgrid with photovoltaics sources to guarantee grid code compliance and ancillary services. The secondary control accomplishes the fault ride-through, which implements a delayed signal cancellation (DSC) algorithm for negative sequence detection. Without mode switching, the proposed control strategy meets grid code requirements and ensures voltage regulation at the secondary level, which is active and more salient throughout the transient period of host grid disturbances. This control also ensures a constant supply of the microgrid’s sensitive local load while adhering to grid code requirements. Similarly, active power injection into the main grid is limited by progressively altering the MPPT operating point dependent on the depth of voltage sag to optimize reactive power injection to sustain grid voltage sag. The recommended secondary control is triggered by utilizing the DSC process’s detection algorithm to identify the occurrence of a fault in a tiny fraction of a half-cycle in a grid fault. Consequently, while satisfying microgrid load needs, the devised technique guaranteed that increases in DC-link voltage and AC grid current were controlled. MATLAB Simscape ElectricalTM and OPAL-RT Lab are used to do time-domain simulations of the model using the recommended secondary control systems.
1. Introduction
According to current grid code standards, in response to a disturbance in the main grid causing voltage sags, grid-connected inverter-based microgrids must stop powering the microgrid loads. In addition, low-voltage microgrids must be disconnected from the host grid before 120 cycles of voltage sag between 0.5 and 0.9 per unit, according to the IEEE Std 929-2000 standard [1,2]. Previously, ancillary services, such as fault ride-through (FRT), were not considered part of the scope of microgrids and were not required [3]. However, isolating a microgrid with a high RES penetration from the main grid in response to disruptions or grid faults has a major impact on the utility system’s power quality, operation, and stability [4,5]. Therefore, a utility grid’s microgrid or DER reactive power supply can minimize overall grid instability while meeting sensitive load needs [6]. As a result of the rising DER integration, grid codes must be updated with their appropriate specifications, especially at active distribution systems. Existing investigations [7,8,9] have shown that DER may play a substantial role in overall system stability and that photovoltaic systems can provide ancillary services to ease grid and power electronics difficulties [10]. Furthermore, several studies are underway to ensure that microgrids can have qualities like FRT and inertia, even on low-voltage networks [11]. Similarly, the problems posed by substantial DER grid penetration, particularly PV systems, are anticipated and expected, thereby demanding improved control to address these potential issues. As a result, revising the existing grid code requirements is required to allow for a large-scale deployment of low-voltage DER with FRT capabilities [12].
As a result, some developed countries have amended their respective grid codes to improve RES efficiency. In 2004, 2006, and 2008, Spain, Germany, and Denmark were among the first countries that issued the FRT requirements for DERs connected to the grid [13,14]. The Spanish, Danish, and Chinese code requirements are displayed in Figure 1 accordingly [9,10]. In particular, when the grid-connected units are above the lines, they need to be connected to the grid instead of stopping power generation. Therefore, DER or Distributed Generator (DG) systems will remain connected if the voltage amplitude is above the lines. Nevertheless, in China, the voltage is also regulated, with DER/DG systems working in high voltage ride-through (HVRT) if the voltage magnitude is higher than the rated nominal value, nonetheless within limits [15]. It means that if the voltage level is too high, HVRT should be enabled. In the case of grid failures (voltage sags), grid-supporting schemes must resist disconnection and stay operational under fault duration. Even though these requirements are projected for the high-voltage network, they are valid for the low-voltage grid due to similar concepts [11] and increasing penetration at the low-voltage level. Voltage sags resulting from fault and other transient disturbances are severe challenging events in grid-connected systems. Because of power line short circuits, lightning strikes, and load dynamics, the magnitude of the grid-voltage can momentarily drop to a particular point, including zero levels. In such situations, the abrupt shutdown of large DER/DG systems will trigger the collapse of power system distribution [15]. Henceforth, it is obligatory for grid-synchronous DER/DG units to momentarily ride-through grid voltage sags. Simultaneously, the DER/DG units should provide dynamic grid supports by contributing reactive power to aid the grid to withstand the transients.
Aside from FRT, future inverter-based microgrid systems are expected to integrate grid support, grid fault resistance, dynamic power regulation, and smart ancillary service supply at the PCC [17,18]. Additionally, as soon as the grid voltage recovers or the fault is cleared, the PV system is required to function at its maximum active power point for a set time at a power factor of unity. Grid disturbances are unavoidable, resulting in periodic voltage sags and posing a considerable challenge to the power inverters. To enable seamless operational changes, traditional inverter control methods must be upgraded to handle these rigorous and important operating parameters. Although reactive power injection via interface inverters is an important issue in control design, reactive power injection is allowed without exceeding operational power restrictions. Dynamic grid voltage support is a critical necessity during different degrees of voltage sag in grids. During fault ride-through operation, reactive current injection takes precedence. Furthermore, reactive power injection through interfacing inverters should be considered in controller design, and thus, reactive power injection is permitted without exceeding the operational power limits [19,20]. In such a way, a microgrid’s DER/DG systems, including PV systems, deliver dynamic supports to the grid. The reactive power injection requirements during different degrees of depth in voltage sag in Spain and Denmark grids are revealed in Figure 2. As shown, the priority is given to the reactive current injection during fault ride-through operation, and in such a situation, the active power generation and delivery may be preserved or varied, although it is not necessary. Considering the urgency and impact of prompt reactive power support, detecting voltage sags to ensure appropriate and suitable action under faults is critical.
Several strategies for FRT enhancement in grid-connected systems have been proposed in the literature through the deployment of devices such as energy storage systems [21], brake chopper [22,23,24], active crowbar systems, flexible alternating current transmission systems, dynamic voltage restorer (DVR), fault current limiters [25,26] and load tap changer. However, all of these external devices come with high upfront and ongoing expenditures and technical system difficulties. The ESSs are usually tied electrically to the DC-link via a DC-DC buck-booster [27]. The ESS absorbs surplus energy from the DC link when a DC overvoltage occurs—thus, AC grid fault. The DC-DC converter’s duty cycle is altered in this period to reduce the power from the PV battery and, as a result, reduce DC link voltage. The ESS stored energy is released into the AC grid immediately after the grid fault is cleared, and thereby, the ESS enhances the FRT ability by regulating and guarding the DC side and DC-AC inverter from a high DC-link voltage. Furthermore, ESS implements power oscillation suppression, peak shaving, and time-shifting [28] apart from improving the FRT. However, ESS devices have high initial and servicing costs as the main disadvantages. Similarly, ESS also fluctuates DC parameters before and after a fault. While ESSs are used to suppress the DC link’s excess energy and protect the DC-AC inverter by riding-through AC grid faults, reactive current injection to sustain the AC grid voltage is yet to be addressed.
The braking chopper protects the DC-AC inverter from rising DC link voltage culminating in an overvoltage resulting from the AC grid fault. The gate pulses of the IGBT only trigger the chopper under fault. Hence, the power resistor absorbs the excess energy generated. This braking chopper structure is beneficial as a result of its low cost and simple control scheme. In [23,29], the DC-chopper and current limiters are utilized to absorb excess DC voltage and minimize extreme AC grid current to mitigate DC-link overvoltage and AC overcurrent problems, respectively, that can cause disconnection or inverter damage. However, these braking choppers only dissipate power and possess no reactive power generation ability to support the AC grid voltage under fault. This is because all the generated power is dissipated at the expense of reactive power injection. The braking chopper is combined with other devices such as Fault Current Limiter (FCL) to enhance performance. This, unfortunately, increases the overall cost.
FACTS controllers are a valid alternative solution to ensure a sustained grid connection of inverter-based systems under grid faults and introduce reactive power as exigent. For instance, STATCOM can improve the FRT of fixed speed wind turbines, and SSSC can be used in FRT capability enhancement control and voltage stabilization. During fault situations, series terminal voltage mitigation using DVR is done by injecting series voltage to the grid voltage at the PCC to retain steady DFIG stator voltage [30]. DVR uses a three-phase power converter tied through a transformer in series between WT and coupling points [31]. STATCOM’s reactive output power under the voltage dip is more-substantial compared to SVC. Both devices can support the voltage recovery and inject reactive power, thereby increasing reactive power controllability for grid support to conform to grid code FRT stipulations. The coordination between the grid-connected inverter-based system and STATCOM has been proposed to suppress grid fault’s impact at the PCC. The traditional STATCOM is limited to only one capacitor-based storage with limited energy storage ability; however, reactive currents are supplied to anticipate grid voltage recovery during faults or disturbances. Similarly, SVC injects reactive power to compensate for grid voltage sags, as discussed in [32]. These controllers are primarily utilized in compensating and injecting reactive power to boost the FRT capacity. DSTATCOM is a shunt compensation device generally used to solve power quality problems in distribution systems. The control strategy of the DSTATCOM plays a vital role in PCC voltage maintenance. Thus, [33] presents the application of a DSTATCOM to improve the power quality in a ship power system during and after pulse loads due to high energy demand. However, the system’s entire cost and complexity are increased due to installing external FACTS hardware. For instance, installing devices such as DVR in the feeder line prevents the DC-AC inverter from sensing voltage drops in the AC grid. Furthermore, due to DVR’s limited capacity, it is inappropriate for extreme AC grid voltage sag [34].
The FCL addresses the over-current when utilized between the microgrid and main grid as in reference [35,36,37,38]. This shields the grid-tied inverter from the AC grid over-current, thereby improving the FRT under faults. The FCL decreases the excessive current at the DC-AC inverter’s AC grid side under fault on the AC grid. Reference [39] proposed a dynamic current curtailment scheme applied in autonomous inverter microgrid in enhancing FRT and presented the effectiveness in limiting current and voltage. FCLs are utilized to reduce the DGs’ contribution to the fault’s current level to enhance FRT [35]. References [40,41] suggested different types of FCL and modified versions of FCL to enhance the microgrids, wind turbines, solar photovoltaic, and other DGs FRT capabilities. The FCL potential to enhance FRT is well established in the literature [42,43]. The FCL is located between the microgrid and main network, and as such, FRT for all microgrids’ DERs is commonly achieved [36,44]. The SDBRs are deployed in RES (PV and WT) systems to boost the FRT. The over-voltage concern is addressed by mitigating the excessive DC link voltage experienced under the AC grid fault. They are installed in series in between the RES, and the grid coupling point is short-circuited in steady-state and activated under fault conditions.
As a result, researchers [16,45] have concentrated on creating modified, state-of-the-art techniques, and FRT can be performed at a low cost and without using any additional equipment. The purpose is to increase the host grid’s performance and fault recovery services. For example, Shin et al. (Shin et al. 2015) provide state-of-the-art FRT approaches based on a low-pass notch phase-locked loop for smooth and rapid transient responses to unexpected imbalanced grid situations. Similarly, [45] presented a way to support voltage by increasing the difference between positive and negative sequence voltages, improving the grid-connected inverter system’s stability and dependability. Furthermore, [46] used a modulated pulse width modulation to manage the stator phase voltage dynamic braking resistor for wind systems to limit the impact of grid failure types to achieve a certain degree of flexibility and robustness. To avoid disconnection during failures, Mirhosseini, Pou, and Agelidis [47] devised a control system for single and double PV inverters [48] that limits active power generation injecting reactive power to sustain the system. In [49], a nonlinear control for LVRT augmentation and post-fault recovery in a two-stage PV system is presented. In [50], a PV inverter control that decouples active and reactive power and smoothly switches between operating modes depending on the grid situation.
In the same way, many novel FRT management methods and schemes were suggested in [12,16,51]. Zamani et al. [44] recommend inverter-interfaced RES regulating strategies to enhance the host grid’s dynamic performance during disturbances and faults. In Kou and Wei [51], some observations were made regarding the specific grid code requirements for interconnection and operation of microgrids, which suggest LVRT functionality for microgrids and the provision of additional fault recovery services. As expressed in the FRT voltage profile, these recommendations expect a grid-connected microgrid to ride through balanced and unbalanced sags in grid voltage. Interruption, followed by a transition to autonomous operation, is only allowed if the fault persists [2].
A complementary controller for voltage is suggested in [52] for inverters-based DGs for the FRT control. This controller is expected to superimpose with minimum adjustments with numerous available voltage control schemes. These modifications, therefore, do not necessarily need to alter the initial configuration of these existing controllers. A hierarchical control has been proposed in the literature [53,54] towards realizing the numerous microgrid control and operation requirements. These propositions are with fundamental control goals, including voltage control, local power allocation among distributed energy units, frequency regulation, and power control (active and reactive) under synchronization with the host grid [55]. A rapid fault detection system plays a crucial role in enhancing the effects of these several strategies.
The voltage sags detection to guarantee proper and acceptable response under failures is crucial, given the urgency and importance of quick reactive power assistance and active power limiting. Detecting voltage sag is critical to the overall performance of the FRT capability control during a grid fault to switch between operating modes quickly and adequately [56,57,58,59]. As a result, built-in fault detection algorithms are used to safely disconnect grid-connected inverter-based equipment during grid outages. As a result, several voltage-sag detection techniques have been proposed; including the positive sequence technique [60], the root means square (RMS) technique [61], the peak value technique [62], the missing voltage method [58], and the wavelet transform technique [61]. In terms of detection speed, design complexity, and efficacy, all of these strategies offer advantages and disadvantages. Most of these methods are based on transforming the AC signal into an equivalent DC signal, which provides ease of processing and analysis. Similarly, several detection methods express voltage sags in terms of RMS; however, the RMS method represents one cycle historical average value, not an instantaneous value, which may lead to a long detection time when voltage sag has occurred [63]. RMS values are continuously calculated for a moving window of the input voltage samples. This convenient magnitude measurement is expressed in the signal’s energy content. A continuously moving window has n samples per cycle, assuming the window contains n samples per cycle (or half cycle). The sag is detected after the data for a window period has been processed. The concept observes the shifts in voltage during the fault phenomenon as near as possible. The closer the fault event is displayed, the more RMS values are measured. The voltage drop is proportional to the sag level [64]. Despite this, the detection approach that is most often utilized is RMS due to the RMS technique’s design simplicity and few complexities. Inverter-based microgrid topologies and control systems must be devised and implemented to fulfill expected FRT requirements.
This study aims to provide a secondary control strategy that uses a fast delayed signal cancellation (DSC) for reactive power injection and faults current limiting to improve grid inverter-based microgrids with solar PV sources. The secondary FRT control specifies primary control references [65]. The primary and secondary FRT control levels create a hierarchical control system, and there is no mode switch in the technique. This controller is built to meet the requirements of the Spanish grid codes for reactive power injection to achieve secondary voltage control with a valid and meaningful operation during the transient fault period.
This study’s contributions are: a fast DSC technique is introduced that detects the issue promptly in less than 0.1515 ms to ensure dependability and rapid reaction to disturbance or fault in the system. The DSC has a shorter convergence time and better separates positive and negative sequences. Using DSC, the voltage sag detection activates reactive power injection and restricts the fault current, thereby avoiding oscillations in the power and DC-link voltage. This research presented a method for limiting the active power reference generated by the MPPT by shifting the operating point, which may be used in a two-stage PV system. To avoid activating the DC-link overvoltage protection system, a particular control action is performed to reduce DC-source power production and equip the interface converters with FRT capabilities. This is accomplished without the converter’s voltage boosting activity being turned off. During the sag cycle of the AC grid voltage, the voltage at the DC bus between the DC-DC and DC-AC converter is controlled. As a result, the recommended solutions in this study reduced the typical momentary DC voltage rise on the DC bus during the transient process. While fulfilling local load needs, the secondary level of control improves the fulfilment of the upcoming grid code FRT standards. This suggested technique eliminates mode switching and allows the PV system to withstand grid failures and transient disturbances. As with a smooth transition approach, continuous grid resynchronization is avoided after a failure, reducing local load shedding. Finally, an adequate power quality for local sensitive loads is obtained during fault duration regardless of grid status. The secondary control, which guides electricity export and import per the grid code, improves the traditional primary control.
The remainder of the paper is structured as follows. Section 2 describes how the active power in a PV system is reduced by altering the operating point of the MPPT in response to grid voltage sags using the suggested secondary level control utilizing the DSC algorithm. Section 3 presents the simulation findings, and Section 4 concludes this article.
2. Proposed Fault Ride-Through Control
2.1. Primary Control with Droop
The created time-domain models of DC-AC inverter-based microgrids with a DC-DC converter and maximum power point tracking incorporate photovoltaic-based distributed energy resources have a circuit and control diagram. The droop control is applied between the outer and inner loops of the control to ensure that the two-stage PV system can participate in grid frequency and voltage regulation [66]. As a result, droop is introduced between the DC link voltage control outer loop and the inner current control, as shown in Figure 3. The goal is to create active and reactive power control based on droop control to meet the overall control scheme of an inverter-based microgrid with a DC-DC converter. This is true for the PV system. As demonstrated in Figure 3, the control is based on output power regulation at a lower value to MPPT extracted power Pmpp per grid frequency and voltage variation. The variation of ω from ω* is used to control the output power. Pmpp is typically estimated using MPPT control.
The outer loop controls the DC-link voltage; hence, the difference between the measured and reference DC-link voltages in this loop is the controller’s input. The controller’s output determines the first reference per unit power as given in Equation (1). The reference per unit power is set at zero for the unity power factor.
where vdc is the measured value of the DC link voltage
The actual first reference of the power p*, which will serve as the input for the integrated droop, is calculated by Equation (2):
The active power output of the inverter is determined by p-ω droop control, which mimics the inertial response of synchronous generators, whereas the reactive power output of the voltage source inverter is determined by Q-E droop control given in Equation (3):
where kpdroop and kqdroop are the coefficients of the inverter’s frequency and voltage droops, respectively. p* and Q* are also active and reactive power references, respectively. Furthermore, the droop generates new references for active and reactive power, which are denoted by p* and Q*, respectively. In addition, ω* denotes the set-point frequency, whereas E* denotes the voltage’s rated set-point amplitude.
2.2. Secondary Control with Fast DSC
The PCC voltage magnitude control is set up to buffer and prevent surpassing the grid code maximum defined and needed voltage range (0.9–1.1 pu) in order to avoid exceeding the limit. To implement an effective unbalanced grid voltage adjustment, the values of its symmetrical components are collected. To detect the presence of symmetrical components and retrieve their values, delayed signal cancellation (DSC) is used. For the grid frequency of 50 Hz, a time of 5 ms is employed. This is determined as Nd = fs/(4 f1), where fs is the sampling frequency, and f1 is the fundamental frequency, which in our instance is 50 Hz grid frequency.
The DSC algorithm measures three-phase voltages and then decomposes them into their symmetrical components [67]. Voltages recorded in phase are principally indicated in the stationary reference frame by the Clarke (abc-∝β) transformation. Two opposite rotations are performed following the above-mentioned resulting stationary reference frame using the host grid voltage’s phasor measured angle (θ and −θ). This angle corresponds to the one presented at the phase-locked loop’s output. The positive factor suggests that the negative component values for and are then stored in two distinct data buffers for half a time.
Finally, the positive and negative component final samples are produced and instantly stored in the two buffers for half a length of time. Equation (4) expresses the components and their additions. In Equations (4) and (5), the second term samples are equal to the components of the first term; however, a fourth duration is displaced, and a multiple of the second terms expresses this change. For the LVRT application, the negative and positive sequence components of voltage and current signals must be acquired. Traditional DSC approaches published in the literature are used to separate the positive-sequence component and negative-sequence components using Equation (4). The signal is delayed within a fourth of the fundamental frequency throughout this precise sequence separation operation.
The typical DSC approach is shown in Figure 4a, where two components of t1 and t2 of are rotated counter-clockwise. Following that, in Figure 4b, the fundamental delay cycle is used to extract components t1. As a result, component t1 now has a phase shift delay of −π. As a result, a −2π phase shift delay is applied to the component t2. As a result, the backward rotation clock will wisely adjust by adding +π to the phases of the two components. As a result, t1 is rotated back to its original position. With the superimposition of Figure 4a,b, the component t1 is doubled in length, and t2 is decreased to zero (b). Figure 4c depicts the result.
The fast DSC utilized in this work differs from the traditional DSC used in [6] due to the significant delay (5 ms for 50 Hz) incurred from employing and , which is a significant shortcoming. Similarly, the ratios must be an integer, which is not feasible in practice. Another disadvantage of and is that the vector will necessitate a large amount of memory. Figure 5 depicts the Fast DSC used for sequence component separation, with a shorter settling time.
The voltage vector consists of both positive and negative components as expanded by:
where and are chosen as random angles depicting negligible phase shifts. Thus, Equation (5) can be expanded as a result of Equation (6):
Hence, the filtered version of the is expressed as where:
where is the delay angle expressed as in Equation (8):
The voltage vector is derived by applying Equations (5) and (6) to Equation (7) as expressed in Equation (9):
Hence, the negative sequence component is cancelled out in Equation (9), as further expressed in Equation (10):
Therefore, the negative component cancelled out is expressed by Equation (11):
The positive and negative sequence components are similar to that of traditional DSC, provided the delay angle in Equations (10) and (11) approaches zero, as expressed in Equation (8).
Hence, a time delay of s, which corresponds to the as given in Equation (8) is realized. Thus, at the exact delay angle , the output of the traditional DSC is achieved.
Suppose:
Therefore, the sequence component estimates in the stationary reference frame are given as:
This proposed fast DSC is deployed for the secondary control is given in Figure 5. Therefore, a transformation from αβ0 stationary reference frame to dq0 rotating reference frame is performed using:
2.2.1. Dynamic Voltage Support
The positive and negative component voltage-independent control is done according to their respective sequence references expressed in Equation (18):
where kpp and kpn are the PI control’s proportional gains for the positive sequence while kip and kin are the integral gains in the negative sequence.
The control technique uses the DSC to independently change both positive and negative components in accordance with their respective sequence references to regulate the microgrid voltage at the local load point of connection with the PCC. As a result, the microgrid voltage of the DERs and local sensitive loads increases compared to the voltage sag experienced in the main grid. As a result, active power is given continuously to the microgrid sensitive load while providing ancillary voltage support to the main grid. Equations (19) and (20) express the separate controls of the voltage at the point of common coupling of the microgrid to the main grid.
where kpp and kpn are the PI control’s proportional gains for the positive sequence while kip and kin are the integral gains in the negative sequence. The aggregate reactive power injection from the microgrid through the PCC to the utility grid for ride-through and reactive power support implies Equation (21) using Figure 6.
where Qp and Qn are the reactive powers obtained from the PCC voltage’s independent control, as in Equations (19) and (20). Qreq is estimated using the Spanish grid code LVRT requirement based on the depth of voltage sag, as shown in Figure 6.
Therefore, the microgrid voltage at the local load point of contact with the PCC is regulated by the control device using the DSC to change both the positive and negative components individually in compliance with their corresponding sequence references. Thus, the voltage within the microgrid common to the DER and local loads improves reasonably independent of the voltage decrease in the main grid. Active power is then continuously supplied to the microgrid-sensitive load, thus offering ancillary voltage support operation to the main grid. Thus, ensuring the independent voltage controls at the microgrid’s common coupling point to the main grid are demonstrated in Equations (19) and (20).
Consequently, the required reactive power injection under fault in the main grid is guided by Equation (22) in accordance with the depth of voltage sag. Accordingly, dynamic grid voltage support is not required within 90–110% of the nominal grid voltage. Therefore, in Equation (11), Qreq is the required reactive power stipulated by the grid code, while VG and VN are the instantaneous and nominal grid voltages.
2.2.2. Active Power Curtailments
Active and reactive power references are fixed according to control goals and grid transient conditions. Before a fault, the dynamic power reference is governed by MPPT control at the unity power factor. The active and reactive power references are recomputed as soon as the DSC detects the fault. Typically, in direct-quadrature equivalent for the three-phase grid parameters, p and Q are computed as:
The corresponding direct-quadrature grid currents are:
According to Equation (25) and with = , the reference grid current as the active power and reactive power are required to be modified under FRT mode.
where the current reference I*g is the direct-quadrature equivalent of the three-phase AC grid current, and GP(s) and GQ(s) are the p and Q, proportional-integral controller.
The DERs are permitted to feed in active power during the voltage sags, although limited to the grid. For this purpose, the inverter injects a smaller amount of power into the grid for the duration of voltage sag, unlike the pre-fault condition capacity while sidestepping DC-link overvoltage. Figure 7 depicts the p−V curve of a solar module where PMPP and VMPP represent the maximum power point power and voltage of the PV source, which is assumed to be the pre-fault values at the MPP.
FRT mode adjustments are applied to limit this active power injection under grid voltage sag caused by faults [68]. The proposed technique matches the DC generated power with the AC grid injected to preserve a moderately constant DC-link voltage. The DC and AC power balance is maintained at a value other than zero. As a result, the AC grid receives a simultaneous injection of active power and reactive power.
The DC-DC converter’s goal under the proposed method is no longer to enforce MPP operations but to control power produced by the PV system to match the instantaneous permissible active power. The converter is regulated to determine the optimal VPV value that attains power balance. Therefore, the operating point could also shift from point X in Figure 7 to a lower control point, i.e., be it point Y or point Z. Thus, a negative voltage value ΔVPV is added to the pre-fault VMPP value, as follows:
The strategy proposed will enable the controller to achieve FRT using the current reference directly derived from the active and reactive power references, according to Equation (25). The linear droop is used in determining the voltage value ΔVPV. This droop relationship implements the FRT, which involves a curve-programmed active power decrease during the FRT operation. Hence, the characteristic linear droop relationship between PV voltage and PV power, according to Figure 2, is approached by:
where kPV is the constant factor of p-V droop, and this relationship is irradiance- and temperature-dependent.
The FRT strategy requires that the depth of the grid voltage drop is commensurate to the level of regulated active power injection into the AC grid to make way for the injection of reactive power in supporting the voltage drop. Consequently, another droop-based correlation in the active power generated with respect to the grid voltage VG is proposed as:
where VG is the grid voltage magnitude, PG is the grid injected active power, kd shows the droop coefficient of the relationship, and V*G and p*G are the corresponding initial values for grid voltage and active power just before transients. In a lossless DC-AC conversion system, the MPPT extracted power is equal to the injected AC power. Consequently:
Thus, applying the relation in Equation (29) to Equations (27) and (28) and combining the two equations yields Equation (30), which indicates an inverse proportionality between the voltage grid changes and PV voltage changes as:
Hence, the PV voltage is maintained at maximum power point voltage with the nominal grid voltage under normal grid conditions. However, the PV voltage is systematically adjusted by Equation (29) under fault. This occurs as a result of grid voltage drop lower than the grid nominal voltage. Consequently, a smooth switch is ensured between MPP and FRT operating modes and vice versa. The FRT voltage for the PV is dependent on the depth of the grid voltage sag, as shown in Equation (20), where ratio kPV: kd is the proportional control gain:
Hence, voltage value ΔVPV is given as:
Therefore, the implementation of the FRT scheme, as depicted in Equation (31) depicted in the DC-DC control of Figure 7 with the maximum power point tracking control gain.
3. Results
In this work, grid support is required to aid grid voltage recovery by the reactive power injection, especially during faults in the grid. Furthermore, this injection will, in turn, contribute to the overall stability and reliability of the system. The mandatory reactive power injection (dynamic grid support) in meeting the grid code requirements is summarized in Equation (22), according to the Spanish network code [6]. Consequently, the required reactive current injection under fault in the AC grid is guided by the given expression. Once the PCC voltage sequence components are obtained in direct-quadrature coordinates when grid failure occurs using Equation (18), broken down into Equations (19) and (20), the two PCC voltage-independent control systems restore normal sequence references. Positive sequence control aims to bring the PCC voltage’s positive sequence level back to its rated value. Therefore, the error is used to regulate the reactive power Qp injected into the grid while considering the electronic power switch thresholds. Likewise, the PCC voltage’s negative sequence regulation restores the quadrature portion to zero normal condition references. This balances and buffers the further unbalance in PCC voltage introduced by reactive power injection into the grid.
The monitoring of grid voltage is crucial to the FRT operation of grid-supporting systems. The DSC algorithm accurately tracks the grid voltage level and promptly activates immediately fault is detected. The DSC detects the grid restoration after fault clearance, and the system switches back to the normal MPPT operating condition, as shown in Figure 8, compared with the other fast Fourier transform, synchronous rotating techniques reference frame, peak, and root means square (RMS) technique. The dynamic grid-supporting regulation is primarily linked to prompt reactive power injection control. The responses of the detection schemes and the proposed DSC at the inception of fault and fault clearance are presented in Figure 8a,b, respectively.
At the inception of fault, the time taken for the various techniques to reach the voltage sag’s actual depth is given in Table 1. Similarly, the time taken for these methods to recover to the nominal system voltage value is also shown in Table 1. The DSC method showed superior performance in early detection of fault and the quality of value signal evaluation at the fault instance. The SRRF method also displayed a faster detection in a way similar to DSC; however, the sag detection went beyond the actual system sag, and the overshoot is experienced with a longer settling time of 0.0699 s after the fault instance and 0.071 s after fault clearance. Moreover, the FFT, PEAK, and RMS methods have similar performance with a significant delay in identifying the fault inception and fault clearance.
Under substantial balanced fault at the time of 1.3 s, as shown in Figure 9 with a 50% sag in the grid voltage, the fault is cleared in 1.8 s. The corresponding product of the output of the delayed signal cancellation and a typical pulse generator generates positive and negative pulses. Ordinarily, the Pulse Generator generates square wave pulses at regular intervals in which waveform parameters, such as the amplitude, phase delays, and pulse duration, determine the pulse output. These pulses generated are cancelled out by multiplying them with the DSC output in Figure 8. Consequently, Figure 10, Figure 11 and Figure 12 show the pulses generated in the three-phase system with all the faults detected in less than 0.1515 ms. In addition, the corresponding sag detection is shown for the pulses generated in each phase. These show that the fault is detected within 0.1515 ms in all phases to activate the FRT scheme for reactive power compensation and active power curtailment.
The FRT approach proposed is simulated on a grid supporting the inverter-based microgrid model with a DC-DC converter. A typical example of this is a double-stage PV system with DC-DC and DC-AC converters. Therefore, the grid code FRT compliance of the system is evaluated while simultaneously solving the unique challenges introduced as a result of a PV source. Table 2 gives the PV and DC-DC Converter Simulation Parameters. Table 3 gives the critical system parameters at uniform 25 °C temperature and 1000 W/m2 irradiance. The system is connected to a medium voltage level with a nominal voltage of 11 kV. The system consists of PV-based DERs and local load, as depicted in Figure 2—the grid-connected inverter-based microgrid with DC-DC converter interfacing the PV. The fault is simulated on the main grid to cause 50%, 60%, and 70% voltage sags at the PCC, switched at time t = 1.3 s and assumed to be automatically cleared at t = 1.8 s.
3.1. DC Side Analysis
The drop in the PCC voltage due to a fault caused the proposed secondary control to re-evaluate the primary control references provided the voltage drop is within the FRT curve envelope. As a result of this drop, the PV power generated, power in the DC link, and power delivered to the AC grid is unbalanced. Consequently, this imbalance portends an unwarranted transient voltage at the PV side and DC link while excessive current is witnessed at the AC side, as shown in Figure 13, Figure 14 and Figure 15 and interpreted in Table 4, Table 5 and Table 6. The exponential increment in the voltage at the DC link is due to the capacitor’s energy build-up [69]. Figure 13a–c show the PV voltage, DC link voltage, and average DC link current flow under fault without and with the proposed secondary control under 50% voltage sags. The corresponding values of the PV Voltage under normal conditions and 50%, 60% and 70% voltage sags are given in Table 4. The corresponding values of the DC-link Voltage under normal conditions and 50%, 60% and 70% voltage sags are given in Table 5. The corresponding values of the Average DC Current under normal conditions and 50%, 60% and 70% voltage sags are given in Table 6.
The MPPT function is deactivated, and the operating point is transitioned to the FRT mode, as seen in Figure 13c, Figure 14c and Figure 15c when a disturbance is sensed in the grid. Immediately upon the fault detection, the PV system starts reactive power injection into the grid per the voltage sag demands and grid code requirements. Similarly, the active power generation is limited in compliance with the ratings and complex power requirements imposed. Furthermore, Figure 14 shows that the PV voltage, DC bus voltage, and average DC link current flow under fault with and without the proposed secondary control under 60% voltage sags.
The limitation of active power is not necessarily the requirement of grid codes; however, it is done out of concern in simultaneously fulfilling the critical objective of the grid-supporting schemes of fault ride-through (by remaining in grid connection mode), providing grid support services to expedite grid recovery. Thus, reactive power injection without a commensurate drop in the active power generation triggers the system to activate overcurrent protection for safe disconnection. As a result, the active power is limited under FRT operation, as shown in the average DC flow in the DC link.
The fault is cleared under the Spanish grid code as soon as the voltage level rises to 90% of the nominal grid voltage value. Hence, the system is recognized to have returned to the normal operation mode. Consequently, the PV system immediately returned to its MPPT mode and tracked the PV panels’ maximum output power. However, it took a short period for the incremental conductance MPPT to adjust to the transients caused by the AC grid fault, which is evident in the responses reported. Furthermore, PV module voltage and current, PV diode current, DC link voltage, average DC link current, and DC-link power require a considerable period to regain the pre-fault stable value. However, the proposed secondary control significantly mitigated the increase in voltage at the DC link.
The developed models and the FRT control have demonstrated that the active power and reactive power regulation can facilitate the FRT capability of the three-phase grid-supporting converter when the operating mode of MPPT is shifted to minimize the generation of active power throughout the fault period. The secondary control developed for the system shifted the operating point hinge on the voltage-sag depth, reducing the PV power generated and DC power delivered at the DC link. This, in the long run, provided adequate protection for the inverter/converter switches from potential damage, which could be caused by the excessive AC grid current and hike in DC voltage. Without the proposed secondary control, the increasing DC link voltage causes the operating point to shift and limit DC link current. As a result, the DC bus voltage failed to be maintained at the reference even after fault clearance, thereby hampering power delivery.
Furthermore, the control of DC generated power by the PV, and, by extension, the AC grid active power transmitted is associated with the depth of voltage dip the AC grid. Therefore, the active power control is based on a droop relationship between these two parameters, and the inverse proportionate relationship and requirements are exploited to develop the proposed strategy. Hence, the AC grid voltage was closely monitored with the DSC algorithm. The information obtained is directly utilized in the converter’s MPPT for alternation between the MPP and FRT operations.
3.2. AC Side Analysis
3.2.1. AC Grid and Microgrid Voltage
Figure 16 illustrates the voltage drop’s depth on the main grid, which also compels a consequent rise in the current magnitude as in Figure 17. The immediate current magnitude limitation is created by the secondary power reference integrated into the proposed secondary control FRT scheme of the DC-AC inverter and DC-DC Converter, as shown in Figure 17. At fault inception, the active and reactive current references are changed instantly. Correspondingly, all references are preserved automatically after fault clearance with suitable tuning. Figure 16 demonstrates a seamless transition from pre-fault to a fault and then from fault to post-fault. Therefore, the LC filter’s current output from the PV system is adequately constrained, as seen in Figure 17. The 50% voltage drop rate detected at the PCC to the grid is enhanced within 93.32% of the microgrid. The grid voltage sag is detected at 0.1515 ms at the PCC, less than half of the first fault incidence cycle. This indicates that the fault is observed in 1.3001515 s as revealed in the positive half cycle and in the negative half cycle 1300 on the point. Consequently, the FRT scheme fault mode operation is activated with simultaneous switching of the IGBT-diode switched reactor in series with all the phases for balanced transient conditions and series with only the affected phase in unbalanced conditions. Implementing the FRT solutions for PV source in the microgrid application meant that the microgrid voltage would be compensated for in the microgrid’s efficient operation independent of the specific transient grid state.
3.2.2. AC Grid and Microgrid Current
Based on its kVA rated values, the fault current restricting this secondary control’s potential contributes to the main grid voltage support using reactive power injected. Figure 17 illustrates the corresponding PV based DER current output waveforms with and without the secondary control under 50% voltage sags at the PCC. The current output within the microgrid is appropriately constrained with no substantial distortion in the PV-DER current signals than when the proposed secondary control is not present. Thus, it is clear that the inverter currents are appropriately limited in the first cycle after fault inception at 1.3 s. Consequently, the inverter currents are at 1.3 s, adequately constrained within the first cycle after fault commencement. The 0.00016 delay after the proposed control activation fault is small and negligible. Nevertheless, the inverter semiconductor switches cannot be affected by overcurrent generated between 1.30000 and 1.30016 s. In particular, grid faults occur practically around the filter capacitor, and the transient current peak at fault commencement disappears almost immediately and thus is overlooked. It should be stated that the excess current in the event of transient interruption is absolutely attenuated where the converters are connected to an electrically weak grid far from the inverter stem placement.
3.2.3. PV Inverter Current and Voltage Harmonics
Following the EN50160 standard for all the phases, the THD of any generating unit’s output voltage waveforms shall not exceed 8% [70]. Subsequently, the THDs (before fault, during the fault, and after fault clearance for different fault types causing 50% and 60% voltage sags) of PV voltage signals and output current waveforms are revealed in Table 7 and Figure 18. The THD is evaluated in MATLAB using a quick analysis of the fast Fourier transformation. As reflected in the low THDs of the PV system output current and voltages, the excellent signal quality confirms the satisfactory performance of the FRT strategy. As examined, the microgrid voltage display significant-quality waveforms, PV system voltage output, and current. Regarding the output current harmonics, the voltage harmonics are relatively negligible. The reported low THD indicates high efficiency, significant power factor, and low peak current. Tshis demonstrates the efficacy of this proposed FRT approach for secondary control and IEC 61000-3-2 standard compliance [71]:
3.2.4. Power Generation and Delivery
Following the grid codes, the FRT control structures ensure that comparable reactive power is delivered to support grid voltage sag, thus performing a PV system ride through disturbances. Therefore, the system seamless switch from grid synchronous to an isolated service mode is prevented. The rise in reactive power requirement restricts active power generation for the PV inverters to comply with the FRT approach’s apparent power threshold and inverter ratings. The active power curtailment under 50%, 60%, and 70% voltage sag are shown in Figure 19a, Figure 20a and Figure 21a. The reactive power injected supports the voltage recovery within the microgrid and at the PCC through the active power generation and reactive power injection per the depth of voltage sag at the PCC. The improved reactive power production ensures the microgrid voltage is controlled to an appropriate voltage magnitude during the fault duration. At the moment t = 1.8 s, the FRT system automatically detects the rise in the main grid voltage to an allowable point of 0.90–1.10 at the PCC. The reactive power injection is thus limited according to the extent of voltage increase, as shown in Figure 19b, Figure 20b and Figure 21b. Figure 19, Figure 20 and Figure 21 indicate the rise in injected reactive capacity and a sharp proportional decrease in active power. This FRT regulation’s deployment with the DSC algorithms monitors the main grid disruption using the voltage sag sensed at the PCC. The FRT technique restricts active and reactive references in the PV system as needed to trigger microgrid voltage change without major distortion to the DER output current and voltage waveforms. The active power generated by the PV system under 50%, 60%, and 70% voltage sags are summarized in Table 8. Similarly, the PV’s reactive power under 50%, 60%, and 70% voltage sags are shown in Table 9.
As a result of the voltage sag induced by grid fault, the PV system’s total active power supply is reduced. The PV system is controlled to initially inject an active power quantity that satisfies local load demand and thus lessens the active power injection into the faulty main grid, as shown in Figure 22a, Figure 23a and Figure 24a. The amplitude of the system voltage declined during voltage sags. The fault current’s intensity is reduced, and the microgrid voltage is enhanced to transmit the active power to the local load. The active power generated is limited to the rated value of the local load under severe voltage sag. Each time an over-generation happens, the excess is transmitted to the failed system. Nevertheless, no active power can be generated for the local microgrid and main grid loads in the severe occurrence voltage sag. Subsequently, according to Spanish grid codes, the PV system reactive power output maximizes host system voltage. The microgrid voltage is regulated within the operating range (0.9–1.1 Spanish grid code) to ensure continuous active power delivery to local sensitive loads, as seen in Figure 22, Figure 23 and Figure 24.
The active and reactive power consumptions in the local load are summarized in Table 10 and Table 11, respectively.
To summarize the proposition implemented in this work, Figure 25 appropriately depicts a grid-supporting solar PV system’s trajectories interfaced with the main grid via DC-DC and DC-AC converters during a fault in the grid. Seamlessly switching is achieved between the MPPT (normal operating condition) and FRT (fault operating condition) operating modes with fast dynamics.
The primary and the proposed secondary control for the double stage PV sourced microgrid implements an FRT using the DSC fault detection algorithm. Strategic amendments to the traditional primary control system of a grid-supporting system are made. This controller is designed as per the Spanish grid codes stipulations for reactive power injection to achieve a secondary voltage control with a valid and significant operation in the transient fault period. The injected reactive power complies with the required reactive currents based on the percentage voltage drop specified in the emerging grid codes under different voltage sags caused by faults. This scheme prevents the transient AC overcurrent in the microgrid and DC link overvoltage during the AC grid fault. Simultaneously, the DC side over-voltage and AC side over-current are mitigated through active power decrease and current amplitude curtailing strategies in compliance with the complex/apparent power ratings. The DSC algorithms allow for separating the sequence components for dual control at the PCC of the positive-sequence and negative-sequence components during the primary grid disturbance.
The continuous supply to microgrid local sensitive load is ensured while meeting the grid code FRT requirement. Furthermore, the control of DC generated power and, by extension, the AC grid active power transmitted is linked to the depth of voltage dip the AC grid. The active power control is based on a droop relationship between these two parameters, and the inverse proportionate relationship and requirements are exploited in developing the proposed shift in the operating point of the MPPT from MPP to FRT operation. To identify negative sequences and instances of fault in 0.1515 ms, the DSC’s sequence identification algorithm is applied to enable the proposed secondary FRT scheme to conform to the grid code stipulations. The DSC detects the grid restoration after fault clearance, and the system switches back to the normal MPPT operating condition.
4. Conclusions
The secondary control developed involves the calculation of active and reactive power references to determine the amount to generate and inject. The injected reactive power must comply with the required reactive currents based on the percentage voltage drop stipulated in the emerging grid codes under different voltage sags caused by faults. This scheme prevents the transient AC overcurrent in the microgrid and DC link overvoltage during the grid fault. Simultaneously, the active power decrease and current amplitude limiting strategies in compliance with the complex/apparent power ratings mitigate the DC side overvoltage and AC side overcurrent. The DSC algorithms allow for separating the sequence components for dual control at the PCC of the positive-sequence and negative-sequence components during a disturbance in the main grid. The developed scheme guarantees inverter protection by ensuring that the current does not exceed the inverter current rating under grid fault conditions. Thus, the converter-based system operates in two non-switching modes of transient and steady-state FRT. The simulation results affirm the good performance of the proposed strategy and its effectiveness. The monitoring of grid voltage is crucial to the FRT operation of the grid-supporting systems. The DSC algorithm accurately tracks the grid voltage level and promptly activates immediately fault is detected. However, the reference current generated at any time, especially under the FRT operation, does not comprise the inverter system protections for both overvoltage and overcurrent by incessant triggering. The DSC detects the grid restoration after fault clearance, and the system switches back to the normal MPPT operating condition.
This active power curtailment is implemented on a PV system assuming uniform irradiance and temperature. Future work is recommended on applying the proposed strategy to a double-stage PV inverter system operating under a variation of irradiance and temperature. Thus, several characteristic linear droop relationships between PV voltage and PV power at different values of irradiance and temperature are created within which the operating points of the system could be shifted.
Author Contributions
Conceptualization, E.B. and I.E.D.; Data curation, E.B.; Formal analysis, E.B.; Funding acquisition, I.E.D.; Investigation, E.B. and I.E.D.; Methodology, E.B. and I.E.D.; Project administration, E.B. and I.E.D.; Resources, E.B. and I.E.D.; Software, E.B.; Supervision, I.E.D.; Validation, E.B. and I.E.D.; Visualization, I.E.D.; Writing—original draft preparation, E.B.; Writing—review and editing, E.B.and I.E.D. All authors have read and agreed to the published version of the manuscript.
Funding
This research received no external funding and The APC was funded by DUT Smart Grids Research and DUT Directorate for Research and Postgraduate Supports.
Institutional Review Board Statement
Not applicable.
Informed Consent Statement
Not applicable.
Data Availability Statement
Not applicable.
Acknowledgments
We acknowledge the support given by DUT Smart Grids Research and DUT Directorate for Research and Postgraduate Supports.
Conflicts of Interest
The authors declare no conflict of interest.
References
- Saleem, H.A. Microgrid Modeling and Grid Interconnection Studies. Master’s Thesis, University of Tennessee, Knoxwille, TN, USA, 2014. [Google Scholar]
- Gkavanoudis, S.I.; Demoulias, C.S. A control strategy for enhancing the fault ride-through capability of a microgrid during balanced and unbalanced grid voltage sags. Sustain. Energy Grids Netw. 2015, 3, 1–11. [Google Scholar] [CrossRef]
- Al-Shetwi, A.Q.; Hannan, M.A.; Jern, K.P.; Mansur, M.; Mahlia, T.M.I. Grid-connected renewable energy sources: Review of the recent integration requirements and control methods. J. Clean. Prod. 2020, 253, 119831. [Google Scholar] [CrossRef]
- Wang, S.; Shang, L. Fault ride through Strategy of virtual-synchronous-controlled DFIG-based wind turbines under symmetrical grid faults. IEEE Trans. Energy Convers. 2020, 35, 1360–1371. [Google Scholar] [CrossRef]
- Yang, Y.; Enjeti, P.; Blaabjerg, F.; Wang, H. Wide-scale adoption of photovoltaic energy: Grid code modifications are explored in the distribution grid. IEEE Ind. Appl. Mag. 2015, 21, 21–31. [Google Scholar] [CrossRef] [Green Version]
- Buraimoh, E.; Davidson, I.E.; Martinez-Rodrigo, F. Fault ride-through enhancement of grid supporting inverter-based microgrid using delayed signal cancellation algorithm secondary control. Energies 2019, 12, 3994. [Google Scholar] [CrossRef] [Green Version]
- Kerdphol, T.; Rahman, F.S.; Mitani, Y. Virtual inertia control application to enhance frequency stability of interconnected power systems with high renewable energy penetration. Energies 2018, 11, 981. [Google Scholar] [CrossRef] [Green Version]
- Xu, X.; Yan, Z.; Shahidehpour, M.; Wang, H.; Chen, S. Power system voltage stability evaluation considering renewable energy with correlated variabilities. IEEE Trans. Power Syst. 2018, 33, 3236–3245. [Google Scholar] [CrossRef]
- Buraimoh, E.; Davidson, I.E. Simplified LCL filter state space modeling and small signal stability analysis of inverter based microgrid. In Proceedings of the 2021 IEEE PES/IAS PowerAfrica Conference, Nairobi, Kenya, 23–27 August 2021. [Google Scholar] [CrossRef]
- Morshed, M.J.; Fekih, A. A novel fault ride through scheme for hybrid wind/PV power generation systems. IEEE Trans. Sustain. Energy 2019, 11, 2427–2436. [Google Scholar] [CrossRef]
- Zhao, X.; Guerrero, J.M.; Savaghebi, M.; Vasquez, J.C.; Wu, X.; Sun, K. Low-voltage ride-through operation of power converters in grid-interactive microgrids by using negative-sequence droop control. 2017, 32, 3128–3142. IEEE Trans. Power Electron. 2017, 32, 3128–3142. [Google Scholar] [CrossRef] [Green Version]
- Hagh, M.T.; Khalili, T. A review of fault ride through of PV and wind renewable energies in grid codes. Int. J. Energy Res. 2019, 43, 1342–1356. [Google Scholar] [CrossRef]
- Ramana Reddy, K.V.; Ramesh Babu, N.; Sanjeevikumar, P. A Review on Grid Codes and Reactive Power Management in Power Grids with WECS.; Springer: Singapore, 2018; pp. 525–539. [Google Scholar]
- Buraimoh, E.; Davidson, I.E. Overview of fault ride-through requirements for photovoltaic grid integration, design and grid code compliance. In Proceedings of the 9th International Conference on Renewable Energy Research and Applications, ICRERA 2020, Glasgow, UK, 27–30 September 2020. [Google Scholar]
- Yang, Y.; Kim, K.A.; Blaabjerg, F.; Sangwongwanich, A. Advanced control of PV systems under anomaly grid conditions. In Advances in Grid-Connected Photovoltaic Power Conversion Systems; Woodhead Publishing: Cambridge, UK, 2018; pp. 113–152. ISBN 9780081023396. [Google Scholar]
- Wang, X.; Yang, Z.; Fan, B.; Xu, W. Control strategy of three-phase photovoltaic inverter under low-voltage ride-through condition. Math. Probl. Eng. 2015, 2015, 1–23. [Google Scholar] [CrossRef]
- Bae, Y.; Vu, T.K.; Kim, R.Y. Implemental control strategy for grid stabilization of grid-connected PV system based on German grid code in symmetrical low-to-medium voltage network. IEEE Trans. Energy Convers. 2013, 28, 619–631. [Google Scholar] [CrossRef]
- Buraimoh, E.; Davidson, I.E.; Martinez-Rodrigo, F. Decentralized fast delayed signal cancelation secondary control for low voltage ride-through application in grid supporting grid feeding microgrid. Front. Energy Res. 2021, 9, 1–16. [Google Scholar] [CrossRef]
- Jiang, S.; Xin, Y.; Li, G.; Wang, L. A novel DC fault ride-through method for wind farms connected to the grid through bipolar MMC-HVDC transmission. IEEE Trans. Power Deliv. 2020, 35, 2937–2950. [Google Scholar] [CrossRef]
- Zhou, D.; Tu, P.; Qiu, H.; Tang, Y. Finite-control-set model predictive control of modular multilevel converters with cascaded open-circuit fault ride-through. IEEE J. Emerg. Sel. Top. Power Electron. 2020, 8, 2943–2953. [Google Scholar] [CrossRef]
- Ota, J.I.Y.; Sato, T.; Akagi, H. Enhancement of performance, availability, and flexibility of a battery energy storage system based on a modular multilevel cascaded converter (MMCC-SSBC). IEEE Trans. Power Electron. 2016, 31, 2791–2799. [Google Scholar] [CrossRef]
- Naderi, S.B.; Negnevitsky, M.; Muttaqi, K.M. A modified DC chopper for limiting the fault current and controlling the DC-link voltage to enhance fault ride-through capability of doubly-fed induction-generator-based wind turbine. IEEE Trans. Ind. Appl. 2019, 55, 2021–2032. [Google Scholar] [CrossRef]
- Al-shetwi, A.Q.; Zahim, M.; Blaabjerg, F. Low voltage ride-through capability control for single-stage inverter-based grid-connected photovoltaic power plant. Sol. Energy 2018, 159, 665–681. [Google Scholar] [CrossRef] [Green Version]
- Al-Durra, A.; Fayyad, Y.; Muyeen, S.M.; Blaabjerg, F. Fault ride-through of a grid-connected photovoltaic system with quasi Z source inverter. Electr. Power Compon. Syst. 2016, 44, 1786–1800. [Google Scholar] [CrossRef] [Green Version]
- Islam, M.M.; Muttaqi, K.M.; Sutanto, D. A novel saturated amorphous alloy core based fault current limiter for improving the low voltage ride through capability of doubly-fed induction generator based wind turbines. IEEE Trans. Ind. Appl. 2021, 57, 2023–2034. [Google Scholar] [CrossRef]
- Islam, M.R.; Hasan, J.; Shipon, M.R.R.; Sadi, M.A.H.; Abuhussein, A.; Roy, T.K. Neuro fuzzy logic controlled parallel resonance type fault current limiter to improve the fault ride through capability of DFIG based wind farm. IEEE Access 2020, 8, 115314–115334. [Google Scholar] [CrossRef]
- Saadat, N.; Choi, S.S.; Vilathgamuwa, D.M. A statistical evaluation of the capability of distributed renewable generator-energy-storage system in providing load low-voltage ride-through. IEEE Trans. Power Deliv. 2015, 30, 1128–1136. [Google Scholar] [CrossRef]
- Meegahapola, L.G.; Littler, T.; Flynn, D. Decoupled-DFIG fault ride-through strategy for enhanced stability performance during grid faults. IEEE Trans. Sustain. Energy 2010, 1, 152–162. [Google Scholar] [CrossRef] [Green Version]
- Al-Shetwi, A.Q.; Sujod, M.Z. Modeling and control of grid-connected photovoltaic power plant with fault ride-through capability. J. Sol. Energy Eng. Trans. ASME 2018, 140, 1–9. [Google Scholar] [CrossRef] [Green Version]
- Amalorpavaraj, R.A.J.; Kaliannan, P.; Padmanaban, S.; Subramaniam, U.; Ramachandaramurthy, V.K. Improved fault ride through capability in DFIG based wind turbines using dynamic voltage restorer with combined feed-forward and feed-back control. IEEE Access 2017, 5, 20494–20503. [Google Scholar] [CrossRef]
- Chen, X.; Yan, L.; Zhou, X.; Sun, H. A novel DVR-ESS-embedded wind-energy conversion system. IEEE Trans. Sustain. Energy 2018, 9, 1265–1274. [Google Scholar] [CrossRef]
- Movahedi, A.; Halvaei Niasar, A.; Gharehpetian, G.B. LVRT improvement and transient stability enhancement of power systems based on renewable energy resources using the coordination of SSSC and PSSs controllers. IET Renew. Power Gener. 2019, 13, 1849–1860. [Google Scholar] [CrossRef]
- Mitra, P.; Venayagamoorthy, G.K. An adaptive control strategy for DSTATCOM applications in an electric ship power system. IEEE Trans. Power Electron. 2010, 25, 95–104. [Google Scholar] [CrossRef]
- Ali, M.S.; Haque, M.M.; Wolfs, P. A review of topological ordering based voltage rise mitigation methods for LV distribution networks with high levels of photovoltaic penetration. Renew. Sustain. Energy Rev. 2019, 103, 463–476. [Google Scholar] [CrossRef]
- Buraimoh, E.; Davidson, I.E. Development of an IGBT-diode based fault current limiter for fault ride-through enhancement in microgrid application. In Proceedings of the IEEE PES/IAS PowerAfrica, Abuja, Nigeria, 20–23 August 2019; pp. 190–195. [Google Scholar]
- Ghanbari, T.; Farjah, E. Unidirectional fault current limiter: An efficient interface between the microgrid and main network. IEEE Trans. Power Syst. 2013, 28, 1591–1598. [Google Scholar] [CrossRef]
- Kovalsky, L.; Yuan, X.; Tekletsadik, K.; Keri, A.; Bock, J.; Breuer, F. Applications of superconducting fault current limiters in electric power transmission systems. IEEE Trans. Appiled Supercond. 2005, 15, 2130–2133. [Google Scholar] [CrossRef]
- Buraimoh, E.; Davidson, I.E. Fault ride-through analysis of current- and voltage-source models of grid supporting inverter-based microgrid. IEEE Can. J. Electr. Comput. Eng. 2021, 44, 189–198. [Google Scholar] [CrossRef]
- Sadeghkhani, I.; Hamedani Golshan, M.E.; Guerrero, J.M.; Mehrizi-Sani, A. A current limiting strategy to improve fault ride-through of inverter interfaced autonomous microgrids. IEEE Trans. Smart Grid 2017, 8, 2138–2148. [Google Scholar] [CrossRef] [Green Version]
- He, H.; Chen, L.; Yin, T.; Cao, Z.; Yang, J.; Tu, X.; Ren, L. Application of a SFCL for fault ride-through capability enhancement of DG in a microgrid system and relay protection coordination. IEEE Trans. Appl. Supercond. 2016, 26, 1–8. [Google Scholar] [CrossRef]
- Choi, D.H.; Yoo, J.I.; Kim, D.; Lee, S.H.; Park, J.W. Analysis on effect of SFCL applied to an isolated microgrid with a dynamic load model. IEEE Trans. Appl. Supercond. 2017, 27, 1–4. [Google Scholar] [CrossRef]
- Naderi, S.B.; Negnevitsky, M.; Jalilian, A.; Tarafdar Hagh, M.; Muttaqi, K.M. Optimum resistive type fault current limiter: An efficient solution to achieve maximum fault ride-through capability of fixed-speed wind turbines during symmetrical and asymmetrical grid faults. IEEE Trans. Ind. Appl. 2017, 53, 538–548. [Google Scholar] [CrossRef]
- Rashid, G.; Ali, M.H. Fault ride through capability improvement of DFIG based wind farm by fuzzy logic controlled parallel resonance fault current limiter. Electr. Power Syst. Res. 2017, 146, 1–8. [Google Scholar] [CrossRef]
- Zamani, M.A.; Member, S.; Yazdani, A.; Member, S.; Sidhu, T.S. A control strategy for enhanced operation of inverter-based microgrids under transient disturbances and network faults. IEEE Trans. Power Deliv. 2012, 27, 1737–1747. [Google Scholar] [CrossRef]
- Çelik, D.; Meral, M.E. Voltage support control strategy of grid-connected inverter system under unbalanced grid faults to meet fault ride through requirements. IET Gener. Transm. Distrib. 2020, 14, 3198–3210. [Google Scholar] [CrossRef]
- Huang, P.H.; El Moursi, M.S.; Hasen, S.A. Novel fault ride-through scheme and control strategy for doubly fed induction generator-based wind turbine. IEEE Trans. Energy Convers. 2015, 30, 635–645. [Google Scholar] [CrossRef]
- Mirhosseini, M.; Pou, J.; Agelidis, V.G. Single- and two-stage inverter-based grid-connected photovoltaic power plants with ride-through capability under grid faults. IEEE Trans. Sustain. Energy 2015, 6, 1150–1159. [Google Scholar] [CrossRef]
- Merabet, A.; Labib, L.; Ghias, A.M.Y.M. Robust model predictive control for photovoltaic inverter system with grid fault ride-through capability. IEEE Trans. Smart Grid 2018, 9, 5699–5709. [Google Scholar] [CrossRef]
- Mojallal, A.; Lotfifard, S. Enhancement of grid connected PV arrays fault ride through and post fault recovery performance. IEEE Trans. Smart Grid 2019, 10, 546–555. [Google Scholar] [CrossRef]
- Easley, M.; Jain, S.; Shadmand, M.B.; Abu-Rub, H.A. Autonomous model predictive controlled smart inverter with proactive grid fault ride-through capability. IEEE Trans. Energy Convers. 2020, 8969, 1–12. [Google Scholar] [CrossRef]
- Kou, W.; Wei, D. Fault ride through strategy of inverter-interfaced microgrids embedded in distributed network considering fault current management. Sustain. Energy Grids Netw. 2018, 15, 43–52. [Google Scholar] [CrossRef]
- Piya, P.; Ebrahimi, M.; Karimi-Ghartemani, M.; Khajehoddin, S.A. Fault ride-through capability of voltage-controlled inverters. IEEE Trans. Ind. Electron. 2018, 65, 7933–7943. [Google Scholar] [CrossRef]
- Palizban, O.; Kauhaniemi, K.; Guerrero, J.M. Microgrids in active network management—Part I: Hierarchical control, energy storage, virtual power plants, and market participation. Renew. Sustain. Energy Rev. 2014, 36, 428–439. [Google Scholar] [CrossRef] [Green Version]
- Palizban, O.; Kauhaniemi, K.; Guerrero, J.M. Microgrids in active network management—Part II: System operation, power quality and protection. Renew. Sustain. Energy Rev. 2014, 36, 440–451. [Google Scholar] [CrossRef] [Green Version]
- Lu, X.; Wang, J.; Member, S.; Guerrero, J.M. Virtual impedance based fault current limiters for inverter dominated AC microgrids. IEEE Trans. Smart Grid 2018, 3053, 1599–1612. [Google Scholar] [CrossRef] [Green Version]
- Freytes, J.; Li, J.; De Preville, G.; Thouvenin, M. Grid-forming control with current limitation for MMC under unbalanced fault ride-through. IEEE Trans. Power Deliv. 2021, 36, 1914–1916. [Google Scholar] [CrossRef]
- Gururaj, M.V.; Padhy, N.P. PHIL experimentation on fault ride through behavior of doubly fed induction generator-based Wind system in the presence of fault current limiter. IEEE Trans. Ind. Appl. 2020, 56, 2988–3005. [Google Scholar] [CrossRef]
- Yang, Y.; Blaabjerg, F. Low-voltage ride-through capability of a single-stage single-phase photovoltaic system connected to the low-voltage grid. Int. J. Photoenergy 2013, 2013. [Google Scholar] [CrossRef] [Green Version]
- Yang, F.; Yang, L.; Ma, X. An advanced control strategy of PV system for low-voltage ride-through capability enhancement. Sol. Energy 2014, 109, 24–35. [Google Scholar] [CrossRef]
- Al-Shetwi, A.Q.; Sujod, M.Z. Voltage sag detection in grid-connected photovoltaic power plant for low voltage ride-through control. Recent Adv. Electr. Electron. Eng. (Formerly Recent Patents on Electrical & Electronic Engineering) 2018, 12, 384–392. [Google Scholar] [CrossRef]
- Khoshkbar Sadigh, A.; Smedley, K.M. Fast and precise voltage sag detection method for dynamic voltage restorer (DVR) application. Electr. Power Syst. Res. 2016, 130, 192–207. [Google Scholar] [CrossRef]
- Alepuz, S.; Busquets-Monge, S.; Bordonau, J.; Martinez-Velasco, J.A.; Silva, C.A.; Pontt, J.; Rodriguez, J. Control strategies based on symmetrical components for grid-connected converters under voltage dips. IEEE Trans. Ind. Electron. 2009, 56, 2162–2173. [Google Scholar] [CrossRef] [Green Version]
- Ding, K.; Cheng, K.W.E.; Xue, X.D.; Divakar, B.P.; Xu, C.D.; Che, Y.B.; Wang, D.H.; Dong, P. A novel detection method for voltage sags. In Proceedings of the 2nd International Conference on Power Electronics Systems and Applications, Hong Kong, China, 12–14 November 2006; pp. 250–255. [Google Scholar]
- Ngo, T.; Min, K.W.; Vu, T. Comparative study of fault detection methods based on time domain RMS calculation. IEEE Power Energy Soc. Gen. Meet. 2019, 2019, 1–5. [Google Scholar] [CrossRef]
- Liu, X.; Li, C.; Shahidehpour, M.; Gao, Y.; Zhou, B.; Zhang, Y.; Yi, J.; Cao, Y. Fault current hierarchical limitation strategy for fault ride-through scheme of microgrid. IEEE Trans. Smart Grid 2019, 10, 6566–6579. [Google Scholar] [CrossRef]
- Wang, H.; Zhang, Q.; Wu, D.; Zhang, J. Advanced current-droop control for storage converters for fault ride-through enhancement. IEEE J. Emerg. Sel. Top. Power Electron. 2020, 8, 2461–2474. [Google Scholar] [CrossRef]
- Ramirez, D.; Martinez-Rodrigo, F.; de Pablo, S.; Carlos Herrero-de Lucas, L. Assessment of a non linear current control technique applied to MMC-HVDC during grid disturbances. Renew. Energy 2017, 101, 945–963. [Google Scholar] [CrossRef]
- Taul, M.G.; Wang, X.; Davari, P.; Blaabjerg, F. Robust fault ride through of converter-based generation during severe faults with phase jumps. IEEE Trans. Ind. Appl. 2020, 56, 570–583. [Google Scholar] [CrossRef]
- Xiao, Y.; Peng, L. A novel fault ride-through strategy based on capacitor energy storage inside MMC. IEEE Trans. Power Electron. 2020, 35, 7960–7971. [Google Scholar] [CrossRef]
- British Standards. Voltage Characteristics of Electricity Supploed by Public Distribution Systems; European Committee for Electrotechnical Standardization: Brussels, Belgium, 2001. [Google Scholar]
- International Electrotechnical Commission. Limits for Harmonic Current Emissions; IEC: Geneva, Switzerland, 2000. [Google Scholar]
Figure 1.
FRT/LVRT curves defined by Spanish, Danish, Chinese grid code [16].
Figure 1.
FRT/LVRT curves defined by Spanish, Danish, Chinese grid code [16].

Figure 2.
Spain and Denmark reactive power requirement under FRT operation mode.

Figure 3.
Incorporated Grid Supporting Control with Droop for Inverter Based Microgrid with DC-DC Converter.
Figure 3.
Incorporated Grid Supporting Control with Droop for Inverter Based Microgrid with DC-DC Converter.

Figure 4.
Delayed Signal Cancellation Demonstration (a) counter-clockwise rotation, (b) opposite phase shift caused by introduced delay, and (c) half-cycle phase shift in an original rotating direction.
Figure 4.
Delayed Signal Cancellation Demonstration (a) counter-clockwise rotation, (b) opposite phase shift caused by introduced delay, and (c) half-cycle phase shift in an original rotating direction.

Figure 5.
Fast DSC implementation.

Figure 6.
Proposed Control with Fast DSC.

Figure 7.
p−V curve for FRT and MPPT operations.

Figure 8.
(a) DSC sag detection compared to FFT, SRRF, PEAK, and RMS methods at fault inception, and (b) DSC sag detection compared to FFT, SRRF, PEAK, and RMS methods at fault clearance.
Figure 8.
(a) DSC sag detection compared to FFT, SRRF, PEAK, and RMS methods at fault inception, and (b) DSC sag detection compared to FFT, SRRF, PEAK, and RMS methods at fault clearance.

Figure 9.
(a) Grid voltage at fault inception, (b) Grid voltage at fault clearance.

Figure 10.
Pulses generated in all line 1 of the three-phase system (a) all through the fault occurrence, (b) at fault inception, and (c) at fault clearance.
Figure 10.
Pulses generated in all line 1 of the three-phase system (a) all through the fault occurrence, (b) at fault inception, and (c) at fault clearance.

Figure 11.
Pulses generated in all line 2 of the three-phase system (a) all through the fault occurrence, (b) at fault inception, and (c) at fault clearance.
Figure 11.
Pulses generated in all line 2 of the three-phase system (a) all through the fault occurrence, (b) at fault inception, and (c) at fault clearance.

Figure 12.
Pulses generated in all line 3 of the three-phase system (a) all through the fault occurrence, (b) at fault inception, and (c) at fault clearance.
Figure 12.
Pulses generated in all line 3 of the three-phase system (a) all through the fault occurrence, (b) at fault inception, and (c) at fault clearance.

Figure 13.
(a) PV voltage under 50% grid voltage sag, (b) DC-link voltage under 50% grid voltage sag, and (c) Average DC link current under 50% grid voltage sag.
Figure 13.
(a) PV voltage under 50% grid voltage sag, (b) DC-link voltage under 50% grid voltage sag, and (c) Average DC link current under 50% grid voltage sag.

Figure 14.
(a) PV voltage under 60% grid voltage sag, (b) DC-link voltage under 60% grid voltage sag, and (c) Average DC link current under 60% grid voltage sag.
Figure 14.
(a) PV voltage under 60% grid voltage sag, (b) DC-link voltage under 60% grid voltage sag, and (c) Average DC link current under 60% grid voltage sag.

Figure 15.
(a) PV voltage under 70% grid voltage sag, (b) DC link voltage under 70% grid voltage sag, and (c) Average DC link current under 70% grid voltage sag.
Figure 15.
(a) PV voltage under 70% grid voltage sag, (b) DC link voltage under 70% grid voltage sag, and (c) Average DC link current under 70% grid voltage sag.

Figure 16.
(a) Voltages in the grid and microgrid at grid voltage sag of 50% produced by L-L-L-G fault, (b) Voltages in the grid and microgrid at grid voltage sag of 60% produced by L-L-L-G fault, and (c) Voltages in the grid and microgrid at grid voltage sag of 70% produced by L-L-L-G fault.
Figure 16.
(a) Voltages in the grid and microgrid at grid voltage sag of 50% produced by L-L-L-G fault, (b) Voltages in the grid and microgrid at grid voltage sag of 60% produced by L-L-L-G fault, and (c) Voltages in the grid and microgrid at grid voltage sag of 70% produced by L-L-L-G fault.

Figure 17.
(a) Current at the PCC with and without the proposed secondary control 50% voltage sag, (b) Current at the PCC with and without the proposed secondary control 60% voltage sag, and (c) Current at the PCC with and without the proposed secondary control 70% voltage sag.
Figure 17.
(a) Current at the PCC with and without the proposed secondary control 50% voltage sag, (b) Current at the PCC with and without the proposed secondary control 60% voltage sag, and (c) Current at the PCC with and without the proposed secondary control 70% voltage sag.

Figure 18.
(a) THD at 50% voltage sag with secondary control and (b) THD at 60% voltage sag with secondary control.
Figure 18.
(a) THD at 50% voltage sag with secondary control and (b) THD at 60% voltage sag with secondary control.

Figure 19.
(a) Active power supplied by PV under voltage sag of 50%, and (b) Reactive power supplied by PV under voltage sag of 50%.
Figure 19.
(a) Active power supplied by PV under voltage sag of 50%, and (b) Reactive power supplied by PV under voltage sag of 50%.

Figure 20.
(a) Active power supplied by PV under voltage sag of 60%, and (b) Reactive power supplied by PV under voltage sag of 60%.
Figure 20.
(a) Active power supplied by PV under voltage sag of 60%, and (b) Reactive power supplied by PV under voltage sag of 60%.

Figure 21.
(a) Active power supplied by PV under voltage sag of 70%, and (b) Reactive power supplied by PV under voltage sag of 70%.
Figure 21.
(a) Active power supplied by PV under voltage sag of 70%, and (b) Reactive power supplied by PV under voltage sag of 70%.

Figure 22.
(a) Active power supply to local microgrid load under voltage sag of 50%, and (b) Reactive power supply to local microgrid load under voltage sag of 50%.
Figure 22.
(a) Active power supply to local microgrid load under voltage sag of 50%, and (b) Reactive power supply to local microgrid load under voltage sag of 50%.

Figure 23.
(a) Active power supply to local microgrid load under voltage sag of 60%, and (b) Reactive power supply to local microgrid load under voltage sag of 60%.
Figure 23.
(a) Active power supply to local microgrid load under voltage sag of 60%, and (b) Reactive power supply to local microgrid load under voltage sag of 60%.

Figure 24.
(a) Active power supply to local microgrid load under voltage sag of 70%, and (b) Reactive power supply to local microgrid load under voltage sag of 70%.
Figure 24.
(a) Active power supply to local microgrid load under voltage sag of 70%, and (b) Reactive power supply to local microgrid load under voltage sag of 70%.

Figure 25.
The seamless switching between MPP and FRT operation based on p-V characteristics.


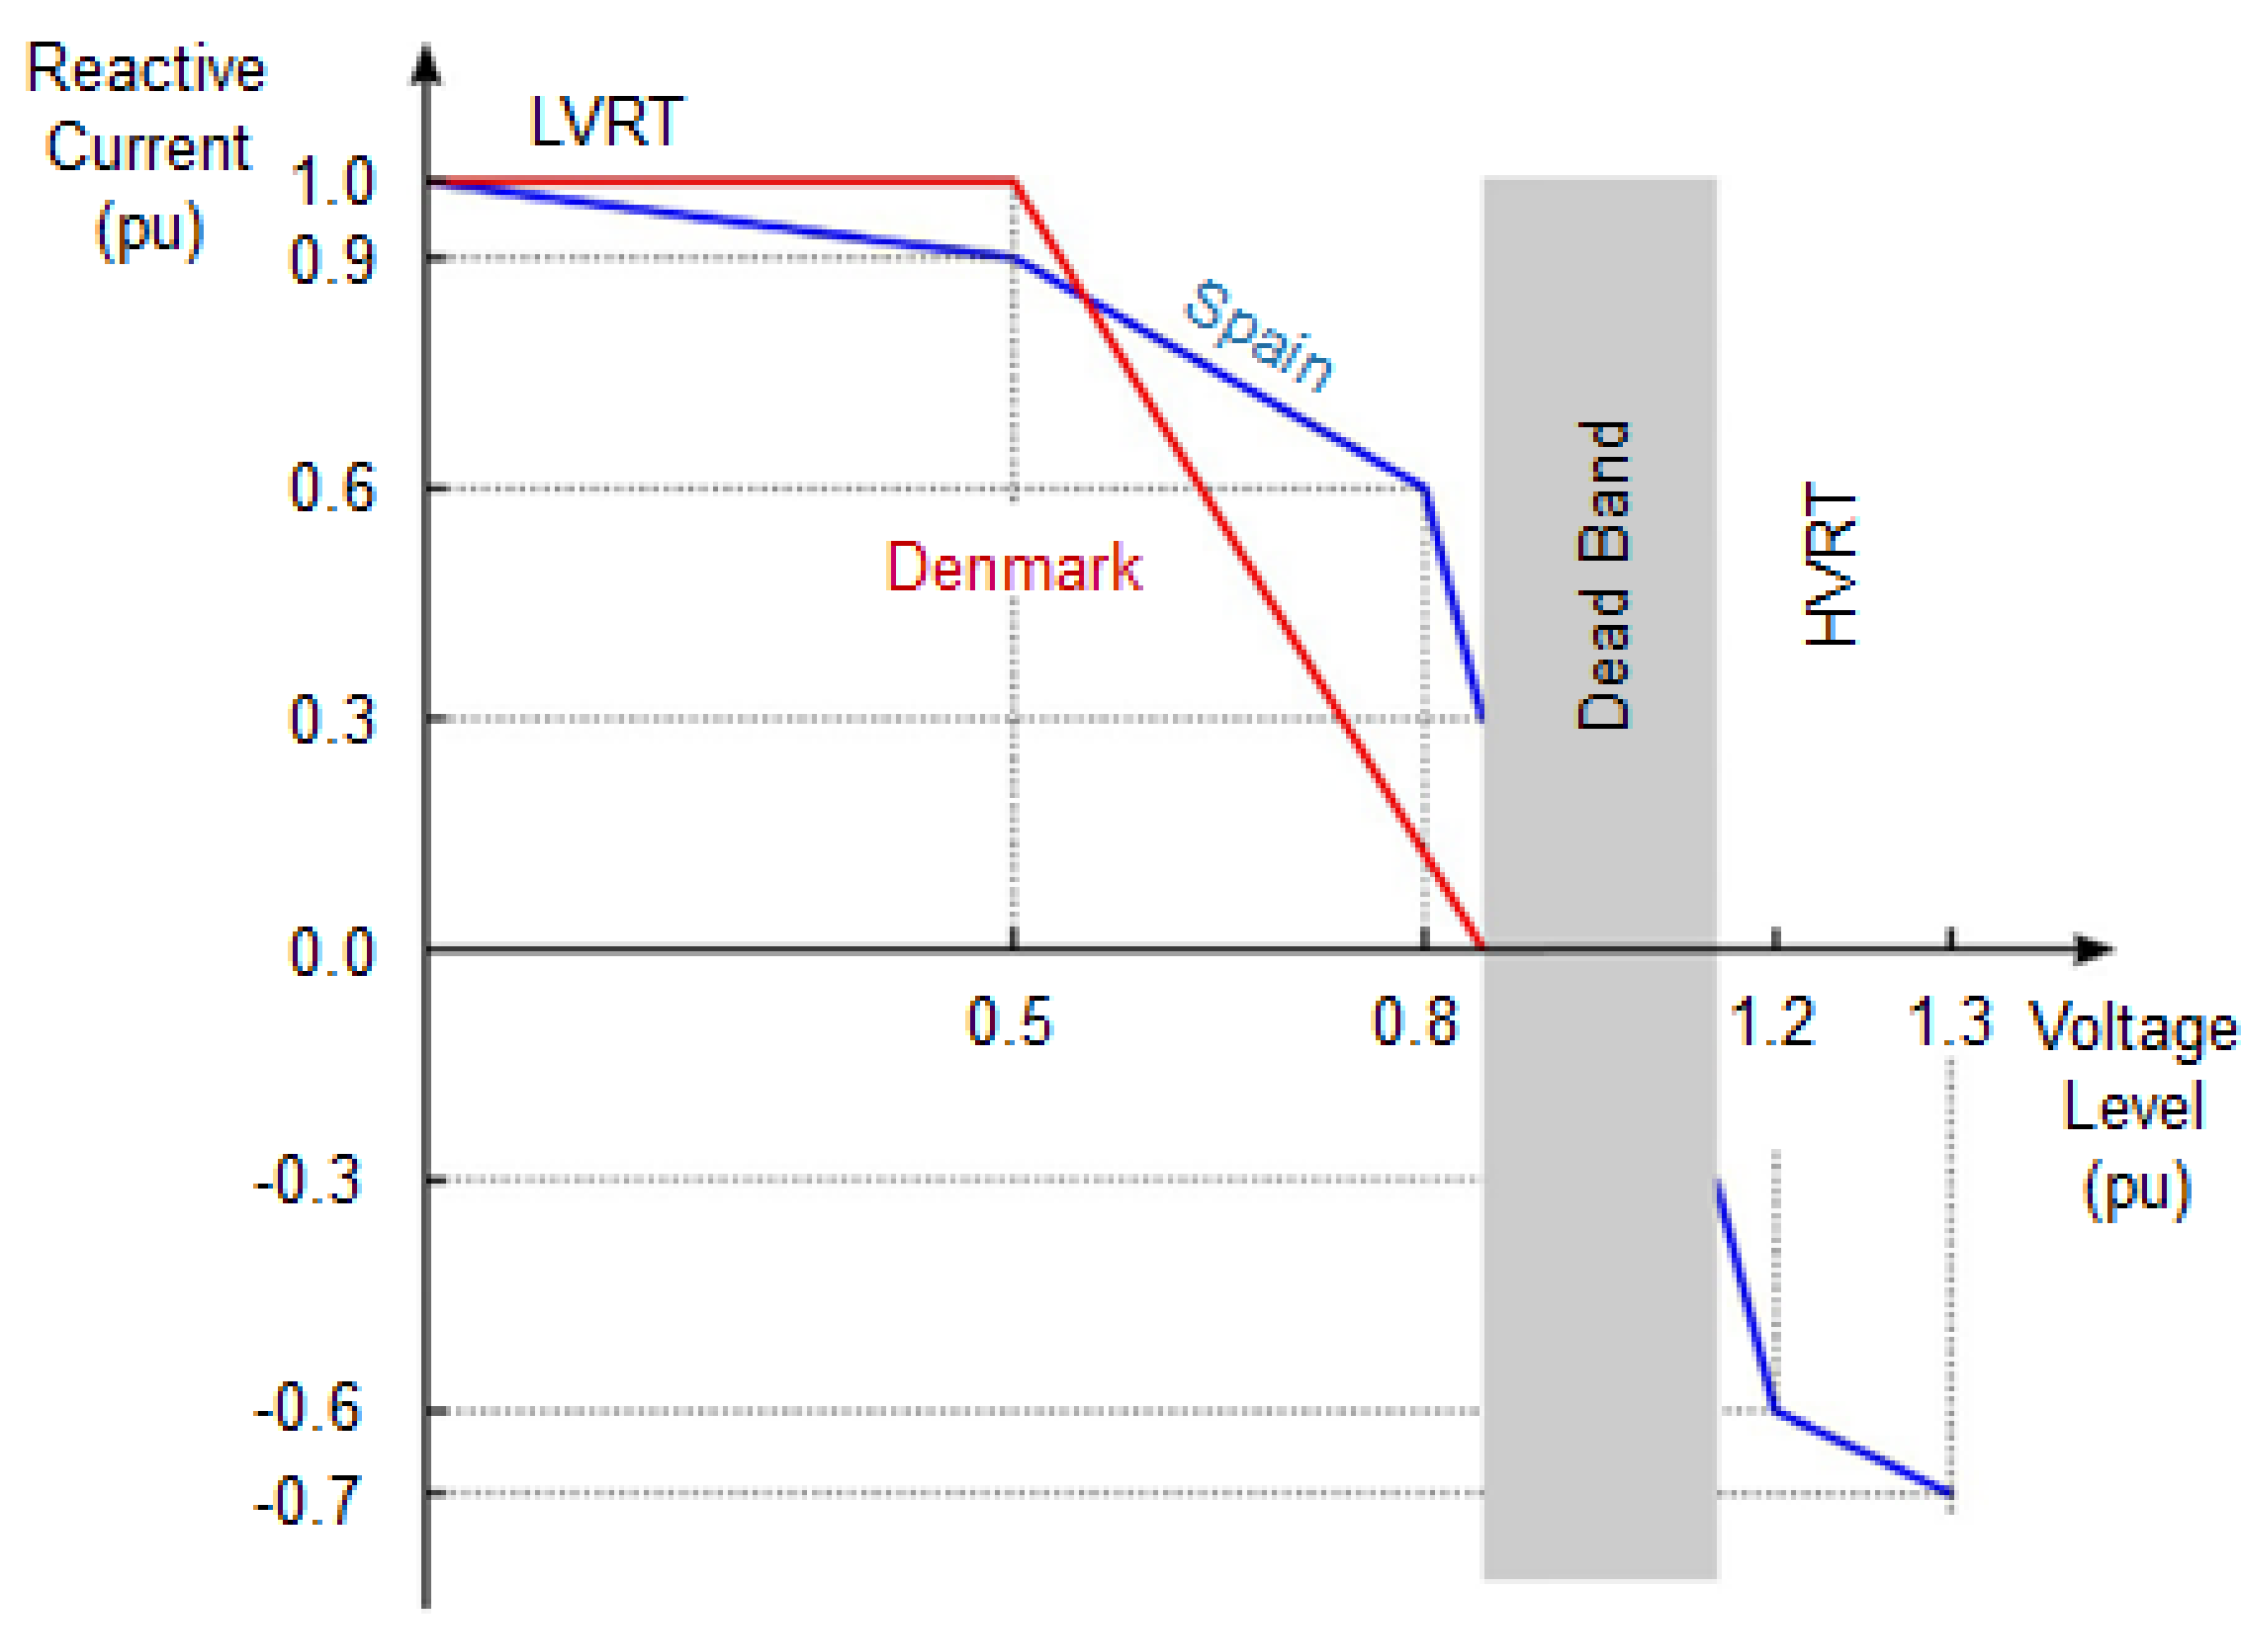
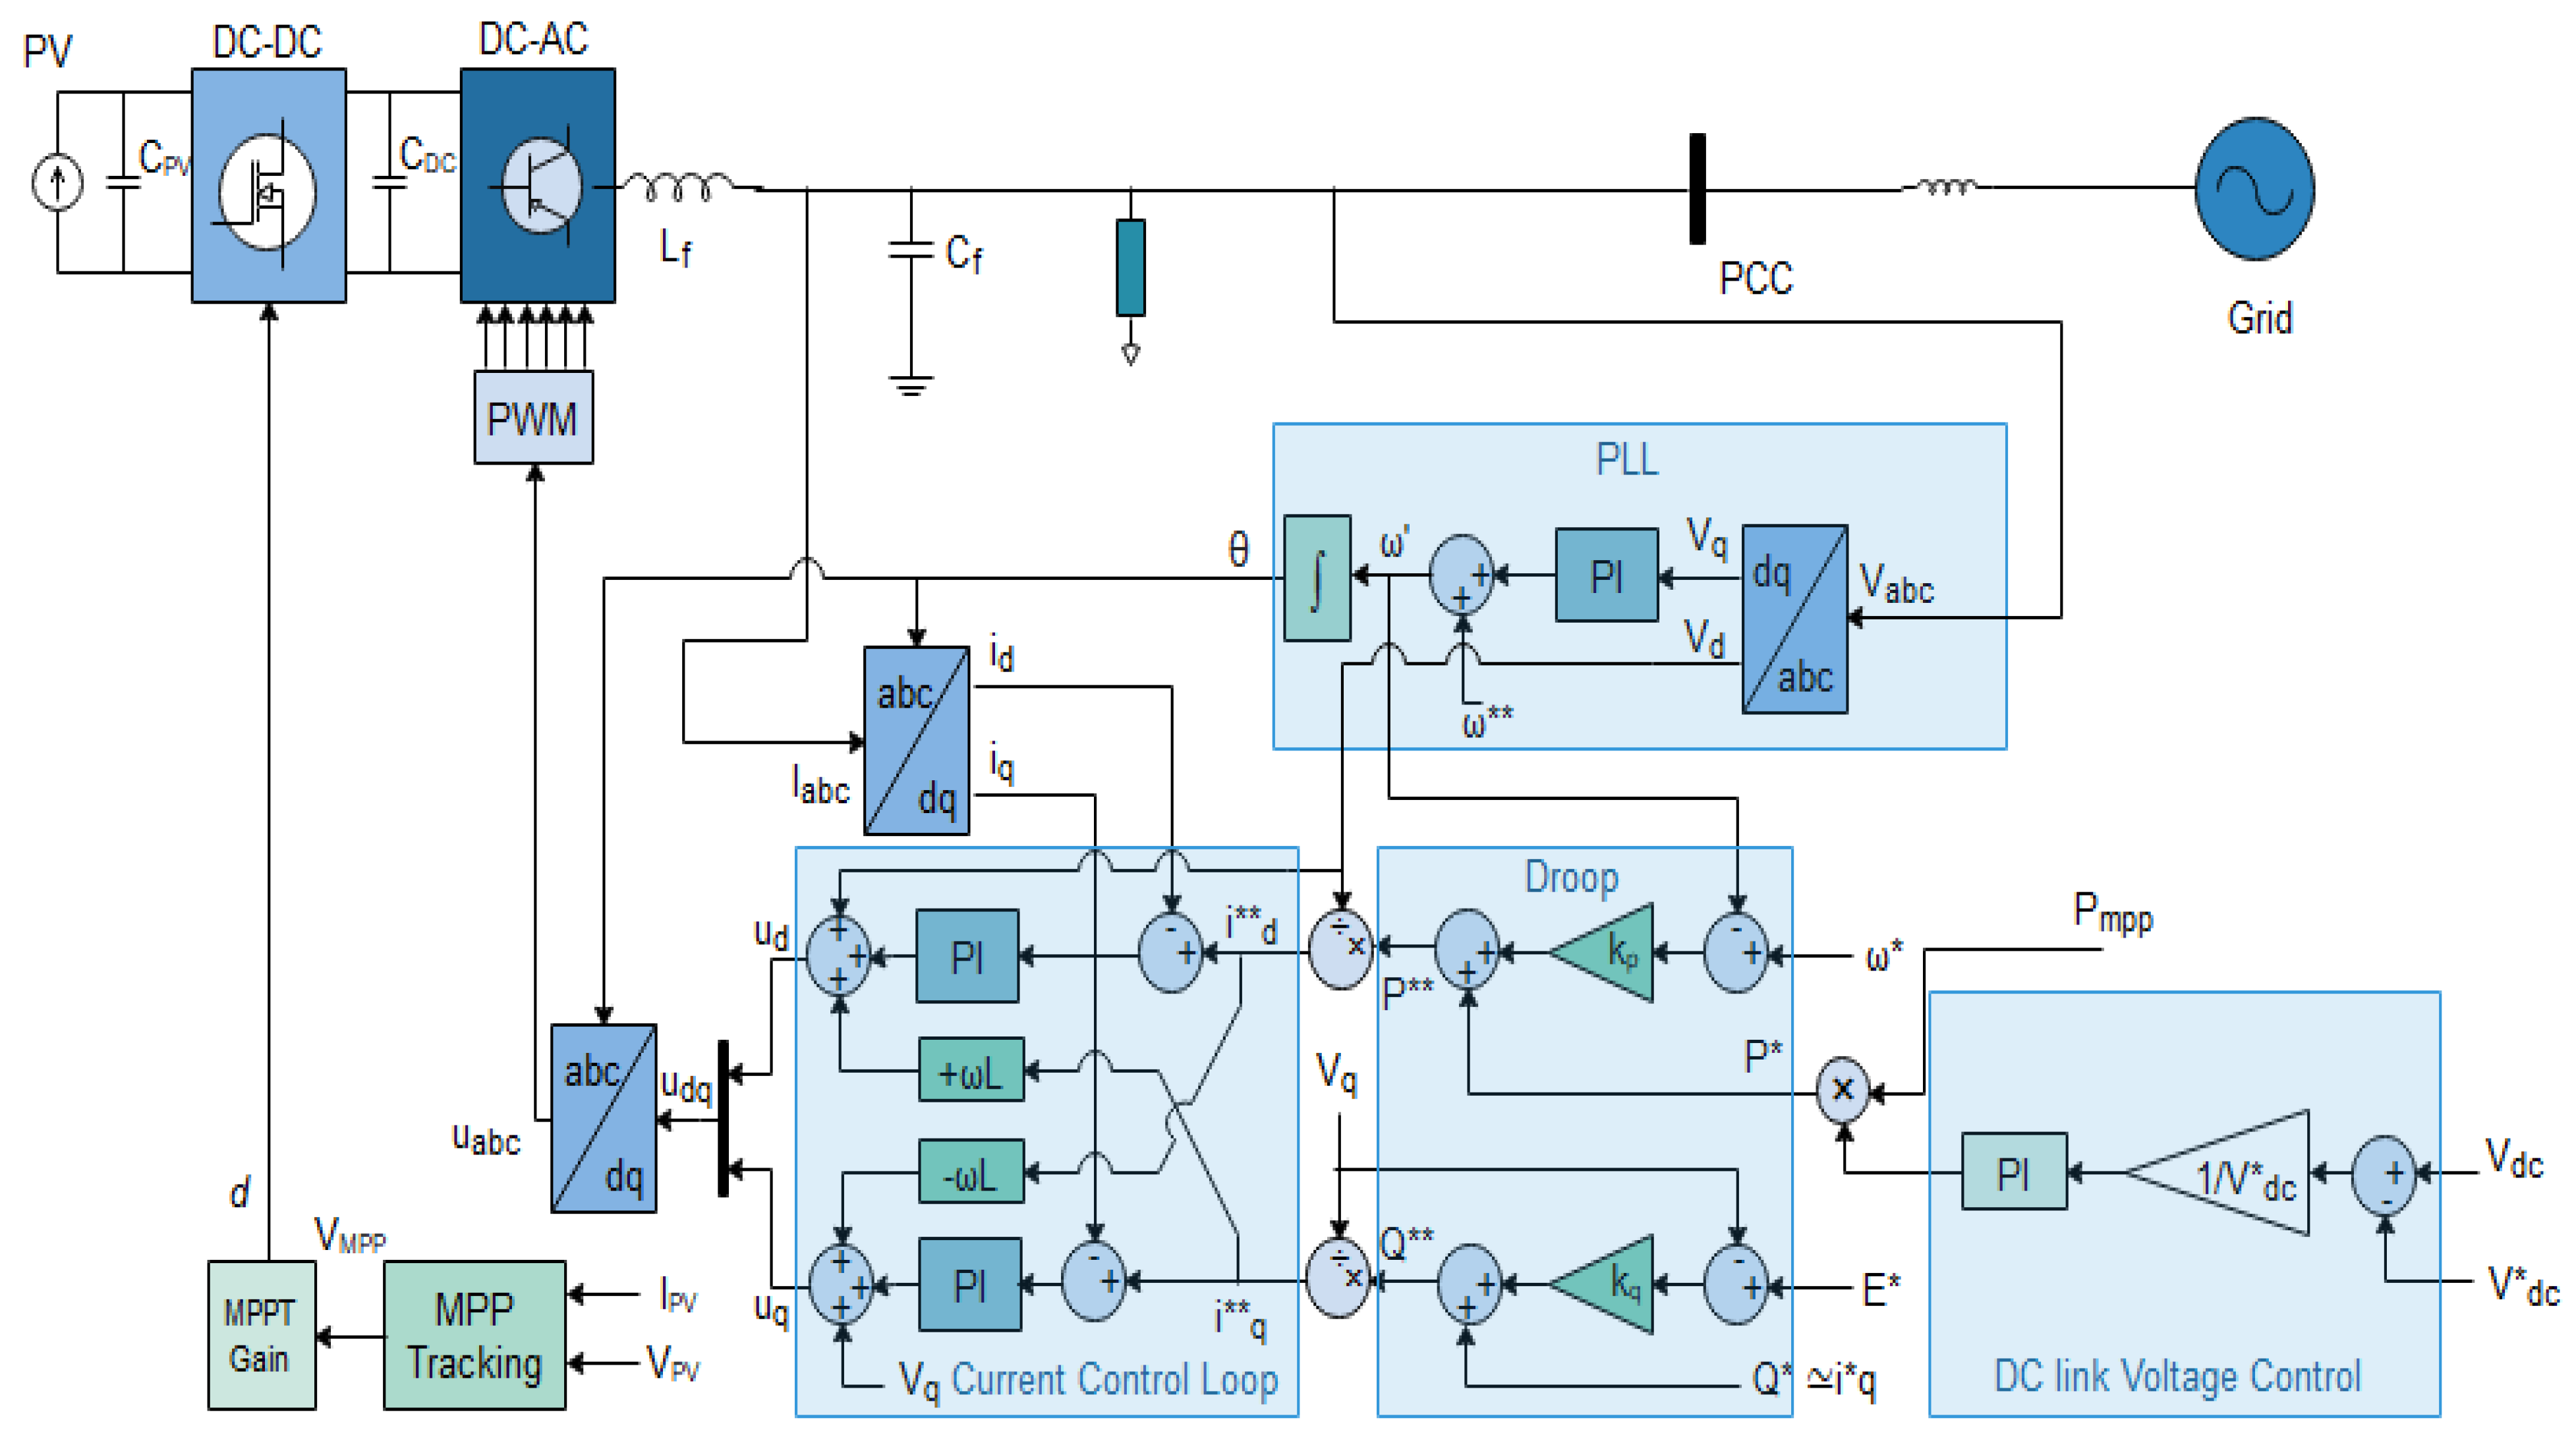
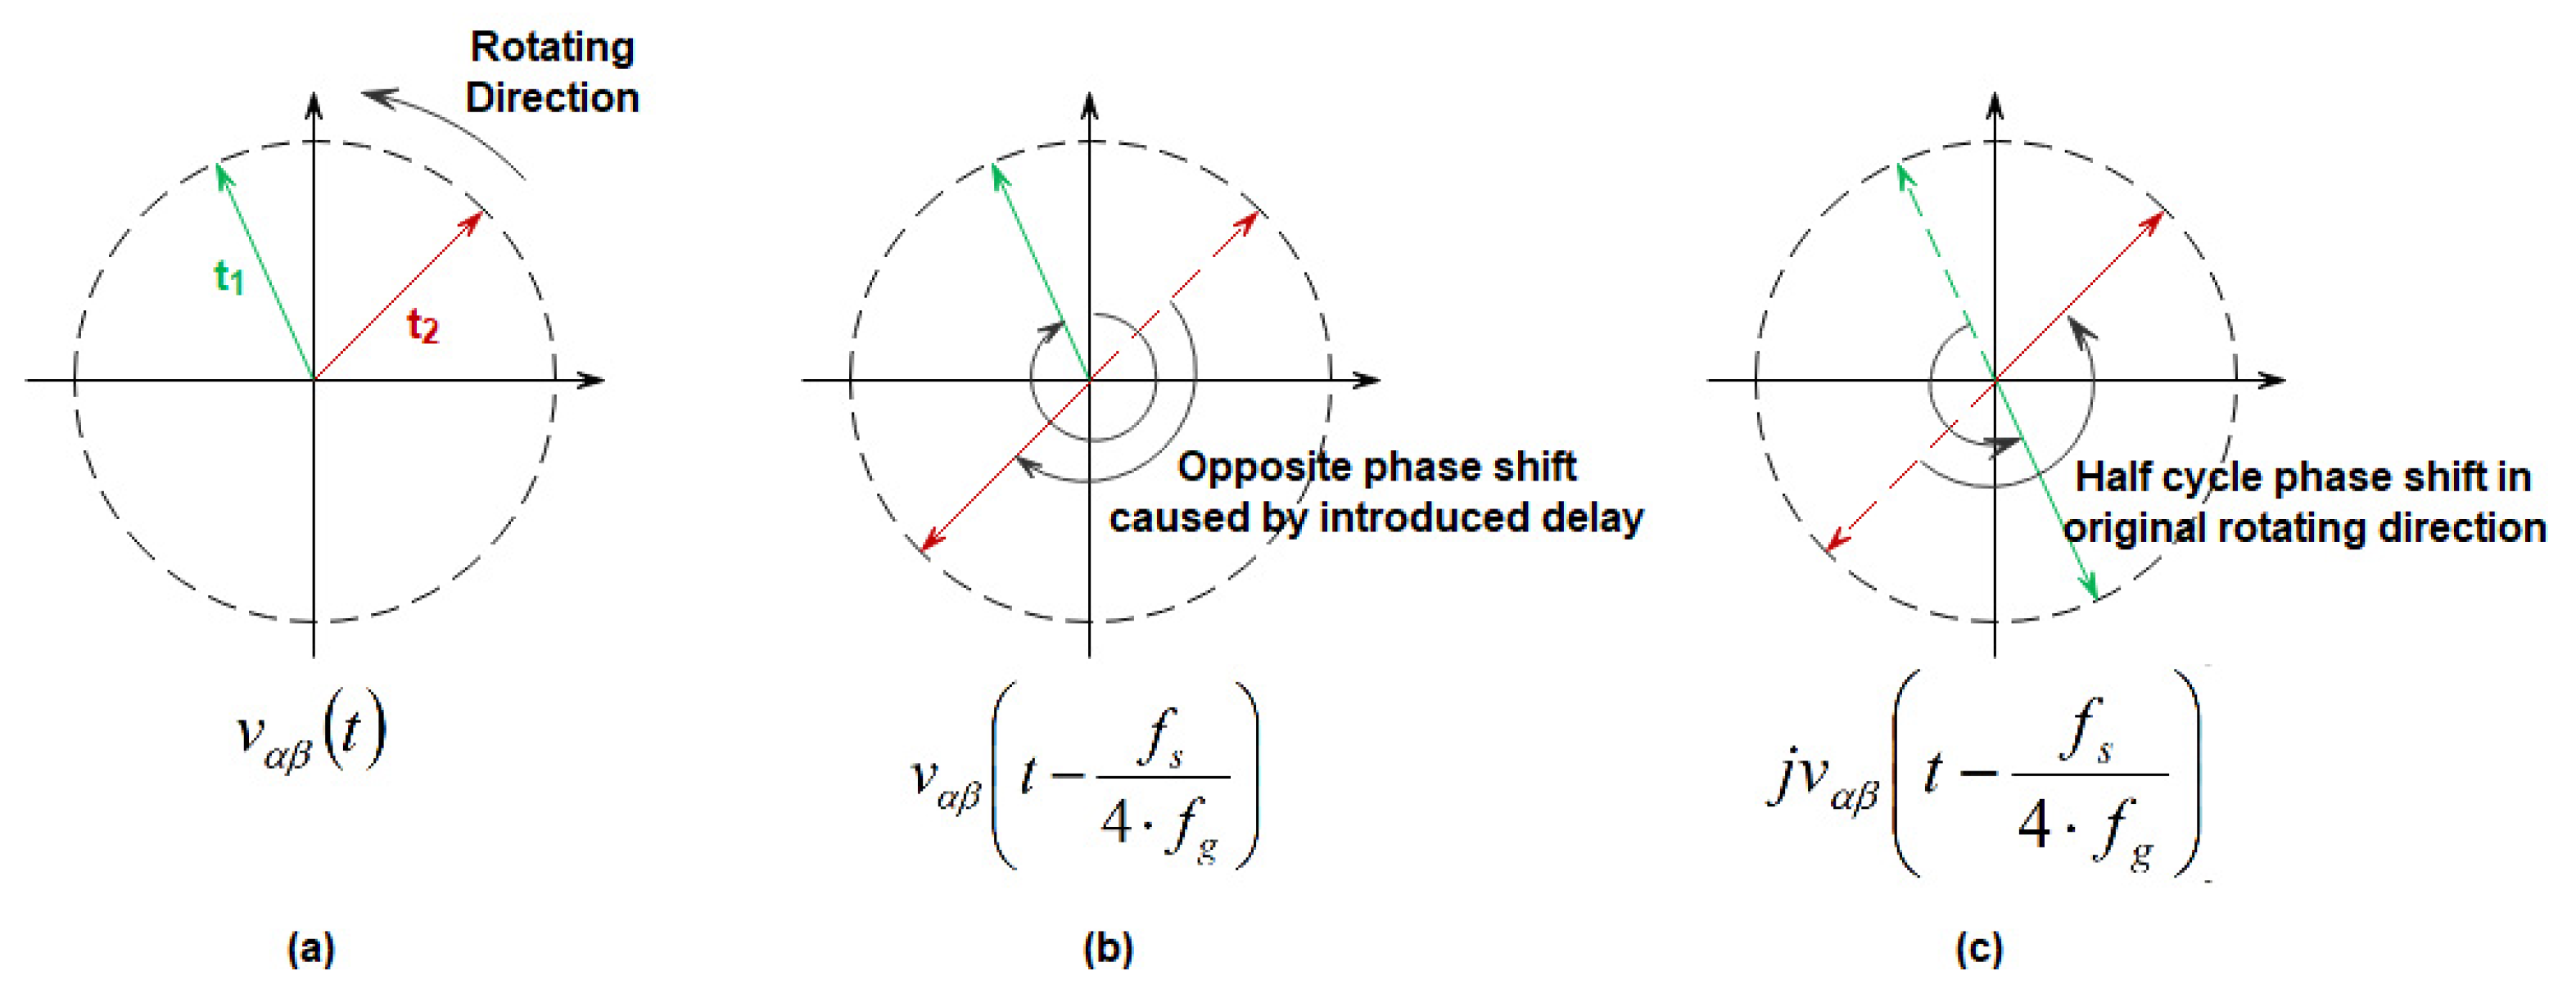
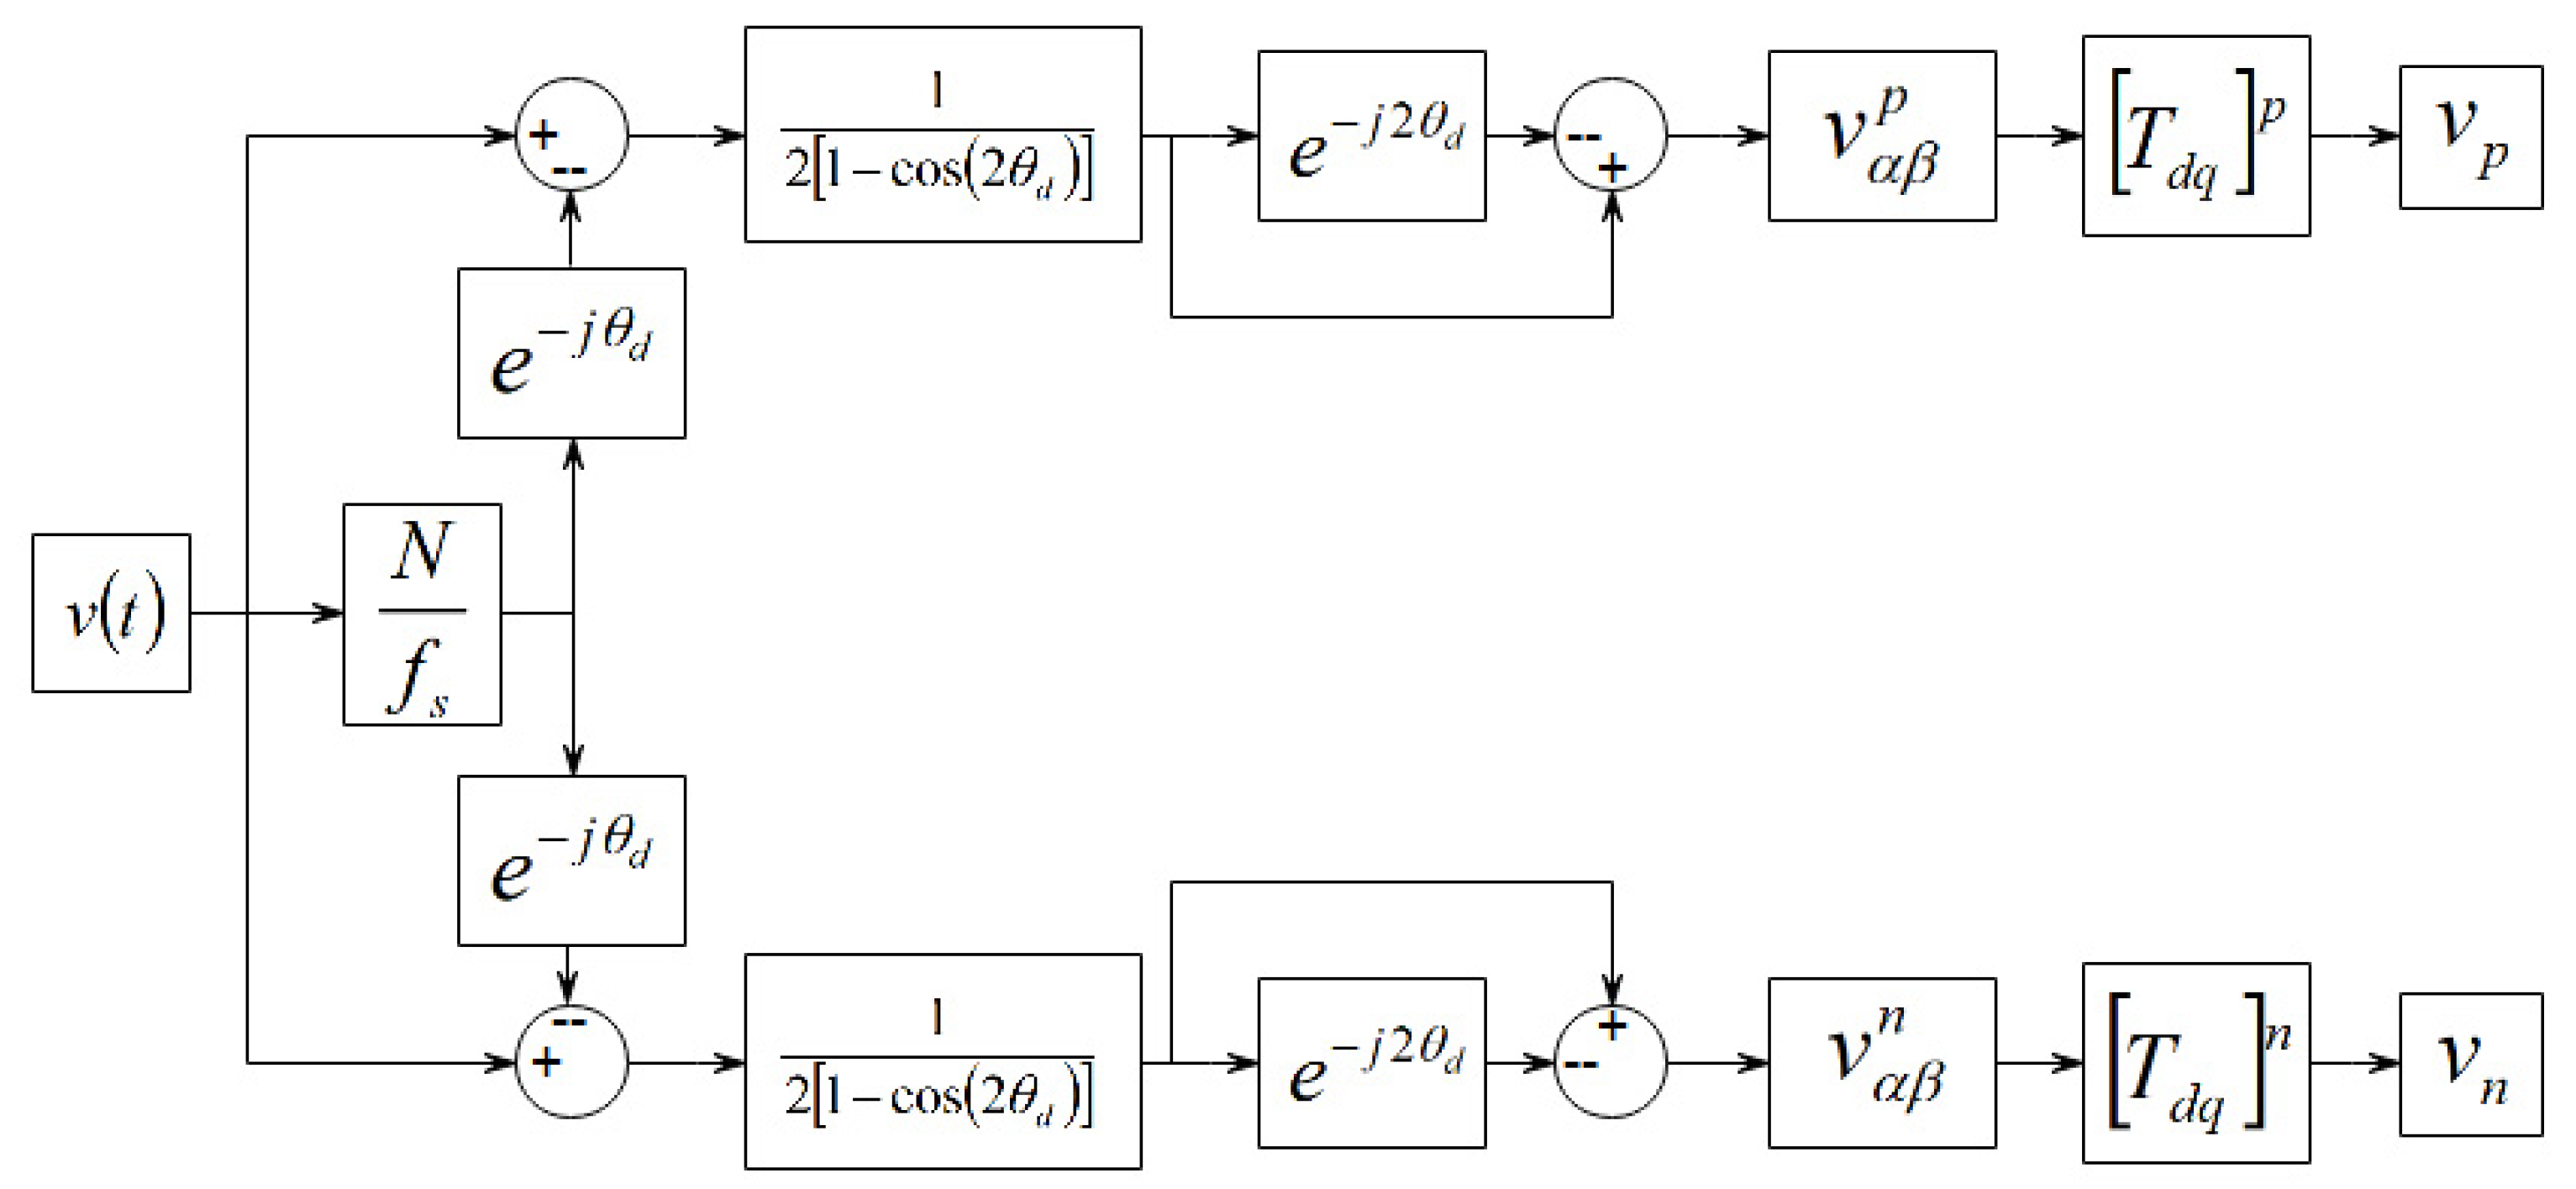
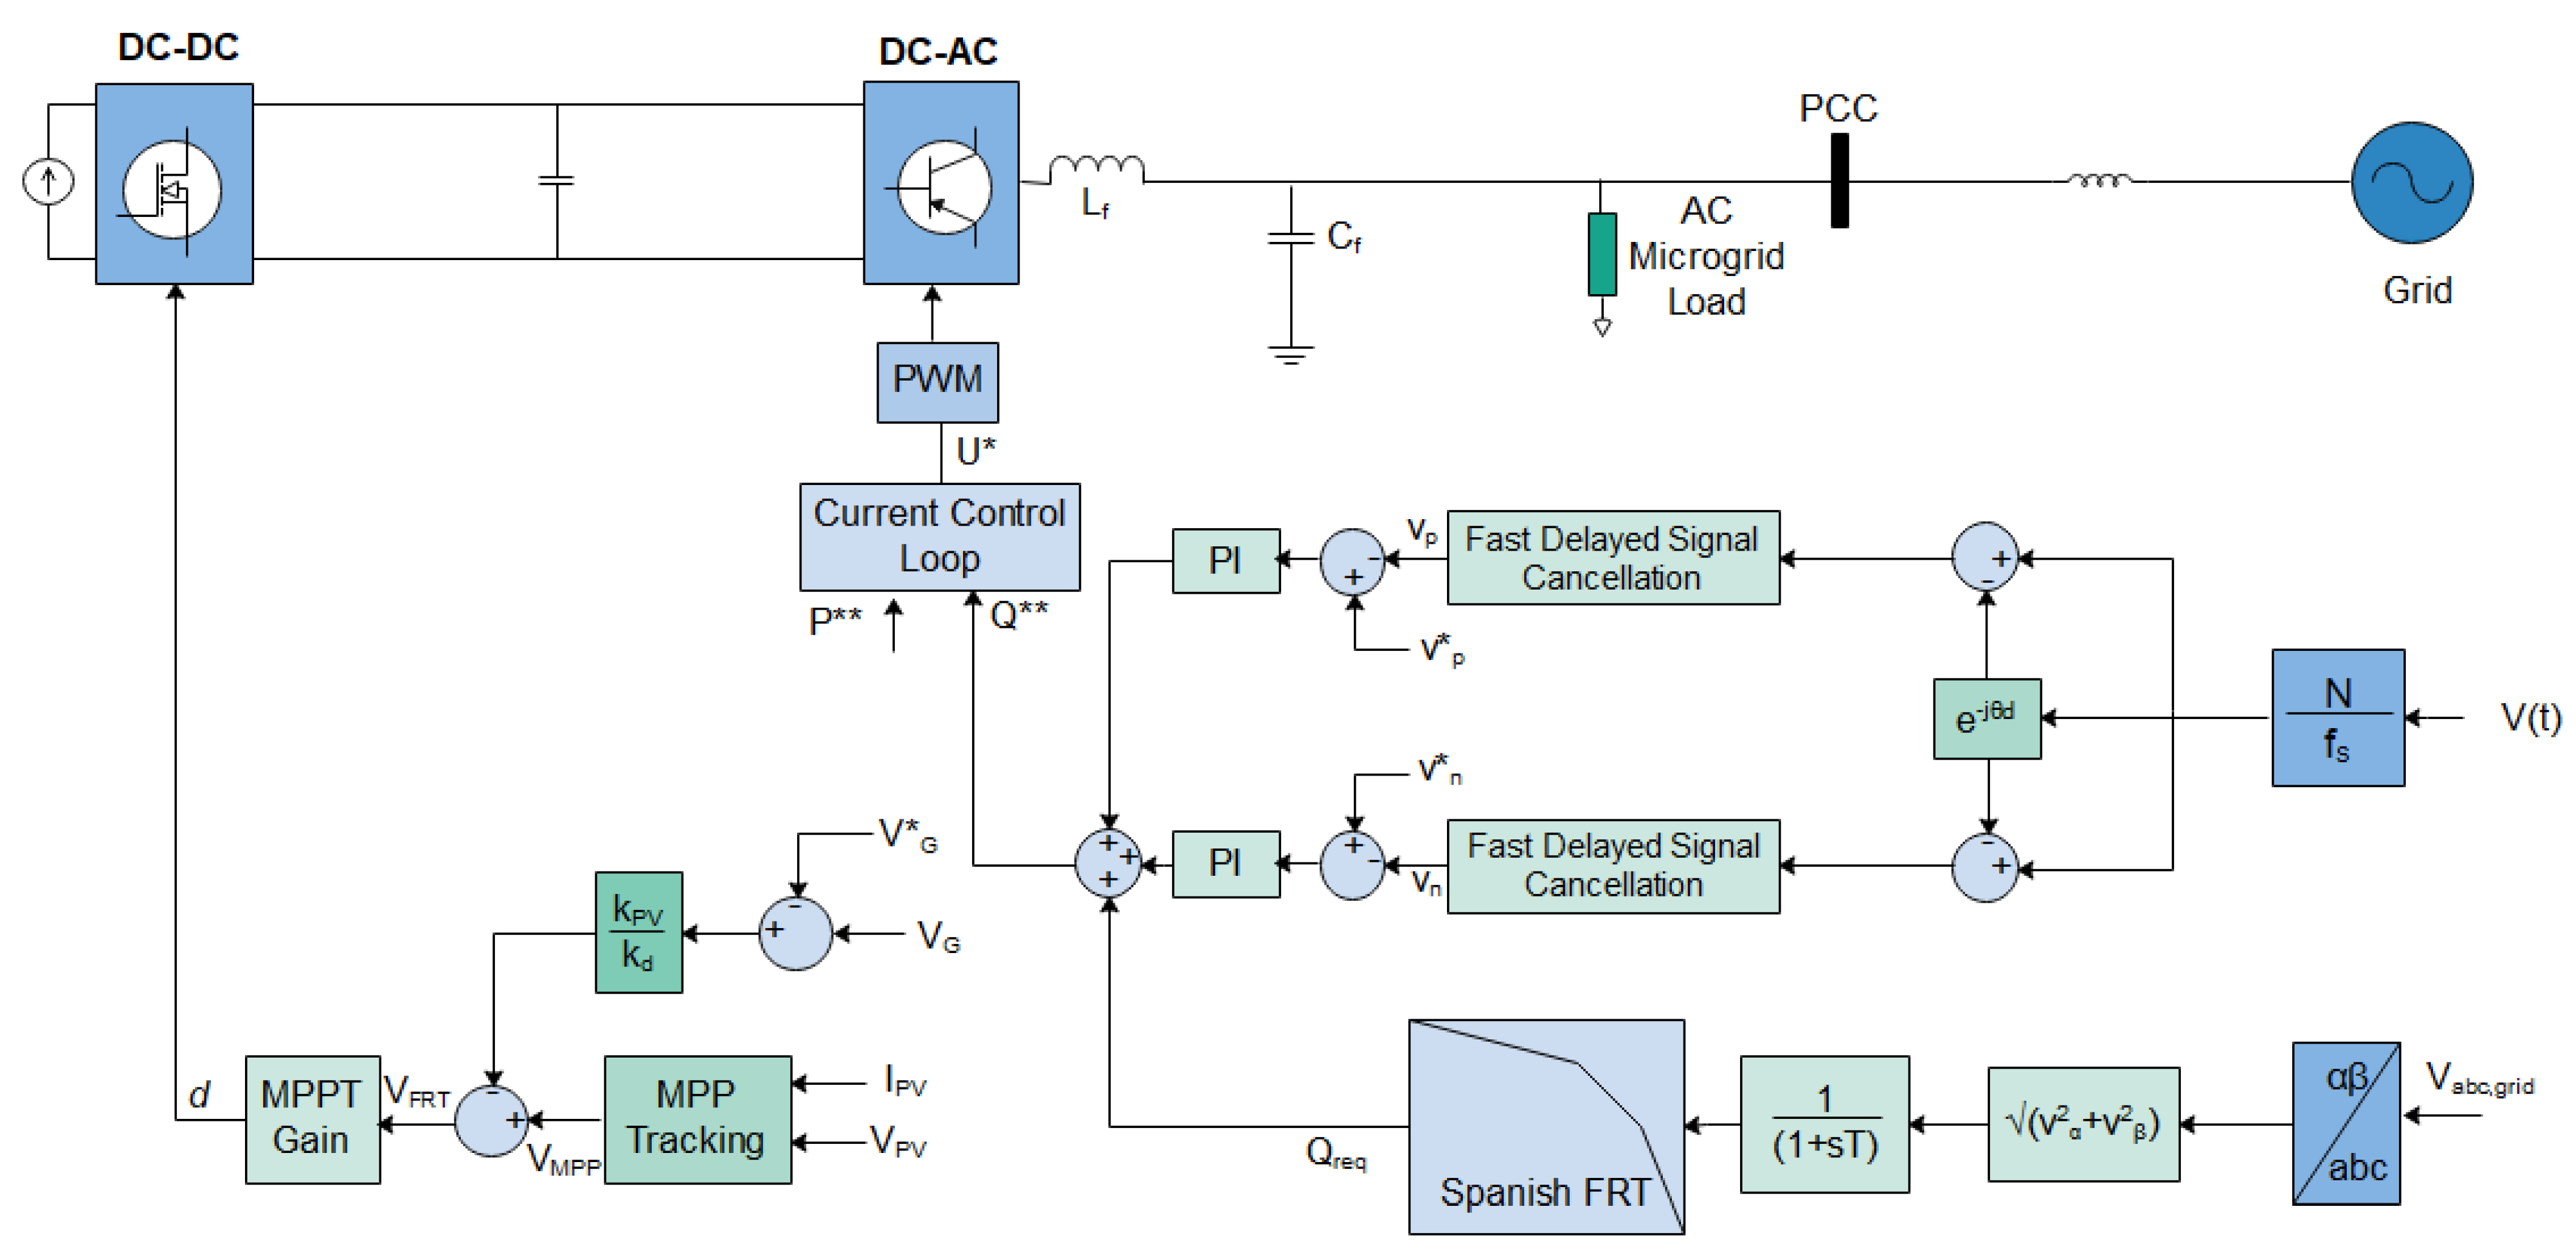
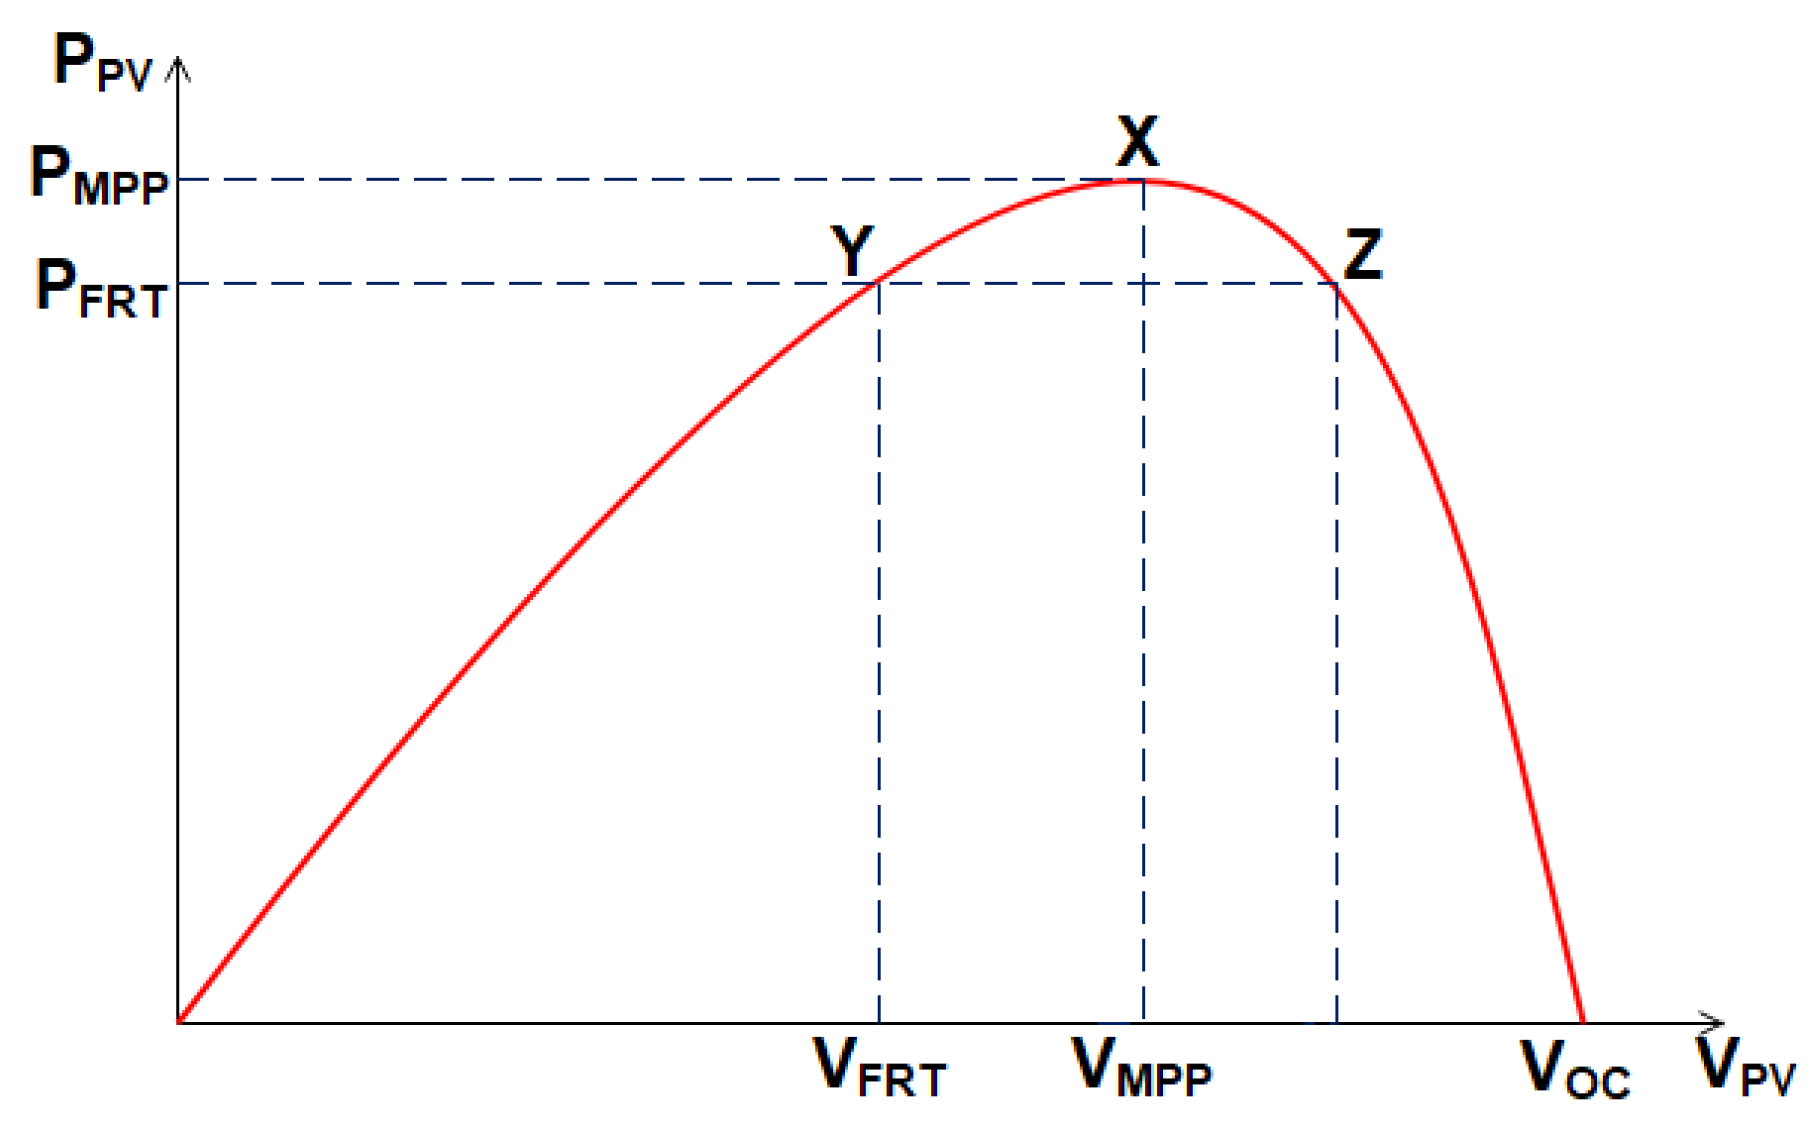
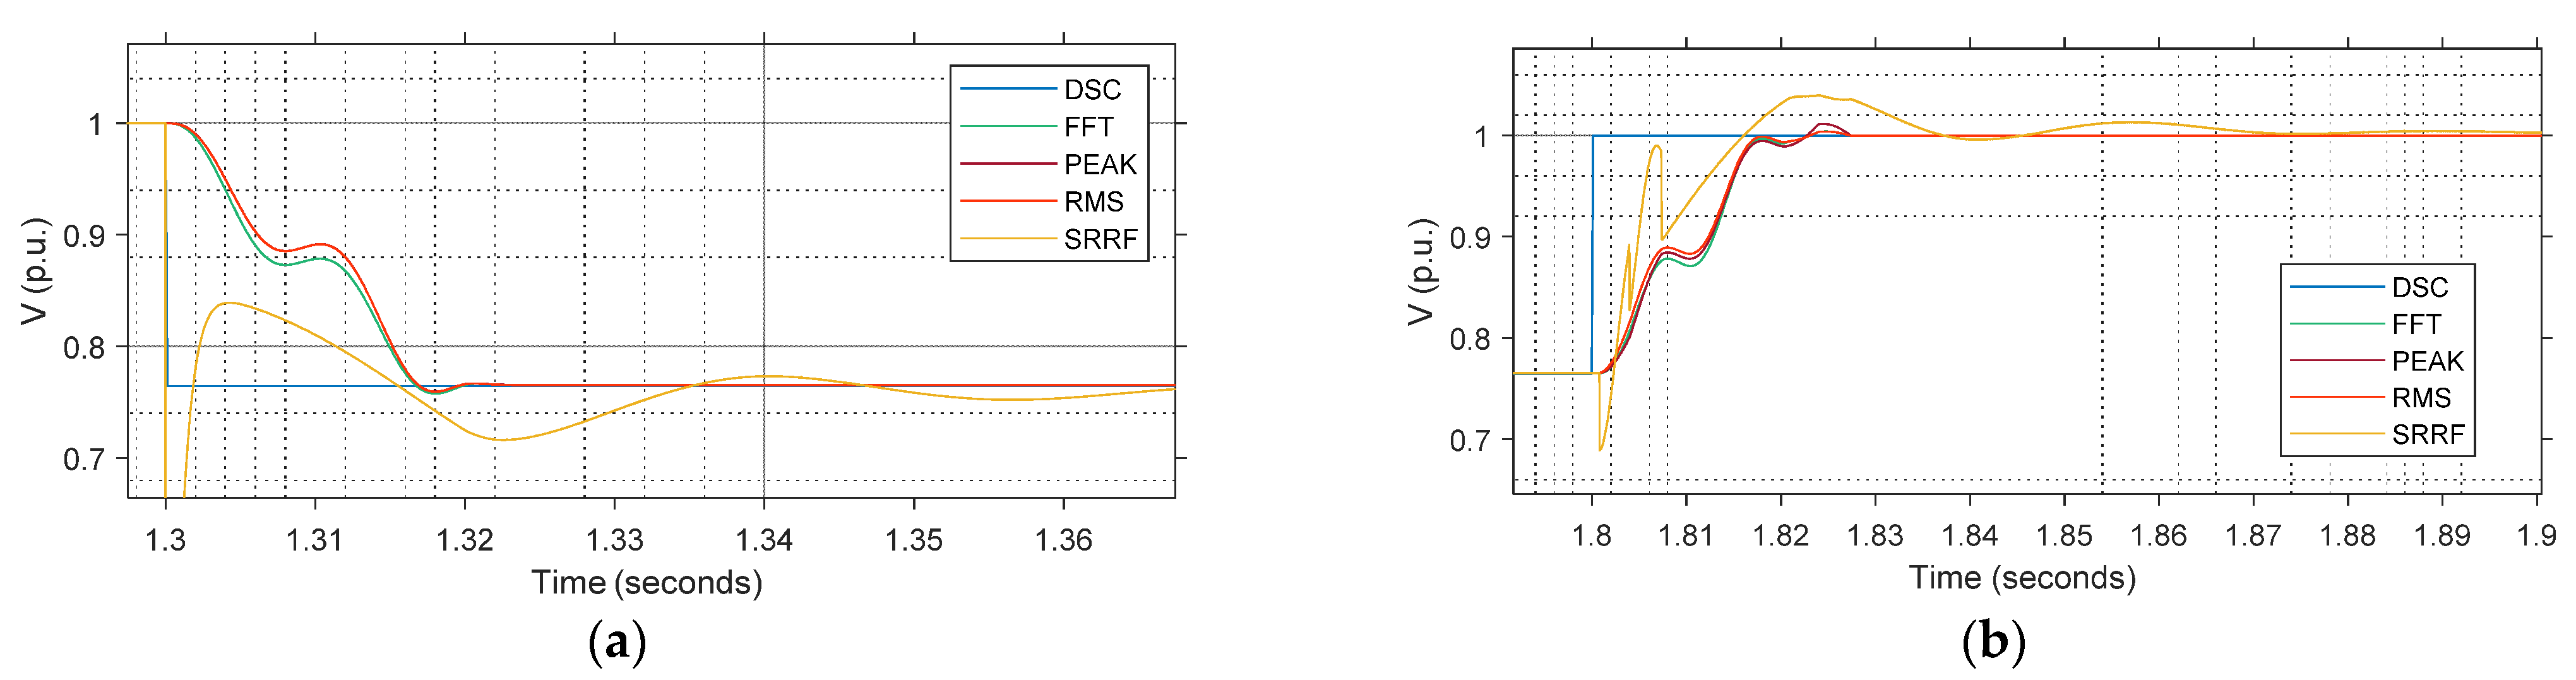
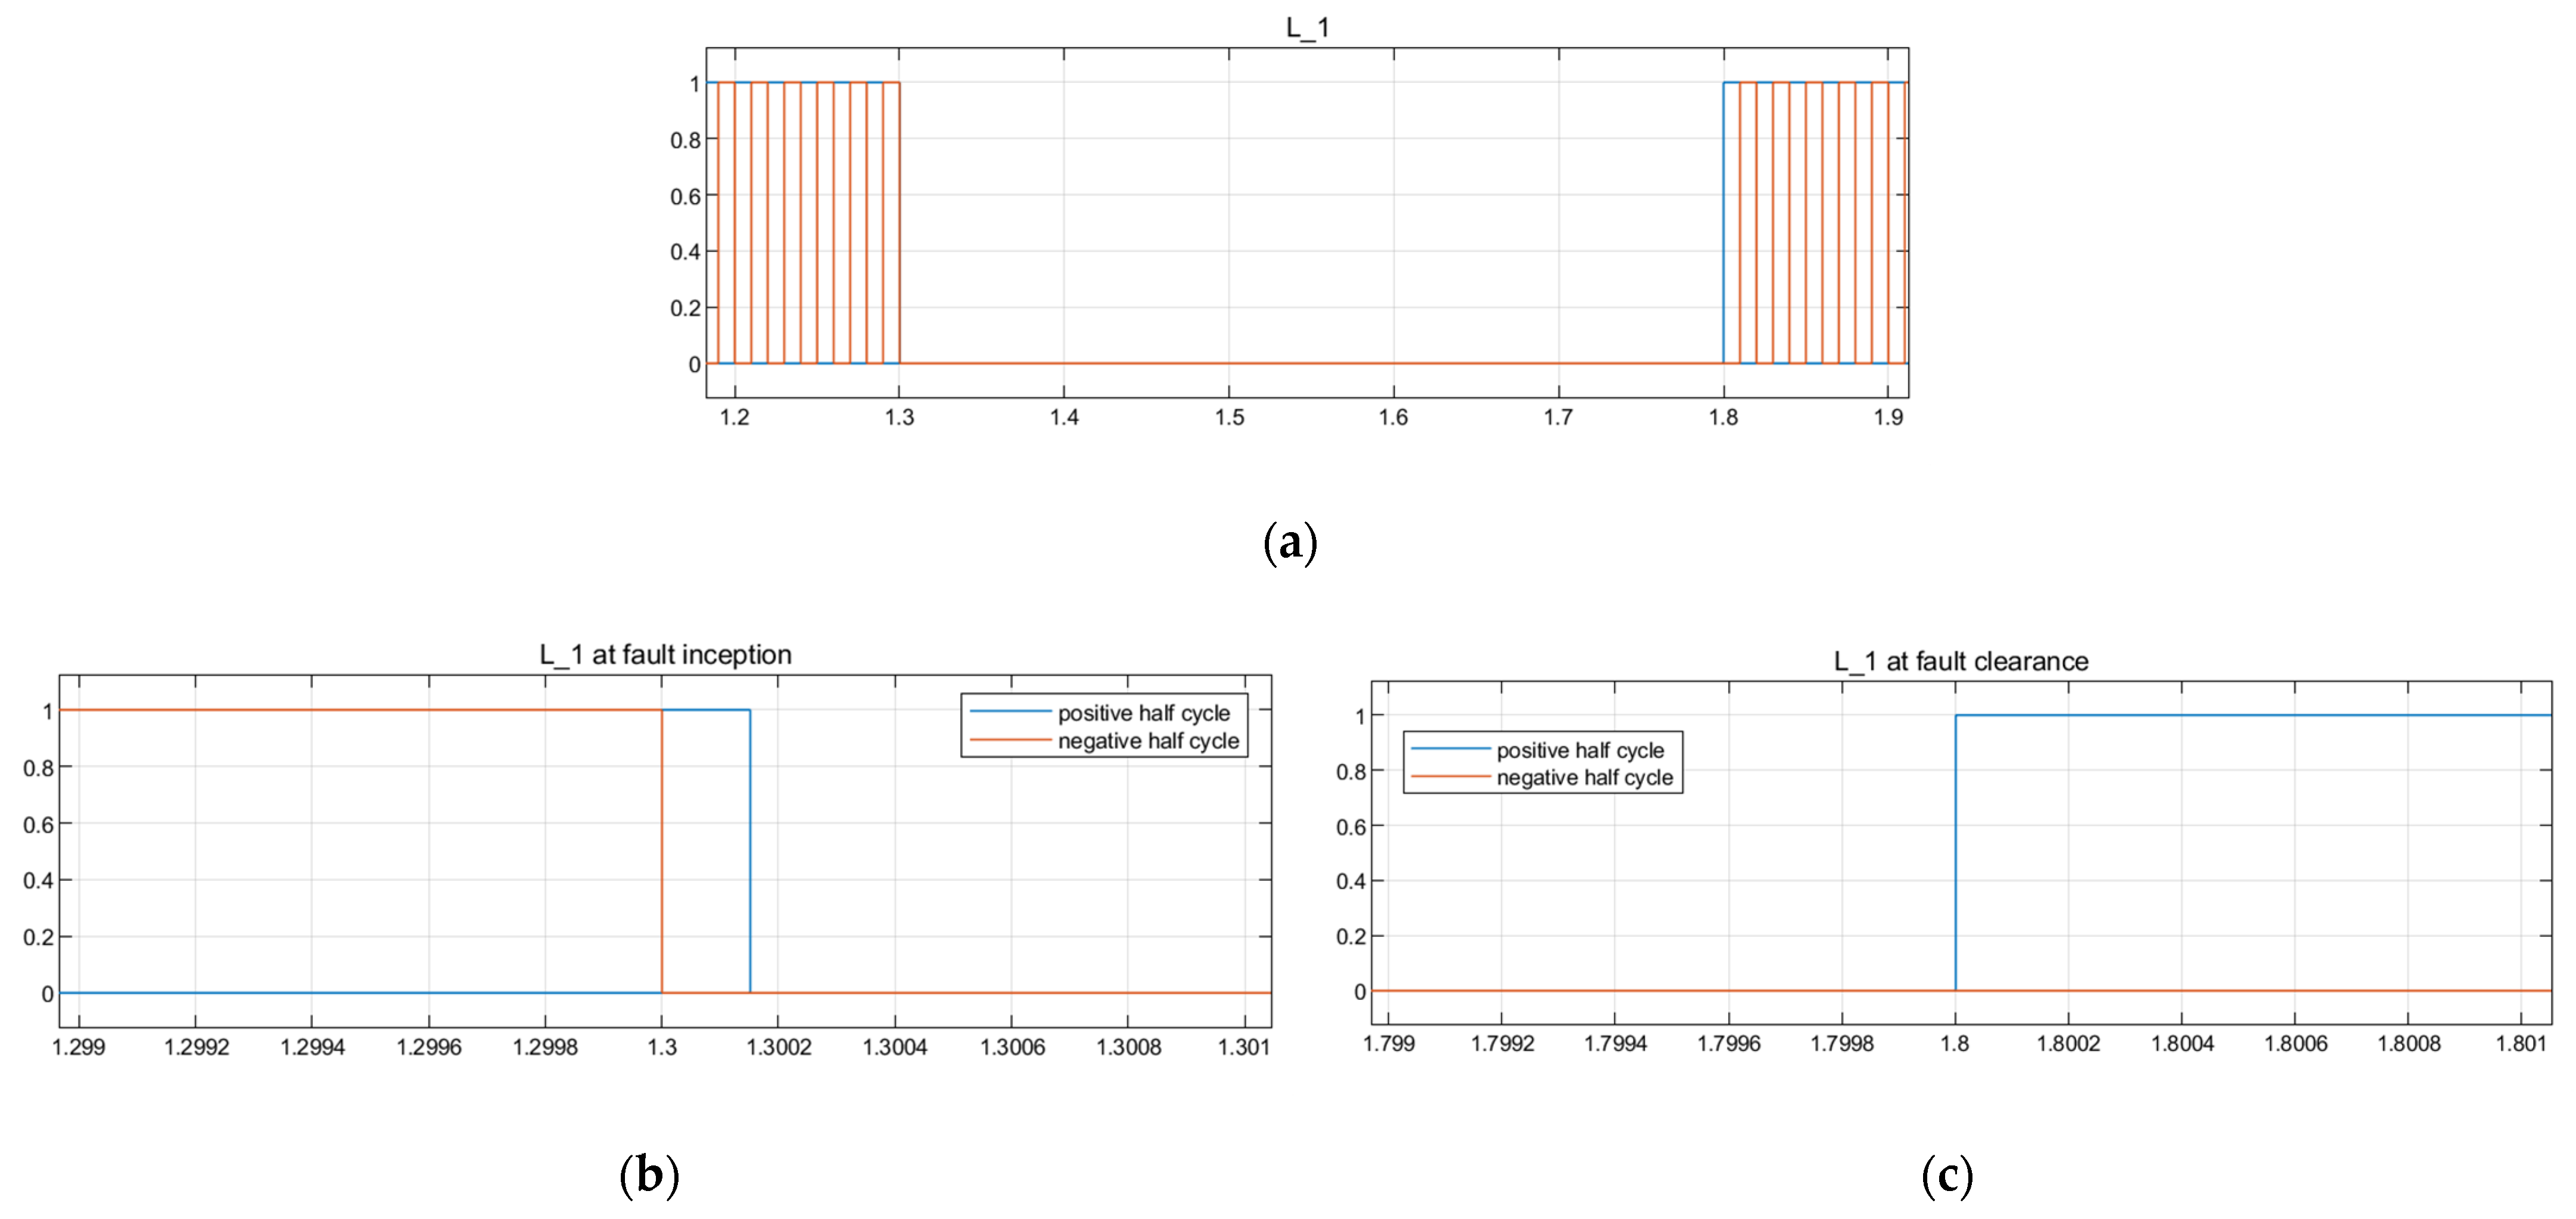
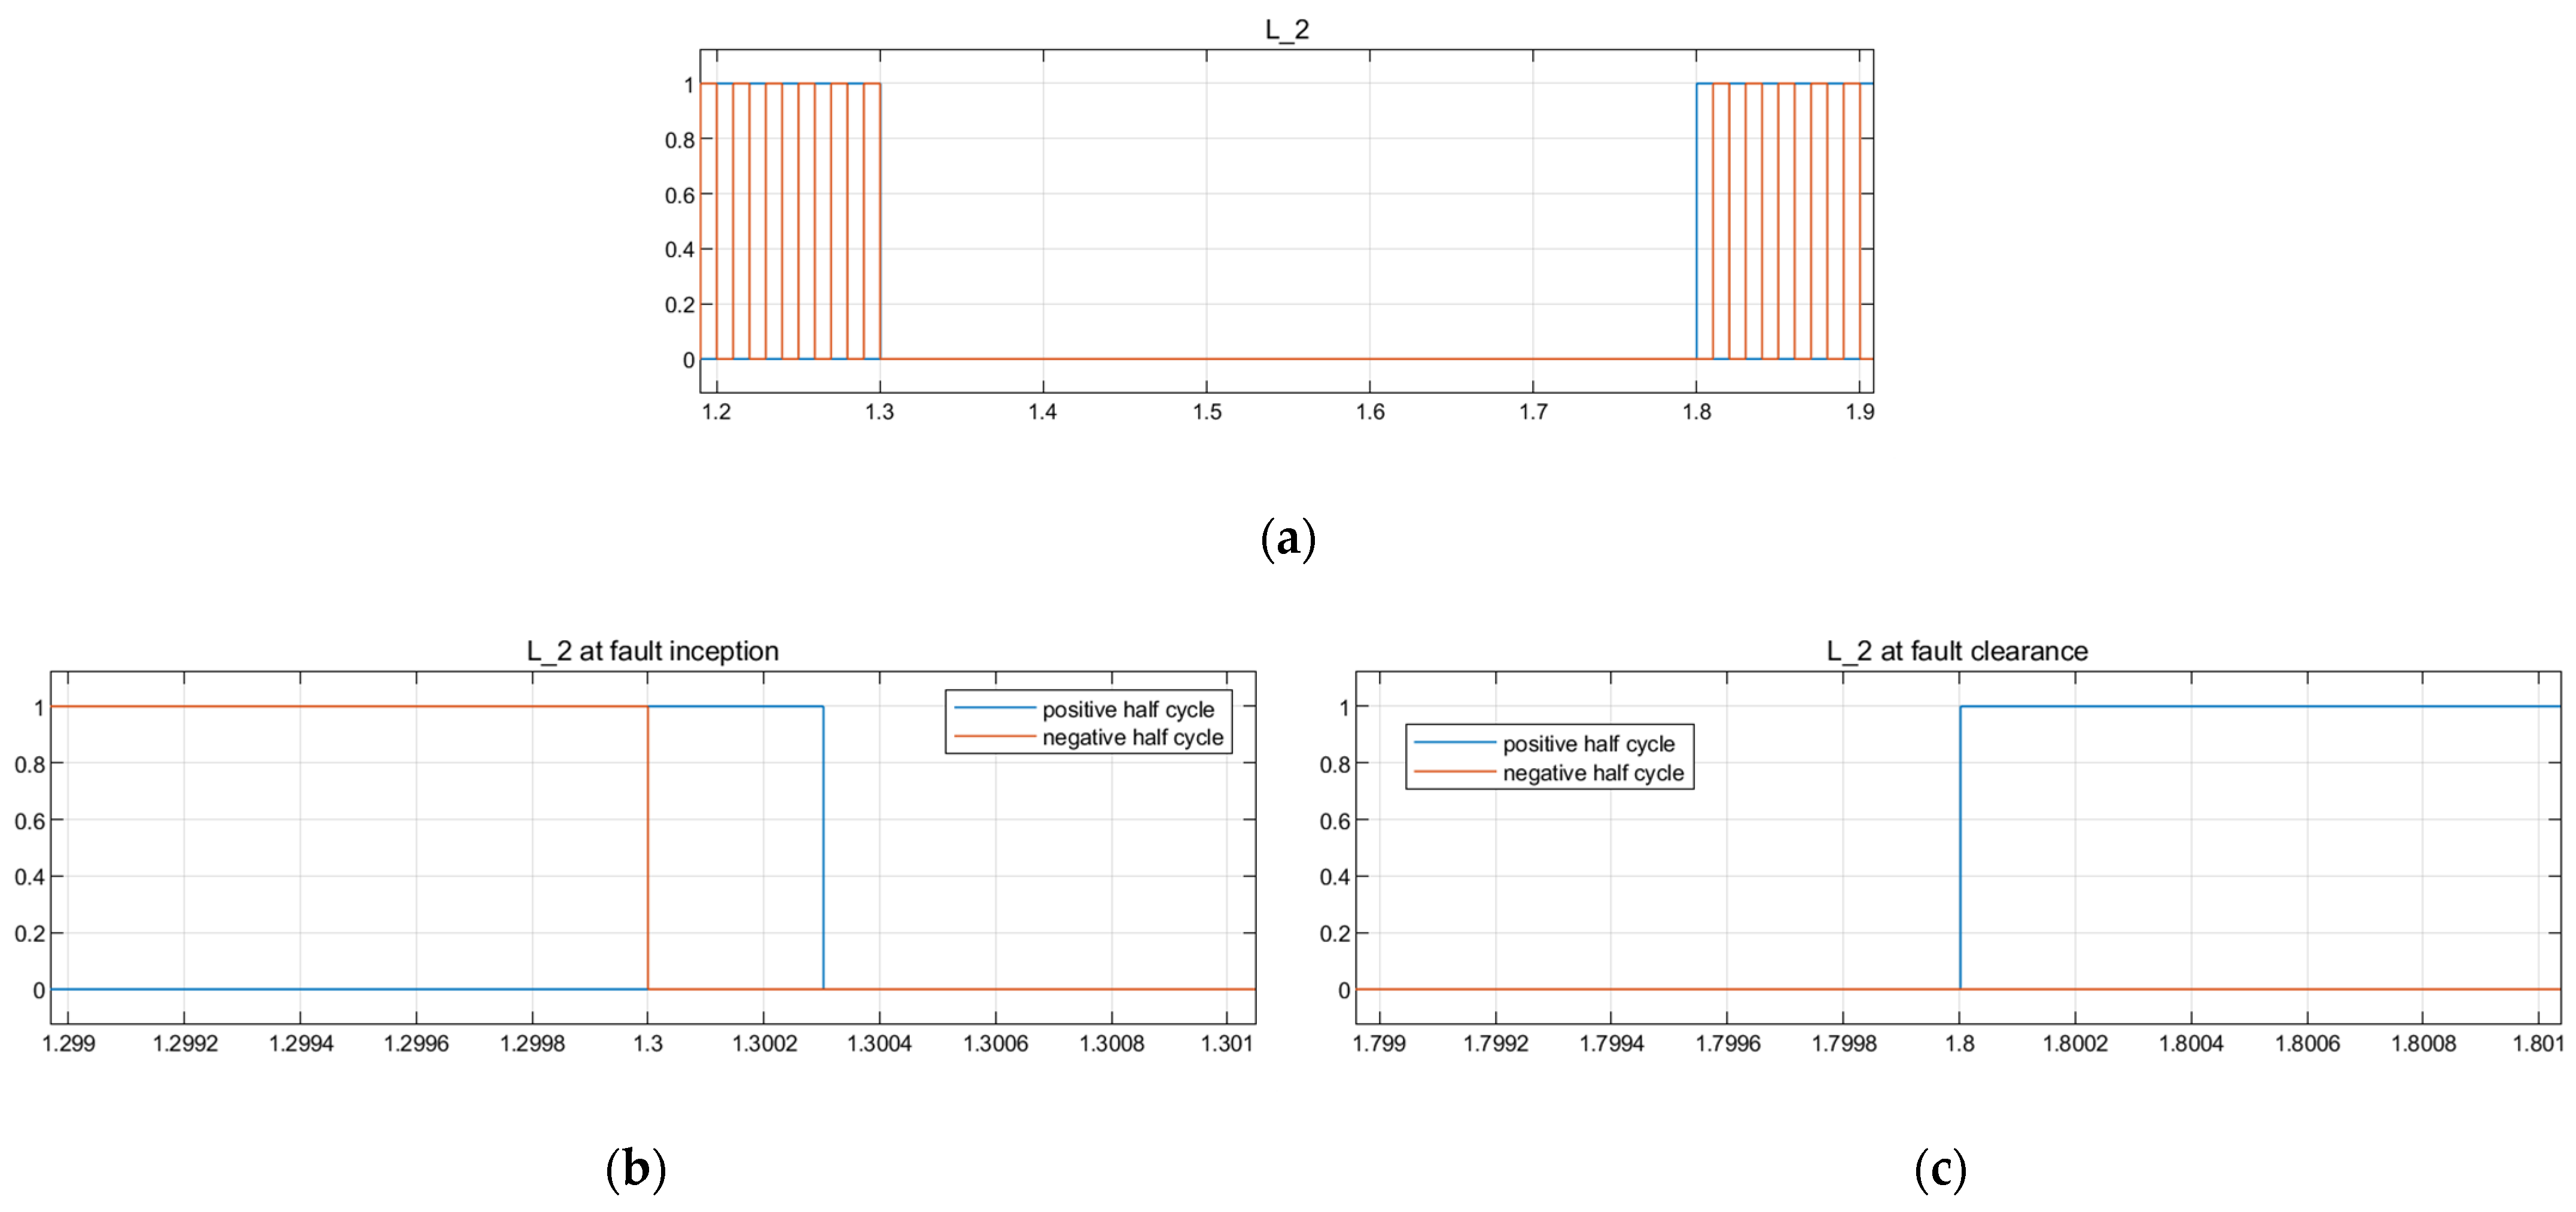
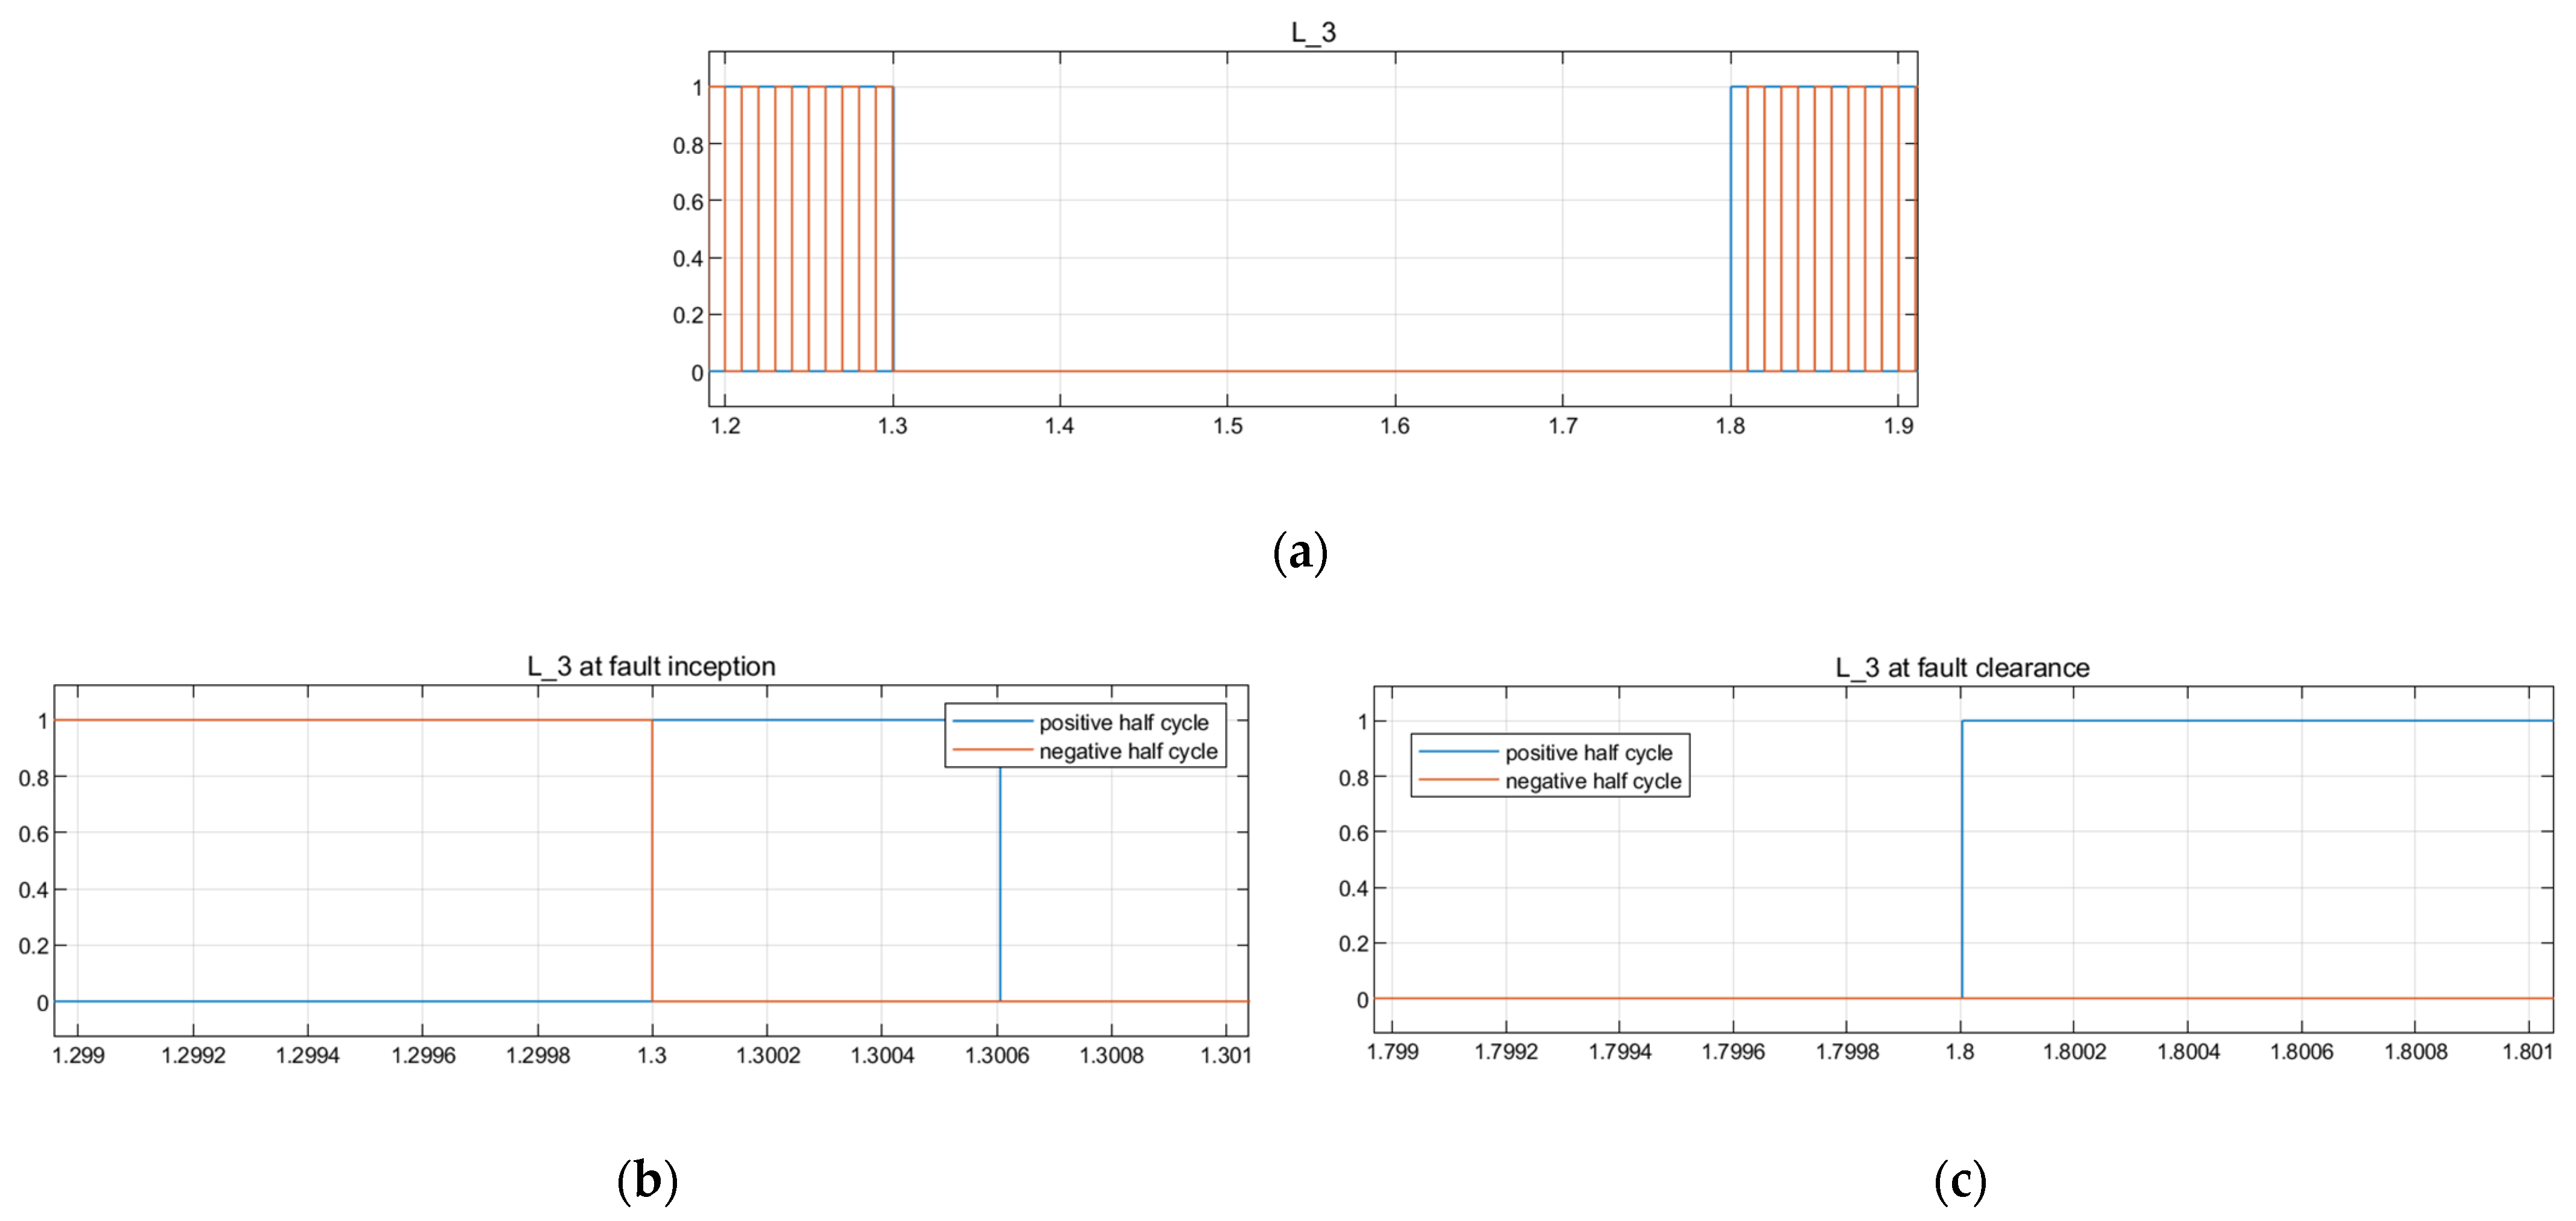
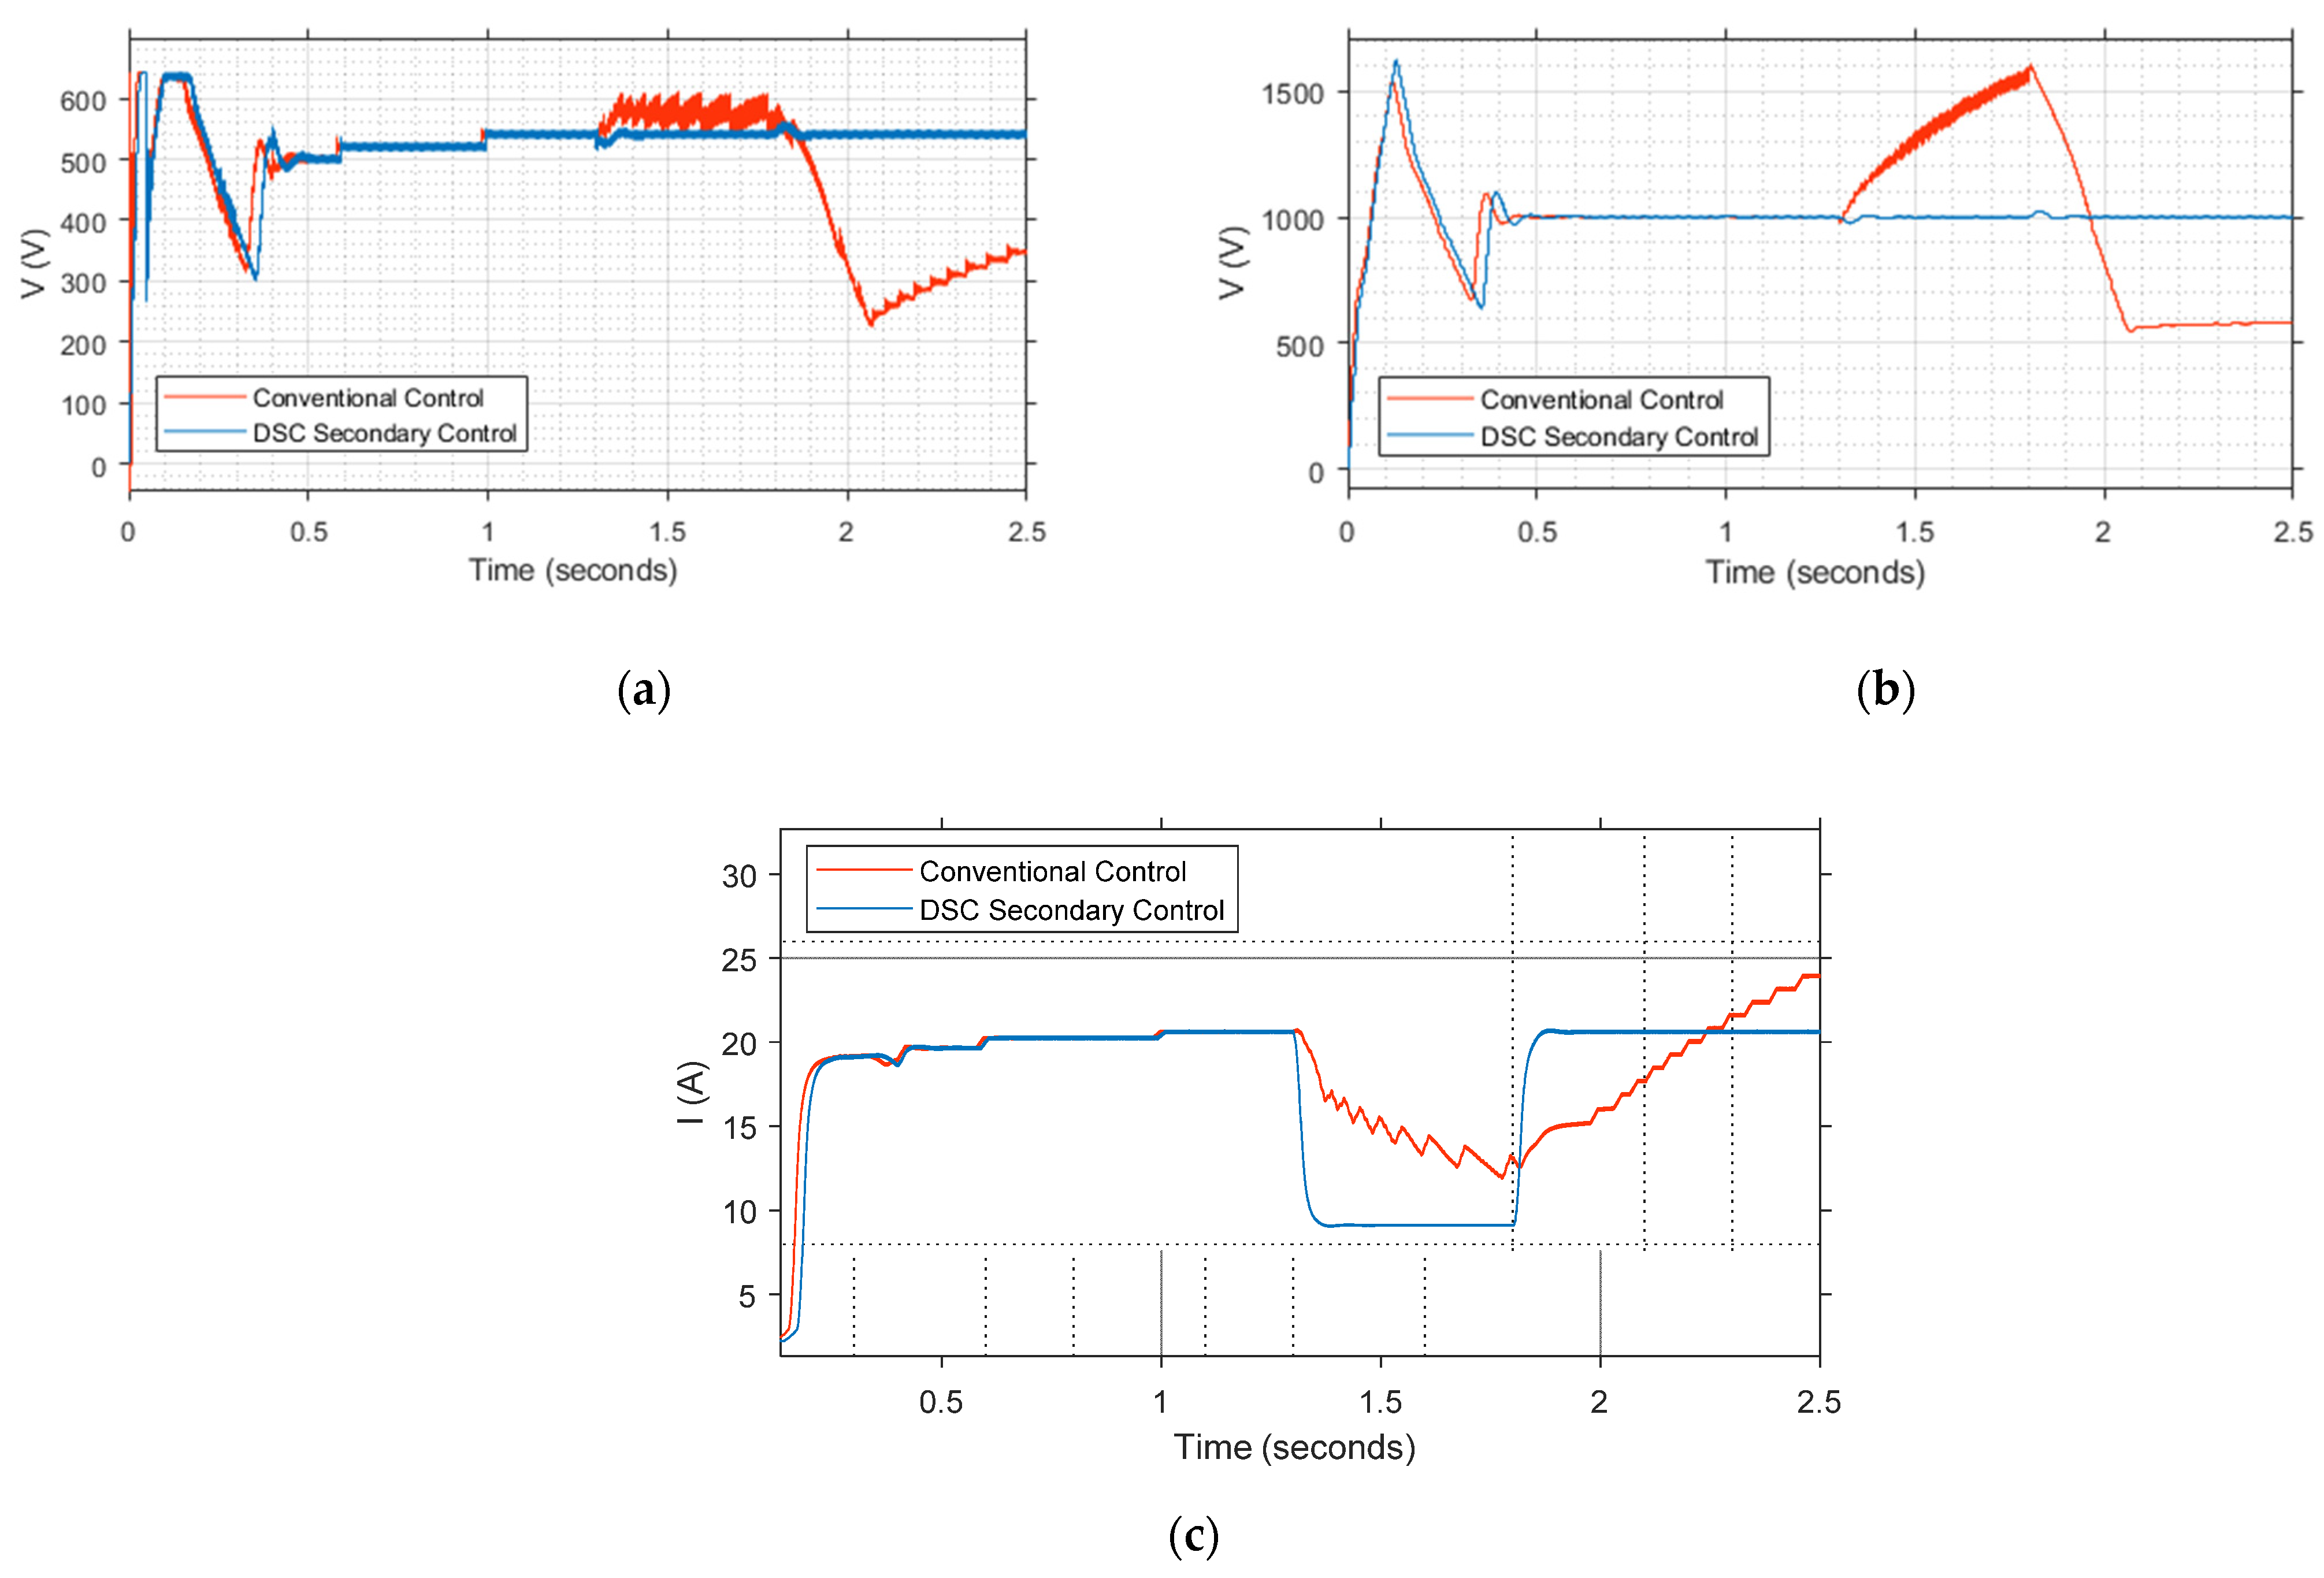
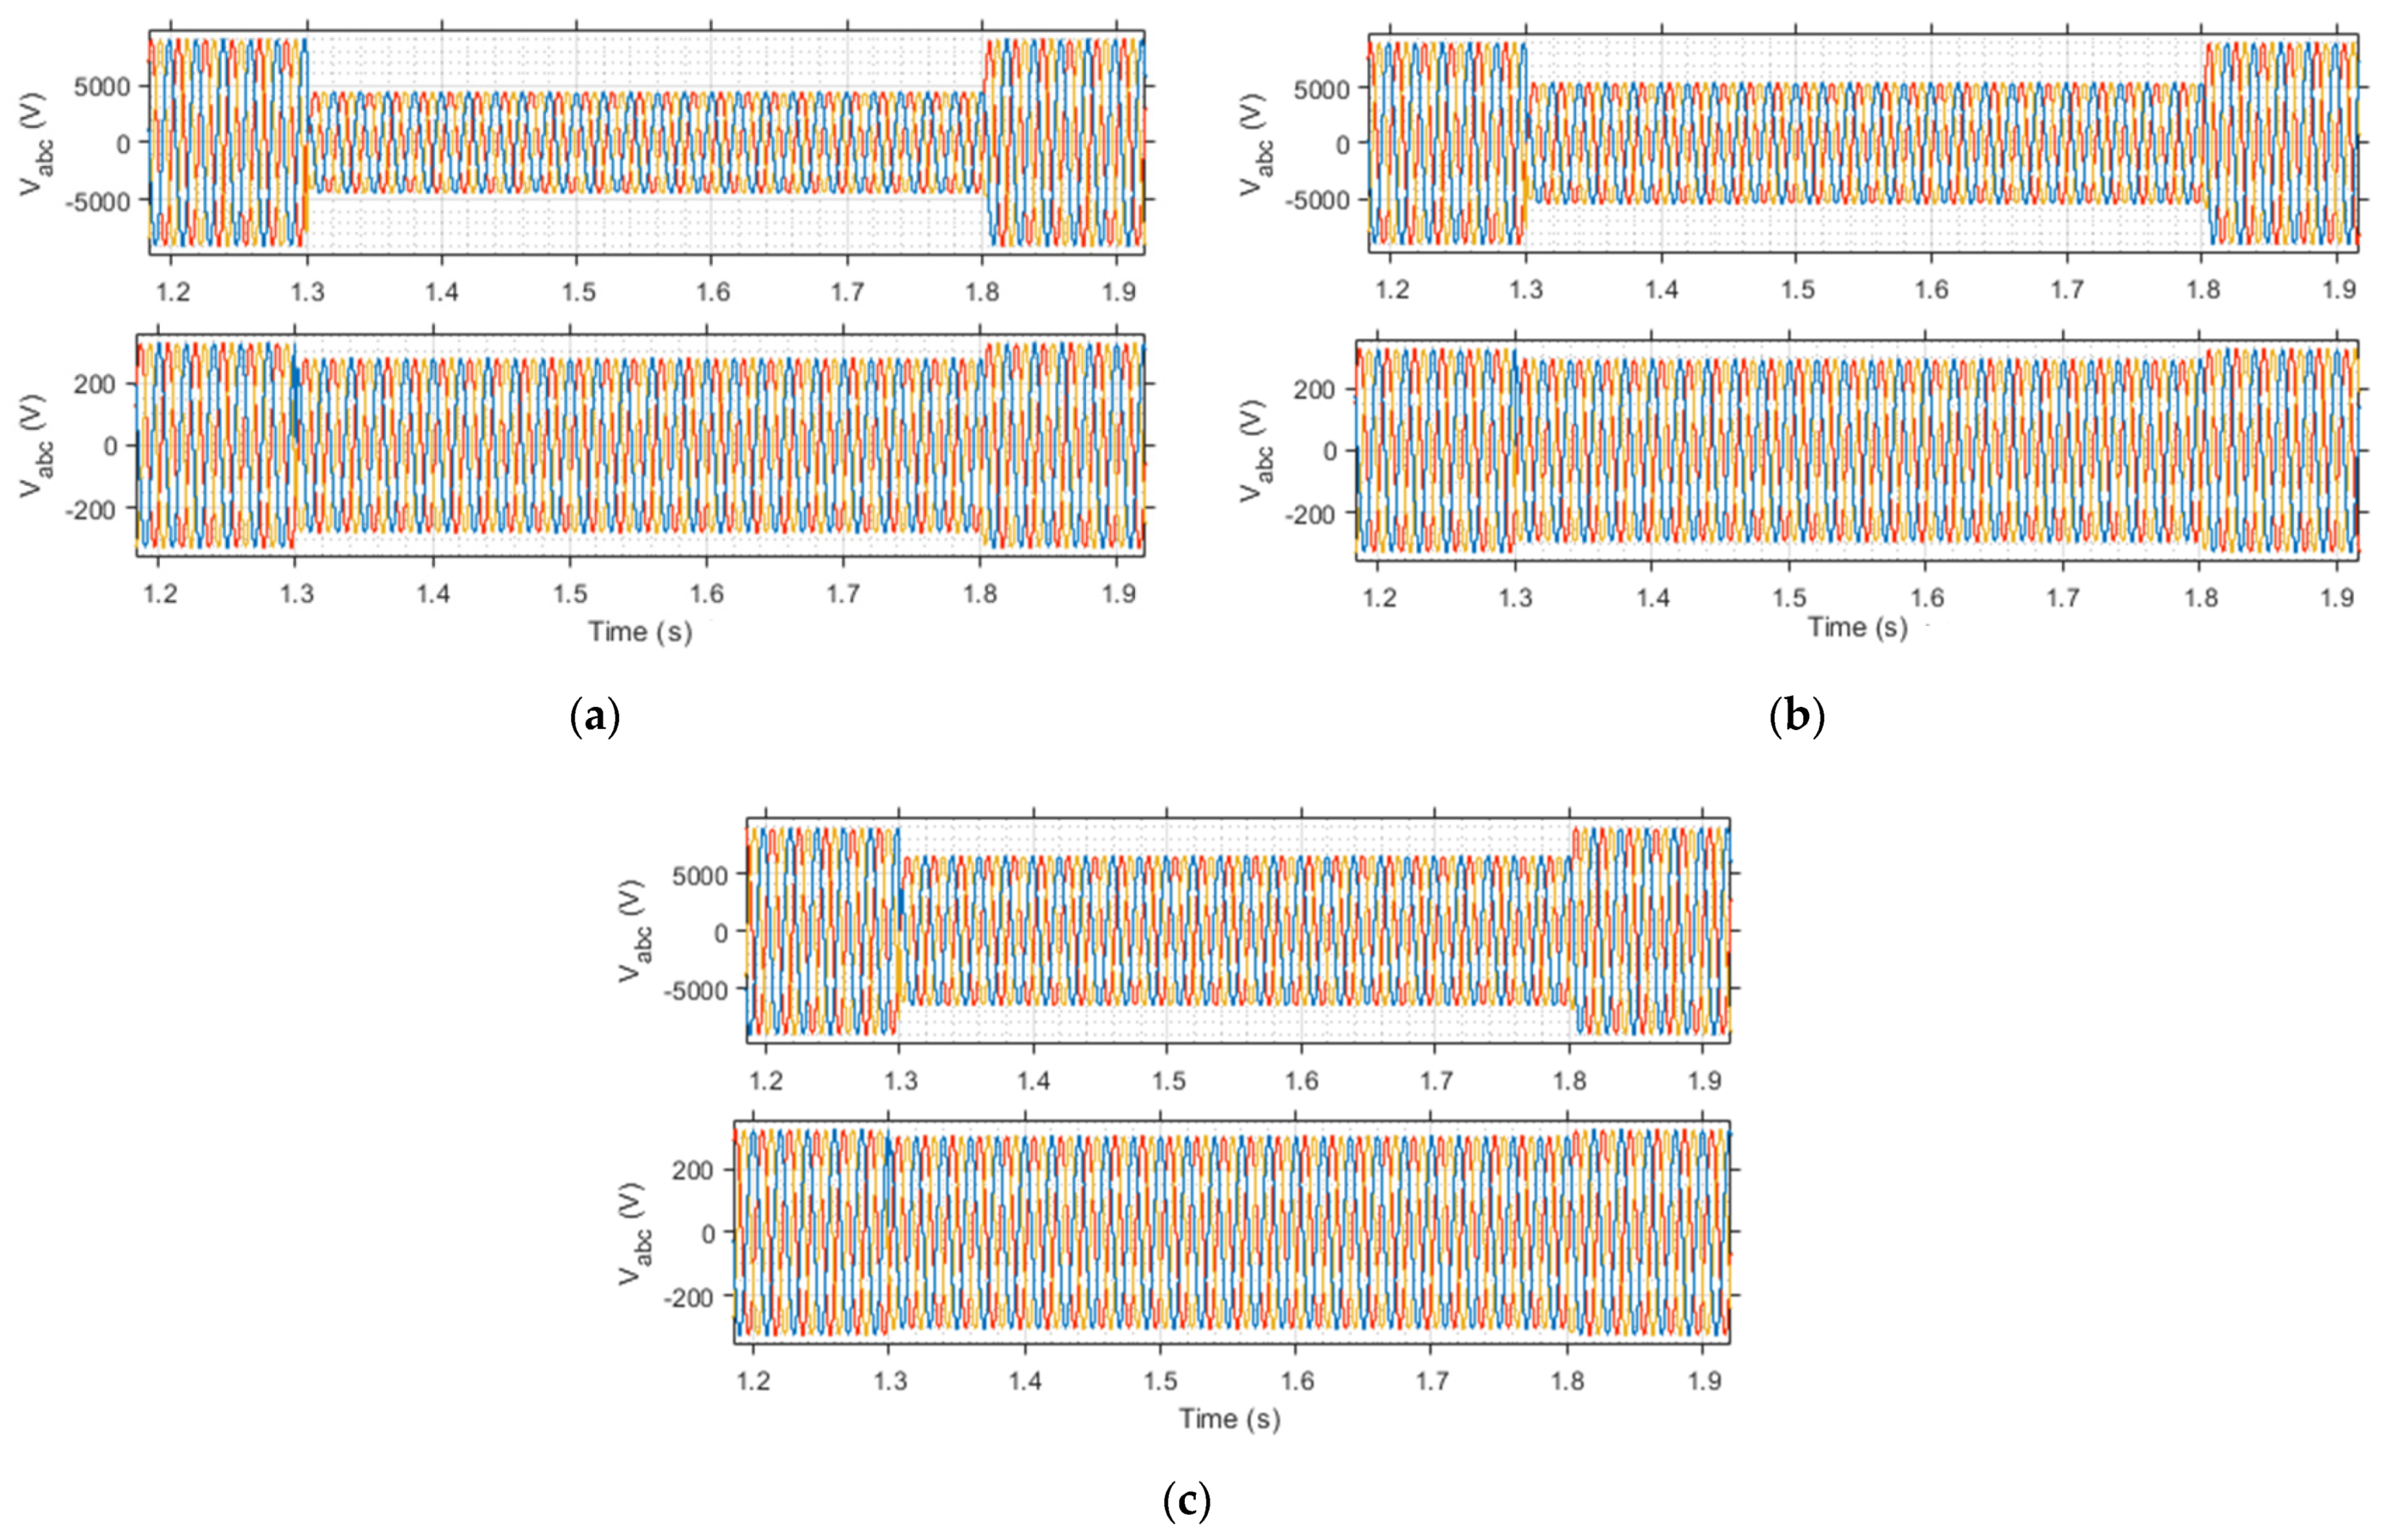
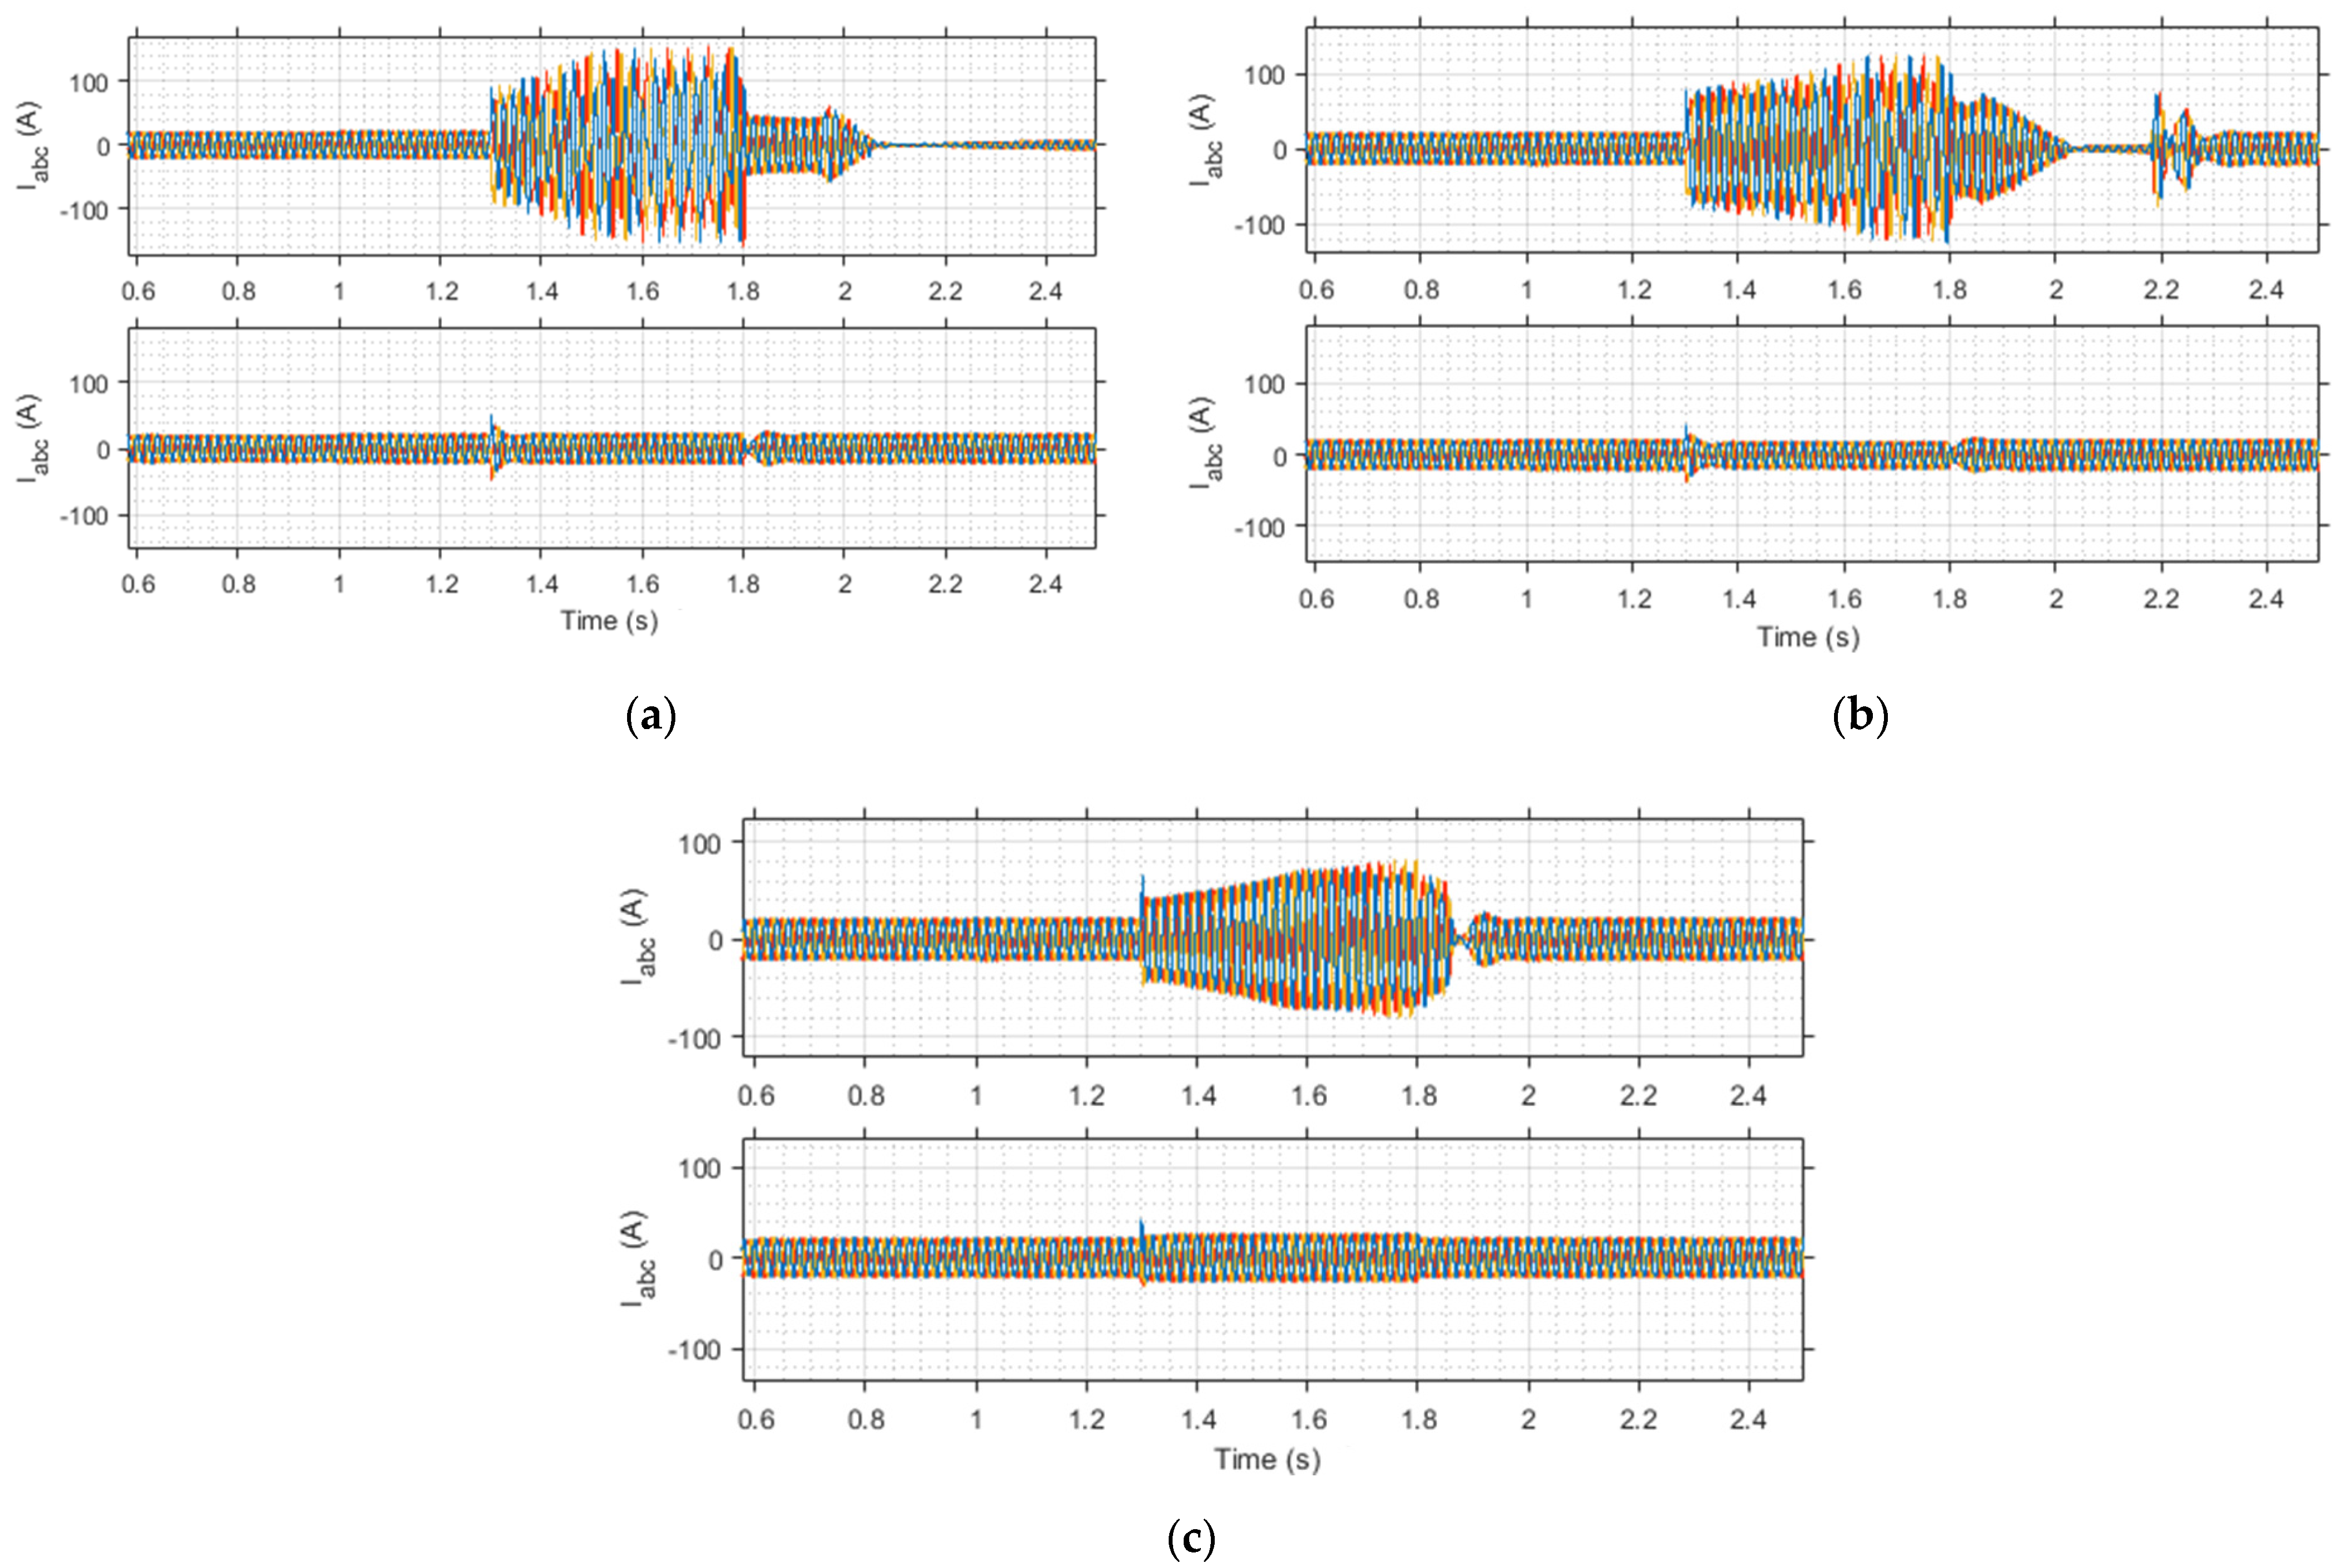
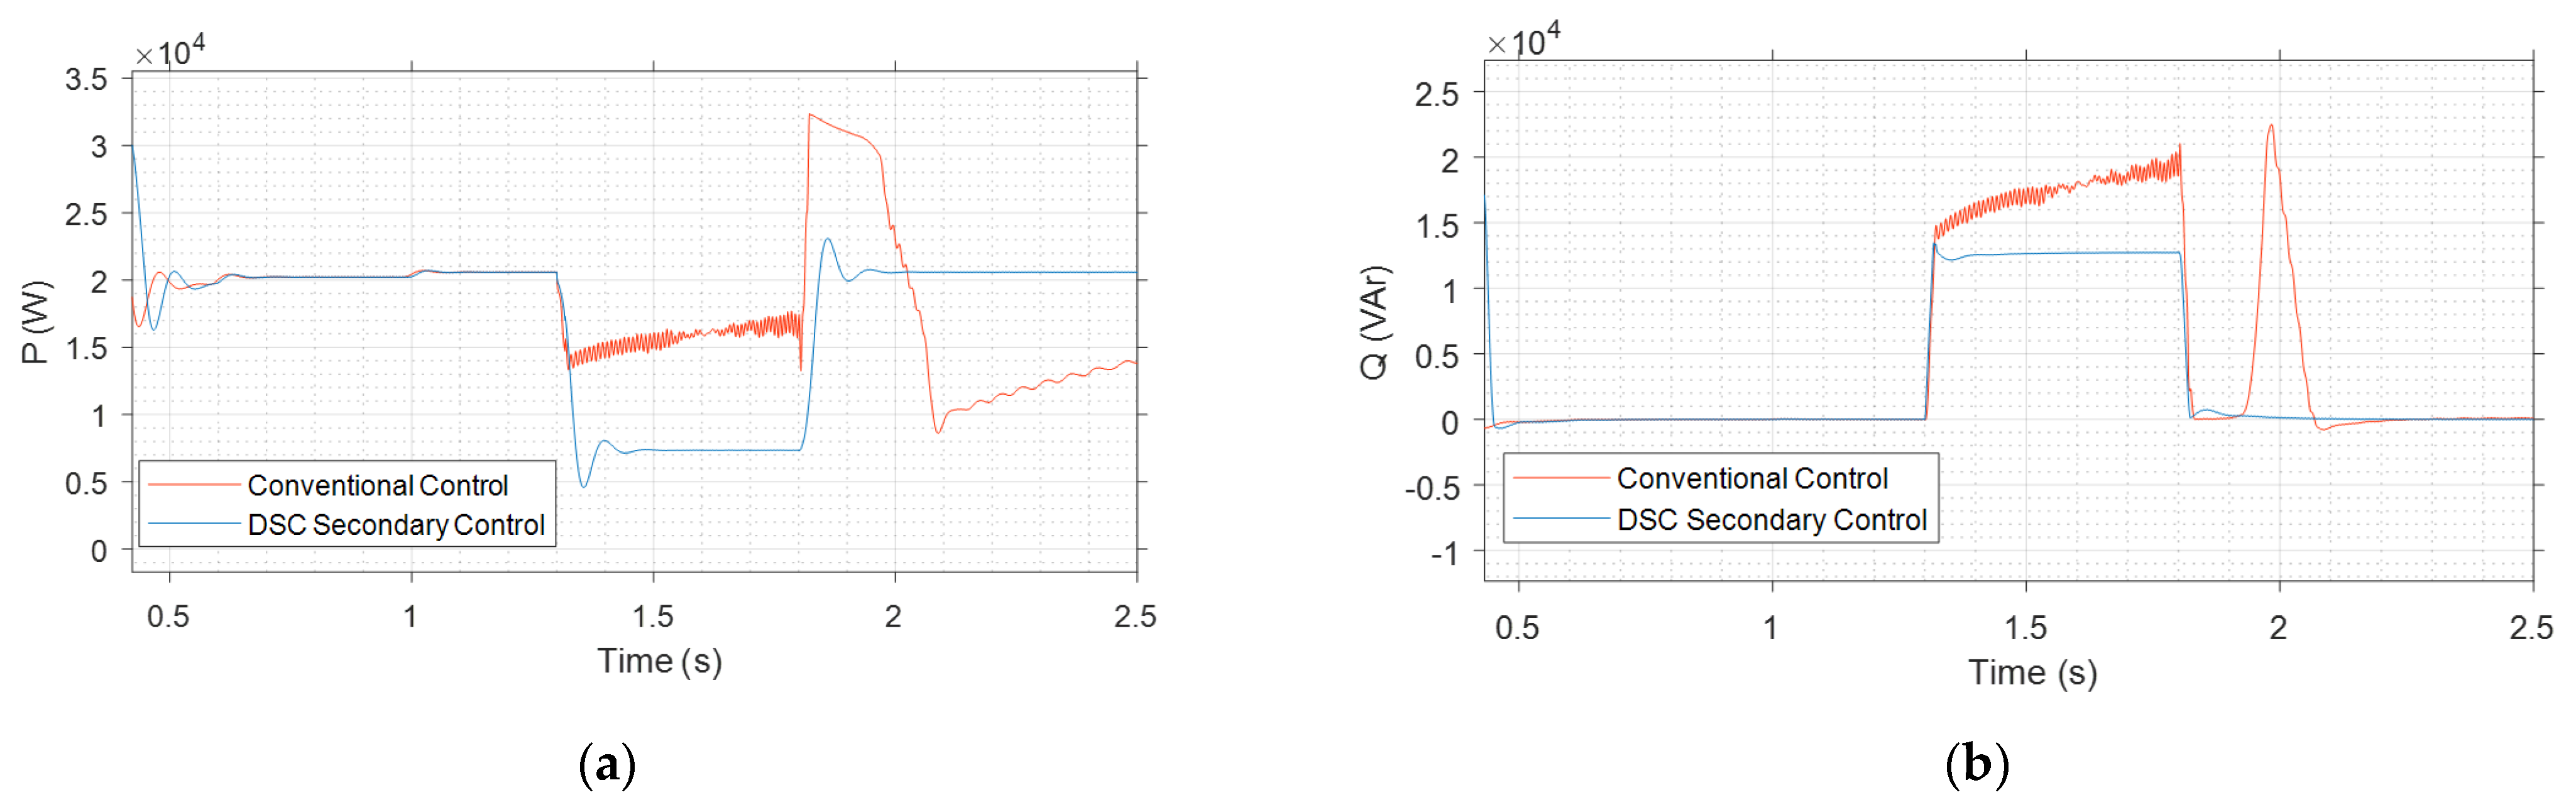
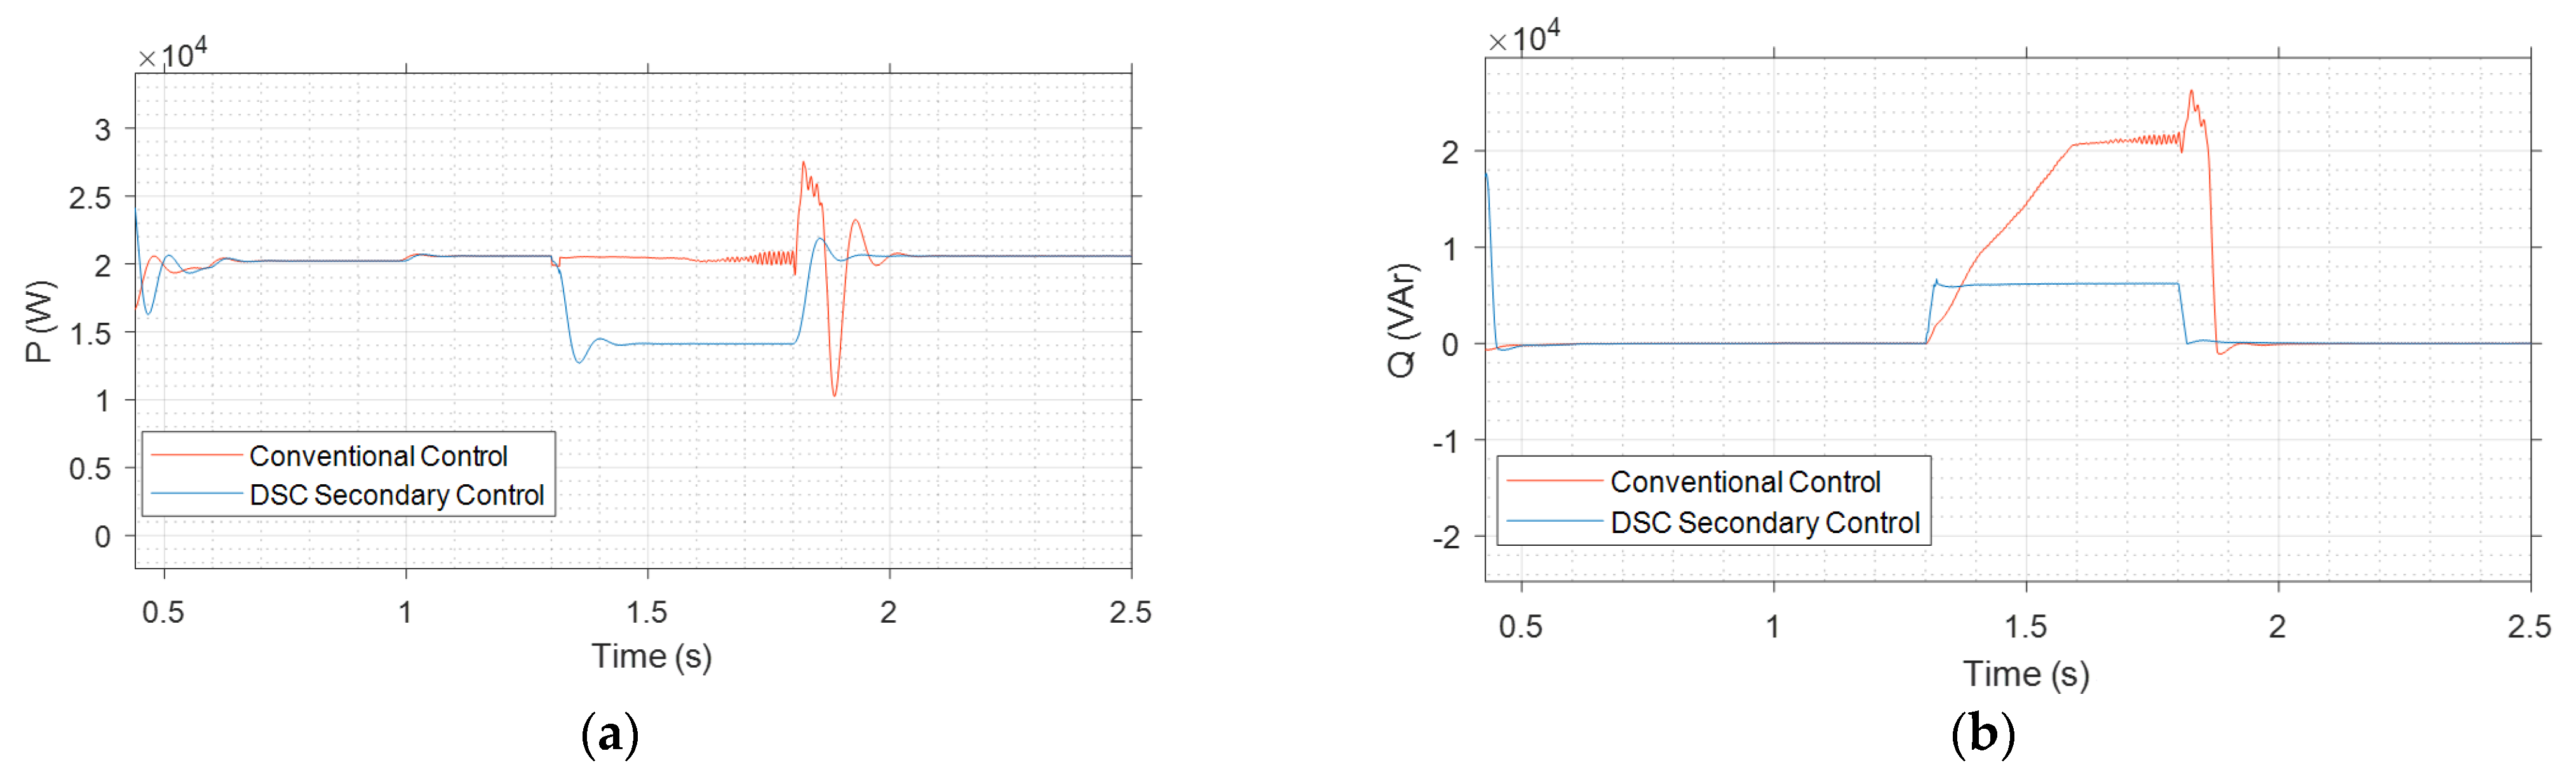
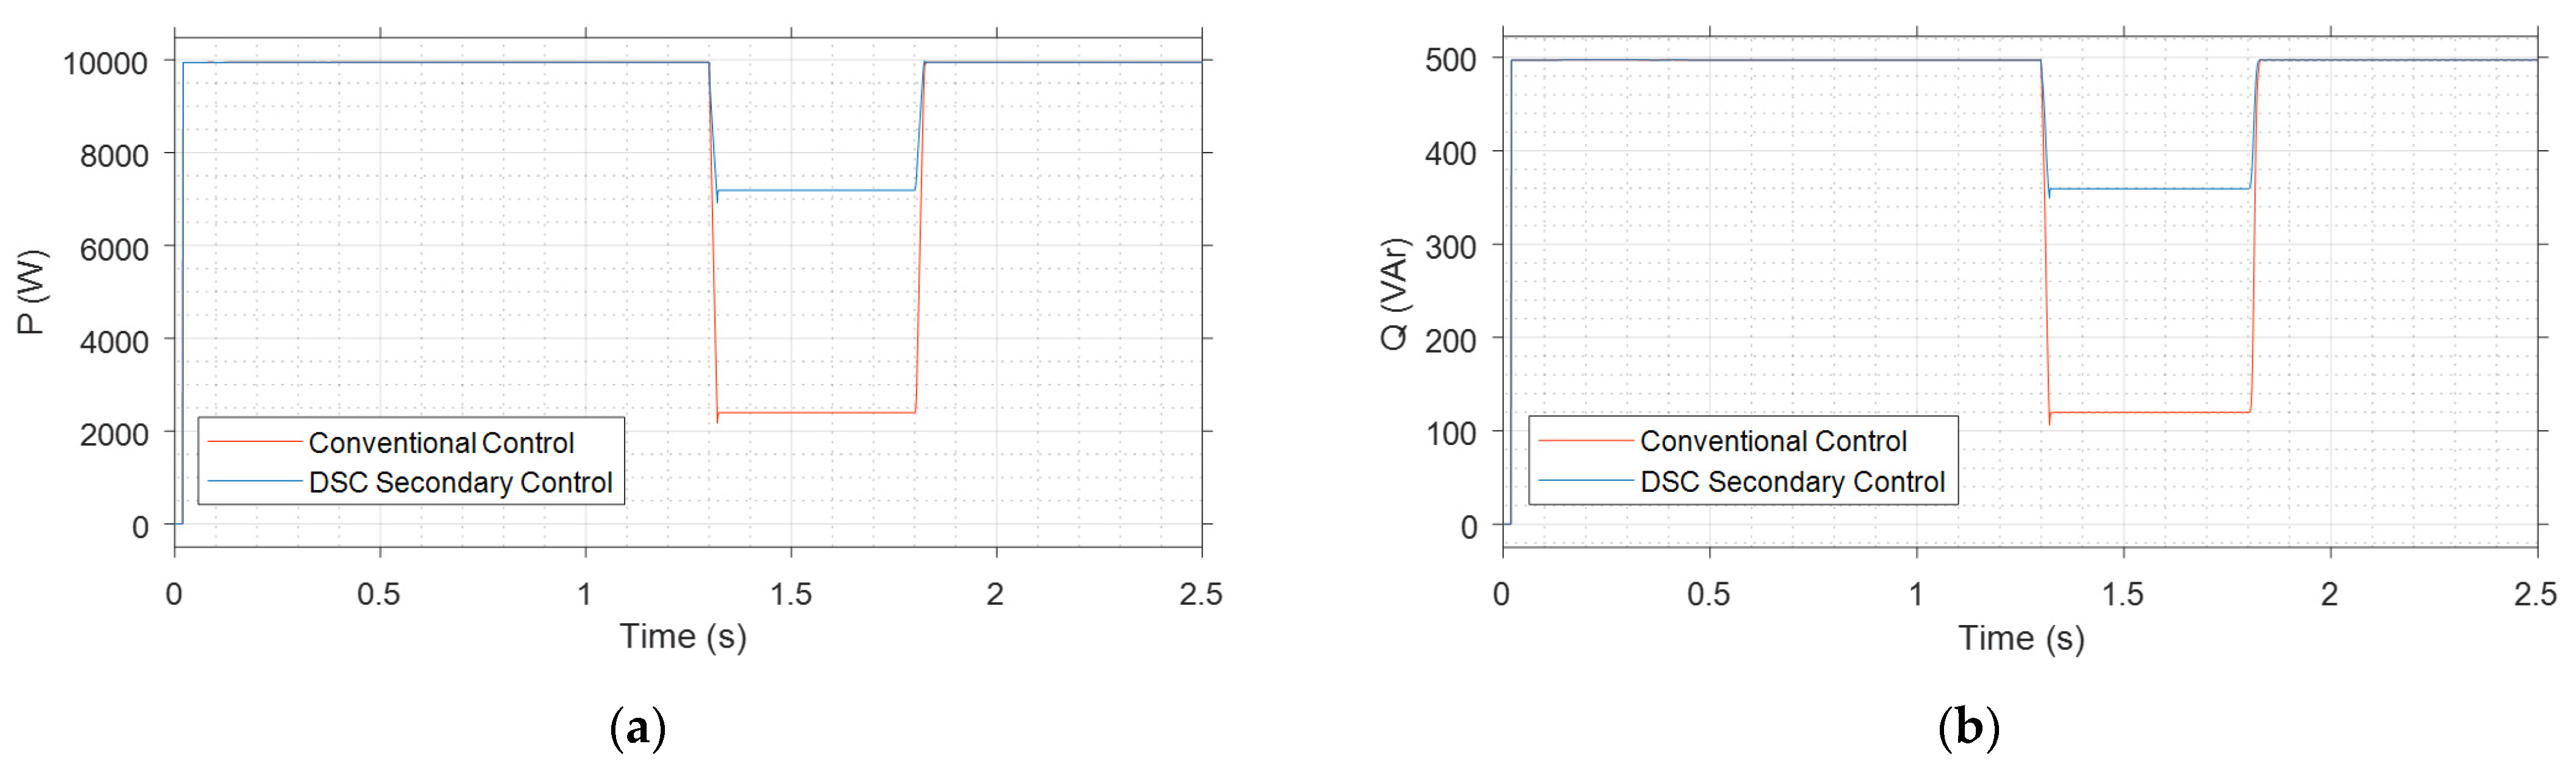
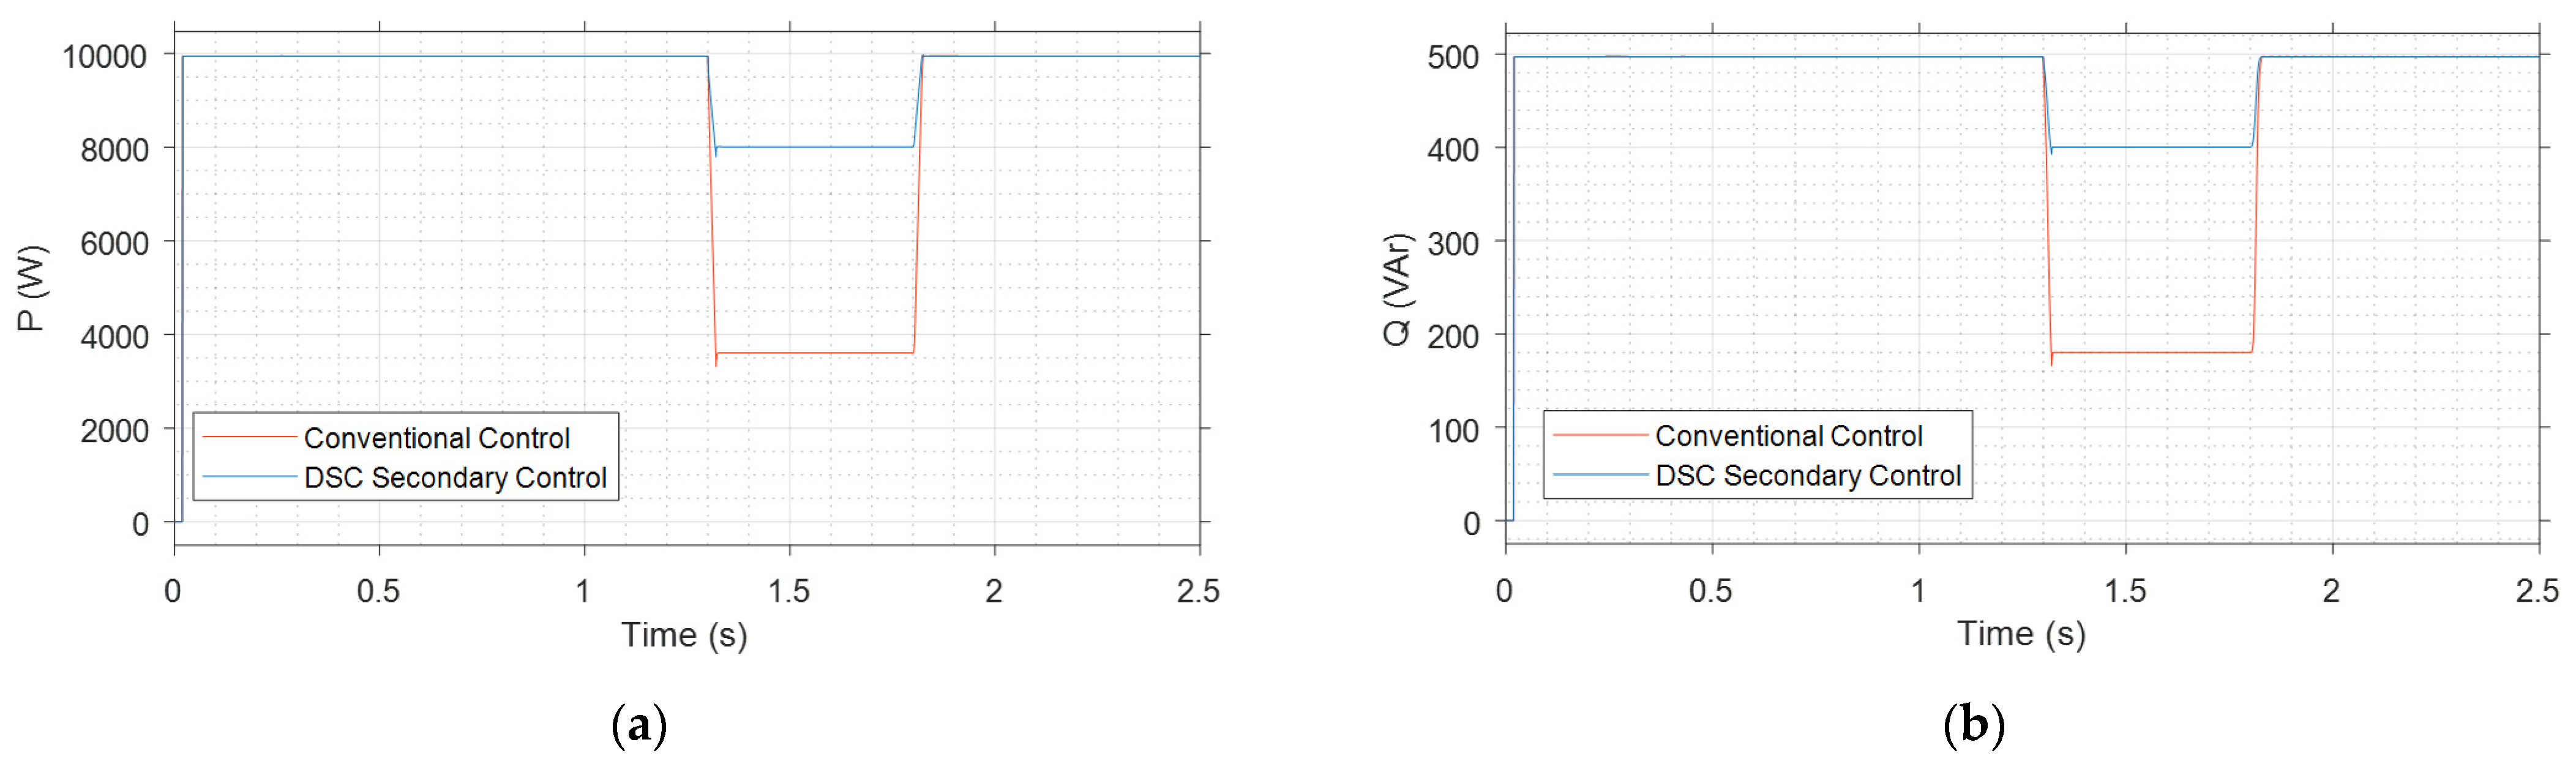
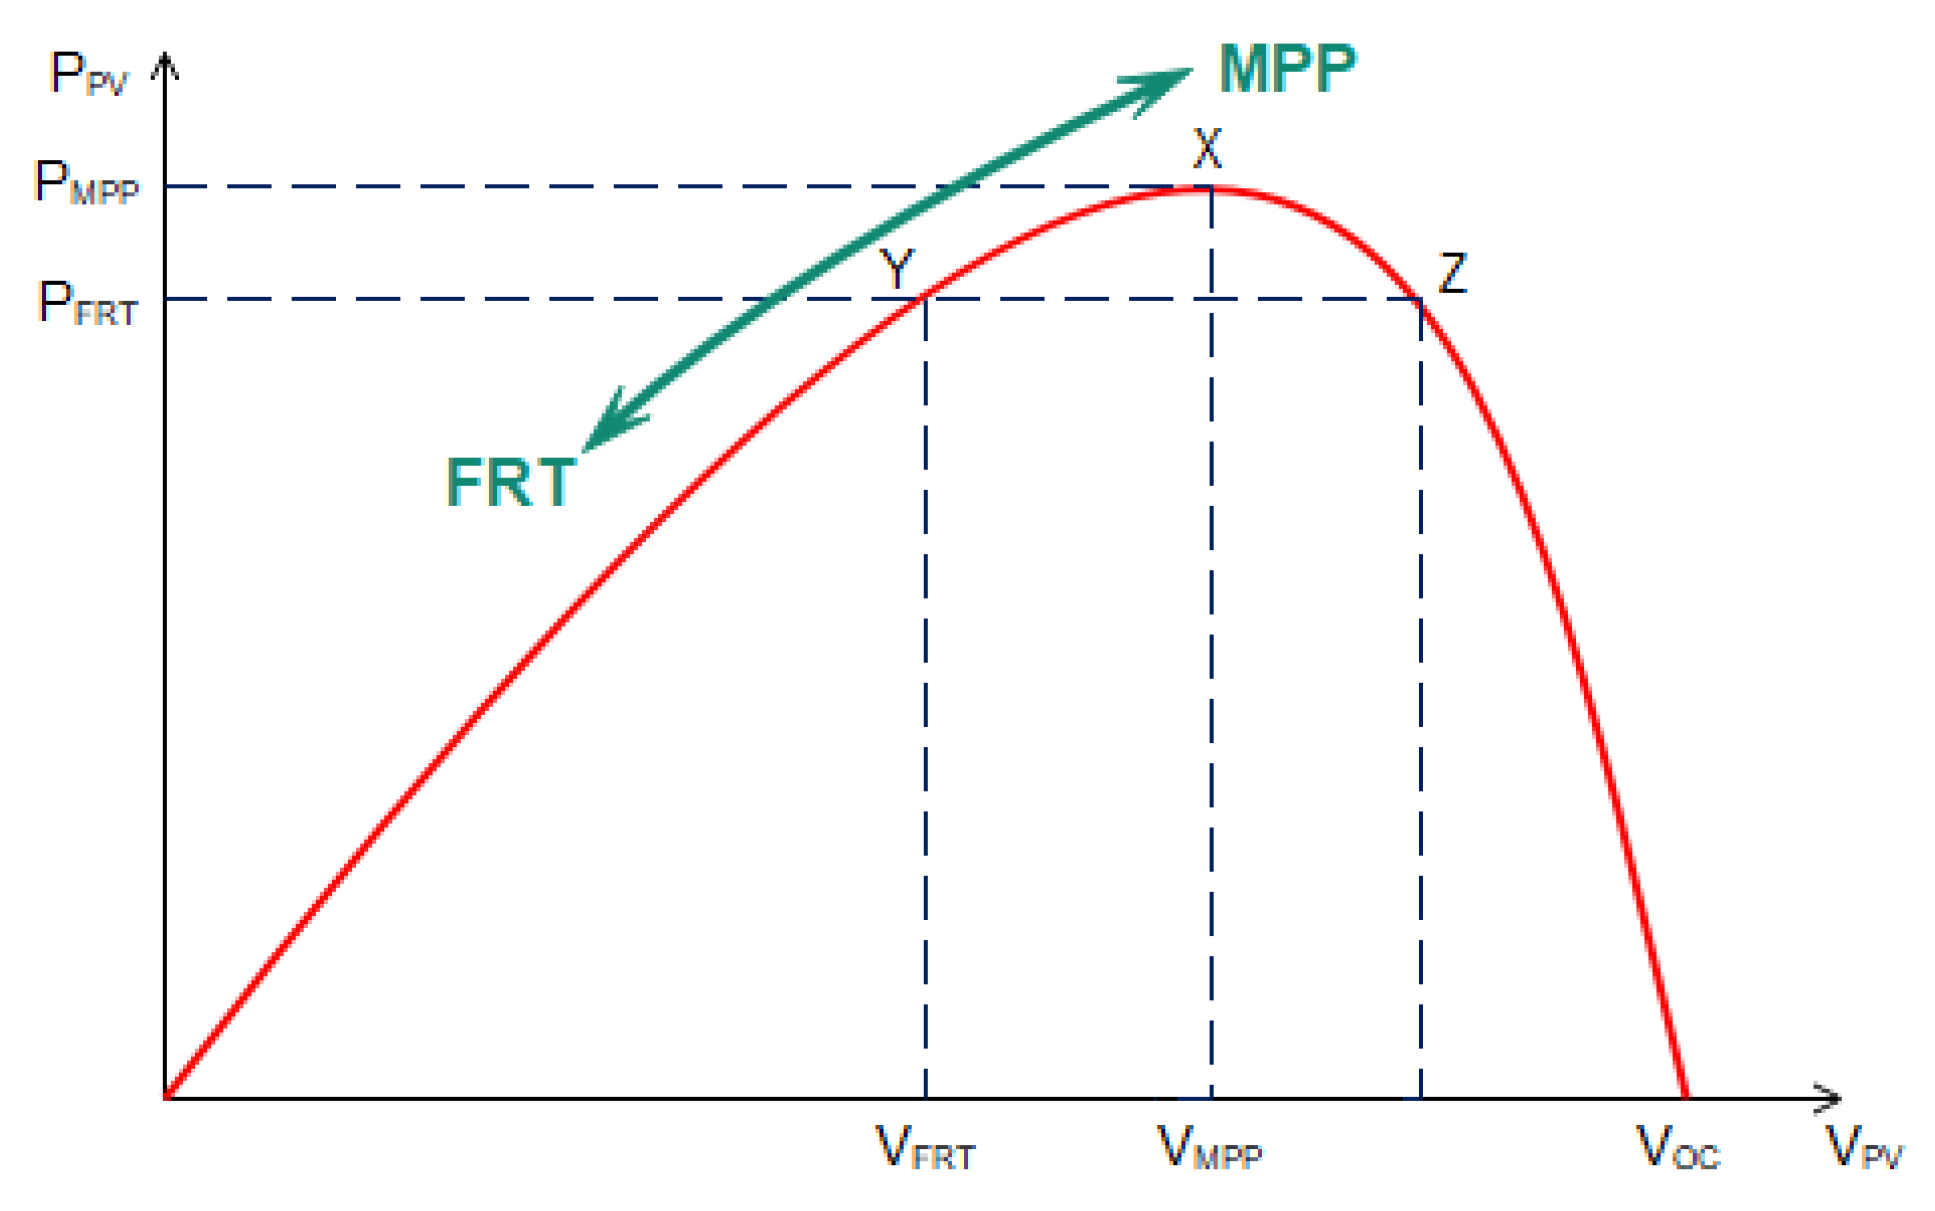
Table 1.
Sag Detection.
| Techniques | Detection Time of Fault Inception (S) | Detection Time of Fault Clearance (S) |
|---|---|---|
| DSC | 1.3001522 | 1.80015210 |
| FFT | 1.3167960 | 1.82308800 |
| PEAK | 1.3169960 | 1.82274000 |
| RMS | 1.3169840 | 1.82309200 |
| SRRF | 1.3012721 | 1.81606000 |
Table 2.
PV and DC-DC Converter Simulation Parameters.
| Parameters | Descriptions | Values |
|---|---|---|
| PMPP | PV system maximum power | 20 kW |
| Q* | PV reactive power reference | 0 kVAr |
| Ee | Maximum irradiance | 1000 W/m2 |
| Te | Temperature | 25 °C |
| V*dc | Reference DC link voltage | 1000 V |
| E | AC single phase voltage amplitude | 330 V |
| CDC | DC link capacitor | 2400 μF |
| CPV | PV side capacitor | 10 μF |
| L | DC link inductor | 5 mH |
| Cf | LC filter capacitance | 2.31 μF |
| Lf | LC filter inductance | 11 mH |
| Kp cl | proportional current control loop gain | 0.3 |
| Ki cl | integral current control loop gain | 20 |
| Kp dc | proportional DC link voltage loop gain | 7 |
| Ki dc | integral DC link voltage loop gain | 800 |
Table 3.
PV Inverter primary and secondary control parameters.
| Parameters | Descriptions | Values |
|---|---|---|
| ωcut | Cut-off angular frequency | 100π |
| E | Single-phase voltage reference | 330 V |
| Kp I | Direct-quadrature current loop p gain | 100 |
| Ki I | Direct-quadrature current loop I gain | 1000 |
| Kp VDC | Outer loop DC voltage p gain | 5 |
| Ki VDC | Outer loop DC voltage I gain | 800 |
| Kp PCC + - | Positive sequence and negative sequence p gain | 0.0125 |
| Ki PCC + - | Positive sequence and negative sequence I gain | 2 |
| fPWM | DC-AC inverter PWM switching frequency | 10 kHz |
Table 4.
PV Voltage under 50%, 60%, and 70% voltage sags.
| . | 50% Voltage Sag | 60% Voltage Sag | 70% Voltage Sag | |||
|---|---|---|---|---|---|---|
| Time (s) | Proposed Secondary Control | Proposed Secondary Control | Proposed Secondary Control | Conventional Control | Proposed Secondary Control | Conventional Control |
| 1.30 | 532.1 | 534.0 | 548.0 | 548.0 | 548.0 | 532.7 |
| 1.34 | 536.6 | 571.8 | 540.1 | 565.1 | 548.5 | 548.3 |
| 1.38 | 542.2 | 570.5 | 536.9 | 556.8 | 548.0 | 548.2 |
| 1.42 | 534.0 | 576.4 | 538.6 | 575.7 | 536.6 | 536.4 |
| 1.46 | 547.5 | 601.7 | 547.6 | 584.9 | 548.0 | 548.1 |
| 1.50 | 536.2 | 581.4 | 534.1 | 572.1 | 548.0 | 548.3 |
| 1.54 | 537.6 | 567.4 | 537.6 | 566.9 | 537.5 | 537.7 |
| 1.58 | 545.6 | 607.2 | 545.7 | 588.9 | 548.0 | 548.2 |
| 1.62 | 533.1 | 553.7 | 532.9 | 552.5 | 532.8 | 536.4 |
| 1.66 | 542.8 | 587.5 | 532.8 | 547.3 | 548.0 | 555.3 |
| 1.70 | 534.4 | 566.6 | 547.7 | 554.0 | 543.8 | 551.4 |
| 1.74 | 534.2 | 570.5 | 532.8 | 533.2 | 548.0 | 538.6 |
| 1.78 | 547.3 | 577.1 | 532.8 | 551.9 | 547.6 | 555.2 |
| 1.82 | 553.5 | 553.2 | 541.4 | 538.4 | 548.0 | 544.8 |
| 1.86 | 534.0 | 537.0 | 547.9 | 518.0 | 534.5 | 486.7 |
| 1.90 | 547.8 | 495.7 | 532.6 | 442.0 | 548.0 | 545.4 |
| 1.94 | 536.6 | 415.2 | 548.1 | 392.4 | 548.0 | 545.5 |
| 1.98 | 540.1 | 361.7 | 547.9 | 343.1 | 537.4 | 538.3 |
| 2.02 | 546.2 | 296.8 | 533.7 | 283.1 | 548.0 | 548.1 |
| 2.06 | 532.9 | 233.7 | 547.9 | 307.5 | 548.0 | 548.0 |
| 2.10 | 543.8 | 251.7 | 548.0 | 300.4 | 547.9 | 548.0 |
| 2.14 | 546.1 | 276.1 | 545.4 | 312.2 | 543.9 | 543.9 |
| 2.18 | 532.9 | 268.7 | 547.9 | 324.4 | 533.0 | 533.0 |
| 2.22 | 543.8 | 288.0 | 548.0 | 586.7 | 546.1 | 546.2 |
| 2.26 | 540.2 | 297.9 | 536.4 | 517.4 | 543.0 | 543.0 |
| 2.30 | 533.2 | 307.9 | 546.9 | 514.8 | 534.6 | 534.5 |
Table 5.
DC Link Voltage under 50%, 60%, and 70% voltage sags.
| 50% Voltage Sag | 60% Voltage Sag | 70% Voltage Sag | ||||
|---|---|---|---|---|---|---|
| Time (s) | Proposed Secondary Control | Proposed Secondary Control | Proposed Secondary Control | Conventional Control | Proposed Secondary Control | Conventional Control |
| 1.30 | 998.8 | 998.8 | 1000.5 | 1000.5 | 1000.4 | 1000.5 |
| 1.34 | 985.4 | 985.4 | 985.5 | 1039.4 | 999.9 | 1001.0 |
| 1.38 | 1005.2 | 1005.2 | 1004.3 | 1086.3 | 1000.4 | 1000.0 |
| 1.42 | 998.3 | 998.3 | 999.2 | 1107.5 | 1000.5 | 999.8 |
| 1.46 | 1000.1 | 1000.1 | 999.9 | 1130.4 | 1000.6 | 1000.3 |
| 1.50 | 1000.0 | 1000.0 | 1000.2 | 1168.6 | 999.6 | 1000.9 |
| 1.54 | 1000.1 | 1000.1 | 1000.0 | 1186.8 | 1000.6 | 999.1 |
| 1.58 | 999.7 | 999.7 | 999.7 | 1217.9 | 1000.5 | 999.9 |
| 1.62 | 1000.1 | 1000.1 | 1000.4 | 1193.1 | 1000.6 | 1005.5 |
| 1.66 | 999.8 | 999.8 | 999.7 | 1241.3 | 999.6 | 1013.6 |
| 1.70 | 999.9 | 999.9 | 1000.3 | 1225.5 | 999.6 | 1017.7 |
| 1.74 | 1000.2 | 1000.2 | 1000.3 | 1281.0 | 999.5 | 1025.7 |
| 1.78 | 999.9 | 999.9 | 1000.3 | 1279.5 | 1000.6 | 1012.6 |
| 1.82 | 1021.6 | 1021.6 | 1013.7 | 1254.5 | 1000.2 | 989.6 |
| 1.86 | 998.9 | 998.9 | 1001.0 | 1115.9 | 1000.5 | 904.1 |
| 1.90 | 999.0 | 999.0 | 999.6 | 977.0 | 1000.5 | 1024.7 |
| 1.94 | 1000.5 | 1000.5 | 1000.0 | 853.8 | 1000.5 | 996.4 |
| 1.98 | 999.9 | 999.9 | 1000.5 | 709.3 | 1000.4 | 1001.4 |
| 2.02 | 999.9 | 999.9 | 1000.5 | 566.5 | 1000.5 | 1000.6 |
| 2.06 | 1000.4 | 1000.4 | 999.6 | 568.9 | 999.5 | 999.7 |
| 2.10 | 1000.0 | 1000.0 | 1000.6 | 569.9 | 1000.5 | 999.8 |
| 2.14 | 1000.0 | 1000.0 | 1000.5 | 572.6 | 1000.6 | 1000.6 |
| 2.18 | 1000.1 | 1000.1 | 999.5 | 576.4 | 1000.5 | 1000.5 |
| 2.22 | 999.7 | 999.7 | 1000.5 | 1100.2 | 999.5 | 1000.5 |
| 2.26 | 1000.2 | 1000.2 | 1000.5 | 982.1 | 1000.4 | 1000.4 |
| 2.30 | 1000.1 | 1000.1 | 1000.5 | 1002.3 | 1000.5 | 1000.5 |
Table 6.
Average DC Current under 50%, 60%, and 70% voltage sags.
| 50% Voltage Sag | 60% Voltage Sag | 70% Voltage Sag | ||||
|---|---|---|---|---|---|---|
| Time (s) | Proposed Secondary Control | Proposed Secondary Control | Proposed Secondary Control | Conventional Control | Proposed Secondary Control | Conventional Control |
| 1.30 | 20.7 | 20.7 | 20.7 | 20.7 | 20.7 | 20.7 |
| 1.34 | 9.8 | 9.8 | 13.3 | 20.1 | 20.6 | 20.7 |
| 1.38 | 9.1 | 9.1 | 12.7 | 19.3 | 20.5 | 20.5 |
| 1.42 | 9.2 | 9.2 | 12.7 | 17.6 | 20.7 | 20.7 |
| 1.46 | 9.2 | 9.2 | 12.7 | 17.8 | 20.5 | 20.5 |
| 1.50 | 9.2 | 9.2 | 12.6 | 16.6 | 20.7 | 20.7 |
| 1.54 | 9.2 | 9.2 | 12.7 | 17.2 | 20.7 | 20.7 |
| 1.58 | 9.2 | 9.2 | 12.7 | 16.3 | 20.7 | 20.7 |
| 1.62 | 9.2 | 9.2 | 12.6 | 16.5 | 20.7 | 20.6 |
| 1.66 | 9.1 | 9.1 | 12.7 | 16.4 | 20.7 | 20.5 |
| 1.70 | 9.1 | 9.1 | 12.7 | 15.8 | 20.7 | 20.4 |
| 1.74 | 9.1 | 9.1 | 12.6 | 15.3 | 20.7 | 20.3 |
| 1.78 | 9.1 | 9.1 | 12.7 | 16.1 | 20.7 | 20.3 |
| 1.82 | 14.5 | 14.5 | 17.1 | 16.0 | 20.7 | 20.5 |
| 1.86 | 20.3 | 20.3 | 20.4 | 17.8 | 20.7 | 21.3 |
| 1.90 | 20.7 | 20.7 | 20.7 | 18.3 | 20.7 | 20.4 |
| 1.94 | 20.5 | 20.5 | 20.6 | 18.2 | 20.7 | 20.7 |
| 1.98 | 20.7 | 20.7 | 20.7 | 19.2 | 20.7 | 20.7 |
| 2.02 | 20.6 | 20.6 | 20.7 | 19.7 | 20.7 | 20.7 |
| 2.06 | 20.5 | 20.5 | 20.7 | 20.3 | 20.7 | 20.7 |
| 2.10 | 20.7 | 20.7 | 20.7 | 20.9 | 20.7 | 20.7 |
| 2.14 | 20.7 | 20.7 | 20.7 | 21.7 | 20.7 | 20.7 |
| 2.18 | 20.5 | 20.5 | 20.7 | 22.5 | 20.7 | 20.7 |
| 2.22 | 20.6 | 20.6 | 20.7 | 18.8 | 20.7 | 20.7 |
| 2.26 | 20.5 | 20.5 | 20.7 | 20.4 | 20.7 | 20.7 |
| 2.30 | 20.7 | 20.7 | 20.7 | 20.3 | 20.7 | 20.7 |
Table 7.
Average (THD) of voltage and current waveforms of the DERs.
| Voltage Sag | Signal | Total Harmonic Distortion (%) | ||||||||
|---|---|---|---|---|---|---|---|---|---|---|
| Pre-Fault | Fault | Post-Fault | ||||||||
| L1 | L2 | L3 | L1 | L2 | L3 | L1 | L2 | L3 | ||
| 50% | Voltage | 0.329 | 0.321 | 0.327 | 1.165 | 1.160 | 1.169 | 0.327 | 0.322 | 0.325 |
| Current | 2.007 | 2.001 | 2.009 | 2.149 | 2.142 | 2.140 | 1.982 | 1.983 | 1.987 | |
| 60% | Voltage | 0.314 | 0.312 | 0.313 | 1.190 | 1.192 | 1.191 | 0.328 | 0.320 | 0.323 |
| Current | 2.059 | 2.054 | 2.058 | 2.056 | 2.057 | 2.050 | 2.083 | 2.085 | 2.082 | |
| 70% | Voltage | 0.310 | 0.315 | 0.311 | 1.243 | 1.249 | 1.249 | 0.321 | 0.328 | 0.329 |
| Current | 2.052 | 2.053 | 2.056 | 2.045 | 2.046 | 2.043 | 2.099 | 2.079 | 2.067 | |
Table 8.
Active Power p Generation under voltage sag.
| Time (s) | Active Power p (kW) | |||||
|---|---|---|---|---|---|---|
| 50% Voltage Sag | 60% Voltage Sag | 70% Voltage Sag | ||||
| Proposed Secondary Control | Conventional Control | Proposed Secondary Control | Conventional Control | Proposed Secondary Control | Conventional Control | |
| 1.30 | 20.590 | 20.590 | 20.600 | 20.600 | 20.590 | 20.590 |
| 1.34 | 07.222 | 14.580 | 10.600 | 16.700 | 14.380 | 20.480 |
| 1.38 | 07.101 | 14.070 | 09.870 | 17.100 | 13.870 | 20.540 |
| 1.42 | 07.498 | 15.160 | 10.400 | 17.900 | 14.240 | 20.530 |
| 1.46 | 07.274 | 15.030 | 10.200 | 18.000 | 14.080 | 20.500 |
| 1.50 | 07.364 | 15.930 | 10.300 | 17.700 | 14.140 | 20.470 |
| 1.54 | 07.347 | 16.090 | 10.200 | 18.300 | 14.120 | 20.450 |
| 1.58 | 07.343 | 15.930 | 10.200 | 17.800 | 14.120 | 20.400 |
| 1.62 | 07.356 | 16.130 | 10.200 | 19.000 | 14.110 | 20.210 |
| 1.66 | 07.364 | 16.420 | 10.200 | 17.800 | 14.130 | 20.320 |
| 1.70 | 07.341 | 16.640 | 10.300 | 17.900 | 14.120 | 20.320 |
| 1.74 | 07.339 | 16.790 | 10.200 | 18.100 | 14.130 | 19.970 |
| 1.78 | 07.337 | 16.580 | 10.200 | 19.500 | 14.120 | 20.890 |
| 1.82 | 09.493 | 24.990 | 12.300 | 27.900 | 15.470 | 25.060 |
| 1.86 | 22.960 | 31.700 | 22.600 | 30.300 | 21.810 | 24.290 |
| 1.90 | 19.960 | 31.020 | 20.100 | 26.900 | 20.230 | 14.120 |
| 1.94 | 20.700 | 30.440 | 20.700 | 23.500 | 20.680 | 22.500 |
| 1.98 | 30.560 | 26.030 | 20.500 | 20.100 | 20.560 | 19.940 |
| 2.02 | 20.580 | 21.010 | 20.600 | 16.200 | 20.600 | 20.770 |
| 2.06 | 20.590 | 15.840 | 20.600 | 10.600 | 20.590 | 20.540 |
| 2.10 | 20.590 | 09.482 | 20.600 | 11.700 | 20.600 | 20.620 |
| 2.14 | 20.600 | 10.400 | 20.600 | 12.400 | 20.590 | 20.590 |
| 2.18 | 20.590 | 11.030 | 20.600 | 12.800 | 20.590 | 20.590 |
| 2.22 | 20.600 | 11.550 | 20.600 | 17.600 | 20.590 | 20.580 |
| 2.26 | 20.580 | 12.020 | 20.600 | 28.400 | 20.570 | 20.570 |
| 2.30 | 20.590 | 12.280 | 20.600 | 17.500 | 20.590 | 20.580 |
Table 9.
Reactive Power Q Generation under voltage sag.
| Time (s) | Reactive Power Q (kVAr) | |||||
|---|---|---|---|---|---|---|
| 50% Voltage Sag | 60% Voltage Sag | 70% Voltage Sag | ||||
| Proposed Secondary Control | Conventional Control | Proposed Secondary Control | Conventional Control | Proposed Secondary Control | Conventional Control | |
| 1.30 | −0.259 | −0.279 | −02.59 | −0.279 | −0.026 | −0.029 |
| 1.34 | 12.300 | 15.100 | 9.470 | 17.700 | 5.920 | 3.030 |
| 1.38 | 12.400 | 16.000 | 09.58 | 18.500 | 6.003 | 6.870 |
| 1.42 | 12.500 | 15.700 | 09.74 | 18.700 | 6.130 | 9.840 |
| 1.46 | 12.600 | 17.300 | 09.81 | 18.800 | 6.130 | 12.100 |
| 1.50 | 12.600 | 17.000 | 09.88 | 20.000 | 6.160 | 14.500 |
| 1.54 | 12.700 | 12.700 | 09.89 | 21.100 | 6.180 | 17.400 |
| 1.58 | 12.700 | 17.800 | 09.91 | 20.300 | 6.190 | 19.900 |
| 1.62 | 12.700 | 17.800 | 09.92 | 20.400 | 6.200 | 20.800 |
| 1.66 | 12.700 | 18.300 | 09.96 | 21.000 | 6.200 | 20.900 |
| 1.70 | 12.700 | 18.900 | 09.94 | 21.000 | 6.230 | 21.200 |
| 1.74 | 12.700 | 18.600 | 09.90 | 21.000 | 6.220 | 20.900 |
| 1.78 | 12.400 | 19.800 | 09.940 | 21.200 | 6.210 | 21.400 |
| 1.82 | 02.870 | 08.100 | 03.150 | 25.800 | −0.040 | 24.100 |
| 1.86 | 0.684 | 00.06 | 00.509 | 26.100 | 0.269 | 20.100 |
| 1.90 | 0.272 | 00.06 | 00.249 | 27.200 | 0.083 | −0.657 |
| 1.94 | 0.274 | 03.010 | 00.155 | 18.500 | 0.118 | 0.003 |
| 1.98 | 0.182 | 22.500 | 00.127 | 10.900 | 0.034 | −0.180 |
| 2.02 | 0.142 | 13.100 | 00.044 | 00.636 | 0.012 | 0.089 |
| 2.06 | 0.102 | 01.470 | −00.525 | 00.002 | 0.004 | −0.078 |
| 2.10 | 0.244 | −06.27 | 0.008 | −0.297 | −0.008 | −0.049 |
| 2.14 | 0.004 | −03.50 | 0.005 | −0.142 | −0.007 | −0.053 |
| 2.18 | −0.005 | −01.88 | 0.005 | −0.056 | 0.039 | 0.001 |
| 2.22 | −0.007 | −00.83 | −0.015 | −0.423 | −0.002 | −0.004 |
| 2.26 | −0.015 | −00.17 | −0.027 | 17.306 | −0.026 | −0.034 |
| 2.30 | 0.020 | 00.420 | −0.022 | −0.588 | 0.035 | 0.020 |
Table 10.
Active Power (kW) Consumption in the Load.
| Time (s) | 50% Voltage Sag | 60% Voltage Sag | 70% Voltage Sag | |||
|---|---|---|---|---|---|---|
| Proposed Secondary Control | Conventional Control | Proposed Secondary Control | Conventional Control | Proposed Secondary Control | Conventional Control | |
| 1.30 | 9.944 | 9.944 | 9.944 | 9.944 | 9.944 | 9.944 |
| 1.31 | 8.277 | 5.921 | 8.748 | 6.456 | 9.182 | 7.251 |
| 1.32 | 6.917 | 2.176 | 7.792 | 3.316 | 8.586 | 4.934 |
| 1.33 | 7.188 | 2.396 | 8.008 | 3.605 | 8.734 | 5.260 |
| 1.80 | 7.188 | 2.395 | 8.007 | 3.606 | 8.734 | 5.261 |
| 1.81 | 8.288 | 4.842 | 8.801 | 5.803 | 9.241 | 7.007 |
| 1.82 | 9.655 | 8.613 | 9.761 | 8.963 | 9.840 | 9.336 |
| 1.83 | 9.944 | 9.945 | 9.944 | 9.947 | 9.944 | 9.947 |
| 1.84 | 9.944 | 9.945 | 9.944 | 9.947 | 9.944 | 9.947 |
Table 11.
Reactive Power (VAr) Consumption in the Load.
| 50% Voltage Sag | 60% Voltage Sag | 70% Voltage Sag | ||||
|---|---|---|---|---|---|---|
| Time (s) | Proposed Secondary Control | Conventional Control | Proposed Secondary Control | Conventional Control | Proposed Secondary Control | Conventional Control |
| 1.30 | 497.2 | 497.2 | 497.2 | 497.2 | 497.2 | 497.2 |
| 1.31 | 421.1 | 311.1 | 442.6 | 336.9 | 462.5 | 374.0 |
| 1.32 | 349.1 | 106.2 | 392.5 | 165.7 | 431.5 | 249.1 |
| 1.33 | 359.4 | 119.7 | 400.4 | 180.2 | 436.7 | 263.0 |
| 1.80 | 359.4 | 119.8 | 400.4 | 180.3 | 436.7 | 263.1 |
| 1.81 | 387.3 | 162.9 | 421.1 | 225.2 | 450.3 | 303.4 |
| 1.82 | 483.6 | 483.3 | 488.4 | 453.8 | 492.1 | 469.8 |
| 1.83 | 497.3 | 497.5 | 497.3 | 497.6 | 497.3 | 497.5 |
| 1.84 | 497.1 | 497.0 | 497.1 | 497.2 | 497.2 | 497.2 |
Publisher’s Note: MDPI stays neutral with regard to jurisdictional claims in published maps and institutional affiliations. |
© 2022 by the authors. Licensee MDPI, Basel, Switzerland. This article is an open access article distributed under the terms and conditions of the Creative Commons Attribution (CC BY) license (https://creativecommons.org/licenses/by/4.0/).
Share and Cite
MDPI and ACS Style
Buraimoh, E.; Davidson, I.E. Modeling of Double Stage Photovoltaic Inverter System with Fast Delayed Signal Cancellation for Fault Ride-Through Control Application in Microgrids. Energies 2022, 15, 701. https://doi.org/10.3390/en15030701
AMA Style
Buraimoh E, Davidson IE. Modeling of Double Stage Photovoltaic Inverter System with Fast Delayed Signal Cancellation for Fault Ride-Through Control Application in Microgrids. Energies. 2022; 15(3):701. https://doi.org/10.3390/en15030701
Chicago/Turabian StyleBuraimoh, Elutunji, and Innocent E. Davidson. 2022. "Modeling of Double Stage Photovoltaic Inverter System with Fast Delayed Signal Cancellation for Fault Ride-Through Control Application in Microgrids" Energies 15, no. 3: 701. https://doi.org/10.3390/en15030701
Note that from the first issue of 2016, this journal uses article numbers instead of page numbers. See further details here.