
Economic Feasibility of a Renewable Integrated Hybrid Power Generation System for a Rural Village of Ladakh
 , , ,
, , ,
Abstract
:1. Introduction
- With ever-increasing demand for electricity due to the expansion of smart cities, electricity generation can be increased through the use of renewable energy sources available locally at the considered site.
- Remote areas could produce electricity by commissioning DG-based power plants through an off-grid method. However, such power plants result in high amounts of pollutive elements in the atmosphere.
- The Indian government has undertaken many initiatives to motivate electricity generation through renewable sources of energy.
- The concept of DERs show promise as away to produce electricity ata reduced energy cost, as they consist of renewable sources of electricity generation (excluding DGs).
- An HPG system may be designed according to the desired location’s weather conditions. Locally available fuel sources like biomass may also be considered to reduce diesel usage. DG can be part of the HPG system as a captive source of power generation if renewable sources fail to generate electricity.
- Much of the work has been done to promote installation of an HPG system to reduce pollution levels caused by electricity generation through coal-based power plants.
2. Methodology
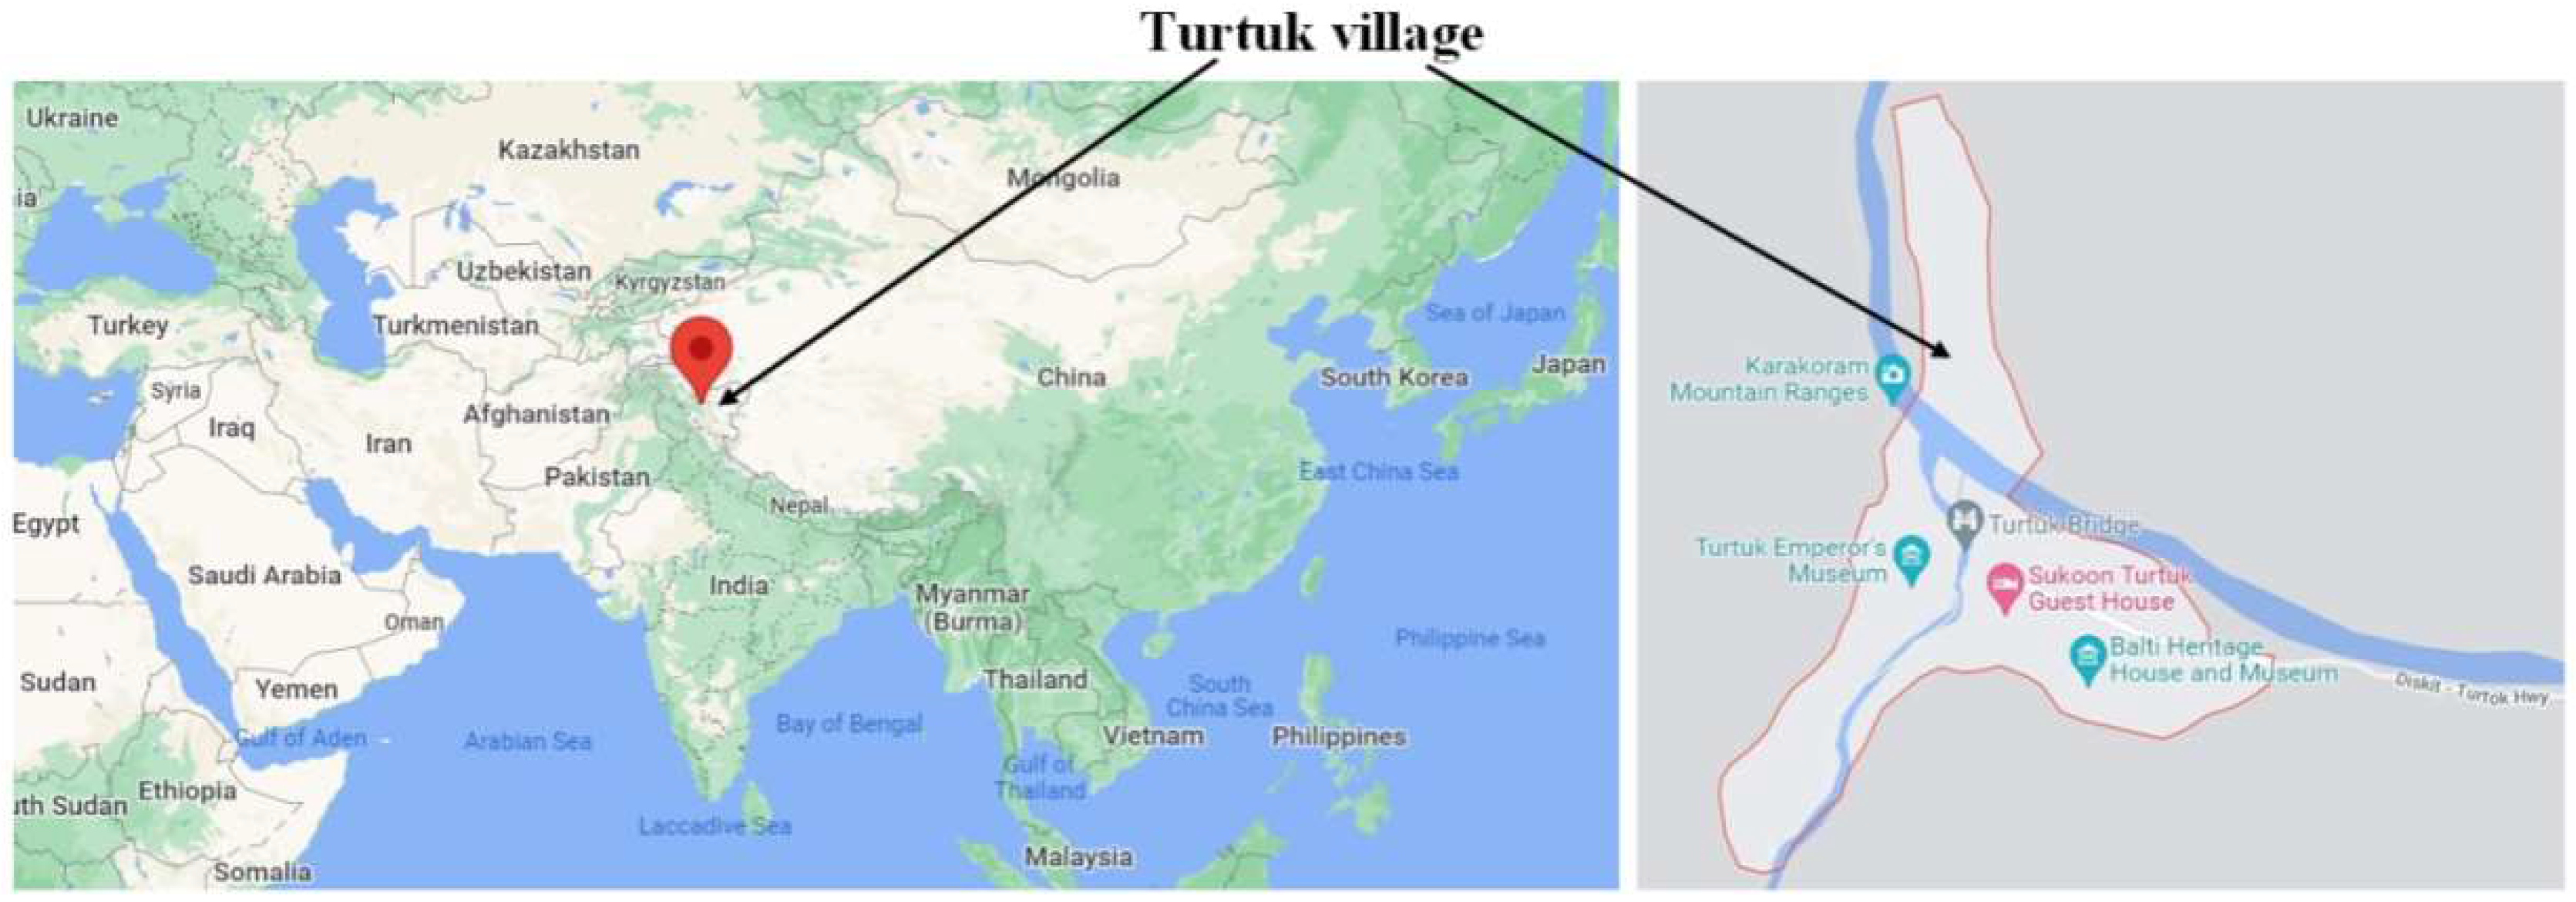
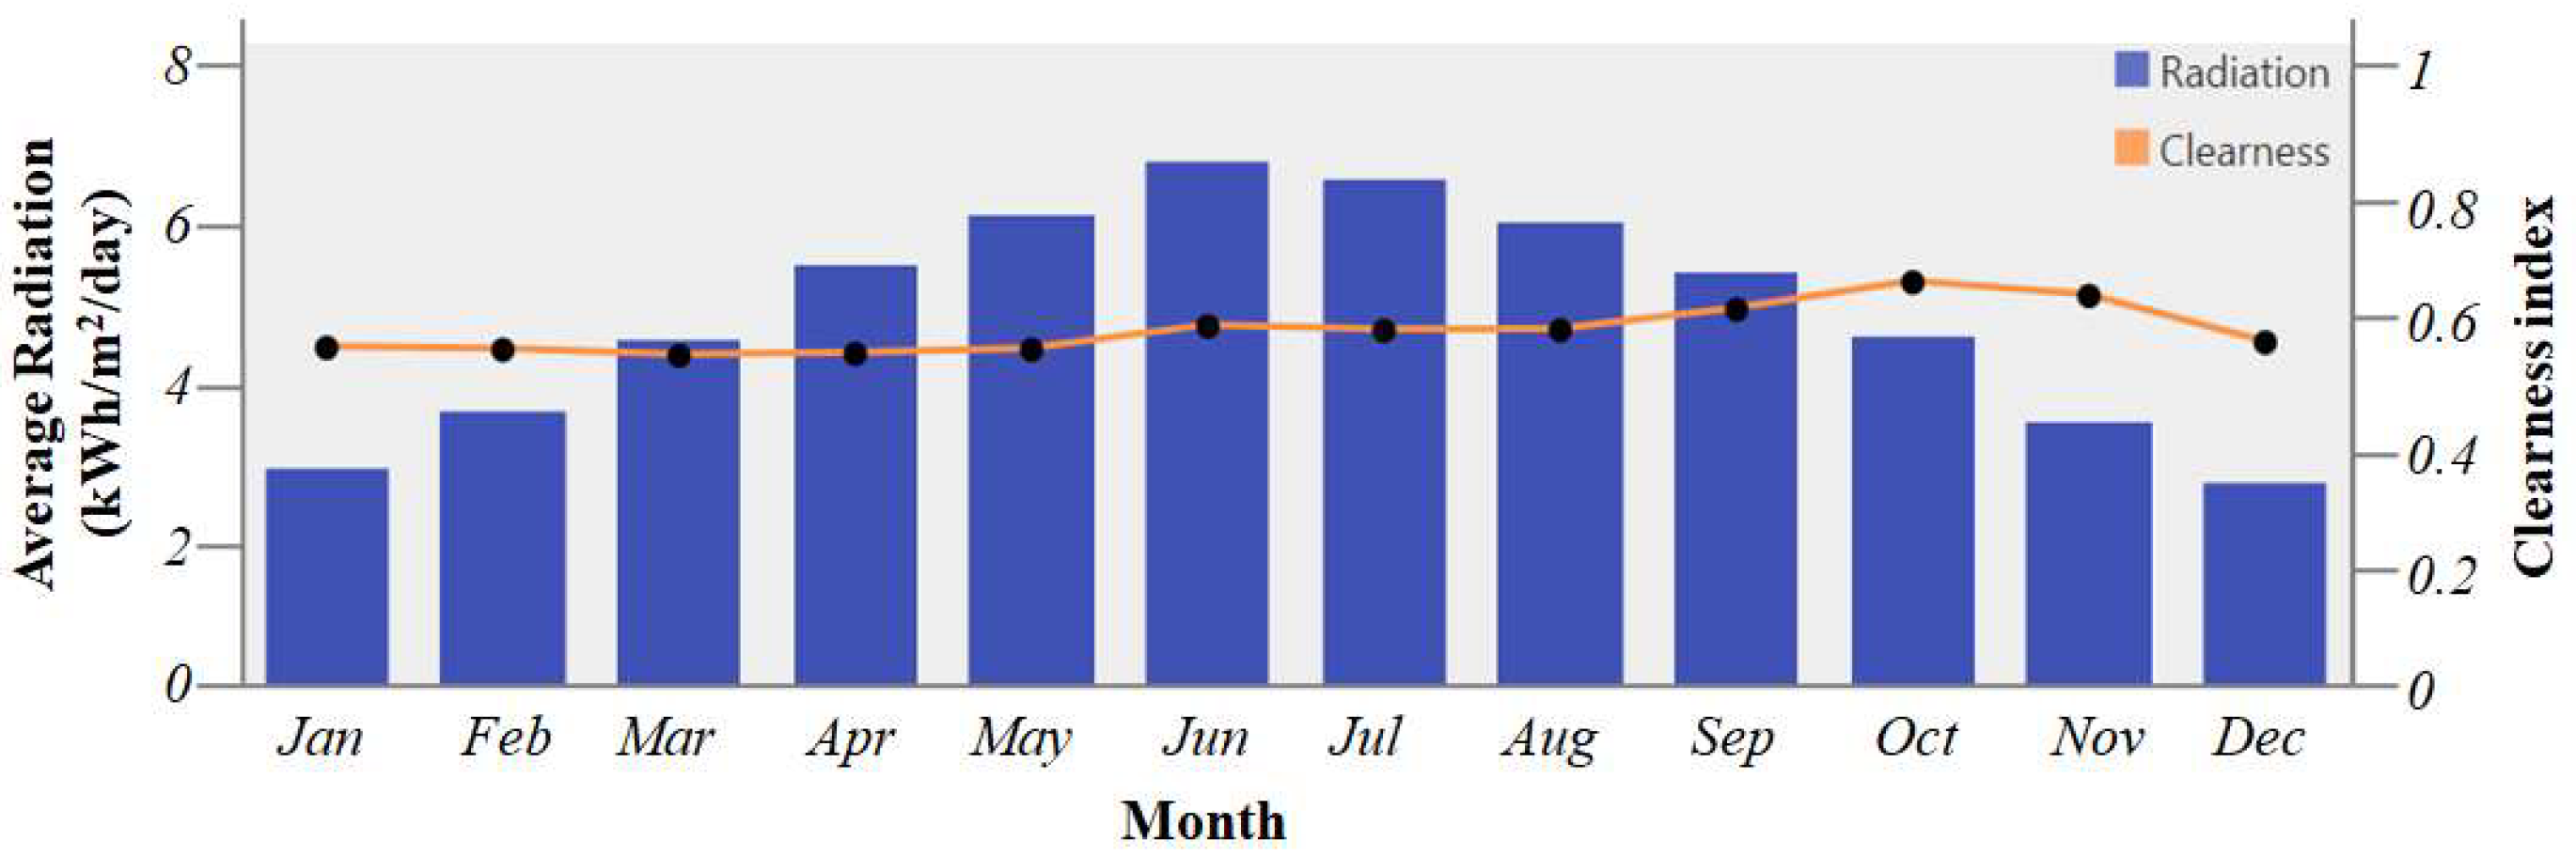
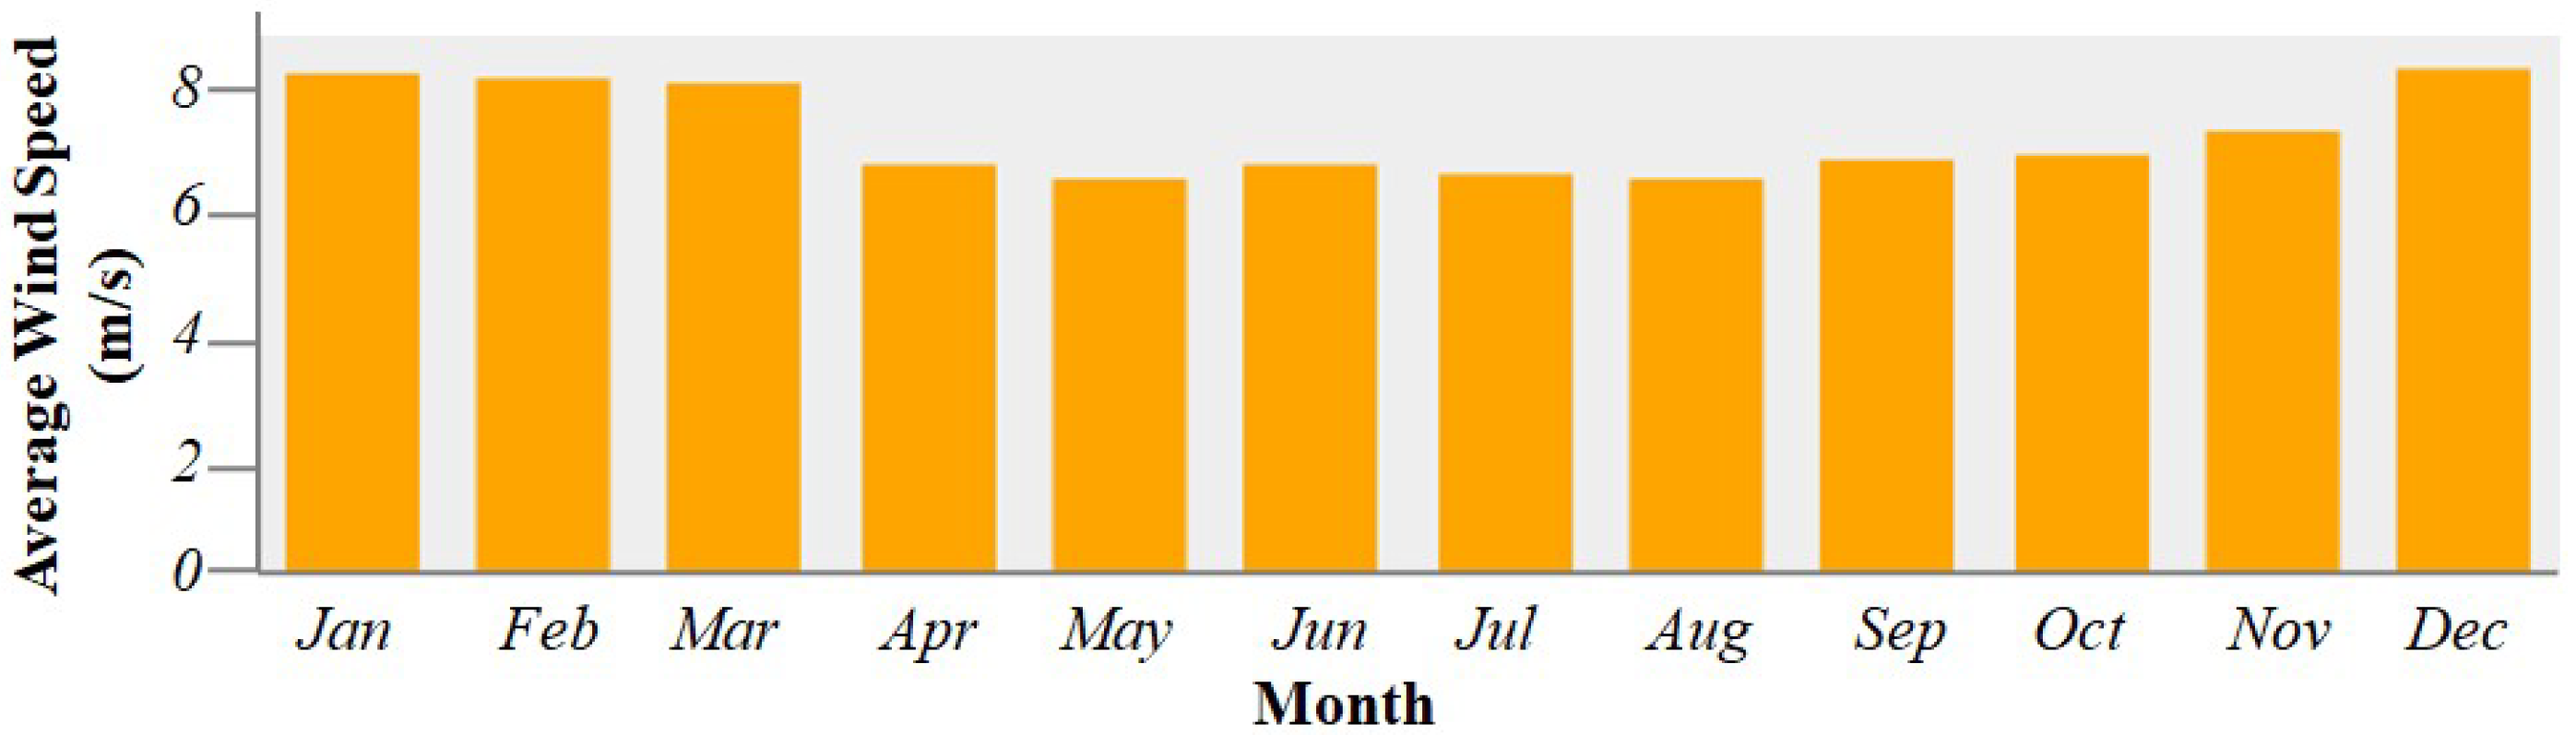
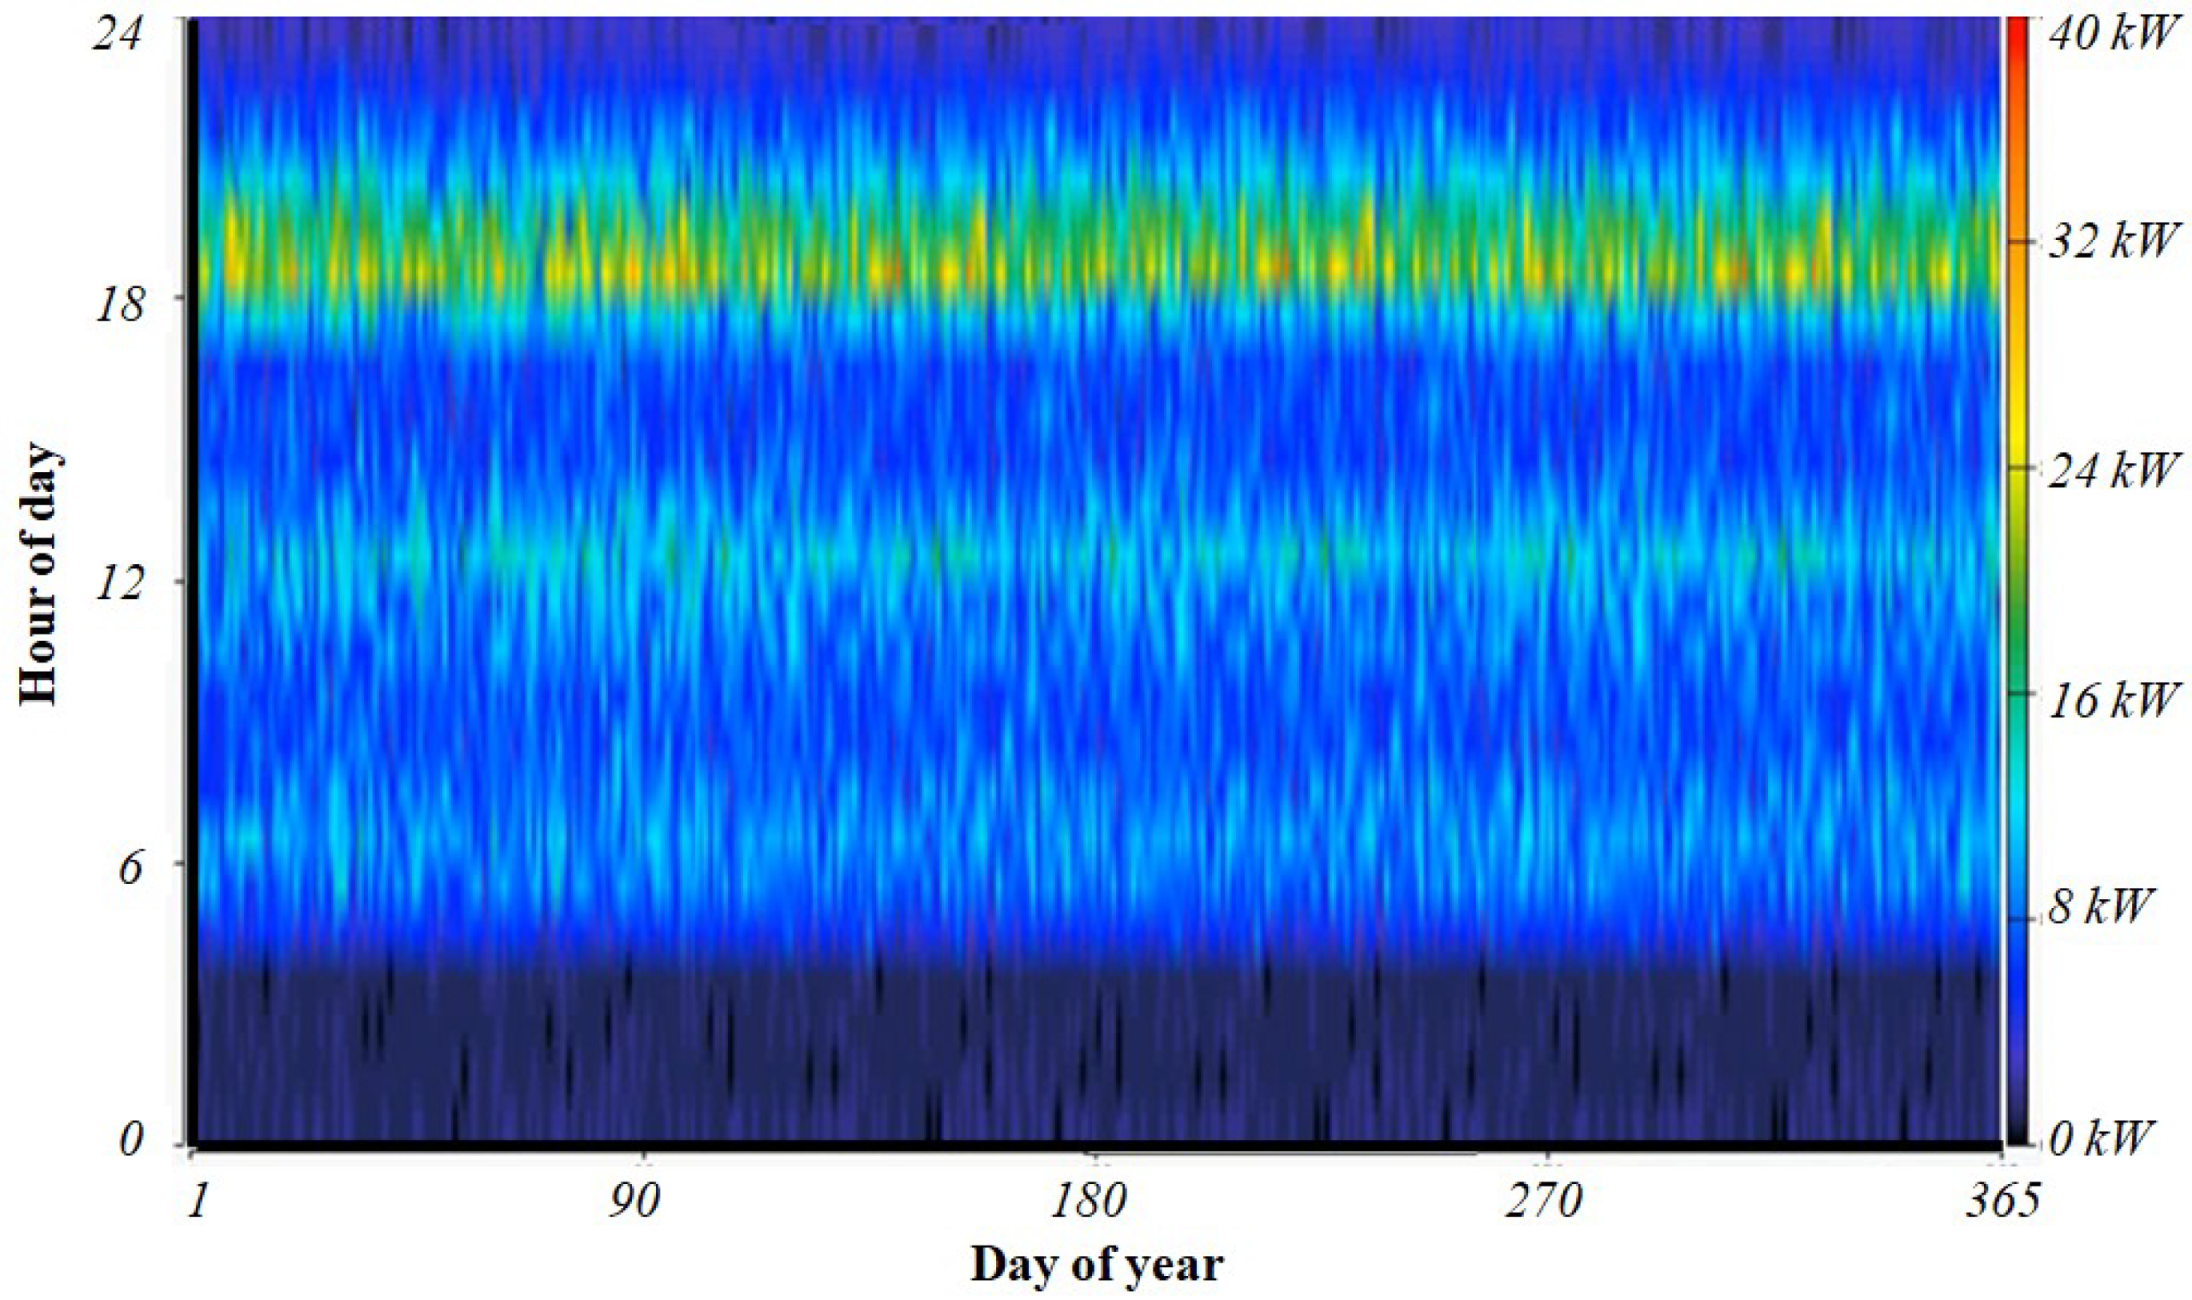
2.1. Weather Characteristics and Load Estimation of the Selected Site
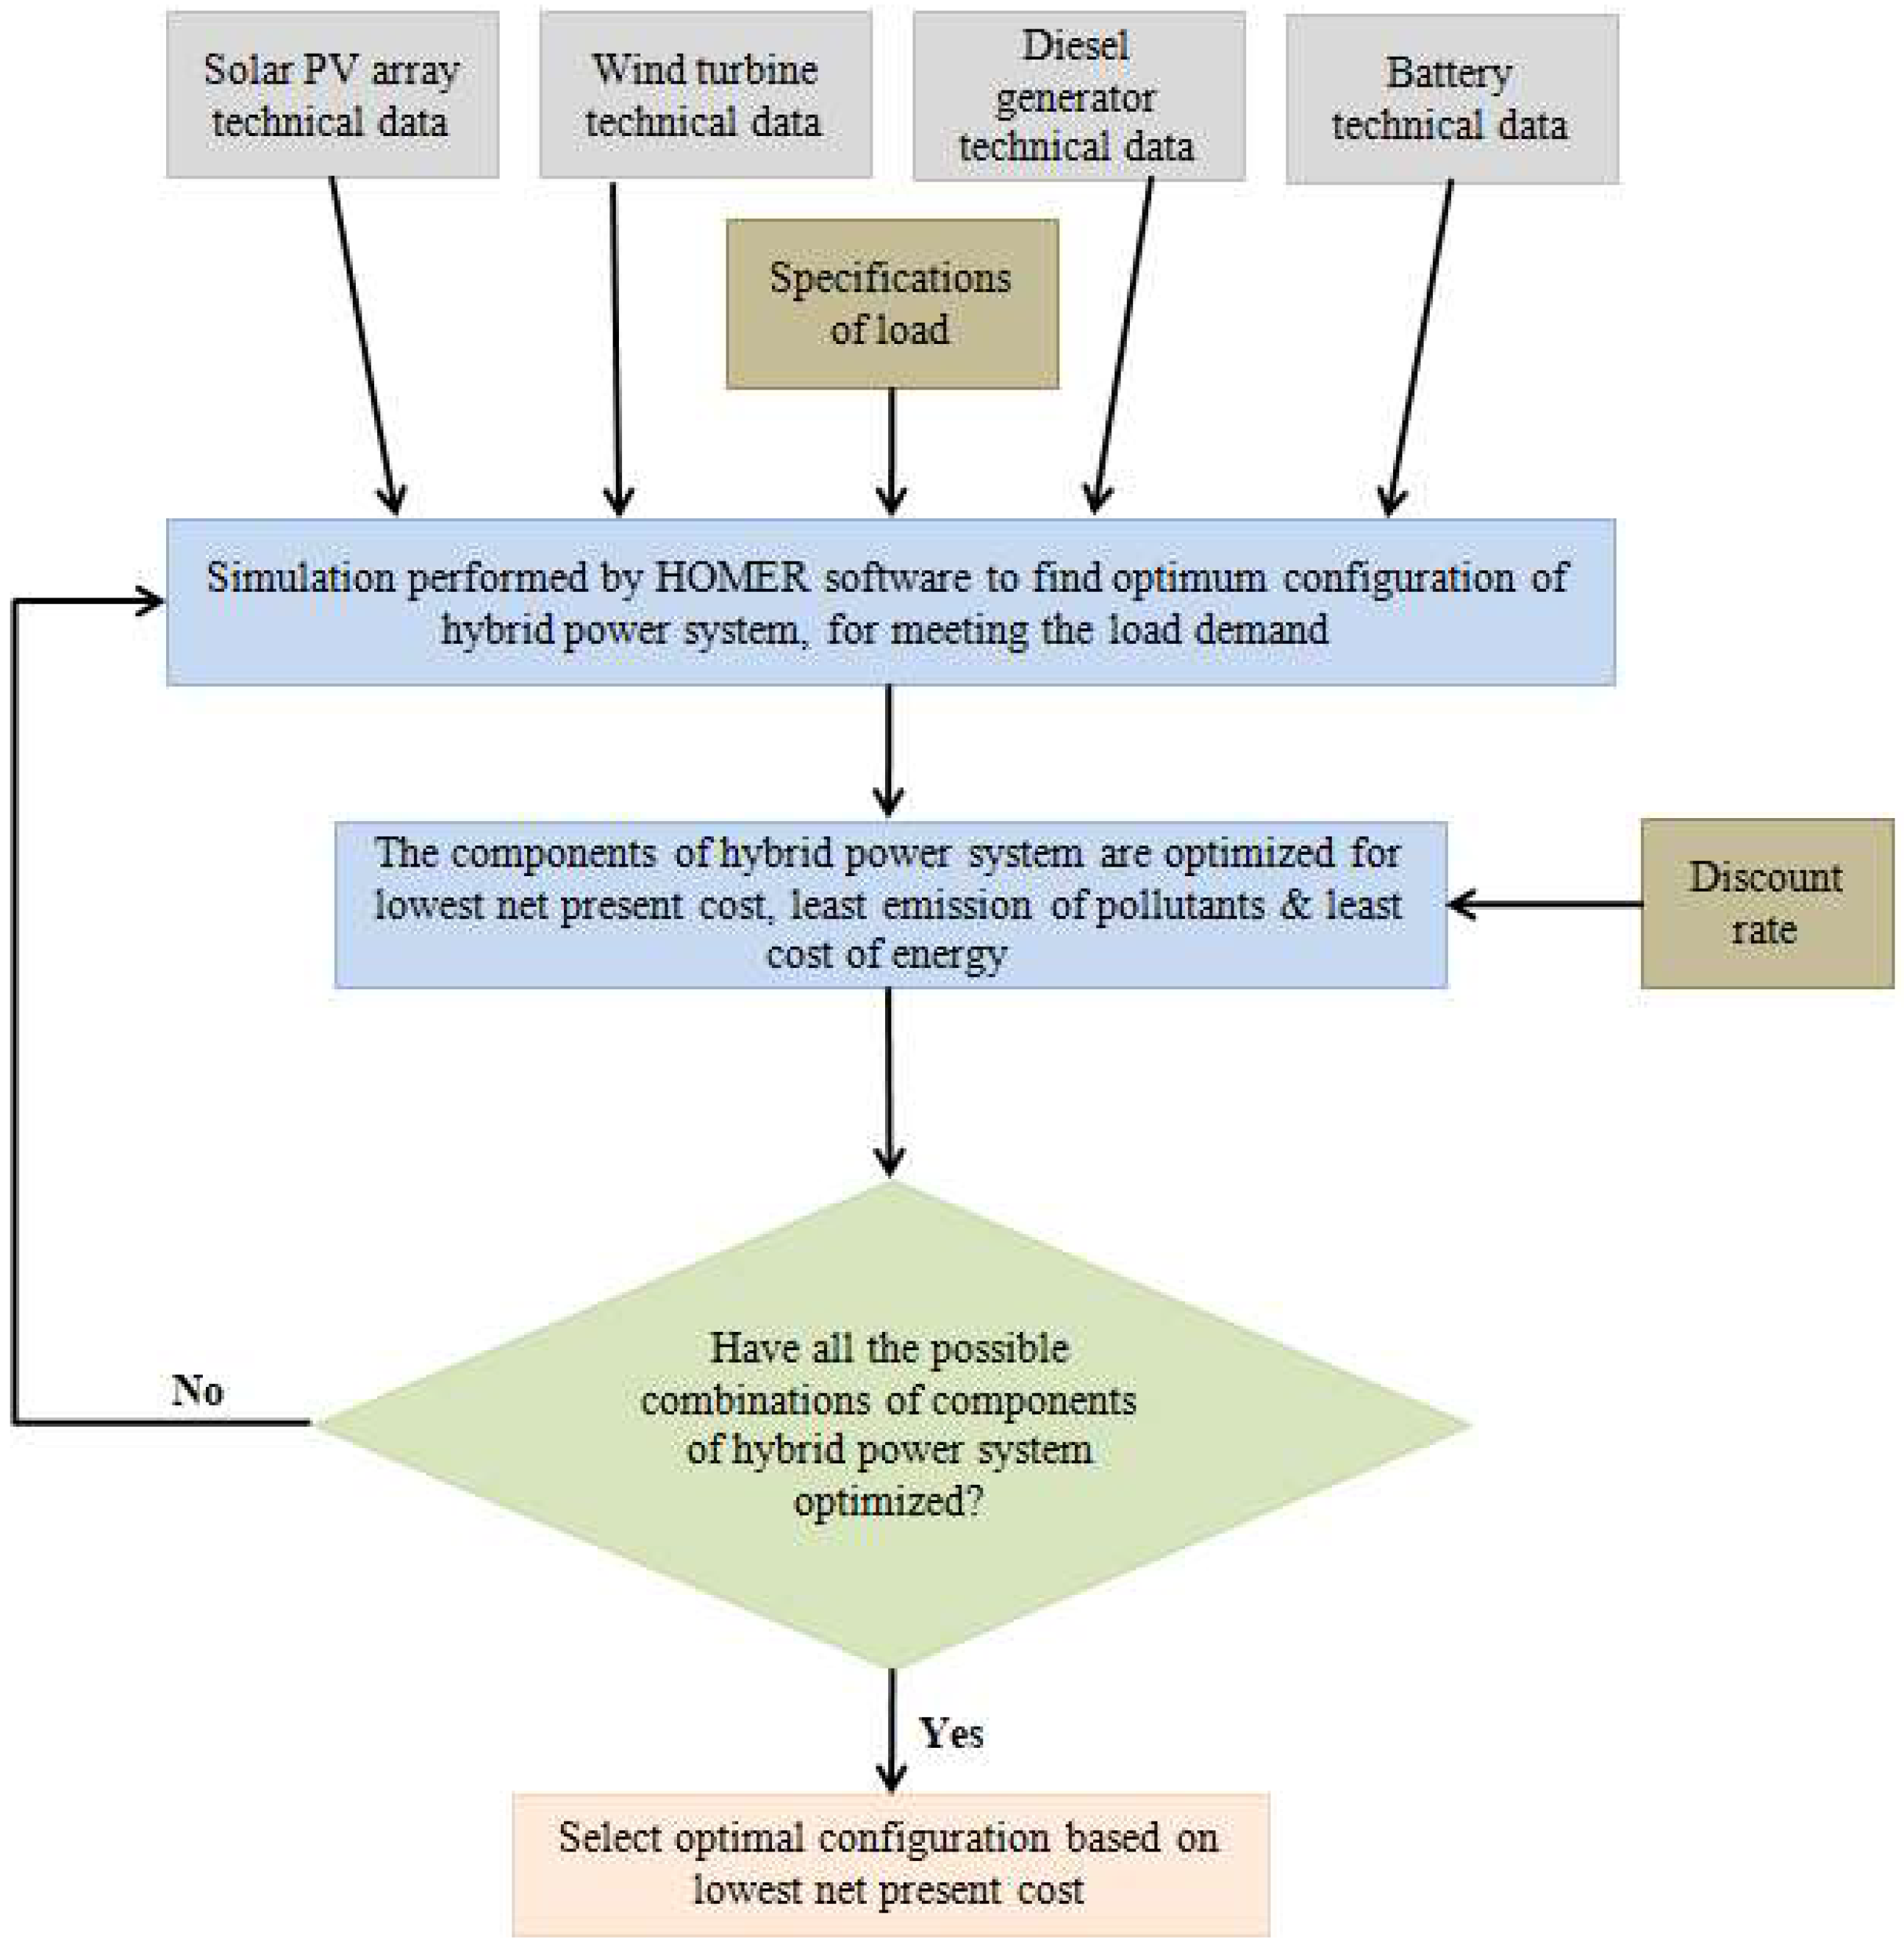
2.2. Simulation Tool for Hybrid Power Plant—HOMER Software
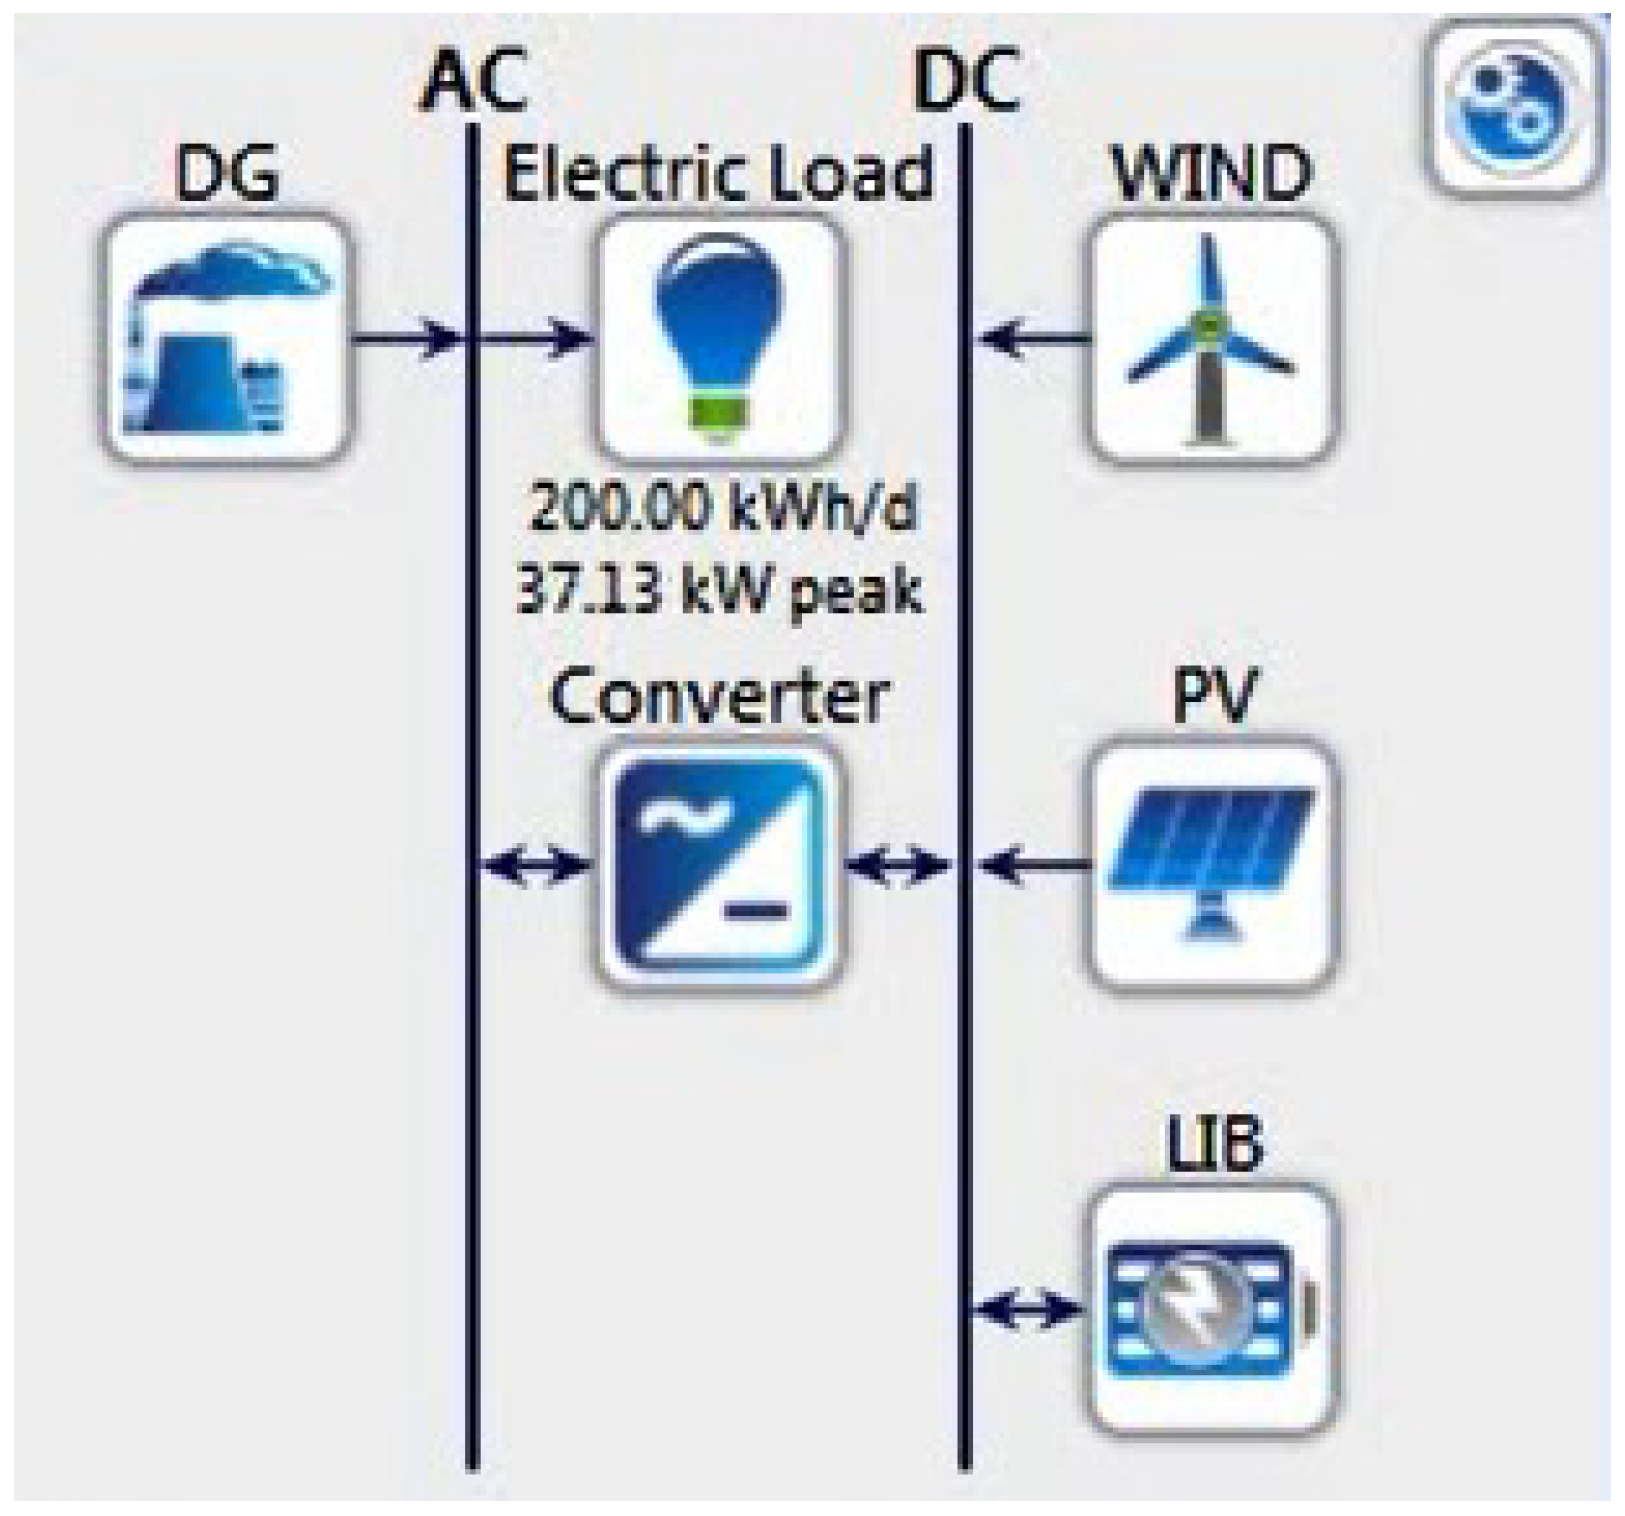
3. Configuration of Hybrid Power Generation System
3.1. PV Array

| Description | Value |
|---|---|
| Type of panel | Flat plate |
| Rated capacity (kWp) | 1 |
| Capital cost ($/kW) | 470 |
| Replacement cost ($/kW) | 470 |
| O&M cost ($/year) | 2.66 |
| Lifetime (years) | 25 |
| Derating factor (% assumed) | 80 |
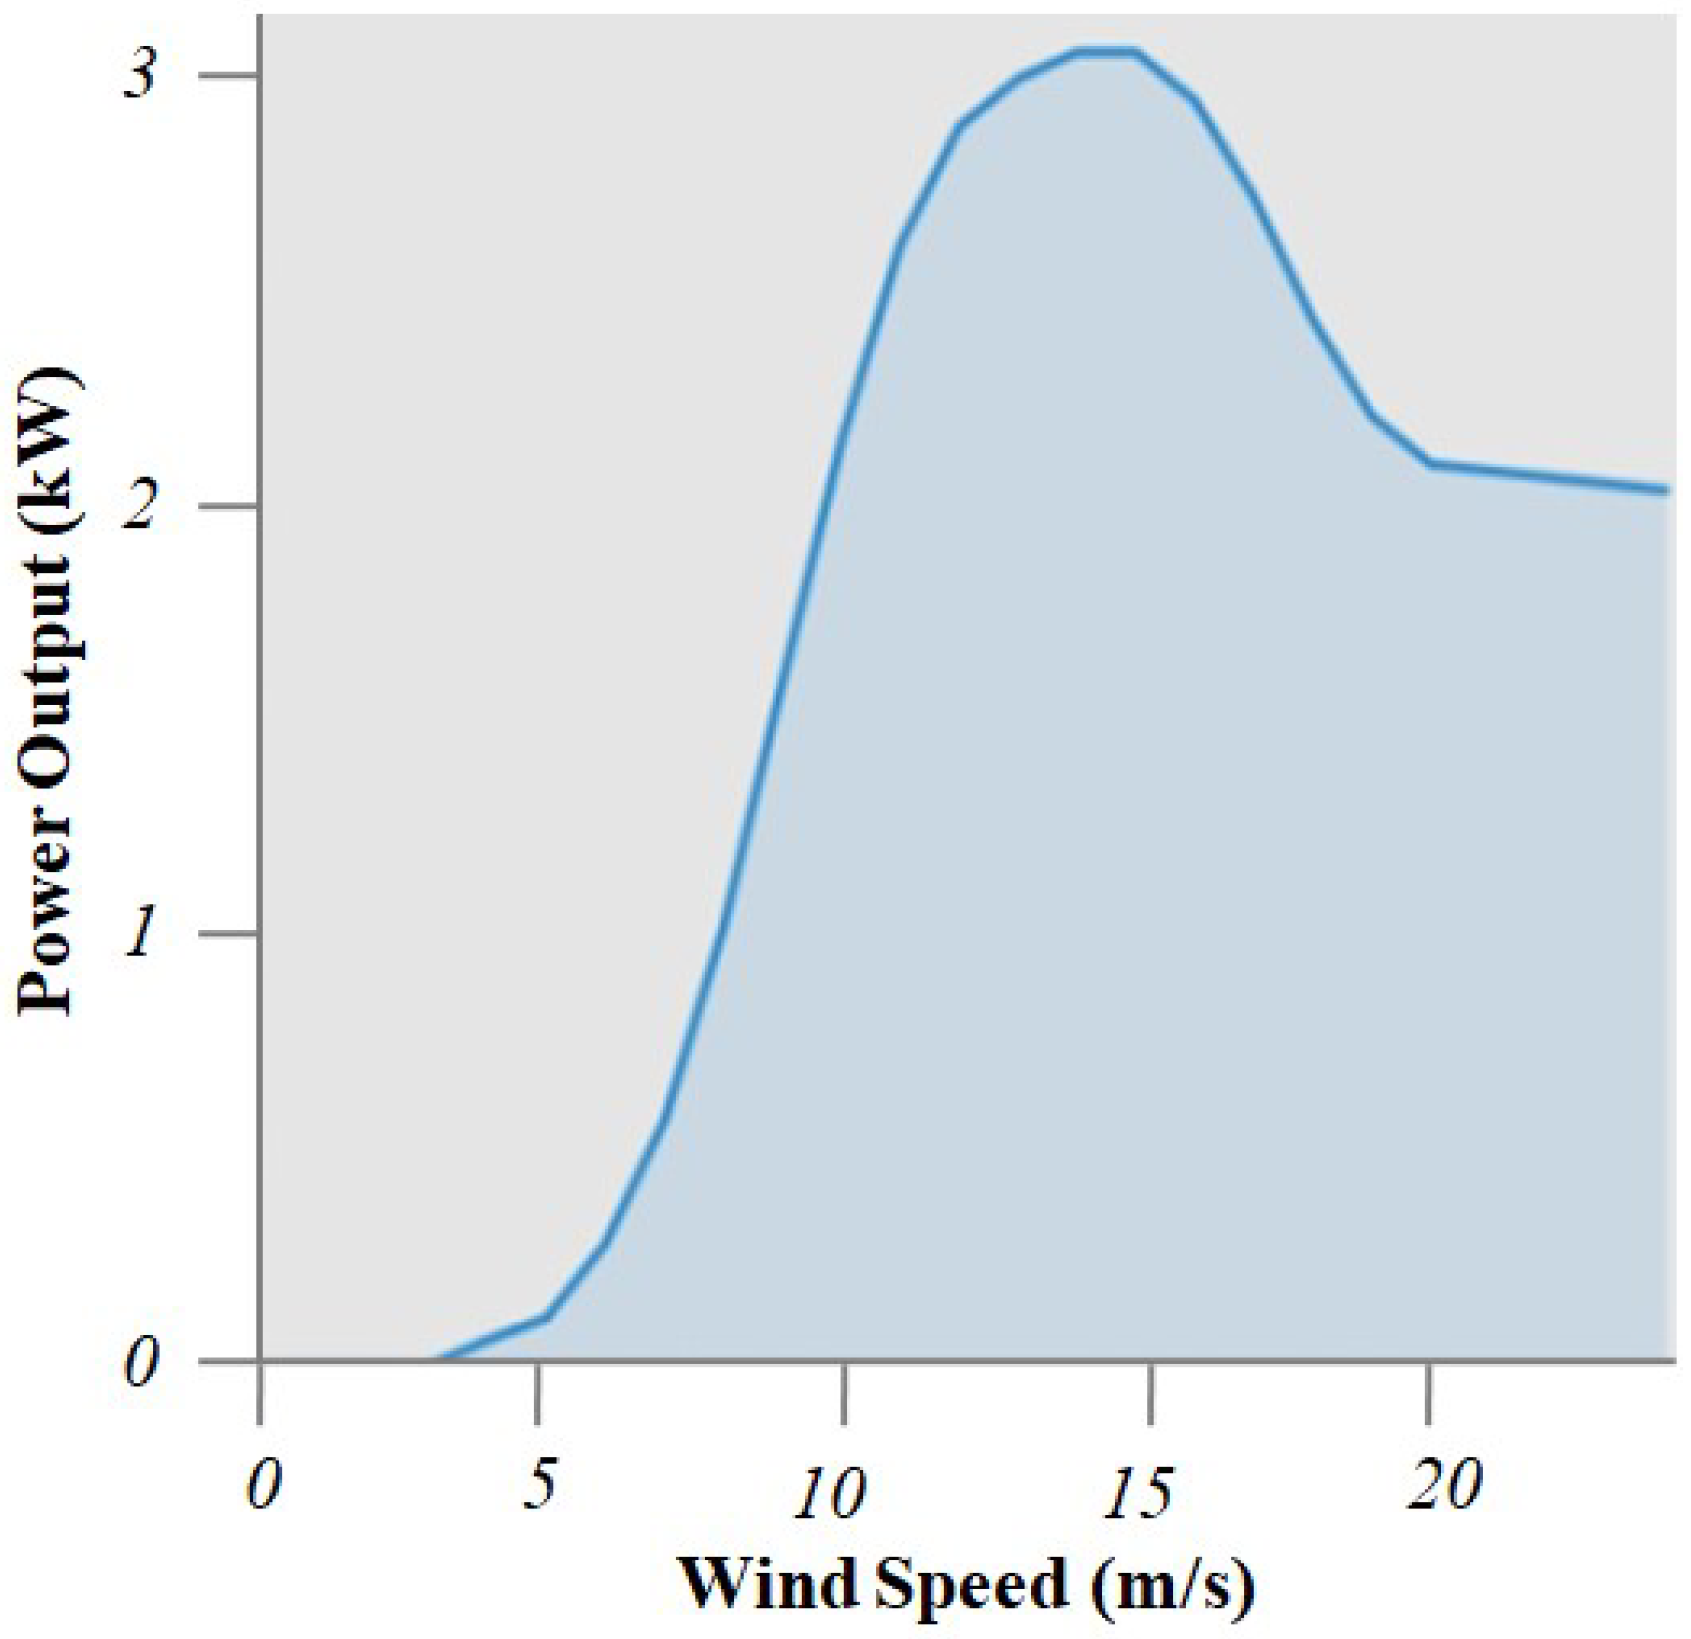
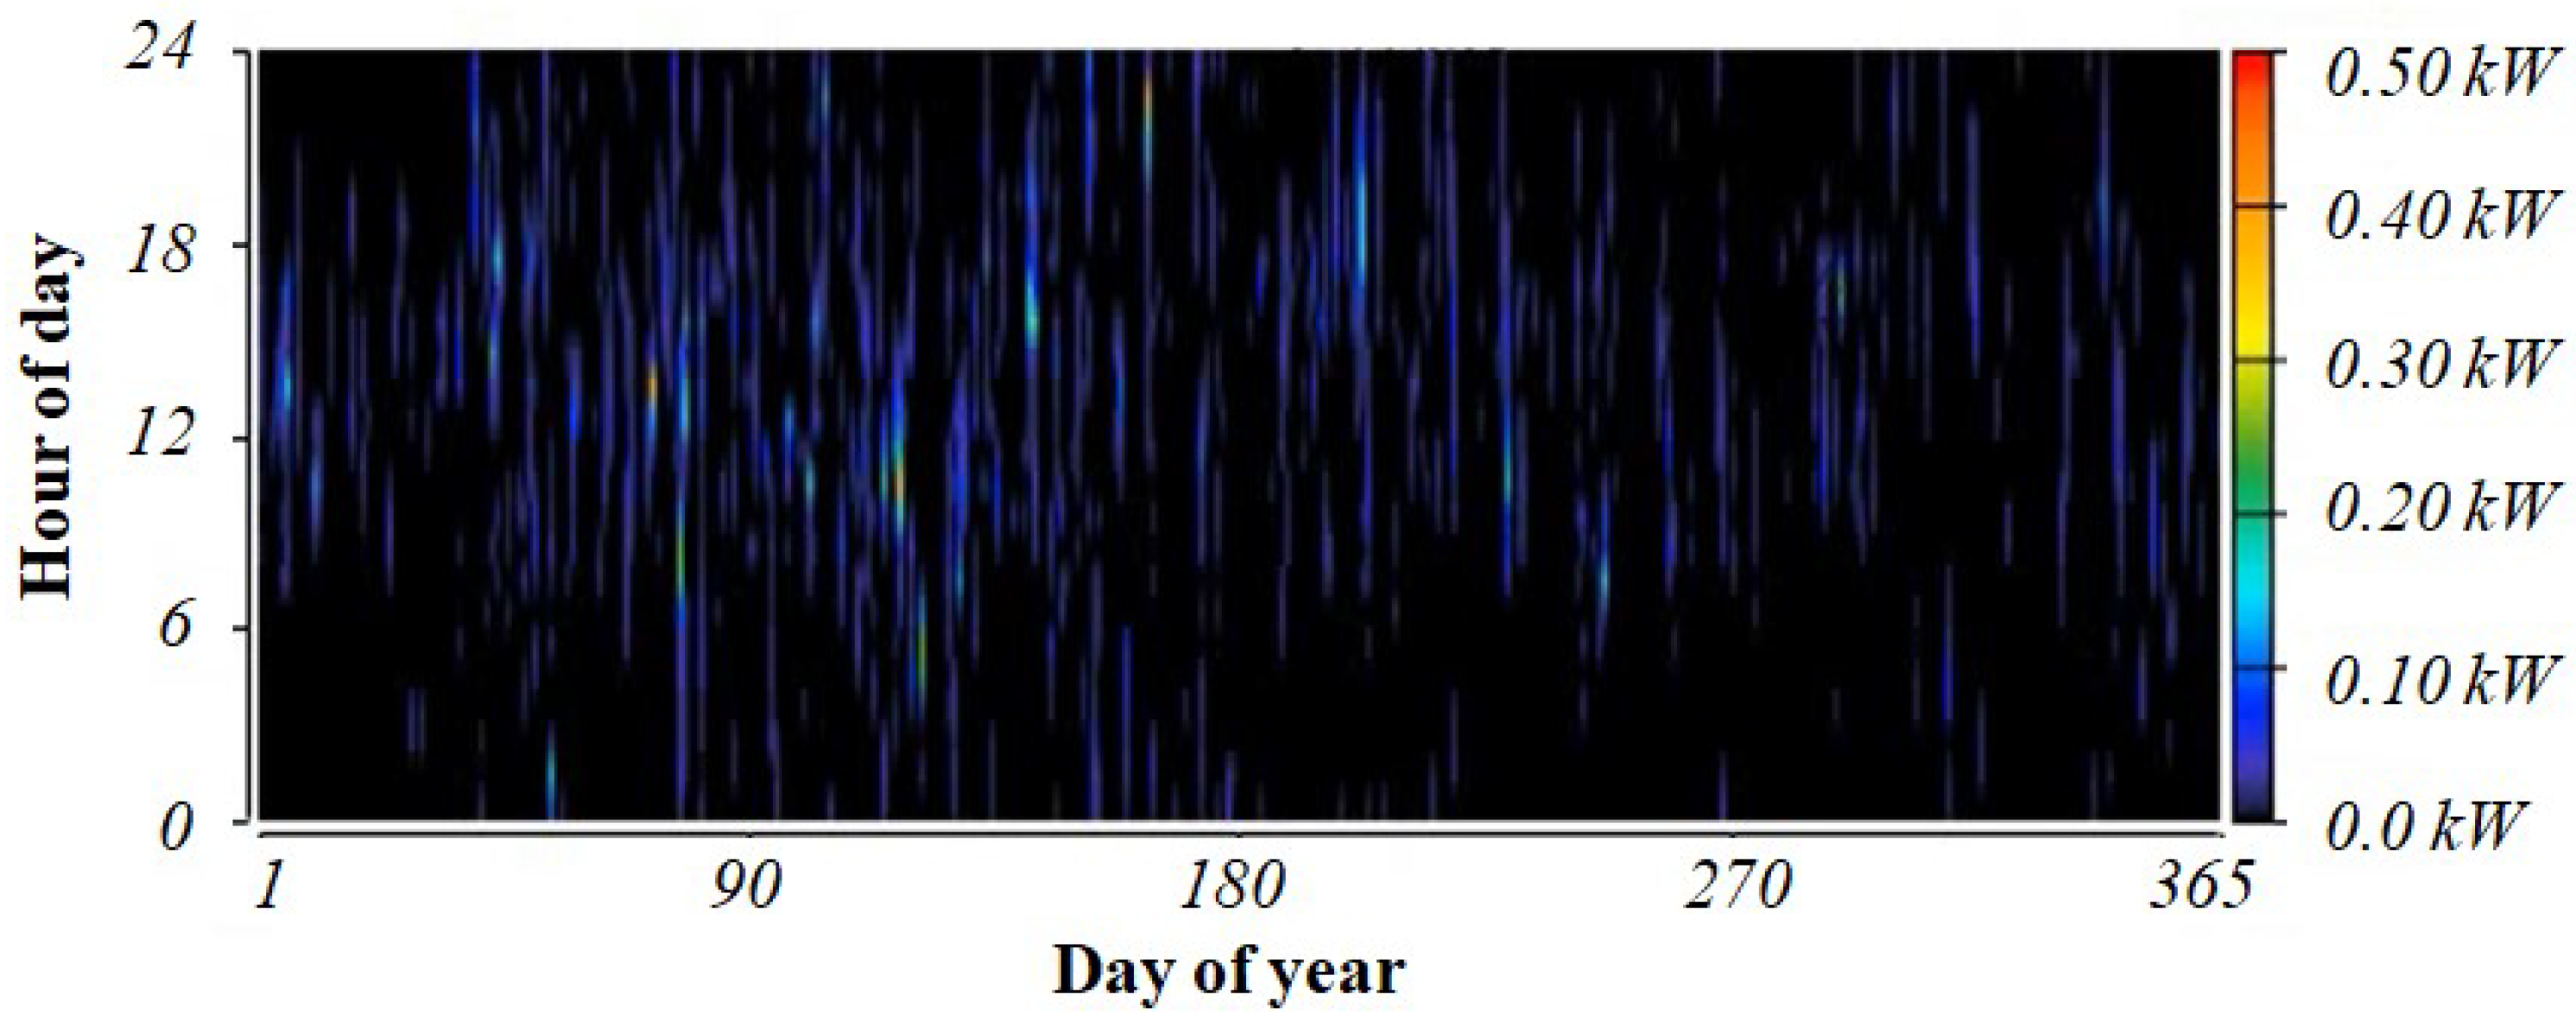
3.2. Wind Turbine

3.3. Battery Storage System
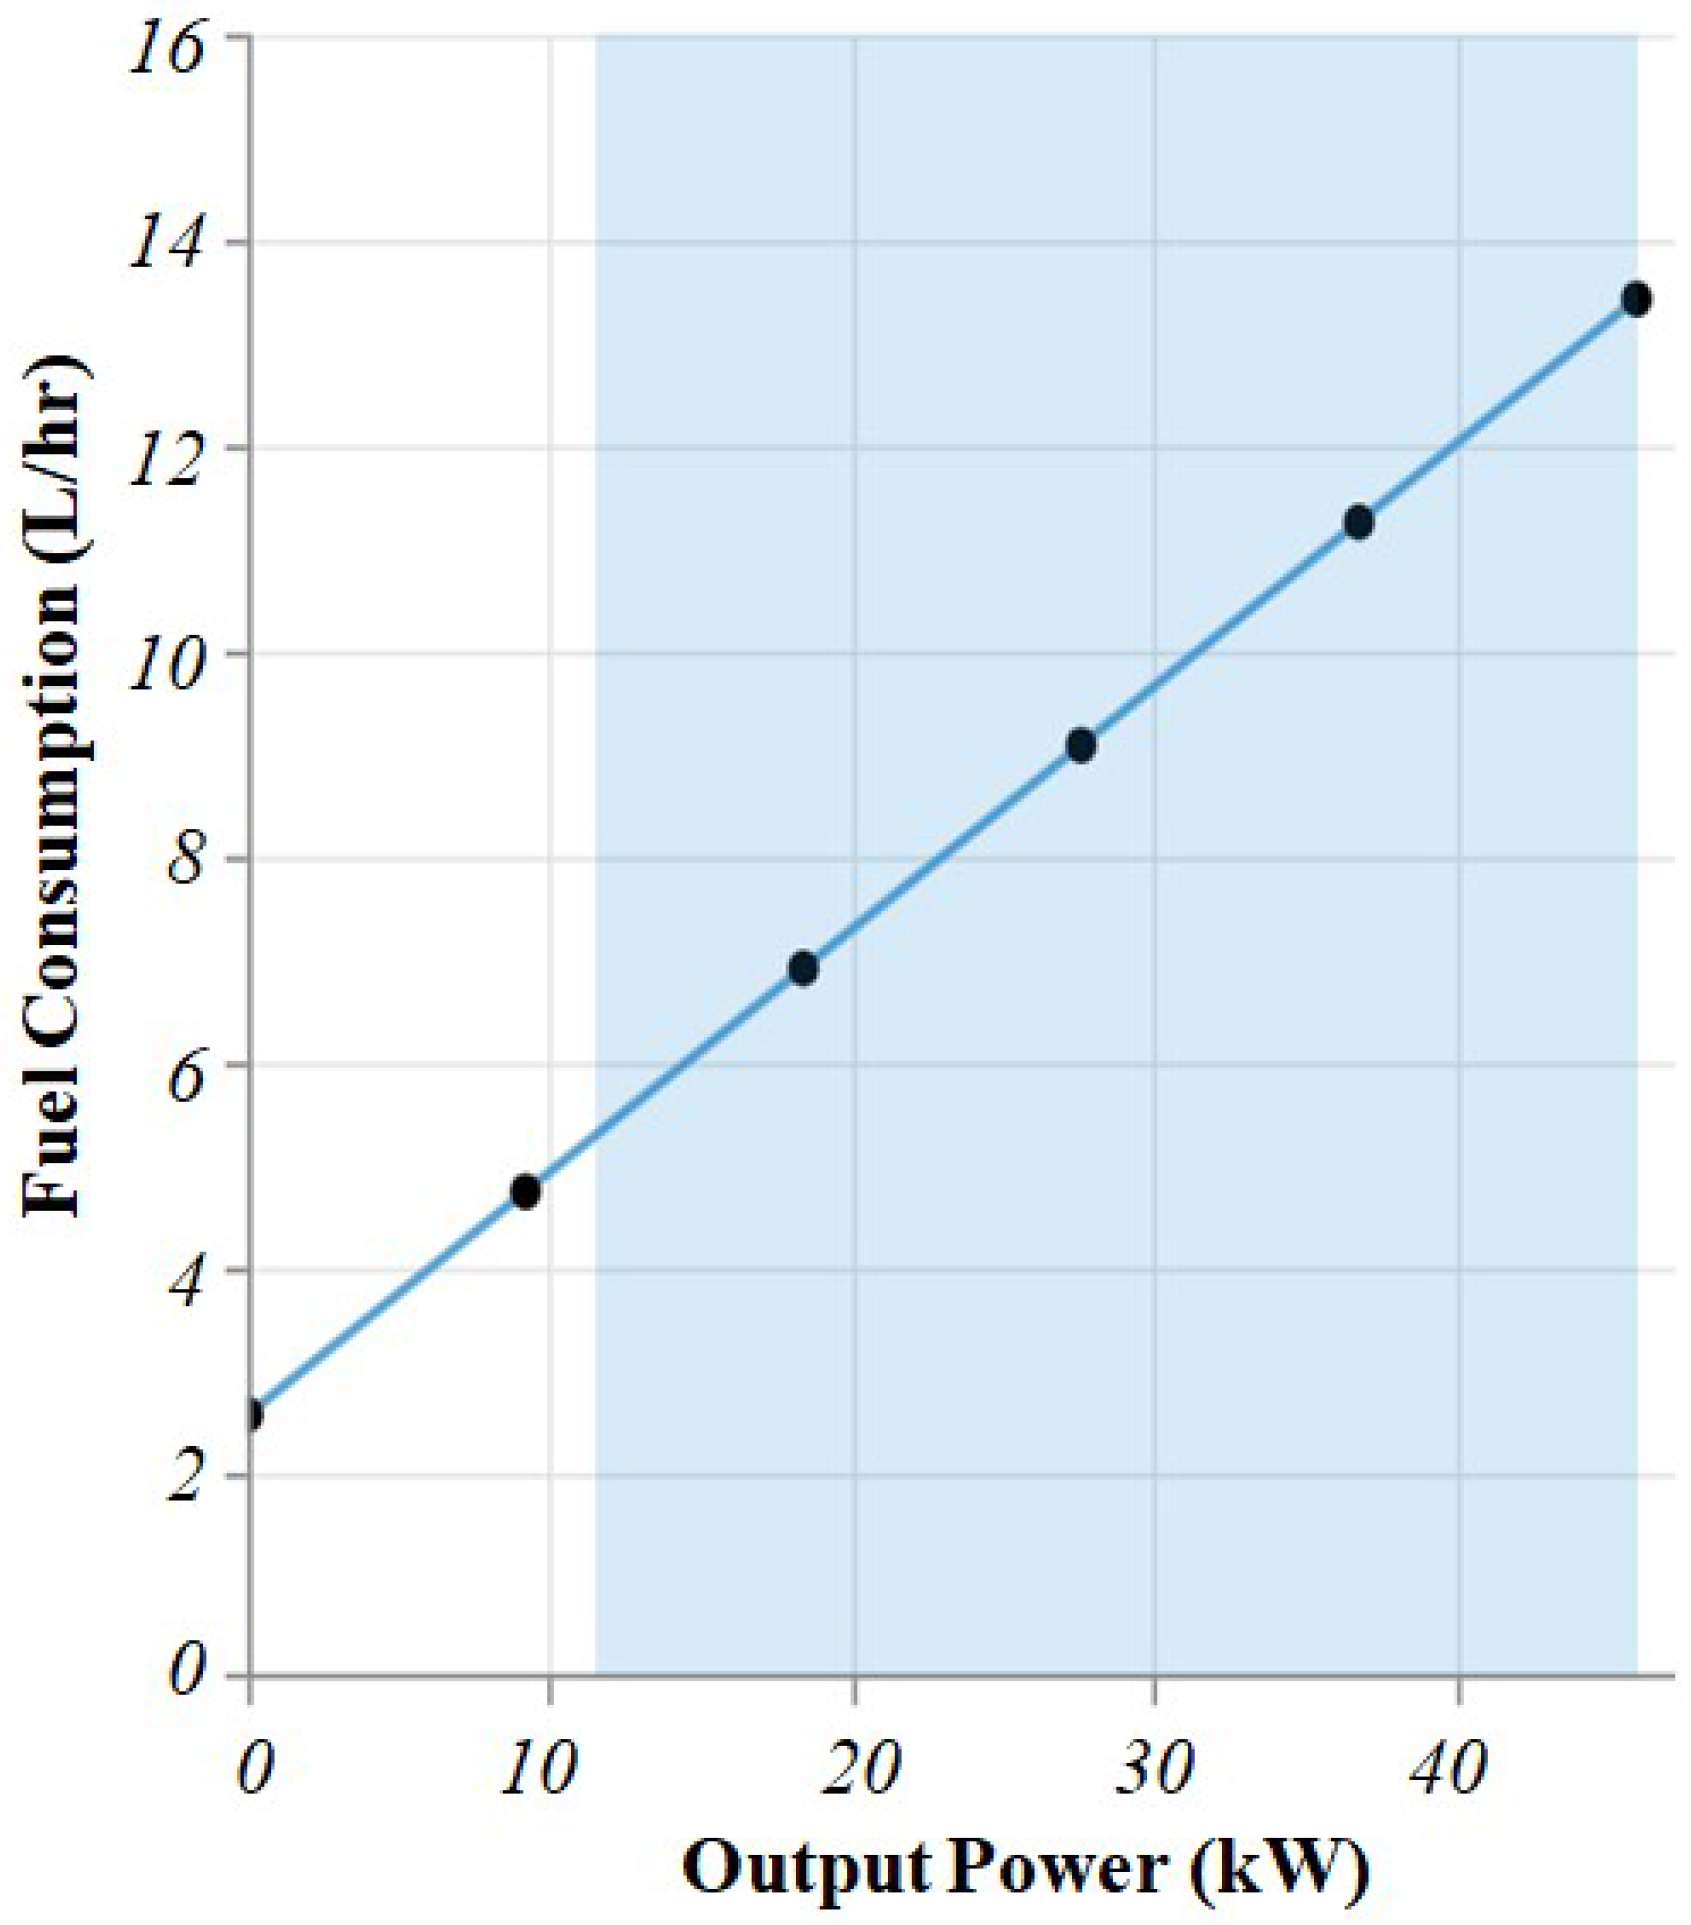
3.4. Diesel Generator
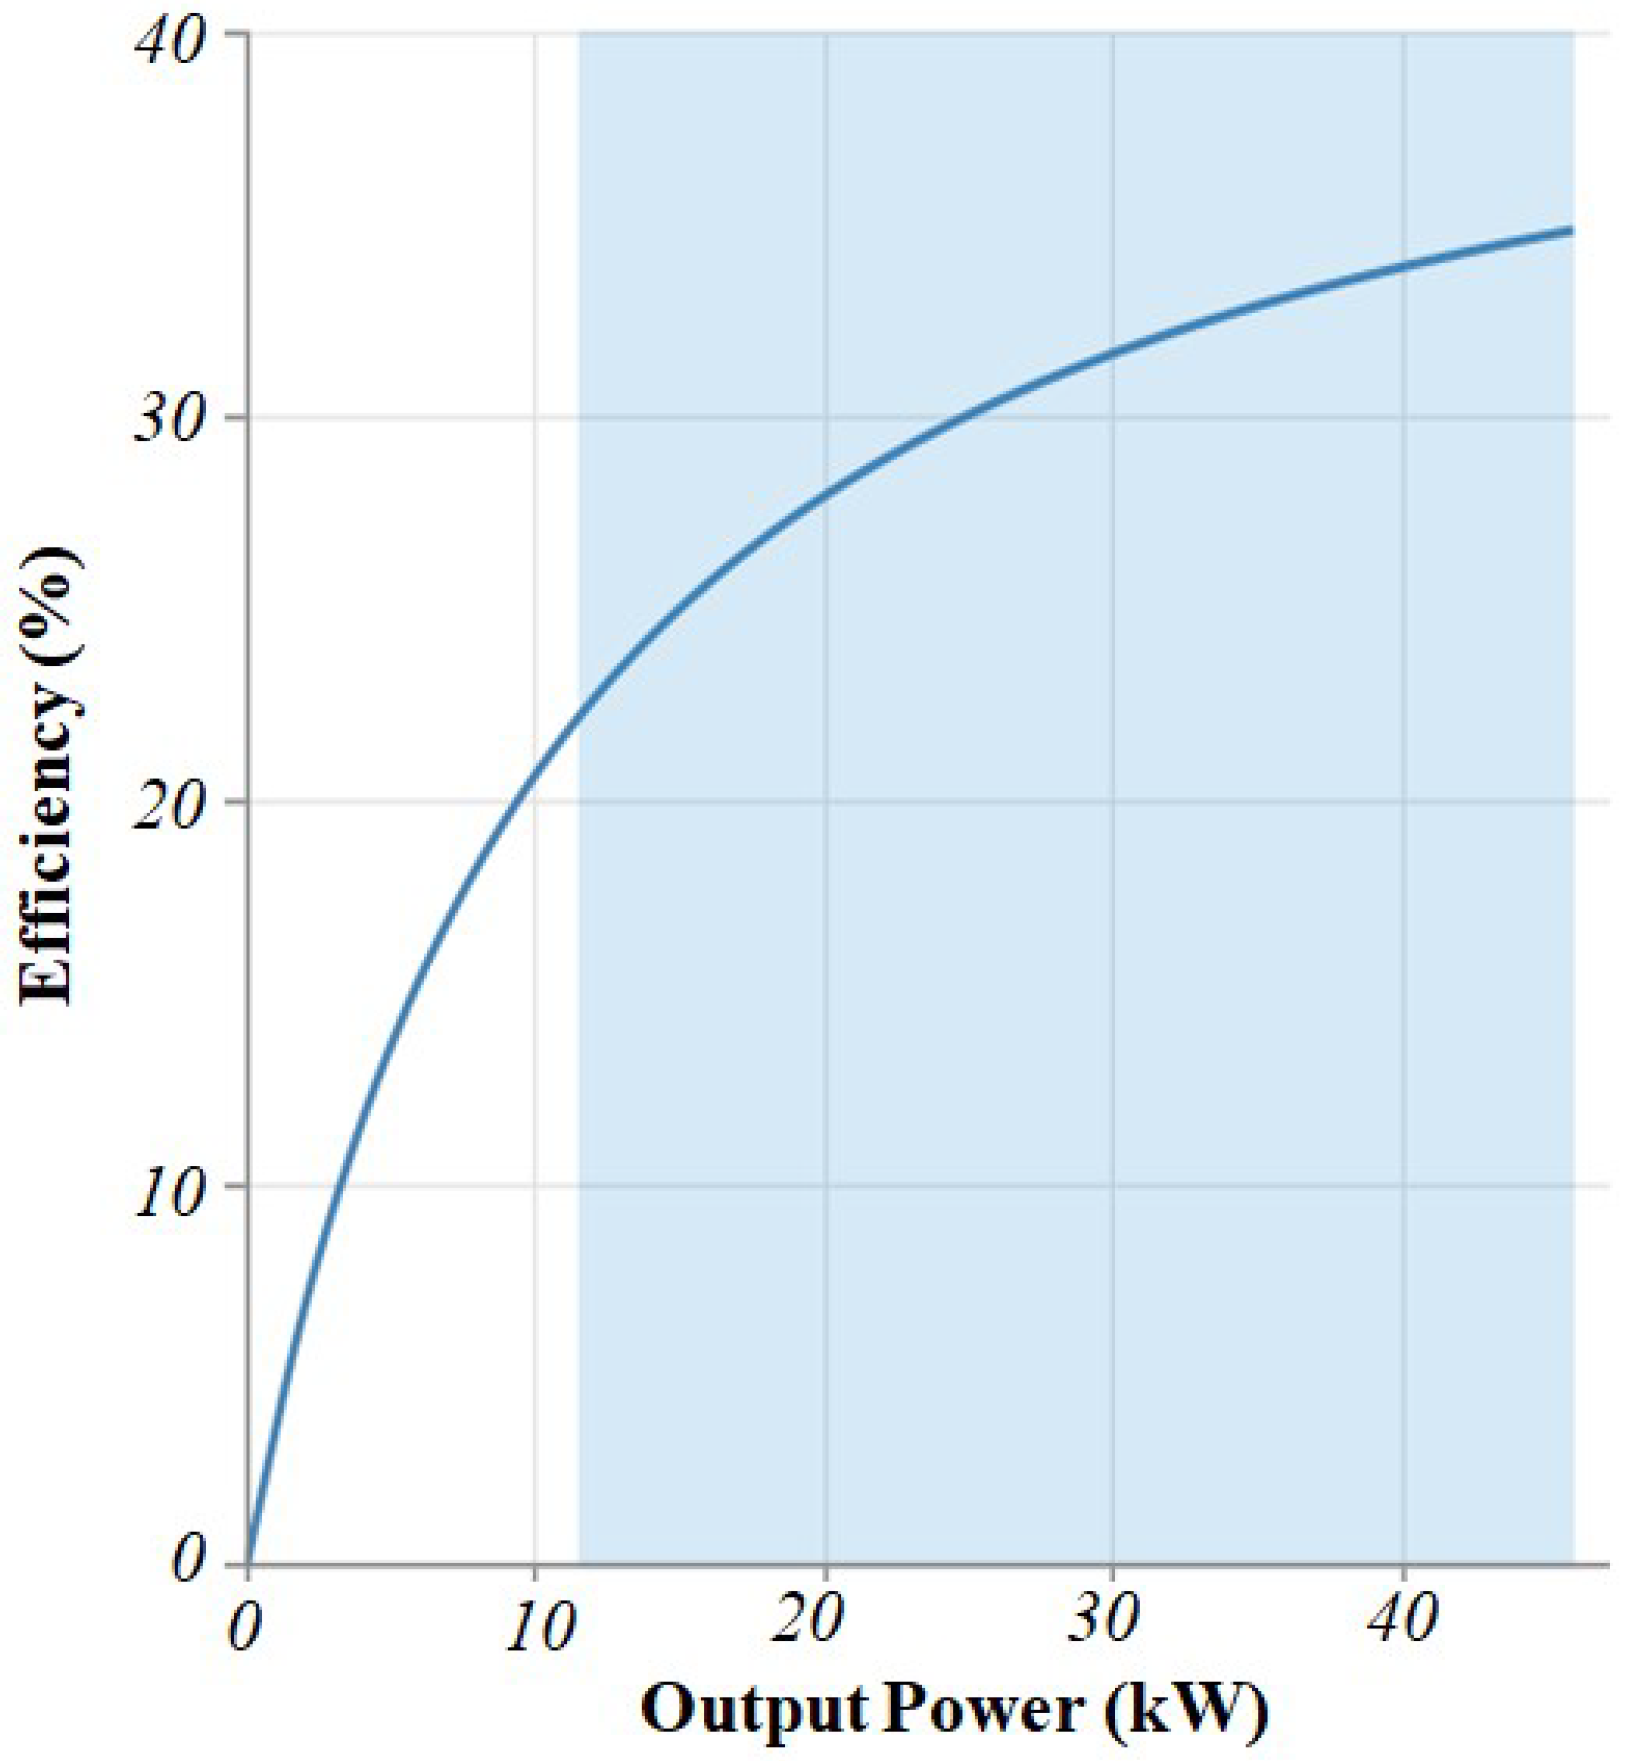
3.5. Converter
3.6. Economic Analysis
3.7. Optimization Problem, Objective Function, Constraints
4. Results and Discussions
4.1. Technical and Economic Analysis
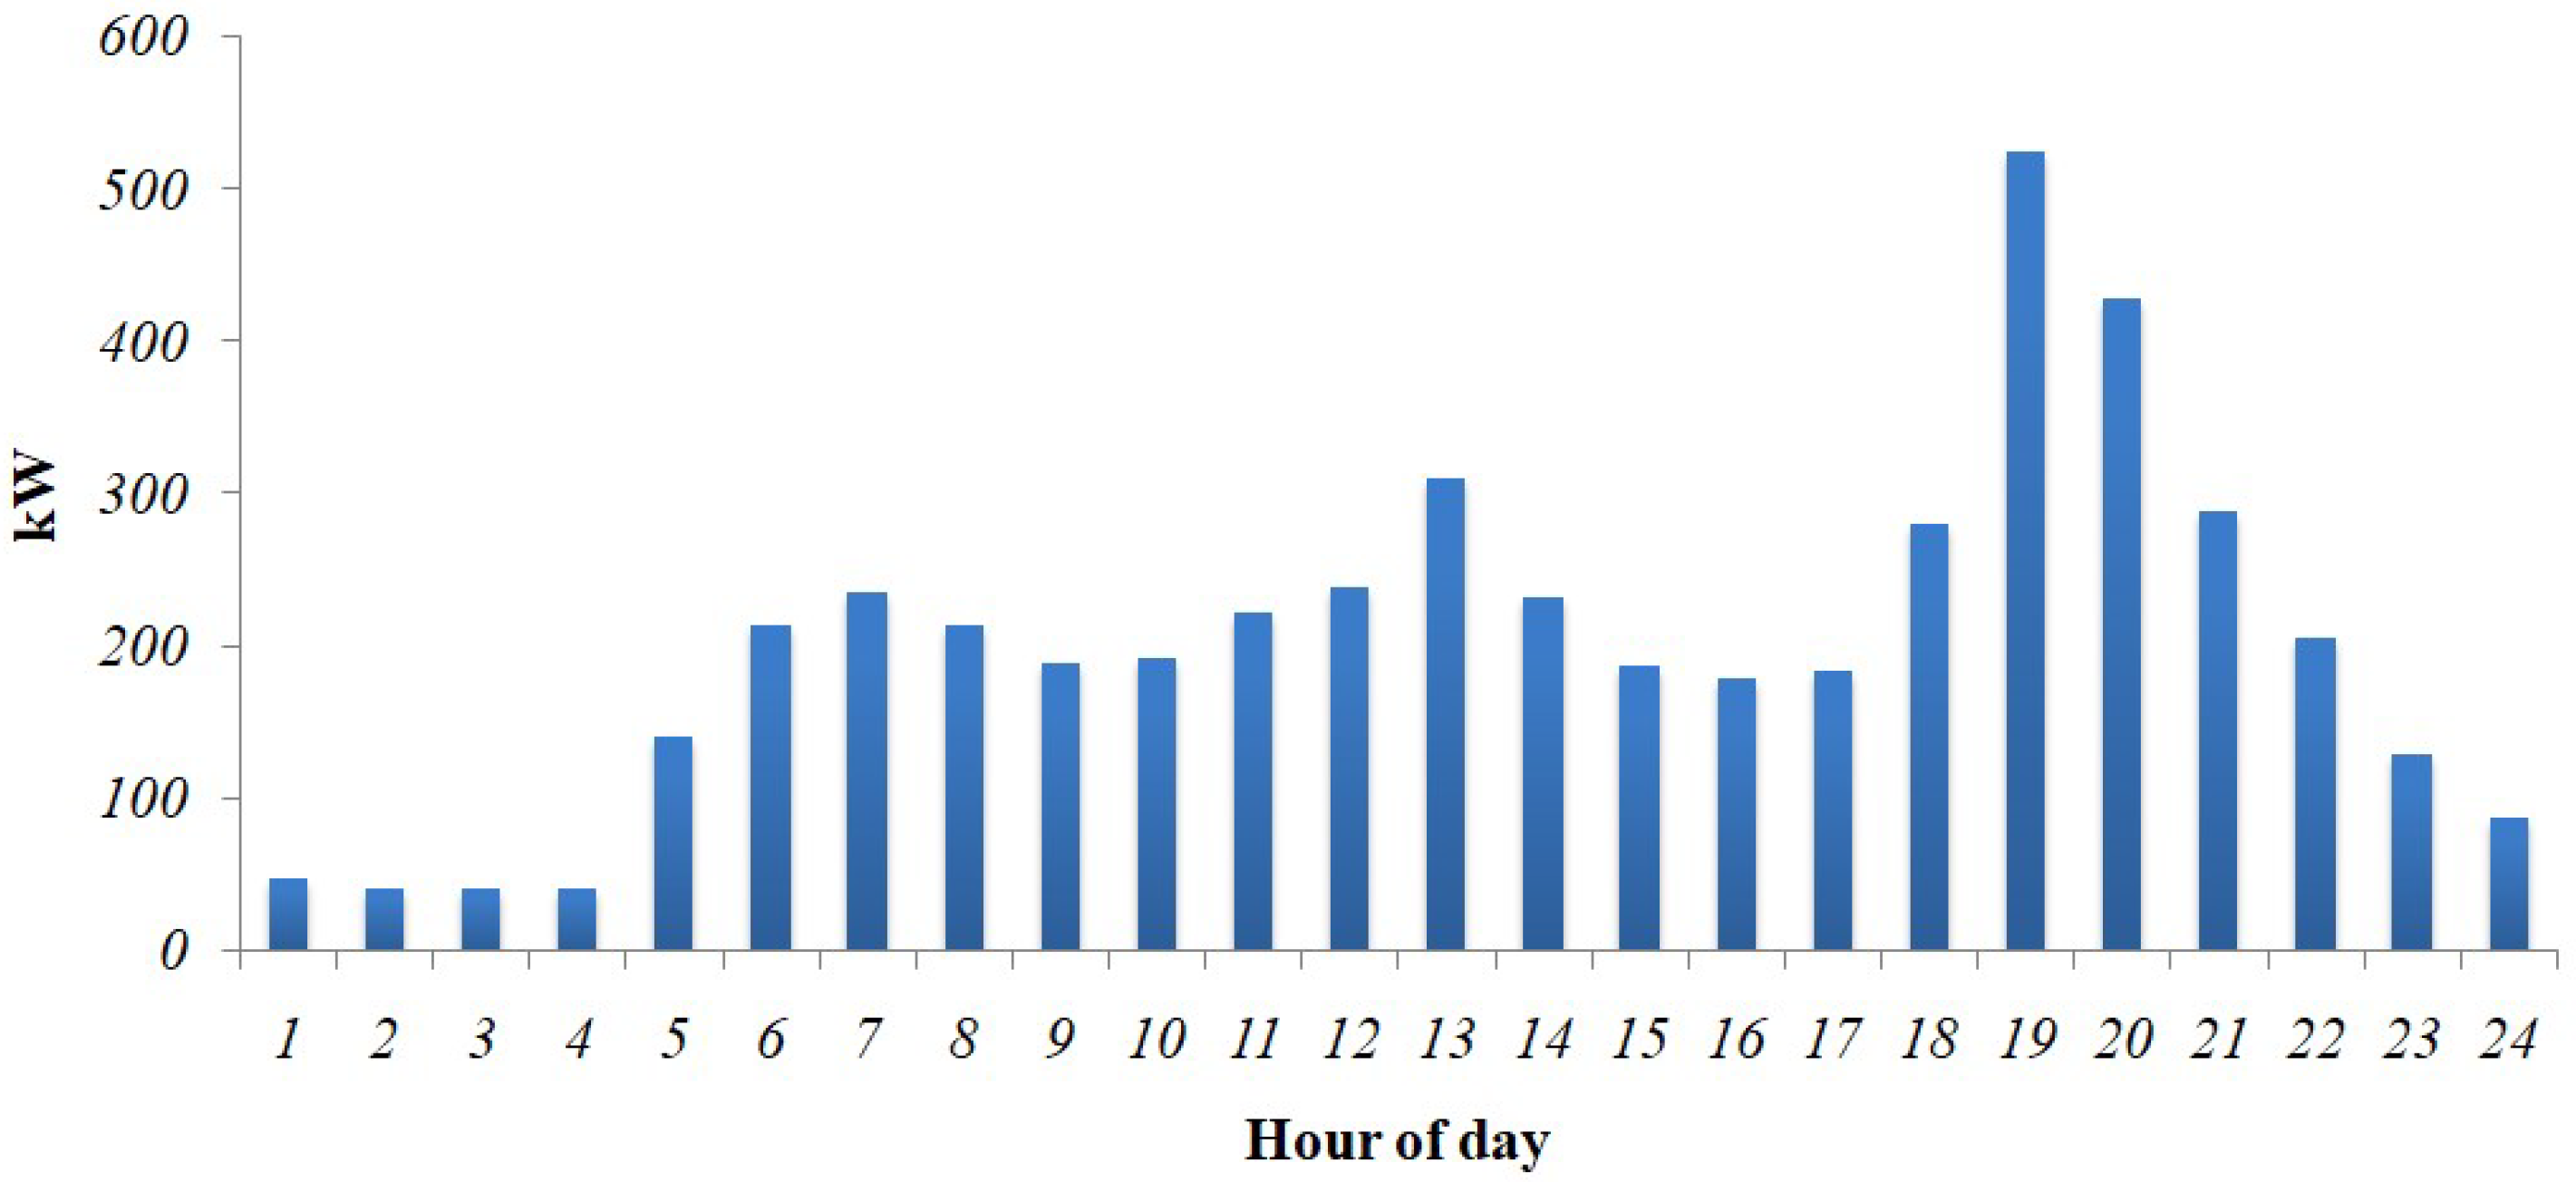
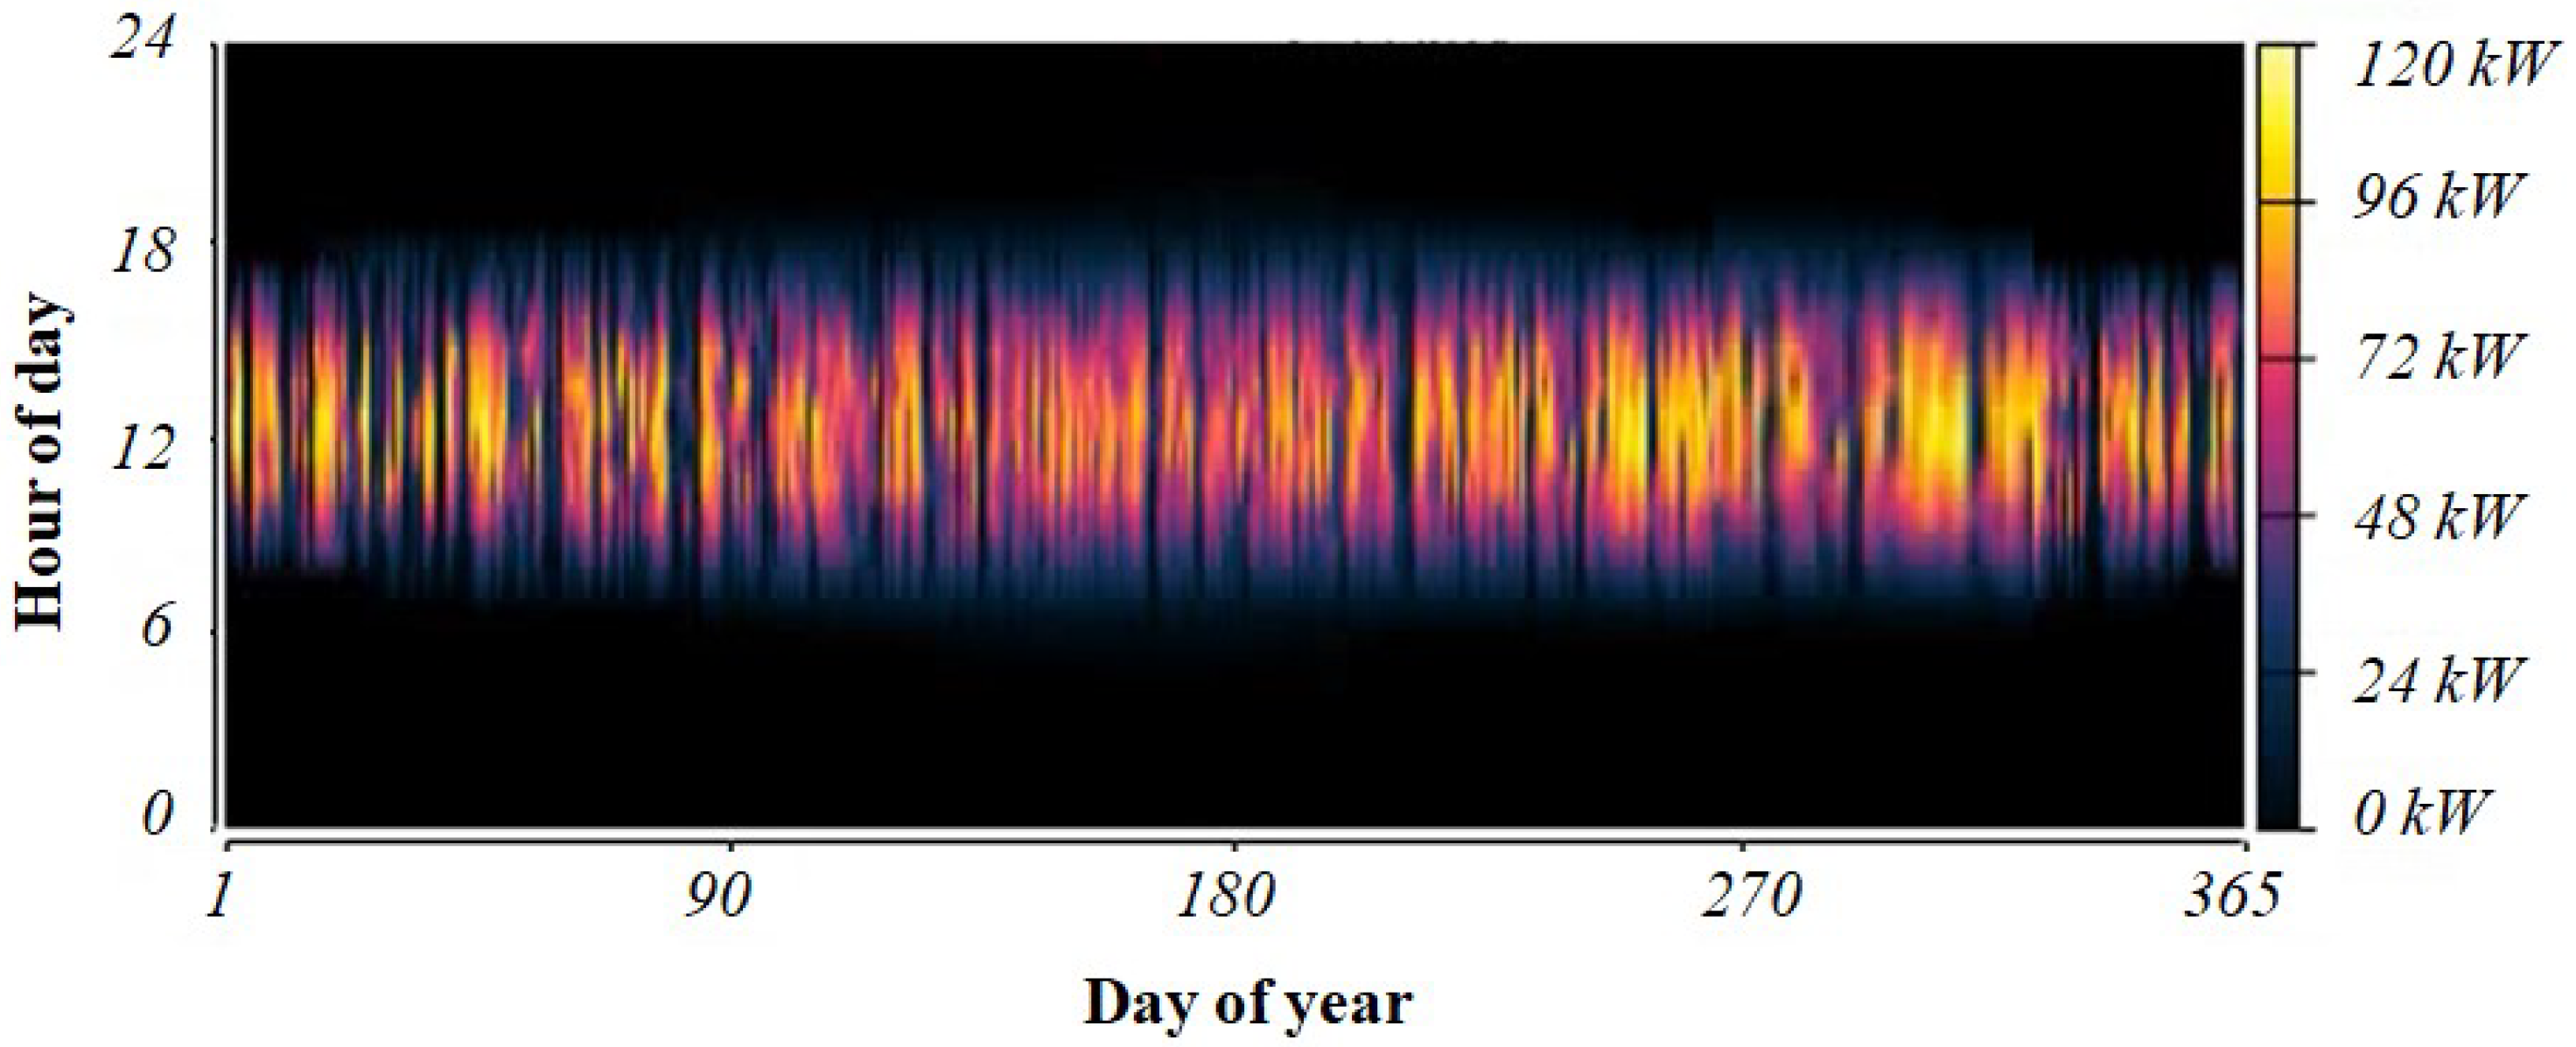
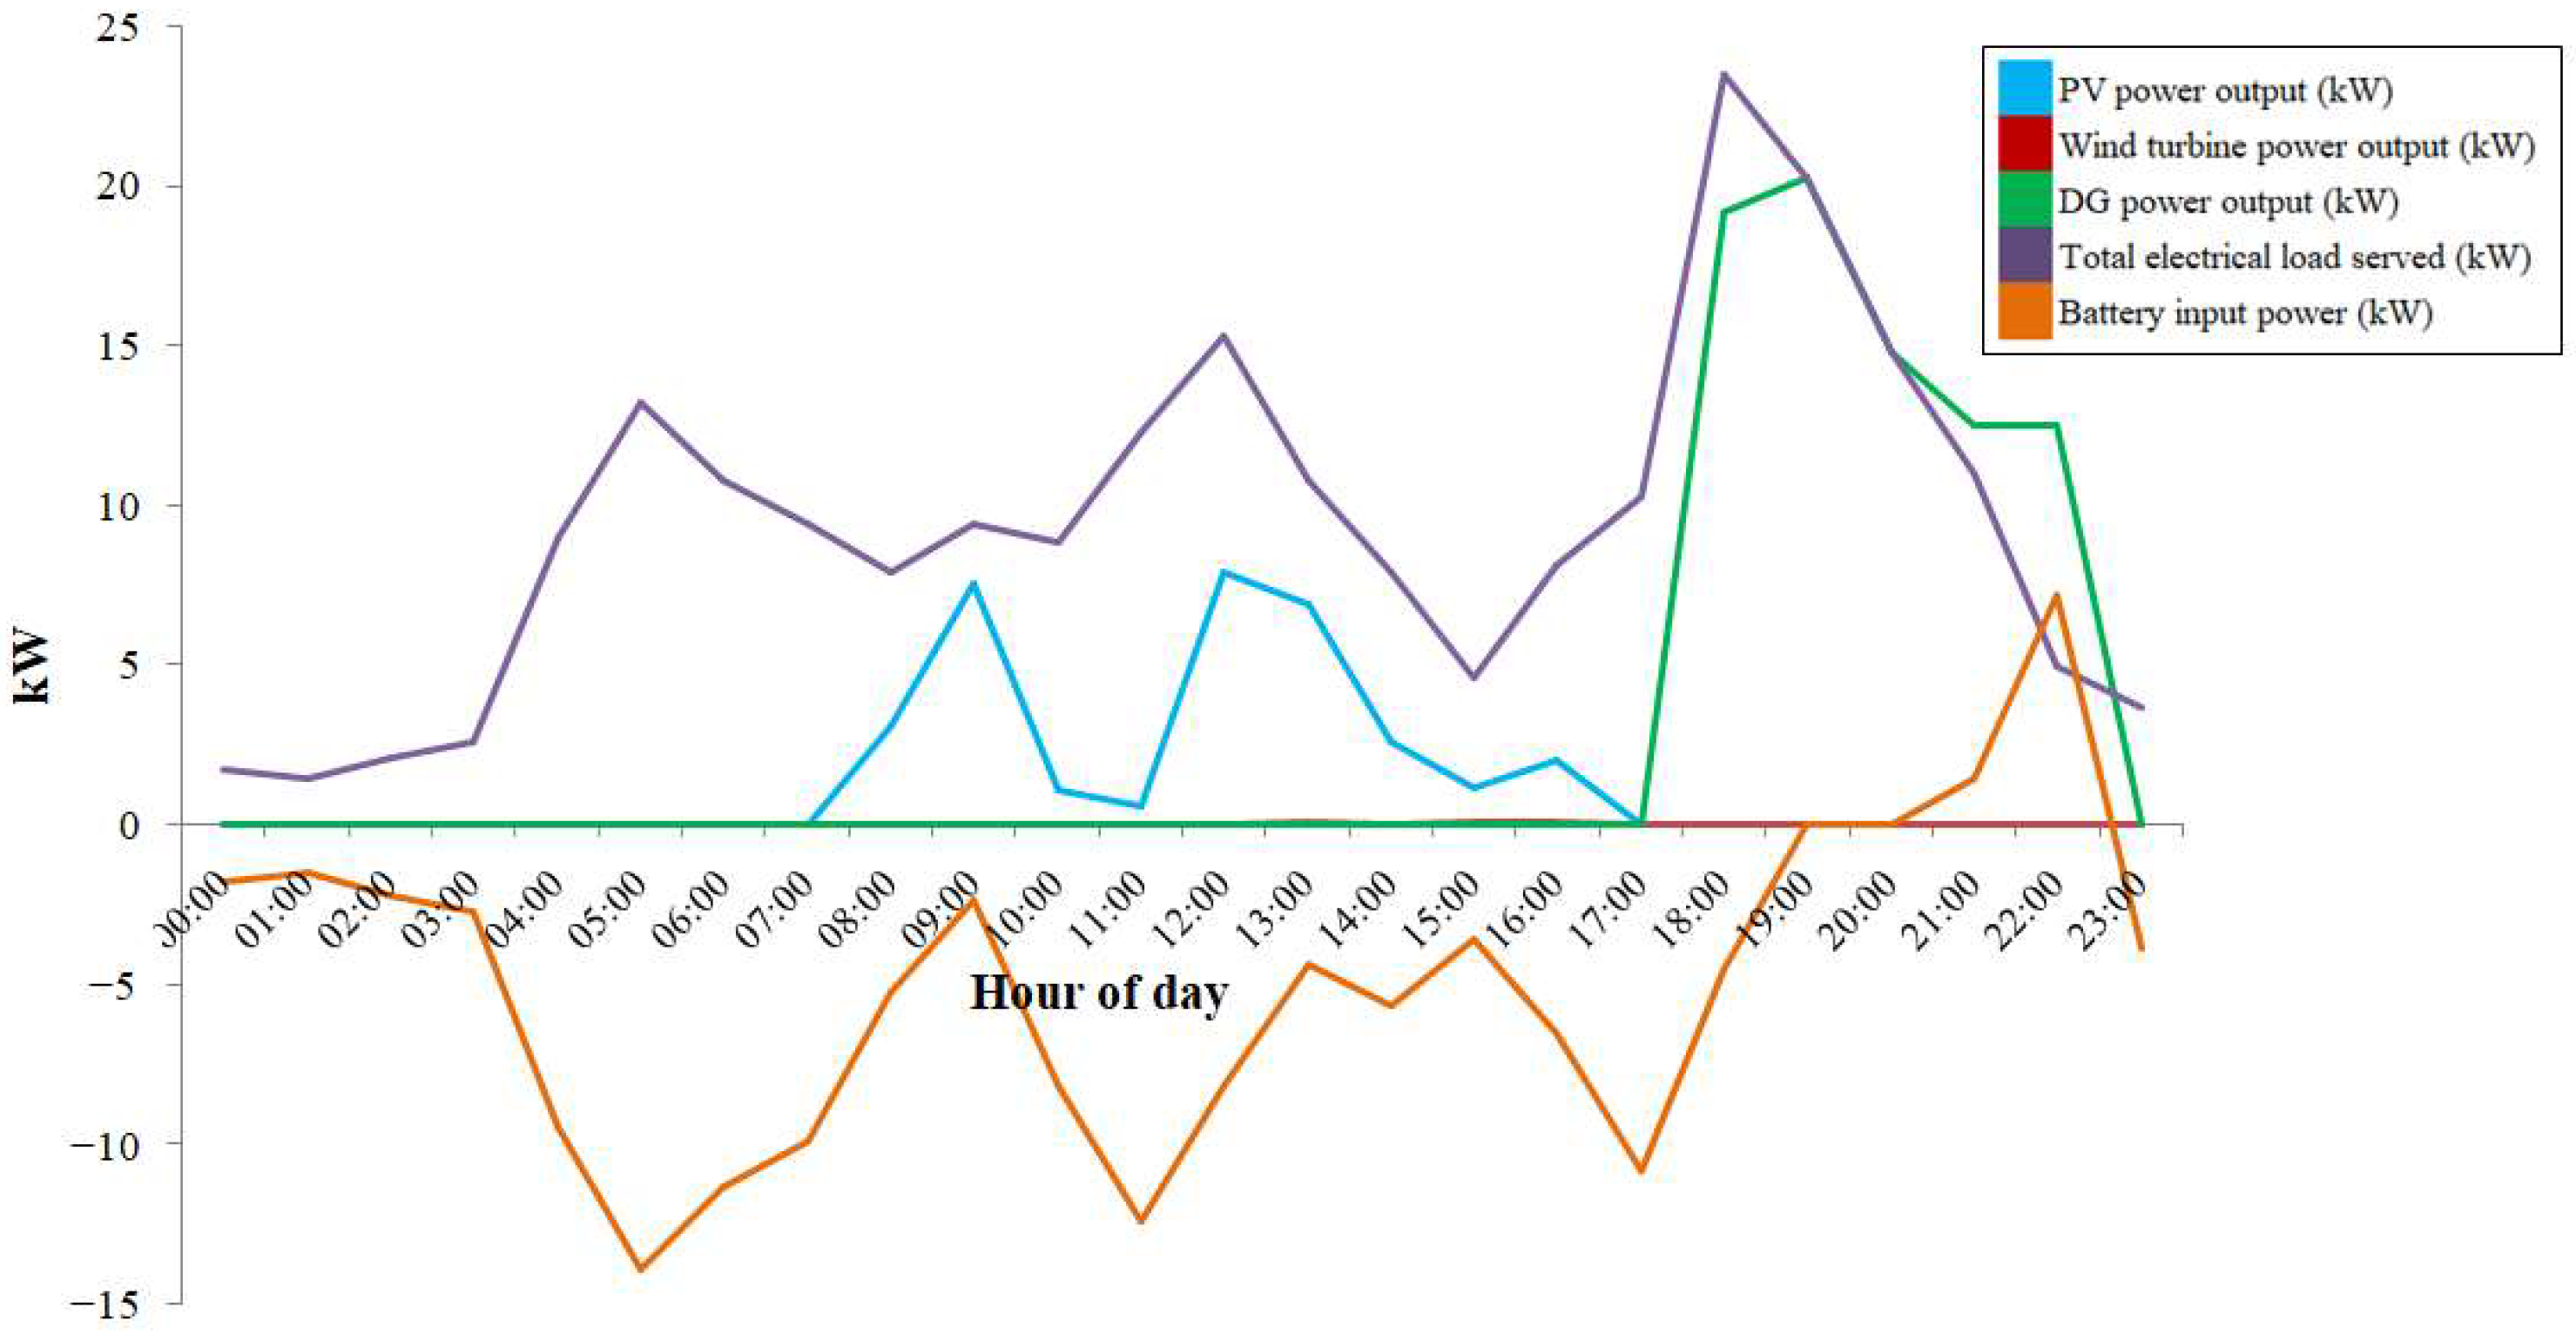
- From hour 0 to the 7th hour, the entire load was served through the energy stored in BSS. PV array, wind turbine, and DG did not operate during this time.
- From the 7th hour to the 17th hour, the load was served through electricity generated from the PV array and the energy stored in BSS. Arise in demand for electricity was experienced during this time. The wind turbine and DG were not operated during this time.
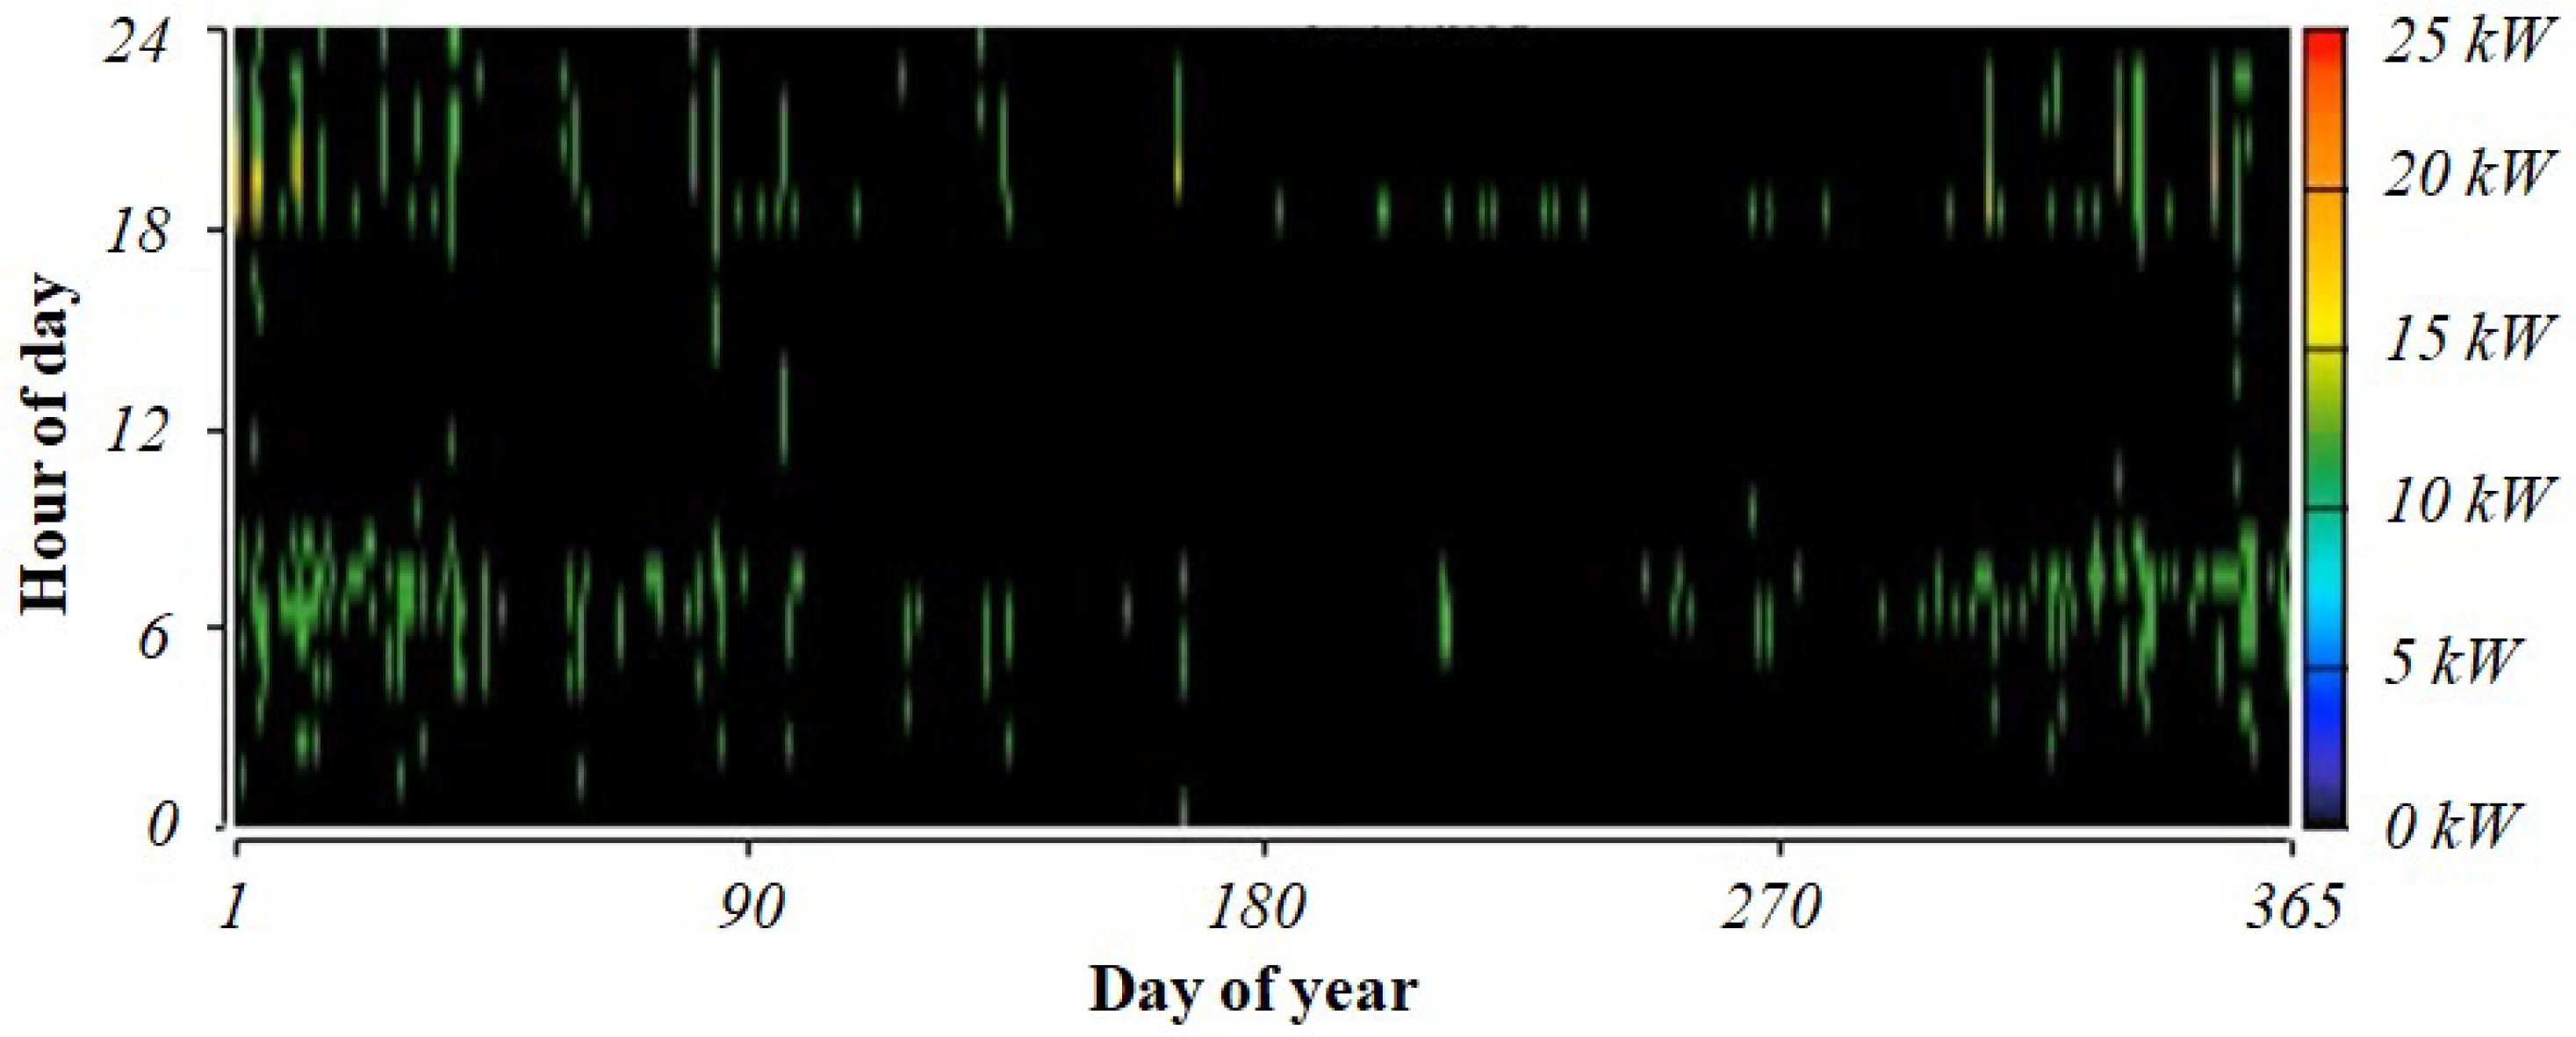
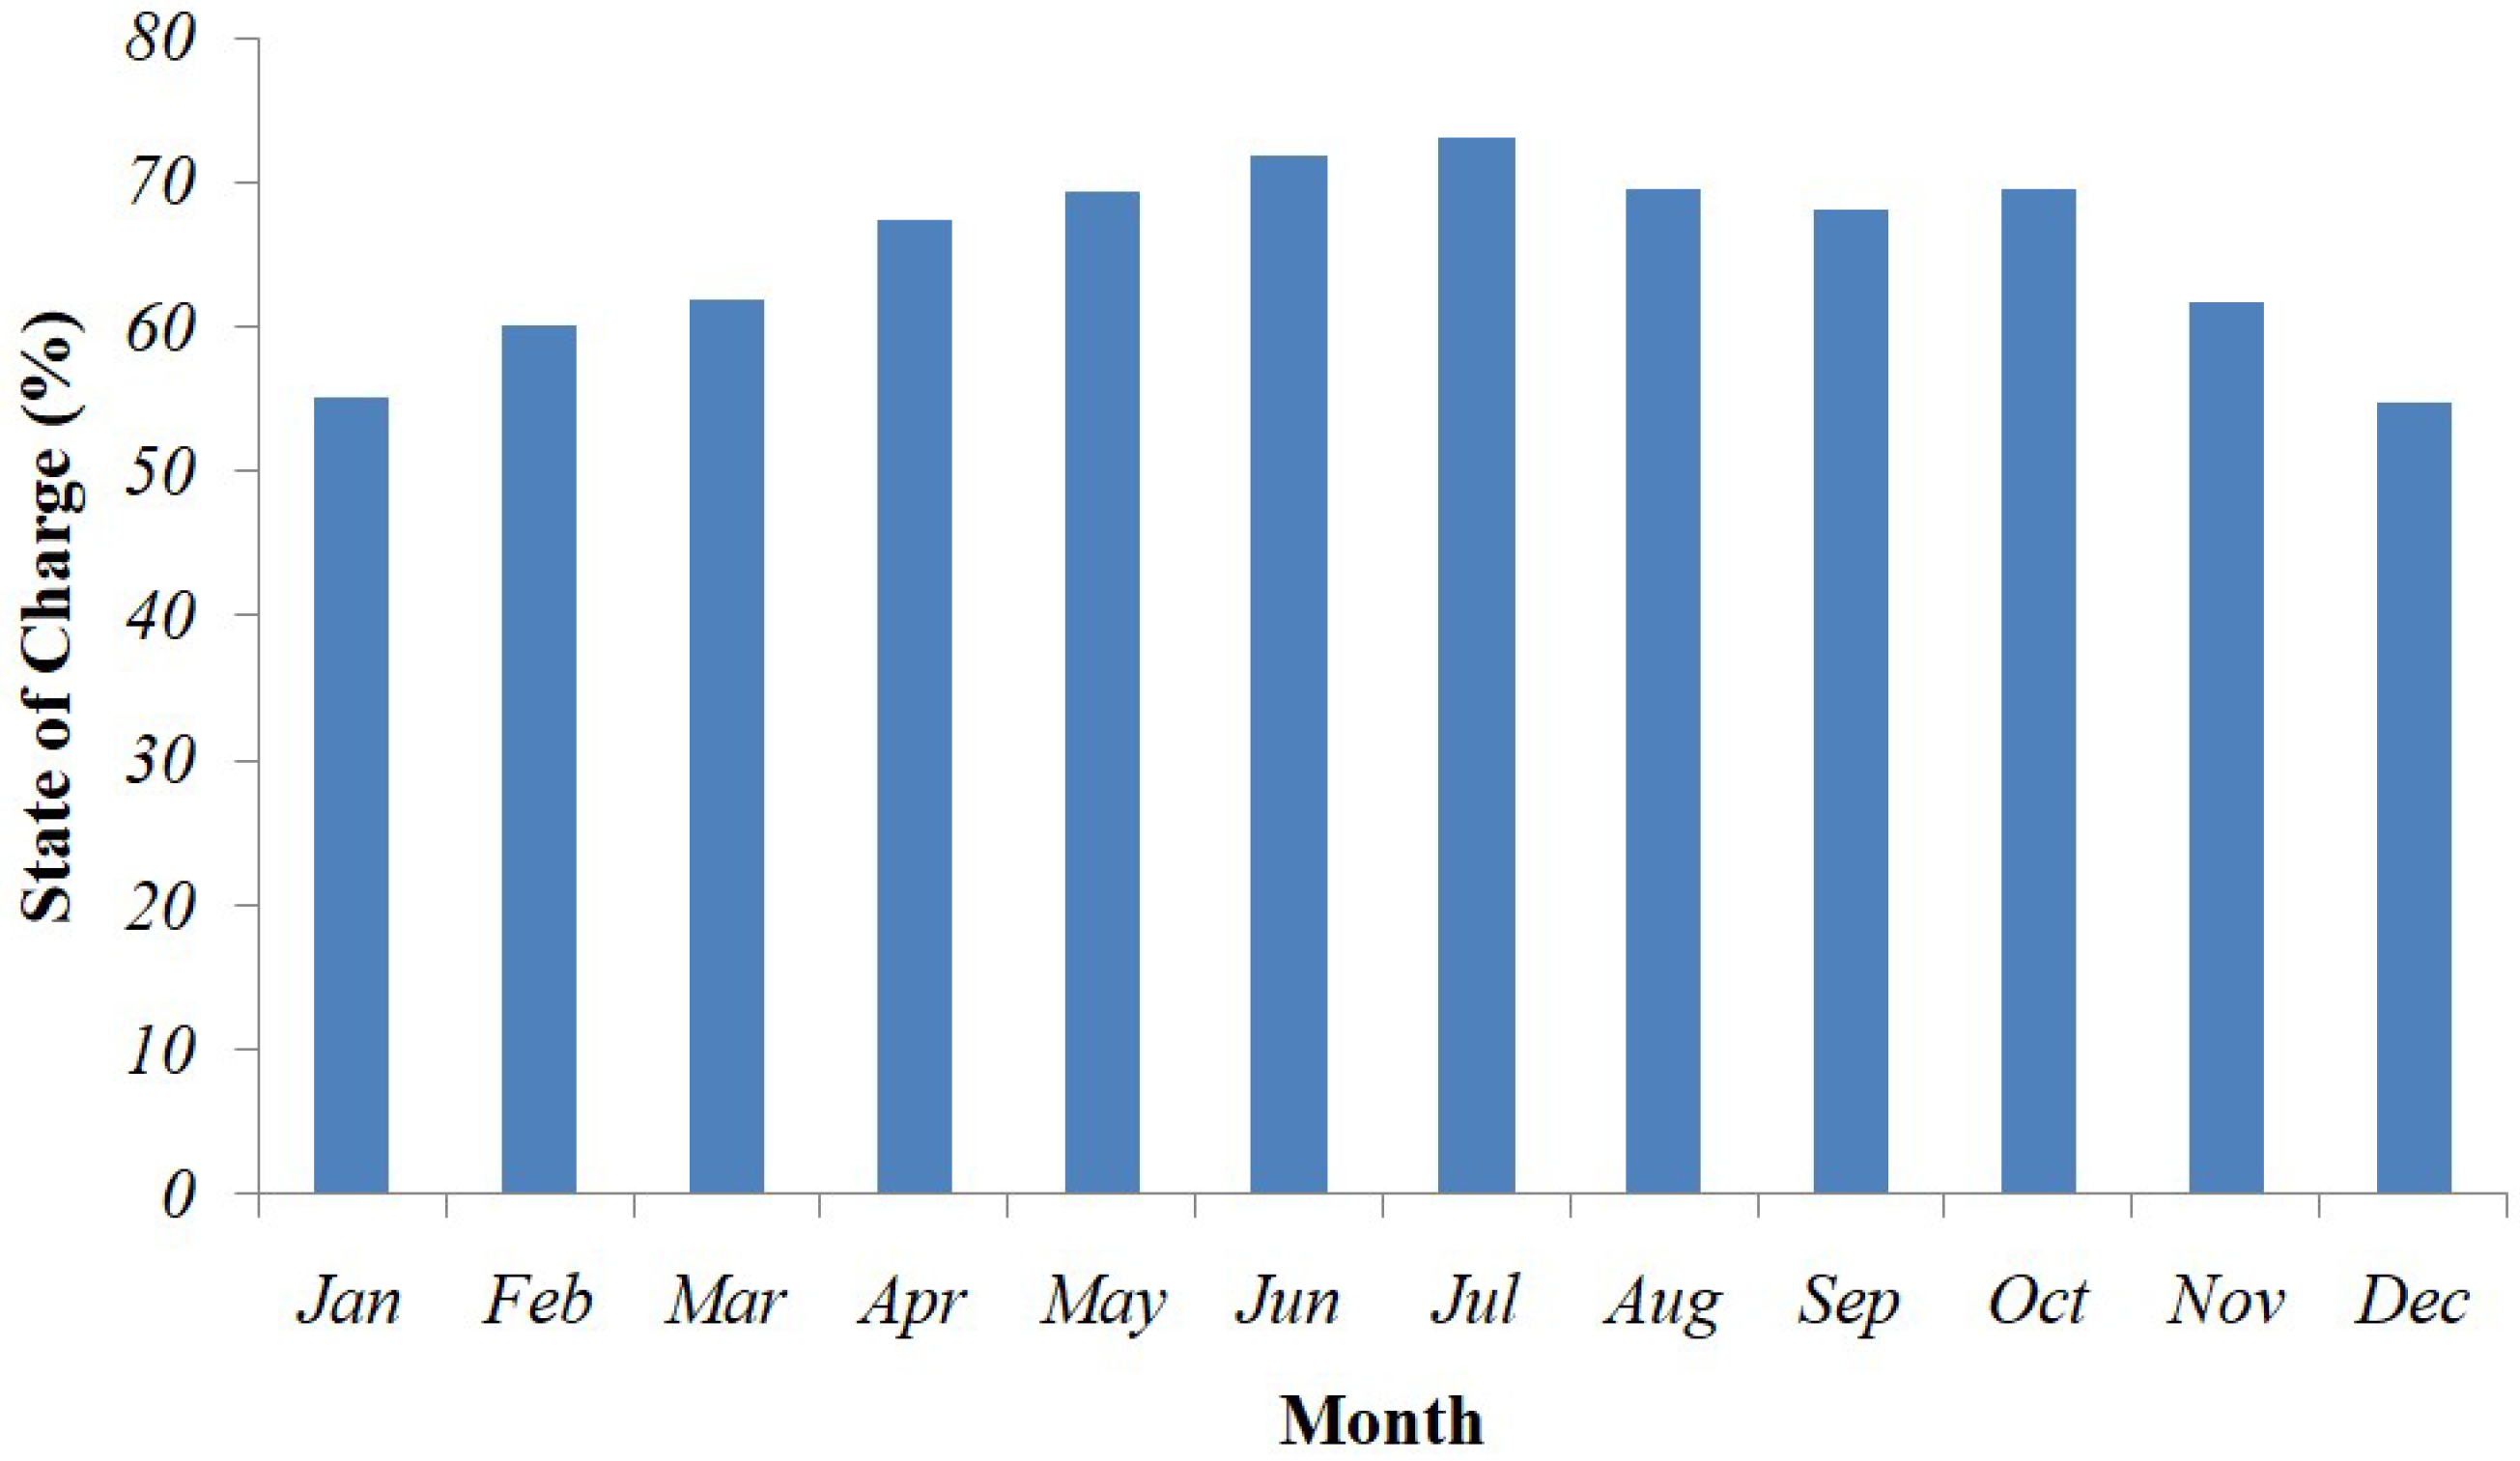
- From the 17th hour to the 20th hour, as PV array could not generate electricity during the evening and night hours, the electricity demand was fulfilled through the operation of DG. The BSS supplied electricity until the 19th hour, and then it discharged. The SOC level of BSS remained at zero from 19th to 20th hours.
- From the 20th hour to the 23rd hour, the demand for electricity decreased, but the load was served through DG only. During this time, the BSS also charged.

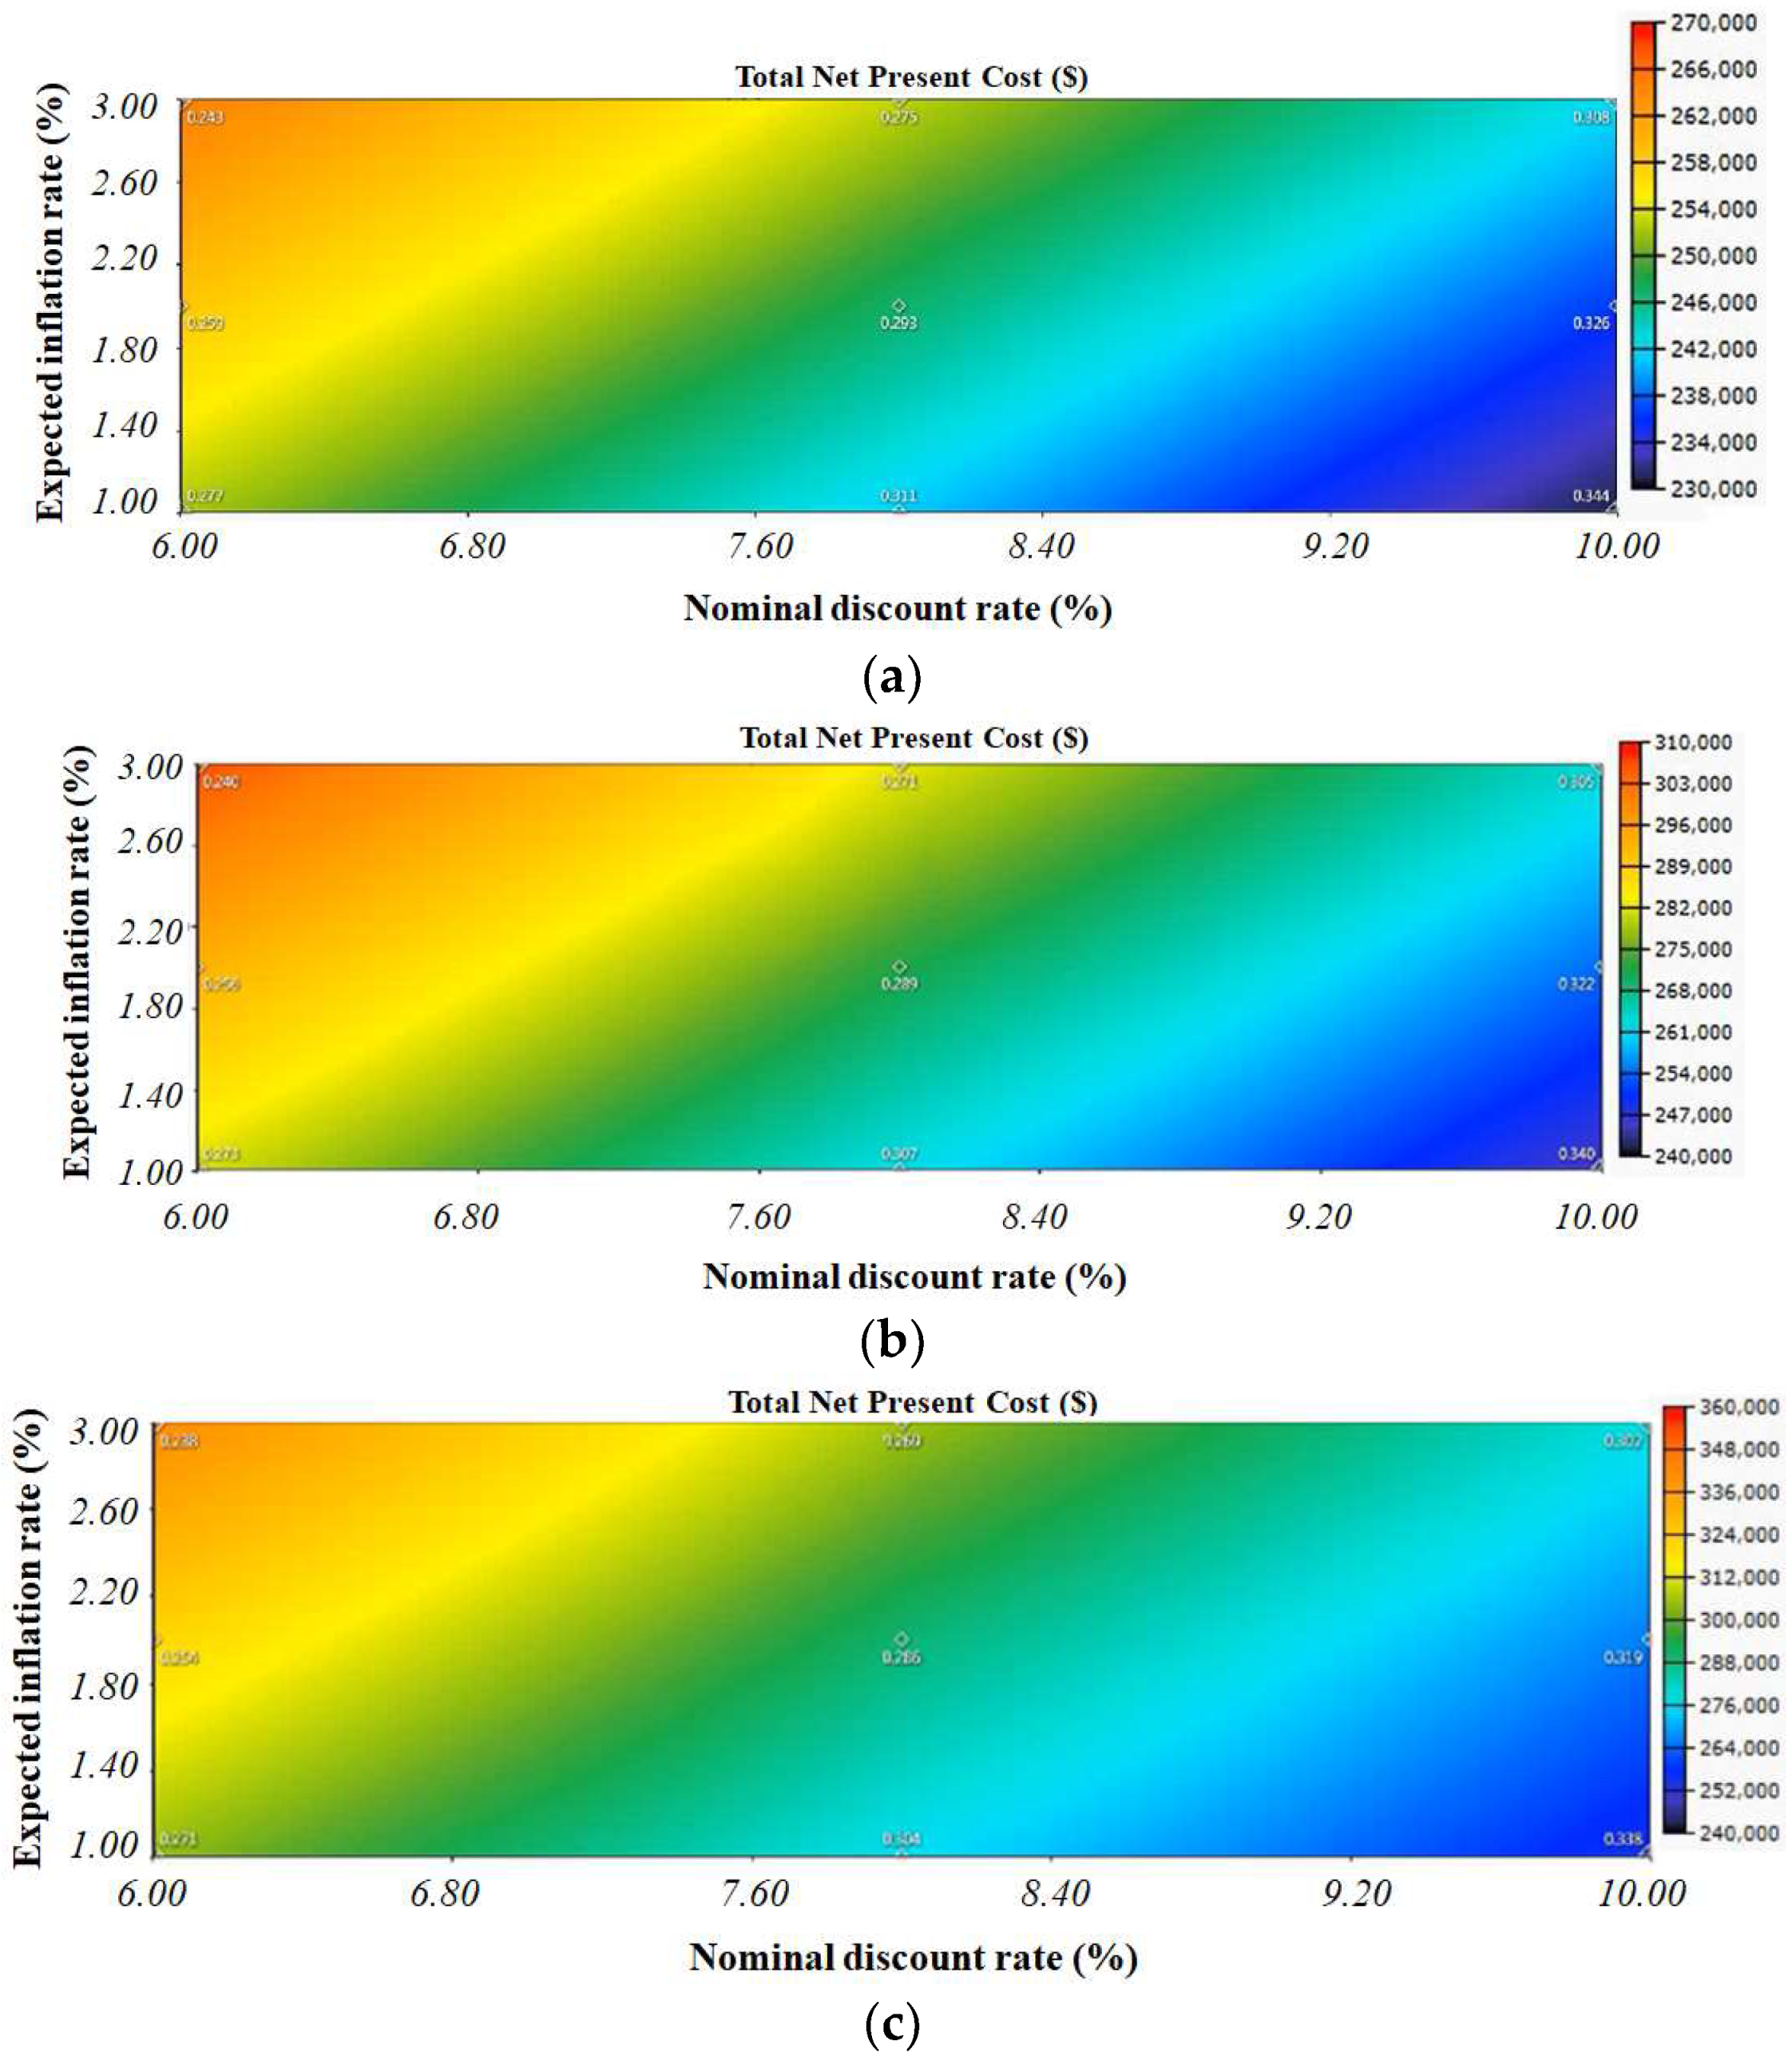
4.2. Sensitivity Analysis
4.3. Comparison of Proposed HPG System with the Base Case
5. Conclusions and Future Prospects
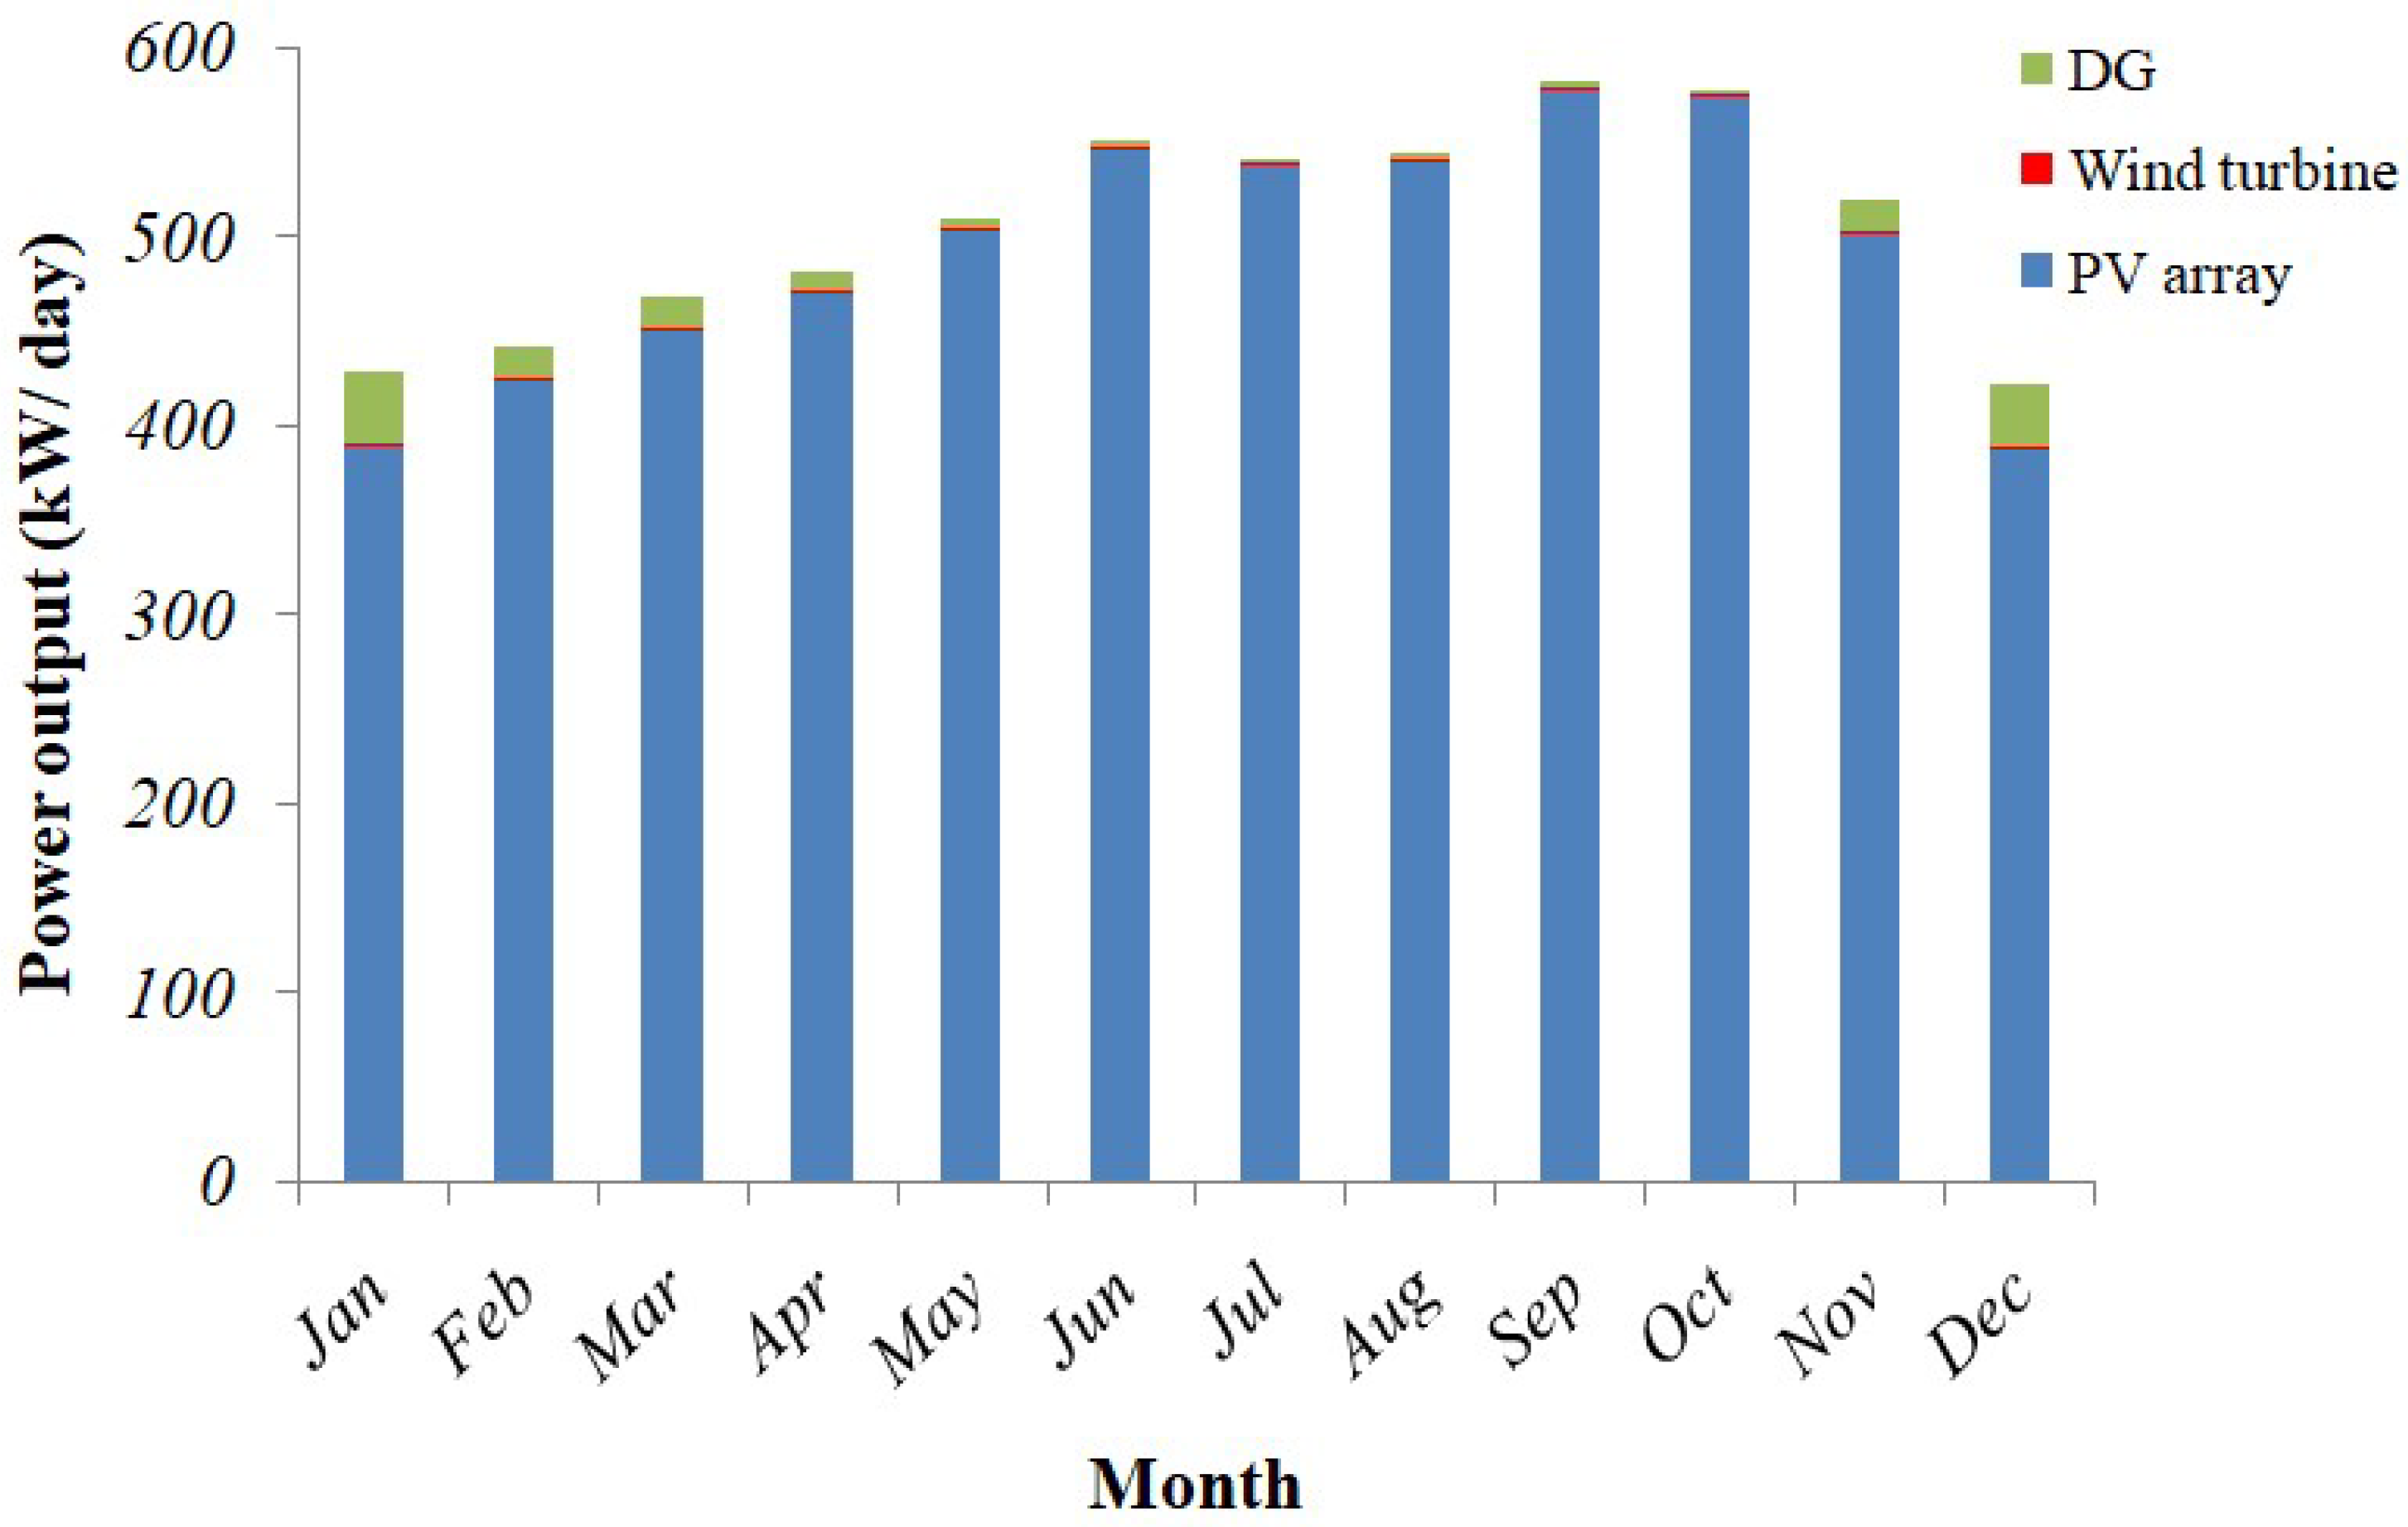
- The configuration of the proposed HPG system had a PV array of 115 kW, wind turbine of 1 kW, DG of 50 kW, BSS with 164 strings of 6V each, and a converter of 31.85 kW. The base case consisted of an isolated DG of 50 kW.
- In the proposed PV-Wind-BSS-DG system, the total net present cost (NPC) of the system was reduced by 74.27%, from $1,081,468 of diesel-based power generation system to $278,176.
- It was observed that the proposed system reduced the cost of energy from $1.14 per kW in the diesel-based base case to $0.29 per kW.
- It was observed that the proposed system reduced the emission of pollutants up to 94.86%, from 168,724.72 kg/year to 8663.14 kg/year.
- A sensitivity analysis was performed, varying project lifetime, inflation rate, and discount rate. NPC and cost of energy were analyzed upon these sensitivity variables.
Author Contributions
Funding
Data Availability Statement
Conflicts of Interest
Appendix A

References
- Ladakh’s Remote Nubra, Zanskar Valleys to Get Connected to National Power Grid. Available online: https://energy.economictimes.indiatimes.com/news/power/ladakhs-remote-nubra-zanskar-valleys-to-get-connected-to-national-power-grid/77737625 (accessed on 25 August 2020).
- Ekonomou, L.; Fotis, G.; Vita, V.; Mladenov, V. Distributed Generation Islanding Effect on Distribution Networks and End User Loads Using the Master-Slave Islanding Method. J. Power Energy Eng. 2016, 4, 1–24. [Google Scholar] [CrossRef]
- Sharma, H.; Pal, N.; Kumar, P.; Yadav, A. A control strategy of hybrid solar-wind energy generation system. Arch. Electr. Eng. 2017, 66, 241–251. [Google Scholar] [CrossRef]
- Kumar, P.; Sharma, H.; Pal, N.; Sadhu, P.K. Comparative Assessment and Obstacles in the Advancement of Renewable Energy in India and China. Probl. Ekorozw. 2019, 14, 191–200. [Google Scholar]
- Power Sector at a Glance ALL INDIA. Available online: https://powermin.gov.in/en/content/power-sector-glance-all-india (accessed on 10 February 2022).
- India May Miss 2030 Renewable Energy Targets as UP, Punjab, Haryana Lag, Say Experts. Available online: https://economictimes.indiatimes.com/industry/renewables/india-may-miss-2030-renewable-energy-targets-as-up-punjab-haryana-lag-say-experts/articleshow/90964081.cms (accessed on 12 May 2022).
- Homer Pro. Available online: https://www.homerenergy.com/products/pro/docs/latest/standard_test_conditions.html (accessed on 14 August 2020).
- India to Have 450 GW Renewable Energy by 2030: President. Available online: https://economictimes.indiatimes.com/small-biz/productline/power-generation/india-to-have-450-gw-renewable-energy-by-2030-president/articleshow/73804463.cms?from=mdr (accessed on 8 June 2022).
- Achieving 2022 Renewable Energy Targets Would Have Averted India’s April Power Crisis. Available online: https://economictimes.indiatimes.com/industry/renewables/achieving-2022-renewable-energy-targets-would-have-averted-indias-april-power-crisis/articleshow/91688224.cms (accessed on 17 July 2022).
- Eze, F.; Ogola, J.; Kivindu, R.; Egbo, M.; Obi, C. Technical and economic feasibility assessment of hybrid renewable energy system at Kenyan institutional building: A case study. Sustain. Energy Technol. Assess. 2022, 51, 101939. [Google Scholar] [CrossRef]
- Kreishan, M.Z.; Fotis, G.; Vita, V.; Ekonomou, L. Distributed Generation Islanding Effect on Distribution Networks and End User Loads Using the Load Sharing Islanding Method. Energies 2016, 9, 956. [Google Scholar] [CrossRef]
- Pepermans, G.; Driesen, J.; Haeseldonckx, D.; Belmans, R.; D’haeseleer, W. Distributed generation: Definition, benefits and issues. Energy Policy 2005, 33, 787–798. [Google Scholar] [CrossRef]
- Kumar, P.; Pal, N.; Sharma, H. Performance analysis and evaluation of 10 kWp of solar photovoltaic array for remote islands of Andaman Nicobar. Sustain. Energy Technol. Assess. 2020, 42, 100889. [Google Scholar] [CrossRef]
- Moustakas, K.; Loizidou, M.; Rehan, M.; Nizami, A.S. A review of recent developments in renewable and sustainable energy systems: Key challenges and future perspective. Renew. Sustain. Energy Rev. 2020, 119, 109418. [Google Scholar] [CrossRef]
- Kumar, R.S.; Raghav, L.P.; Raju, D.K.; Singh, A.R. Customer-oriented energy demand management of grid-connected microgrids. Int. J. Energy Res. 2021, 45, 18695–18712. [Google Scholar] [CrossRef]
- International Renewable Energy Agency. Available online: www.irena.org/newsroom/pressreleases (accessed on 10 August 2020).
- Kumar, A.; Singh, A.R.; Deng, Y.; He, X.; Kumar, P.; Bansal, R.C. Integrated assessment of a sustainable microgrid for a remote village in hilly region. Energy Convers. Manag. 2019, 180, 442–472. [Google Scholar] [CrossRef]
- Ghaithi, H.M.; Fotis, G.; Vita, V. Techno-Economic Assessment of Hybrid Energy off-Grid System—A Case Study for Masirah Island in Oman. Int. J. Power Energy Res. 2017, 11, 103–116. [Google Scholar] [CrossRef]
- Wu, T.; Zhang, H.; Shang, L. Optimal sizing of a grid-connected hybrid renewable energy systems considering hydroelectric storage. Energy Sources A Recovery Util. Environ. Eff. 2020, 1–17. [Google Scholar] [CrossRef]
- Ren, Y.; Yao, X.; Liu, D.; Qiao, R.; Zhang, L.; Zhang, K.; Jin, K.; Li, H.; Ran, Y.; Li, F. Optimal design of hydro-wind-PV multi-energy complementary systems considering smooth power output. Sustain. Energy Technol. Assess. 2022, 50, 101832. [Google Scholar] [CrossRef]
- Maqbool, U.; Tyagi, A.; Tyagi, V.V.; Kothari, R. Optimization of the renewable-energy-based micro-grid for rural electrification in northern region of India. Clean Technol. Environ. Policy 2020, 22, 579–590. [Google Scholar] [CrossRef]
- Suresh, V.; Muralidhar, M.; Kiranmayi, R. Modelling and optimization of an off-grid hybrid renewable energy system for electrification in a rural areas. Energy Rep. 2020, 6, 594–604. [Google Scholar] [CrossRef]
- Vendoti, S.; Muralidhar, M.; Kiranmayi, R. Techno-economic analysis of off-grid solar/wind/biogas/biomass/fuel cell/battery system for electrification in a cluster of villages by HOMER software. Environ. Dev. Sustain. 2020, 23, 351–372. [Google Scholar] [CrossRef]
- Sharma, H.; Pal, N.; Sadhu, P.K. Modeling and Simulation of Off-Grid Power Generation System Using Photovoltaic. Int. J. Power Electron. Drive Syst. (IJPEDS) 2015, 13, 418–424. [Google Scholar] [CrossRef]
- Lotfi, R.; Kargar, B.; Hoseini, S.H.; Nazari, S.; Safavi, S.; Weber, G.-W. Resilience and sustainable supply chain network design by considering renewable energy. Int. J. Energy Res. 2021, 45, 17749–17766. [Google Scholar] [CrossRef]
- Sambhi, S.; Sambhi, S.; Bhadoria, V.S. IoT based optimized and secured ecosystem for energy internet: The state of the art. In Internet of Things in Business Transformation: Developing an Engineering and Business Strategy for Industry 5.0; Scrivener Publishing LLC: Beverly, MA, USA, 2021; pp. 91–126. [Google Scholar] [CrossRef]
- Chambon, C.L.; Karia, T.; Sandwell, P.; Hallett, J.P. Techno-economic assessment of biomass gasification-based mini grids for productive energy applications: The case of rural India. Renew. Energy 2020, 154, 432–444. [Google Scholar] [CrossRef]
- Mehregan, M.; Abbasi, M.; Hashemian, S.M. Technical, economic and environmental analyses of combined heat and power (CHP) system with hybrid prime mover and optimization using genetic algorithm. Sustain. Energy Technol. Assess. 2022, 49, 101697. [Google Scholar] [CrossRef]
- Yadav, D.; Singh, N.; Bhadoria, V.S. Comparison of MPPTAlgorithms in Stand-Alone Photovoltaic (PV) System on Resistive Load. In Machine Intelligence and Smart Systems; Agrawal, S., Kumar Gupta, K., Chan, J.H., Agrawal, J., Gupta, M., Eds.; Algorithms for Intelligent Systems; Springer: Singapore, 2021. [Google Scholar] [CrossRef]
- Sharma, H.; Pal, N.; Singh, Y.; Sadhu, P.K. Development and Simulation of Stand Alone Photovoltaic Model Using Matlab/Simulink. Int. J. Power Electron. Drive Syst. 2015, 6, 703. [Google Scholar] [CrossRef]
- Cai, W.; Li, X.; Maleki, A.; Pourfayaz, F.; Rosen, M.A.; Nazari, M.A.; Bui, D.T. Optimal sizing and location based on economic parameters for an off-grid application of a hybrid system with photovoltaic, battery and diesel technology. Energy 2020, 201, 117480. [Google Scholar] [CrossRef]
- Ndwali, P.K.; Njiri, J.G.; Wanjiru, E.M. Optimal Operation Control of Microgrid Connected Photovoltaic-Diesel Generator Backup System Under Time of Use Tariff. J. Control Autom. Electr. Syst. 2020, 31, 1001–1014. [Google Scholar] [CrossRef]
- Hoseinzadeh, S.; Garcia, D.A. Techno-economic assessment of hybrid energy flexibility systems for islands’ decarbonization: A case study in Italy. Sustain. Energy Technol. Assess. 2022, 51, 101929. [Google Scholar] [CrossRef]
- Fotis, G.; Dikeakos, C.; Zafeiropoulos, E.; Pappas, S.; Vita, V. Scalability and Replicability for Smart Grid Innovation Projects and the Improvement of Renewable Energy Sources Exploitation: The FLEXITRANSTORE Case. Energies 2022, 15, 4519. [Google Scholar] [CrossRef]
- Ao, H.X.; Eftekhari, M.; Aungkulanon, P.; Almutairi, K.; Mostafaeipour, A. Impact of economic and government investment in residential solar power plant on energy system sustainability. Sustain. Energy Technol. Assess. 2022, 52 Pt A, 102050. [Google Scholar] [CrossRef]
- Das, U.; Nandi, C.; Bhattacharjee, S.; Mandal, S. Energy Impacts on Climate Change: Issues, Challenges and Solutions with Clean Conversion Technology. In Climate Change in the Mediterranean and Middle Eastern Region; Leal Filho, W., Manolas, E., Eds.; Climate Change Management; Springer: Cham, Switzerland, 2022. [Google Scholar] [CrossRef]
- Pravin, P.S.; Luo, Z.; Li, L.; Wang, X. Learning-based scheduling of industrial hybrid renewable energy systems. Comput. Chem. Eng. 2022, 159, 107665. [Google Scholar] [CrossRef]
- Yadav, R.K.; Bhadoria, V.S.; Hrisheekesha, P.N. Technical and Financial Assessment of a Grid Connected Solar PV Net Metering System for Residential Community. In Proceedings of the 2019 2nd International Conference on Power Energy, Environment and Intelligent Control (PEEIC), Greater Noida, India, 18–19 October 2019; pp. 299–303. [Google Scholar] [CrossRef]
- Zhang, L.; Li, S.; Hu, Y.; Nie, Q. Economic optimization of a bioenergy-based hybrid renewable energy system under carbon policies—From the life-cycle perspective. Appl. Energy 2022, 310, 118599. [Google Scholar] [CrossRef]
- The Solar Quarterly. Available online: https://bookstore.teri.res.in/docs/magazines/TSQ_Jan%202011_(Part2).pdf (accessed on 5 August 2020).
- Ladakh Climate. Available online: https://www.thethirdpole.net/2018/09/25/climate-ladakh-agriculture (accessed on 5 August 2020).
- Sherwani, A.F.; Asjad, M.; Haleem, A. Performance evaluation of solar photovoltaic electricity-generating systems: An Indian perspective. Int. J. Sustain. Eng. 2019, 12, 70–75. [Google Scholar] [CrossRef]
- Ramesh, M.; Saini, R.P. Dispatch strategies based performance analysis of a hybrid renewable energy system for a remote rural area in India. J. Clean. Prod. 2020, 259, 120697. [Google Scholar] [CrossRef]
- Ar’evalo, P.; Benavides, D.; Lata-García, J.; Jurado, F. Energy control and size optimization of a hybrid system (photovoltaic- hydrokinetic) using various storage technologies. Sustain. Cities Soc. 2020, 52, 101773. [Google Scholar] [CrossRef]
- Aziz, A.S.; Tajuddin, M.F.N.; Hussain, M.K.; Adzman, M.R.; Ghazali, N.H.; Ramli, M.A.; Zidane, T.E.K. A new optimization strategy for wind/diesel/battery hybrid energy system. Energy 2021, 239, 122458. [Google Scholar] [CrossRef]
- Ahamed, A.; Fayaz, R.M.R.; Vibahar, S.; Purusothaman, M.; Gurudevan, P.R. Optimization of Hybrid Microgrid of Renewable Energy Efficiency Using Homer Software. Rev. Gestão Inovação Tecnol. 2021, 11, 3427–3441. [Google Scholar] [CrossRef]
- Kapoor, S.; Sharma, A.K. Techno-economic analysis by homer-pro approach of solar on-grid system for Fatehpur-Village, India. J. Phys. Conf. Ser. 2021, 2070, 012146. [Google Scholar] [CrossRef]
- Chaurasia, R.; Gairola, S.; Pal, Y. Technical, economic, and environmental performance comparison analysis of a hybrid renewable energy system based on power dispatch strategies. Sustain. Energy Technol. Assess. 2022, 53 Pt D, 102787. [Google Scholar] [CrossRef]
- Adewumi, O.B.; Fotis, G.; Vita, V.; Nankoo, D.; Ekonomou, L. The Impact of Distributed Energy Storage on Distribution and Transmission Networks’ Power Quality. Appl. Sci. 2022, 12, 6466. [Google Scholar] [CrossRef]
- Alzahrani, A.M.; Zohdy, M.; Yan, B. An Overview of Optimization Approaches for Operation of Hybrid Distributed Energy Systems with Photovoltaic and Diesel Turbine Generator. Electr. Power Syst. Res. 2021, 191, 106877. [Google Scholar] [CrossRef]
- Ram, K.; Swain, P.K.; Vallabhaneni, R.; Kumar, A. Critical assessment on application of software for designing hybrid energy systems. Mater. Today Proc. 2022, 49 Pt 2, 425–432. [Google Scholar] [CrossRef]
- Fathima, A.H.; Palanisamy, K. Optimization in microgrids with hybrid energy systems—A review. Renew. Sustain. Energy Rev. 2015, 45, 431–446. [Google Scholar] [CrossRef]
- Kumar, P.; Pal, N.; Sharma, H. Optimization and techno-economic analysis of a solar photo-voltaic/biomass/diesel/battery hybrid off-grid power generation system for rural remote electrification in eastern India. Energy 2022, 247, 123560. [Google Scholar] [CrossRef]
- Zafeiropoulou, M.; Mentis, I.; Sijakovic, N.; Terzic, A.; Fotis, G.; Maris, T.I.; Vita, V.; Zoulias, E.; Ristic, V.; Ekonomou, L. Forecasting Transmission and Distribution System Flexibility Needs for Severe Weather Condition Resilience and Outage Management. Appl. Sci. 2022, 12, 7334. [Google Scholar] [CrossRef]
- Climate Turtuk (India). Available online: https://en.climate-data.org/asia/india/jammu-and-kashmir/turtuk-565427/ (accessed on 10 August 2021).
- Razmjoo, A.; Shirmohammadi, R.; Davarpanah, A.; Pourfayaz, F.; Aslani, A. Stand-alone hybrid energy systems for remote area power generation. Energy Rep. 2019, 5, 231–241. [Google Scholar] [CrossRef]
- Sijakovic, N.; Terzic, A.; Fotis, G.; Mentis, I.; Zafeiropoulou, M.; Maris, T.I.; Zoulias, E.; Elias, C.; Ristic, V.; Vita, V. Active System Management Approach for Flexibility Services to the Greek Transmission and Distribution System. Energies 2022, 15, 6134. [Google Scholar] [CrossRef]
- Wang, Y.; Hu, Q.; Li, L.; Foley, A.; Srinivasan, D. Approaches to wind power curve modeling: A review and discussion. Renew. Sustain. Energy Rev. 2019, 116, 109422. [Google Scholar] [CrossRef]
- Homer Pro 3.15. Available online: https://www.homerenergy.com/products/pro/docs/latest/index.html (accessed on 14 August 2020).
- Bruen, T.; Marco, J. Modelling and experimental evaluation of parallel connected lithium ion cells for an electric vehicle battery system. J. Power Sources 2016, 310, 91–101. [Google Scholar] [CrossRef]
- DG Set System. Available online: https://beeindia.gov.in/sites/default/files/3Ch9.pdf (accessed on 15 September 2020).
- Petrol Diesel Price. Available online: https://www.petroldieselprice.com/petrol-diesel-price-in-Leh (accessed on 26 November 2021).
- Bhadoria, V.S.; Pachauri, R.K.; Tiwari, S.; Jaiswal, S.P.; Alhelou, H.H. Investigation of Different BPD Placement Topologies for Shaded Modules in a Series-Parallel Configured PV Array. IEEE Access 2020, 8, 216911–216921. [Google Scholar] [CrossRef]
- Capacity Shortage Constraint. Available online: https://www.homerenergy.com/products/pro/docs/latest/capacity_shortage.html (accessed on 19 November 2022).
- Niyonteze, J.D.D.; Zou, F.; Asemota, G.N.O.; Bimenyimana, S.; Shyirambere, G. Key technology development needs and applicability analysis of renewable energy hybrid technologies in off-grid areas for the Rwanda power sector. Heliyon 2020, 6, e03300. [Google Scholar] [CrossRef]
- Leithon, J.; Werner, S.; Koivunen, V. Cost-aware renewable energy management: Centralized vs. distributed generation. Renew. Energy 2020, 147, 1164–1179. [Google Scholar] [CrossRef]
- Gebrehiwot, K.; Mondal, A.H.; Ringler, C.; Gebremeskel, A.G. Optimization and cost-benefit assessment of hybrid power systems for off-grid rural electrification in Ethiopia. Energy 2019, 177, 234–246. [Google Scholar] [CrossRef]
- Razmjoo, A.; Kaigutha, L.G.; Rad, M.V.; Marzband, M.; Davarpanah, A.; Denai, M. Technical analysis investigating energy sustainability utilizing reliable renewable energy sources to reduce CO2 emissions in a high potential area. Renew. Energy 2021, 164, 46–57. [Google Scholar] [CrossRef]
- Li, J.; Liu, P.; Li, Z. Optimal design and techno-economic analysis of a solar-wind-biomass off-grid hybrid power system for remote rural electrification: A case study of west China. Energy 2020, 208, 118387. [Google Scholar] [CrossRef]
- Zhang, G.; Xiao, C.; Razmjooy, N. Optimal Operational Strategy of Hybrid PV/Wind Renewable Energy System Using Homer: A Case Study. Int. J. Ambient Energy 2021, 43, 3953–3966. [Google Scholar] [CrossRef]
- Odou, O.D.T.; Bhandari, R.; Adamou, R. Hybrid off-grid renewable power system for sustainable rural electrification in Benin. Renew. Energy 2020, 145, 1266–1279. [Google Scholar] [CrossRef]
- Babaei, R.; Ting, S.-K.D.; Carriveau, R. Feasibility and optimal sizing analysis of stand-alone hybrid energy systems coupled with various battery technologies: A case study of Pelee Island. Energy Rep. 2022, 8, 4747–4762. [Google Scholar] [CrossRef]
- Das, S.; Ray, A.; De, S. Optimum combination of renewable resources to meet local power demand in distributed generation: A case study for a remote place of India. Energy 2020, 209, 118473. [Google Scholar] [CrossRef]
- Murty, V.V.V.S.N.; Kumar, A. Optimal Energy Management and Techno-economic Analysis in Microgrid with Hybrid Renewable Energy Sources. J. Mod. Power Syst. Clean Energy 2020, 8, 929–940. [Google Scholar] [CrossRef]
- Sambhi, S.; Sharma, H.; Kumar, P.; Fotis, G.; Vita, V.; Ekonomou, L. Techno-Economic Optimization of an Off-Grid Hybrid Power Generation for SRM IST, Delhi-NCR Campus. Energies 2022, 15, 7880. [Google Scholar] [CrossRef]


| Load | Power (Watts) | Quantity | Usage Hours | Total Load (kWh) |
|---|---|---|---|---|
| TV | 70 | 1 | 3 | 0.21 |
| CFL light | 25 | 1 | 9 | 0.225 |
| LED light | 10 | 2 | 10 | 0.2 |
| Mobile charging point | 3 | 1 | 6 | 0.018 |
| Radio | 2 | 1 | 6 | 0.012 |
| Total load for one household | 0.665 kWh/day | |||
| Total load for 300 households | 199.5 kWh/day | |||
| Description | Value |
|---|---|
| Manufacturer | Generic |
| Rated capacity (kW) | 1 |
| Hub height (m) | 17 |
| Capital cost ($/kW) | 5000 |
| Replacement cost ($/kW) | 5000 |
| O&M cost ($/year) | 50 |
| Lifetime (years) | 25 |
| Description | Value |
|---|---|
| Nominal voltage (V) | 6 |
| Nominal capacity (kWh) | 1 |
| Maximum charge current (A) | 167 |
| Estimated throughput (kWh) | 3000 |
| Capital cost ($/kWh) | 500 |
| Replacement cost ($/kWh) | 455 |
| Lifetime (years) | 10 |
| Description | Value |
|---|---|
| Fuel | Diesel |
| Capacity (kW) | 1 |
| Capital cost ($/kW) | 665 |
| Replacement cost ($/kW) | 535 |
| O&M cost ($/hour) | 0.027 |
| Fuel price ($/litre) | 1.18 |
| Lifetime (hours) | 15,000 |
| Architecture | Cost | |||||||
|---|---|---|---|---|---|---|---|---|
| PV Array (kW) | Wind Turbine (kW) | Diesel Generator (kW) | Li-Ion Battery (kWh) | Converter (kW) | NPC ($) | Cost of Energy ($/kWh) | Operating Cost ($/year) | Initial Capital ($) |
| 115 | 1 | 50 | 164 | 32 | 278,176 | 0.29 | 7542 | 180,672 |
| 369 | 219 | 42 | 384,750 | 0.40 | 7253 | 290,983 | ||
| 370 | 1 | 218 | 42 | 389,860 | 0.41 | 7275 | 295,818 | |
| 50 | 60 | 39 | 629,078 | 0.66 | 43,186 | 70,786 | ||
| 1 | 50 | 58 | 41 | 634,618 | 0.67 | 43,275 | 75,176 | |
| 253 | 50 | 21 | 874,726 | 0.92 | 55,580 | 156,220 | ||
| 216 | 1 | 50 | 21 | 880,339 | 0.93 | 56,969 | 143,870 | |
| 50 | 1,081,468 | 1.14 | 81,084 | 33,250 | ||||
| 1 | 50 | 0 | 1,087,169 | 1.15 | 81,134 | 38,307 | ||
| Total solutions simulated: 133,156 | ||||||||
| Feasible solutions | 98,110 | |||||||
| Infeasible solutions due to capacity shortage constraint | 35,046 | |||||||
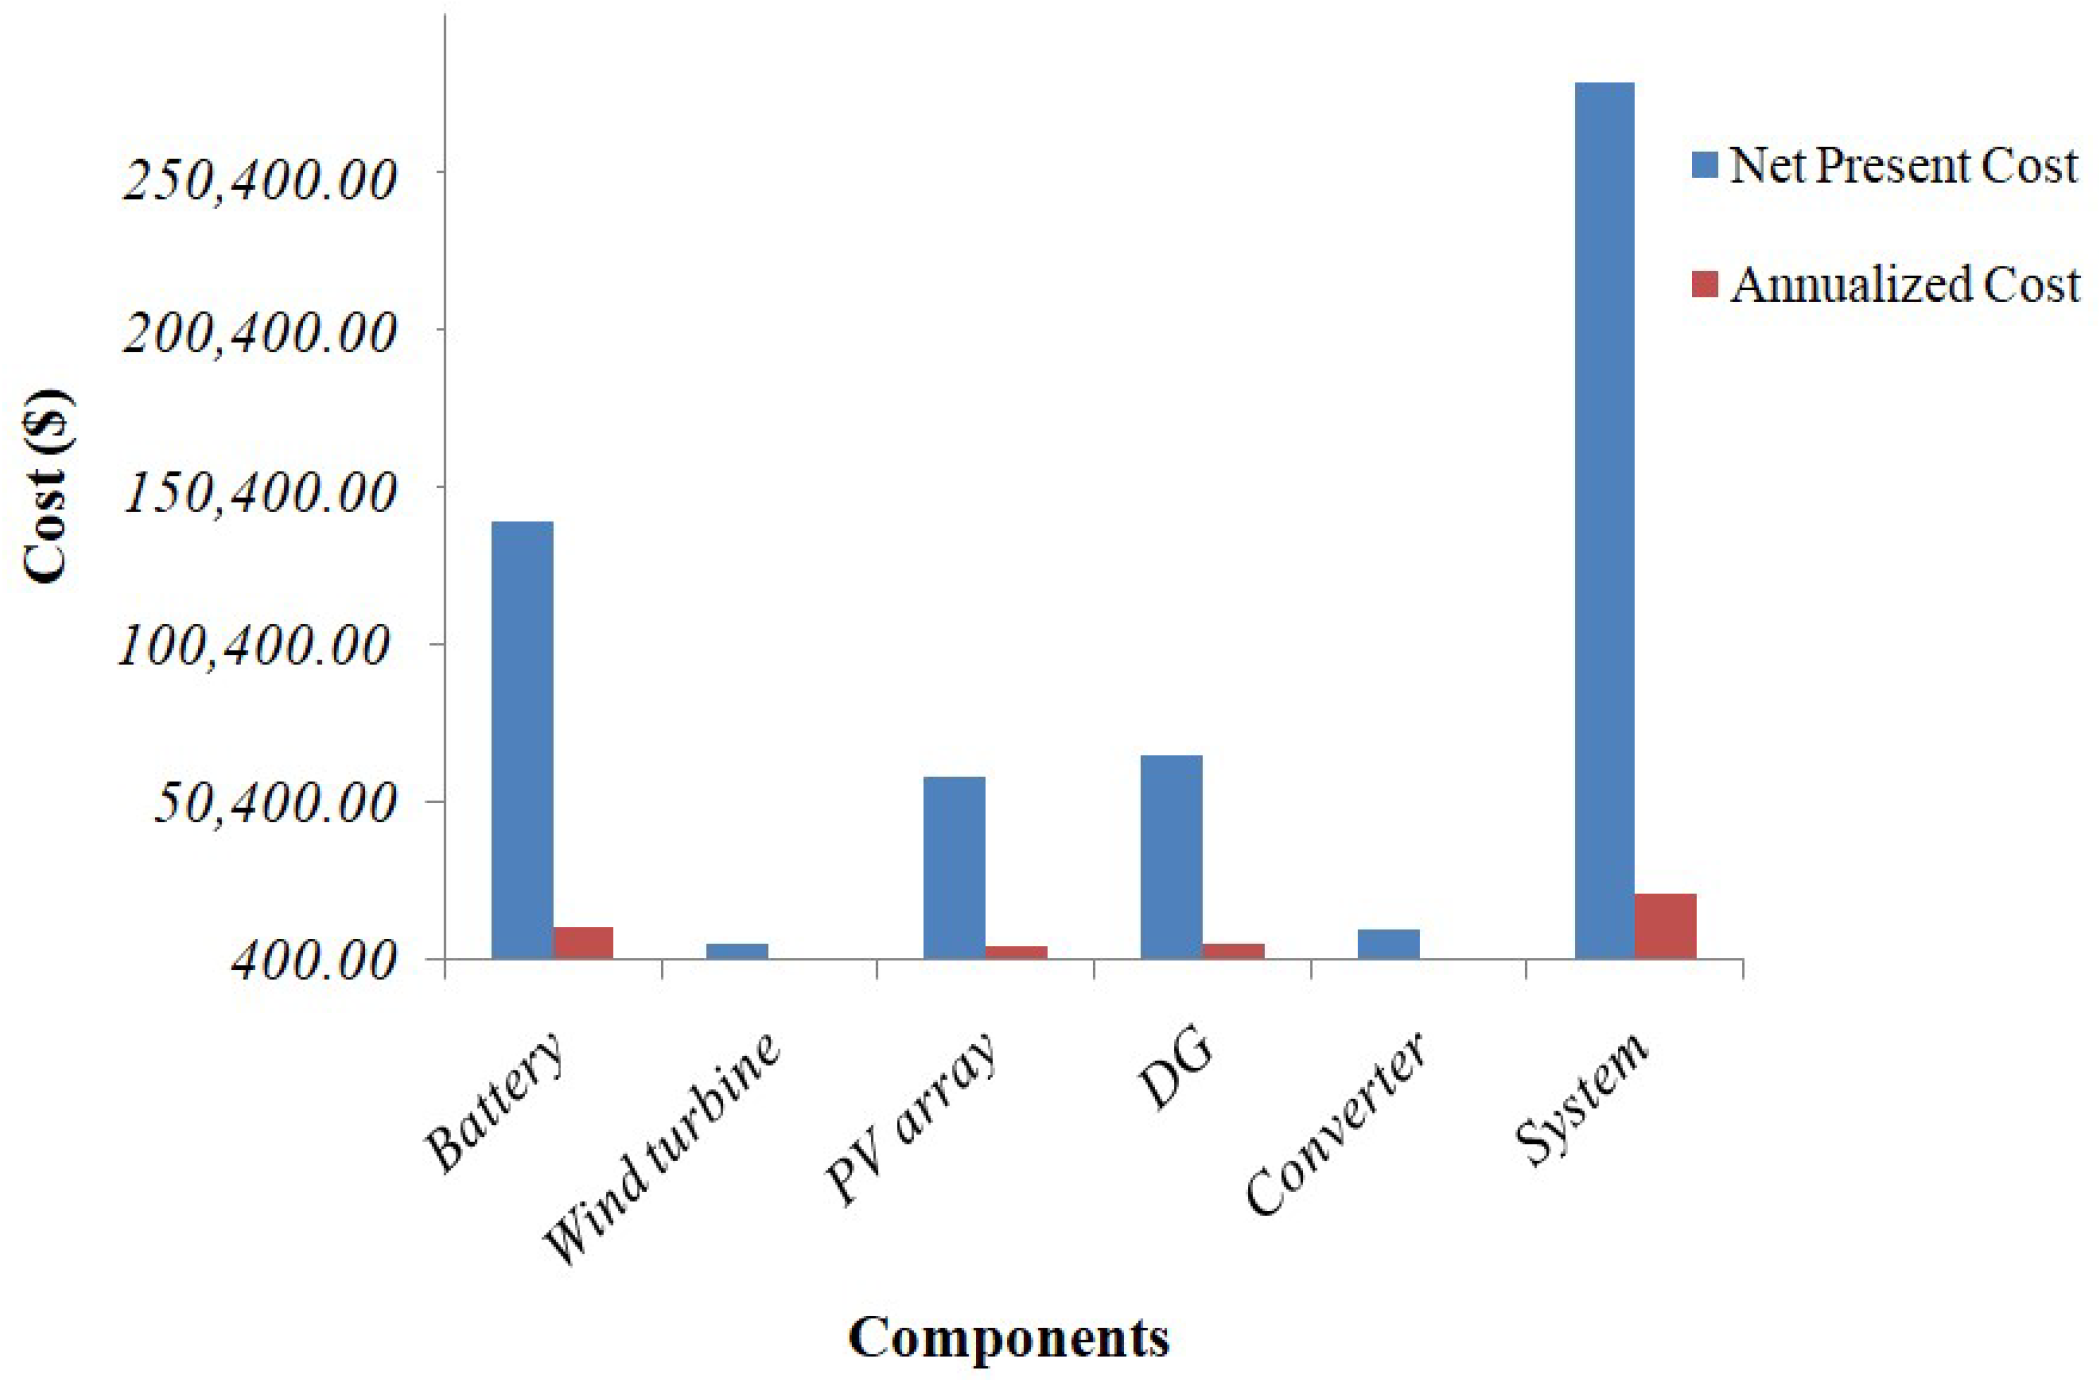
| Component | Capital Cost ($) | Replacement Cost ($) | O&M Cost ($/year) | Fuel Cost ($) | Salvage Cost ($) | Total Cost ($) |
|---|---|---|---|---|---|---|
| Battery | 82,000 | 65,922 | 0 | 0 | −8937 | 138,984 |
| Wind turbine | 5000 | 0 | 646 | 0 | 0 | 5646 |
| PV array | 54,209 | 0 | 3966 | 0 | 0 | 58,175 |
| Diesel Generator | 33,250 | 0 | 6335 | 28,316 | −2531 | 65,370 |
| Converter | 6212 | 2635 | 1647 | 0 | −496 | 9999 |
| System | 180,671 | 68,557 | 12,595 | 28,316 | −11,965 | 278,176 |
| Parameter | DG Only (Base Case) | PV-Wind-BSS-DG Configuration |
|---|---|---|
| Initial Capital ($) | 33,250 | 180,672 |
| Operating cost ($/year) | 81,084 | 7542 |
| Cost of energy ($/kWh) | 1.14 | 0.29 |
| NPC ($) | 1,081,468 | 278,176 |
| Configuration | Total Fuel (Diesel) Consumed (Litre/Year) | Carbon Dioxide (kg/Year) | Carbon Monoxide (kg/Year) | Unburned Hydrocarbons (kg/Year) | Particulate Matter (kg/Year) | Sulfur Dioxide (kg/Year) | Nitrogen Oxides (kg/Year) |
|---|---|---|---|---|---|---|---|
| DG only (Base case) | 46,140 | 120,788 | 754 | 33.2 | 4.52 | 296 | 709 |
| PV-Wind-BSS-DG (Proposed) | 1856 | 4859 | 30.3 | 1.34 | 0.182 | 11.9 | 28.5 |
| Sr. No. | Location | Proposed Hybrid System | NPC ($) | Cost of Energy ($/kWh) | Reference |
|---|---|---|---|---|---|
| 1 | Korkadu, Union territory of Puducherry, India | PV-WT-Biogen | $16,365.95 | $0.19 | [17] |
| 2 | Rwanda, East African Country | Hydro-Solar-Battery | $41,210.80 | $0.056 | [65] |
| 3 | Chamarajanagar district, Karnataka, India | PV-WT-BGG-BMG-FC-Battery | $890,013 | $0.214 | [19] |
| 4 | Jask (near the Gulf of Oman) | PV-WT-Battery | $44.1 M | $0.219 | [66] |
| Genaveh (near the Persian Gulf) | PV-WT-Battery | $46.9 M | $0.233 | ||
| Anzali (near the Caspian sea) | PV-WT-Battery | $48.8 M | $0.242 | ||
| 5 | Golbo II village, Ethiopia | PV-DG-Battery | $82,734 | $0.207 | [67] |
| 6 | Mankwadze, Ghana | PV-WT-DG-Battery | $8,649,054 | $0.382 | [42] |
| 7 | Rezwan village, Sudaklen, Iran | PV-WT-Battery | $24,662 | $0.322 | [68] |
| 8 | Leopard beach, Hongsibao, China | PV-WT-BGG-Battery | $587,013 | $0.201 | [69] |
| 9 | Industrial city II, Ardabil, Iran | PV-WT-DG-Battery | $304,380 | $0.471 | [70] |
| 10 | Fouay, Benin republic, Africa | PV-DG-Battery | $555,492 | $0.207 | [71] |
| 11 | Chikmagalur district, Karnataka, India | PV-Hydro-Battery | $712,975 | $0.16 | [72] |
| 12 | Singa village, Siang district, Arunachal Pradesh, India | WT-Hydro-DG-Battery | $23,808 | $0.63 | [73] |
| 13 | Tamilnadu, India | PV-WT-DG-Battery | $199,850.80 | $0.2492 | [74] |
| 14 | Ghaziabd, India | PV-BSS | $639,981 | $0.34 | [75] |
| 15 | Turtuk village, Ladakh, India | PV-Wind-BSS-DG | $2,78,176 | $0.29 | Present study |
Publisher’s Note: MDPI stays neutral with regard to jurisdictional claims in published maps and institutional affiliations. |
© 2022 by the authors. Licensee MDPI, Basel, Switzerland. This article is an open access article distributed under the terms and conditions of the Creative Commons Attribution (CC BY) license (https://creativecommons.org/licenses/by/4.0/).
Share and Cite
Sambhi, S.; Sharma, H.; Bhadoria, V.; Kumar, P.; Chaurasia, R.; Chaurasia, G.S.; Fotis, G.; Vita, V.; Ekonomou, L.; Pavlatos, C. Economic Feasibility of a Renewable Integrated Hybrid Power Generation System for a Rural Village of Ladakh. Energies 2022, 15, 9126. https://doi.org/10.3390/en15239126
Sambhi S, Sharma H, Bhadoria V, Kumar P, Chaurasia R, Chaurasia GS, Fotis G, Vita V, Ekonomou L, Pavlatos C. Economic Feasibility of a Renewable Integrated Hybrid Power Generation System for a Rural Village of Ladakh. Energies. 2022; 15(23):9126. https://doi.org/10.3390/en15239126
Chicago/Turabian StyleSambhi, Shilpa, Himanshu Sharma, Vikas Bhadoria, Pankaj Kumar, Ravi Chaurasia, Giraja Shankar Chaurasia, Georgios Fotis, Vasiliki Vita, Lambros Ekonomou, and Christos Pavlatos. 2022. "Economic Feasibility of a Renewable Integrated Hybrid Power Generation System for a Rural Village of Ladakh" Energies 15, no. 23: 9126. https://doi.org/10.3390/en15239126