
Risk Assessment of Industrial Energy Hubs and Peer-to-Peer Heat and Power Transaction in the Presence of Electric Vehicles
 , and
, and
Abstract
:1. Introduction
1.1. Research Review
1.2. Novelties and Contributions
- ❖
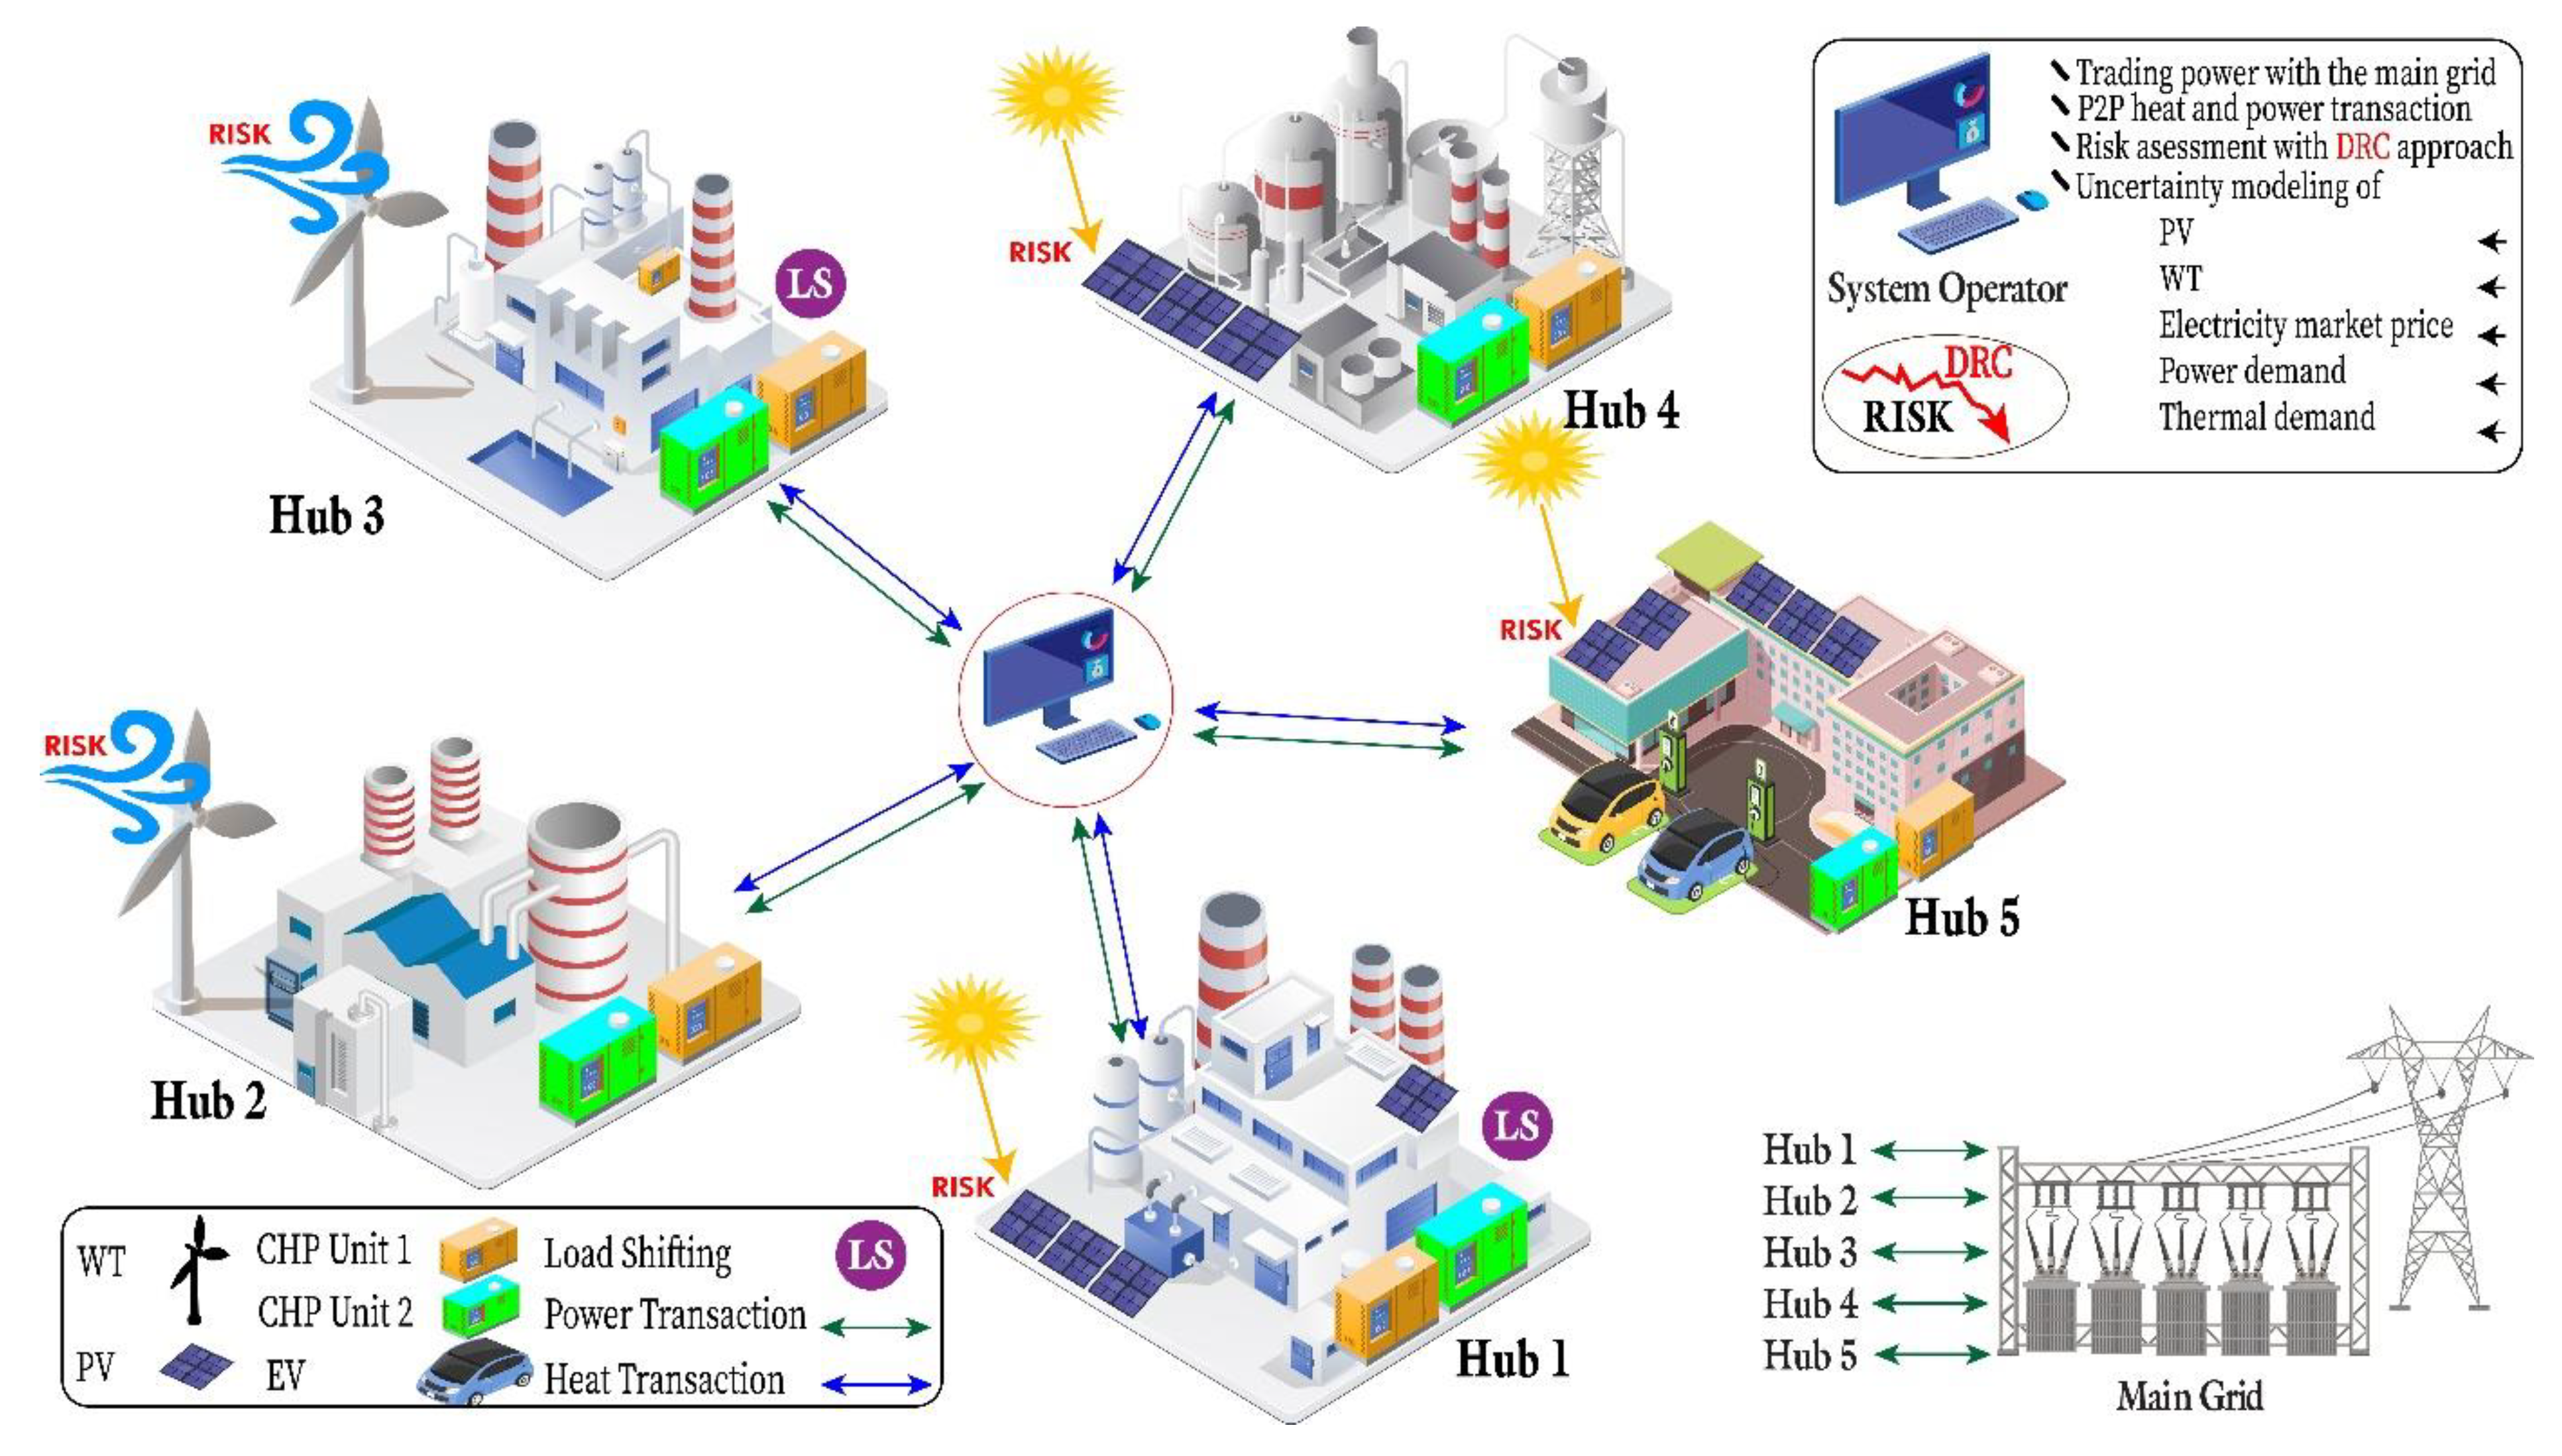
- Techno-economic analysis of an industrial MEH with P2P heat and power transaction.
- ❖
- Risk analysis of an industrial MEH with the downside risk constraint method (DRC) as a stochastic optimization procedure.
- ❖
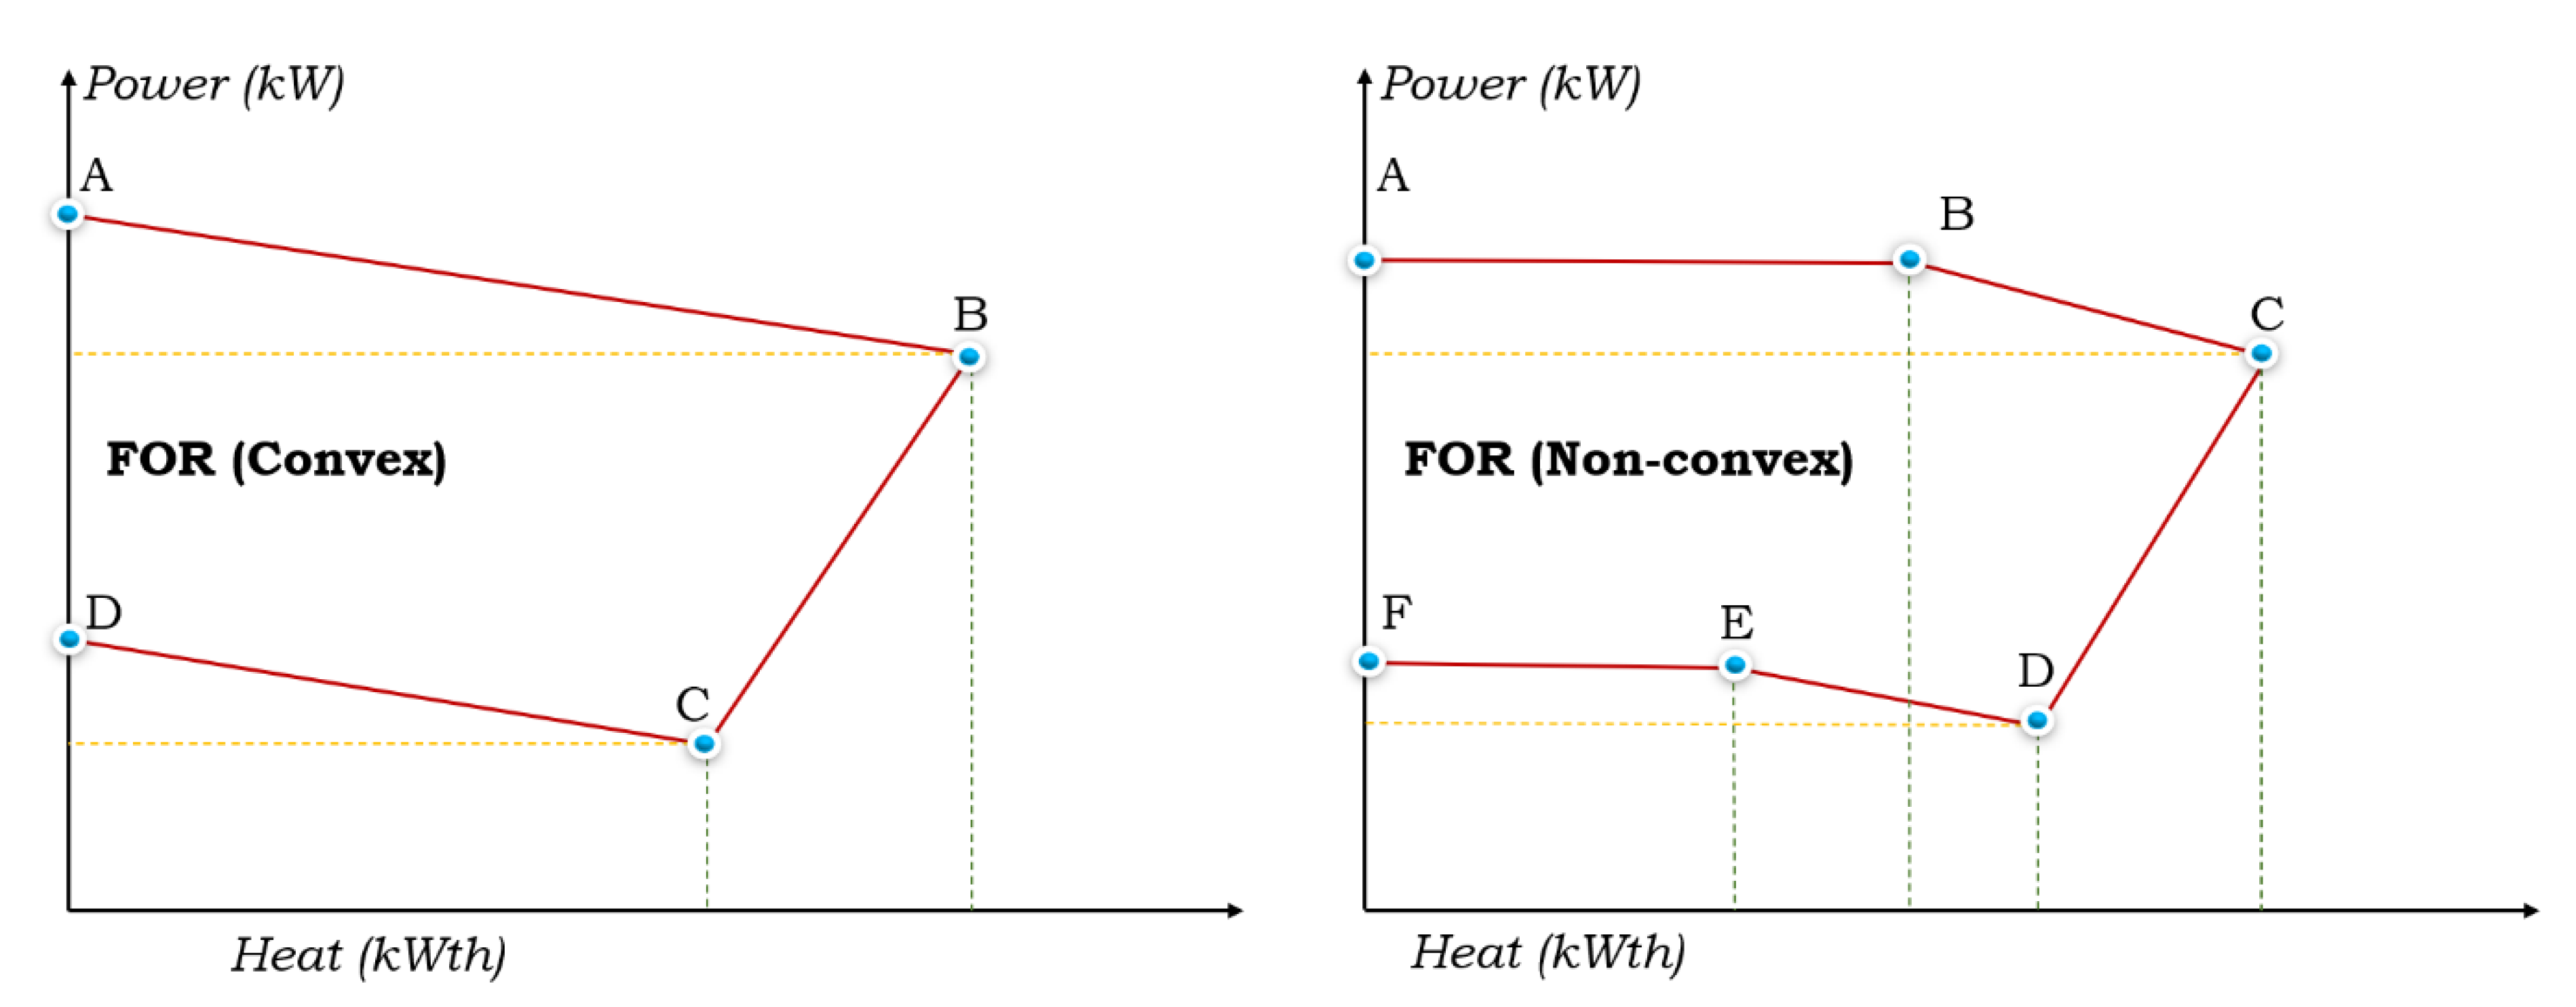
- Load-shifting flexibility asset and distributed energy resources, namely WTs, PVs, convex and non-convex CHP units, and plug-in electric vehicles (PEVs) to support energy demands.
1.3. Paper Structure
2. Mathematical Formulation
2.1. Objective Function
2.2. Energy Balance
2.3. Constraints of P2P Energy Transaction
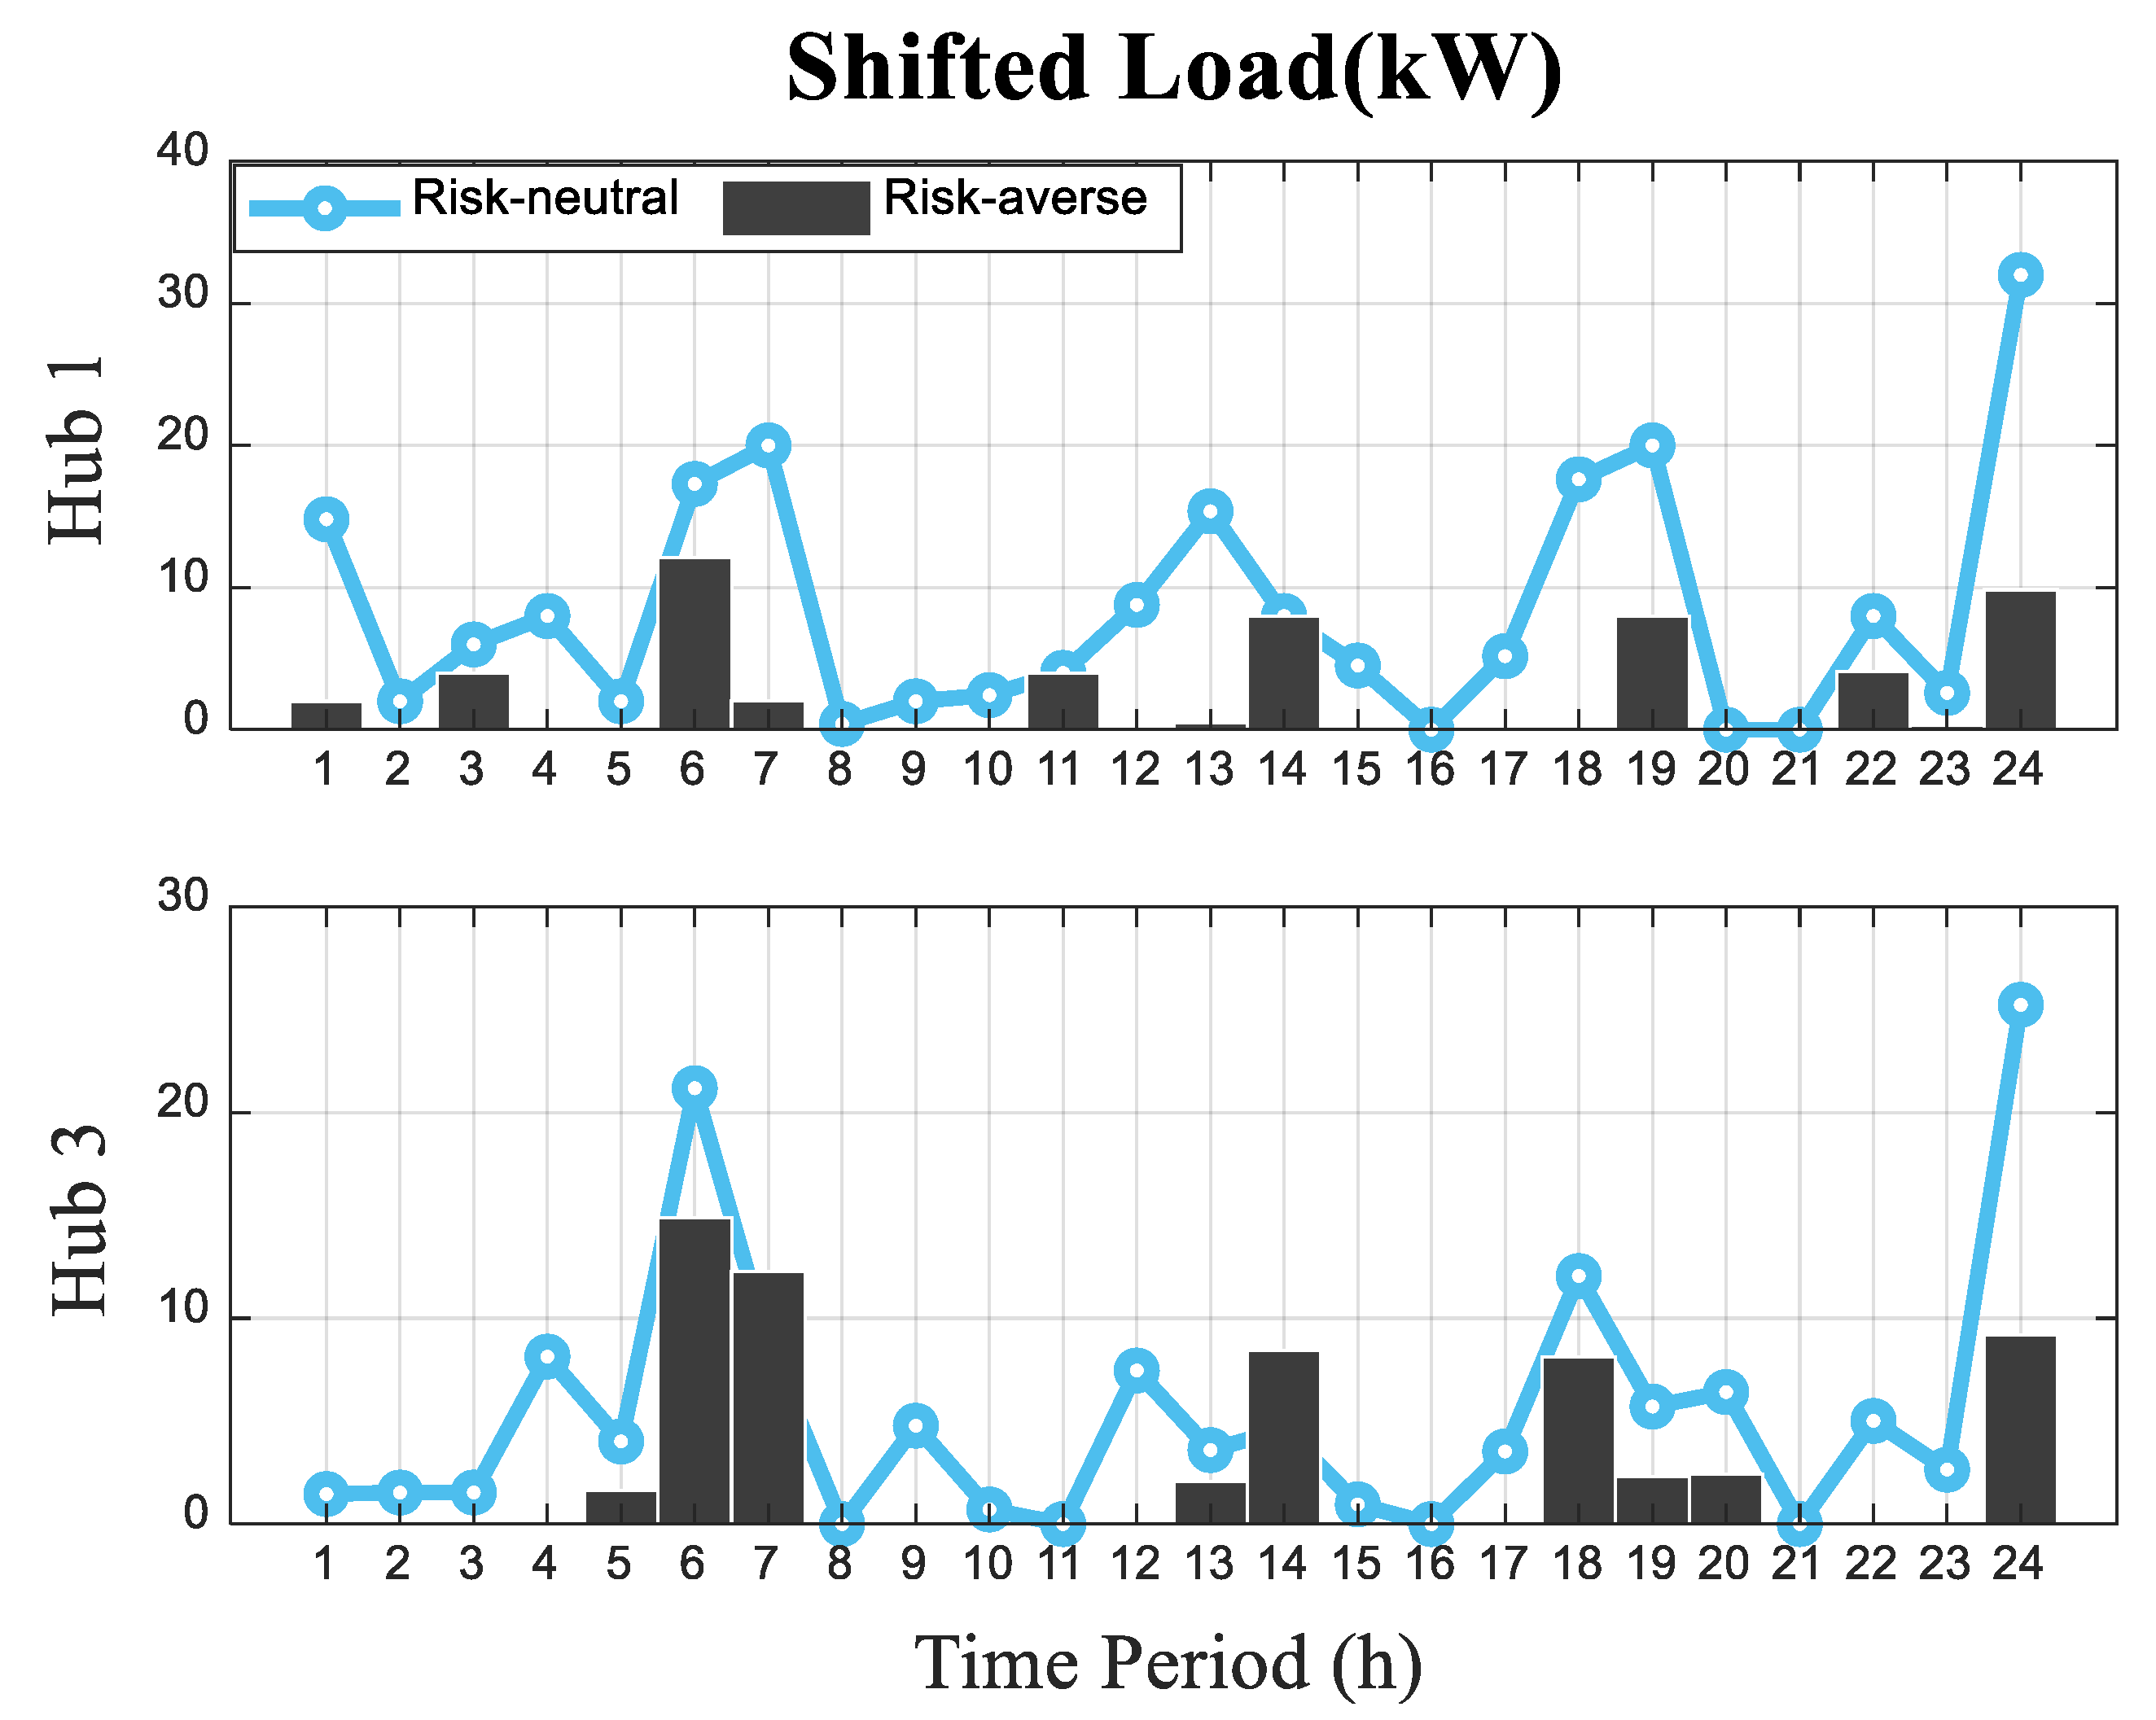
2.4. Load-Shifting Constraints
2.5. Electric Vehicle (EV) Constraints
2.6. Constraints of CHP Units
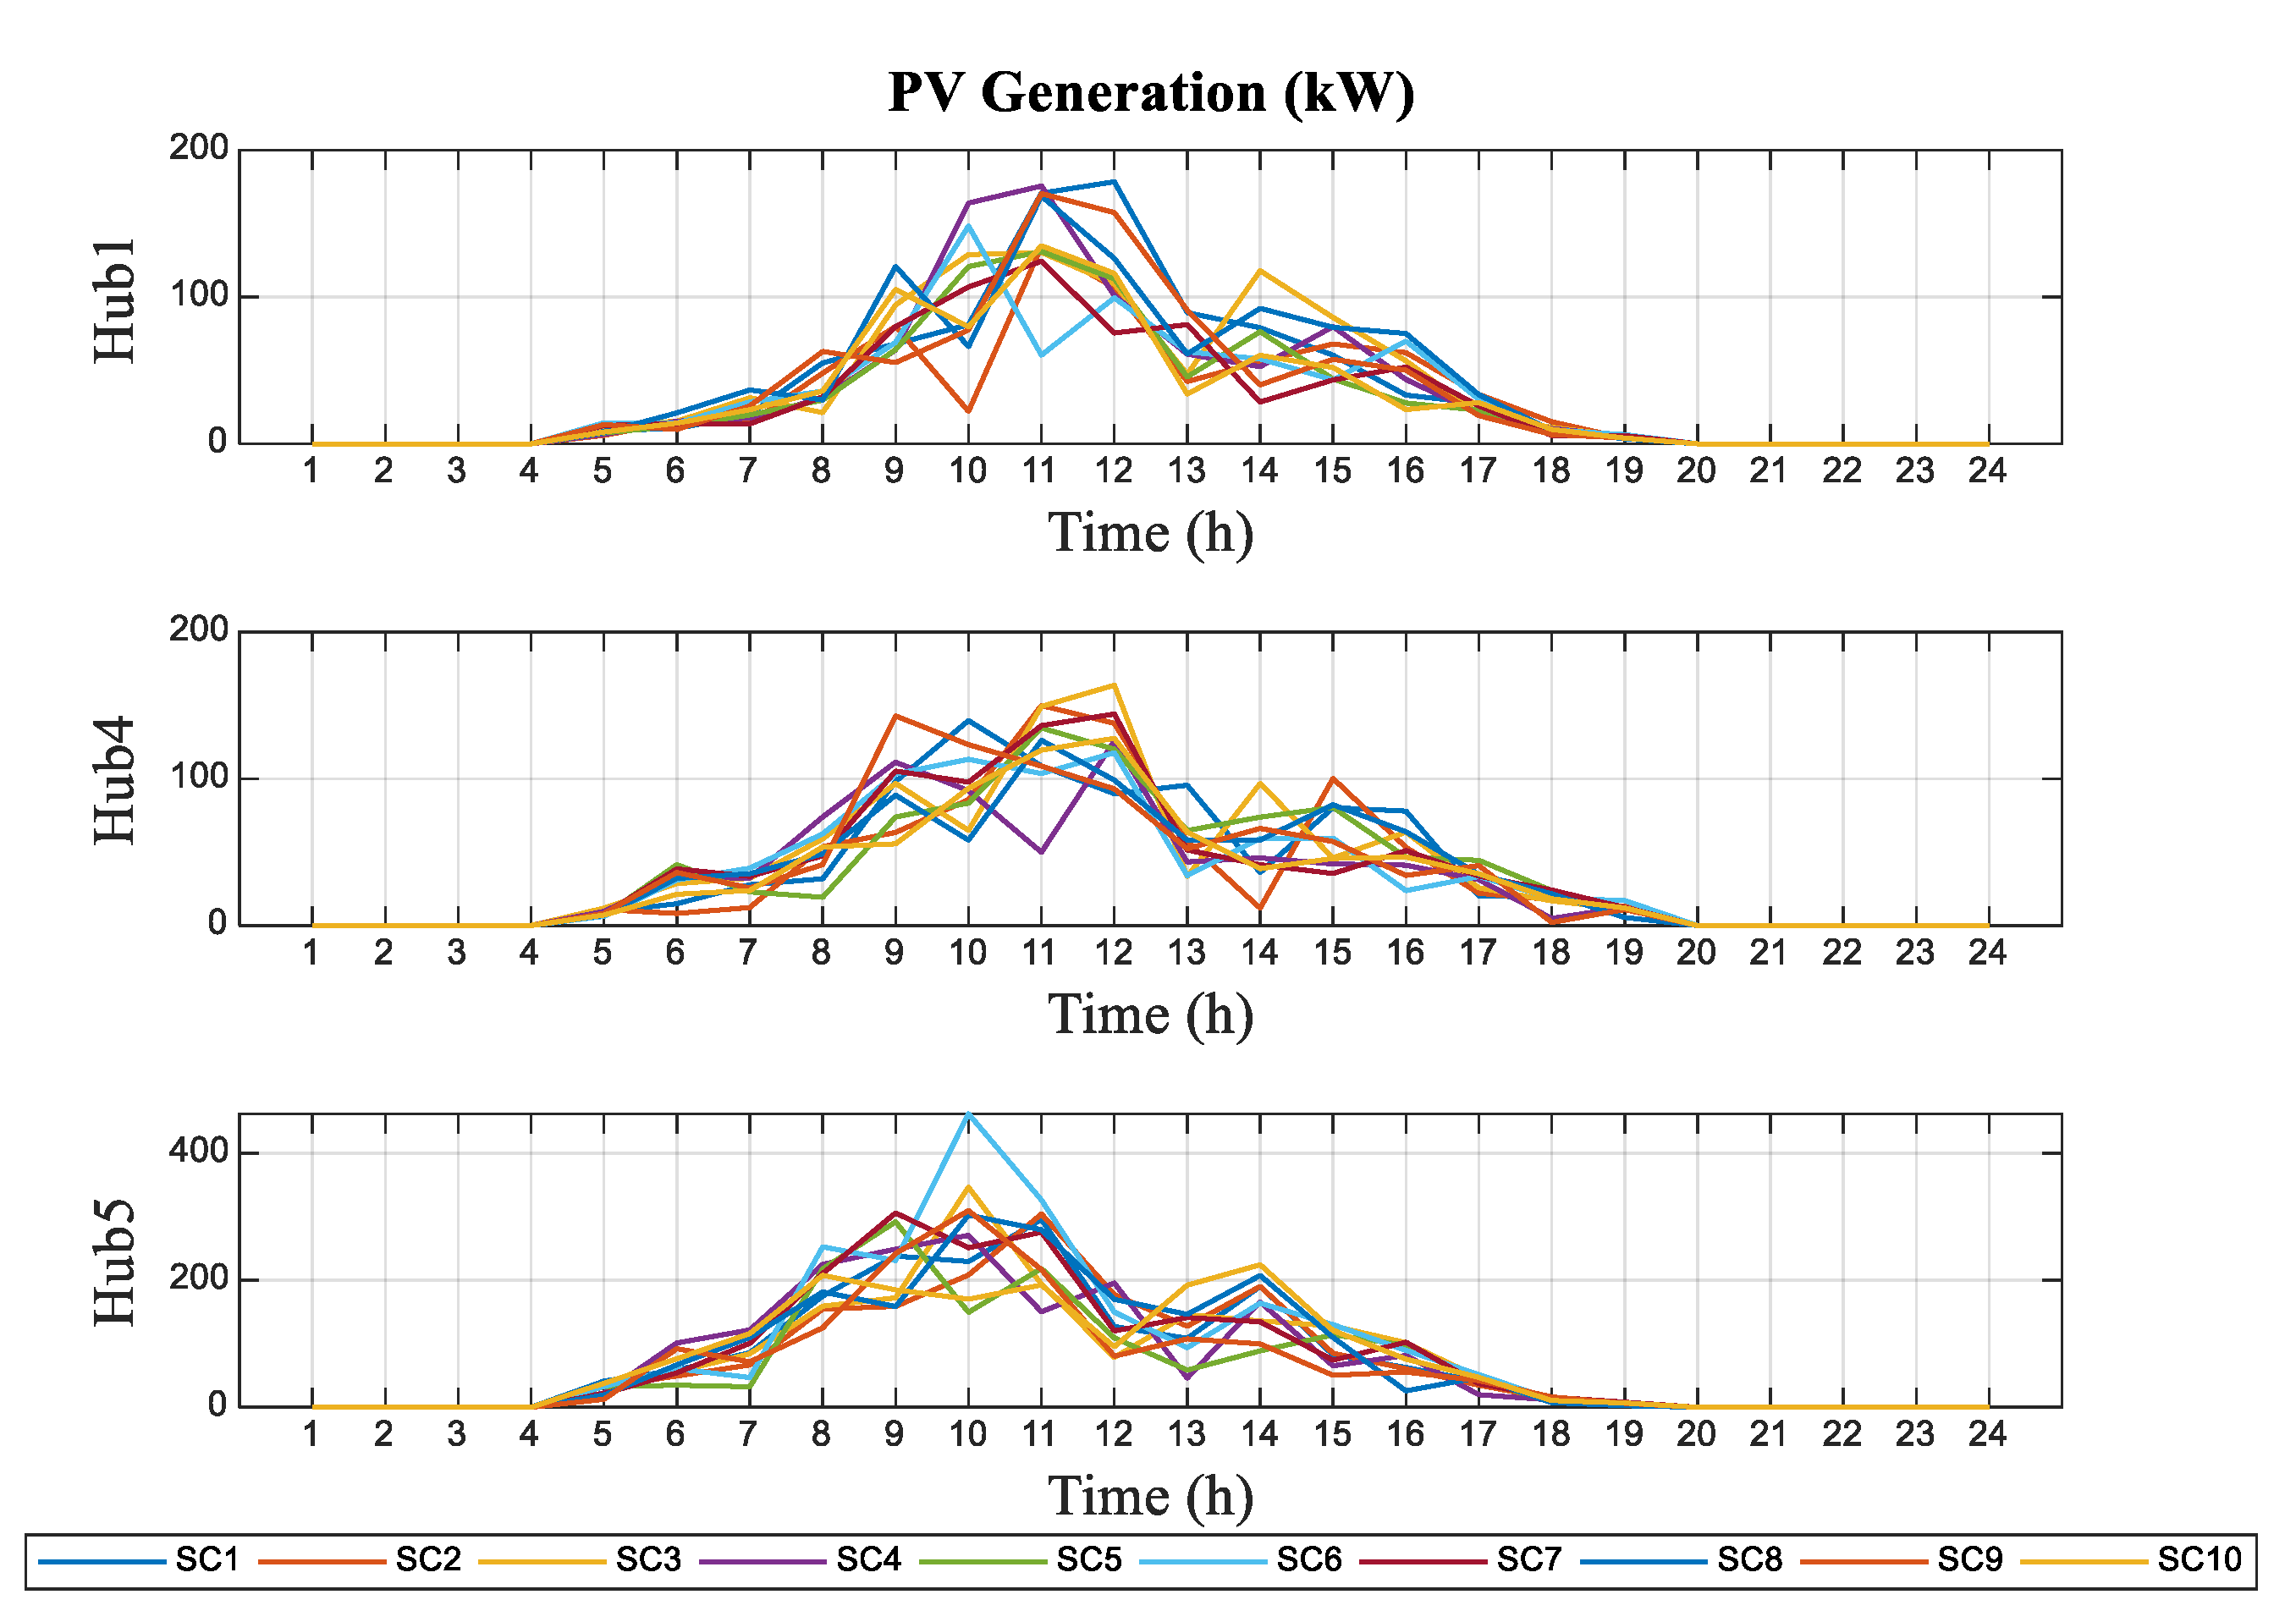
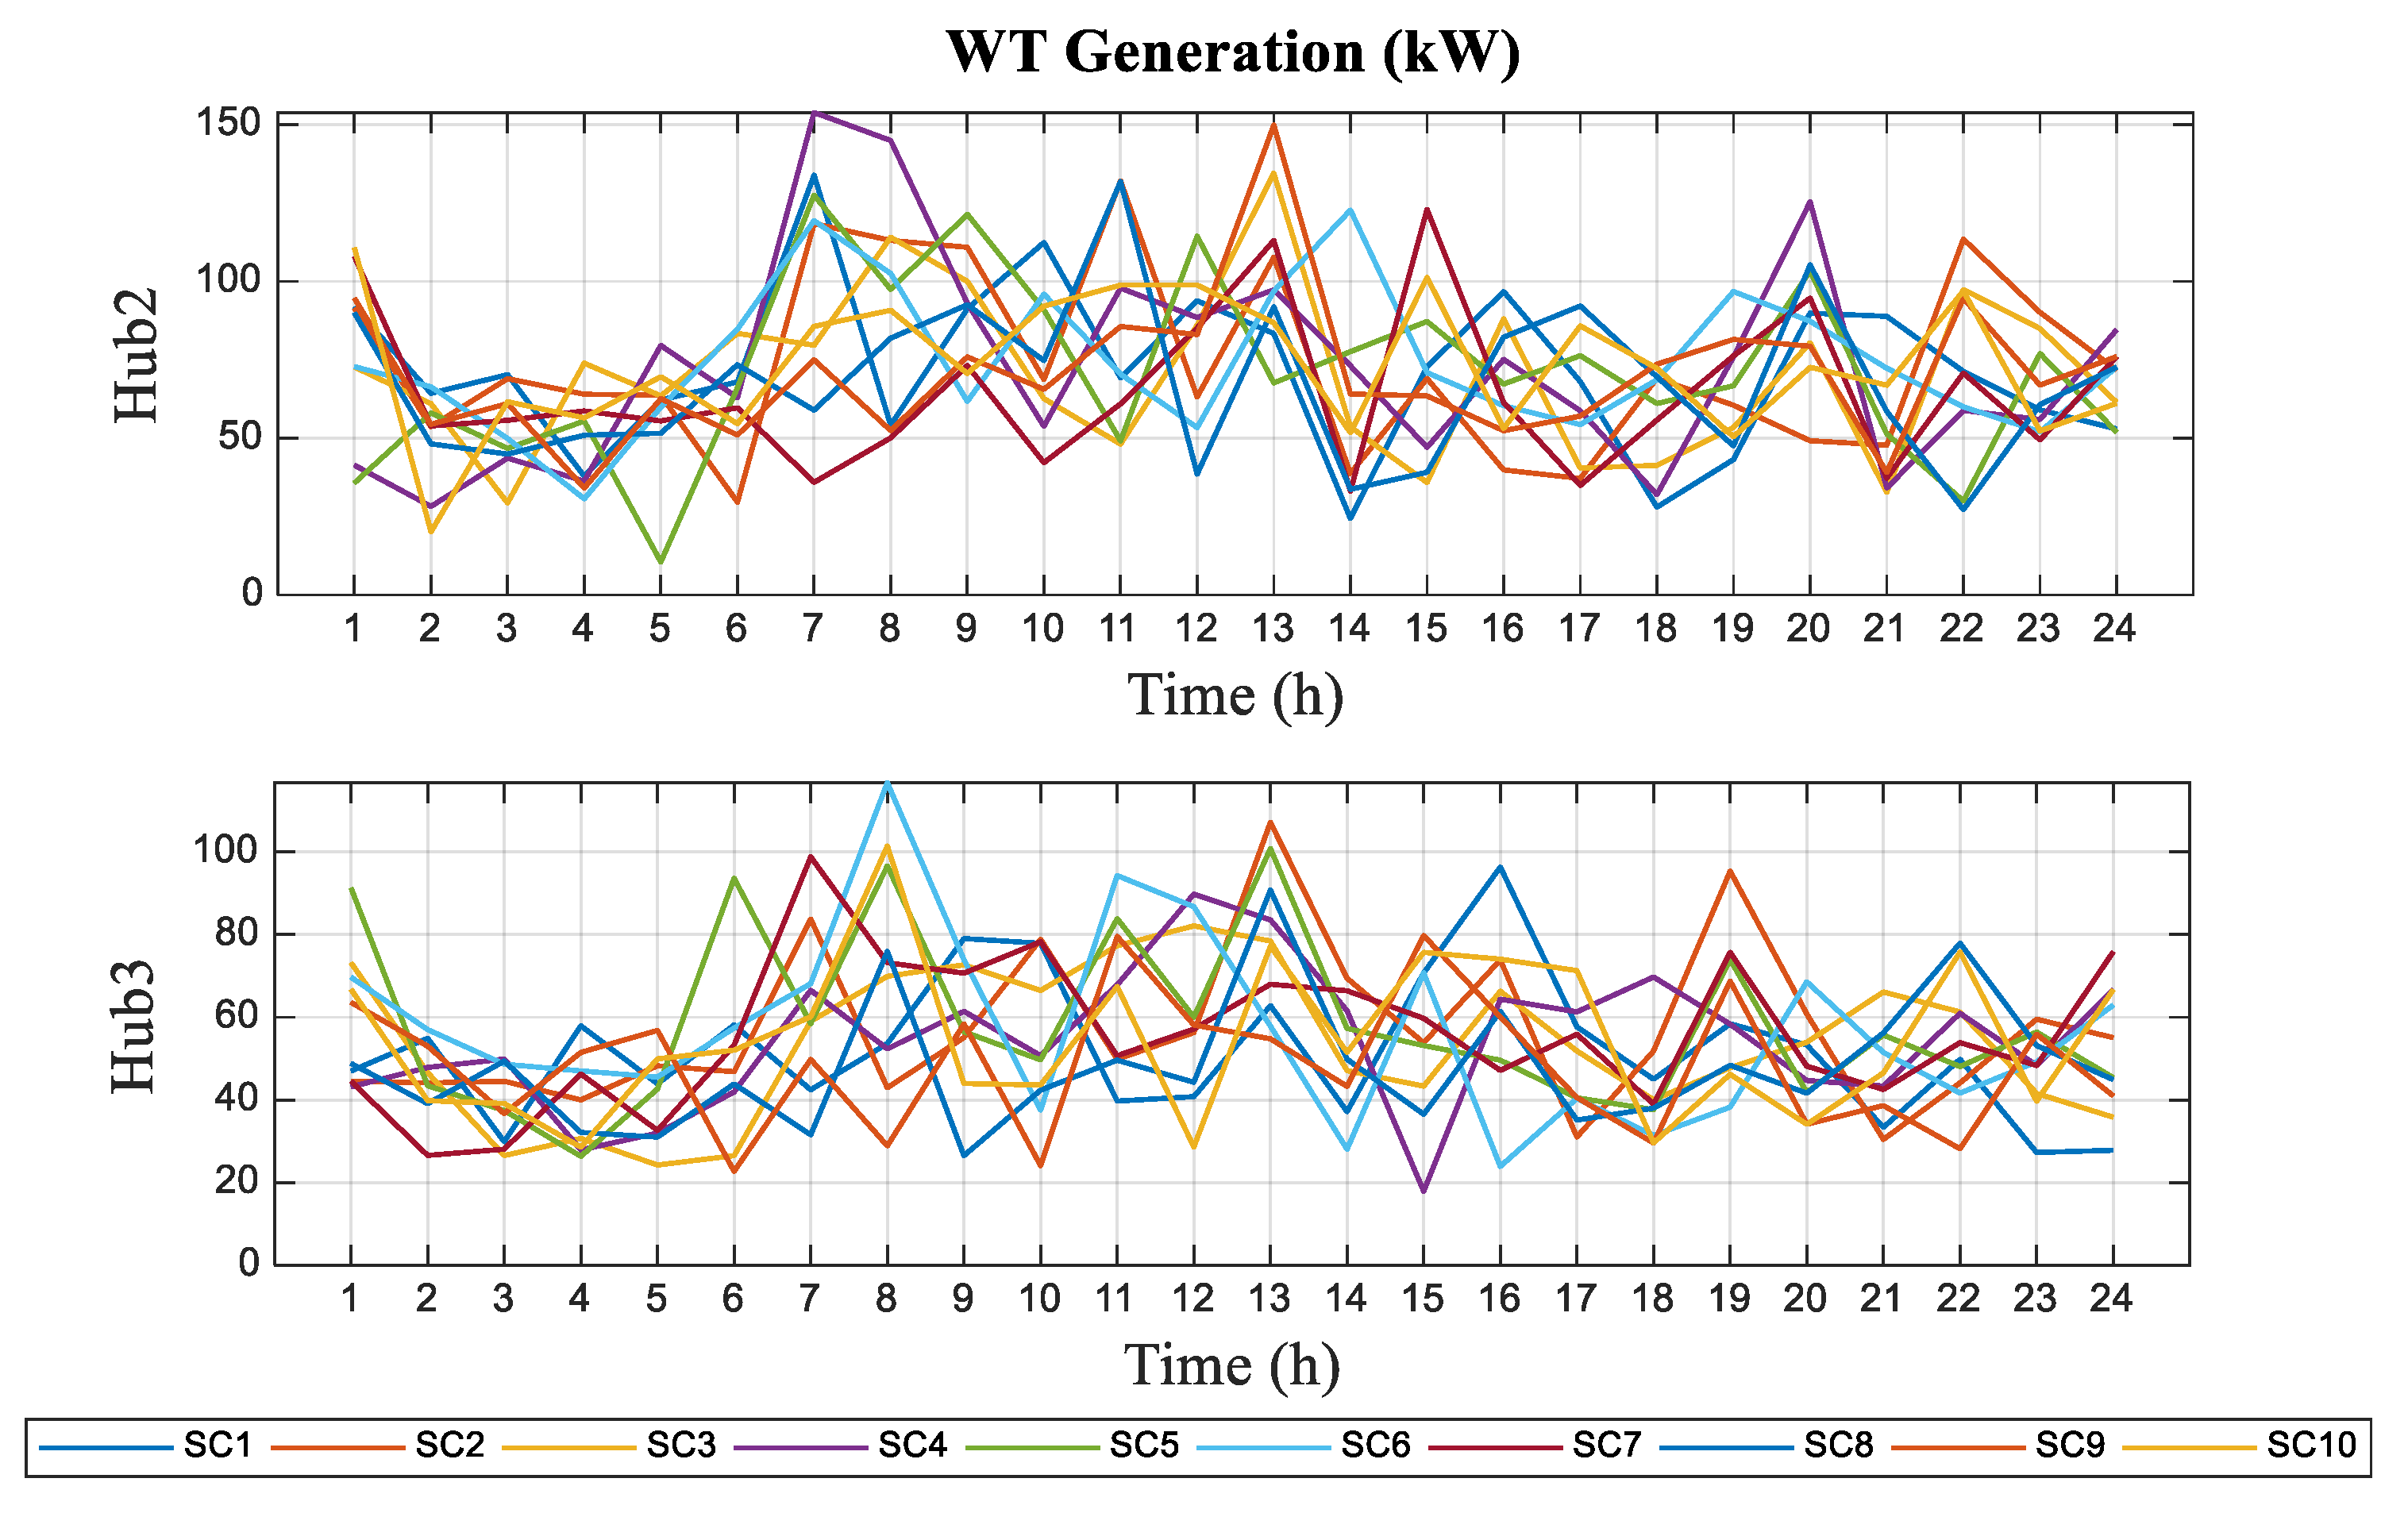
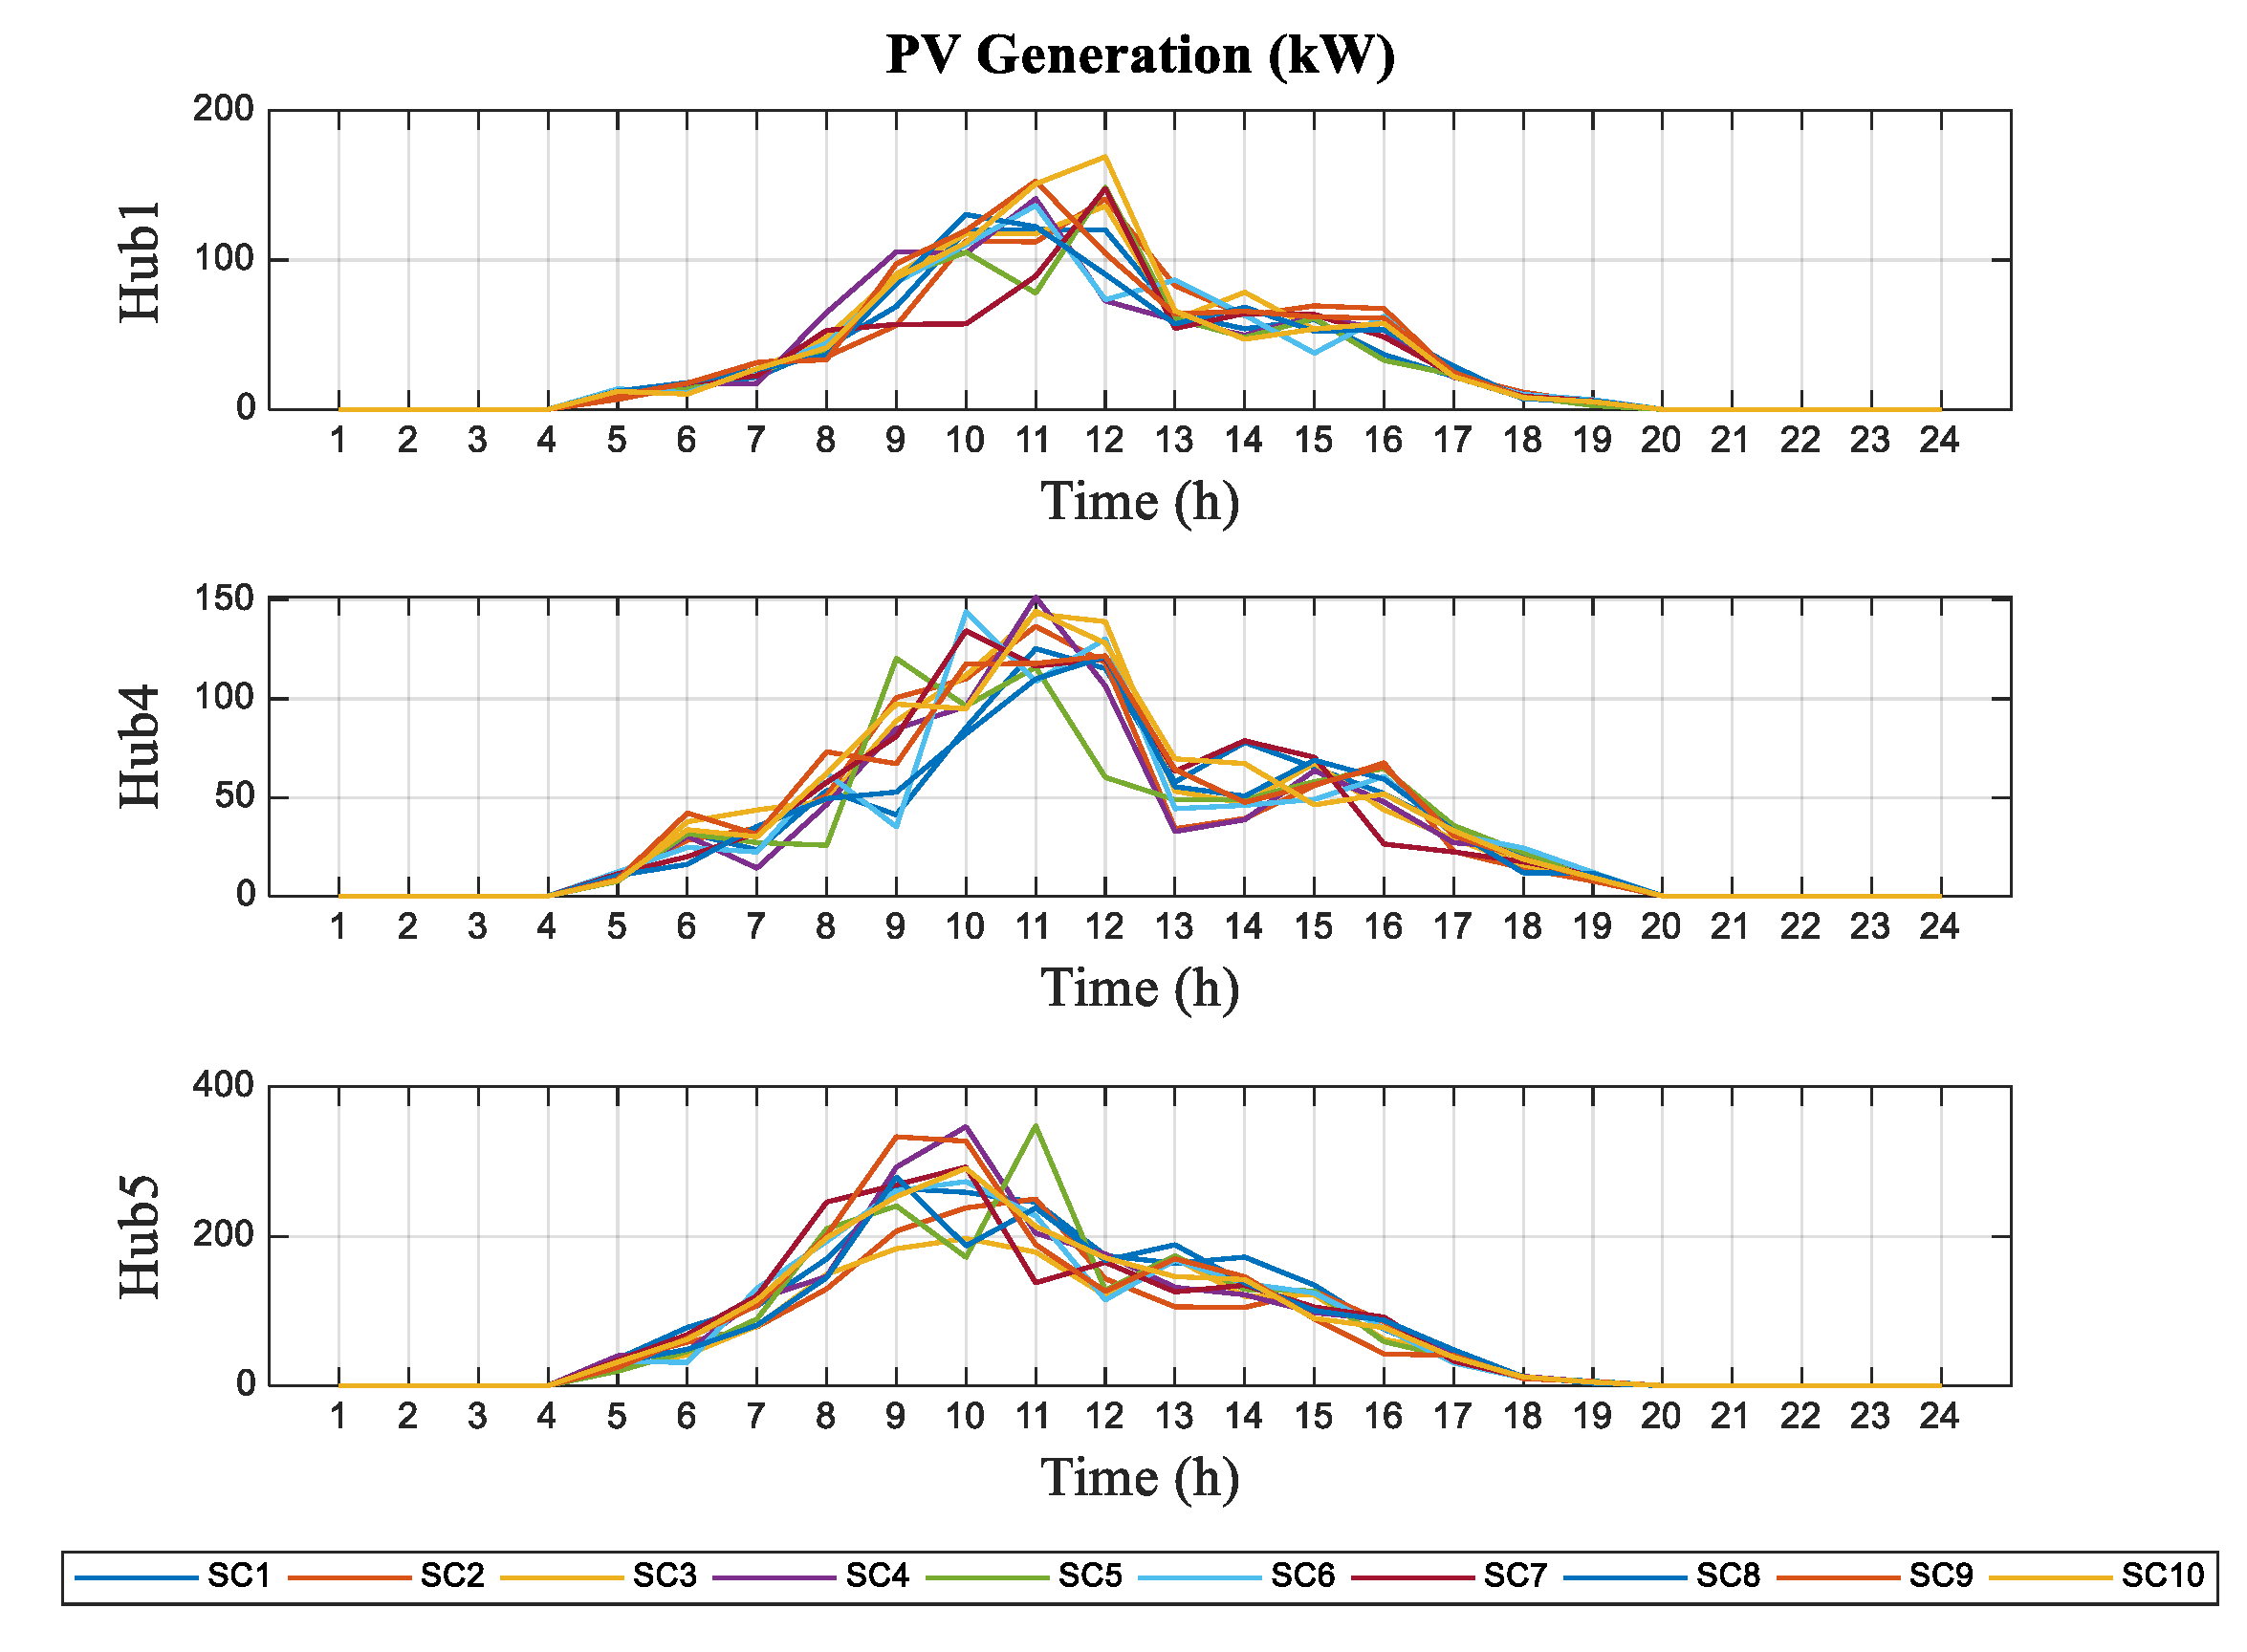
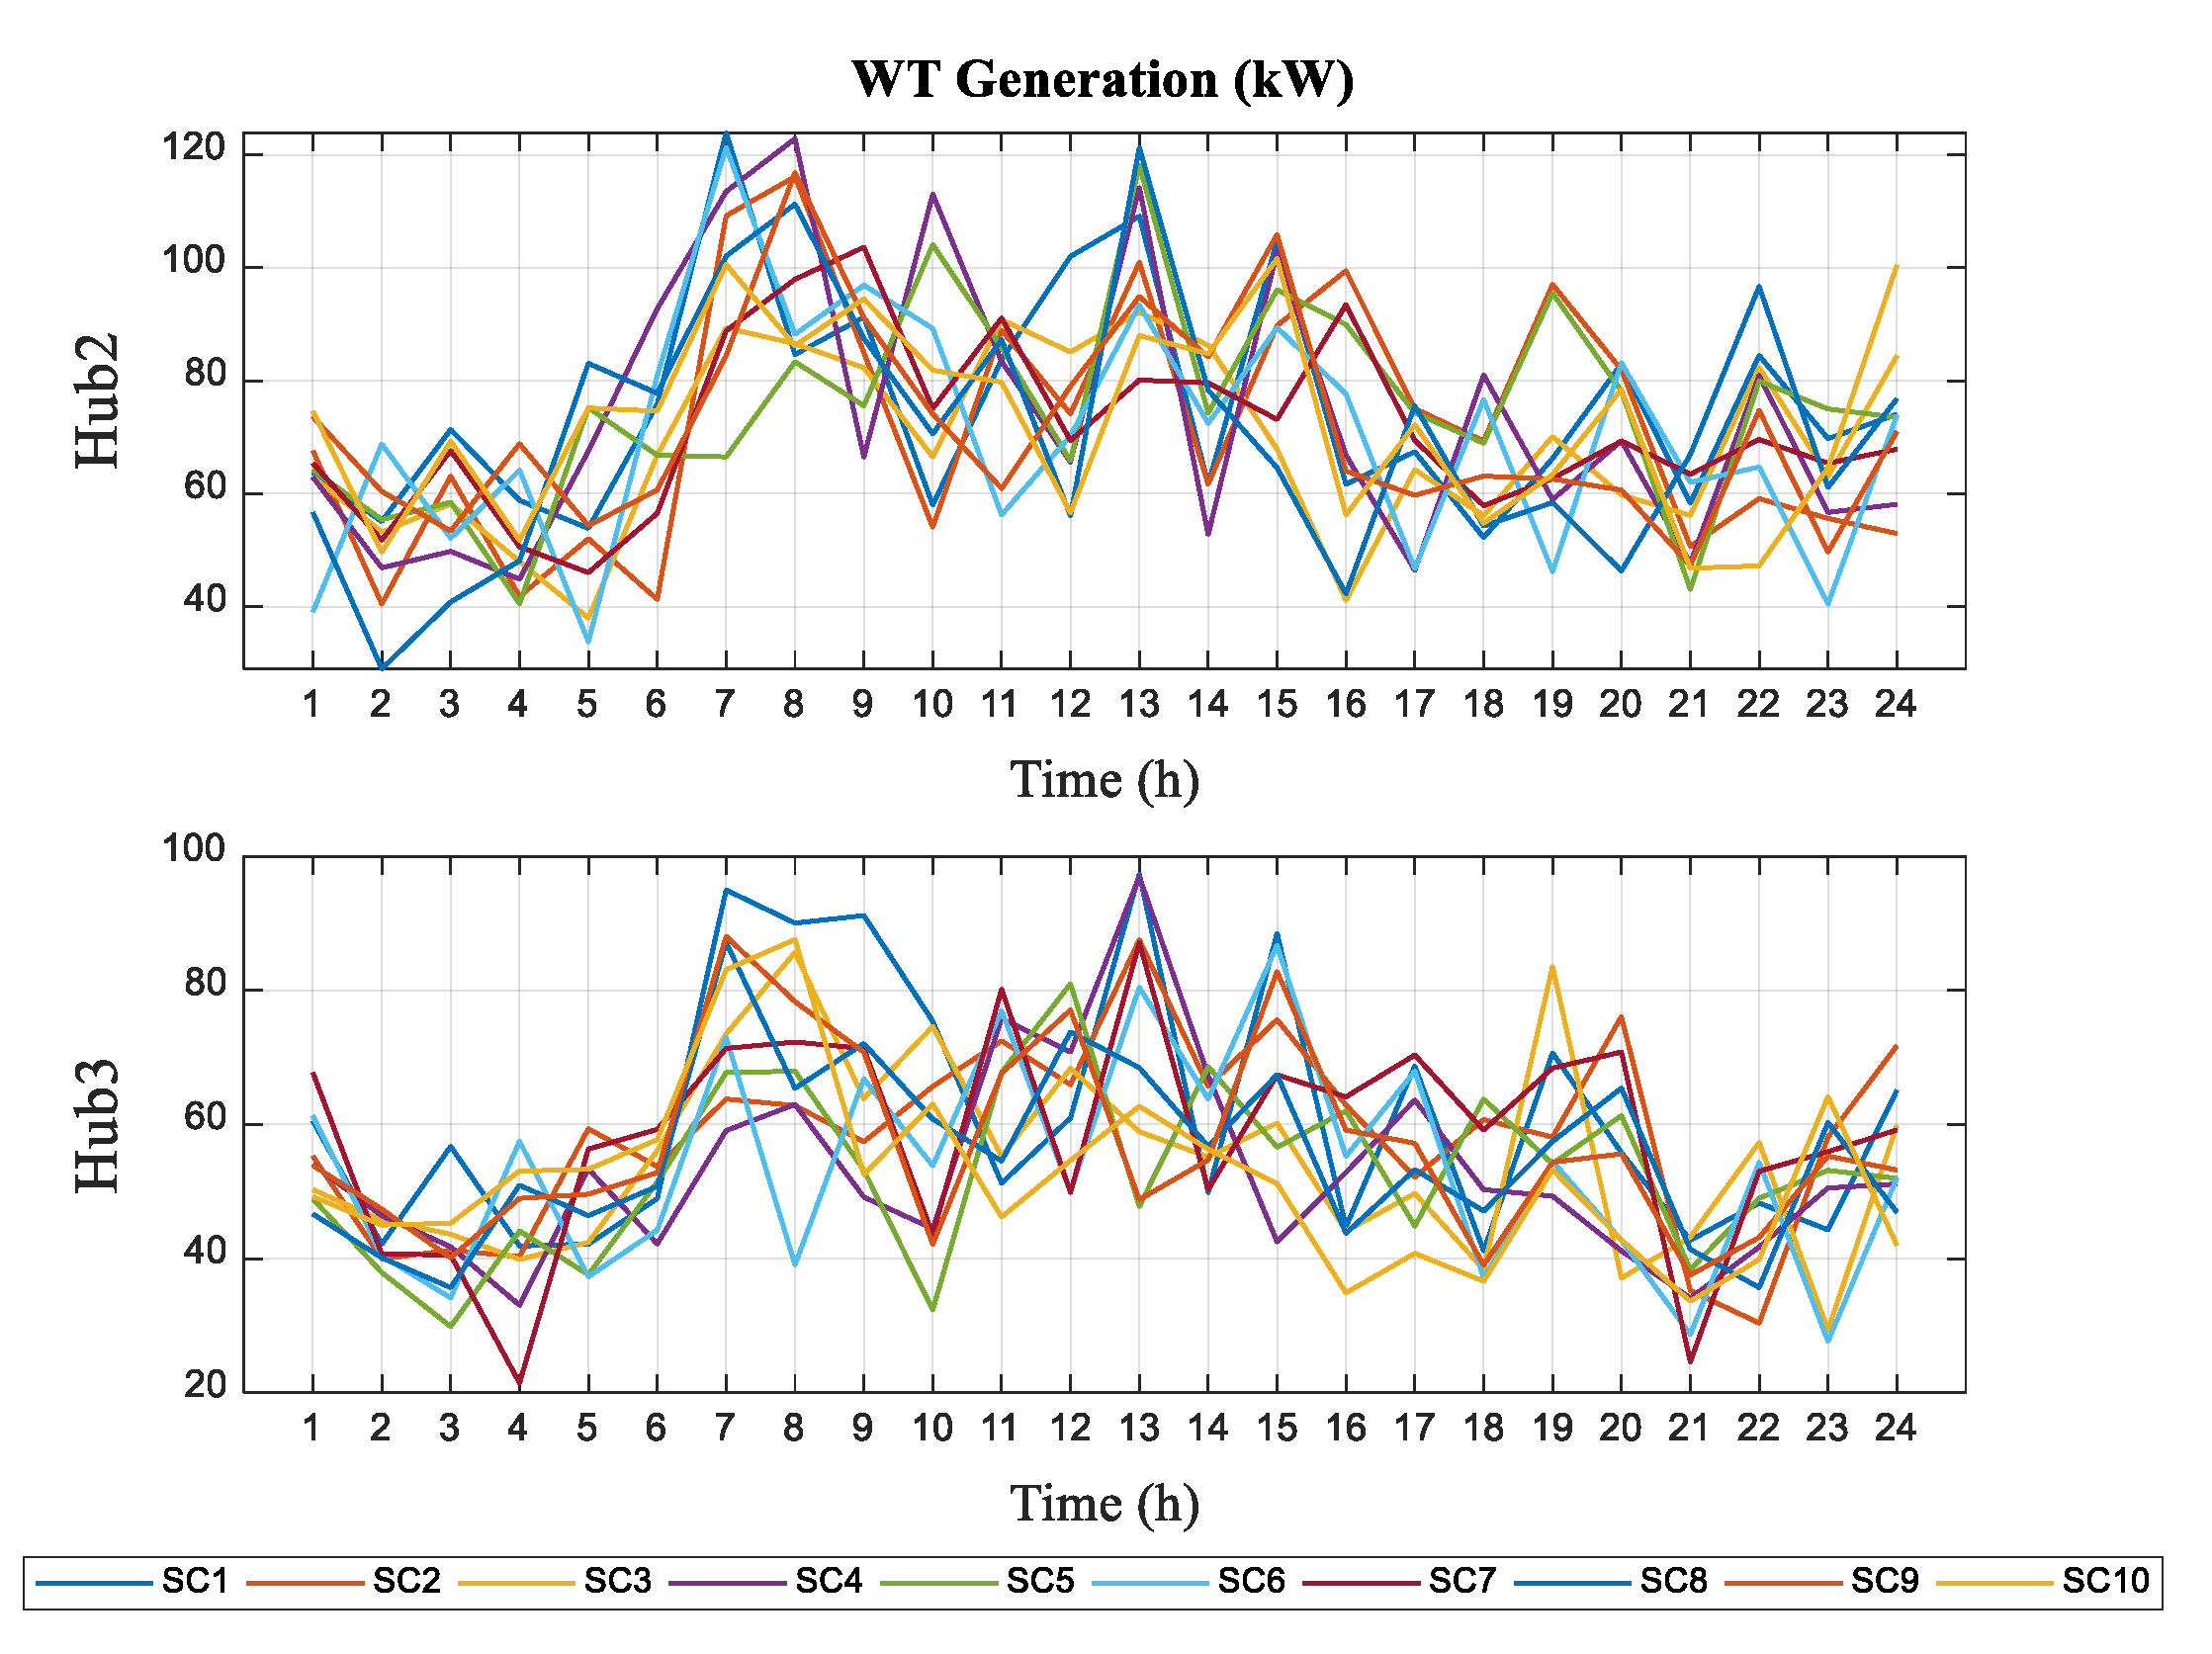
2.7. Constraints of Renewable Energy Sources
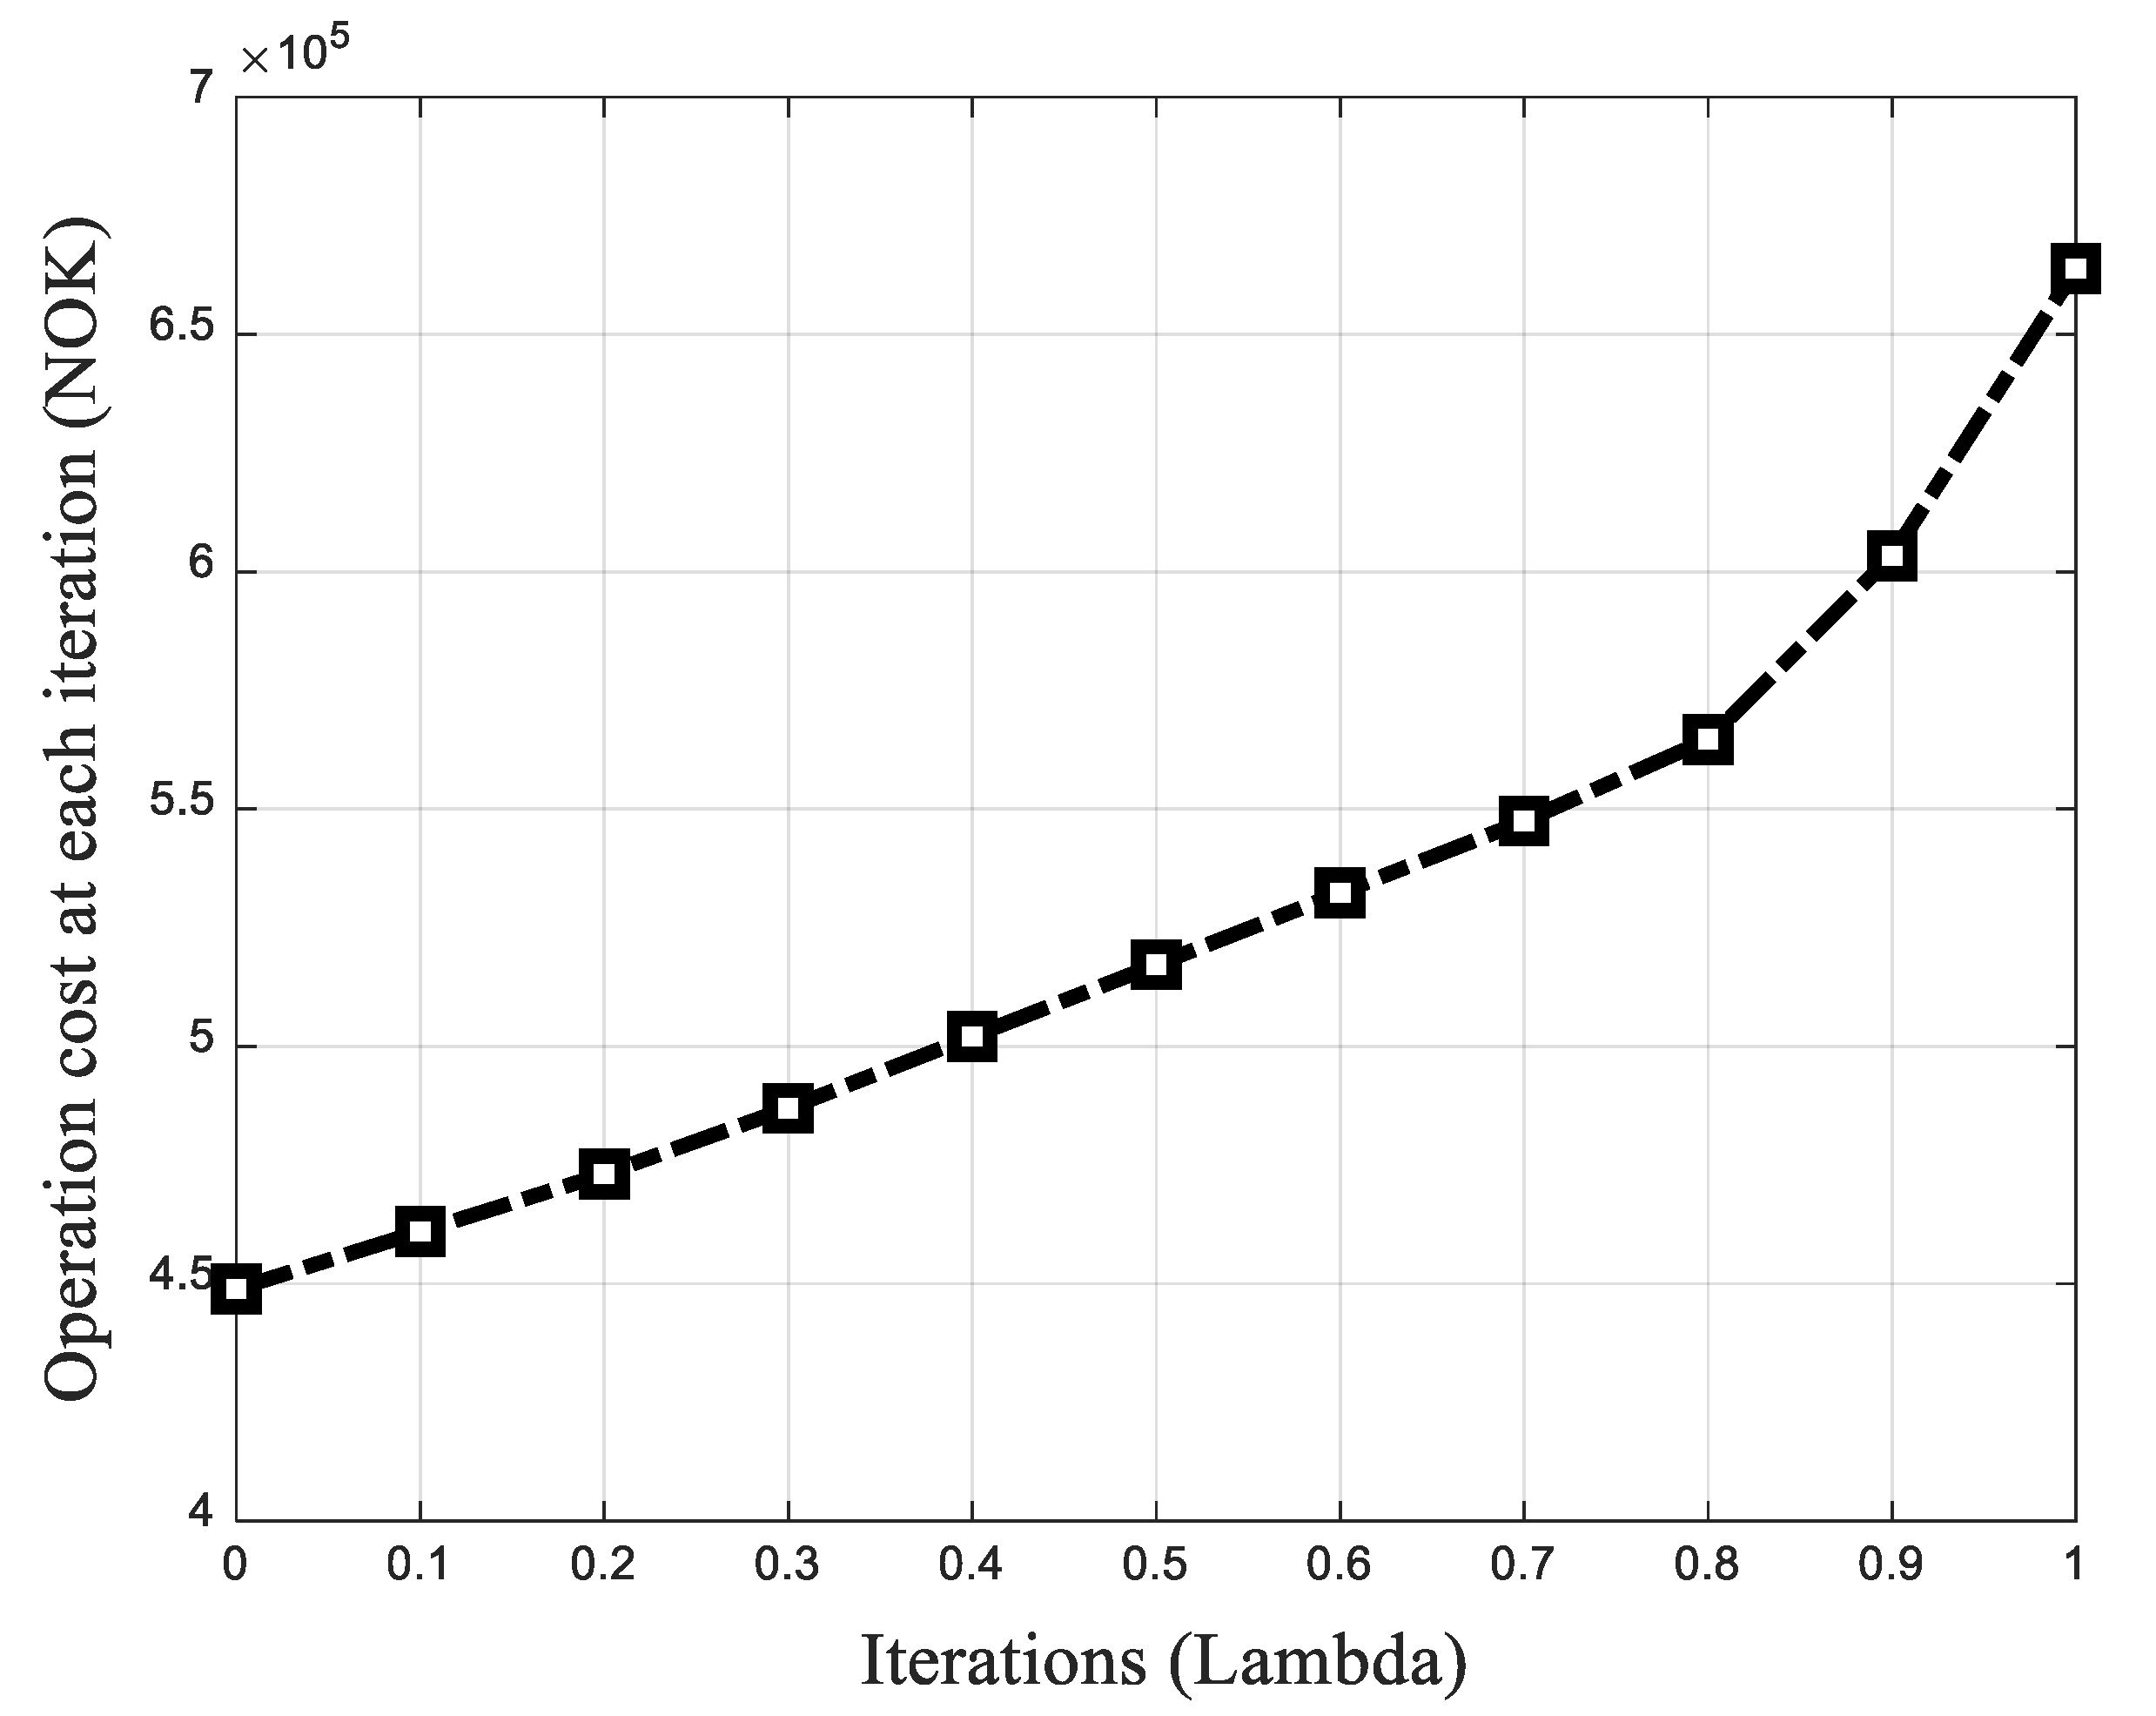
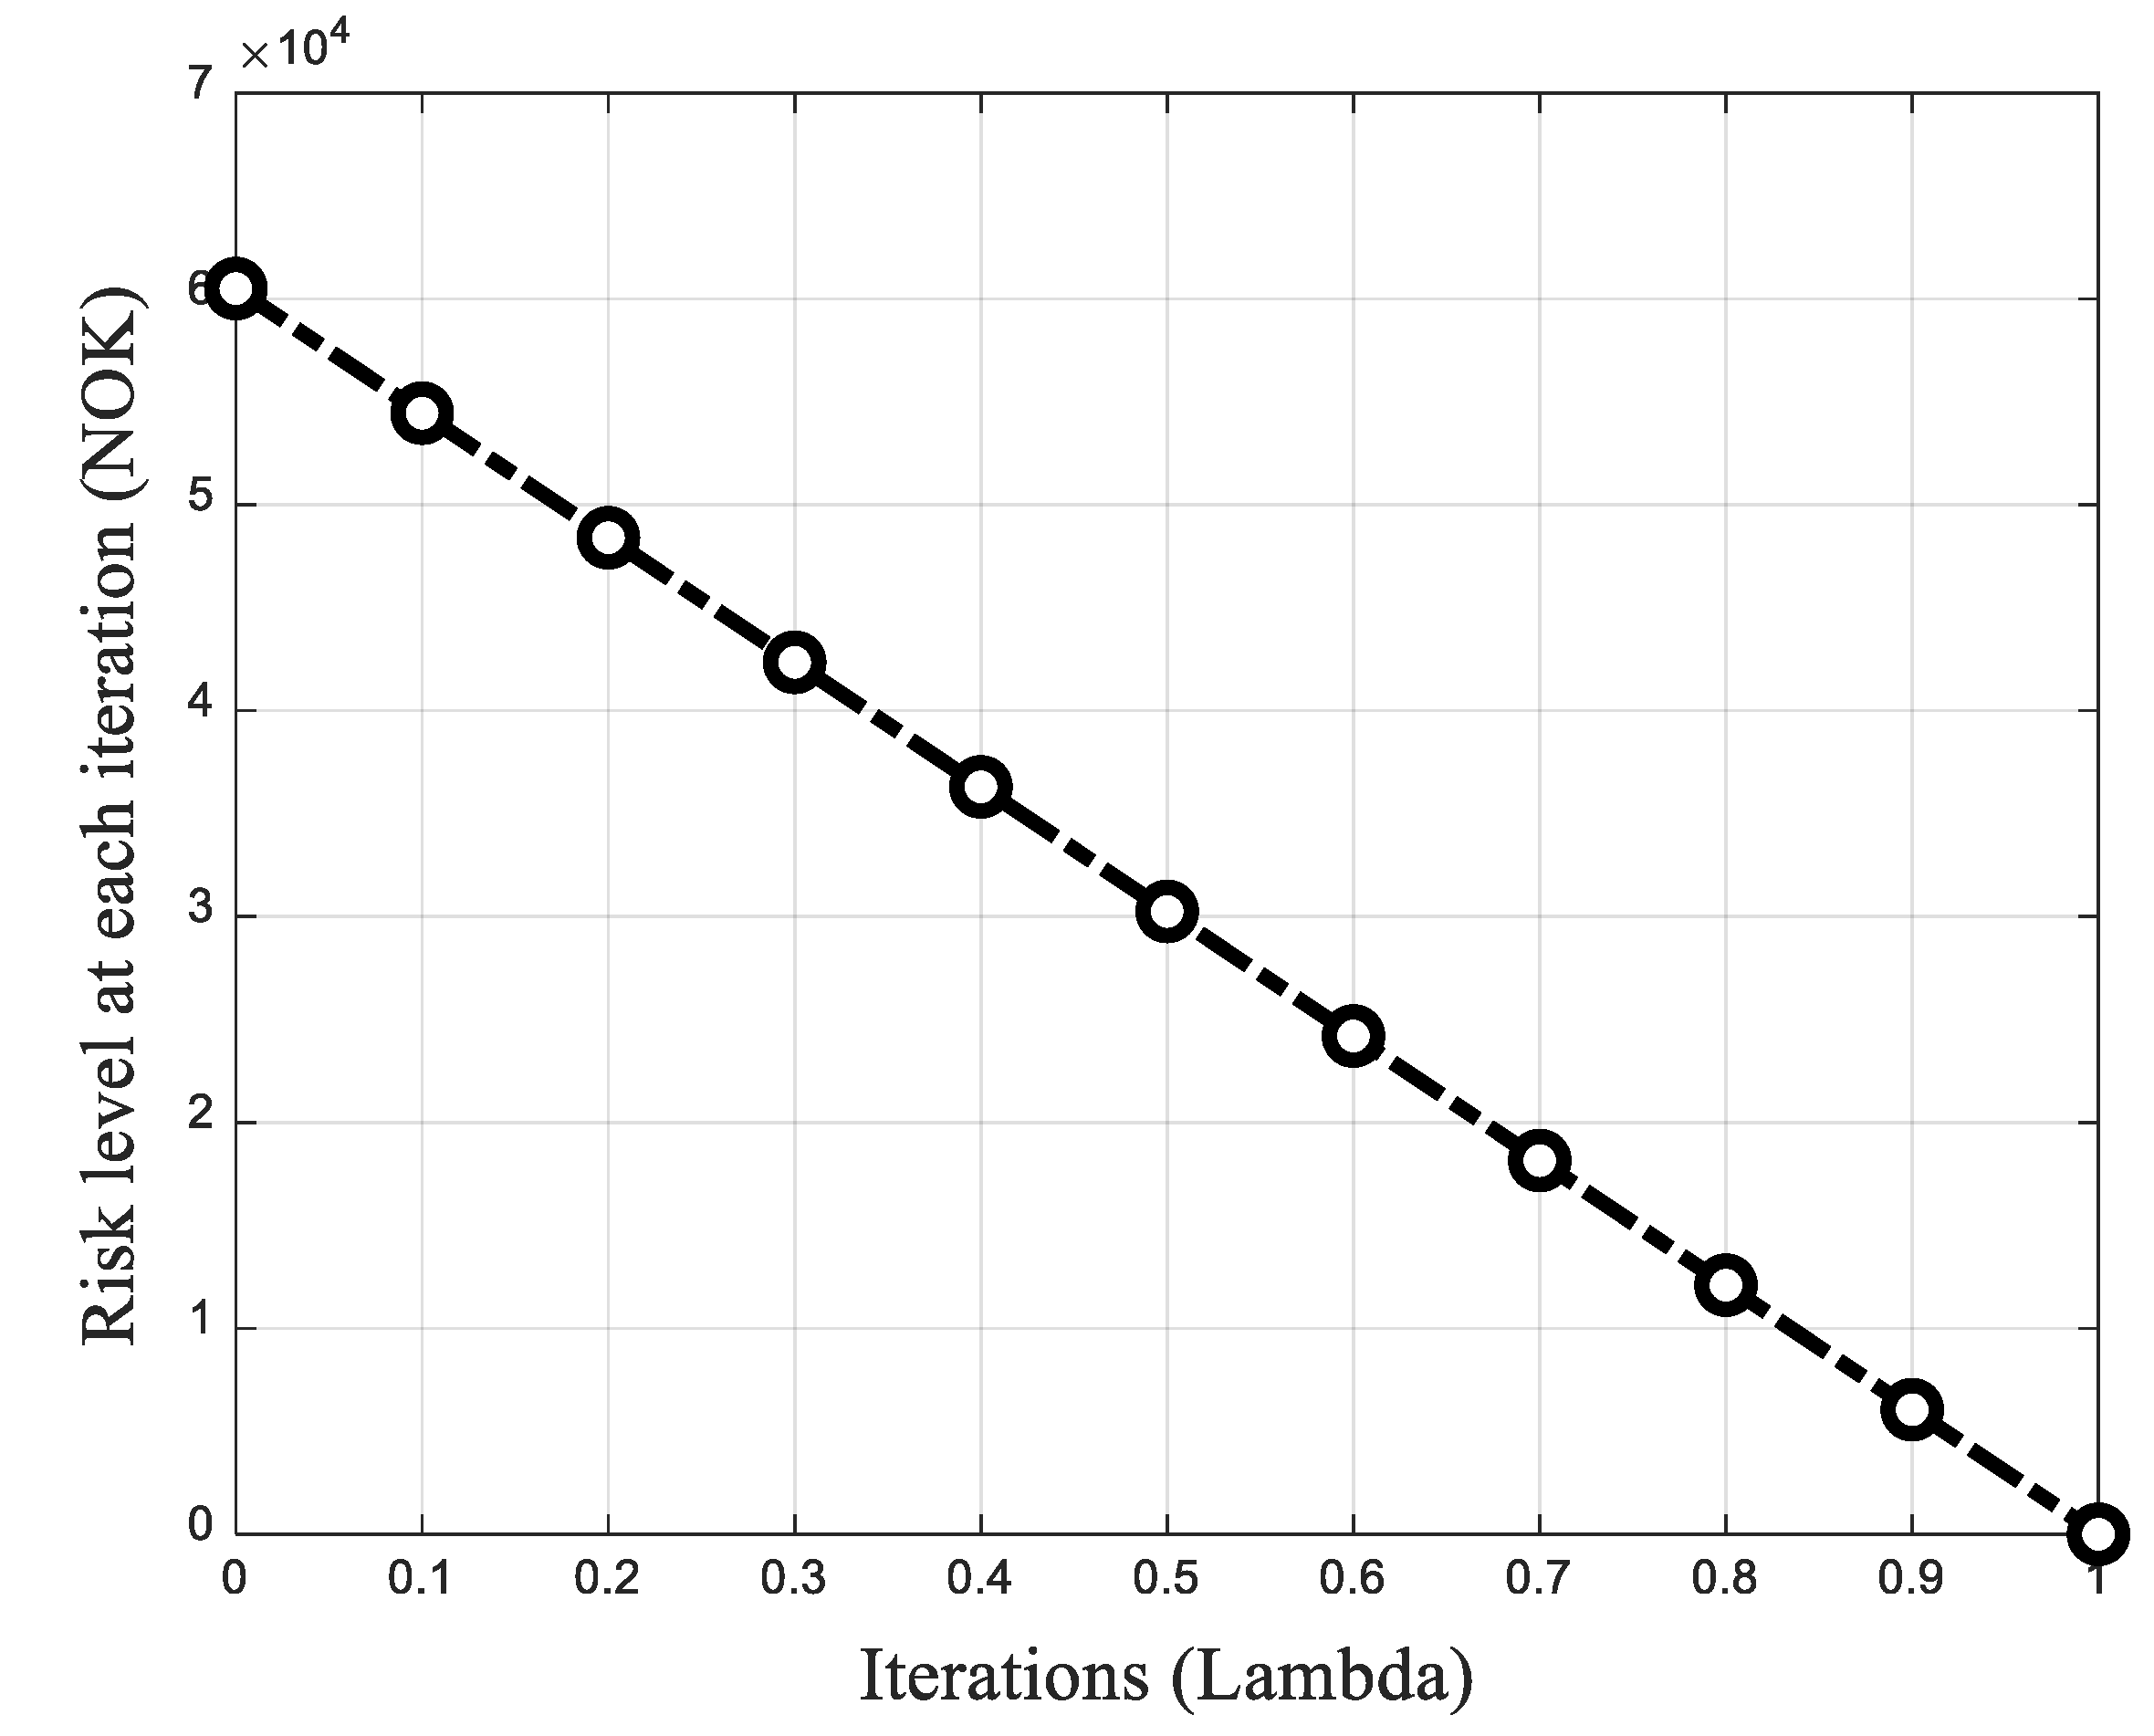
3. Downside Risk Constraint (DRC) Method
4. Study Case
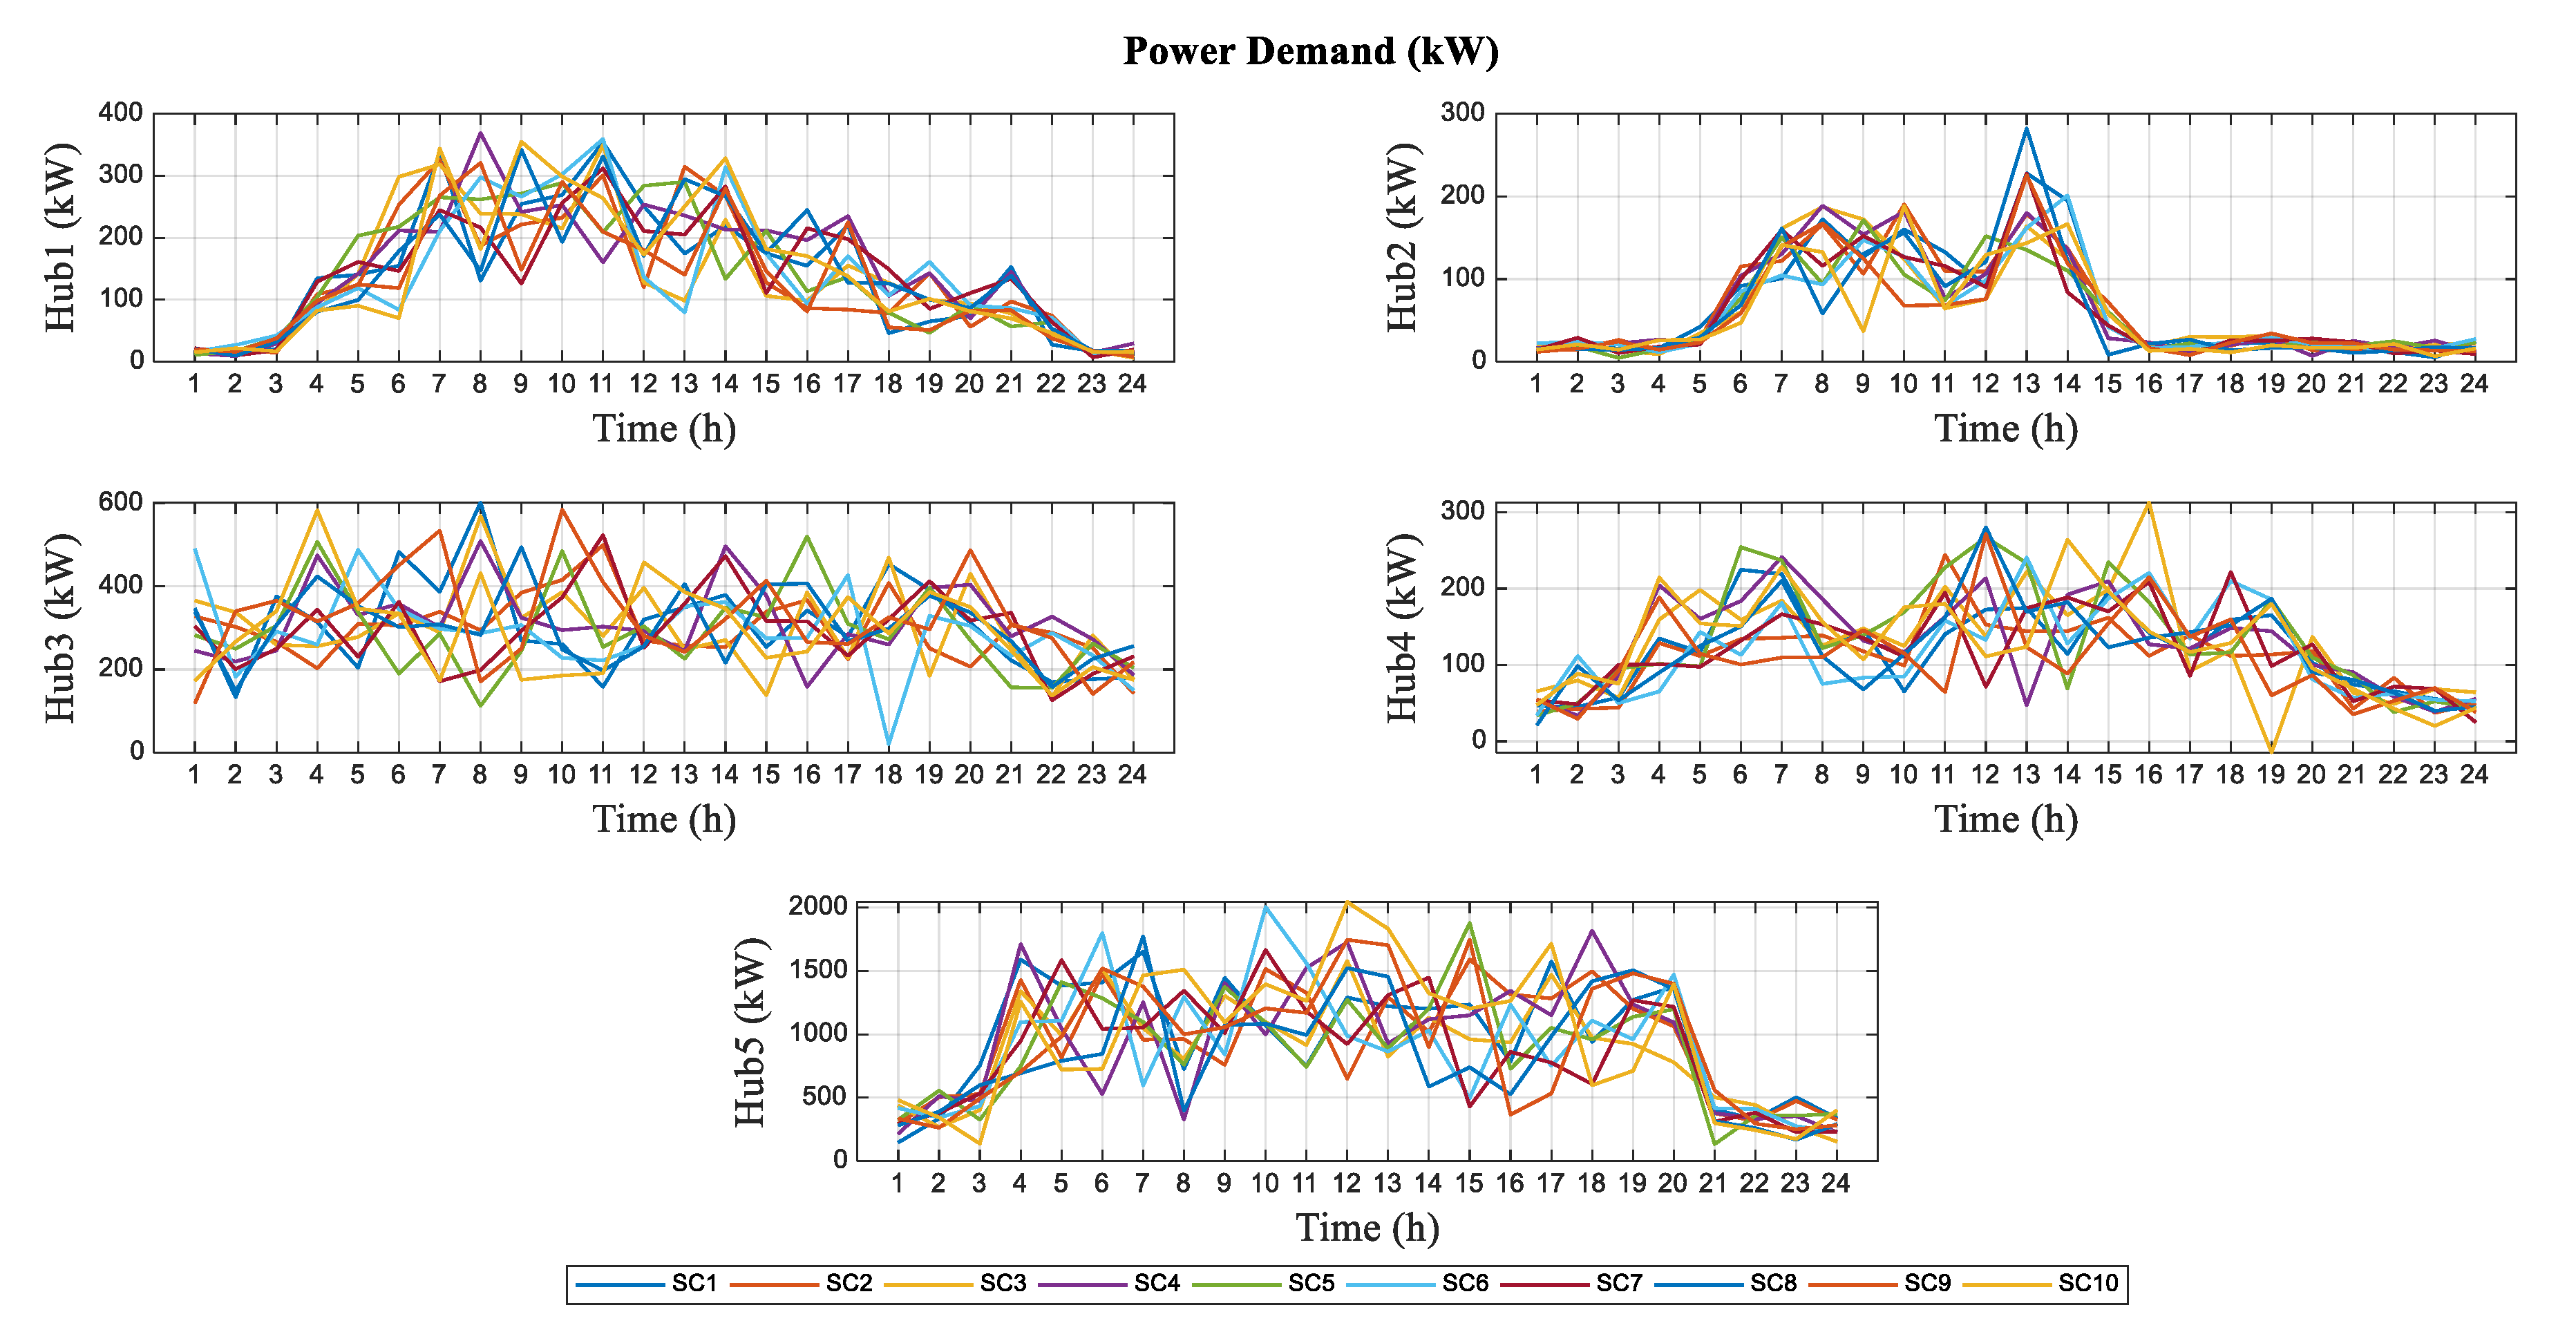
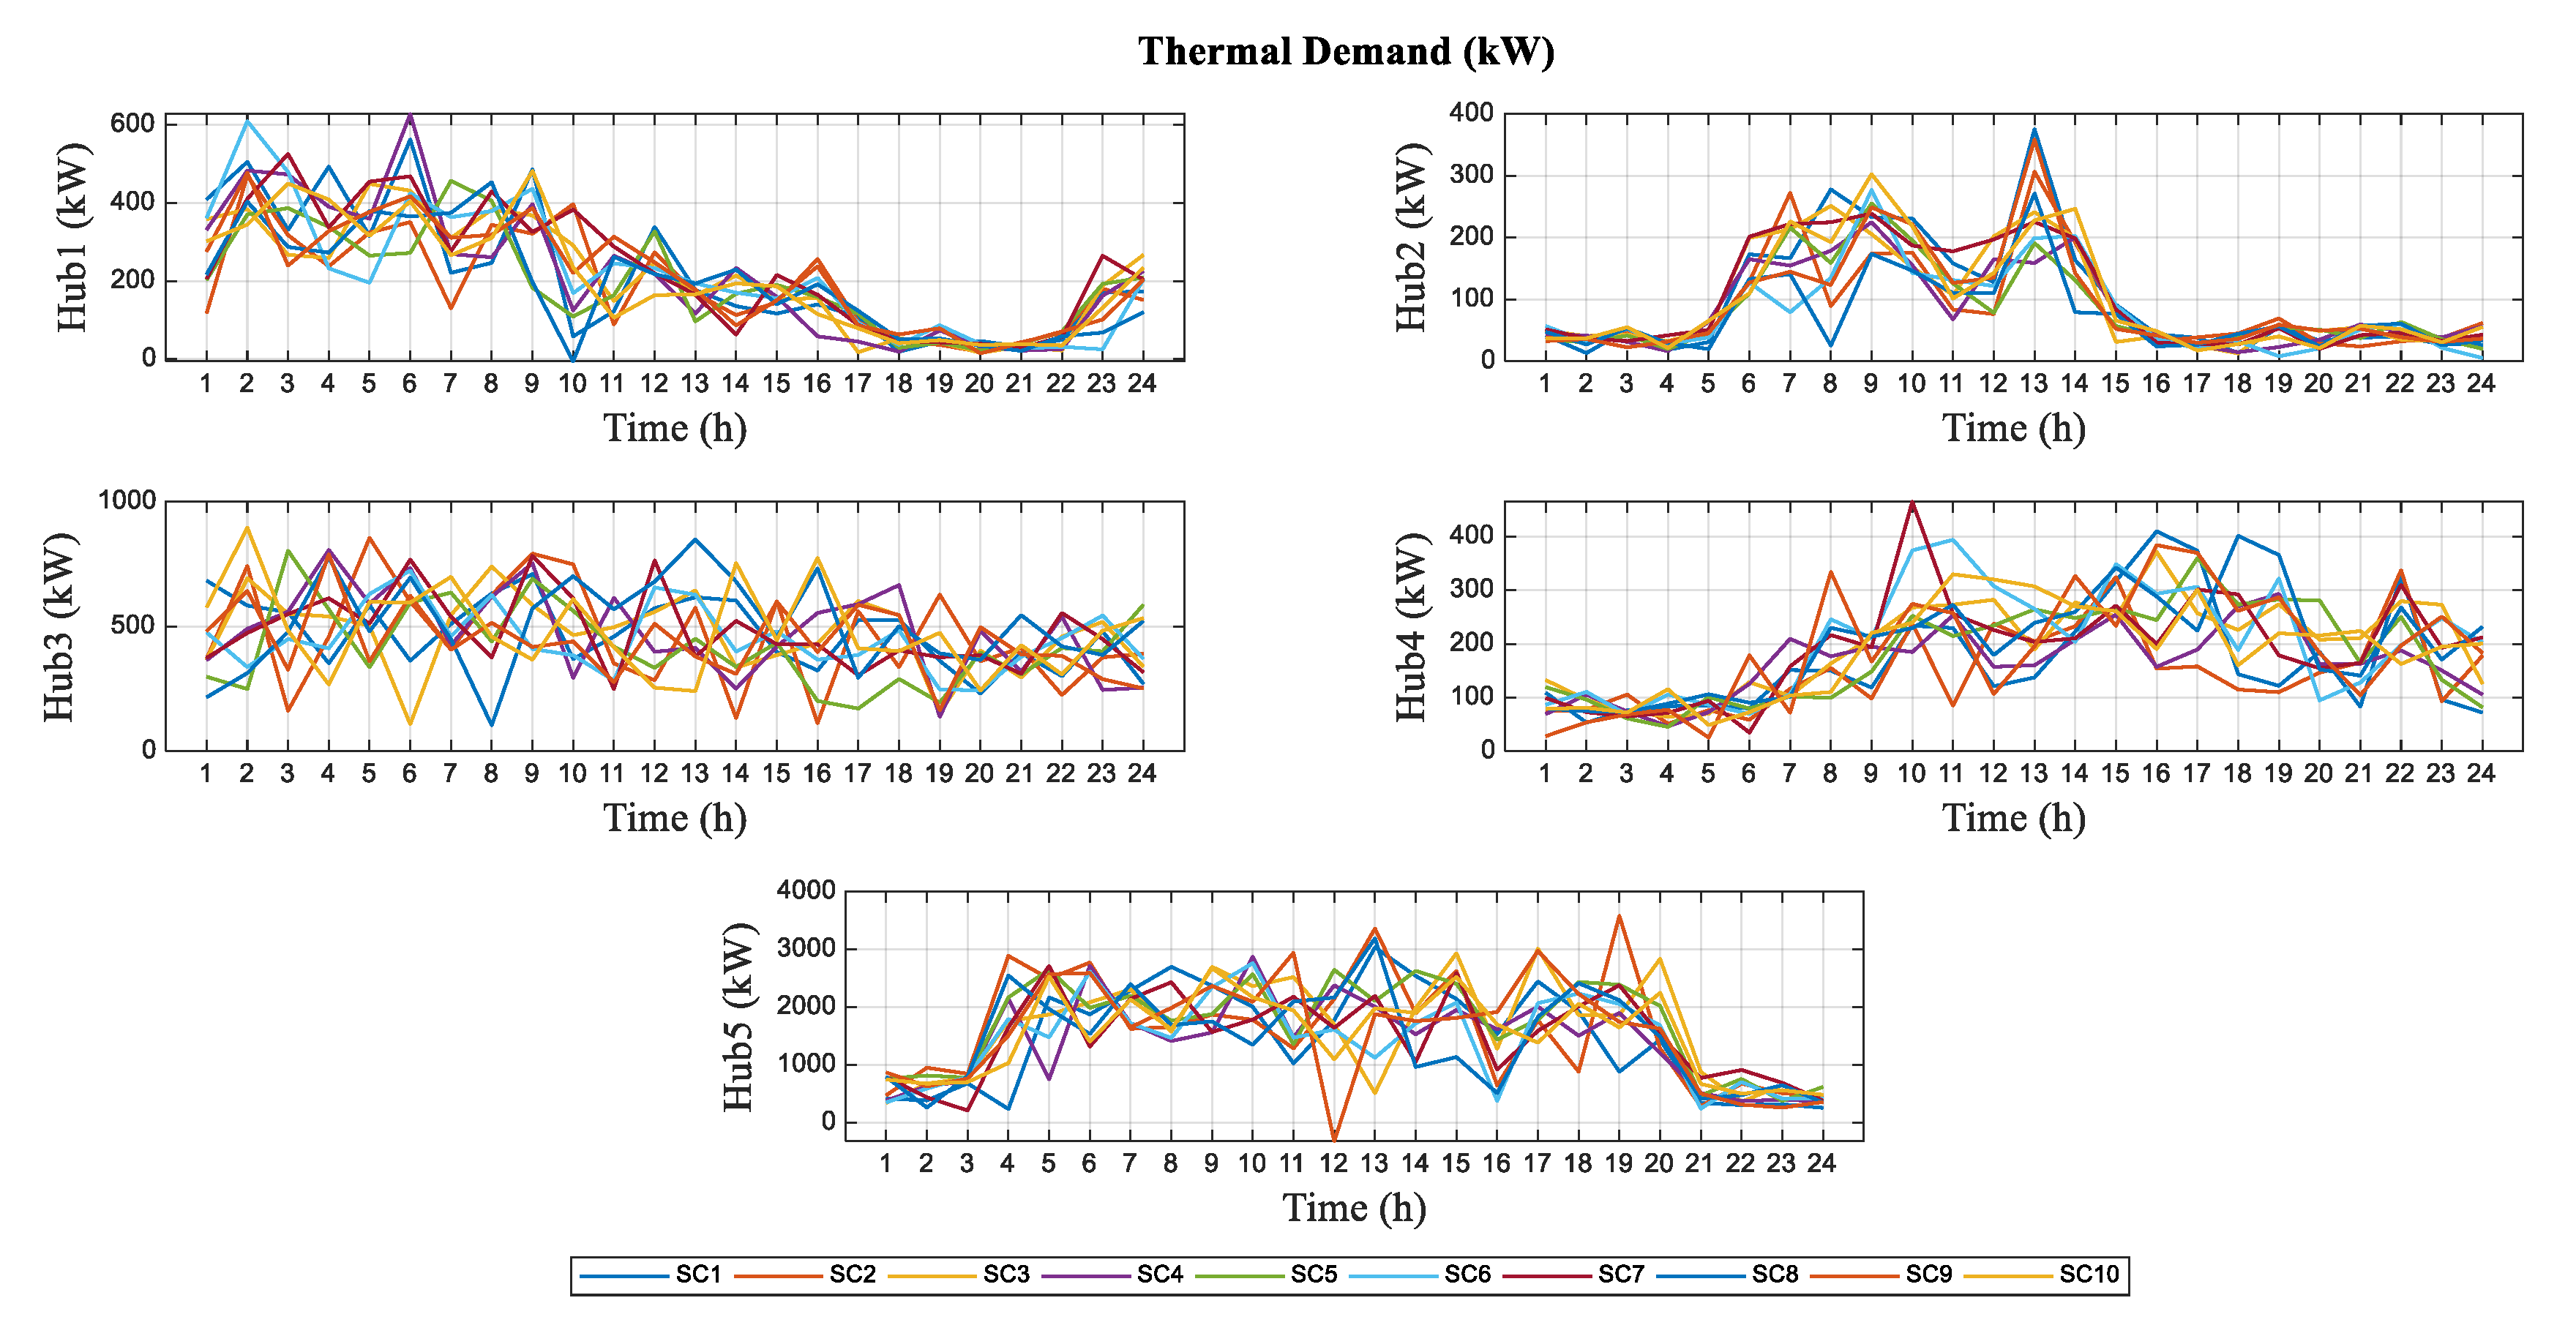
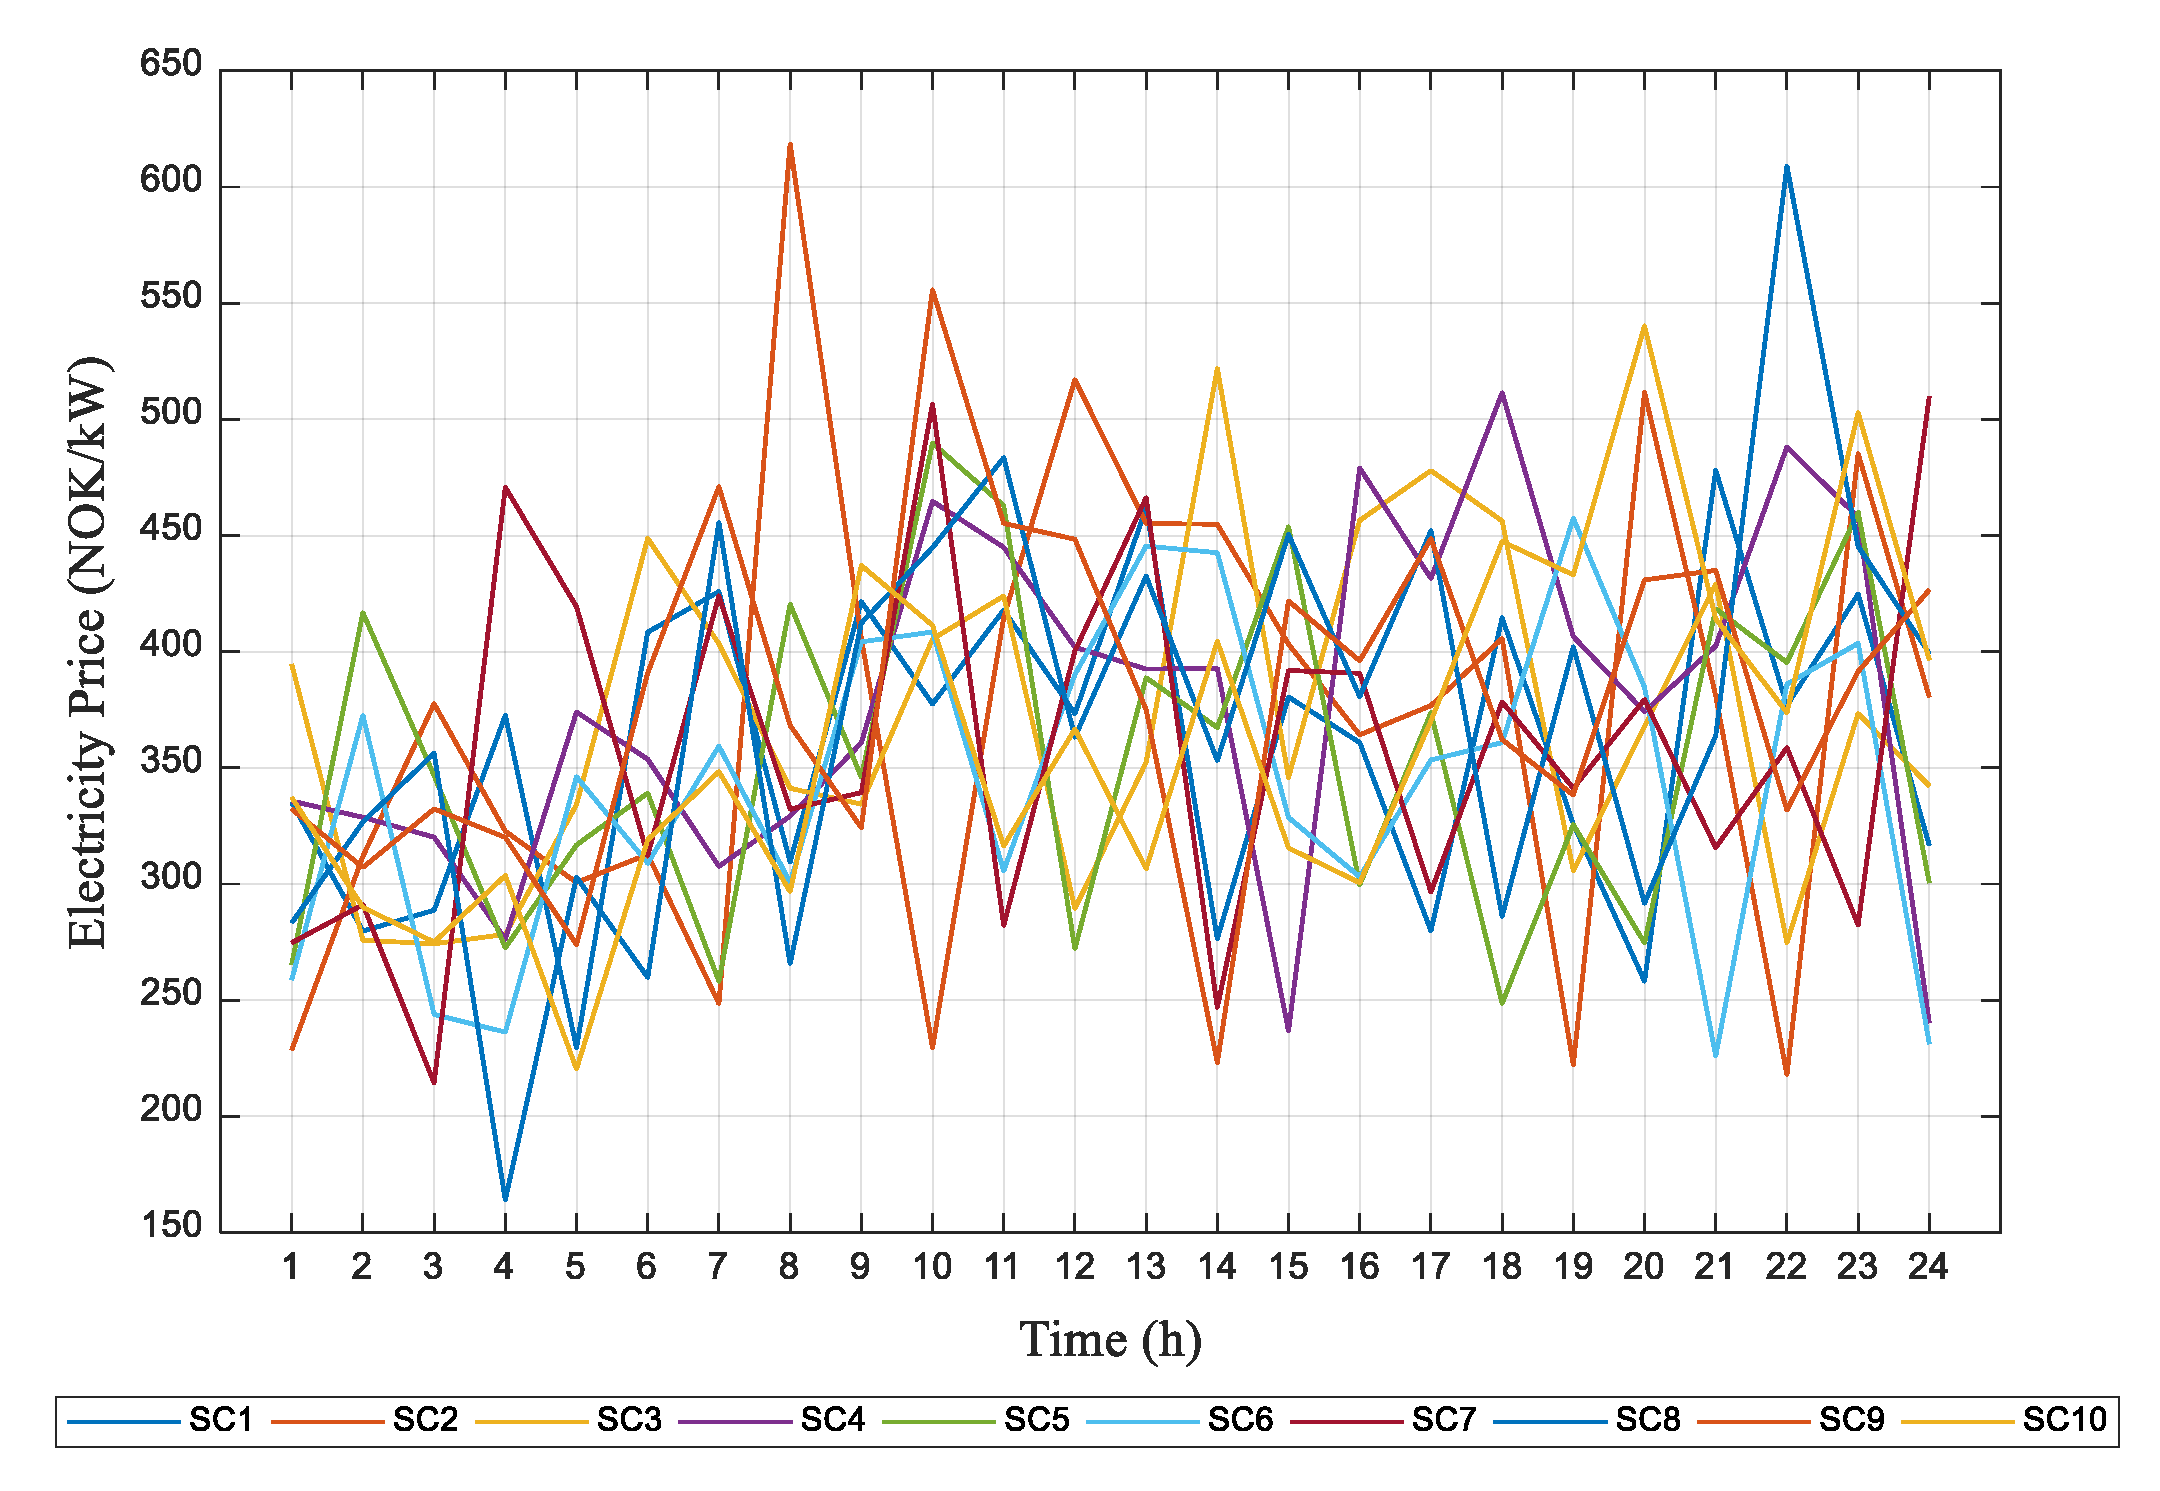
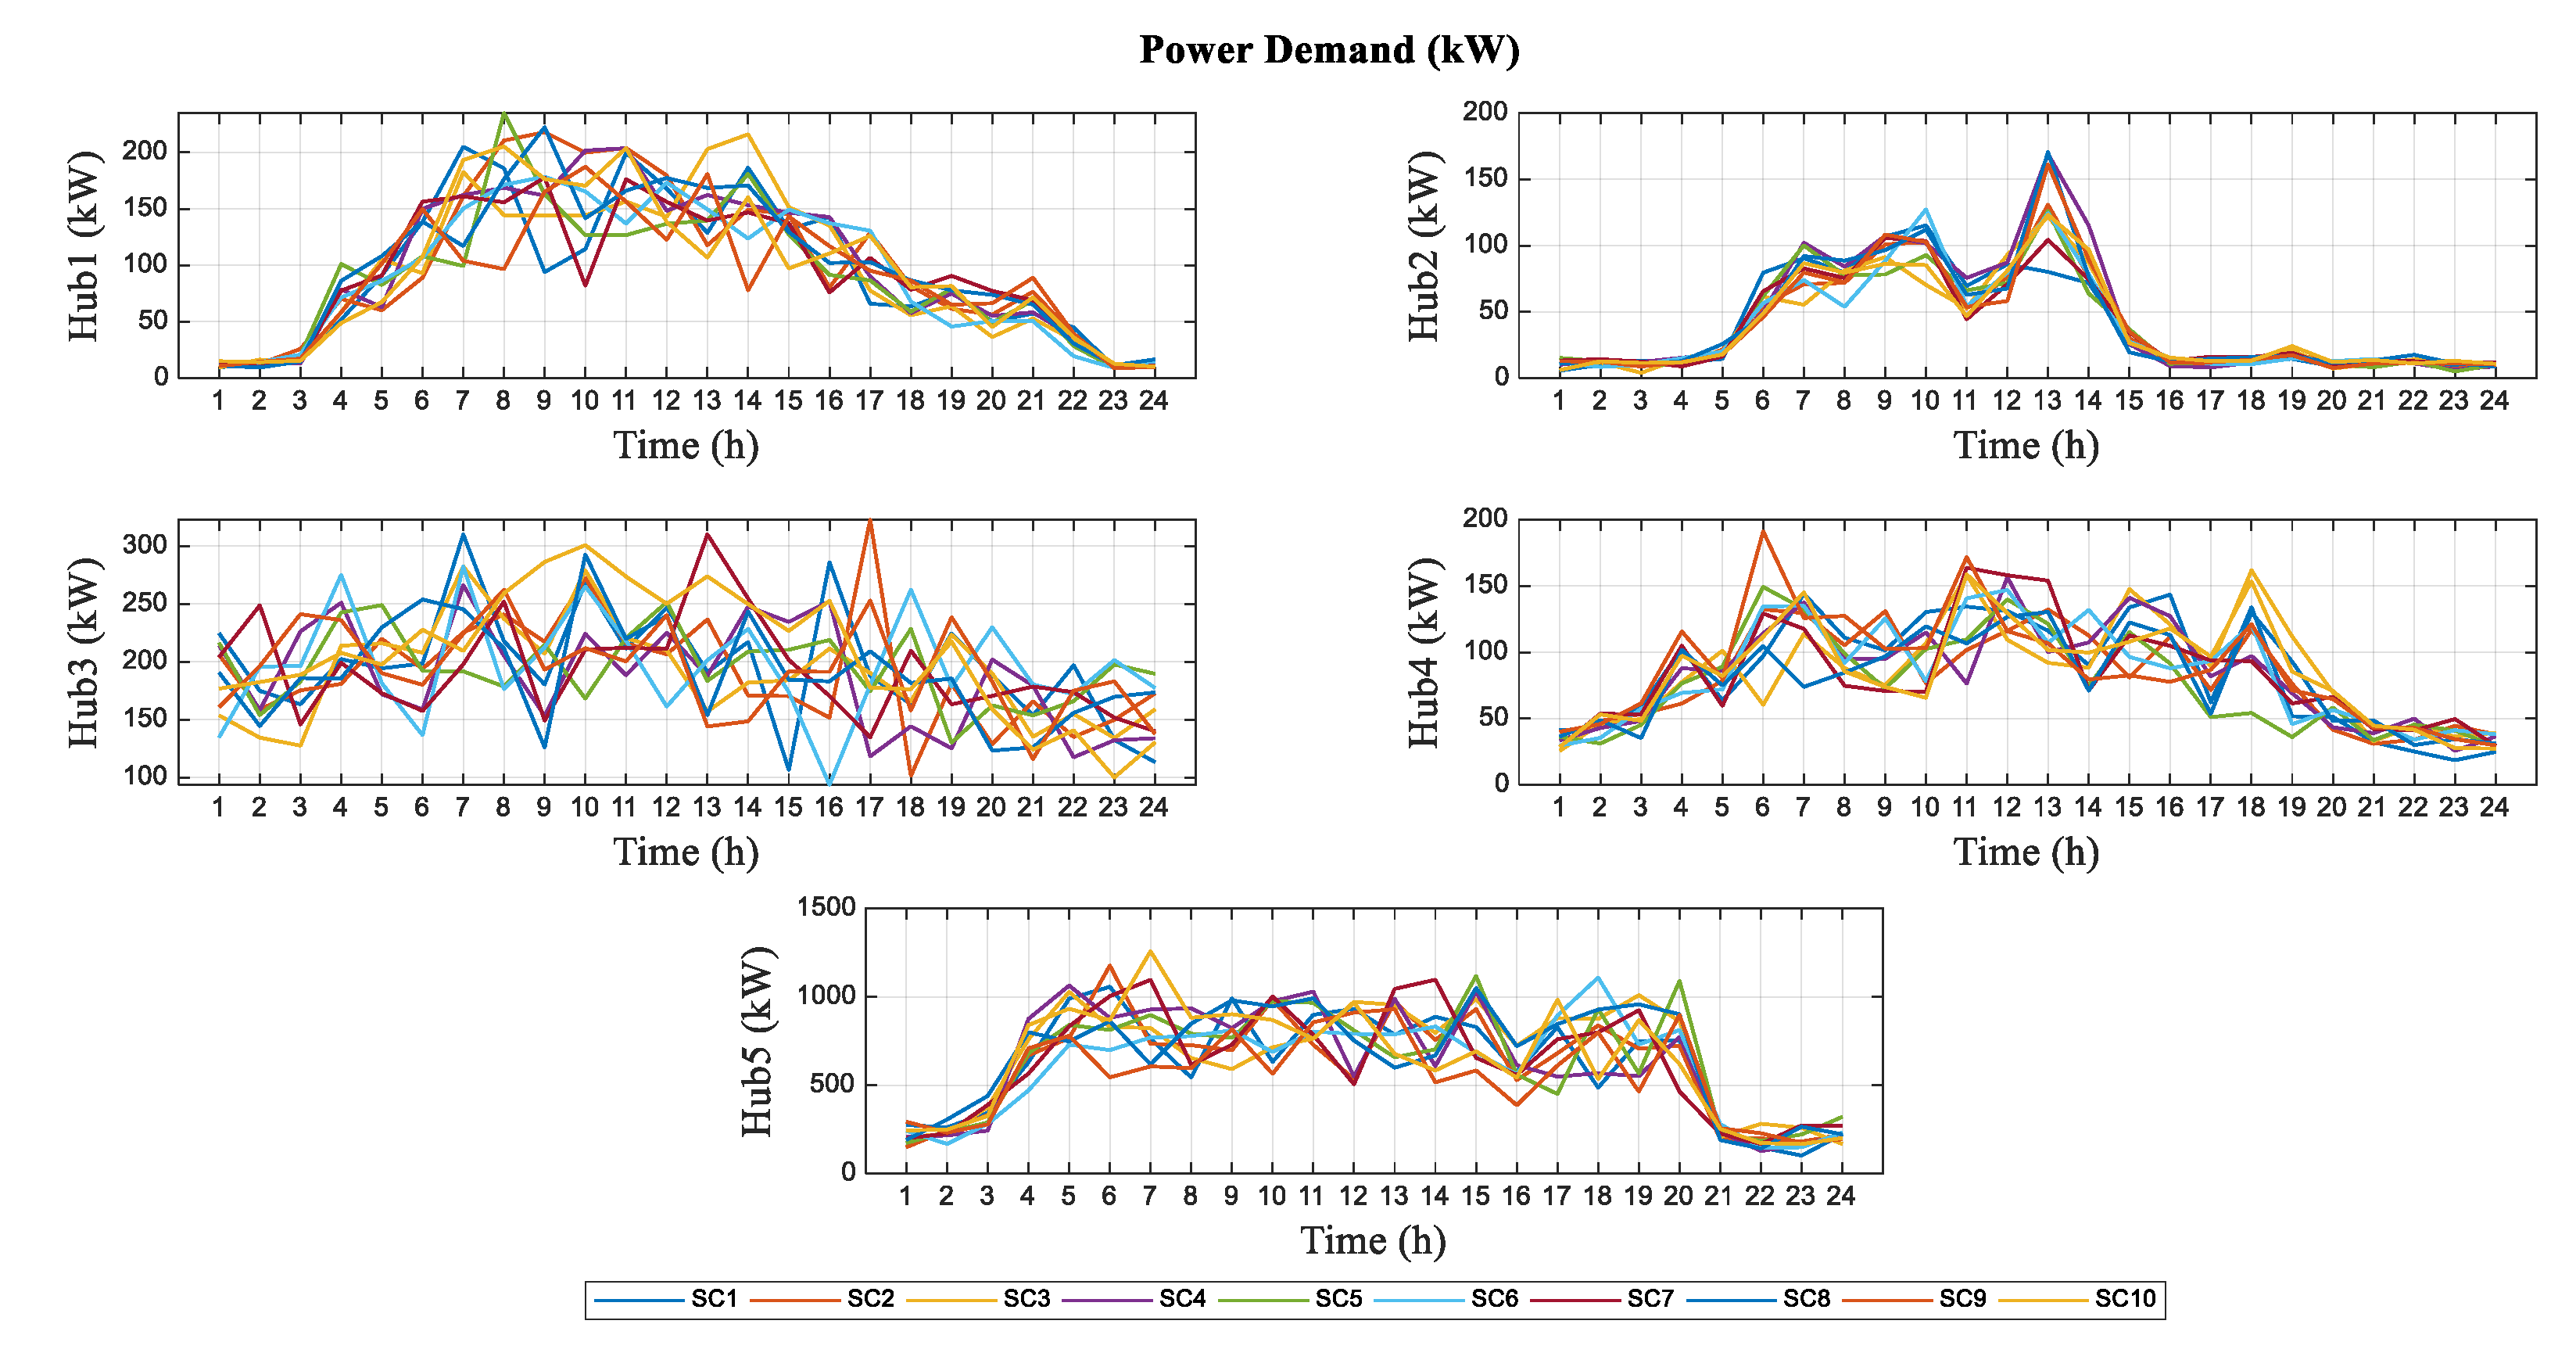
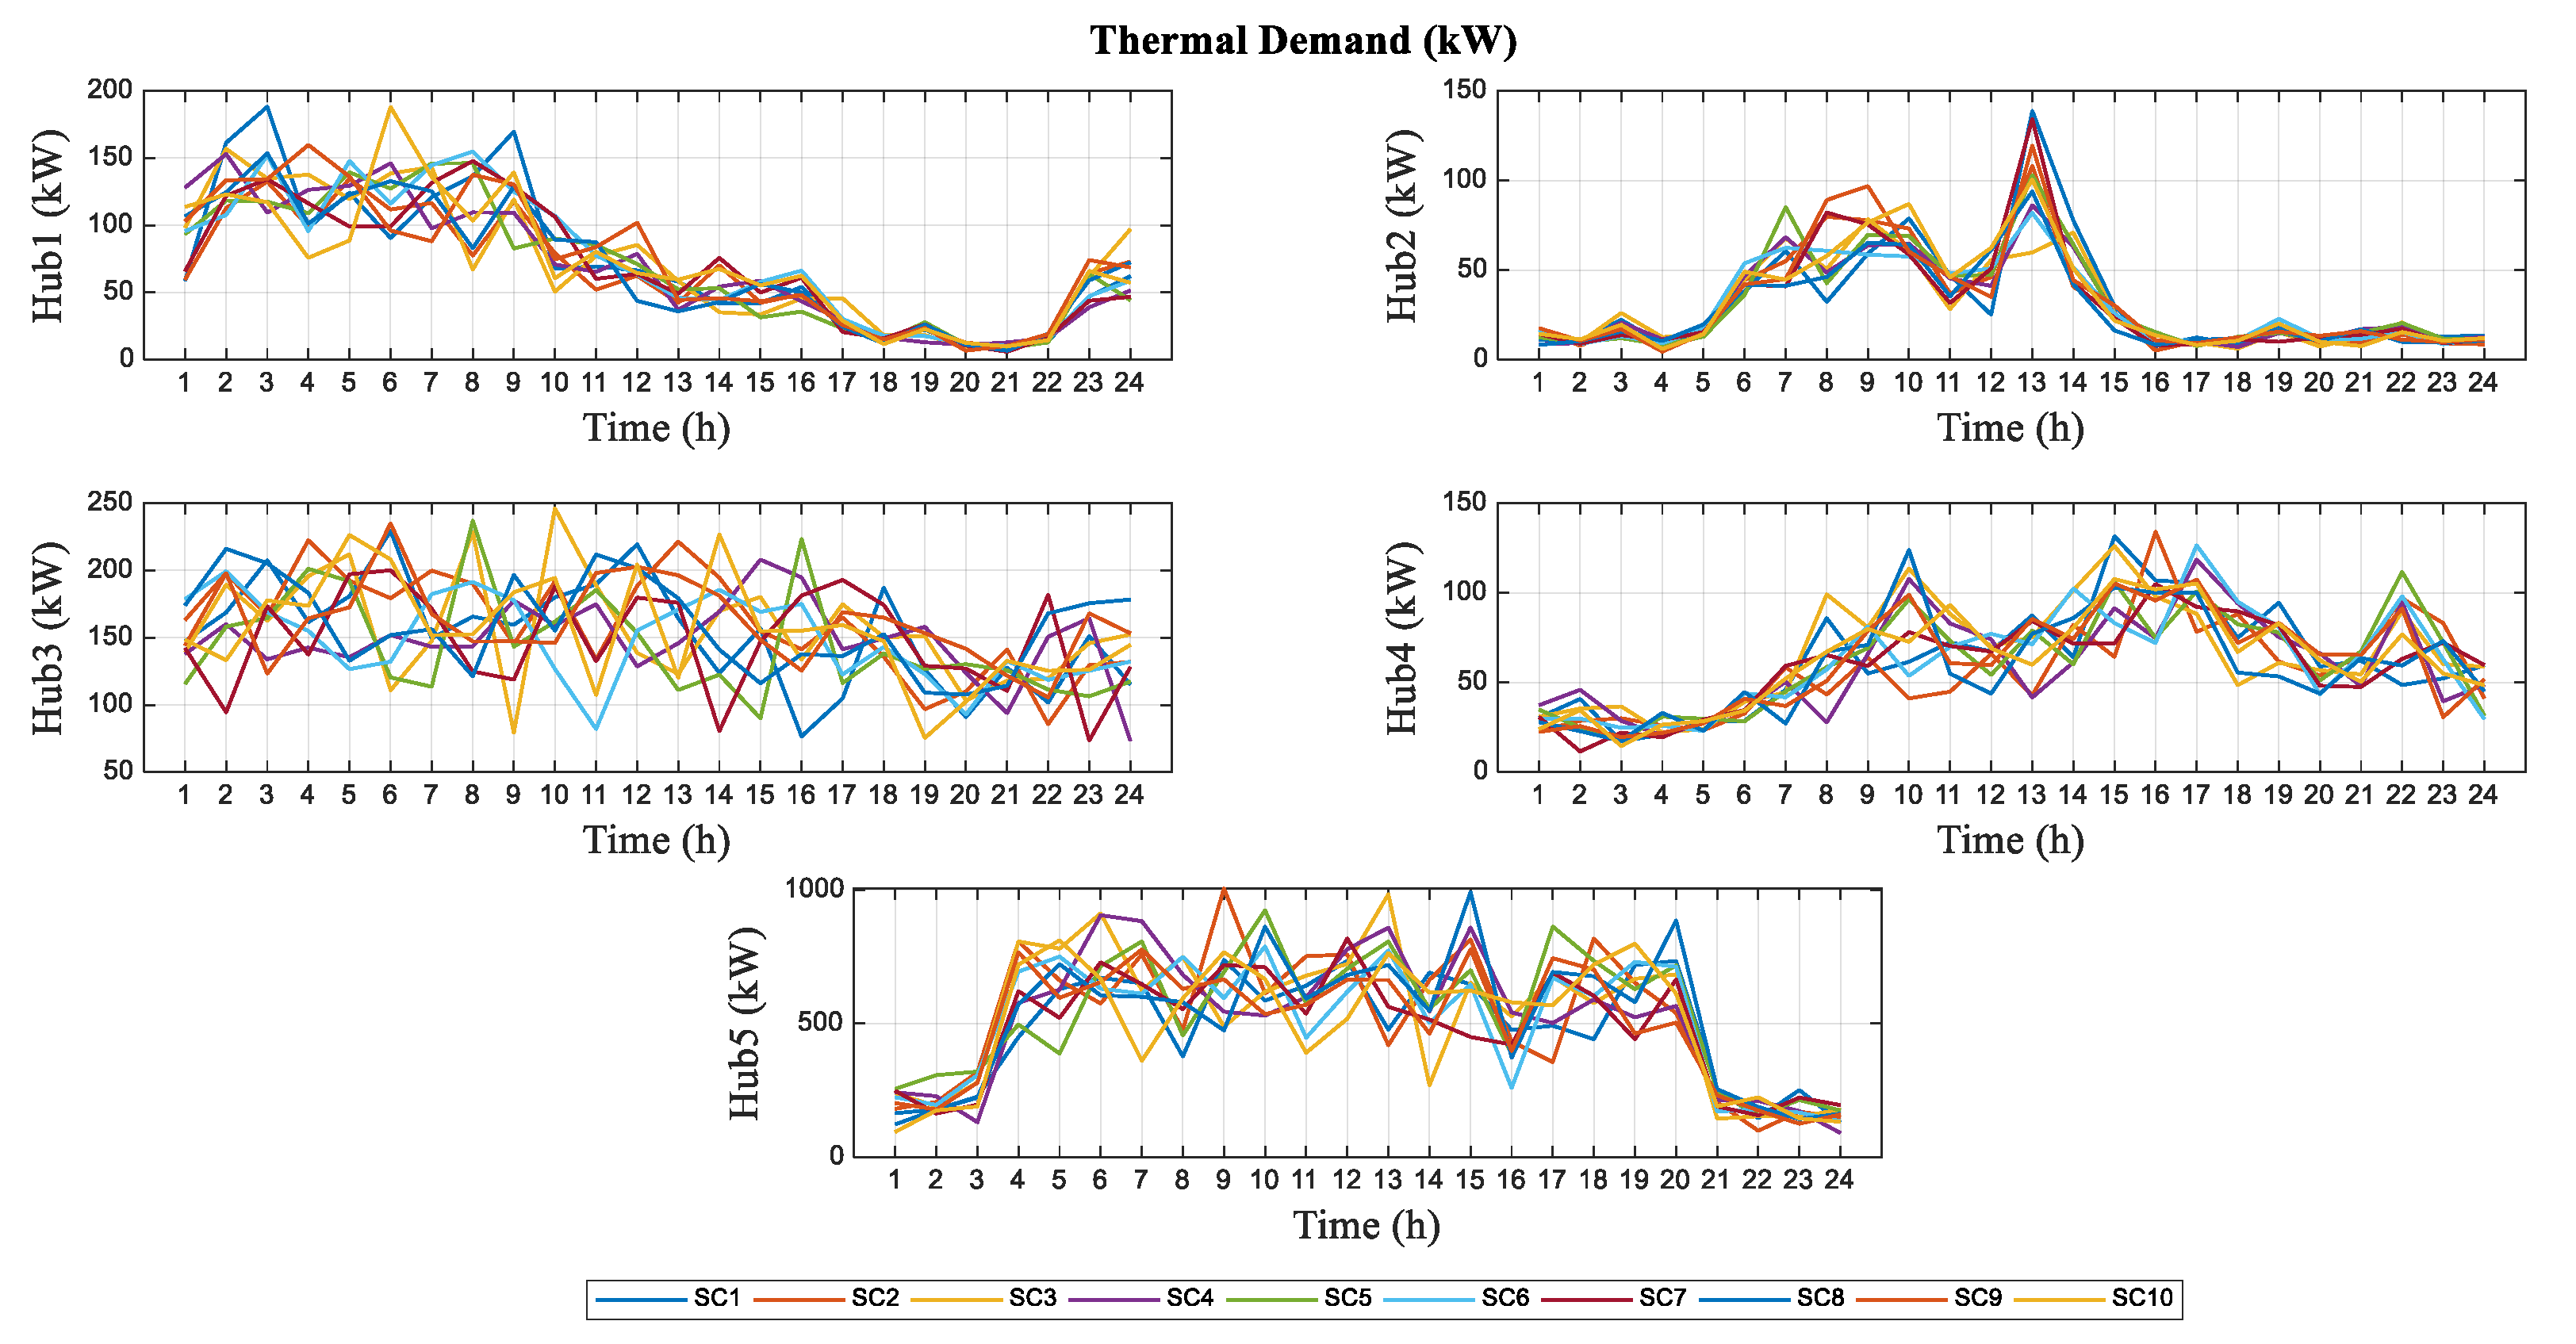
4.1. Input Data
4.2. Numerical Results
5. Results Validation
6. Conclusions
Author Contributions
Funding
Data Availability Statement
Conflicts of Interest
Nomenclature
| Sets | Load-shifting penalty for hub h | ||
| Index of time interval | Price of P2P power transaction (kWh/NOK) | ||
| Index of energy hubs | Price of P2P heat transaction | ||
| Index of scenarios | Spot price of wholesale (kWh/ NOK) | ||
| Index of CHP units | Cost coefficients of CHP units | ||
| Parameters | Variables | ||
| Energy cost (NOK/kWh) | Power consumption from the grid | ||
| The number of wind turbines in energy hubs | The maximum power demand of hub h | ||
| Wind speed | Power feed-in to the grid | ||
| Solar radiation | P2P electricity imported by hub h | ||
| The nominal capacity of wind turbine | P2P electricity imported by hub h from peer p | ||
| Rated wind speed | P2P electricity exported by hub h | ||
| Cut-in wind speed | P2P electricity exported by hub h to the peer p | ||
| Cut-out wind speed | Generated power by CHP units | ||
| Solar radiation in a typical day | Produced heat by CHP units | ||
| Radiation point | P2P heat energy imported by hub h | ||
| The nominal capacity of solar panels | P2P heat energy imported by hub h from peer p | ||
| Utility tariff cost | P2P heat energy exported by hub h | ||
| The power loss of the distribution network and P2P transaction | P2P heat energy exported by hub h to the peer p | ||
| Time duration of step t | The overall level of EV storage unit | ||
| Maximum power to meet prosumers’ needs (kWh) | Charged power to the EV storage unit | ||
| The efficiency of EV charging unit | Discharged power from the EV storage unit | ||
| The efficiency of EV discharging unit | Shifted load by hub h | ||
| The nominal capacity of the storage unit | Rescheduled load by hub h | ||
| The nominal capacity of the EV charger (kWh) | The amount of shifted power | ||
| The energy level in EVs when they arrive at work | Binary Variable | ||
| The energy level in EVs when they leave work | Binary variable to buy power from the network | ||
| The number of parked EVs during work time | Binary variable to sell power to the network | ||
| Peak power price of utility tariff (NOK/Month) | Strat-up status of CHP unit | ||
| Power demand of energy hubs (kW) | Shut-down status of the CHP unit | ||
| Heat demand of energy hubs (kW) | Commitment status of the CHP unit | ||
References
- Lingcheng, K.; Zhenning, Z.; Jiaping, X.; Jing, L.; Yuping, C. Multilateral agreement contract optimization of renewable energy power grid-connecting under uncertain supply and market demand. Comput. Ind. Eng. 2019, 135, 689–701. [Google Scholar] [CrossRef]
- Islam, M.M.; Zhong, X.; Sun, Z.; Xiong, H.; Hu, W. Real-time frequency regulation using aggregated electric vehicles in smart grid. Comput. Ind. Eng. 2019, 134, 11–26. [Google Scholar] [CrossRef]
- Nikmehr, N. Distributed robust operational optimization of networked microgrids embedded interconnected energy hubs. Energy 2020, 199, 117440. [Google Scholar] [CrossRef]
- Long, C.; Wu, J.; Zhang, C.; Thomas, L.; Cheng, M.; Jenkins, N. Peer-to-peer energy trading in a community microgrid. In Proceedings of the 2017 IEEE Power & Energy Society General Meeting, Chicago, IL, USA, 16–20 July 2017; pp. 1–5. [Google Scholar]
- Haider, S.; Walewski, J.; Schegner, P. Investigating peer-to-peer power transactions for reducing EV induced network congestion. Energy 2022, 254, 124317. [Google Scholar] [CrossRef]
- Mbungu, N.T.; Naidoo, R.M.; Bansal, R.C.; Siti, M.W.; Tungadio, D.H. An overview of renewable energy resources and grid integration for commercial building applications. J. Energy Storage 2020, 29, 101385. [Google Scholar] [CrossRef]
- Nourollahi, R.; Zare, K.; Nojavan, S. Energy Management of Hybrid AC-DC Microgrid under Demand Response Programs: Real-Time Pricing Versus Time-of-Use Pricing. In Demand Response Application in Smart Grids; Springer: Berlin/Heidelberg, Germany, 2020; pp. 75–93. [Google Scholar]
- Jian, P.; Guo, T.; Wang, D.; Valipour, E.; Nojavan, S. Risk-based energy management of industrial buildings in smart cities and peer-to-peer electricity trading using second-order stochastic dominance procedure. Sustain. Cities Soc. 2022, 77, 103550. [Google Scholar] [CrossRef]
- Salyani, P.; Nourollahi, R.; Zare, K.; Razzaghi, R. A new MILP model of switch placement in distribution networks with consideration of substation overloading during load transfer. Sustain. Energy Grids Netw. 2022, 32, 100944. [Google Scholar] [CrossRef]
- Dong, J.; Ye, C. Green scheduling of distributed two-stage reentrant hybrid flow shop considering distributed energy resources and energy storage system. Comput. Ind. Eng. 2022, 169, 108146. [Google Scholar] [CrossRef]
- Luo, X.; Liu, Y. A multiple-coalition-based energy trading scheme of hierarchical integrated energy systems. Sustain. Cities Soc. 2021, 64, 102518. [Google Scholar] [CrossRef]
- Liu, C.; Chai, K.K.; Zhang, X.; Chen, Y. Peer-to-peer electricity trading system: Smart contracts based proof-of-benefit consensus protocol. Wirel. Netw. 2021, 27, 4217–4228. [Google Scholar] [CrossRef]
- Moret, F.; Baroche, T.; Sorin, E.; Pinson, P. Negotiation algorithms for peer-to-peer electricity markets: Computational properties. In Proceedings of the 2018 Power Systems Computation Conference (PSCC), Dublin, Ireland, 11–15 June 2018; pp. 1–7. [Google Scholar]
- Burgwinkel, D. (Ed.) Blockchaintechnologie und deren Funktionsweise verstehen. In Blockchain Technology: Einführung für Business- und IT Manager; De Gruyter Oldenbourg: Berlin, Boston, Germany, 2016; pp. 3–50. [Google Scholar] [CrossRef]
- Mengelkamp, E.; Gärttner, J.; Rock, K.; Kessler, S.; Orsini, L.; Weinhardt, C. Designing microgrid energy markets: A case study: The Brooklyn Microgrid. Appl. Energy 2018, 210, 870–880. [Google Scholar] [CrossRef]
- Zhang, C.; Wu, J.; Zhou, Y.; Cheng, M.; Long, C. Peer-to-Peer energy trading in a Microgrid. Appl. Energy 2018, 220, 1–12. [Google Scholar] [CrossRef]
- Xie, B.-C.; Lu, L.; Duan, N. Environmental efficiency assessment of China’s integrated power system under the assumption of semi-disposability. Comput. Ind. Eng. 2022, 167, 108023. [Google Scholar] [CrossRef]
- Nourollahi, R.; Gholizadeh-Roshanagh, R.; Feizi-Aghakandi, H.; Zare, K.; Mohammadi-Ivatloo, B. Power distribution expansion planning in the presence of wholesale multimarkets. IEEE Syst. J. 2022; early access. [Google Scholar] [CrossRef]
- Noor, S.; Yang, W.; Guo, M.; van Dam, K.H.; Wang, X. Energy demand side management within micro-grid networks enhanced by blockchain. Appl. Energy 2018, 228, 1385–1398. [Google Scholar] [CrossRef]
- Seyfi, M.; Mehdinejad, M.; Mohammadi-Ivatloo, B.; Shayanfar, H. Scenario-based robust energy management of CCHP-based virtual energy hub for participating in multiple energy and reserve markets. Sustain. Cities Soc. 2022, 80, 103711. [Google Scholar] [CrossRef]
- Nasir, M.; Jordehi, A.R.; Matin, S.A.A.; Tabar, V.S.; Tostado-Véliz, M.; Mansouri, S.A. Optimal operation of energy hubs including parking lots for hydrogen vehicles and responsive demands. J. Energy Storage 2022, 50, 104630. [Google Scholar] [CrossRef]
- Qu, Z.; Chen, J.; Peng, K.; Zhao, Y.; Rong, Z.; Zhang, M. Enhancing stochastic multi-microgrid operational flexibility with mobile energy storage system and power transaction. Sustain. Cities Soc. 2021, 71, 102962. [Google Scholar] [CrossRef]
- Kandpal, B.; Pareek, P.; Verma, A. A robust day-ahead scheduling strategy for EV charging stations in unbalanced distribution grid. Energy 2022, 249, 123737. [Google Scholar] [CrossRef]
- Zargar, R.H.M.; Yaghmaee, M.H. Energy exchange cooperative model in SDN-based interconnected multi-microgrids. Sustain. Energy Grids Netw. 2021, 27, 100491. [Google Scholar] [CrossRef]
- Aghdam, F.H.; Kalantari, N.T.; Mohammadi-Ivatloo, B. A stochastic optimal scheduling of multi-microgrid systems considering emissions: A chance constrained model. J. Clean. Prod. 2020, 275, 122965. [Google Scholar] [CrossRef]
- Sobhani, S.O.; Sheykhha, S.; Madlener, R. An integrated two-level demand-side management game applied to smart energy hubs with storage. Energy 2020, 206, 118017. [Google Scholar] [CrossRef]
- Li, L.; Zhang, S. Peer-to-peer multi-energy sharing for home microgrids: An integration of data-driven and model-driven approaches. Int. J. Electr. Power Energy Syst. 2021, 133, 107243. [Google Scholar] [CrossRef]
- Nguyen, D.H.; Ishihara, T. Distributed peer-to-peer energy trading for residential fuel cell combined heat and power systems. Int. J. Electr. Power Energy Syst. 2021, 125, 106533. [Google Scholar] [CrossRef]
- Gan, W.; Yan, M.; Yao, W.; Wen, J. Peer to peer transactive energy for multiple energy hub with the penetration of high-level renewable energy. Appl. Energy 2021, 295, 117027. [Google Scholar] [CrossRef]
- Nourollahi, R.; Salyani, P.; Zare, K.; Mohammadi-Ivatloo, B.; Abdul-Malek, Z. Peak-Load Management of Distribution Network Using Conservation Voltage Reduction and Dynamic Thermal Rating. Sustainability 2022, 14, 11569. [Google Scholar] [CrossRef]
- Lüth, A.; Zepter, J.M.; del Granado, P.C.; Egging, R. Local electricity market designs for peer-to-peer trading: The role of battery flexibility. Appl. Energy 2018, 229, 1233–1243. [Google Scholar] [CrossRef] [Green Version]
- Howell, A.; Saber, T.; Bendechache, M. Measuring node decentralisation in blockchain peer to peer networks. Blockchain Res. Appl. 2022, 100109. [Google Scholar] [CrossRef]
- Dong, J.; Song, C.; Liu, S.; Yin, H.; Zheng, H.; Li, Y. Decentralized peer-to-peer energy trading strategy in energy blockchain environment: A game-theoretic approach. Appl. Energy 2022, 325, 119852. [Google Scholar] [CrossRef]
- McIlvenna, A.; Herron, A.; Hambrick, J.; Ollis, B.; Ostrowski, J. Reducing the computational burden of a microgrid energy management system. Comput. Ind. Eng. 2020, 143, 106384. [Google Scholar] [CrossRef]
- Sperstad, I.B.; Helseth, A.; Korpås, M. Valuation of Stored Energy in Dynamic Optimal Power Flow of Distribution Systems with Energy Storage. In Proceedings of the 2016 International Conference on Probabilistic Methods Applied to Power Systems (PMAPS), Beijing, China, 16–20 October 2016; pp. 1–8. [Google Scholar]
- Zhang, H.; Cai, J.; Fang, K.; Zhao, F.; Sutherland, J.W. Operational optimization of a grid-connected factory with onsite photovoltaic and battery storage systems. Appl. Energy 2017, 205, 1538–1547. [Google Scholar] [CrossRef]
- Sæther, G.; Del Granado, P.C.; Zaferanlouei, S. Peer-to-peer electricity trading in an industrial site: Value of buildings flexibility on peak load reduction. Energy Build. 2021, 236, 110737. [Google Scholar] [CrossRef]
- Jafarikia, S.; Feghhi, S. Built in importance estimation in forward Monte Carlo calculations. Ann. Nucl. Energy 2022, 177, 109298. [Google Scholar] [CrossRef]
- Gökçer, T.Y.; Aslan, İ. Approximation by Kantorovich-type max-min operators and its applications. Appl. Math. Comput. 2022, 423, 127011. [Google Scholar] [CrossRef]
- Rezaei, N.; Pezhmani, Y.; Khazali, A. Economic-environmental risk-averse optimal heat and power energy management of a grid-connected multi microgrid system considering demand response and bidding strategy. Energy 2022, 240, 122844. [Google Scholar] [CrossRef]


| SC = 1 | SC = 2 | SC = 3 | SC = 4 | SC = 5 | SC = 6 | SC = 7 | SC = 8 | SC = 9 | SC = 10 | |
|---|---|---|---|---|---|---|---|---|---|---|
| t = 1 | 0.2125 | 0.2762 | 0.4314 | 0.3241 | 0.3631 | 0.3883 | 0.2539 | 0.3572 | 0.3039 | 0.2153 |
| t = 2 | 0.3486 | 0.2504 | 0.2775 | 0.2111 | 0.2695 | 0.3523 | 0.4421 | 0.2276 | 0.3448 | 0.3589 |
| t = 3 | 0.3888 | 0.4054 | 0.2231 | 0.3130 | 0.4031 | 0.3503 | 0.4162 | 0.4021 | 0.4889 | 0.1063 |
| t = 4 | 0.2782 | 0.2776 | 0.1954 | 0.2638 | 0.4112 | 0.3078 | 0.3762 | 0.4273 | 0.2813 | 0.2723 |
| t = 5 | 0.2078 | 0.2883 | 0.2545 | 0.2928 | 0.2923 | 0.2534 | 0.2211 | 0.2805 | 0.3109 | 0.2404 |
| t = 6 | 0.3793 | 0.3360 | 0.3259 | 0.4281 | 0.5496 | 0.4225 | 0.4046 | 0.3490 | 0.3599 | 0.3993 |
| t = 7 | 0.3250 | 0.2364 | 0.4177 | 0.3110 | 0.4144 | 0.2988 | 0.2590 | 0.2448 | 0.4037 | 0.5615 |
| t = 8 | 0.403 | 0.4308 | 0.3975 | 0.4058 | 0.6106 | 0.3087 | 0.3684 | 0.3191 | 0.4522 | 0.4082 |
| t = 9 | 0.359 | 0.4635 | 0.2927 | 0.4026 | 0.4105 | 0.5448 | 0.4436 | 0.3942 | 0.2596 | 0.2471 |
| t = 10 | 0.4481 | 0.3221 | 0.3669 | 0.3056 | 0.4082 | 0.4127 | 0.5607 | 0.5679 | 0.4941 | 0.4963 |
| t = 11 | 0.2697 | 0.5027 | 0.2914 | 0.2287 | 0.6829 | 0.4115 | 0.3180 | 0.3819 | 0.3877 | 0.1839 |
| t = 12 | 0.3095 | 0.4268 | 0.3803 | 0.2202 | 0.3306 | 0.3628 | 0.3846 | 0.2187 | 0.4010 | 0.5211 |
| t = 13 | 0.2244 | 0.4139 | 0.4983 | 0.4084 | 0.4279 | 0.3287 | 0.3557 | 0.2662 | 0.3616 | 0.3214 |
| t = 14 | 0.3112 | 0.5073 | 0.3616 | 0.4311 | 0.4074 | 0.2780 | 0.1965 | 0.2389 | 0.3982 | 0.3444 |
| t = 15 | 0.4501 | 0.3423 | 0.2532 | 0.3879 | 0.4824 | 0.4033 | 0.3606 | 0.3384 | 0.4982 | 0.4647 |
| t = 16 | 0.3398 | 0.2525 | 0.2937 | 0.4124 | 0.2767 | 0.3438 | 0.3690 | 0.3179 | 0.3212 | 0.3591 |
| t = 17 | 0.3301 | 0.2543 | 0.4533 | 0.2948 | 0.4819 | 0.3499 | 0.3534 | 0.5068 | 0.4078 | 0.3443 |
| t = 18 | 0.3051 | 0.3345 | 0.4230 | 0.4660 | 0.3892 | 0.3372 | 0.4168 | 0.4491 | 0.3440 | 0.5233 |
| t = 19 | 0.3493 | 0.4706 | 0.4773 | 0.3897 | 0.3761 | 0.4688 | 0.2110 | 0.3875 | 0.3909 | 0.4194 |
| t = 20 | 0.2996 | 0.2491 | 0.1309 | 0.4372 | 0.4885 | 0.3420 | 0.6137 | 0.3232 | 0.2586 | 0.370 |
| t = 21 | 0.3960 | 0.4517 | 0.3976 | 0.3122 | 0.2389 | 0.3292 | 0.2543 | 0.4556 | 0.3758 | 0.2071 |
| t = 22 | 0.4198 | 0.2960 | 0.5145 | 0.3897 | 0.4067 | 0.3089 | 0.4350 | 0.3909 | 0.4055 | 0.3539 |
| t = 23 | 0.4451 | 0.1496 | 0.3993 | 0.4839 | 0.3651 | 0.4388 | 0.3263 | 0.4000 | 0.3274 | 0.4932 |
| t = 24 | 0.4254 | 0.5116 | 0.3767 | 0.3750 | 0.4105 | 0.5185 | 0.1532 | 0.2211 | 0.5013 | 0.5609 |
| CHP Units | a ($/kW2) | b ($/kW2) | c ($) | d ($/kWth2) | e ($/kWth) | f ($/kW.kWth) | Feasible Region Coordinates |
|---|---|---|---|---|---|---|---|
| CHP 1 | 0.0345 | 44.5 | 26.5 | 0.03 | 4.2 | 0.031 | [1.258 0], [1.258 0.324], [1.102 1.356], [0.4 0.75], [0.44 0.159], [0.44 0] |
| CHP 2 | 0.0435 | 56 | 12.5 | 0.027 | 0.6 | 0.011 | [2.47 0], [2.15 1.8], [0.81 1.048], [0.988 0] |
| n1 | SC = 1 | SC = 2 | SC = 3 | SC = 4 | SC = 5 | SC = 6 | SC = 7 | SC = 8 | SC = 9 | SC = 10 |
|---|---|---|---|---|---|---|---|---|---|---|
| λ = 0 | 223,296 | 663,866 | 478,104 | 419,689 | 252,088 | 586,506 | 377,805 | 366,694 | 560,148 | 560,861 |
| λ = 0.1 | 239,965 | 663,866 | 478,104 | 441,956 | 279,744 | 586,506 | 411,143 | 387,756 | 560,148 | 560,861 |
| λ = 0.2 | 295,246 | 663,867 | 478,105 | 454,059 | 301,644 | 586,506 | 416,584 | 414,024 | 560,148 | 560,861 |
| λ = 0.3 | 282,311 | 663,867 | 486,978 | 478,361 | 339,428 | 586,506 | 448,238 | 463,084 | 560,148 | 560,861 |
| λ = 0.4 | 283,285 | 663,867 | 502,102 | 492,357 | 406,741 | 586,506 | 470,921 | 494,234 | 560,148 | 560,861 |
| λ = 0.5 | 322,415 | 663,867 | 517,226 | 477,362 | 484,446 | 586,506 | 482,204 | 517,226 | 560,148 | 560,861 |
| λ = 0.6 | 381,447 | 663,867 | 532,350 | 515,415 | 532,350 | 586,506 | 485,118 | 505,438 | 560,148 | 560,861 |
| λ = 0.7 | 547,474 | 663,867 | 547,474 | 547,474 | 464,808 | 586,506 | 489,965 | 506,162 | 560,148 | 560,861 |
| λ = 0.8 | 514,006 | 663,867 | 564,691 | 564,691 | 564,691 | 586,506 | 494,385 | 564,691 | 564,691 | 564,691 |
| λ = 0.9 | 603,371 | 663,867 | 603,371 | 603,371 | 598,991 | 603,371 | 603,371 | 547,256 | 603,371 | 603,371 |
| λ = 1 | 663,867 | 663,867 | 663,867 | 663,867 | 663,867 | 663,867 | 663,867 | 663,867 | 663,867 | 663,867 |
| C | SC = 1 | SC = 2 | SC = 3 | SC = 4 | SC = 5 | SC = 6 | SC = 7 | SC = 8 | SC = 9 | SC = 10 |
|---|---|---|---|---|---|---|---|---|---|---|
| λ = 0 | 0 | 214,960 | 29,198 | 0 | 0 | 137,600 | 0 | 0 | 111,242 | 111,955 |
| λ = 0.1 | 0 | 202,861 | 17,099 | 0 | 0 | 125,501 | 0 | 0 | 99,143 | 99,856 |
| λ = 0.2 | 0 | 190,762 | 5000 | 0 | 0 | 113,402 | 0 | 0 | 87,044 | 87,757 |
| λ = 0.3 | 0 | 176,888 | 0 | 0 | 0 | 99,528 | 0 | 0 | 73,170 | 73,883 |
| λ = 0.4 | 0 | 161,764 | 0 | 0 | 0 | 84,404 | 0 | 0 | 58,046 | 58,759 |
| λ = 0.5 | 0 | 146,641 | 0 | 0 | 0 | 69,280 | 0 | 0 | 42,922 | 43,635 |
| λ = 0.6 | 0 | 131,517 | 0 | 0 | 0 | 54,156 | 0 | 0 | 27,798 | 28,511 |
| λ = 0.7 | 0 | 116,393 | 0 | 0 | 0 | 39,032 | 0 | 0 | 12,674 | 13,387 |
| λ = 0.8 | 0 | 99,176 | 0 | 0 | 0 | 21,815 | 0 | 0 | 0 | 0 |
| λ = 0.9 | 0 | 60,495 | 0 | 0 | 0 | 0 | 0 | 0 | 0 | 0 |
| λ = 1 | 0 | 0 | 0 | 0 | 0 | 0 | 0 | 0 | 0 | 0 |
| SC = 1 | SC = 2 | SC = 3 | SC = 4 | SC = 5 | SC = 6 | SC = 7 | SC = 8 | SC = 9 | SC = 10 | |
|---|---|---|---|---|---|---|---|---|---|---|
| λ = 0 | 223,256 | 550,148 | 477,104 | 418,689 | 251,083 | 576,426 | 374,801 | 365,674 | 633,806 | 560,661 |
| λ = 0.1 | 249,265 | 564,361 | 478,604 | 448,456 | 279,244 | 586,402 | 411,243 | 387,550 | 663,840 | 560,661 |
| λ = 0.2 | 295,416 | 564,361 | 478,605 | 453,049 | 301,534 | 586,402 | 416,514 | 413,064 | 663,852 | 560,661 |
| λ = 0.3 | 282,231 | 564,361 | 486,278 | 476,351 | 338,328 | 586,402 | 448,248 | 463,124 | 663,852 | 560,661 |
| λ = 0.4 | 283,755 | 564,361 | 502,001 | 492,357 | 405,541 | 586,402 | 470,451 | 494,144 | 663,852 | 560,661 |
| λ = 0.5 | 322,345 | 564,361 | 517,026 | 476,342 | 484,356 | 586,402 | 482,164 | 517,247 | 663,852 | 560,661 |
| λ = 0.6 | 381,627 | 564,361 | 532,140 | 518,412 | 532,530 | 586,402 | 485,248 | 505,531 | 663,852 | 560,661 |
| λ = 0.7 | 547,284 | 564,361 | 547,974 | 547,671 | 464,758 | 586,402 | 489,855 | 505,212 | 663,852 | 560,661 |
| λ = 0.8 | 514,126 | 564,361 | 564,792 | 564,664 | 564,521 | 586,402 | 494,245 | 564,951 | 663,852 | 565,691 |
| λ = 0.9 | 603,321 | 603,451 | 603,470 | 603,571 | 598,691 | 603,371 | 603,191 | 547,426 | 663,852 | 602,371 |
| λ = 1 | 663,852 | 663,852 | 663,852 | 663,852 | 663,852 | 663,852 | 663,852 | 663,852 | 663,852 | 663,852 |
Publisher’s Note: MDPI stays neutral with regard to jurisdictional claims in published maps and institutional affiliations. |
© 2022 by the authors. Licensee MDPI, Basel, Switzerland. This article is an open access article distributed under the terms and conditions of the Creative Commons Attribution (CC BY) license (https://creativecommons.org/licenses/by/4.0/).
Share and Cite
Valipour, E.; Nourollahi, R.; Taghizad-Tavana, K.; Nojavan, S.; Alizadeh, A. Risk Assessment of Industrial Energy Hubs and Peer-to-Peer Heat and Power Transaction in the Presence of Electric Vehicles. Energies 2022, 15, 8920. https://doi.org/10.3390/en15238920
Valipour E, Nourollahi R, Taghizad-Tavana K, Nojavan S, Alizadeh A. Risk Assessment of Industrial Energy Hubs and Peer-to-Peer Heat and Power Transaction in the Presence of Electric Vehicles. Energies. 2022; 15(23):8920. https://doi.org/10.3390/en15238920
Chicago/Turabian StyleValipour, Esmaeil, Ramin Nourollahi, Kamran Taghizad-Tavana, Sayyad Nojavan, and As’ad Alizadeh. 2022. "Risk Assessment of Industrial Energy Hubs and Peer-to-Peer Heat and Power Transaction in the Presence of Electric Vehicles" Energies 15, no. 23: 8920. https://doi.org/10.3390/en15238920