
Pressure Losses Downstream of a Compact Valve in the Inlet Chamber of an Intermediate-Pressure Steam Turbine

1
Doosan Skoda Power, Tylova 1/57, 301 28 Pilsen, Czech Republic
2
Power System Engineering Department, University of West Bohemia, Univerzitni 8, 306 14 Pilsen, Czech Republic
3
Institute of Thermomechanics of the Czech Academy of Sciences, Dolejskova 1402/5, 182 00 Praha 8, Czech Republic
4
Department of Power Engineering, University of Zilina, Univerzitna 8215/1, 010 26 Zilina, Slovakia
*
Author to whom correspondence should be addressed.
Energies 2022, 15(22), 8753; https://doi.org/10.3390/en15228753
Submission received: 14 October 2022
/
Revised: 14 November 2022
/
Accepted: 17 November 2022
/
Published: 21 November 2022
(This article belongs to the Topic Latest Developments in Fluid Mechanics and Energy)
Abstract
:Deep knowledge about pressure and energy losses in each part of a steam turbine is crucial for assuring the required efficiency and operational reliability. This paper presents the experimental as well as the numerical study of pressure losses in the inlet chamber of an intermediate-pressure steam turbine. Measurements were carried out on a complex model, where not only was there an inlet turbine chamber, but also a compact valve assembly situated upstream and nozzles situated downstream. The compact valve as well as the turbine inlet chamber were relatively small. Therefore, greater pressure losses were expected. The aerodynamic laboratory of the Institute of Thermomechanics of the Czech Academy of Sciences was responsible for acquiring the measurements, which were carried out in a modular in-draft wind tunnel. In order to learn further details, numerical simulations were carried out. Doosan Skoda Power was responsible for this. A package of ANSYS software tools was used. Measured data were described and compared with numerical ones. Pressure losses were generalized in the form of the total pressure loss coefficient. As a result, pressure losses in similar turbine compact inlet chambers can be predicted with the required accuracy.
1. Introduction
Each part of a steam turbine should be, to some extent, studied in detail to gain the know-how to estimate and provide the required efficiency and operational reliability [1]. Therefore, the Doosan Skoda Power company focuses on the investigation of each individual turbine part, such as the parts described in [2,3,4].
Recently, extensive studies of pressure losses in different valve assemblies have been carried out. For example, a high-pressure valve assembly for nozzle governing [5], a high-pressure valve assembly for throttle governing [6] and, finally, a compact valve assembly for controlling the steam going to the intermediate-pressure turbine part [7]. Valves for steam turbines are also investigated in other industrial companies, as well as research institutes. A comprehensive literature review can be found in [8]. The impact of an unsteady flow due to the geometry of a valve and the inlet chamber to the first turbine stage is also the topic of many studies [9,10,11,12]. It was concluded that if the flow is significantly unsteady in the valve, hence, producing greater losses, this negative effect also propagates to the first and even other turbine stages, which reduces their efficiency. Therefore, it is important to thoroughly investigate not only the flow field in the valve, but also the flow field in the turbine inlet chambers.
Each valve assembly consists of many parts. The main parts are a stop valve (intercepting valve) and a control valve. Regarding the compact valve assembly [7], the flow field and related pressure losses have been evaluated and described by using measurements on the model and numerical simulations in terms of a complex valve characteristic, which represent dependence between the mass flow ratios, pressure losses and relative valve cone lifts. Between this valve assembly and the first turbine stage, there is the turbine inlet chamber. Pressure losses in such a chamber had never been measured or simulated. This is the main subject of this paper.
2. Experimental Model
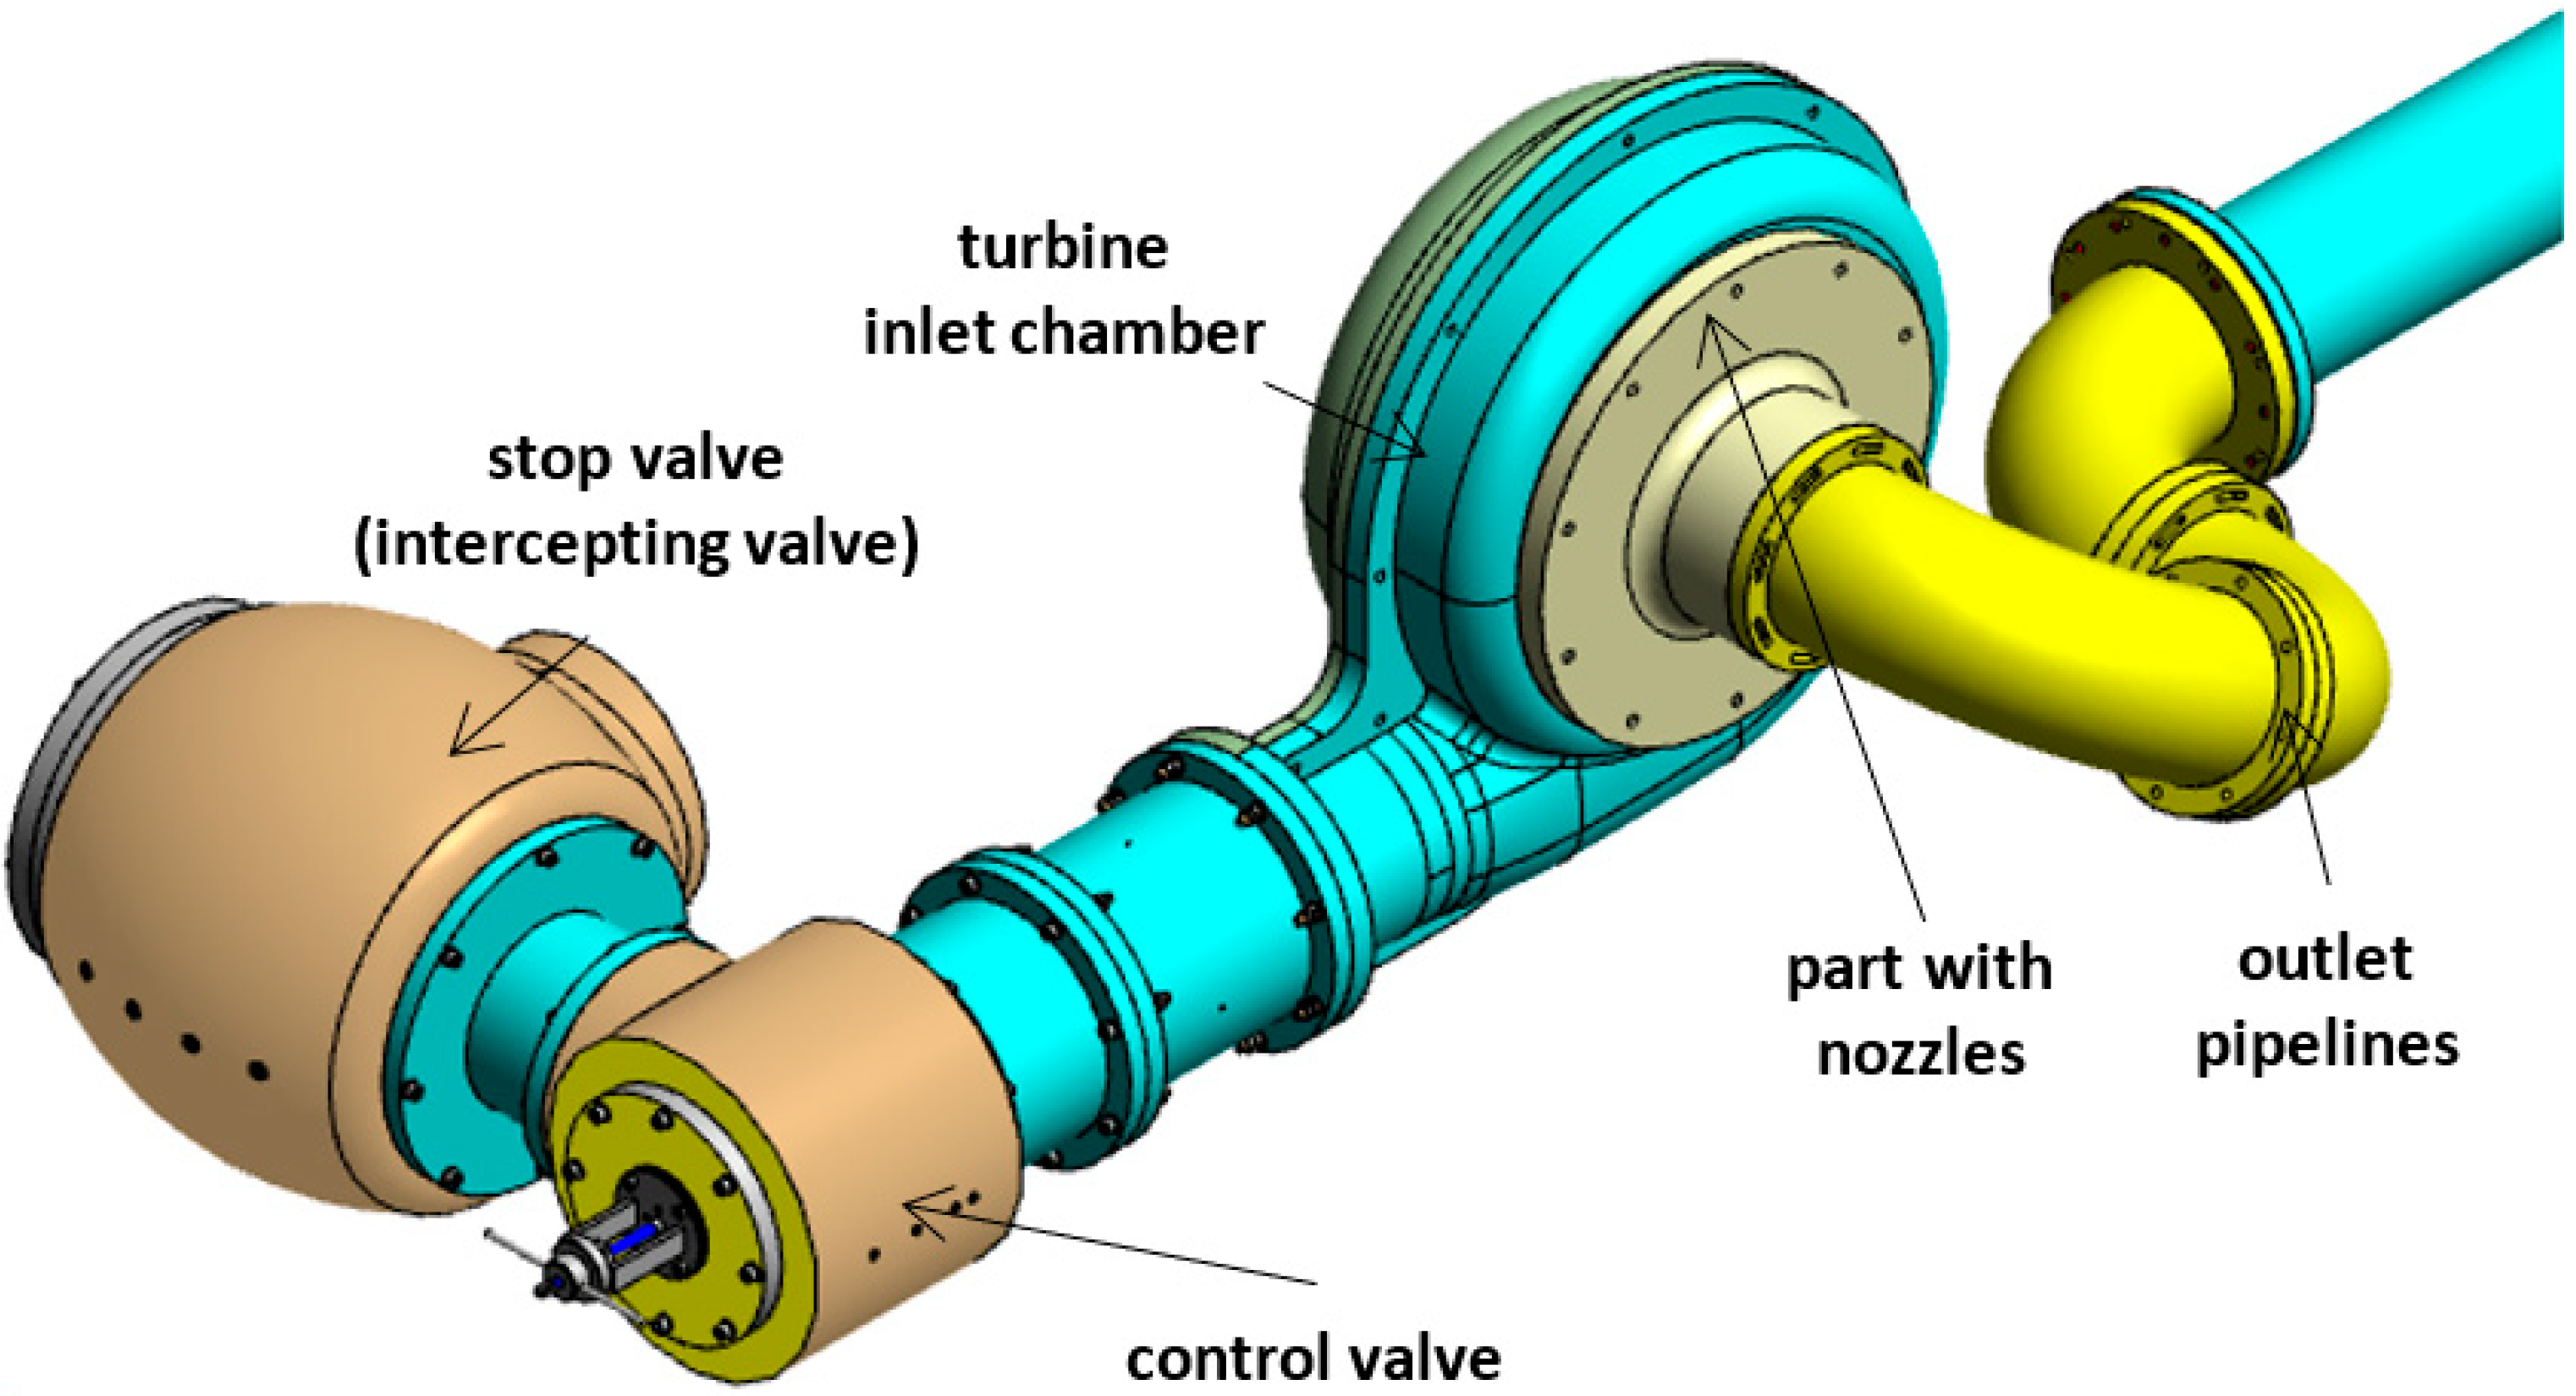
The complex model that was subject to the current measurements is shown in Figure 1. It consisted of the valves, which were studied in the past and results were presented in [7], and the turbine inlet chamber, which was the subject of the presented study. Downstream of this chamber, there was a nozzle part and outlet pipelines. These pipelines did not represent any actual turbine part. They merely connected the measured model with the main duct leading to the vacuum storage. The main valve assembly parts were composed of wood and polyurethane, and the pipelines and connecting parts were composed of acrylic glass.
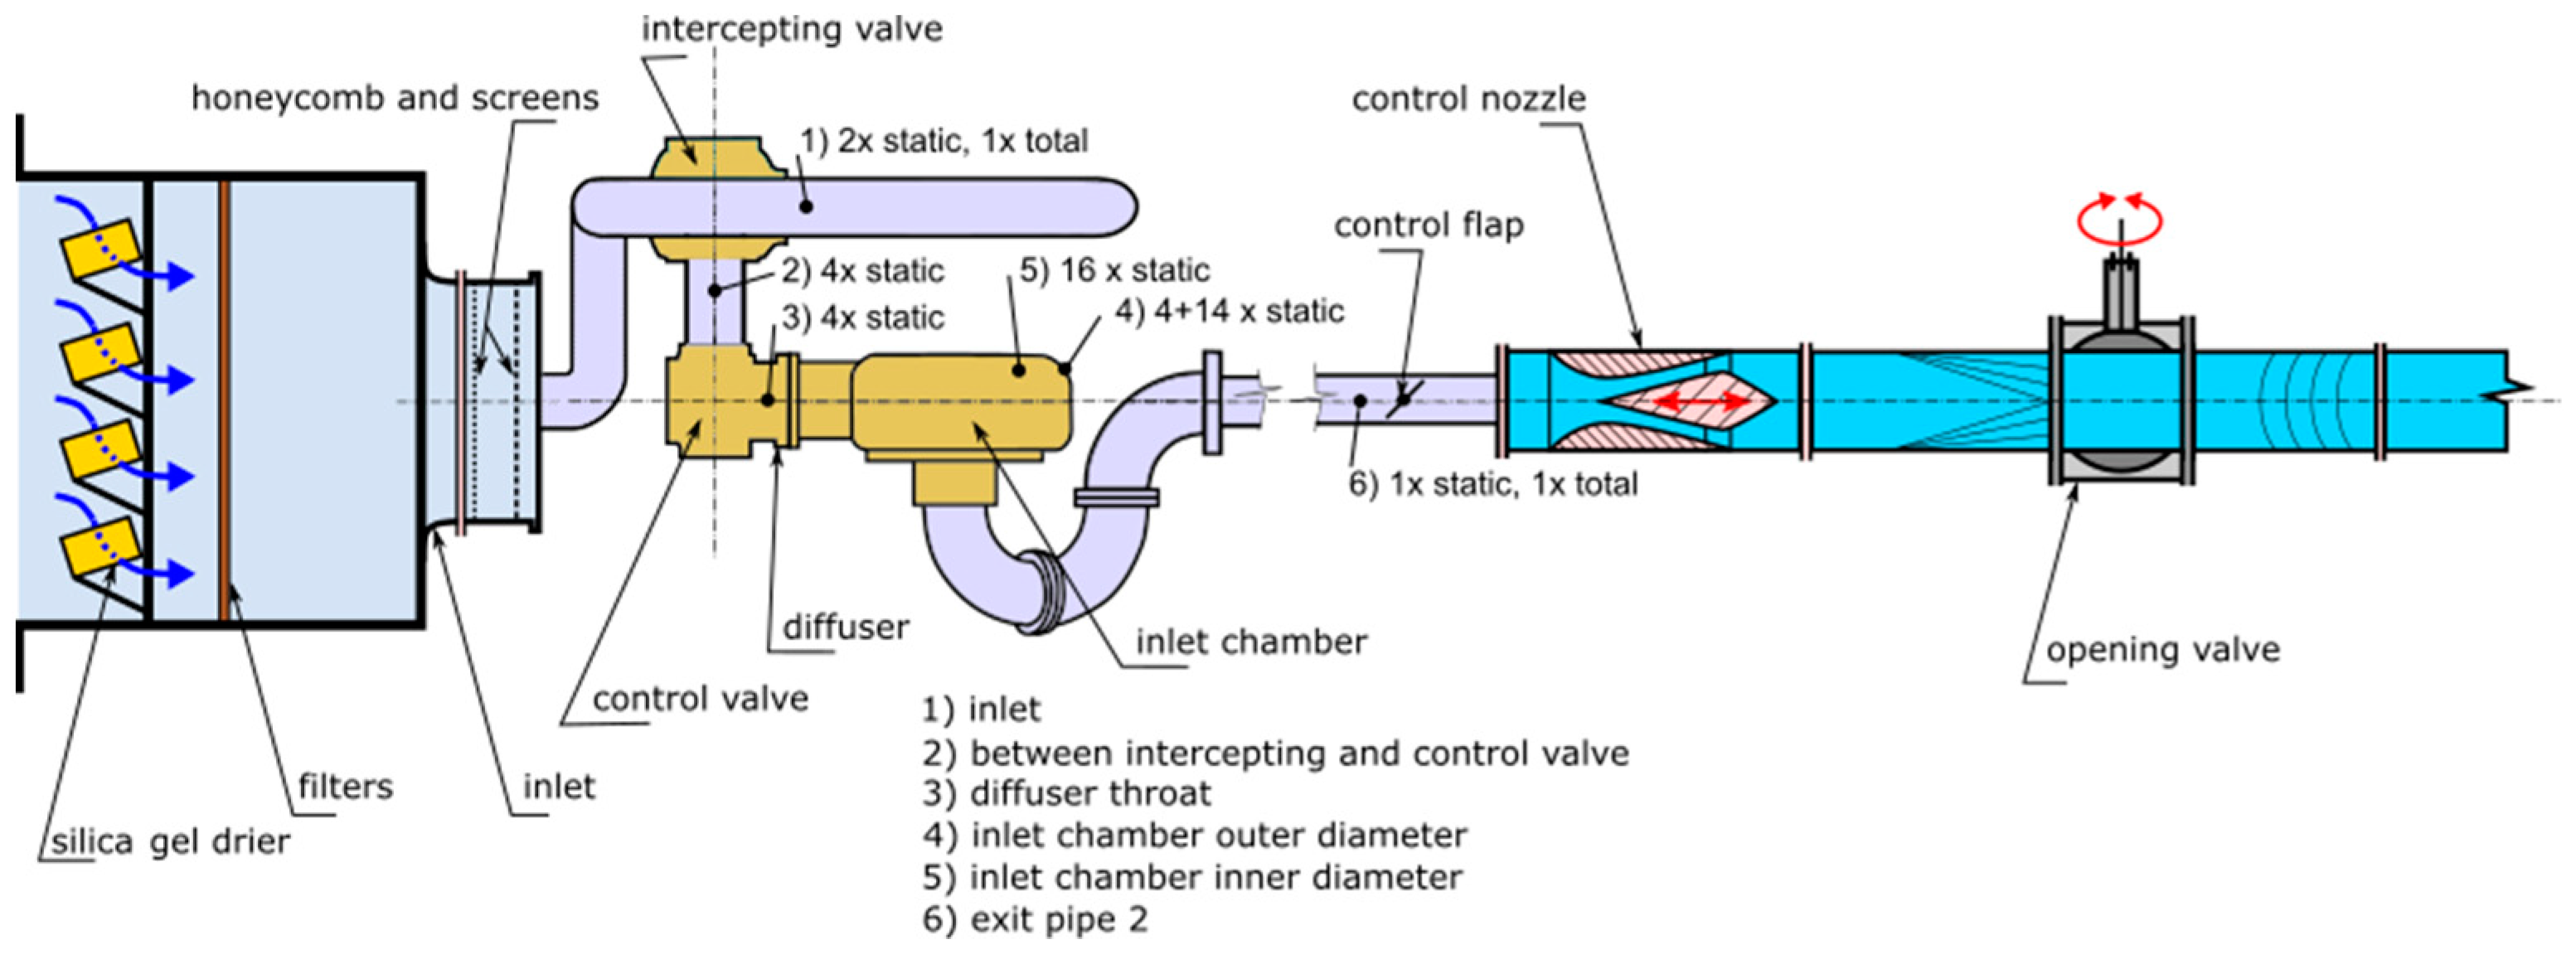
The scheme of the aerodynamic tunnel is provided in Figure 2, where its main parts are described. It was an aerodynamic suction-type modular tunnel where the air was sucked down from ambient conditions at the inlet through the tested model (the complex valve assembly, also including the turbine inlet chamber model) into an outlet piping, where conditions were set with a control nozzle to the desired pressure ratio. The vacuum chamber could be evacuated to an absolute pressure of 10 kPa.
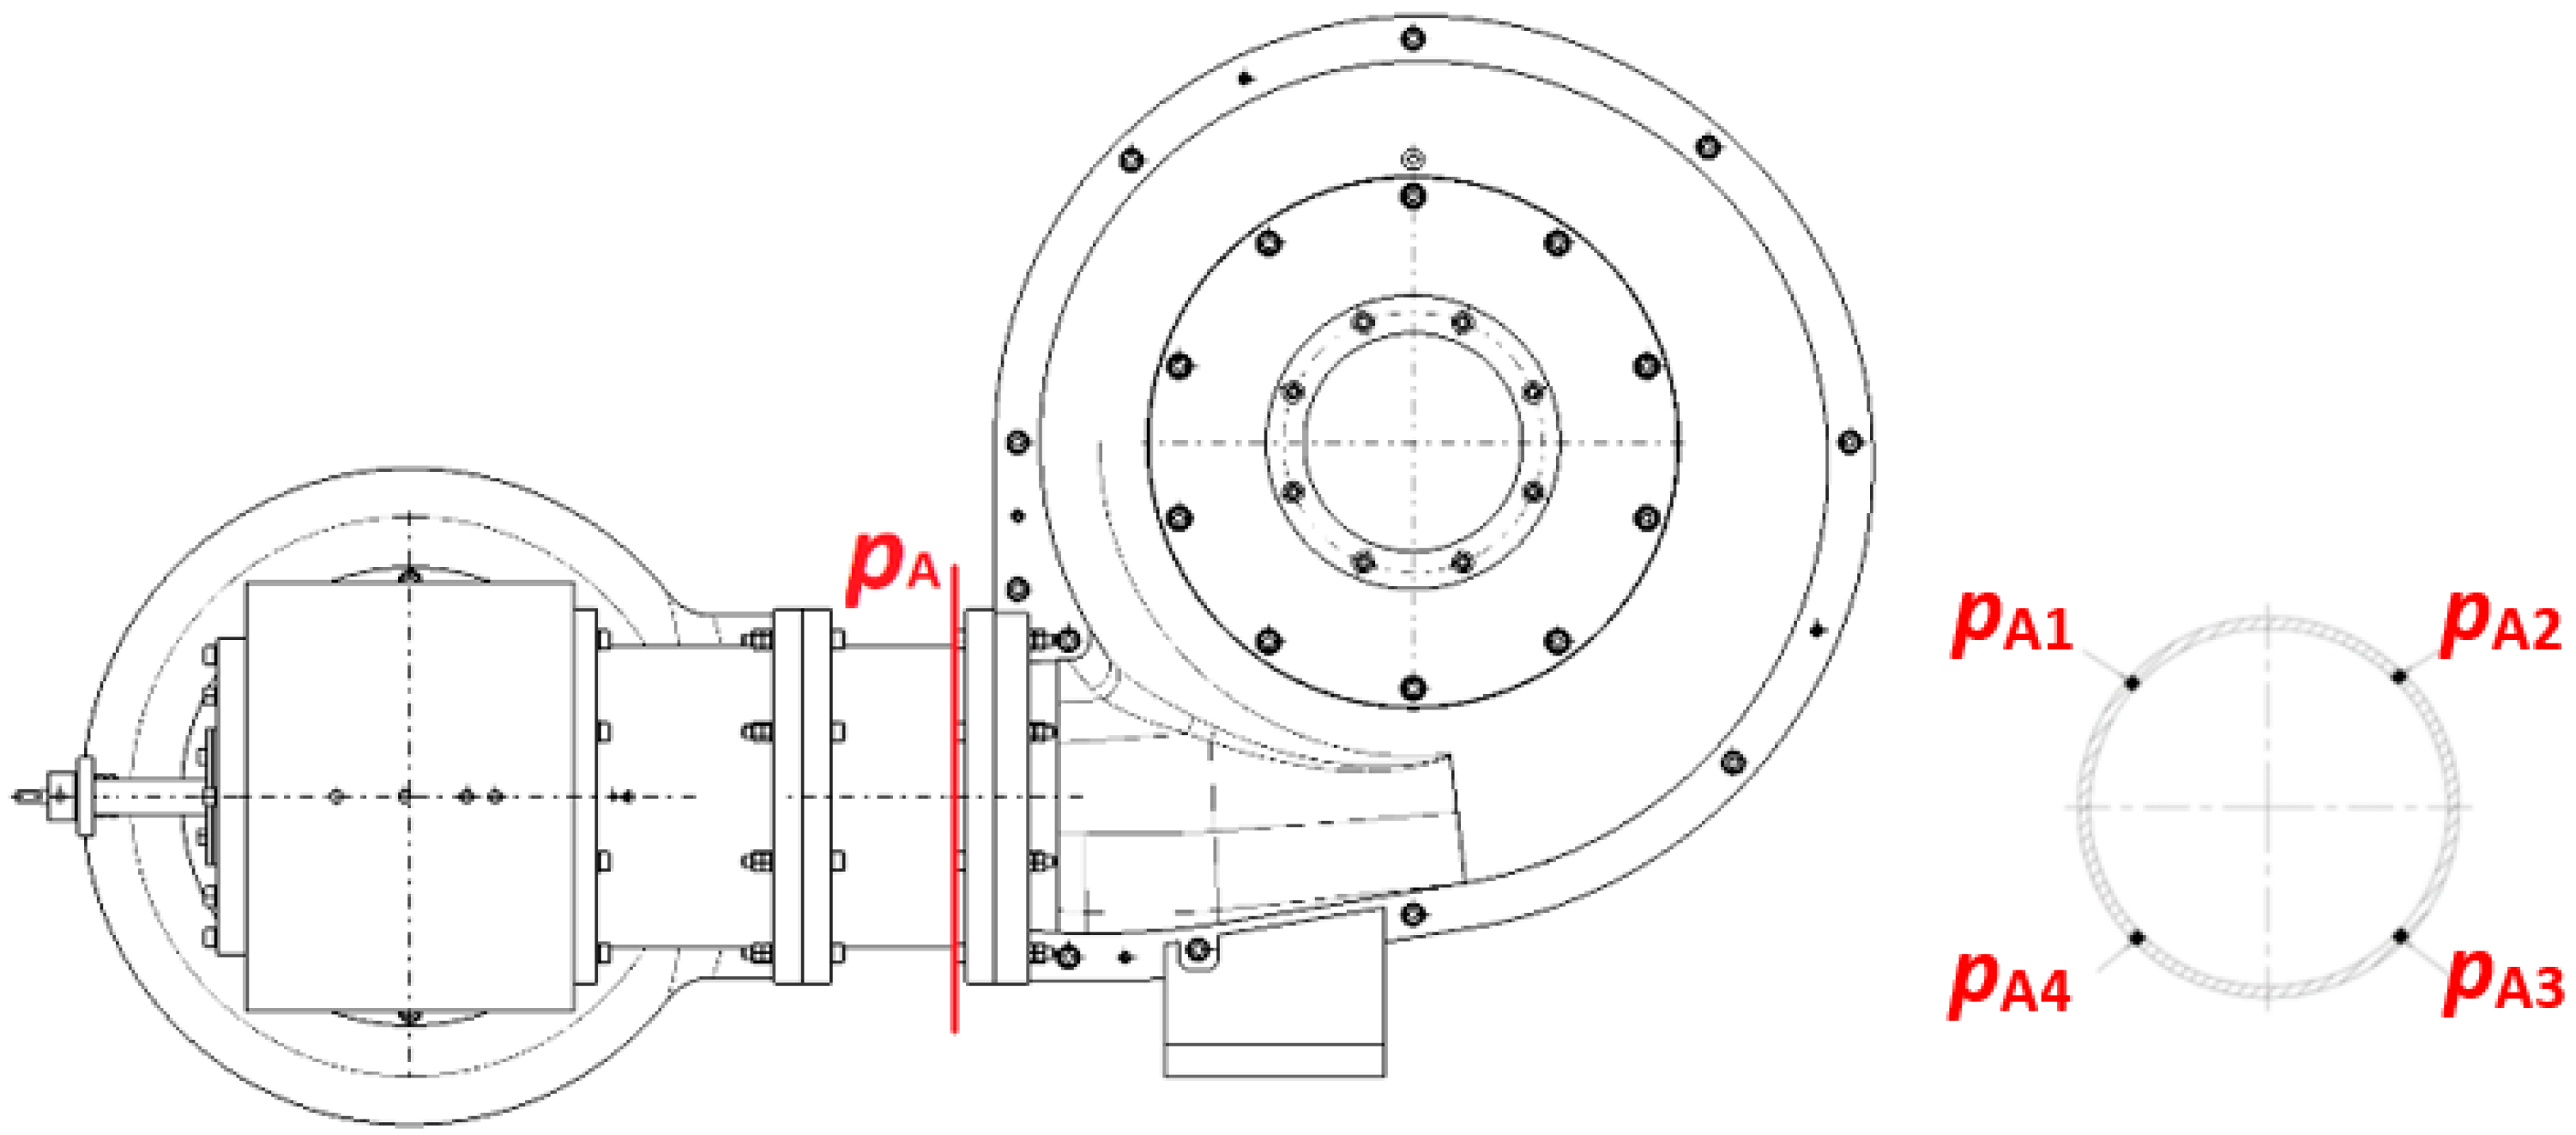
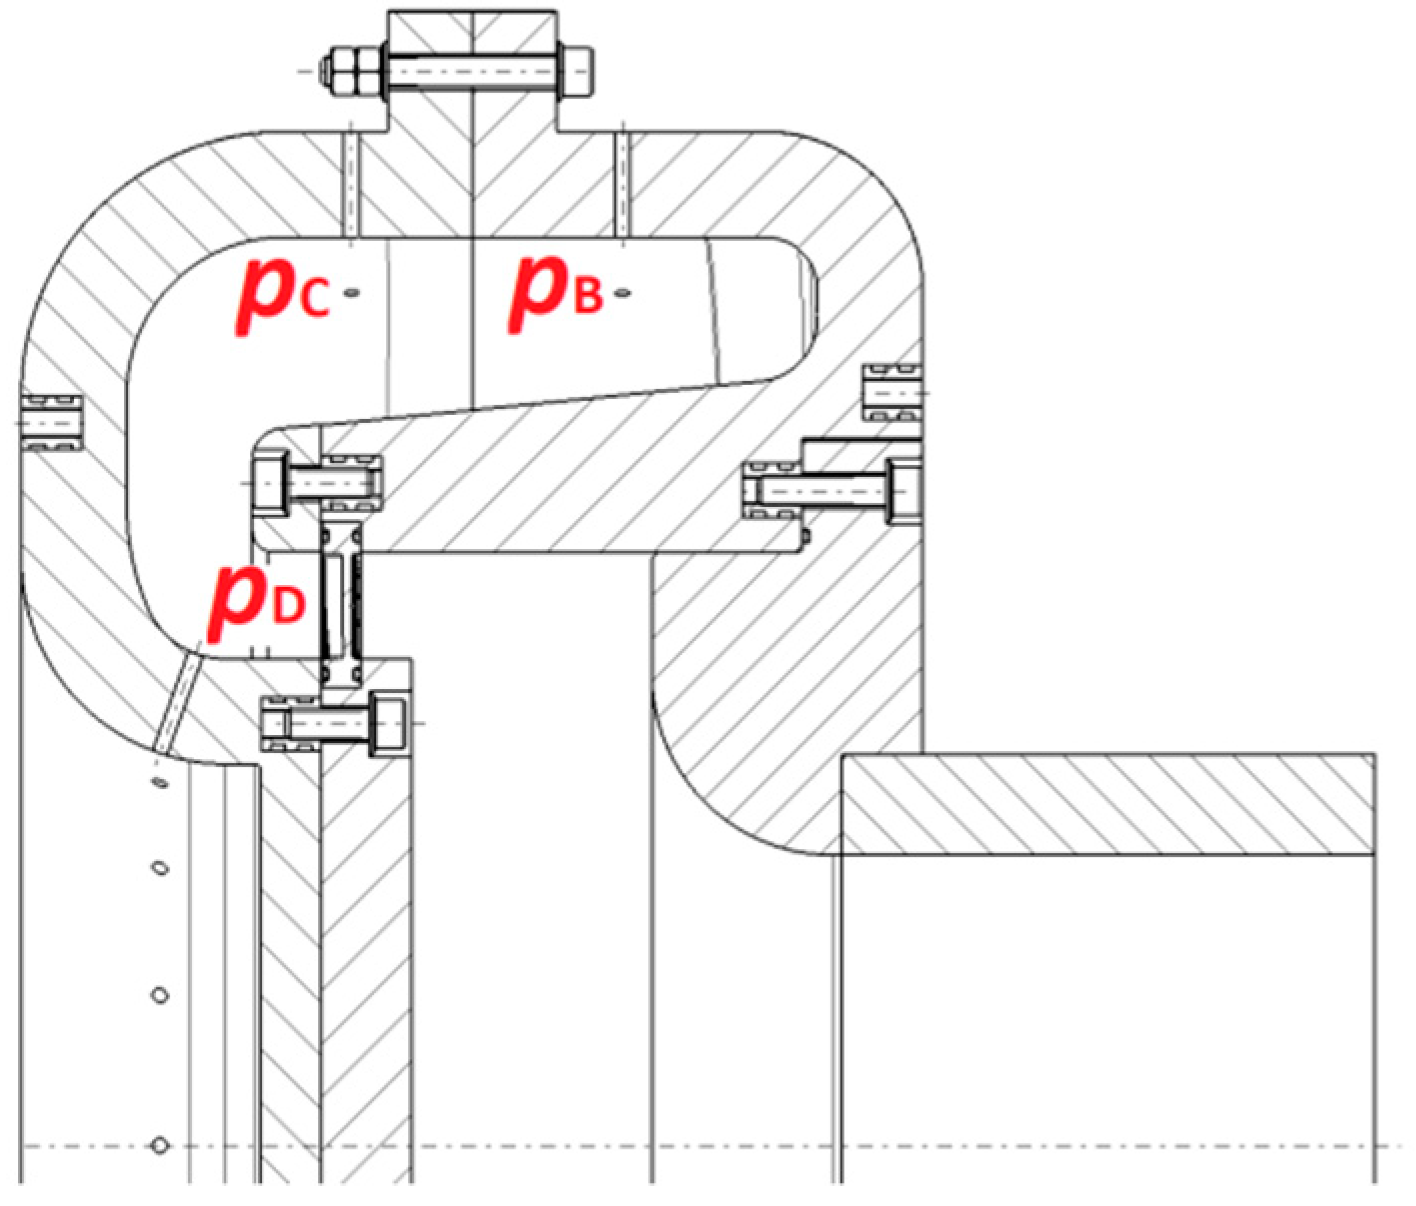
Results of the valve assembly study were presented in detail in [7], where there was no model of the turbine inlet chamber. In order to analyze the flow in the turbine inlet chamber, which was a new subject of the study presented here, four pressures evenly distributed around the circumference were measured upstream of the chamber (downstream of the control valve). This is shown in Figure 2 and also in Figure 3 in position pA. Other pressures were measured on the outer chamber surface as pB and pC and closely upstream of the nozzle model as pD. Their positions are shown in detail in Figure 4. Regarding pressure pB, four pressure extractions were used, as shown in Figure 5 on the left. This was necessary due to the transducer’s limited capacity. More measuring points were used in the case of pressures pC and pD. pC was measured at 14 positions, as shown in Figure 5 on the right; pD was similarly measured, but at 16 positions, because, in this position, there was no inlet pipeline.
To evaluate all the pressures, a Pressure Systems 9116 pressure transducer was used. Moreover, the total pressure upstream of the valves was measured using a Prandtl probe. The measurement of the mass flow rate was carried out in the outlet pipeline using an Annubar Deltatop DP 62D probe and Thermometers Pt100. The relative uncertainty of the pressure measurements was evaluated to be better than 4%, with a confidence interval of 95%. Since the experiments were performed with dry air at a low pressure, Reynolds numbers were approximately two orders of magnitude lower in comparison with the real valve assembly with steam. This difference was analyzed in [13,14], where it was shown that measurements at lower Reynolds numbers still provided accurate valve characteristics. The deeper analyses based on the aerodynamic similarity theory [15] applied to the valve assemblies can be found in [16], where the result differences between steam and air were described. The conclusion was that the differences were small. In fact, the pressure drops measured on the model with air were slightly greater. This was also tested in the model described in [5]. The results of this supporting study are shown in Figure 6 for two different relative valve cone lifts. The curve presenting the air was situated higher in the valve characteristic, which meant that for the same mass flow, the pressure ratio was greater, which meant that there was a lower pressure loss. Except for one point presenting in steam at the pressure ratio of 0.90, the differences were similar, as described in [16]. As a result, the experiments carried out with air could show reasonably greater pressure losses, which was, fortunately, a conservative result to apply to real valve assemblies.
3. Numerical Model
In order to learn further details, especially the total pressures, since only static pressures could be measured due to the model’s complexity and limited space, numerical simulations were carried out. The numerical model is shown in Figure 7 on the right. Boundary conditions were defined based on the measured data. This meant that the total pressure and static temperature were defined at the model inlet, and the measured mass flow was defined at the model outlet. The inlet turbulence intensity was defined as being 5%, although it was not measured. This was based on experiences in similar studies [5,6,7], and an assumption that the flow field turbulence at the inlet had minor influence on the observed parts (the control valve and the turbine inlet chamber), since a flow had already developed downstream of the stop valve. The medium was defined as dry air in accordance with the experiment, where dryness was guaranteed through the use of a silica gel drier (see Figure 2). A high-resolution scheme (second-order scheme) was used to compute the steady-state solution for the advection scheme and turbulence numerics. The simulation convergence was judged with a 10−4 residual target value. Furthermore, imbalances of pressure losses in the chamber were monitored to be less than 0.10%. Hexahedral and tetrahedral meshes were created, shown in Figure 8 and Figure 9. The meshes were created to keep the recommendation of y+ < 5. This recommendation was valid for the used turbulence model k-ω SST [17,18]. This turbulence model by Menter, 1993, is a two-equation eddy viscosity model, which has become very popular and widely validated in ANSYS software package tools [19]. It was achieved according to the results in similar projects, for example [20], where mesh sensitivity was tested. In this project, only a brief mesh sensitivity analysis, shown in Table 1, was performed for two different meshes, the used one with approximately 20 million nodes and 50 million elements and the finer one with approximately 30 million nodes and 70 million elements. For the boundary conditions named C2, whose position in the valve characteristics is shown later, the resulting pressure losses in the control valve and the inlet chamber differed by less than 0.05%, which was lower than the above-monitored convergence criterion.
4. Results and Discussion
At first, the valve characteristics, which represent the dependence of the mass flow on the pressure ratio for all required valve cone lifts, were evaluated. A valve characteristic is the graph of the dependency of the mass flow ratio on the pressure ratio and the relative valve cone lift. The pressure ratio ε2 can be defined as a ratio of static p2/p1t or total pressures p2t/p1t. Index one is the inlet and index two the outlet of the valve. The mass flow ratio was defined as m/mcr, where m is the mass flow and mcr is the critical mass flow through the valve. The relative valve cone lift is defined as h/D. D is the diffuser throat diameter and h is the control valve cone lift. A comparison of the results of measurements on the valve assembly alone (the dashed lines) with the new model with the turbine inlet chamber (the full lines) is in Figure 10. The comparison showed that the differences were not significant. This meant that the valve characteristics, which are widely used for pressure loss prediction and valve designing, were not dependent on the downstream geometry. This also showed that the measurements were consistent with the previous ones.
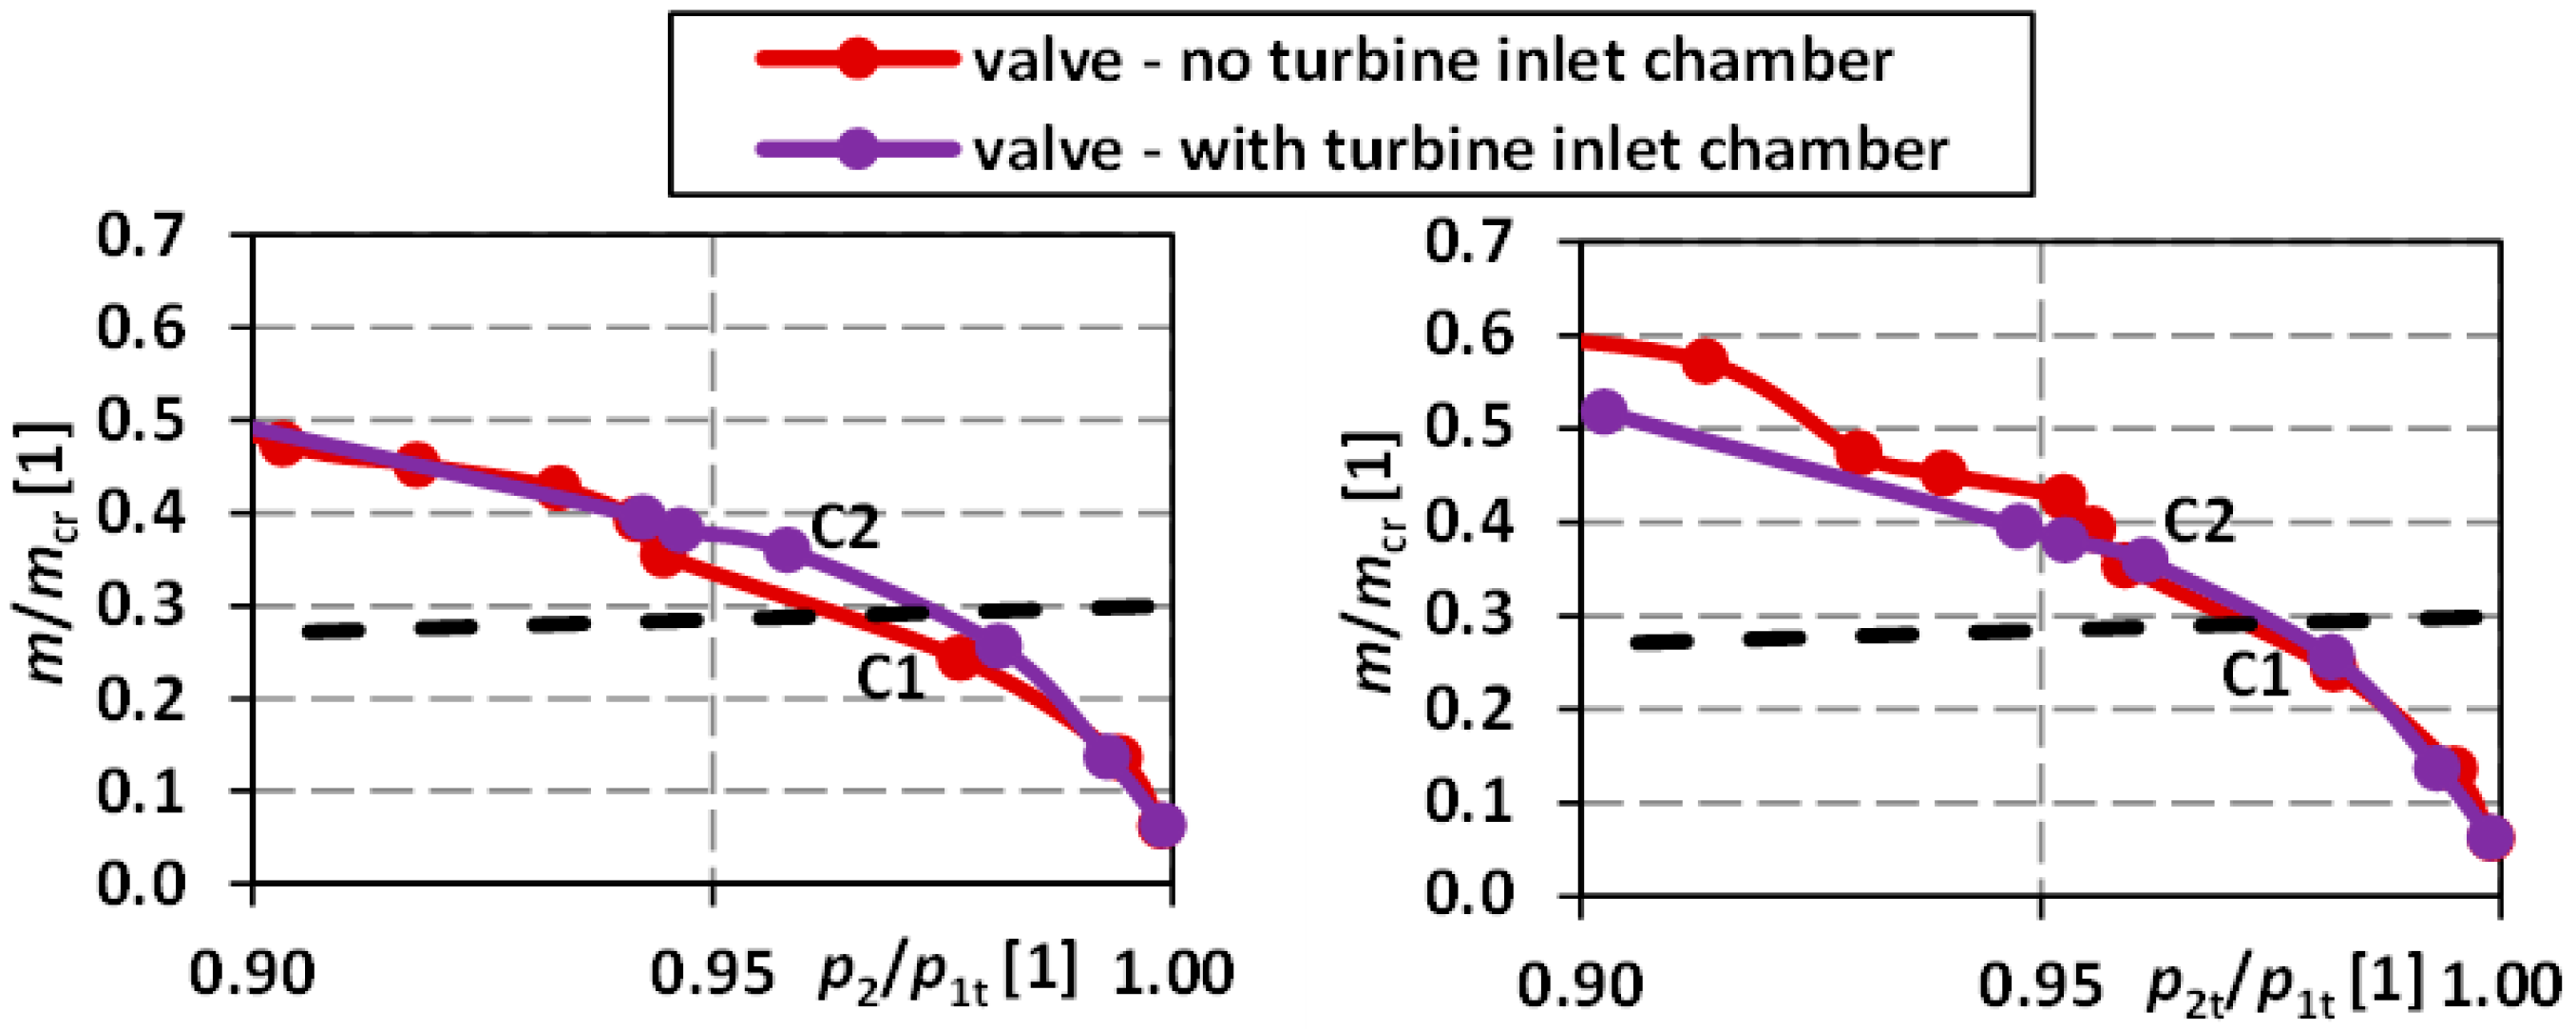
The same comparison was carried out with the numerical (CFD) results for one particular relative valve cone lift h/D = 0.322, where the valve was fully open. It was chosen for a further investigation of the losses in the turbine inlet chamber because, for such a case, a pressure loss prediction was required. Using the CFD, static, as well as total pressure ratios, could be evaluated. The compared results are in Figure 11. We could see some differences in the case of the total pressure ratio for ratios lower than 0.96. Fortunately, such regions were far away from the practical use of valves. The area of practical use is under the dashed line in Figure 11 (the lines going from 0 to 0.3 of the mass flow ratio).
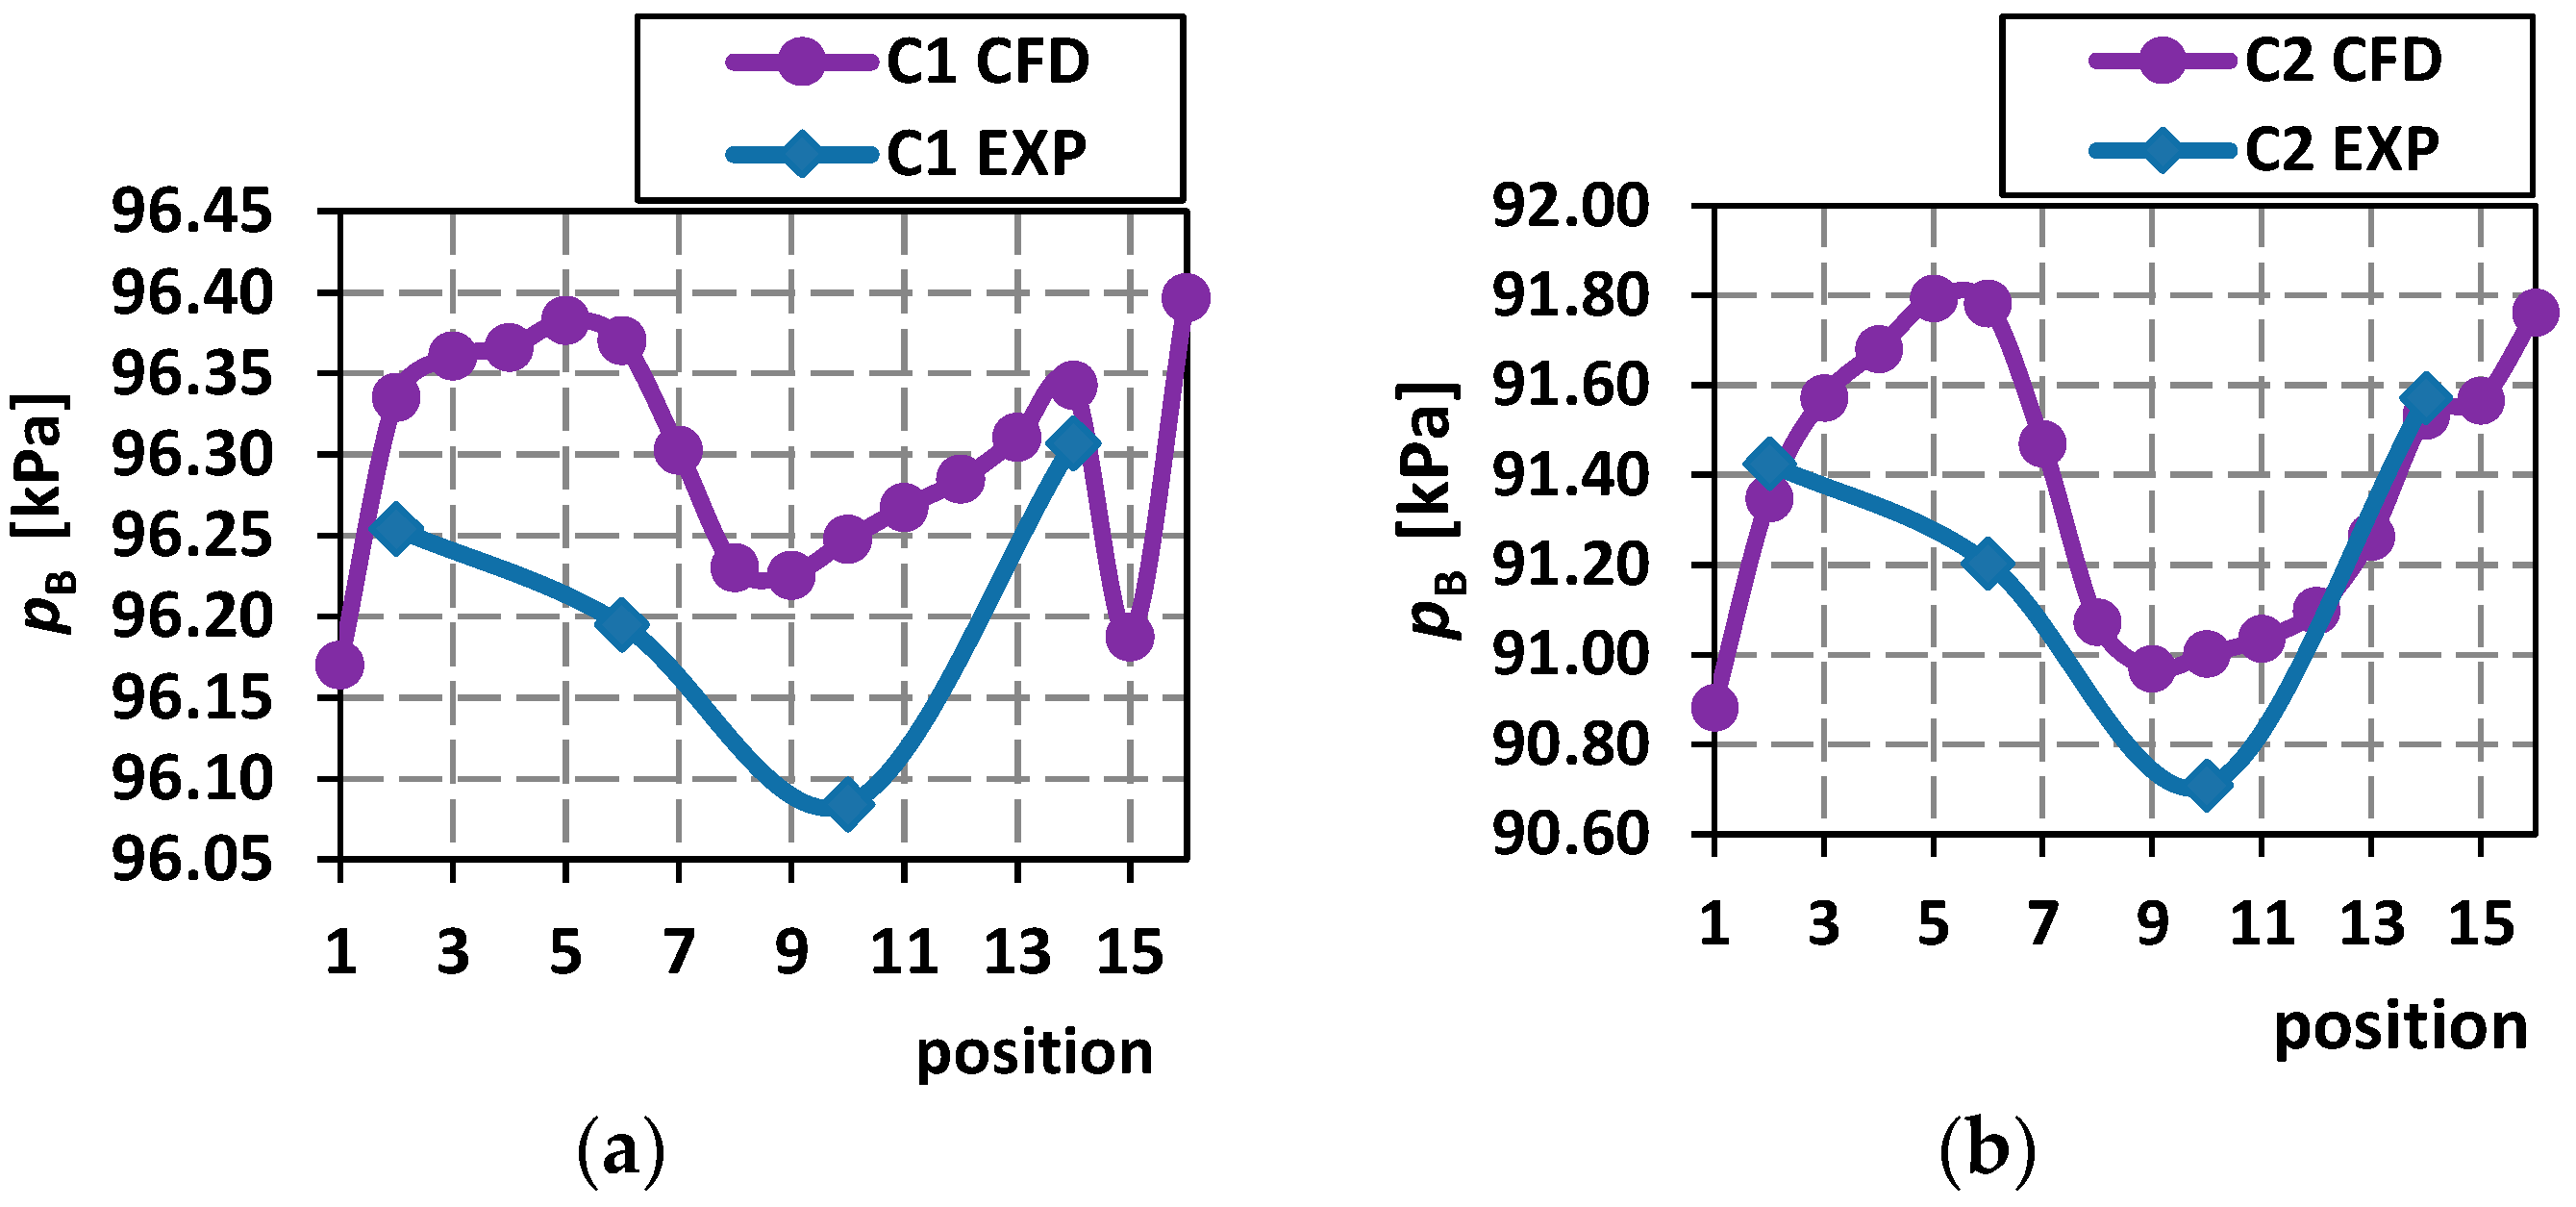
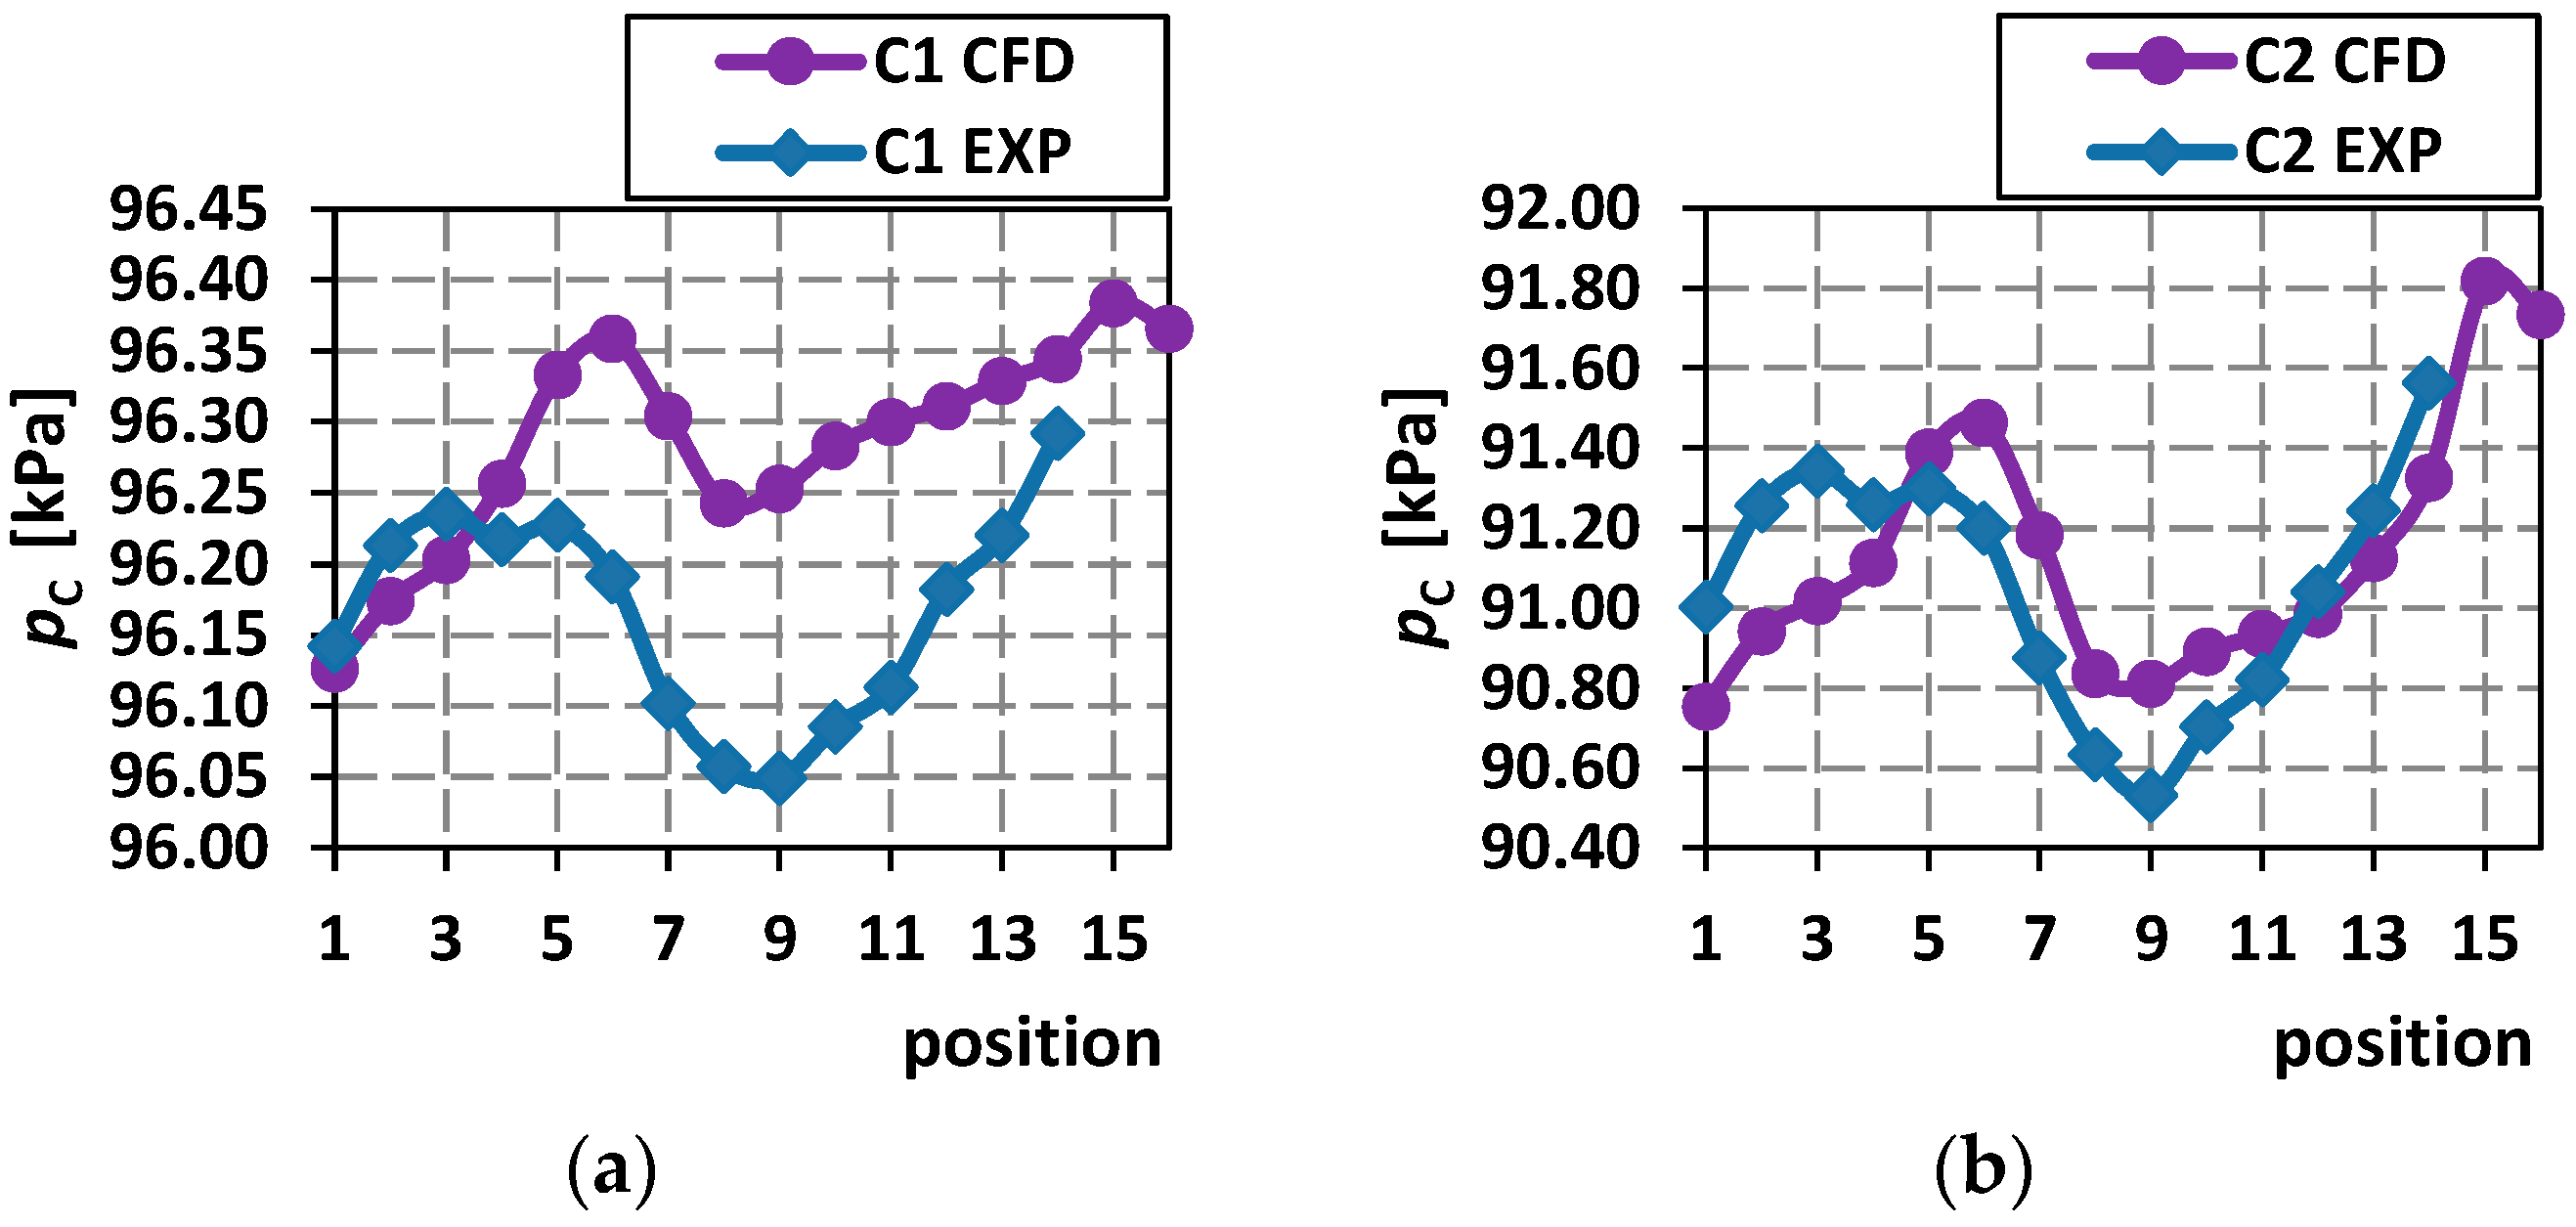
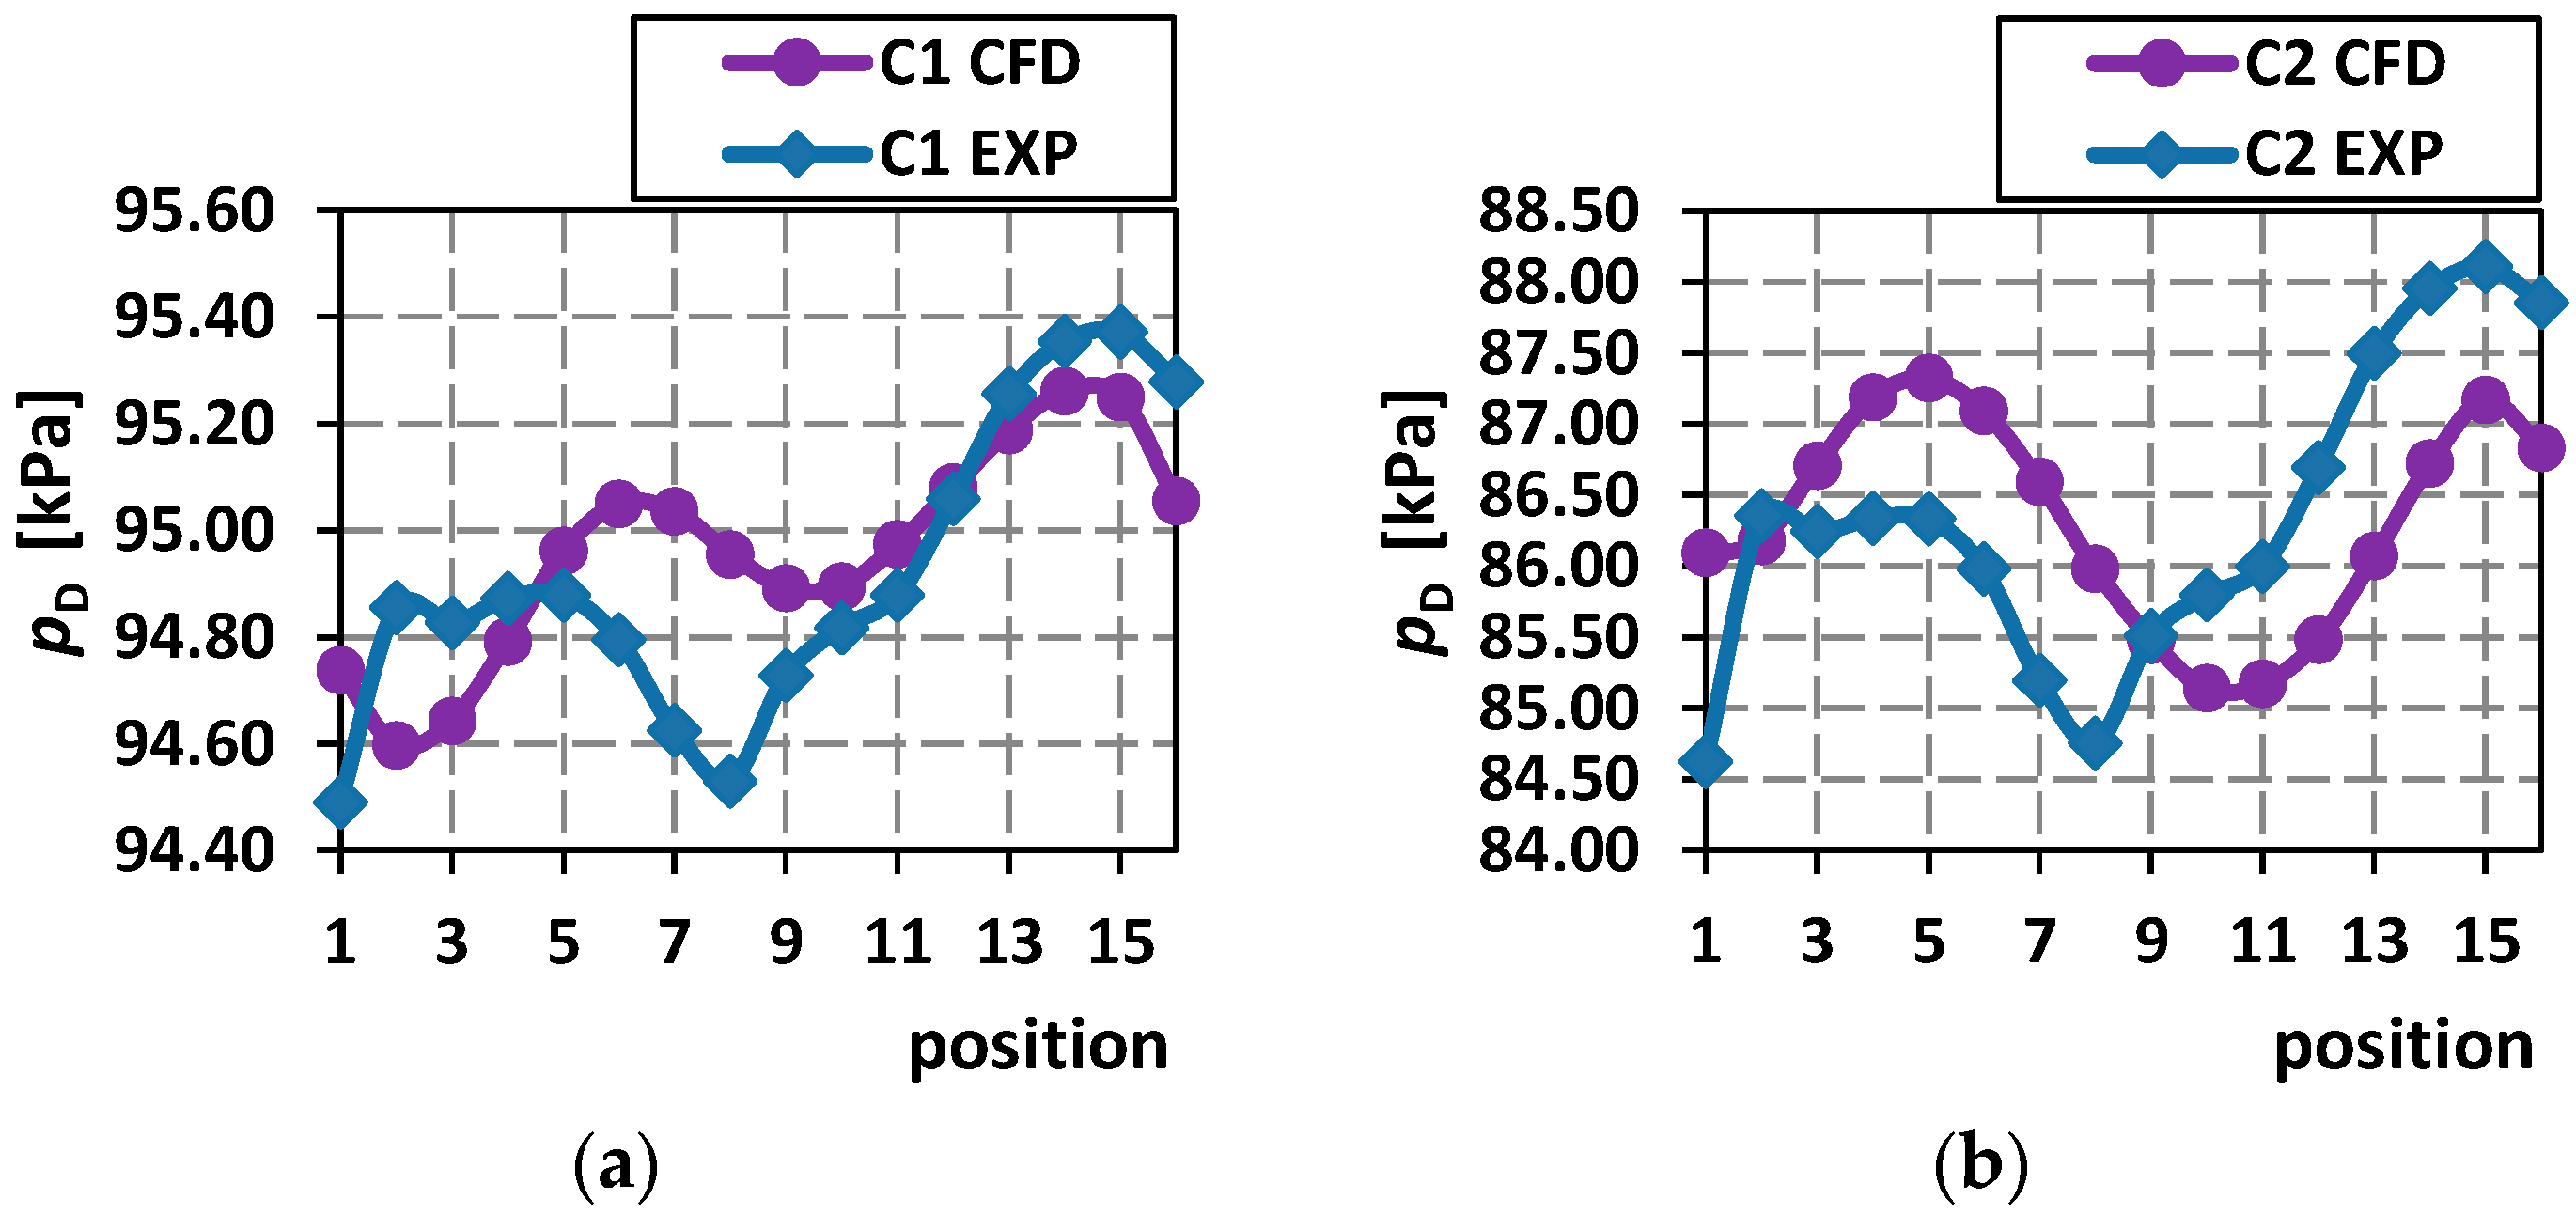
When it was proved that the results regarding the control valve were consistent and had reasonable differences, the evaluation of the turbine inlet chamber measurement was carried out. Examples of the results of the comparisons in the form of measured and calculated static pressures pB, pC, and pD are shown in Figure 12, Figure 13 and Figure 14. Two cases named C1 and C2 were chosen. Their positions in the valve characteristics are shown in Figure 11. We could see that, for both cases, there were differences between the numerical (CFD) and experimental results (EXP). The trends were, to some extent, similar. For case C1, the maximum difference was approximately 0.40 kPa, and for case C2 it was approximately 1.00 kPa. This was a good match, given the complexity of the geometry.
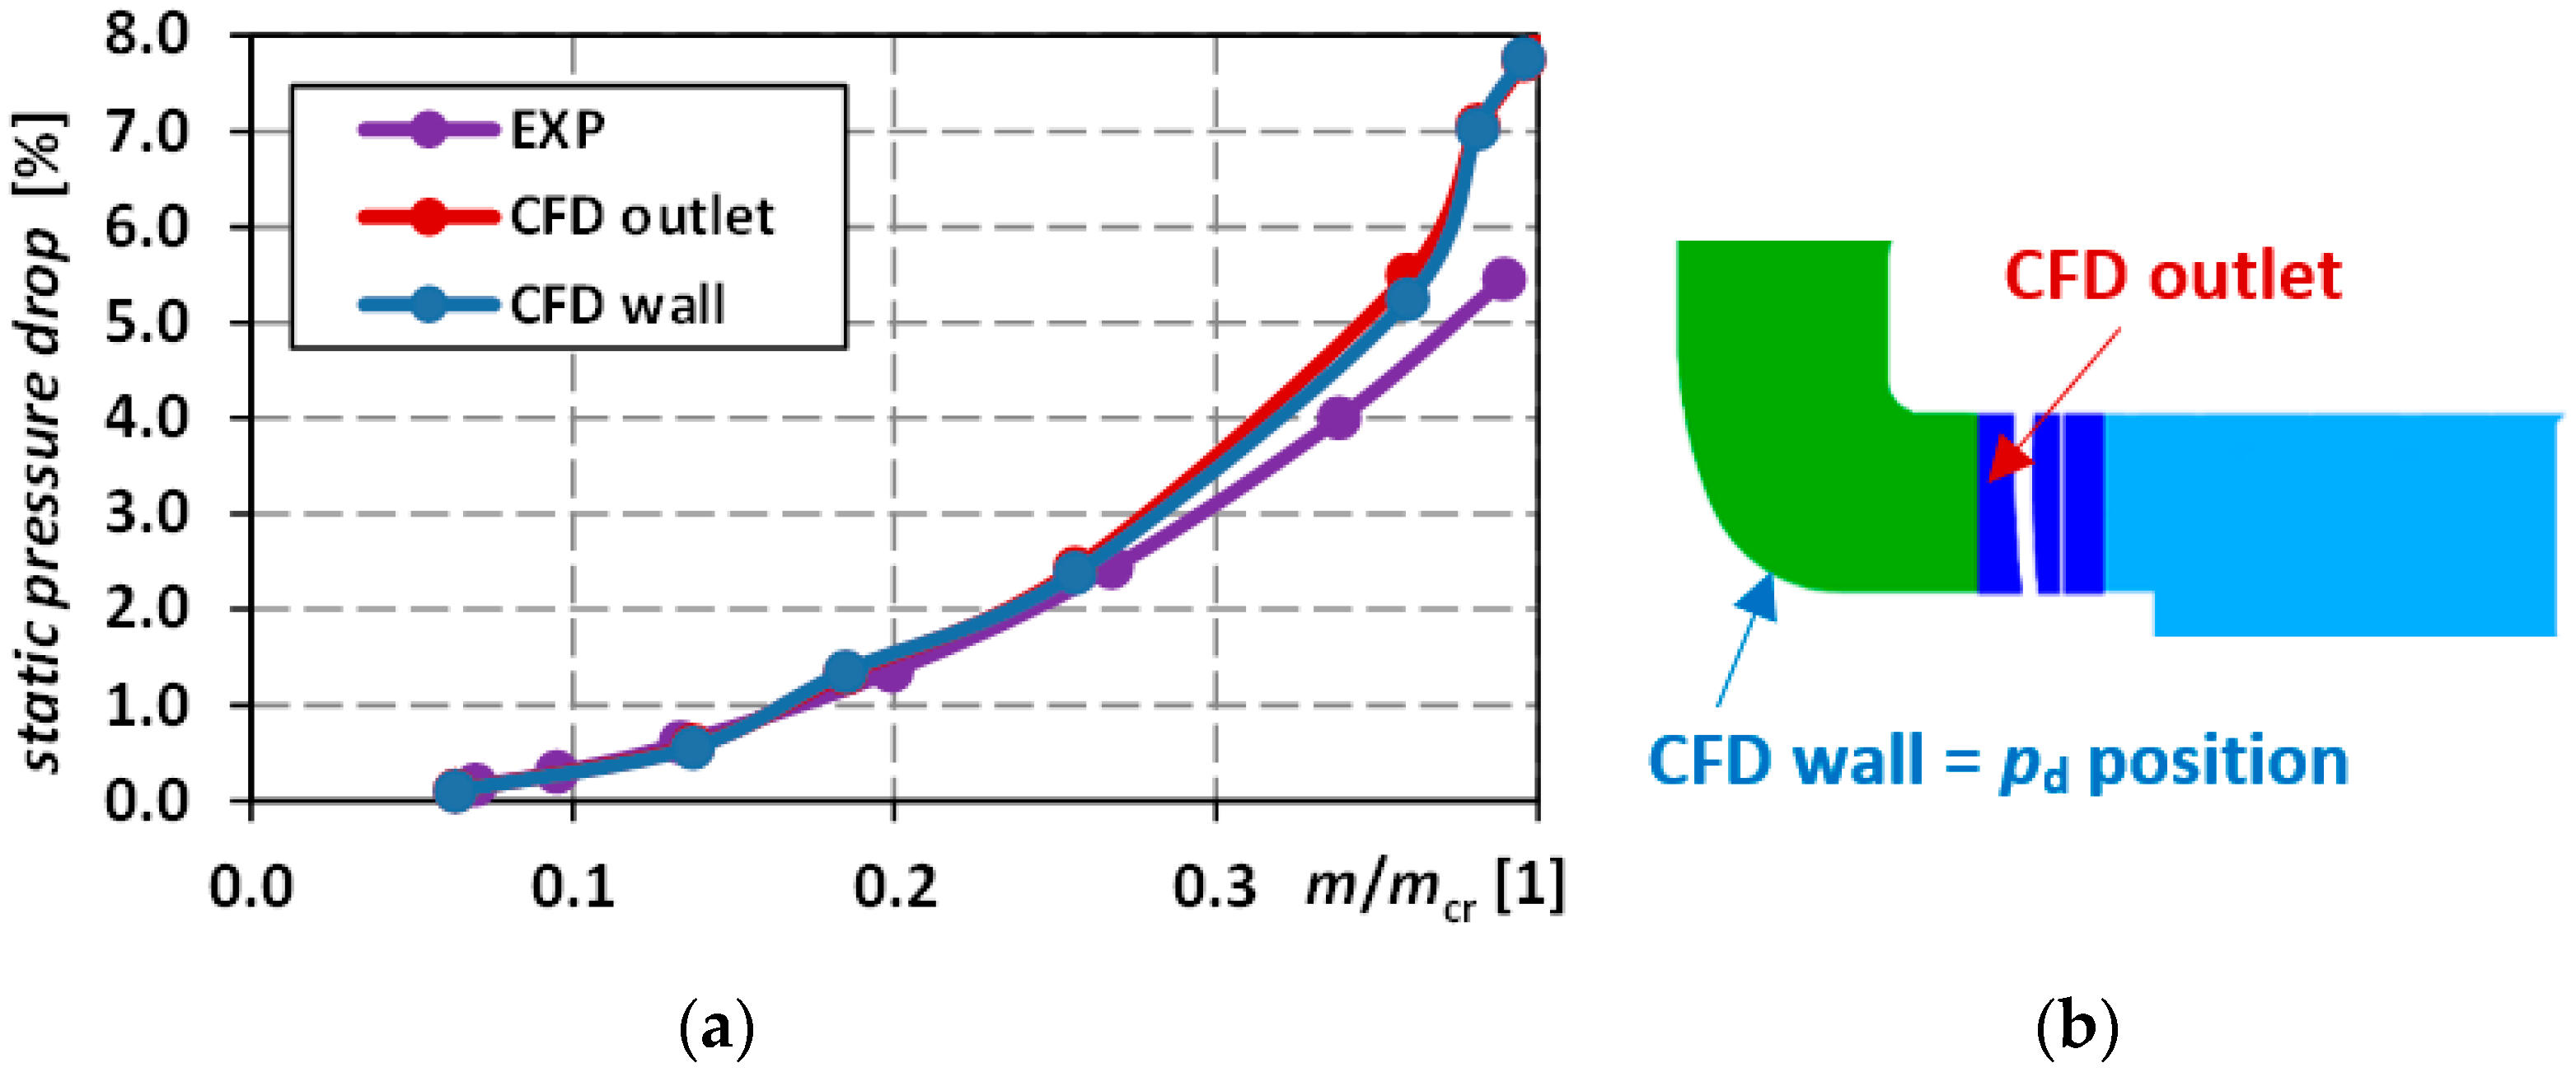
In order to generalize the pressure drop from the inlet to the outlet of the turbine inlet chamber, it was important to evaluate pressures not only from a few measuring points, but also from average values at the inlet and outlet planes. This meant that the pressure drop, which is the most important for practical use, between locations pA and pD should have been better evaluated in the numerical simulations, since the measuring positions were limited (see Figure 3, Figure 4 and Figure 5). The required pressures could be compared for different boundary conditions in different evaluating positions. Results for the required case with h/D = 0.322 are shown in Figure 15. It can be seen that the static pressure drop was almost the same, no matter whether it was calculated from the pressure at the whole outlet (before the nozzles, see Figure 4 and Figure 15b) or from the points where pressures were measured (pD). This was also proof that the selected measurement positions were relevant.
When comparing experimental and numerical results, it could be seen that the differences were reasonable up to m/mcr < 0.3. For greater m/mcr, the differences were significant from 0.5 to 2.0%. The reason is that, in the region of m/mcr > 0.3, there started to appear very unsteady phenomena, such as flow detachments, but the numerical simulations were carried out in steady-state. This was described and shown in detail in [7]. Fortunately, for a practical pressure loss prediction, the valves and, accordingly, the turbine inlet chambers were designed to be used only for conditions where m/mcr < 0.3, where the differences between numerical simulations and measurements were reasonably small.
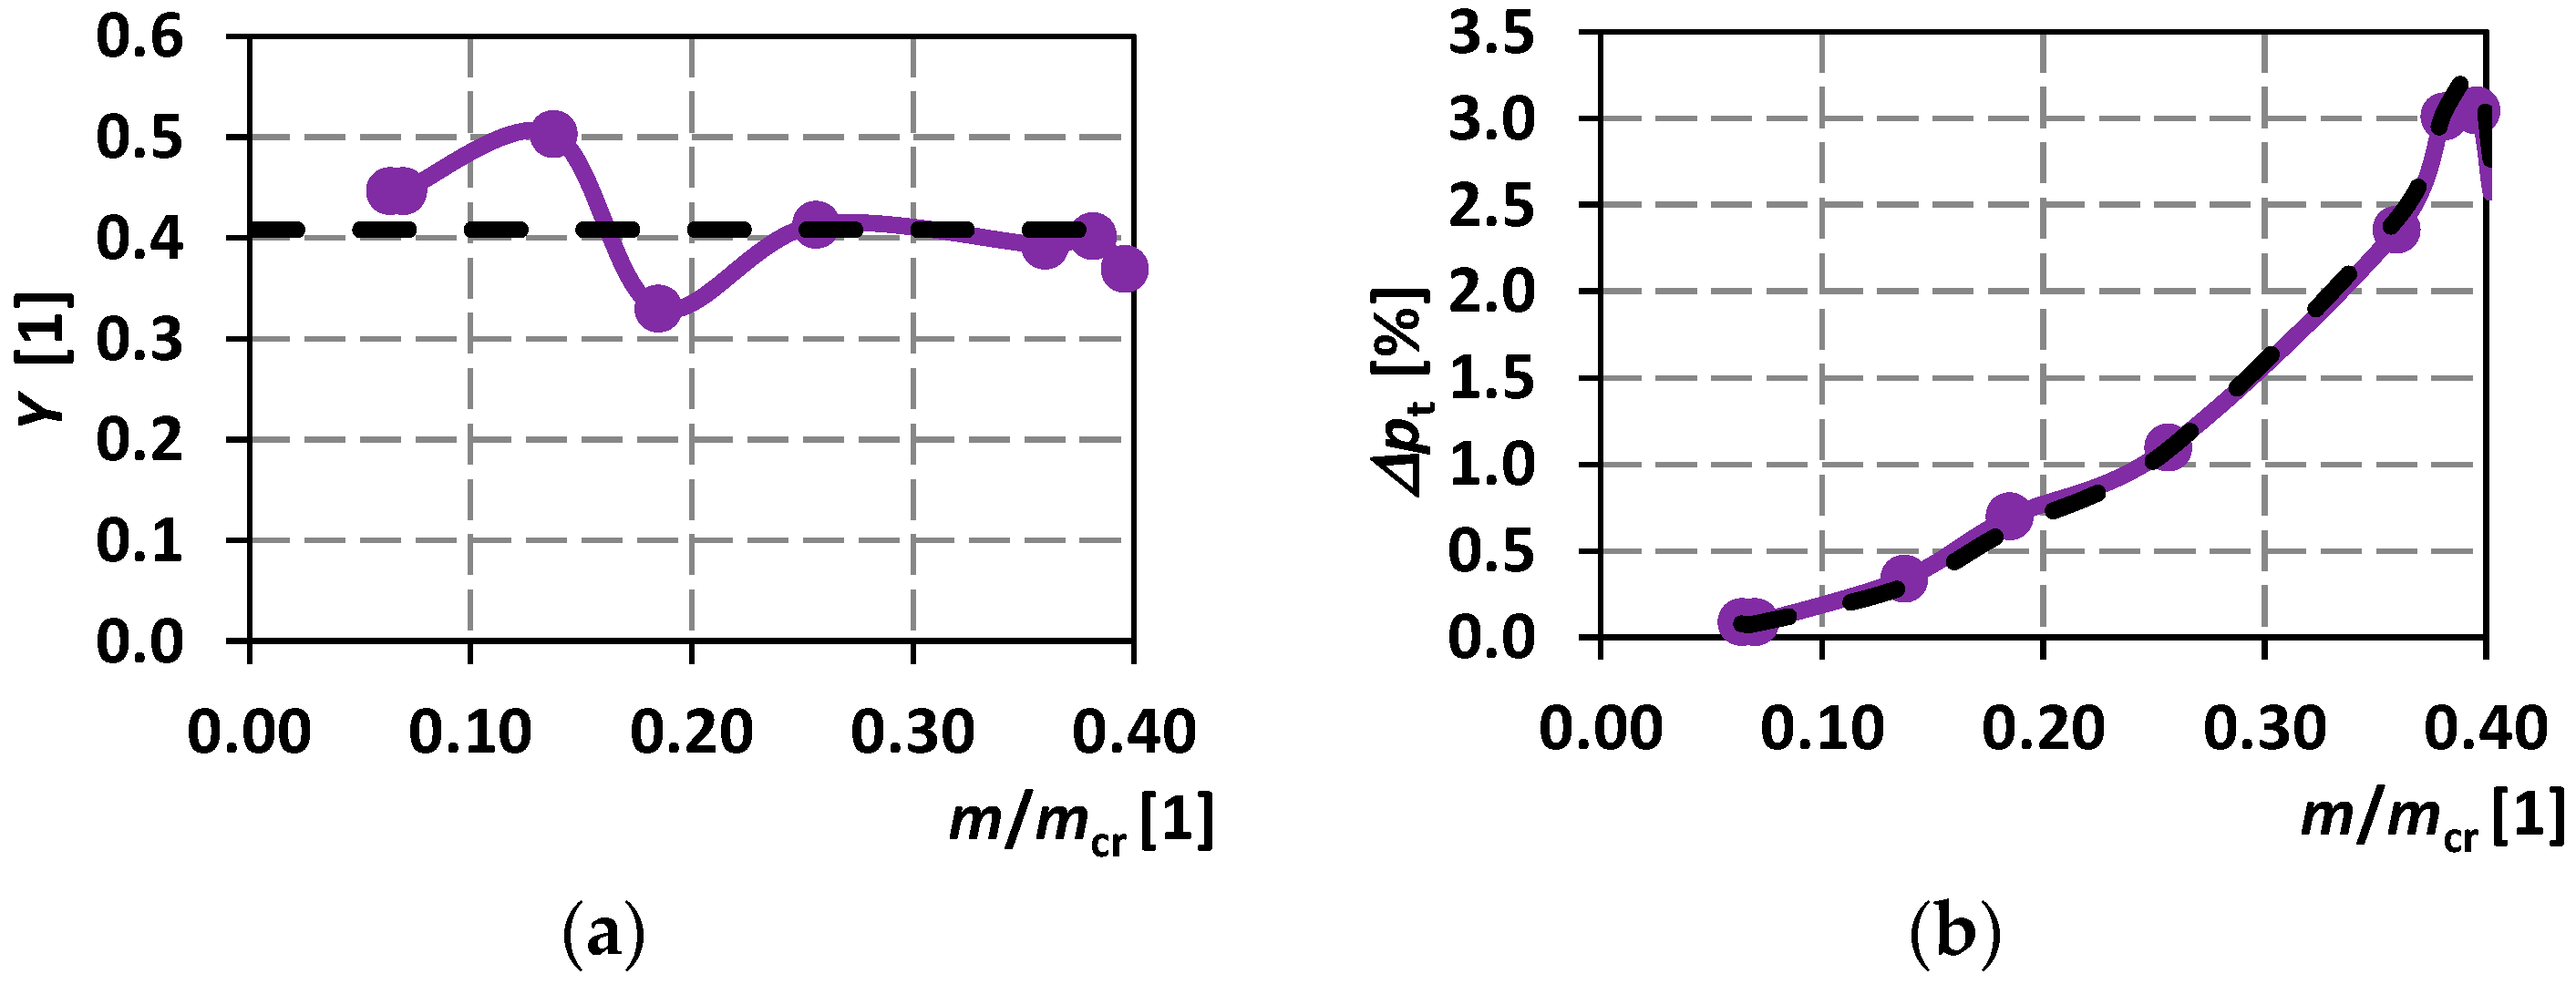
If the differences in the static pressure drop were small in the region of m/mcr < 0.3, there was an assumption that differences in the total pressure drop would also be small there. As a result, the total pressure losses should have been evaluated. The common way to evaluate and generalize the loss in an inlet turbine chamber is to use the total pressure loss coefficient Y according to [21], defined as:
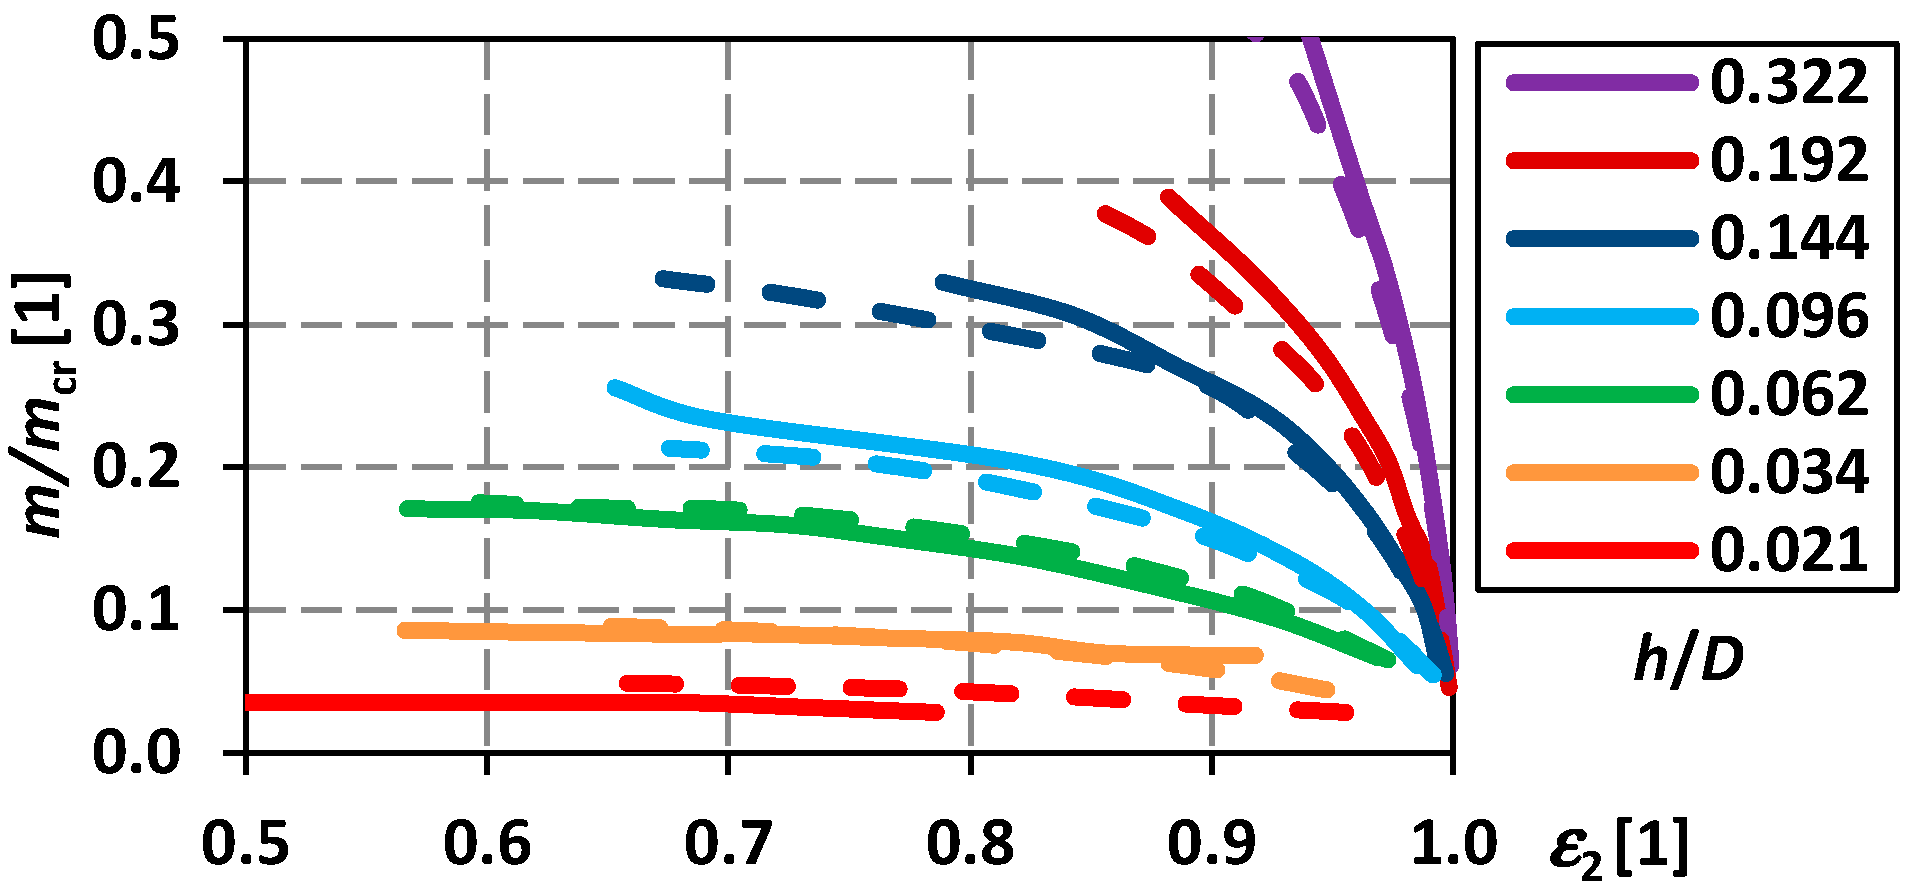
The results for all the calculated cases are shown in Figure 16 on the left. It can be seen that the total pressure loss coefficient was not constant. At lower relative mass flow ratios, its value oscillated. The reasons for these oscillations are going to be analyzed in further studies. For practical use, however, the average value of Y, which is shown with the dashed line, could be used very well. The results of the calculated total pressure losses using the average value Y are shown in Figure 16 on the right with the dashed line and using the exact values of Y shown with the solid line, respectively. For the cases where m/mcr < 0.3 represented the typical region for which the turbines were designed, the differences in the total pressure loss between the exact and average values were lower than 0.10%. This is supposed to be a reasonable difference for a practical pressure loss estimation.
5. Conclusions
Measurement and numerical simulations on a complex model of an intermediate-pressure steam turbine inlet chamber were performed. As a result, the following was found out:
- The measurement presented here was consistent with previous ones [7].
- The valve characteristics were not dependent on the downstream geometry.
- Differences in pressure drops in the inlet turbine chamber between experimental and numerical results were reasonable for the practically used operating range of valve assemblies, where m/mcr < 0.3. For greater mass flows, the differences were significant.
- The total pressure loss prediction for the inlet chambers of the intermediate-pressure steam turbine part was generalized in the form of the average value of the total pressure loss coefficient.
Furthermore, the lessons learned could be summarized as follows:
- The static pressure measured on a wall near the nozzles was almost the same as the average pressure on the plane directly upstream of the nozzles.
- If possible, a measurement of total pressures would be beneficial in order to further compare the experimental and numerical results.
- Cases of a mass flow ratio greater than 0.3 seemed to be very unsteady, and the numerical simulation results could be very different from the measured ones.
Future work is planned to optimize the design of the inlet turbine chamber, since it is evident that there is a potential for a reduction in losses. Some better-shaped designs would be more beneficial as well.
Author Contributions
Conceptualization, V.S.; Formal analysis, R.L.; Investigation, D.S.; Methodology, D.S.; Project administration, V.S.; Software, V.S.; Validation, D.S.; Writing—review and editing, R.L. All authors have read and agreed to the published version of the manuscript.
Funding
This research was funded by the projects KEGA 047ŽU-4/2022, innovative approaches to fluid dynamics modeling in energy systems and KEGA 046ŽU-4/2021, innovative methods of increasing the thermal efficiency of small heat sources using heat recovery through phase transformations, and also by the Technology Agency of the Czech Republic, National Centre for Energy, TN01000007/05.
Institutional Review Board Statement
Not applicable.
Informed Consent Statement
Not applicable.
Data Availability Statement
Not applicable.
Conflicts of Interest
The authors declare no conflict of interest.
References
- Wilson, D.G.; Korakianitis, T. The Design of High-Efficiency Turbomachinery and Gas Turbines; The MIT Press: Cambridge, MA, USA, 2014. [Google Scholar]
- Guillot, S.; Wing, F.; Hamm, H.; Stang, U.; Lowe, K. The experimental studies of improving the aerodynamic performance of a turbine exhaust system. J. Eng. Gas Turbines Power 2014, 137, 012601. [Google Scholar] [CrossRef]
- Gadhamshetty, V.; Nirmalakhandan, N.; Myint, M.; Ricketts, C. Improving air-cooled condenser performance in combined cycle power plants. J. Energy Eng. 2006, 132, 81. [Google Scholar] [CrossRef]
- Kumar, V.; Viswanath, T. Investigation on last stage high pressure steam turbine blade for producing electricity. J. Appl. Mech. Eng. 2015, 4. [Google Scholar] [CrossRef]
- Slama, V.; Mrozek, L.; Tajc, L.; Klimko, M.; Zitek, P. Flow analysis in a steam turbine control valve with through-flow valve chamber. ASME J Nucl. Rad Sci. 2021, 7, 021401. [Google Scholar] [CrossRef]
- Mrozek, L.; Slama, V.; Sedlak, K.; Tajc, L. Analysis of losses in steam turbine control valves. AIP Conf. Proc. 2021, 2323, 060003. [Google Scholar]
- Slama, V.; Simurda, D.; Mrozek, L.; Tajc, L.; Hala, J.; Radnic, T. Pressure losses and oscillations in a compact valve of a steam turbine. MATEC Web Conf. 2021, 345, 00027. [Google Scholar] [CrossRef]
- Domnick, C.; Brillert, D. Flow-induced steam valve vibrations—A literature review of excitation mechanisms, preventive measures, and design improvements. J. Eng. Gas Turbines Power 2019, 141, 051009. [Google Scholar] [CrossRef]
- He, L. Computation of unsteady flow through steam turbine blade rows at partial admission. Proc. Inst. Mech. Eng. Part A J. Power Energy 1997, 211, 197–205. [Google Scholar] [CrossRef]
- Cho, S.Y.; Ahn, K.Y.; Lee, Y.D.; Kim, Y.C. Pressure and force on a blade row operated in partial admission with different solidity. J. Mech. Sci. Technol. 2013, 27, 387–396. [Google Scholar] [CrossRef]
- Orman, L.J. Boiling heat transfer on meshed surfaces of different aperture. In Proceedings of the International Conference on Application of Experimental and Numerical Methods in Fluid Mechanics and Energetics (Slovakia), AIP Conference Proceedings, Liptovský Ján, Slovakia, 9–11 April 2014; Volume 1608. [Google Scholar]
- Suzuki, F.; Nishida, S.; Fukao, S.; Tsuruta, M. Verification of combined main steam valve pressure distribution and vibration characteristics with downscale model test on air condition. In Proceedings of the ASME Turbo Expo 2019: Turbomachinery Technical Conference and Exposition, Phoenix, AZ, USA, 17–19 June 2019. [Google Scholar]
- Brüggemann, P.; Vinnemeier, P.; Balkowski, I.; Büscher, C.; Stapper, P.; Zimmer, G.; Wirsum, M. A new emergency stop and control valves design—part 1: Experimental verification with scaled models. In Proceedings of the ASME Turbo Expo 2014: Turbine Technical Conference and Exposition, Düsseldorf, Germany, 16–20 June 2014. [Google Scholar]
- Musch, C.; Deister, F.; Zimmer, G.; Balkowski, I.; Brüggemann, P.; Haslinger, W. A new emergency stop and control valves design—Part 2: Validation of numerical model and transient flow physics. In Proceedings of the ASME Turbo Expo 2014: Turbine Technical Conference and Exposition, Düsseldorf, Germany, 16–20 June 2014. [Google Scholar]
- Langhaar, H. Dimensional Analysis and Theory of Models, 1st ed.; John Wiley & Son Ltd: New York, NY, USA, 1951; ISBN 13 978-0471516781. [Google Scholar]
- Zaryankin, A.E.; Simonov, B. Control and Stop-Control Valves of Steam Turbines; Moscow Energetic Institute: Moscow, Russia, 2005; ISBN 5-7046-1143-5. [Google Scholar]
- Knopp, T. Model-consistent universal wall-functions for RANS turbulence modelling. In Proceedings of the BAIL 2006 International Conference on Boundary and Interior Layers, Göttingen, Germany, 24–28 July 2006. [Google Scholar]
- Denton, J.D. Some limitations of turbomachinery CFD. ASME Turbo Expo Power Land Sea Air 2010, 7, 735–745. [Google Scholar]
- Menter, F.R. Two-Equation Eddy-Viscosity Turbulence Models for Engineering Applications. AIAA J. 1994, 32, 1598–1605. [Google Scholar] [CrossRef] [Green Version]
- Kalista, R.; Mrozek, L.; Slama, V.; Sedlak, K. Steam turbine axial exhaust diffuser investigation using a test rig and its numerical model. In Proceedings of the ASME 2019 International Mechanical Engineering Congress and Exposition, Salt Lake City, UT, USA, 11–14 November 2019. [Google Scholar]
- Denton, J.D. Loss Mechanisms in Turbomachines. J. Turbomach. 1993, 115, 621–656. [Google Scholar] [CrossRef]
Figure 1.
Complex assembly of the measured model.

Figure 2.
Detail aerodynamic tunnel scheme.

Figure 3.
Measurement position at the inlet of the chamber.

Figure 4.
Measurement positions (static pressure extractions) from the chamber.

Figure 5.
Measurement positions of pressures around the circumference of the chamber (4 pressure positions of pB and 14 pressure positions of pC).
Figure 5.
Measurement positions of pressures around the circumference of the chamber (4 pressure positions of pB and 14 pressure positions of pC).

Figure 6.
Supporting study showing the influence of flowing media.

Figure 7.
Former numerical model (a) [7]; new model with the turbine inlet chamber (b).
Figure 7.
Former numerical model (a) [7]; new model with the turbine inlet chamber (b).

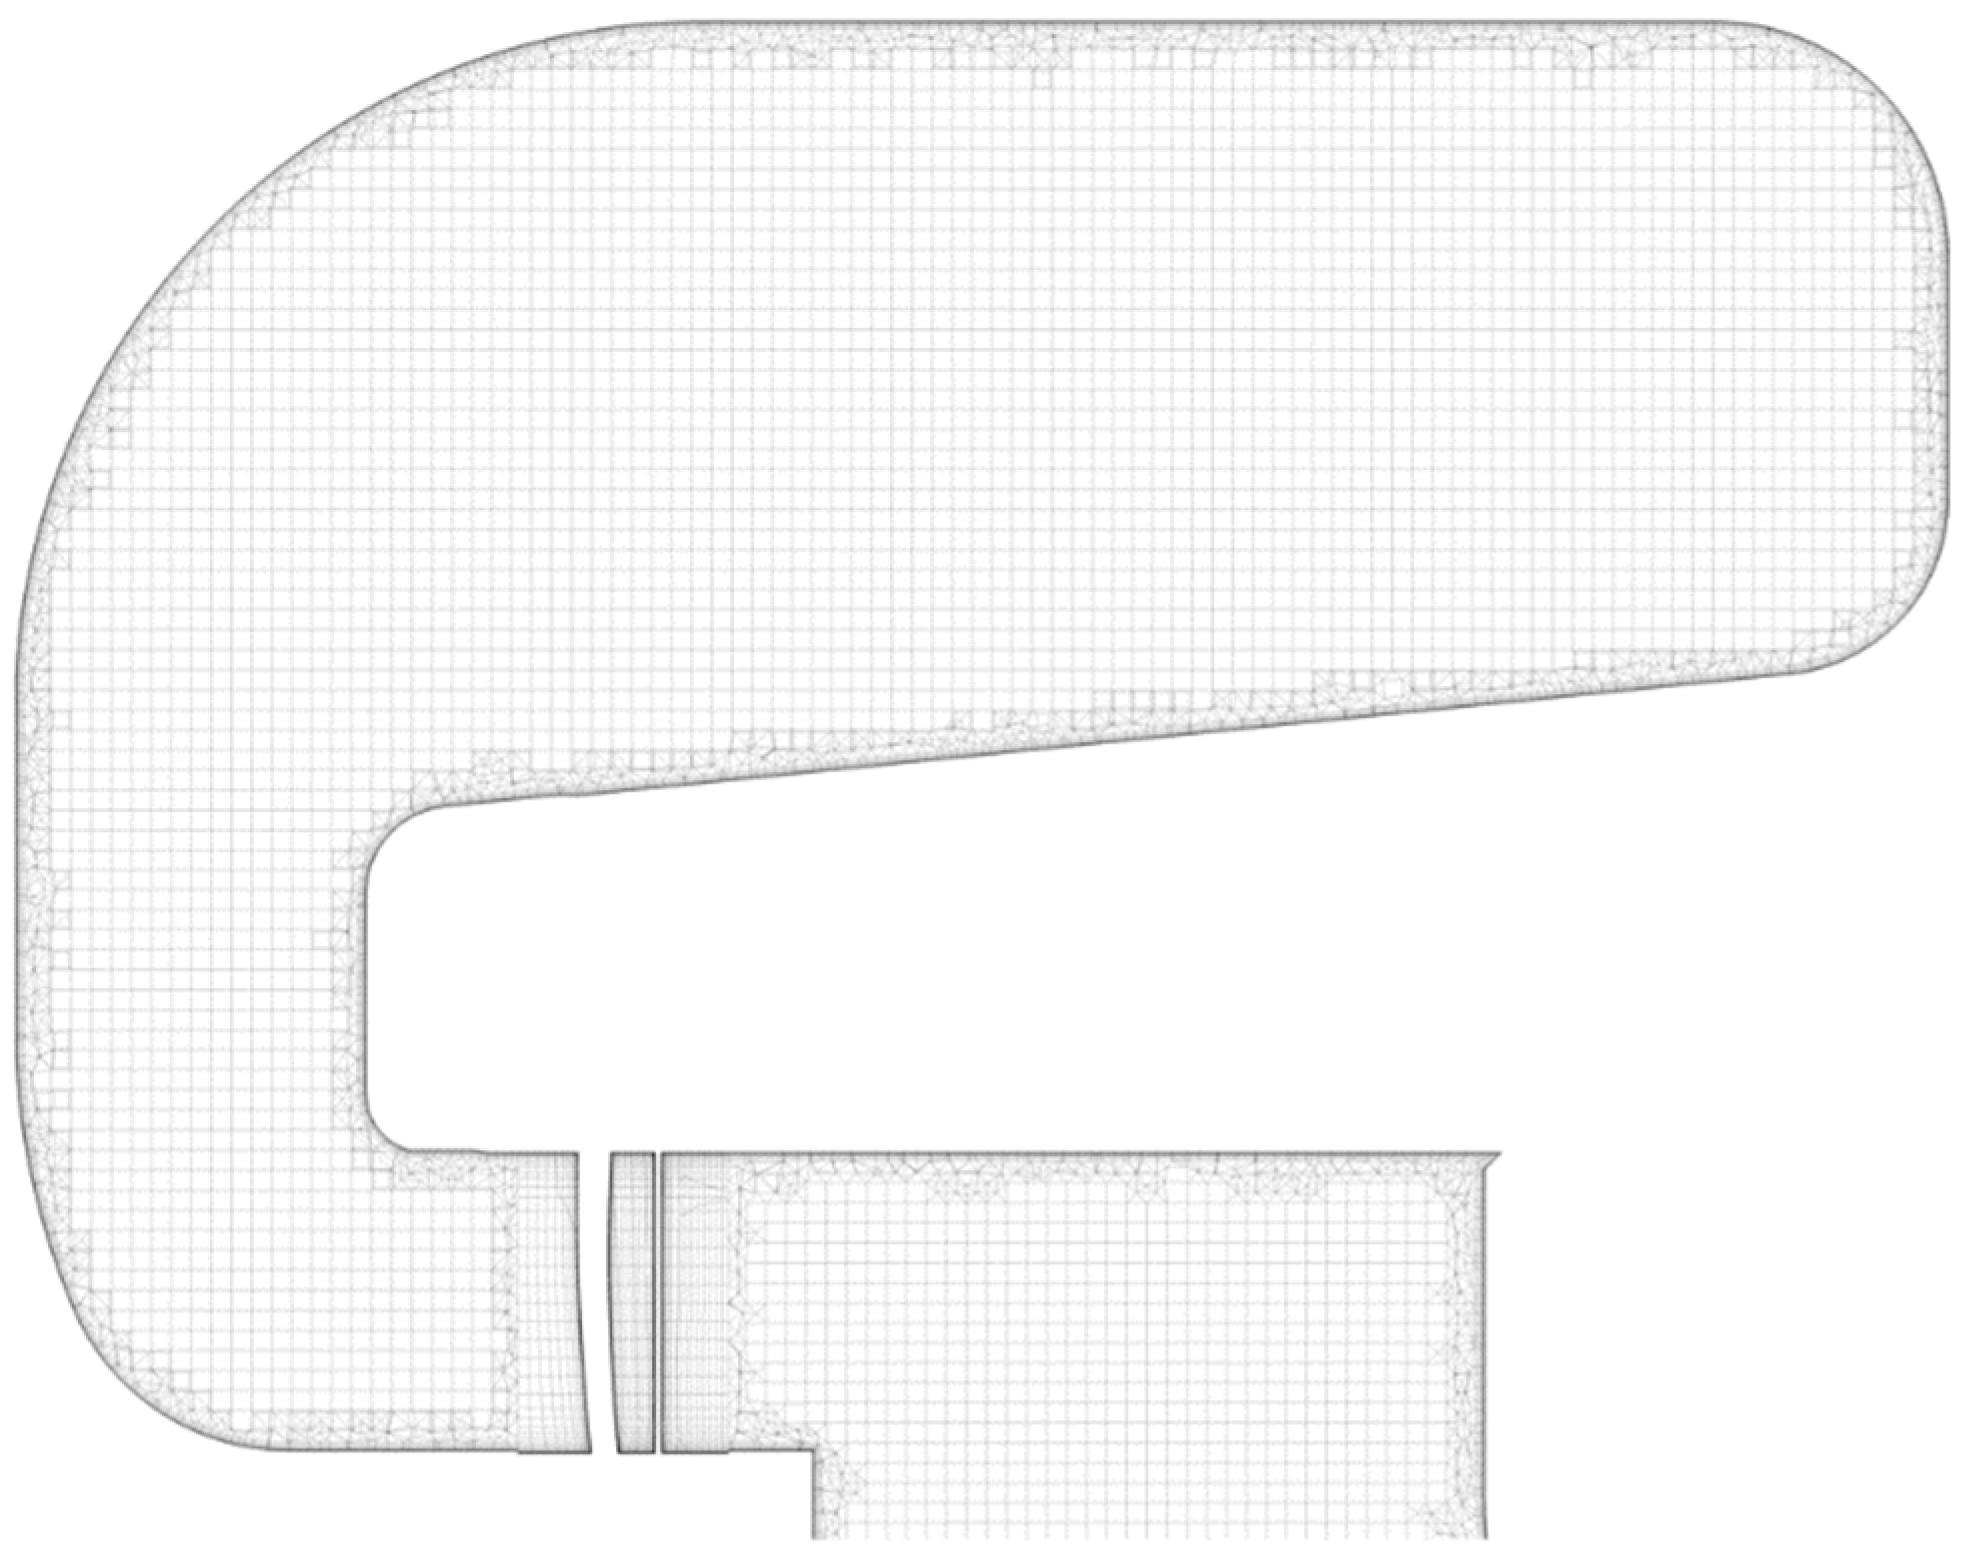
Figure 8.
Mesh in the cross-section of the control valve and the chamber.

Figure 9.
Details of the mesh in the cross-section of the chamber.

Figure 10.
Measured valve characteristics comparison.

Figure 11.
CFD valve characteristics comparison.

Figure 12.
Distribution of pressure pB for cases C1 (a) and C2 (b).

Figure 13.
Distribution of pressure pC for cases C1 (a) and C2 (b).

Figure 14.
Distribution of pressure pD for cases C1 (a) and C2 (b).

Figure 15.
Static pressure drop differences comparison (a); evaluating positions in the CFD model (b).
Figure 15.
Static pressure drop differences comparison (a); evaluating positions in the CFD model (b).

Figure 16.
Total pressure loss coefficient (a) and total pressure loss dependence (b), the full lines present the exact values and the dashed lines present the average values.
Figure 16.
Total pressure loss coefficient (a) and total pressure loss dependence (b), the full lines present the exact values and the dashed lines present the average values.


Table 1.
Brief mesh sensitivity analysis: different mesh densities and resulting pressure losses for boundary conditions C2.
Table 1.
Brief mesh sensitivity analysis: different mesh densities and resulting pressure losses for boundary conditions C2.
| Mesh Density | Used Mesh | Refined Mesh |
|---|---|---|
| size factor (1) | 1.0 | 1.5 |
| nodes (1) | 19,825,425 | 30,220,150 |
| elements (1) | 49,620,100 | 70,401,200 |
| total pressure loss (%) | 3.879 | 3.878 |
| difference (%) | 0 | 0.047 |
Publisher’s Note: MDPI stays neutral with regard to jurisdictional claims in published maps and institutional affiliations. |
© 2022 by the authors. Licensee MDPI, Basel, Switzerland. This article is an open access article distributed under the terms and conditions of the Creative Commons Attribution (CC BY) license (https://creativecommons.org/licenses/by/4.0/).
Share and Cite
MDPI and ACS Style
Slama, V.; Simurda, D.; Lenhard, R. Pressure Losses Downstream of a Compact Valve in the Inlet Chamber of an Intermediate-Pressure Steam Turbine. Energies 2022, 15, 8753. https://doi.org/10.3390/en15228753
AMA Style
Slama V, Simurda D, Lenhard R. Pressure Losses Downstream of a Compact Valve in the Inlet Chamber of an Intermediate-Pressure Steam Turbine. Energies. 2022; 15(22):8753. https://doi.org/10.3390/en15228753
Chicago/Turabian StyleSlama, Vaclav, David Simurda, and Richard Lenhard. 2022. "Pressure Losses Downstream of a Compact Valve in the Inlet Chamber of an Intermediate-Pressure Steam Turbine" Energies 15, no. 22: 8753. https://doi.org/10.3390/en15228753
Note that from the first issue of 2016, this journal uses article numbers instead of page numbers. See further details here.