
The PRISMI Plus Toolkit Application to a Grid-Connected Mediterranean Island

 , , and
Abstract
:1. Introduction
2. Literature Review
3. Materials and Methods
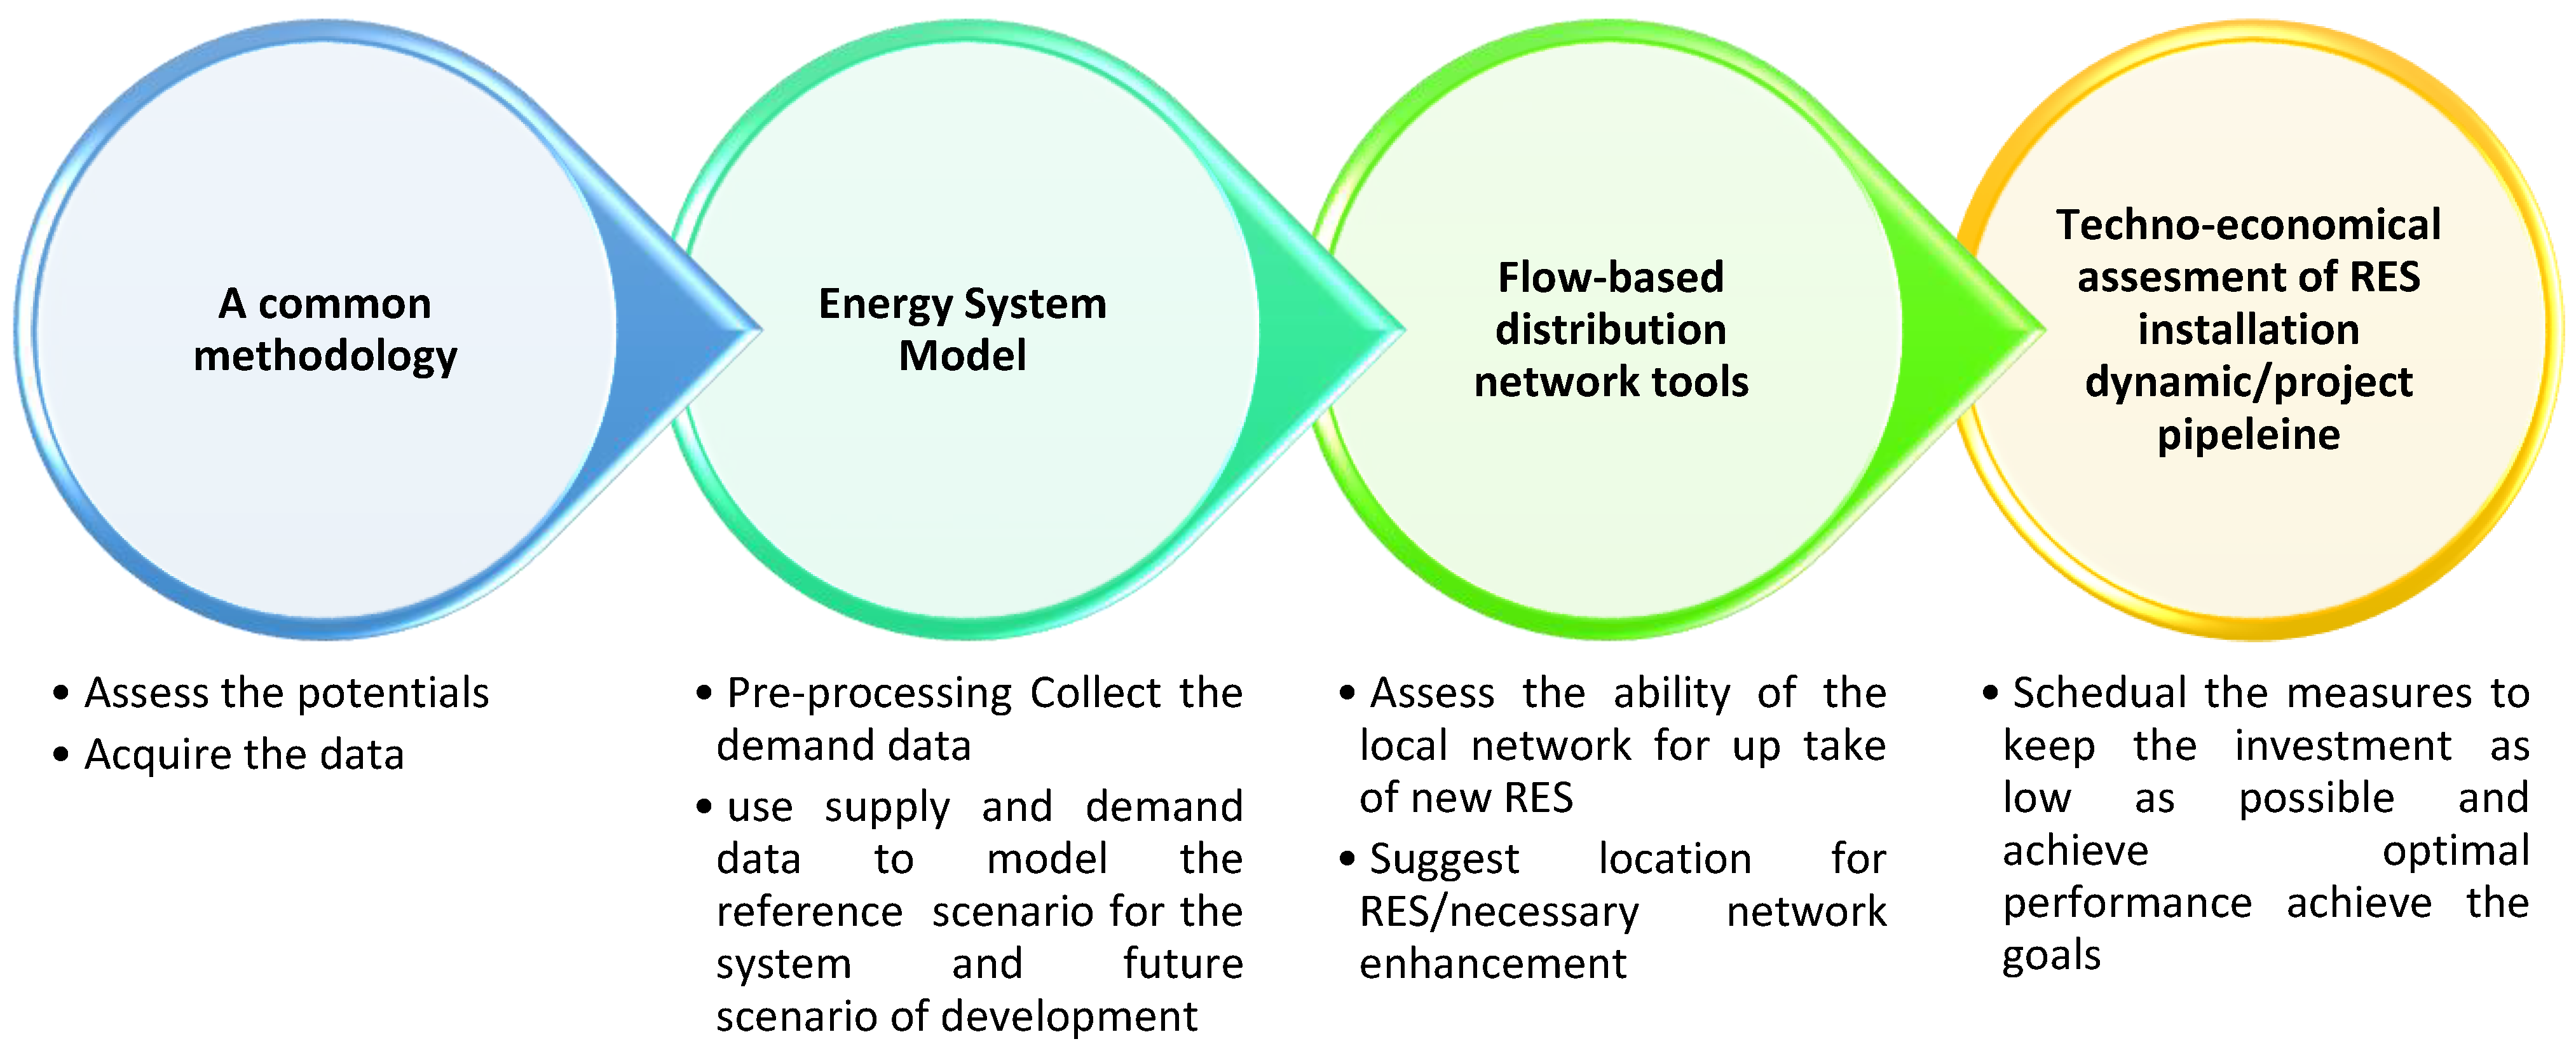
3.1. General Framework Method for Devising the Future Development Energy Scenarios for the PRISMI Plus Case Study Considered
- (1)
- Mapping the energy needs of the local municipality
- (2)
- Mapping the locally available renewable energy resources
- (3)
- Technologies overview for bridging the gap between energy needs and energy resources
- (4)
- Division of scenarios
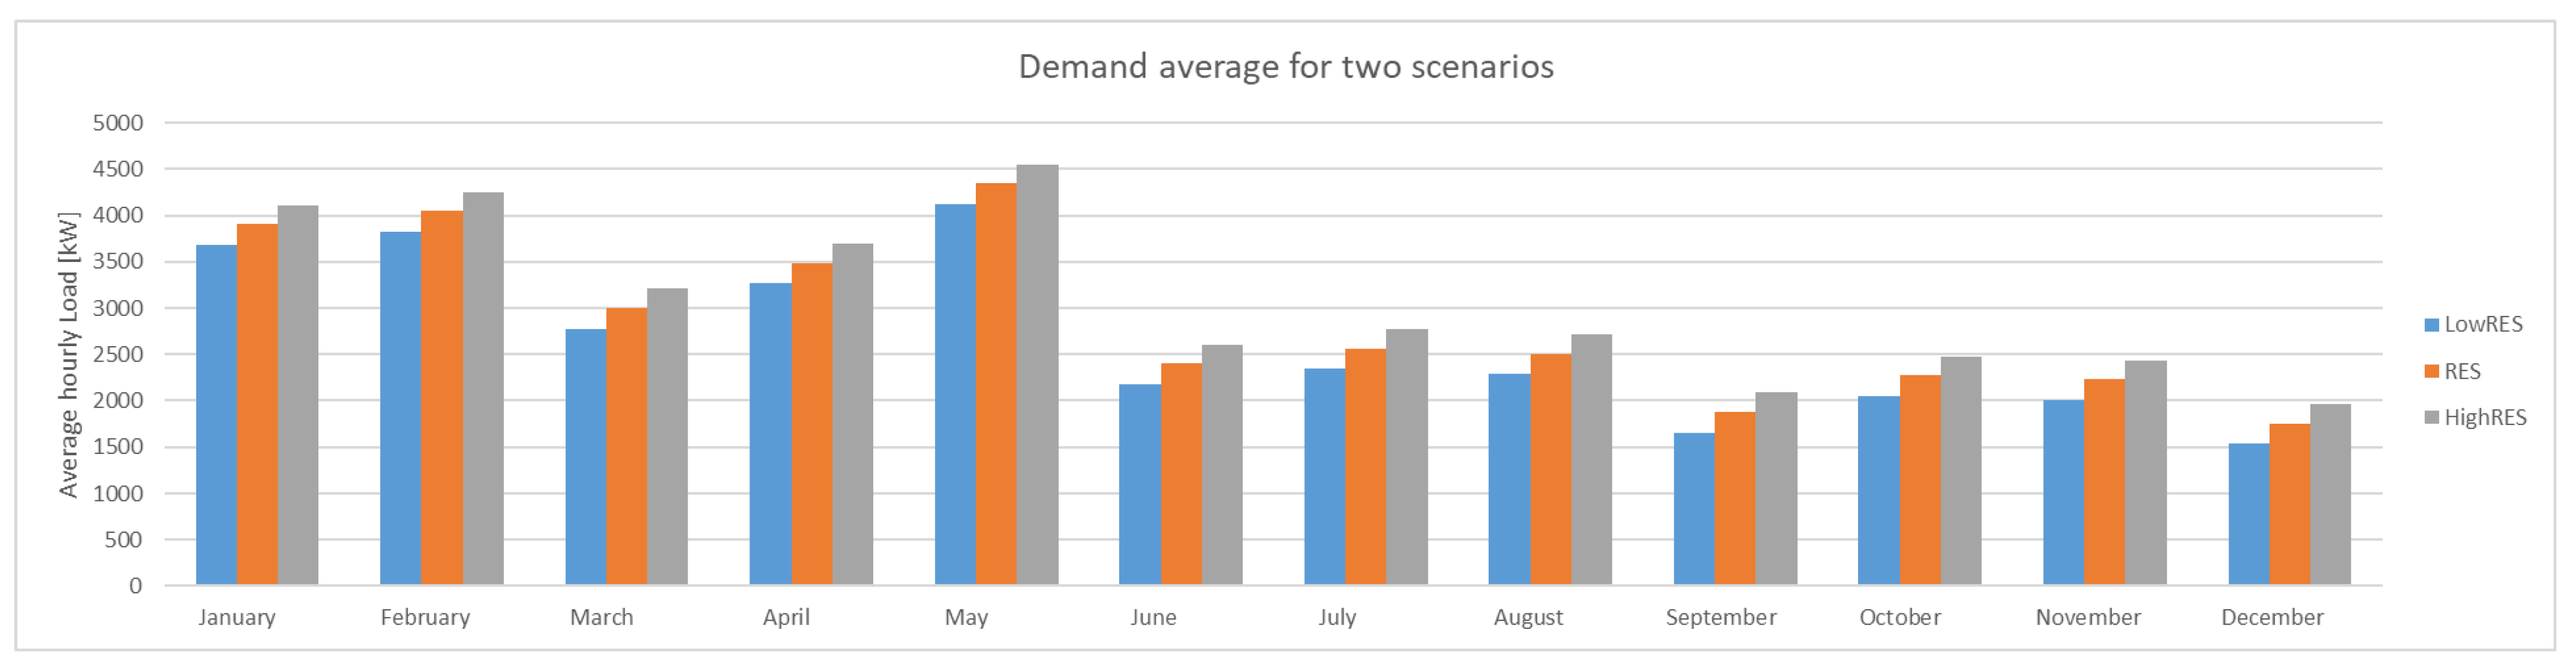
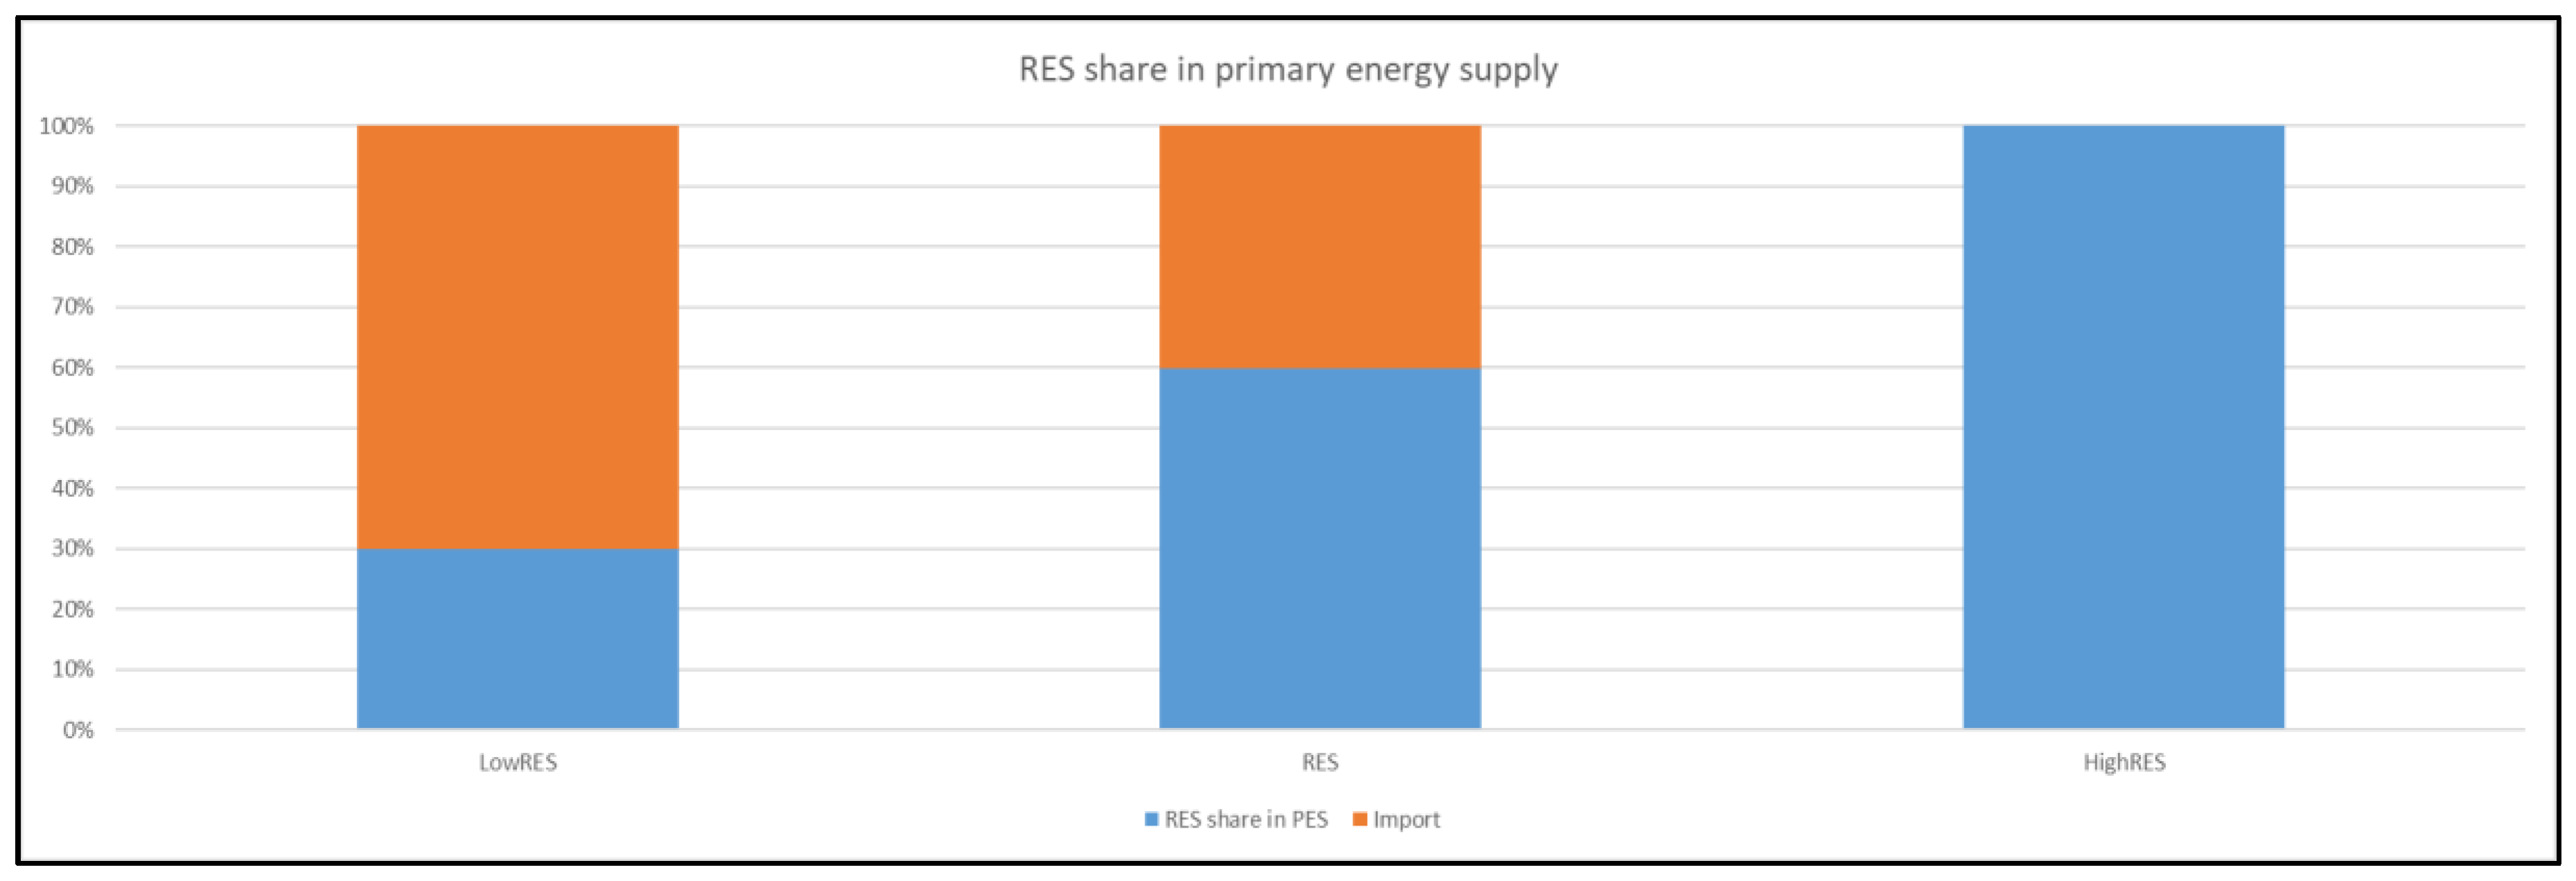
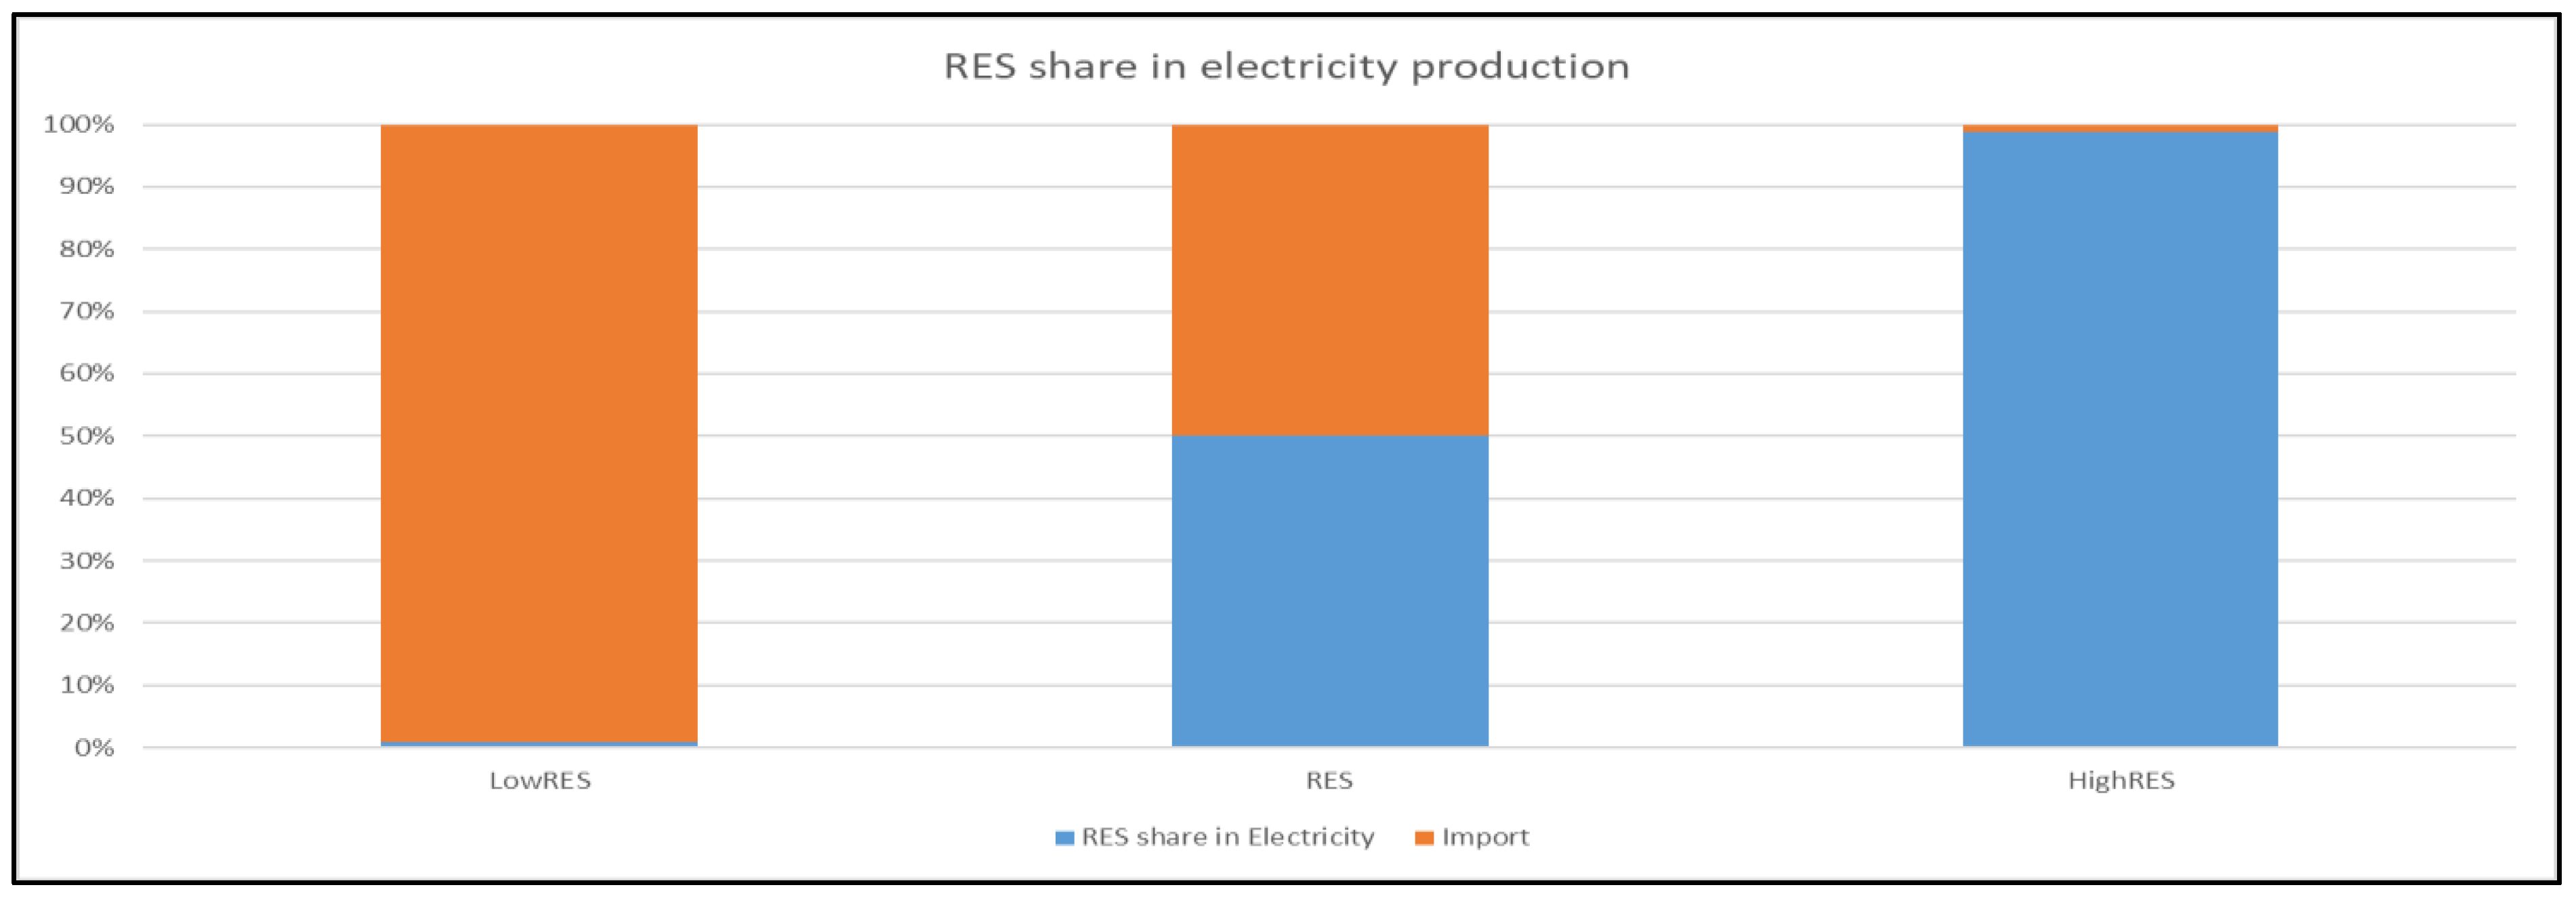
| Scenario 1 | During this scenario, the electricity consumption of the whole island, as provided by Procida Municipality itself, is considered. This scenario is used as a baseline scenario since no other installation/investment are analysed. |
| Scenario 2 | During this scenario, the partial electrification (i.e., 50% of the total consumption) of the heating sector and the transport sector is analysed by means of the installation of HPs and EVs, respectively. In addition, the investment on PV and BES is analysed in order to reach a 50% RES share. |
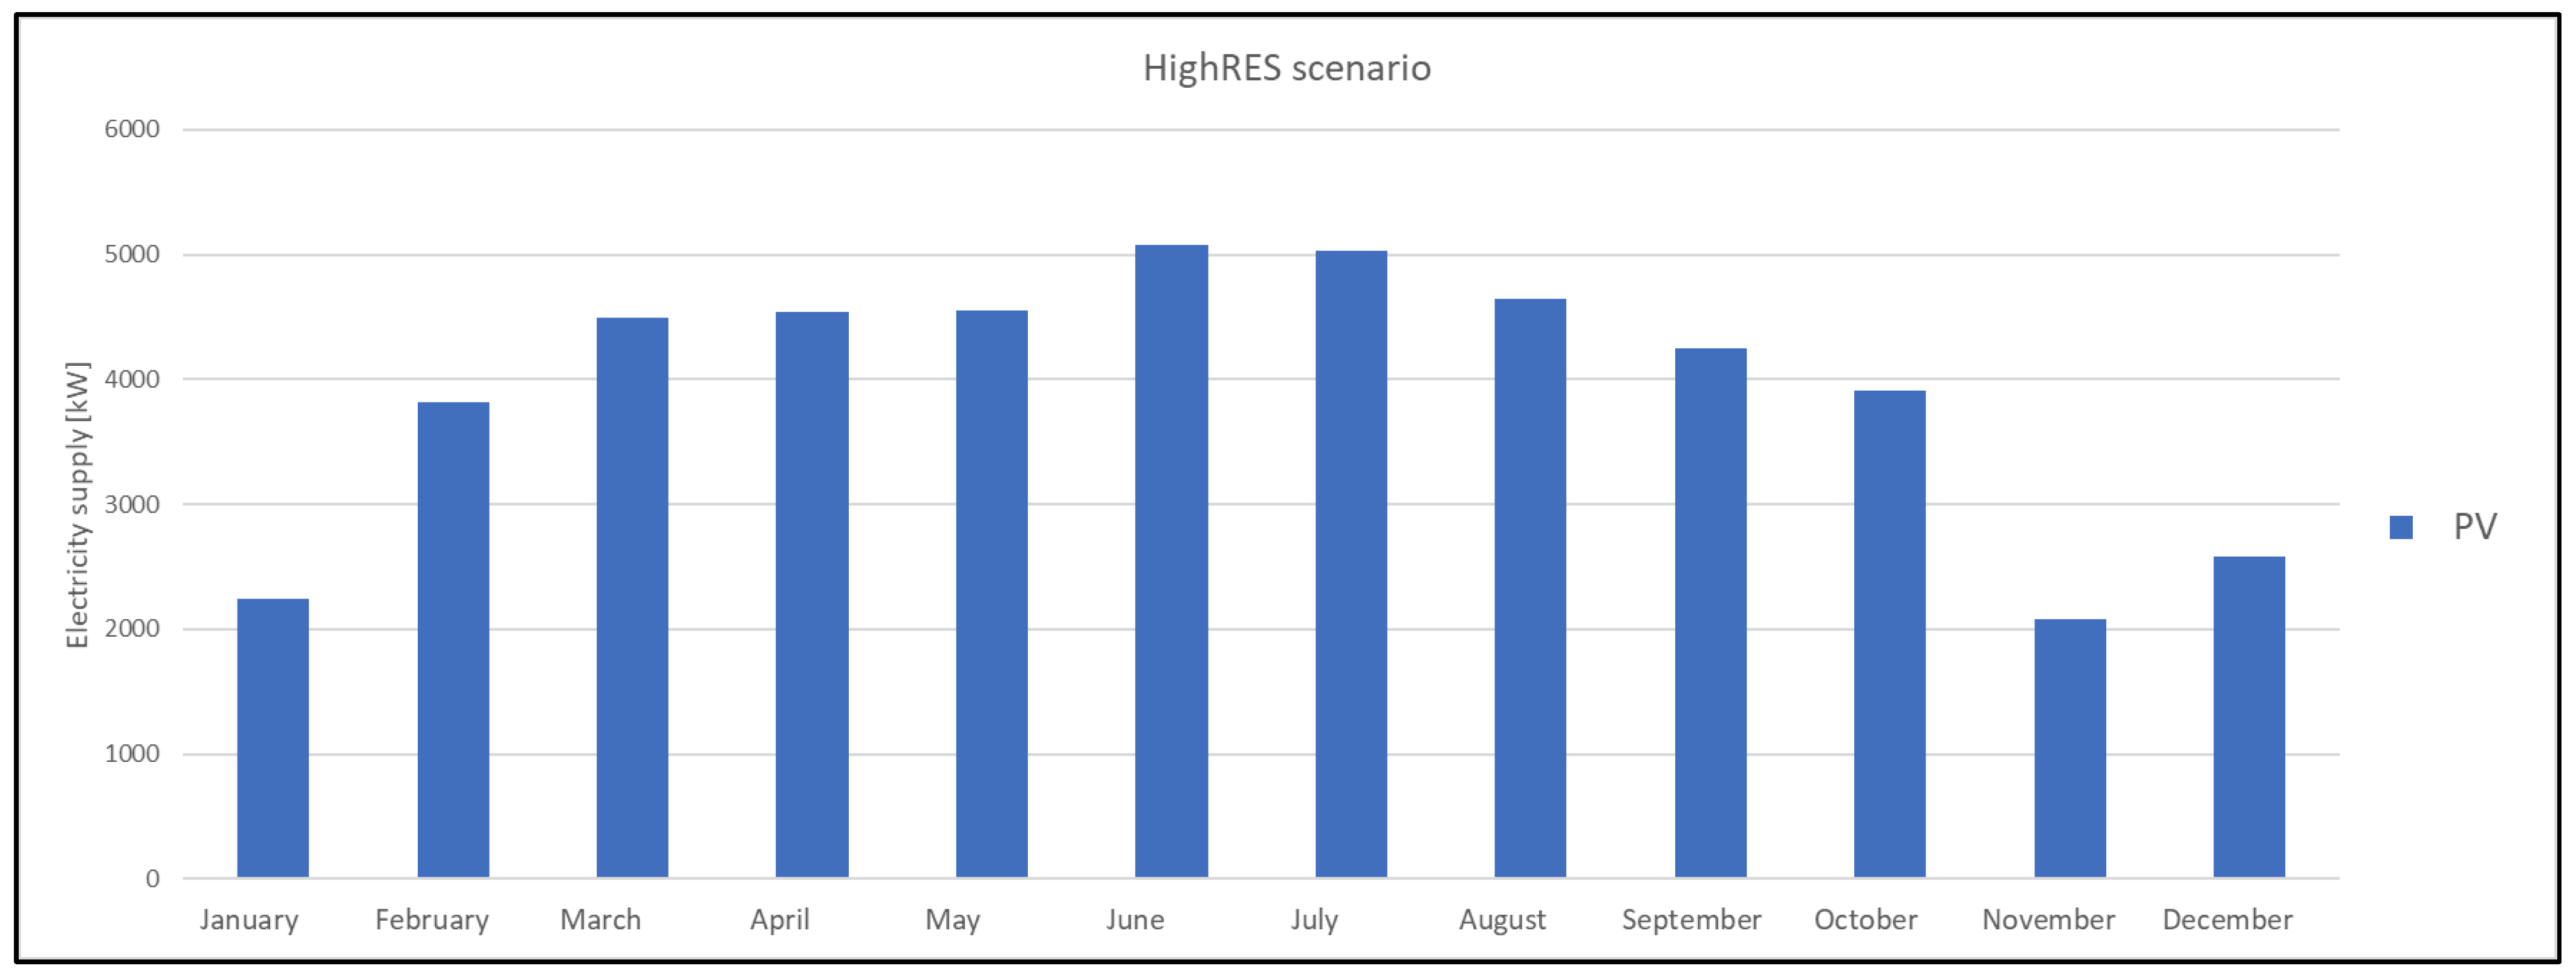
| Scenario 3 | During this scenario, the full electrification (i.e., 100% of the total consumption) of the heating sector and the transport sector is analysed by means of the installation of HPs and EVs, respectively. In addition, the investment on PV and BES is analysed in order to reach a 100% RES share. |
3.2. Case Study Examined—Procida Municipality Flagship Case (FC)
4. Results and Discussion
4.1. Environmental Considerations
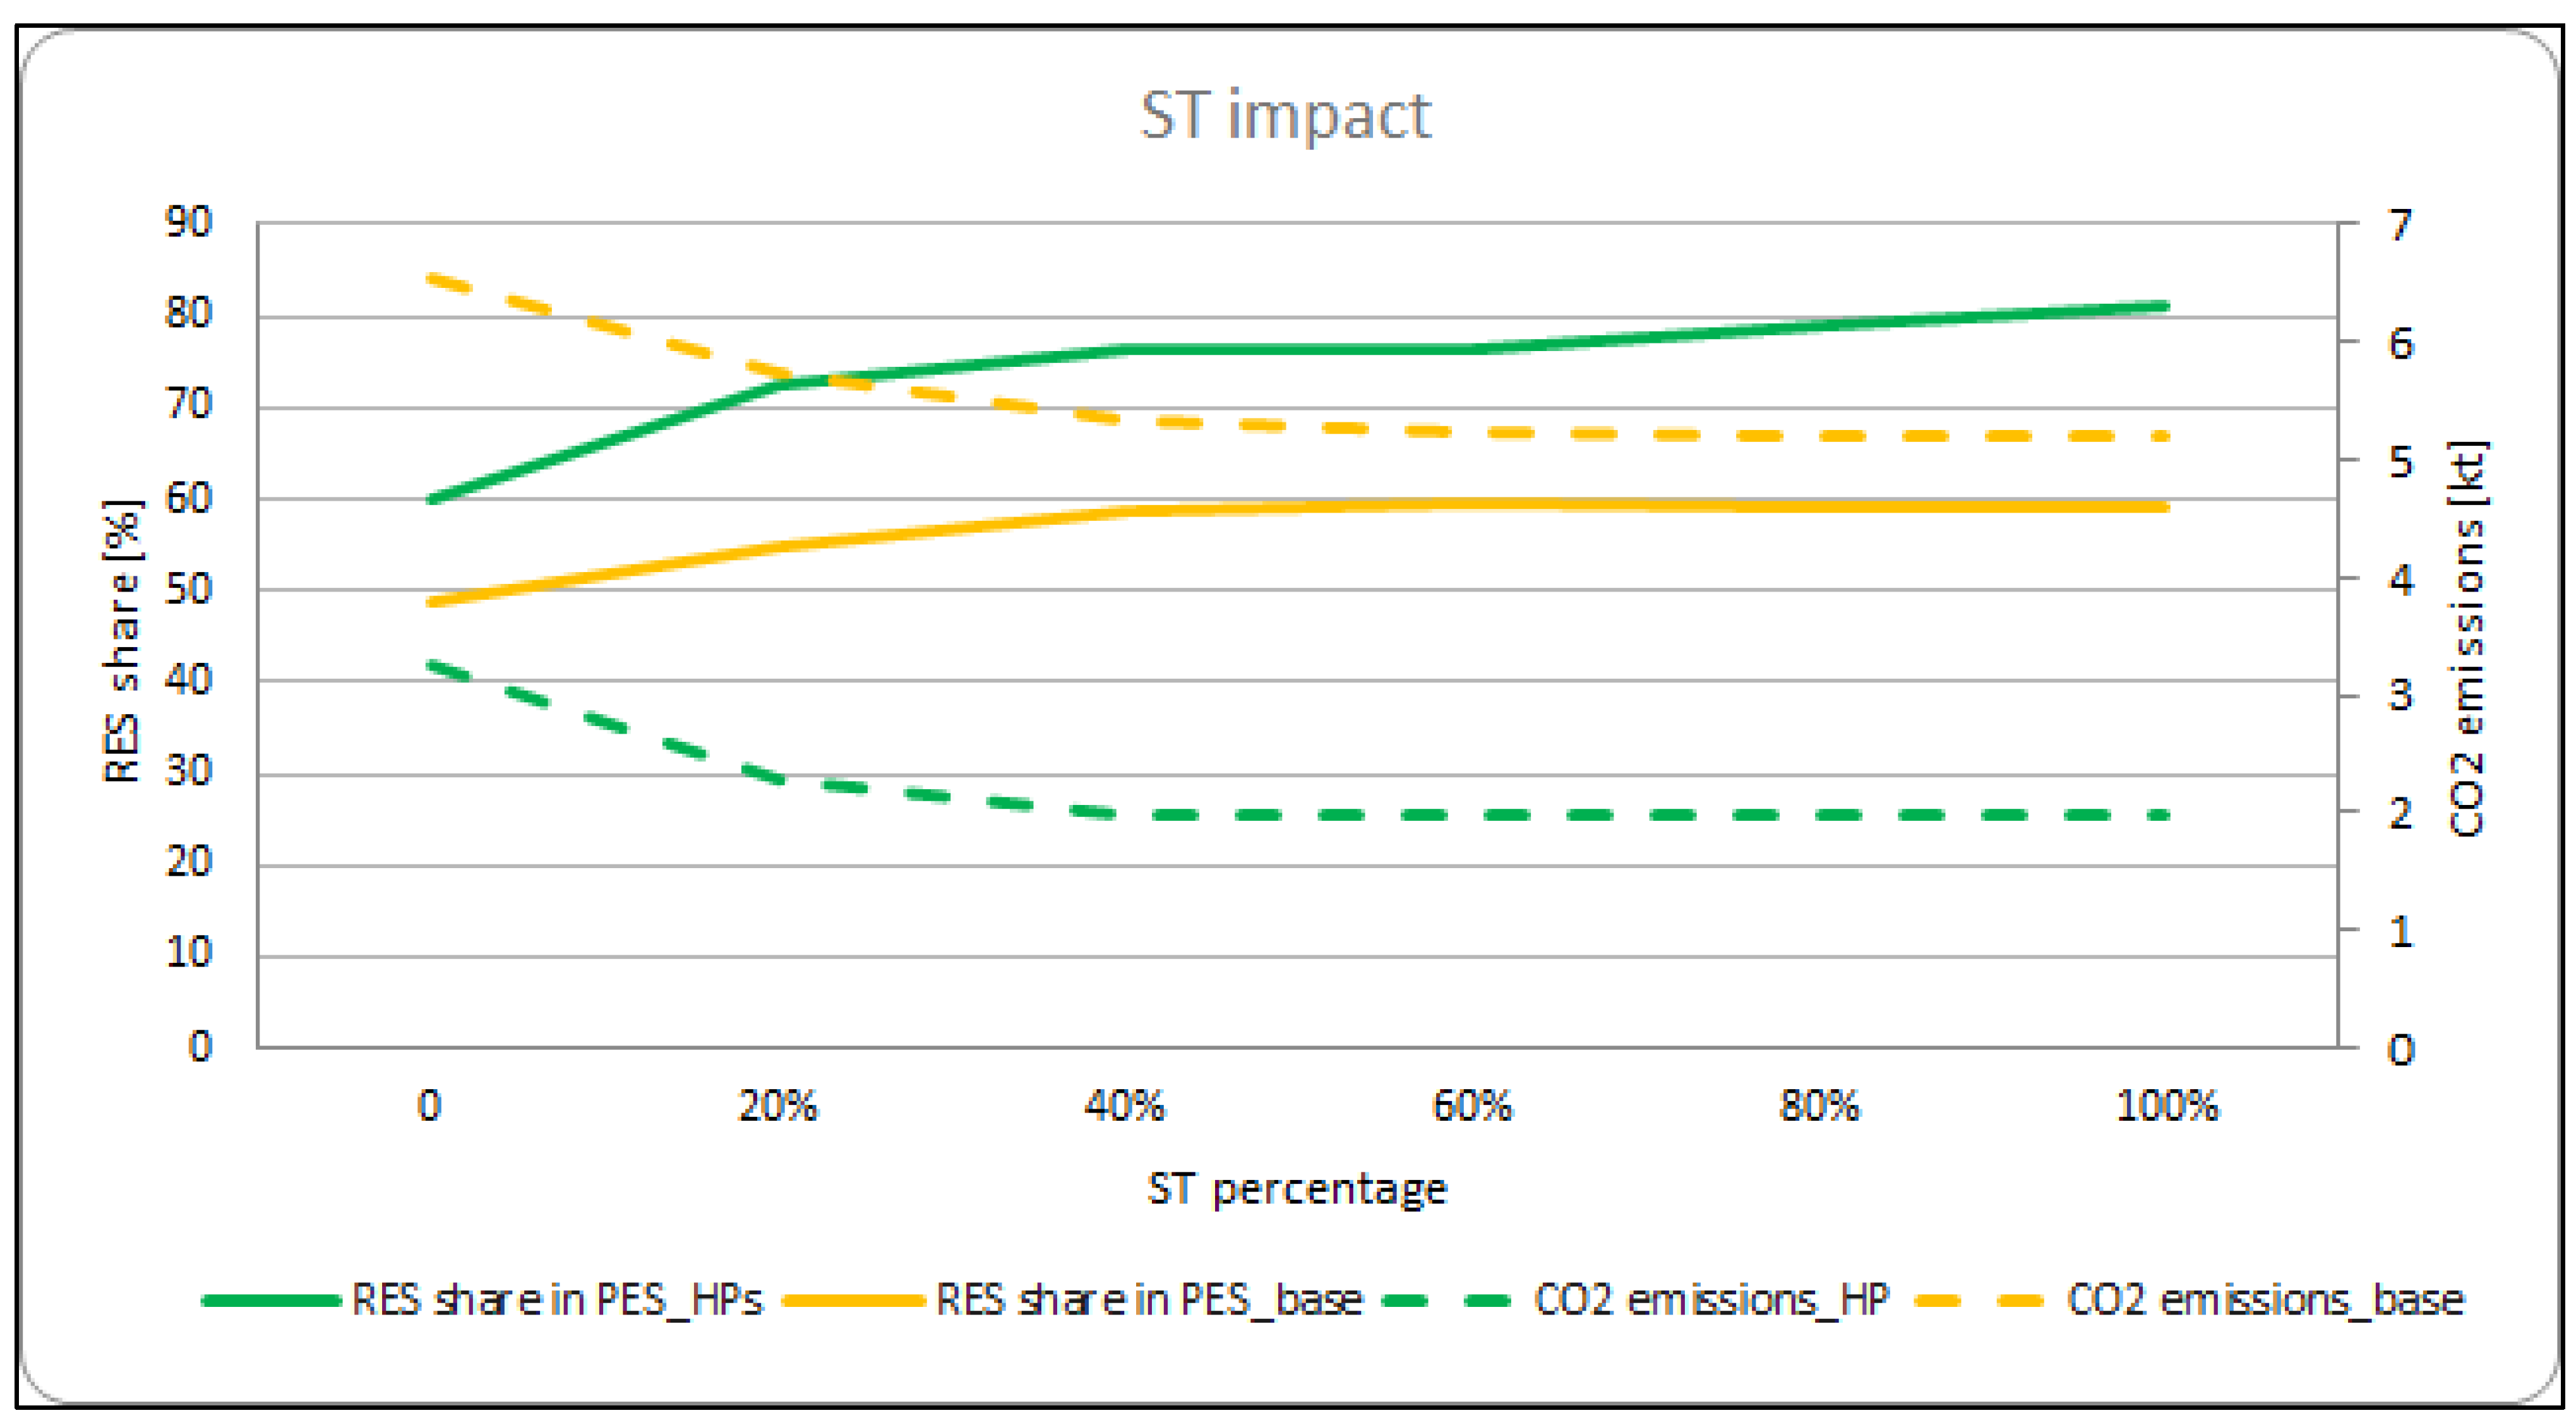
4.2. Solar Thermal Collectors’ Analysis
5. Conclusions
Author Contributions
Funding
Informed Consent Statement
Data Availability Statement
Conflicts of Interest
References
- Kyriakopoulos, G.L.; Arabatzis, G. Electrical energy storage systems in electricity generation: Energy policies, innovative technologies, and regulatory regimes. Renew. Sustain. Energy Rev. 2016, 56, 1044–1067. [Google Scholar] [CrossRef]
- Streimikiene, D.; Kyriakopoulos, G.L.; Lekavicius, V.; Pazeraite, A. How to support sustainable energy consumption in households? Acta Montan. Slovaca 2022, 27, 479–490. [Google Scholar]
- Ntanos, S.; Kyriakopoulos, G.L.; Arabatzis, G.; Palios, V.; Chalikias, M. Environmental Behavior of Secondary Education Students: A Case Study at Central Greece. Sustainability 2018, 10, 1663. [Google Scholar] [CrossRef] [Green Version]
- Sharadg, H.; Hajimirza, S.; Balog, R.S. Time series forecasting of solar power generation for large-scale photovoltaic plants. Renew. Energy 2020, 150, 797–807. [Google Scholar] [CrossRef]
- Acar, G.D.; Acar, M.A.; Feeny, B.F. Parametric Resonances of a Three-Blade-Rotor System with Reference to Wind Turbines. J. Vib. Acoust. 2020, 142, 021013. [Google Scholar] [CrossRef]
- Dehghani-Sanij, A.R.; Tharumalingam, E.; Dusseault, M.B.; Fraser, R. Study of energy storage systems and environmental challenges of batteries. Renew. Sustain. Energy Rev. 2019, 104, 192–208. [Google Scholar] [CrossRef]
- Said, Z.; Mehmood, A. Application of fuel cell and electrolyzer as hydrogen energy storage system in energy management of electricity energy retailer in the presence of the renewable energy sources and plug-in electric vehicles. Energy Convers. Manag. 2017, 136, 404–417. [Google Scholar]
- Nastasi, B. Renewable Hydrogen Potential for Low-carbon Retrofit of the Building Stocks. Energy Procedia 2015, 82, 944–949. [Google Scholar] [CrossRef] [Green Version]
- Nastasi, B.; de Santoli, L.; Albo, A.; Bruschi, D.; Basso, G.L. RES (Renewable Energy Sources) Availability Assessments for Eco-fuels Production at Local Scale: Carbon Avoidance Costs Associated to a Hybrid Biomass/H2NG-based Energy Scenario. Energy Procedia 2015, 81, 1069–1076. [Google Scholar] [CrossRef] [Green Version]
- Nastasi, B.; Markovska, N.; Puksec, T.; Duić, N.; Foley, A. Renewable and sustainable energy challenges to face for the achievement of Sustainable Development Goals. Renew. Sustain. Energy Rev. 2022, 157, 112071. [Google Scholar] [CrossRef]
- Ghahramani, M.; Nazari-Heris, M.; Zare, K.; Mohammadi-Ivatloo, B. Optimal Energy and Reserve Management of the Electric Vehicles Aggregator in Electrical Energy Networks Considering Distributed Energy Sources and Demand Side Management. In Electric Vehicles in Energy Systems; Ahmadian, A., Mohammadi-Ivatloo, B., Elkamel, A., Eds.; Springer: Cham, Switzerland, 2020. [Google Scholar]
- Assareh, E.; Dejdarc, A.; Ershadi, A.; Jafarian, M.; Mansouri, M.h.; Salekroshani, A.; Azish, E.; Saedpanah, E.; Lee, M. Techno-economic Analysis of Combined Cooling, Heating, and Power (CCHP) System Integrated with Multiple Renewable Energy Sources and Energy Storage Units. Energy Build. 2023, 278, 112618. [Google Scholar] [CrossRef]
- Shafi, A.; Sharadga, H.; Hajimirza, S. Design of Optimal Power Point Tracking Controller Using Forecasted Photovoltaic Power and Demand. IEEE Trans. Sustain. Energy 2019, 11, 1820–1828. [Google Scholar] [CrossRef]
- Sahebi, H.K.; Hoseinzadeh, S.; Ghadamian, H.; Ghasemi, M.H.; Esmaeilion, F.; Garcia, D.A. Techno-Economic Analysis and New Design of a Photovoltaic Power Plant by a Direct Radiation Amplification System. Sustainability 2021, 13, 11493. [Google Scholar] [CrossRef]
- Lu, J.; Hajimirza, S. Exergy analysis of a Combined Cooling, Heating and Power system integrated with wind turbine and compressed air energy storage system. Sol. Energy 2017, 158, 71–82. [Google Scholar] [CrossRef]
- Sedaghatizadeh, N.; Arjomandi, M.; Cazzolato, B.; Kelso, R. Wind farm noises: Mechanisms and evidence for their dependency on wind direction. Renew. Energy 2017, 109, 311–322. [Google Scholar] [CrossRef]
- Hernández-Callejo, L. A Comprehensive Review of Operation and Control, Maintenance and Lifespan Management, Grid Planning and Design, and Metering in Smart Grids. Energies 2019, 12, 1630. [Google Scholar] [CrossRef] [Green Version]
- Kougias, I.; Szabó, S.; Nikitas, A.; Theodossiou, N. Sustainable energy modelling of non-interconnected Mediterranean islands. Renew. Energy 2019, 133, 930–940. [Google Scholar] [CrossRef]
- Esmaeilion, F.; Ahmadi, A.; Hoseinzadeh, S.; Aliehyaei, M.; Makkeh, S.A.; Garcia, D.A. Renewable energy desalination; a sustainable approach for water scarcity in arid lands. Int. J. Sustain. Eng. 2021, 14, 1916–1942. [Google Scholar] [CrossRef]
- De Pascali, P.; Santangelo, S.; Perrone, F.; Bagaini, A. Territorial Energy Decentralisation and Ecosystem Services in Italy: Limits and Potential. Sustainability 2020, 12, 1424. [Google Scholar] [CrossRef] [Green Version]
- Farooqui, S.Z. Prospects of renewables penetration in the energy mix of Pakistan. Renew. Sustain. Energy Rev. 2014, 29, 693–700. [Google Scholar] [CrossRef]
- Rikos, E.; Perakis, C. The PRISMI proposal for a user-friendly load-flow tool for analysis of island grids. Renew. Energy 2020, 145, 2621–2628. [Google Scholar] [CrossRef]
- Cassar, D.; Erika, M.; Evangelos, R.; Christoforos, P.; Pfeifer, A.; Groppi, D.; Krajacic, G.; Garcia, D.A. A Methodology for Energy Planning in Small Mediterranean Islands, the Case of the Gozo Region. In Proceedings of the 2019 1st International Conference on Energy Transition in the Mediterranean Area (SyNERGY MED), Cagliari, Italy, 28–30 May 2019; pp. 1–6. [Google Scholar]
- Sailor, D.J. Risks of summertime extreme thermal conditions in buildings as a result of climate change and exacerbation of urban heat islands. Build. Environ. 2014, 78, 81–88. [Google Scholar] [CrossRef]
- Alipour, M.; Mohammadi-Ivatloo, B.; Moradi-Dalvand, M.; Zare, K. Stochastic scheduling of aggregators of plug-in electric vehicles for participation in energy and ancillary service markets. Energy 2017, 118, 1168–1179. [Google Scholar] [CrossRef]
- Groppi, D.; Garcia, D.A.; Basso, G.L.; Cumo, F.; De Santoli, L. Analysing economic and environmental sustainability related to the use of battery and hydrogen energy storages for increasing the energy independence of small islands. Energy Convers. Manag. 2018, 177, 64–76. [Google Scholar] [CrossRef]
- Pfeifer, A.; Dobravec, V.; Pavlinek, L.; Krajačić, G.; Duić, N. Integration of renewable energy and demand response technologies in interconnected energy systems. Energy 2018, 161, 447–455. [Google Scholar] [CrossRef]
- Majidi Nezhad, M.; Neshat, M.; Piras, G.; Astiaso Garcia, D.; Sylaios, G. Marine Online Platforms of Services to Public End-Users—The Innovation of the ODYSSEA Project. Remote Sens. 2022, 14, 572. [Google Scholar] [CrossRef]
- Gilani, H.A.; Hoseinzadeh, S.; Karimi, H.; Karimi, A.; Hassanzadeh, A.; Garcia, D.A. Performance analysis of integrated solar heat pump VRF system for the low energy building in Mediterranean island. Renew. Energy 2021, 174, 1006–1019. [Google Scholar] [CrossRef]
- Gilani, H.A.; Hoseinzadeh, S.; Esmaeilion, F.; Memon, S.; Garcia, D.A.; Assad, M.E.H. A solar thermal driven ORC-VFR system employed in subtropical Mediterranean climatic building. Energy 2022, 250, 123819. [Google Scholar] [CrossRef]
- Dehghani-Sanij, A.R.; Al-Haq, A.; Bastian, J.; Luehr, G.; Nathwani, J.; Dusseault, M.B.; Leonenko, Y. Assessment of current developments and future prospects of wind energy in Canada. Sustain. Energy Technol. Assess. 2022, 50, 101819. [Google Scholar] [CrossRef]
- Nastasi, B.; Manfren, M.; Groppi, D.; Lamagna, M.; Mancini, F.; Garcia, D.A. Data-driven load profile modelling for advanced measurement and verification (M&V) in a fully electrified. Build. Environ. 2022, 221, 109279. [Google Scholar]
- Hoseinzadeh, S.; Garcia, D.A. Techno-economic assessment of hybrid energy flexibility systems for islands’ decarbonization: A case study in Italy. Sustain. Energy Technol. Assess. 2022, 51, 101929. [Google Scholar] [CrossRef]
- Hoseinzadeh, S.; Ghasemi, M.H.; Heyns, S. Application of hybrid systems in solution of low power generation at hot seasons for micro hydro systems. Renew. Energy 2020, 160, 323–332. [Google Scholar] [CrossRef]
- Maleki, A.; Pourfayaz, F.; Ahmadi, M.H. Design of a cost-effective wind/photovoltaic/hydrogen energy system for supplying a desalination unit by a heuristic approach. Sol. Energy 2016, 139, 666–675. [Google Scholar] [CrossRef]
- Mancini, F.; Nastasi, B. Solar Energy Data Analytics: PV Deployment and Land Use. Energies 2020, 13, 417. [Google Scholar] [CrossRef] [Green Version]
- Groppi, D.; Garcia, D.A.; Basso, G.L.; De Santoli, L. Synergy between smart energy systems simulation tools for greening small Mediterranean islands. Renew. Energy 2019, 135, 515–524. [Google Scholar] [CrossRef]
- Ahmadpour, A.; Mokaramian, E.; Anderson, S. The effects of the renewable energies penetration on the surplus welfare under energy policy. Renew. Energy 2021, 164, 1171–1182. [Google Scholar] [CrossRef]
- Heydari, A.; Astiaso Garcia, D.; Keynia, F.; Bisegna, F.; De Santoli, L. Hybrid intelligent strategy for multifactor influenced electrical energy consumption forecasting. Energy Sources Part B Econ. Plan. Policy 2019, 14, 341–358. [Google Scholar] [CrossRef]
- Alves, M.; Segurado, R.; Costa, M. Increasing the penetration of renewable energy sources in isolated islands through the interconnection of their power systems. The case of Pico and Faial islands. Azores Energy 2019, 182, 502–510. [Google Scholar] [CrossRef]
- Assareh, E.; Jafarian, M.; Nedaei, M.; Firoozzadeh, M.; Lee, M. Performance Evaluation and Optimization of a Photovoltaic/Thermal (PV/T) System according to Climatic Conditions. Energies 2022, 15, 7489. [Google Scholar] [CrossRef]
- Bazazzadeh, H.; Pilechiha, P.; Nadolny, A.; Mahdavinejad, M.; Hashemi safaei, S.S. The impact assessment of climate change on building energy consumption in Poland. Energies 2021, 14, 4084. [Google Scholar] [CrossRef]
- PRISMI PLUS Website. Available online: https://prismi.interreg-med.eu/what-we-achieve/deliverable-library/detail/?tx_elibrary_pi1%5Blivrable%5D=4235&tx_elibrary_pi1%5Baction%5D=show&tx_elibrary_pi1%5Bcontroller%5D=Frontend%5CLivrable&cHash=84898a2ba8011be727ac374c63bcc637 (accessed on 1 September 2022).
- Renewables.ninja, n.d. Available online: https://www.renewables.ninja/ (accessed on 1 October 2021).
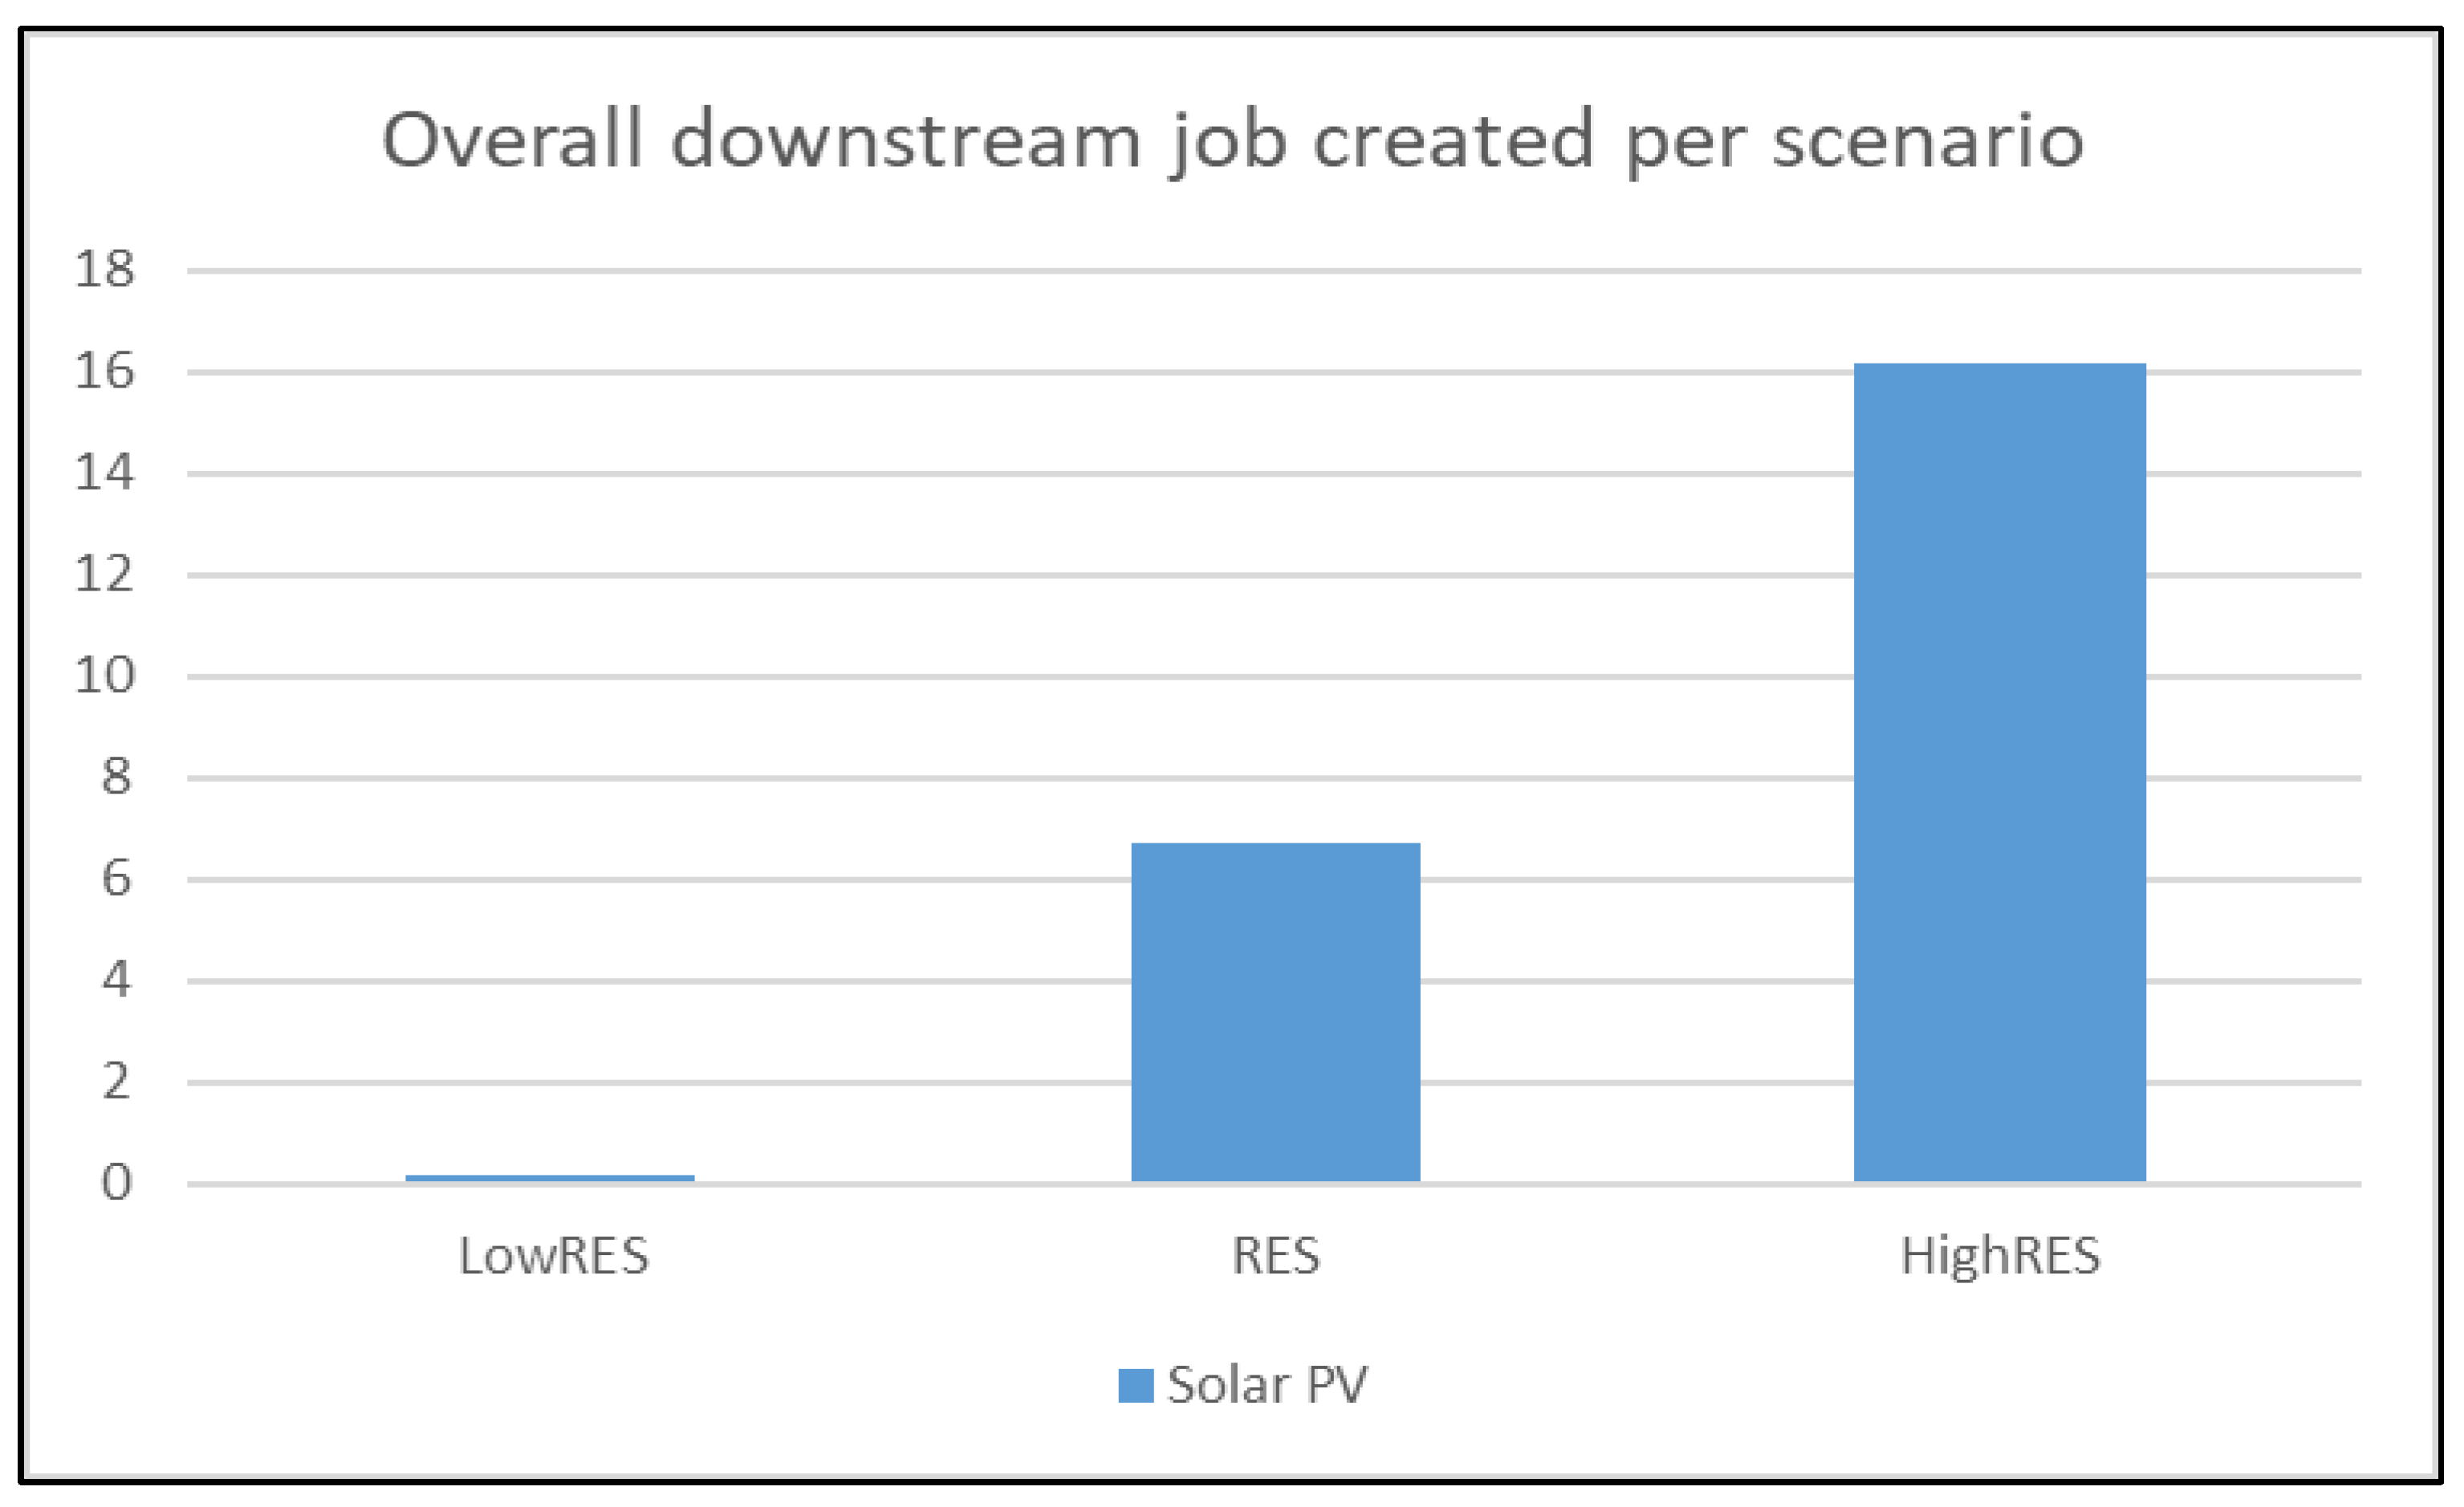
- International Renewable Energy Agency (IRENA). Renewable Energy and Jobs—Annual Review 2020. 2020. Available online: https://www.irena.org (accessed on 1 October 2021).
- Ram, M.; Aghahosseini, A.; Breyer, C. Job creation during the global energy transition towards 100% renewable power system by 2050. Technol. Forecast. Soc. Chang. 2020, 151, 119682. [Google Scholar] [CrossRef]
- Hoseinzadeh, S.; Garcia, D.A. Numerical Analysis of Thermal, Fluid, and Electrical Performance of a Photovoltaic Thermal Collector at New Micro-Channels Geometry. J. Energy Resour. Technol. 2022, 144, 062105. [Google Scholar] [CrossRef]
- Jafari, S.; Sohani, A.; Hoseinzadeh, S.; Pourfayaz, F. The 3E Optimal Location Assessment of Flat-Plate Solar Collectors for Domestic Applications in Iran. Energies 2022, 15, 3589. [Google Scholar] [CrossRef]
- European Commission. Photovoltaic Geographical Information System (PVGIS). 2021. Available online: https://re.jrc.ec.europa.eu/pvg_tools/en/tools.html (accessed on 1 October 2021).


| 2030 | Scenario 1 | Scenario 2 | Scenario 3 |
|---|---|---|---|
| PV installed capacity [kWp] | 305 | 9650 | 23,200 |
| PV surface range [m2] | 1800–3000 | 57,000–96,000 | 139,000–232,000 |
| 2030 | Investment | O&M | Lifetime |
|---|---|---|---|
| PV [kEUR/kW] | 0.7 | 1% | 25 |
| Consumption | Energy Vector | Value | Unit |
|---|---|---|---|
| Heating | Diesel | 1281 | MWh/y |
| Coal | 269 | ||
| Biomass | 11,434 | ||
| GPL | 13,193 | ||
| Oil | 1300 | ||
| Transport | Gasoline | 6279 | |
| Diesel | 6627 | ||
| GPL | 893 |
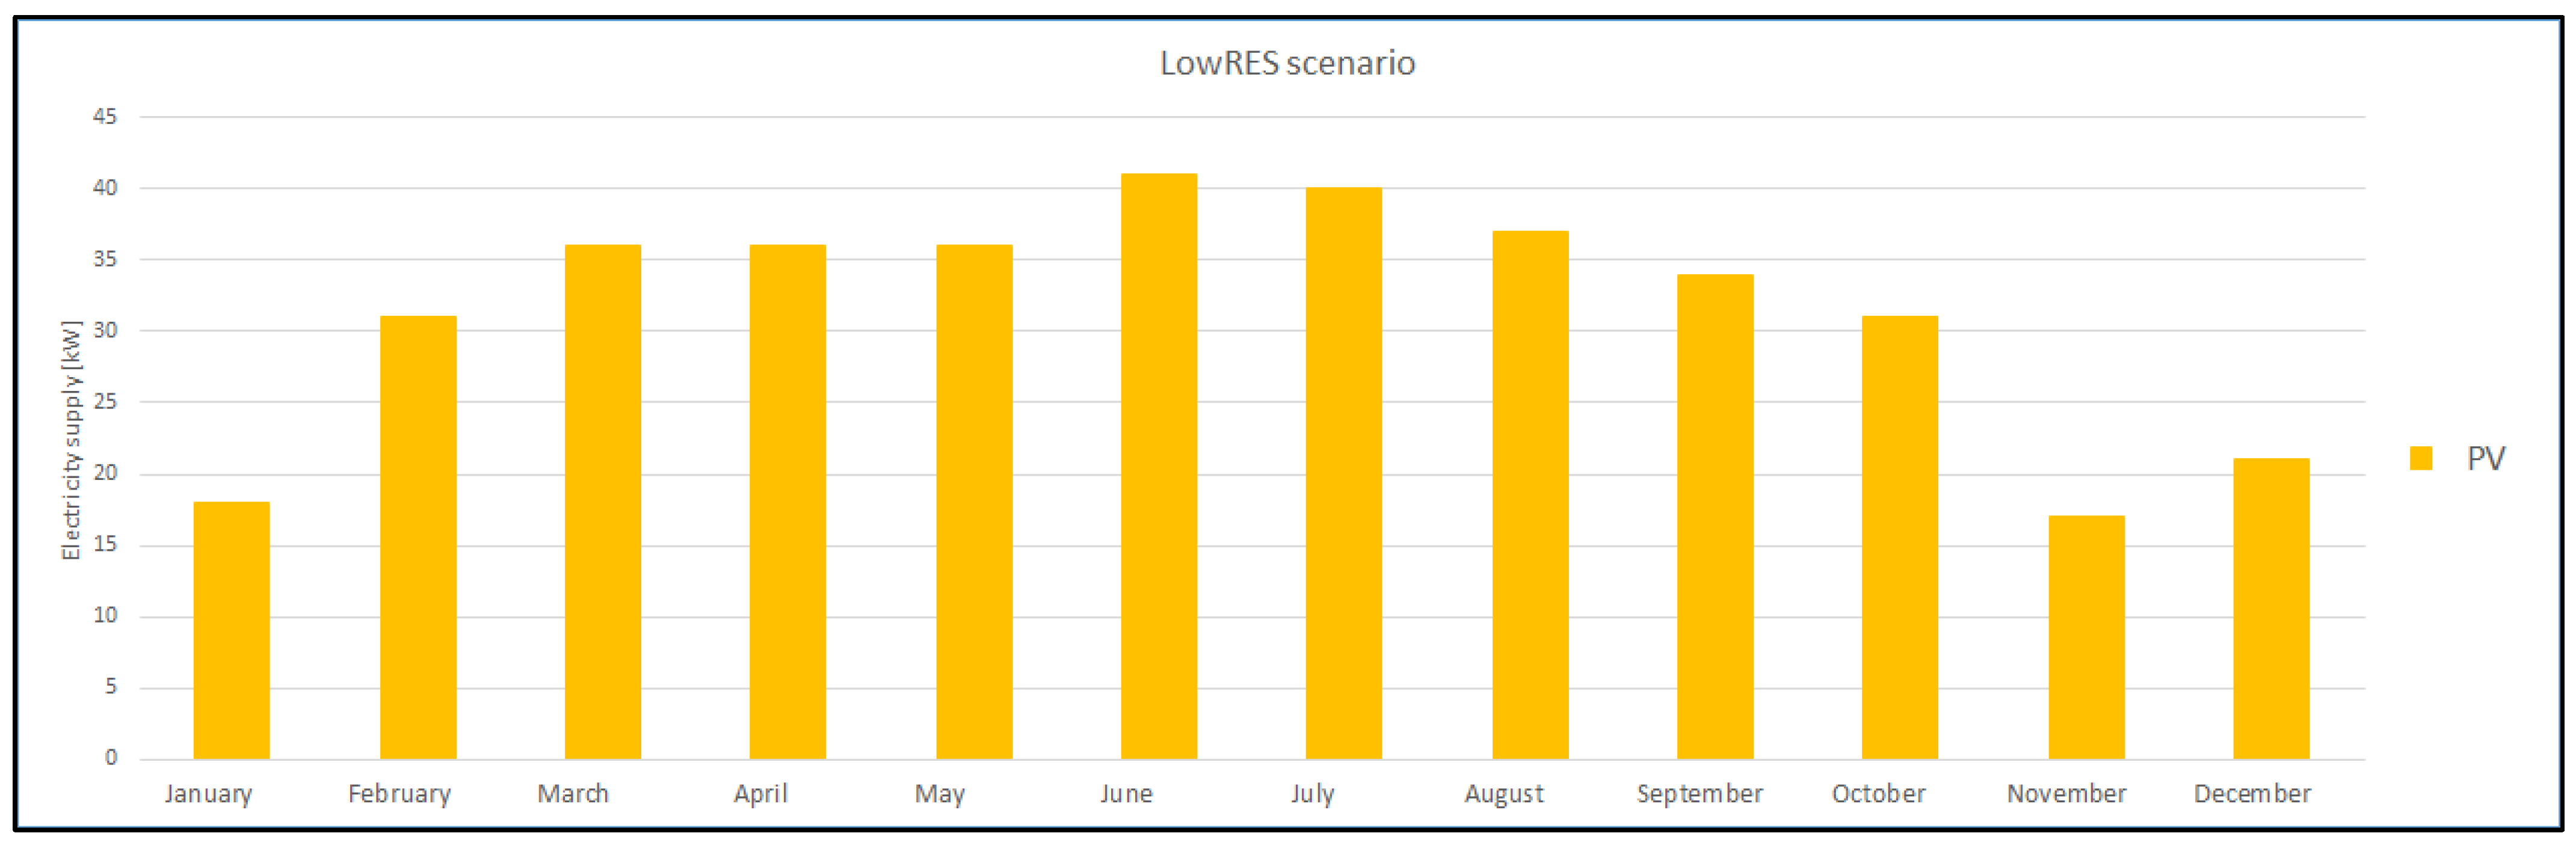
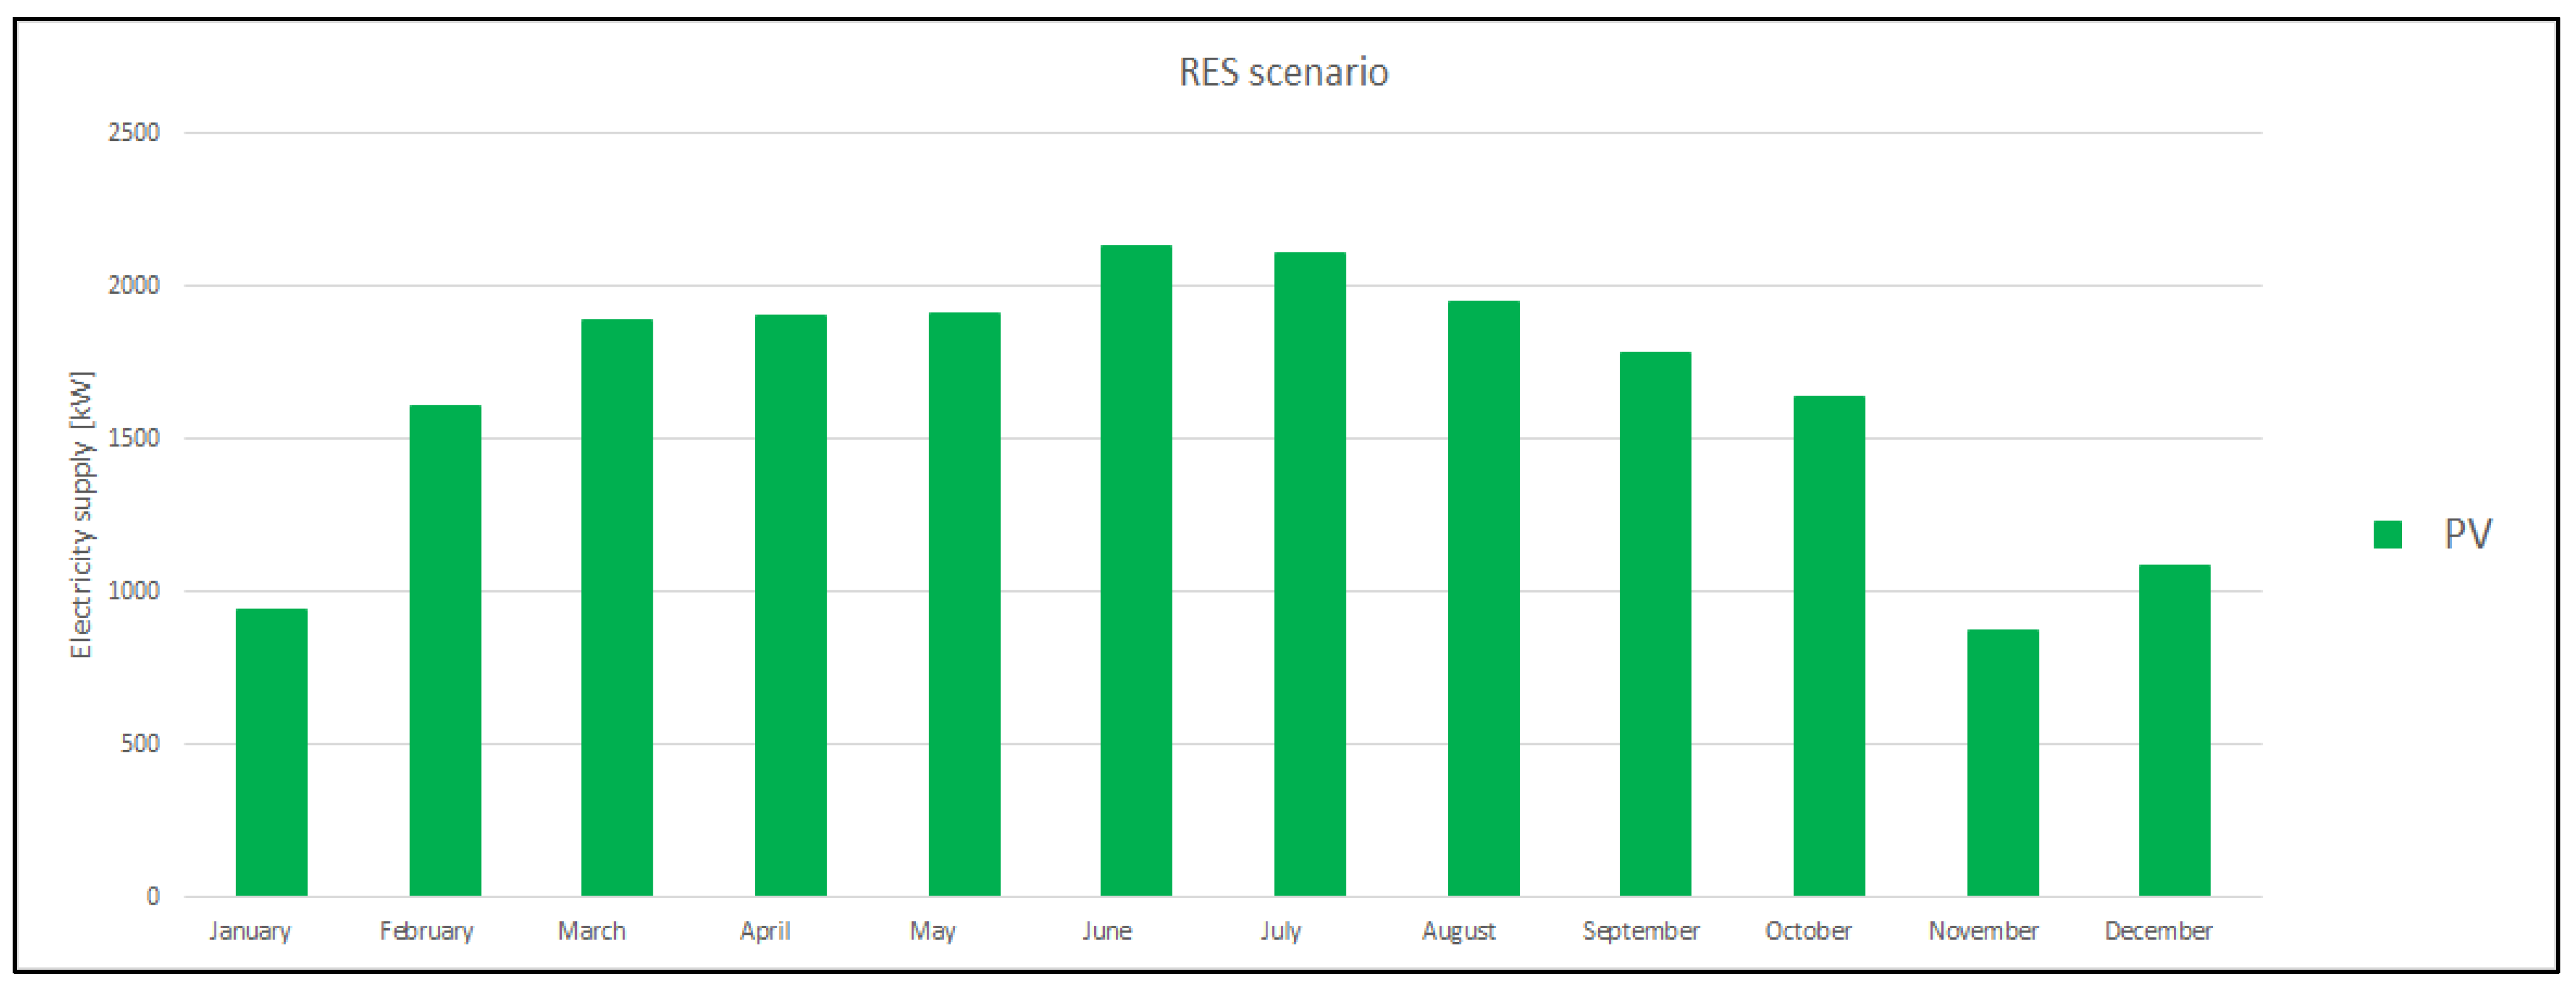
| PV Production | ||
|---|---|---|
| Scenario 1 | 0.18 | GWh/year |
| Scenario 2 | 14.5 | GWh/year |
| Scenario 3 | 34.57 | GWh/year |
Publisher’s Note: MDPI stays neutral with regard to jurisdictional claims in published maps and institutional affiliations. |
© 2022 by the authors. Licensee MDPI, Basel, Switzerland. This article is an open access article distributed under the terms and conditions of the Creative Commons Attribution (CC BY) license (https://creativecommons.org/licenses/by/4.0/).
Share and Cite
Hoseinzadeh, S.; Groppi, D.; Sferra, A.S.; Di Matteo, U.; Astiaso Garcia, D. The PRISMI Plus Toolkit Application to a Grid-Connected Mediterranean Island. Energies 2022, 15, 8652. https://doi.org/10.3390/en15228652
Hoseinzadeh S, Groppi D, Sferra AS, Di Matteo U, Astiaso Garcia D. The PRISMI Plus Toolkit Application to a Grid-Connected Mediterranean Island. Energies. 2022; 15(22):8652. https://doi.org/10.3390/en15228652
Chicago/Turabian StyleHoseinzadeh, Siamak, Daniele Groppi, Adriana Scarlet Sferra, Umberto Di Matteo, and Davide Astiaso Garcia. 2022. "The PRISMI Plus Toolkit Application to a Grid-Connected Mediterranean Island" Energies 15, no. 22: 8652. https://doi.org/10.3390/en15228652