Article

Photovoltaic Production Management in a Hall of Residence with High Energy Consumption

1
proMetheus, Unidade de Investigação em Materiais, Energia e Ambiente Para a Sustentabilidade, Instituto Politécnico de Viana do Castelo, Rua da Escola Industrial e Comercial de Nun’Alvares, 4900-347 Viana do Castelo, Portugal
2
CINTECX, Centro de Investigación en Tecnologías, Energía y Procesos Industriales, University of Vigo, Lagoas-Marcosende, S/n, 36310 Vigo, Pontevedra, Spain
*
Author to whom correspondence should be addressed.
Energies 2022, 15(22), 8412; https://doi.org/10.3390/en15228412
Submission received: 4 October 2022 / Revised: 1 November 2022 / Accepted: 9 November 2022 / Published: 10 November 2022
(This article belongs to the Collection Feature Papers in Energy, Environment and Well-Being)

Abstract

:
A hall of residence with low energy performance was subjected to an extensive retrofitting program due to its high energy consumption, to enhance the building’s energy efficiency and reduce its energy costs and greenhouse gas emissions. The retrofitting program included the integration of a solar photovoltaic (PV) system installed on the building’s flat roof, among other factors. Nevertheless, the electricity supply provided by the system during the daytime proved insufficient to cover the building’s energy demand. Based on this, a study was implemented to analyze the contribution of the electricity produced by the solar PV system throughout the year to reduce power consumption under distinct solar radiation conditions, and to define a strategy to optimize renewable energy use by drawing up a set of organizational measures to be implemented to manage the PV solar system energy strategically. The strategic measures are mainly related to selecting the residence tasks with higher energy consumption to fit into higher PV energy production periods. Additionally, it is fundamental to raise the residence’s occupants’ education and awareness of energy efficiency, optimize the excess PV energy produced in specific periods by converting it into other energy forms, and install complementary storage systems for surplus production.

Graphical Abstract

1. Introduction

Today, the European Union faces several energy challenges worsened by the war in Ukraine, including increasing dependence on imports, limited diversification, high and volatile energy prices, growing global energy demand, security risks that affect the countries’ energy producers and the energy transit, increasing threats from climate change, slow progress in terms of energy efficiency, and the challenges posed by the growing share of renewable energy [1,2,3]. Similarly, the need for transparency, integration, and interconnection of energy markets is a challenge to deal with at present [4]. Based on this, it is fundamental to achieve an integrated energy market, prioritize security in the energy supply, and achieve a sustainable energy sector [5]. The current scenario has also made clear how much Europe depends on fossil fuels and, consequently, the progress in at least reducing the use of this type of fuel [6]. To do this, a quick and fair transition from coal, oil, and gas would be desirable, through increasing energy efficiency and focusing on the implementation of renewable energies [7]. This is the only viable way to rapidly reduce the European Union (EU)’s dependence on fossil fuels while contributing fairly to achieving the Paris Agreement’s objective of limiting the global temperature rise to 1.5 °C [8]. Excessive energy consumption is particularly evident in the buildings sector, because of the increase in living standards and the widespread use of various types of air conditioning equipment [9]. On the one hand, the building sector is the one with the highest energy consumption; on the other hand, it is also the sector with the greatest potential in terms of energy savings [10].
Among all types of buildings, halls of residence play a crucial role in energy consumption, given the high electricity costs associated with the preparation of domestic hot water, lighting, space heating and cooling systems, and appliances, which are highly dependent on the habits of the residents [11]. Despite their excessive energy consumption, the construction of halls of residence on academic campuses is typically conducted without adequate consideration of issues related to energy efficiency, applying low-efficiency appliances and low-performance building envelopes, as well as adopting ineffective strategies for energy conservation, with low incorporation of renewable energies, assuming that the annual growth in energy consumption can be supported indefinitely by accessible and inexhaustible energy sources [12]. The low performance of these types of buildings is at odds with one of the most important roles of higher education institutions (HEIs) in society—their contribution to sustainability [13]. Through the adoption of energy efficiency interventions on their campuses, HEIs can help to reduce energy dependence and cost, as well as greenhouse gas emissions [14]. On the other hand, educating very specific audiences on sustainability issues can provide pedagogical support for students in their professional and/or personal futures [15].
To improve the building’s energy efficiency, so as to reduce energy costs and greenhouse gas emissions, the hall of residence of the Agrarian School of Ponte de Lima, Northern Portugal, has recently undergone an energy rehabilitation process driven by the building’s high energy consumption. The original building was built in the 1980s, and has not been subject to any maintenance action ever since. The retrofitting program focused on improving the energy efficiency of the building envelope and windows, optimizing the ventilation systems, replacing the incandescent lamps with a highly energy-efficient LED lamp system, and integrating a solar photovoltaic (PV) system designed to be installed on the building’s flat roof. However, the total area of the solar PV panels installed could not exceed the roof’s load-bearing capacity, so the electricity supply provided by the system during the daytime is not enough to cover the building’s energy demand.
On this basis, this paper aimed to evaluate the contribution of the electricity produced by the PV system installed on the hall of residence of the Agrarian School of Ponte de Lima under distinct solar radiation conditions, as well as to optimize its use in reducing the building’s electricity consumption, during the winter and summer seasons. Additionally, a strategy was designed to maximize the use of the PV panels to supplement electricity to minimize the bulk electricity supply from the local electricity company and, therefore, reduce the building’s energy consumption and carbon footprint. This strategy is summarized as a set of practical organizational measures to improve the use of the PV solar system’s energy in order to optimize the energy consumption of the building and reduce the carbon footprint via the local generation of electricity from a renewable energy source.

2. Related Works

HEIs have recently benefited from funding packages to implement energy efficiency funding programs that finance old and inefficient buildings’ energy rehabilitation to reduce their energy bills and environmental footprint. Among all campus buildings, halls of residence are among the most energy-consuming due to their high occupancy for long periods and the intensive use of highly electricity-drawing appliances. The installation of photovoltaic (PV) solar systems is at the forefront of the measures most frequently applied to tackle high electricity consumption. PV systems already have mature technology with reduced payback periods, typically needing large outdoor areas and buildings with flat roofs, free of shading, for better performance. The following literature review of grid-connected PV systems installed on HEI campuses contributes to meeting this objective. In this context, the University of Jaén, Southern Spain, installed a grid-connected PV system of 200 kWp to provide 8% of the campus’s energy needs [16]. The system proved to be safe for setting up, operating, and maintaining PV systems in a densely populated university campus, as well as their architectural incorporation in some specific types of buildings, such as those designed for the school campus. This technological integration is an excellent example of replication by other HEIs. Likewise, at the Technical University of Crete’s campus, a 2 MWp grid-connected PV system was installed for large-scale production, supporting 47% of the campus’s electricity consumption and saving 1234 CO2eq., with a payback of 4.2 years [17]. The authors view this system to be a quality reference for similar interventions on academic campuses in the Mediterranean area, by integrating energy savings with exemplification both for education and investigation [18]. Concerning the monitoring of solar power plants to evaluate their performance, the University of Bangka Belitung in Indonesia designed an online monitoring system to assess parameters such as voltage, current, air humidity, temperature, and solar irradiation, concluding that increases in both air temperature and relative humidity can compromise the solar panels’ overall performance [19]. Similarly, a 467.2 kWp solar PV plant was installed on three buildings of Integral University, Lucknow, India, and afterwards it was assessed to quantify power generation for three consecutive years, as well as the impacts of solar insolation and temperature on the plant’s overall performance [20]. The authors concluded that the performance ratio was similar for all instrumented years except for 2020, stressing that the continuous assessment of the solar PV plant is fundamental to the evaluation of its effectiveness, performance, and degradation over time, as well as for planning maintenance actions [20].
In terms of the planning and future integration of grid-connected PV systems in university campus areas, the University of Jaén, Spain, has evaluated the PV potential of its campus by selecting possible areas where the systems could be installed, in accordance with the power demands, the zone possibilities, the electrical system’s outline, and some additional social requirements [21]. The study provides evidence that the use of cartographic tools combined with specific software can be a powerful approach to evaluate the PV potential of an academic campus, allowing calculation of the energy generated by the future PV system [21].
The dormitory building of the Technical University of Crete is planned to be converted into a near-zero-energy building (nZEB) by adopting an energy efficiency retrofitting intervention that will result in 36% energy savings [18]. The integration of a PV plant on the building’s roof will cover 62% of the initial energy consumption, thereby reducing both the energy demand and the greenhouse gas emissions. This study shows that the adoption of a self-producing PV plant will help the University residence to be transformed into an nZEB [18].
The university campus in Ouargla Province, Algeria, has developed a new approach for rooftop PV systems designed for academic buildings in arid environments [22]. The findings of the investigation show that only 60% of the roof is adequate for placing PV panels, that the impact of shading reduces the PV systems potential, and that grid-connected rooftop PV (GCR-PV) systems without a battery can be more effective than those including a battery for this type of building [22].
Concerning economic analysis, the Monteluco Campus of the University of L’Aquila, Italy, has installed a large PV system (115 and 210 kW plants) on the campus rooftop and has analyzed the campus’s energy production and consumption [23]. This investment represents a significant change in the campus’s energy performance by guaranteeing that all produced energy will be self-consumed, and has improved the university´s sustainability image among students, professors, and staff. The study showed that the integration of a 210 kW PV plant could reduce the emissions by 184.9 tCO2eq.·year−1 and has generated profits of EUR 315,000 (approximately EUR 1314 per month over 20 years). Slightly lower values were obtained for the 115 kW plant, which could generate an overall reduction in emissions of 101.5 t CO2eq.·year−1 and profits of EUR 158,000 (approximately EUR 657 per month over 20 years) [23].
Regarding the viability of PV plant use, a study conducted in Jordan shows that Jordan is one of the richest countries in the world in terms of solar energy production, with a solar irradiance of 4–8 kWh·m−2·d−1, a sunshine duration of more than 300 days per year, and an average sunshine period of 9 h·day−1 (3311 h·year−1) [24]. Based on this analysis, in the Engineering Faculty at Mu’tah University, Jordan, the use of available resources to reduce electricity demand and consequent energy bills led to the installation of a 56.7 kW grid-connected solar photovoltaic power plant designed to meet the campus’s electricity demand, representing an overall capital cost of USD 117,000 with a payback period of 5.5 years [25]. In the same direction, the University of Jordan defined a target of achieving 100% electrical energy independence by adopting the use of PV technology [26]. A techno-economic assessment to determine the most adequate PV solution was implemented by calculating the final yield, land use, and conversion efficiency, as well as the simple payback period and internal rate of return, finding the engineering, procurement, and construction (EPC) model to be the best solution to implement PV projects by using a fixed-axis PV system for installation, with an internal rate of return (IRR) of 32% and a payback period of 3 years [26].
Regarding the subsidization of PV systems, in Italy, new subsidies were reintroduced for PV plants in public buildings with a capacity above 20 kW through the specific program FER1 (renewable energy sources), designed to support cities’ transition to sustainability by reducing GHG emissions [27]. The techno-economic analysis was implemented by using the discounted cash flow (DCF) methodology so that the value of the following variables could be assessed: insolation level, size of the plant, share of self-consumption, cost of investment, and electricity price [27]. To calculate the self-consumed energy share for which the net present value (NPV) was positive, the break-even point (BEP) analysis was used. Based on this analysis, NPV calculations varied between 84 and 957 EUR·kW−1 in 25 kW plants, and between 44 and 1007 EUR·kW−1 in 105 kW plants [27]. The obtained results showed rentability in almost all subsidized scenarios designed to increase the percentage of self-consumed energy in public buildings [27].
A techno-economic analysis was implemented for a PV plant with a peak power of 1.4 MWp installed on the campus of the University of Calabria, Italy [28]. The results showed daily consumption of about 70 MWh during winter (14–25 February) and about 85 MWh during summer (25 June), with a total annual electricity-specific need of 18.3 GWh. Based on these results, the payback time is 5 years, with a total net present saving (RNa) of EUR 9,829,887 by the end of the period. The ratio of benefit/cost is 3.47, which represents an internal rate of return of 0.185 [28].
A detailed technical analysis including economic and ecological assessment was implemented by ICFAI University, in Jaipur, India, concerning a 50 kWp rooftop solar photovoltaic plant, based on data collected in 2017 [29]. The results showed that the PV plant could remediate 102 tons of CO2, 128 kg of SO2, 268 kg of NOx, and 7033 kg of ash during one complete year, thereby contributing to the campus’s overall sustainability [29]. The energy generation varied between a maximum of 7198 kWh (in April) and a minimum of 1604 kWh (in December), while the monthly average final yield and reference yield were 106.9 kWh·month−1 and 149.7 kWh·month−1, respectively [29]. The obtained results show that this PV plant is rather efficient when compared to other similar plants in India [29].
A techno-economic analysis was carried out by taking as a case study a building at the Federal University of Itajuba, Brazil—a public university of the Brazilian higher education network [30]. The study proved that the PV plants play a decisive role in contributing to reducing the operating costs and increasing the security of the electrical network by guaranteeing a big share of the overall load demand, showing that the economic viability of the project is 92%, while the chance of reducing the maximum inverter power of 25% is about 87% [30].

3. Materials and Methods
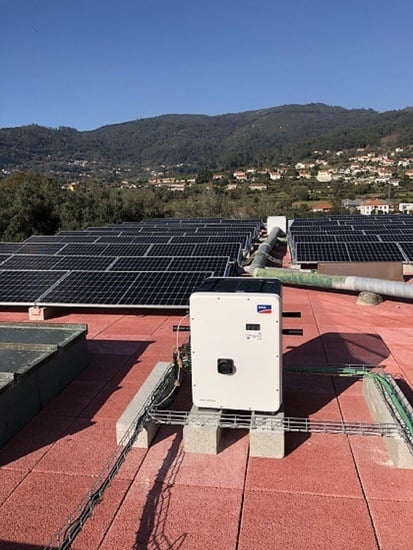
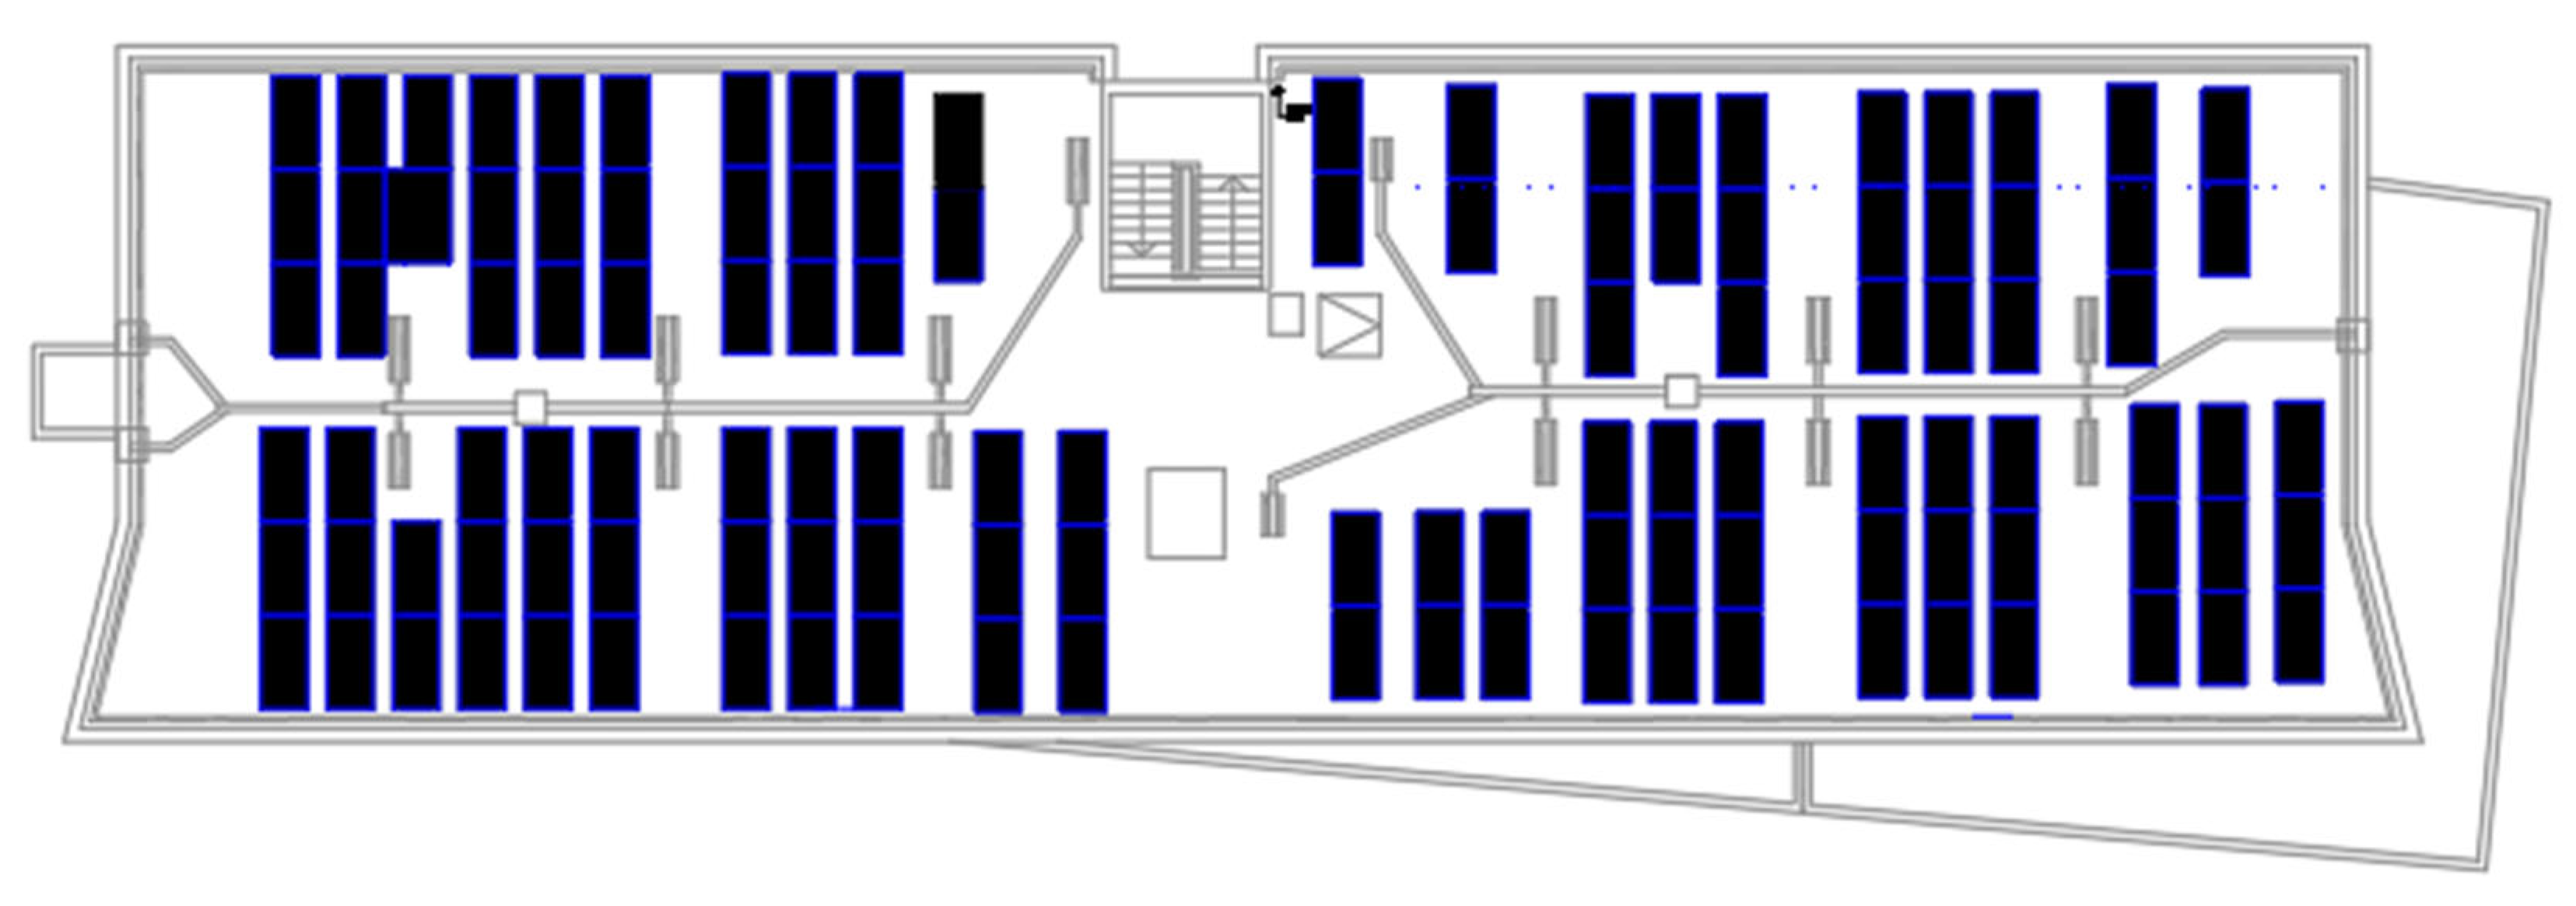
3.1. Case Study

The hall of residence taken as a case study belongs to the Agrarian School of Ponte de Lima (ESA), Northern Portugal—a 4-floor building recently rehabilitated to reinforce its energy efficiency. In addition to the improvement of the building envelope’s thermal insulation—including renovation of the windows and the replacement of the ventilation systems—a photovoltaic (PV) system was installed on the building´s flat roof (Figure 1), including a set of 455 W solar modules (Table 1). A 50 kW core 1 power inverter was installed to convert the variable direct current (DC) into alternating current (AC).
The installed PV system achieved a total energy production of 23,960 kWh over January, February, March, April, and May of 2022, corresponding to a ~20% reduction in the energy consumption of the whole campus—including the school, hall of residence, and other facilities—between January and May of 2022 (119,347 kWh). This rate was expected to increase over the next few months due to the increased production of the PV system during the summer months. The Agrarian School of Ponte de Lima’s campus includes several buildings. However, the most relevant in terms of energy consumption are the main pedagogic complex—with all of the classrooms, laboratories, and teachers’ and staff offices, where teaching, investigation, and administrative activities are carried out—and the hall of residence, which includes dorms, bars and canteens, and some additional technical areas. Since the campus operates as a whole, both buildings and their installations are electrically powered by a single delivery point, limiting the possibility of splitting consumption on a per building basis. There are analog network analyzers, but collecting data from them is impossible. An analyzer was placed for two months to investigate the consumption profiles. The ongoing study aims to estimate the impact of the installation of photovoltaic panels throughout the year 2022 on the reduction in global energy consumption and the decline in the emissions of greenhouse gases based on historical consumption over the last 10 years.

3.2. Data Collection

The methodologies used for data processing and achieving the outcomes are comprehensively described in Section 4, along with the presentation and discussion of the results. It is understood that an easier understanding of the obtained results can be provided by a detailed description of the methodologies used as the results emerge and their discussion takes place.

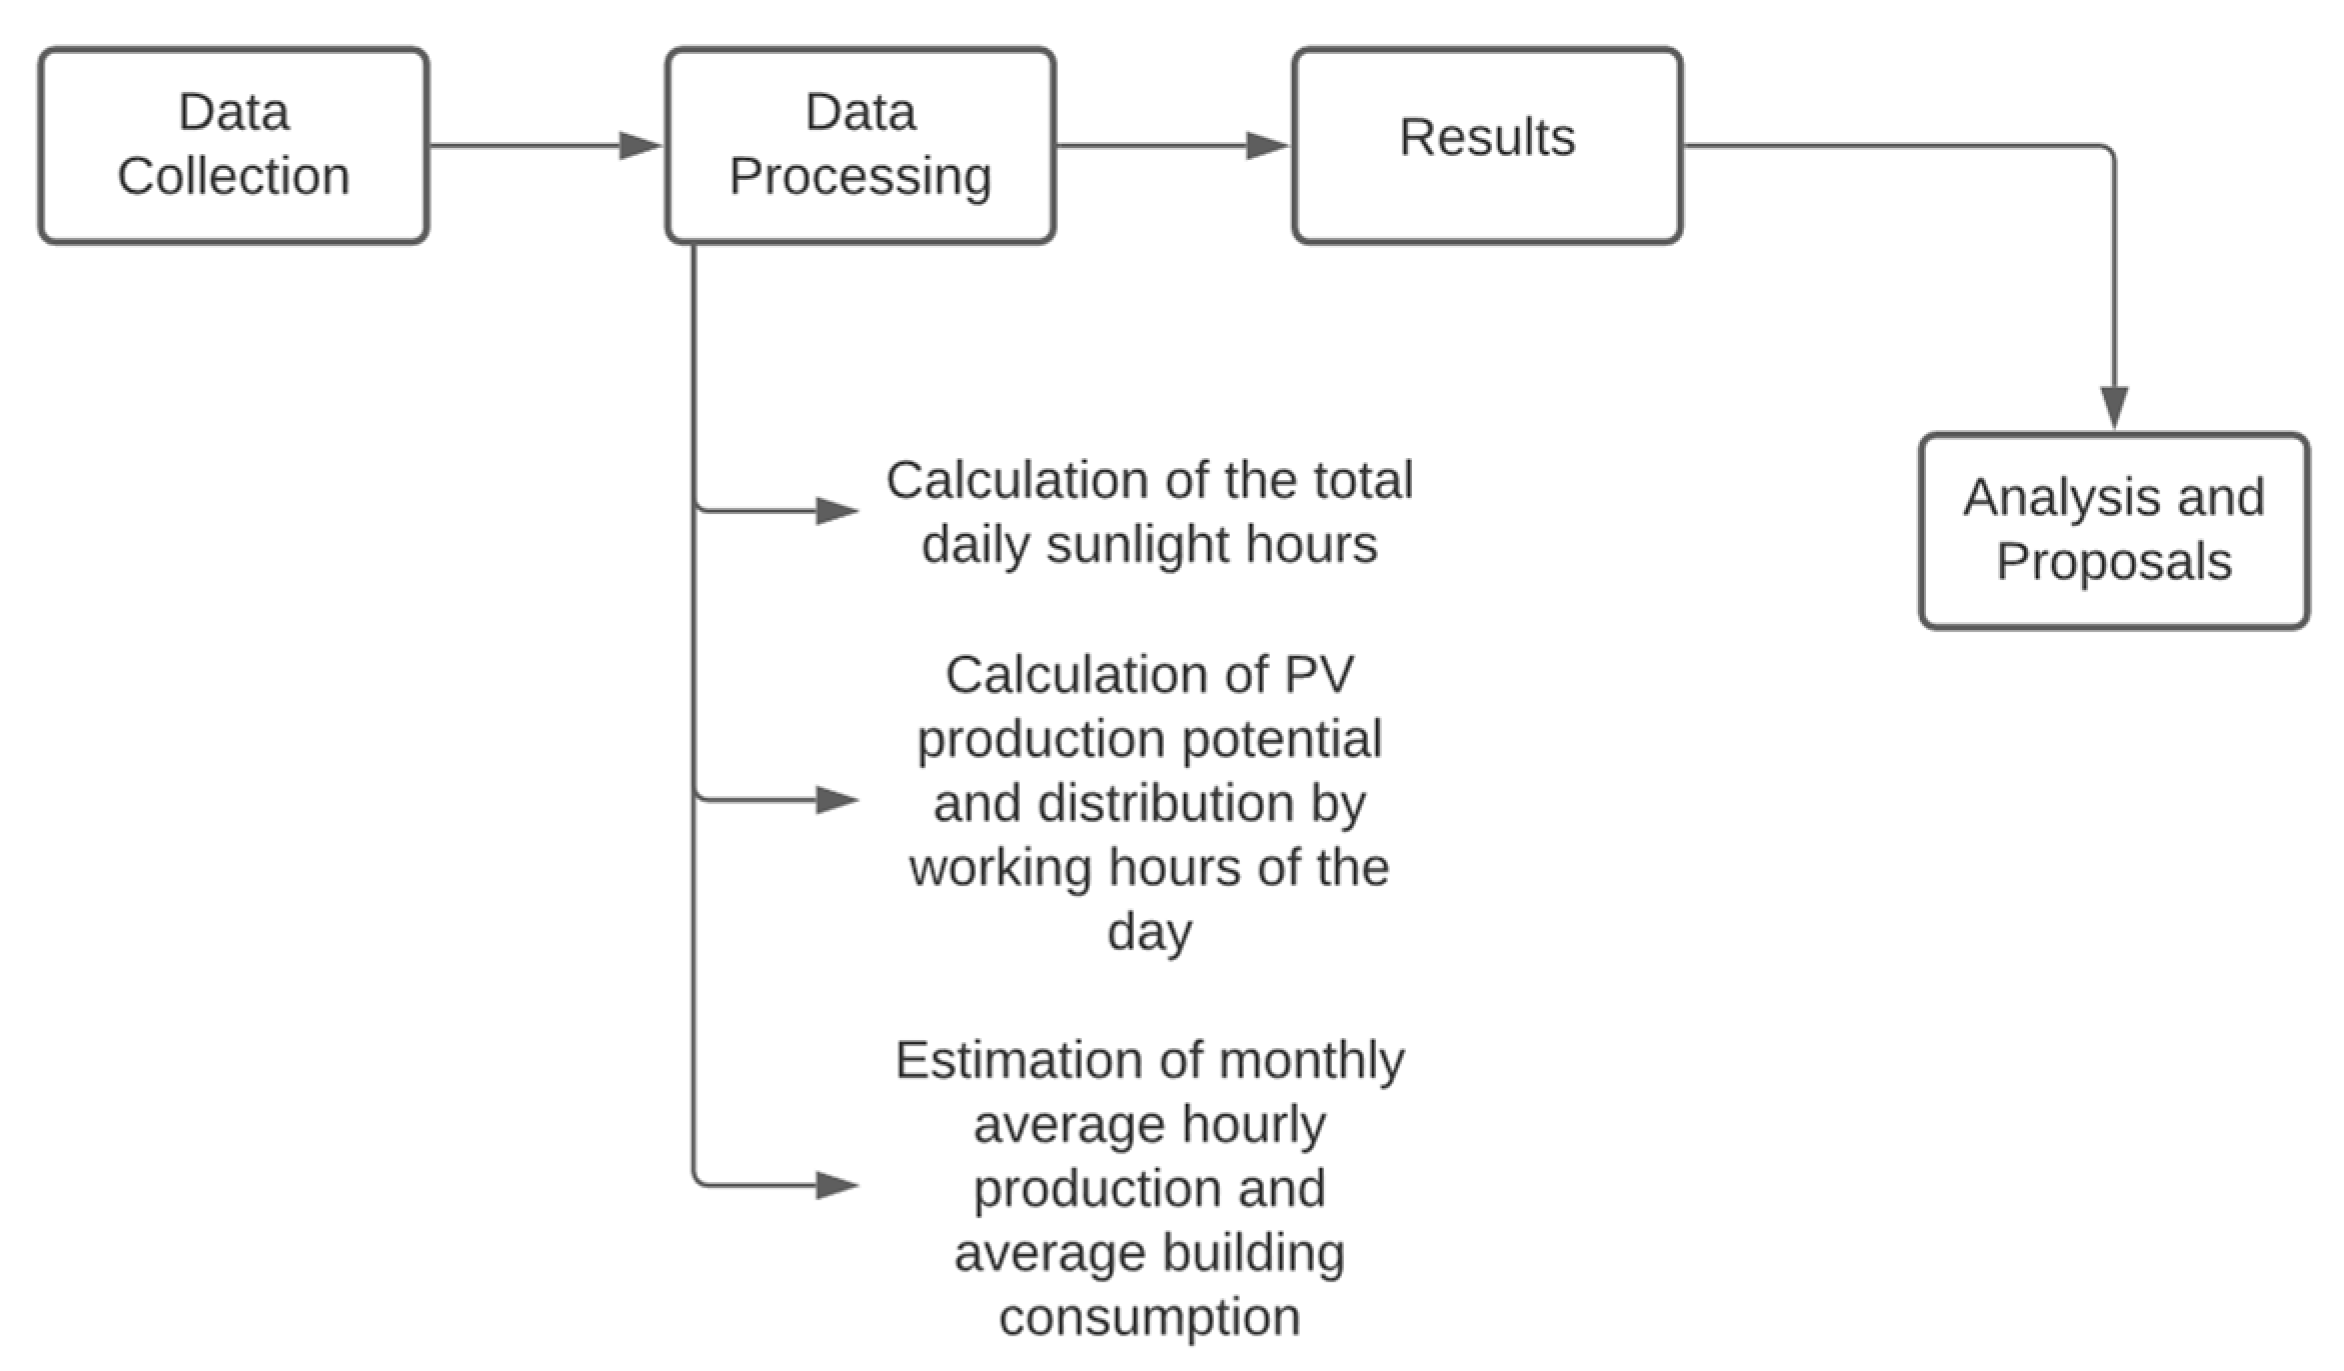
3.3. Data Processing

The data used to implement the analysis were obtained by using different approaches, bearing in mind the outcomes this study aimed to achieve. Thus, to obtain the data used to calculate the average number of sunlight hours per day for each month of the year, information was available on the internet (available at http://www.sunrise-and-sunset.com, accessed on 16 July 2022). To estimate the production of the installed PV system, we used the PVGIS (Photovoltaic Geographical Information System) platform (available at http://joint-research-centre.ec.europe.eu/pvgis-photovoltaic-geographical-information-system_en, accessed on 16 July 2022). The data regarding in situ monitoring were obtained through analysis of PV system during the period between 2 March and 31 May 2022. The data collected and the results were obtained using the algorithm presented in Figure 2.

4. Results and Discussion

4.1. Calculation of the Total Daily Average Sunlight Hours

The total sunlight hours per day are directly related to the PV production potential. To acquire these data, we consulted the available information corresponding to the times of sunrise and sunset for the year 2022 at the location’s coordinates (accessible at https://www.sunrise-and-sunset.com, accessed on 16 July 2022). Subsequently, these data were grouped by the corresponding months, and the monthly averages for sunrise and sunset hours were calculated. The same procedure was used to determine the average length of the day for each of the months. After determining the respective monthly average values, they were approximated to integer values to simplify the calculations, as shown in Table 2.
According to the data presented in Table 2, from a statistical point of view, both the Student’s t-test and Snedecor’s F-test were applied to data corresponding to the actual number of hours in the day. The number of adjusted hours showed a p-value > 0.05, indicating that the null hypothesis (H0) was not rejected. That is, there were no significant differences between the variances, which were supposedly equal, and there were also no significant differences between the means of the two groups. The values obtained for Snedecor’s F-test and Student’s t-test were 0.59 and 0.30, respectively.

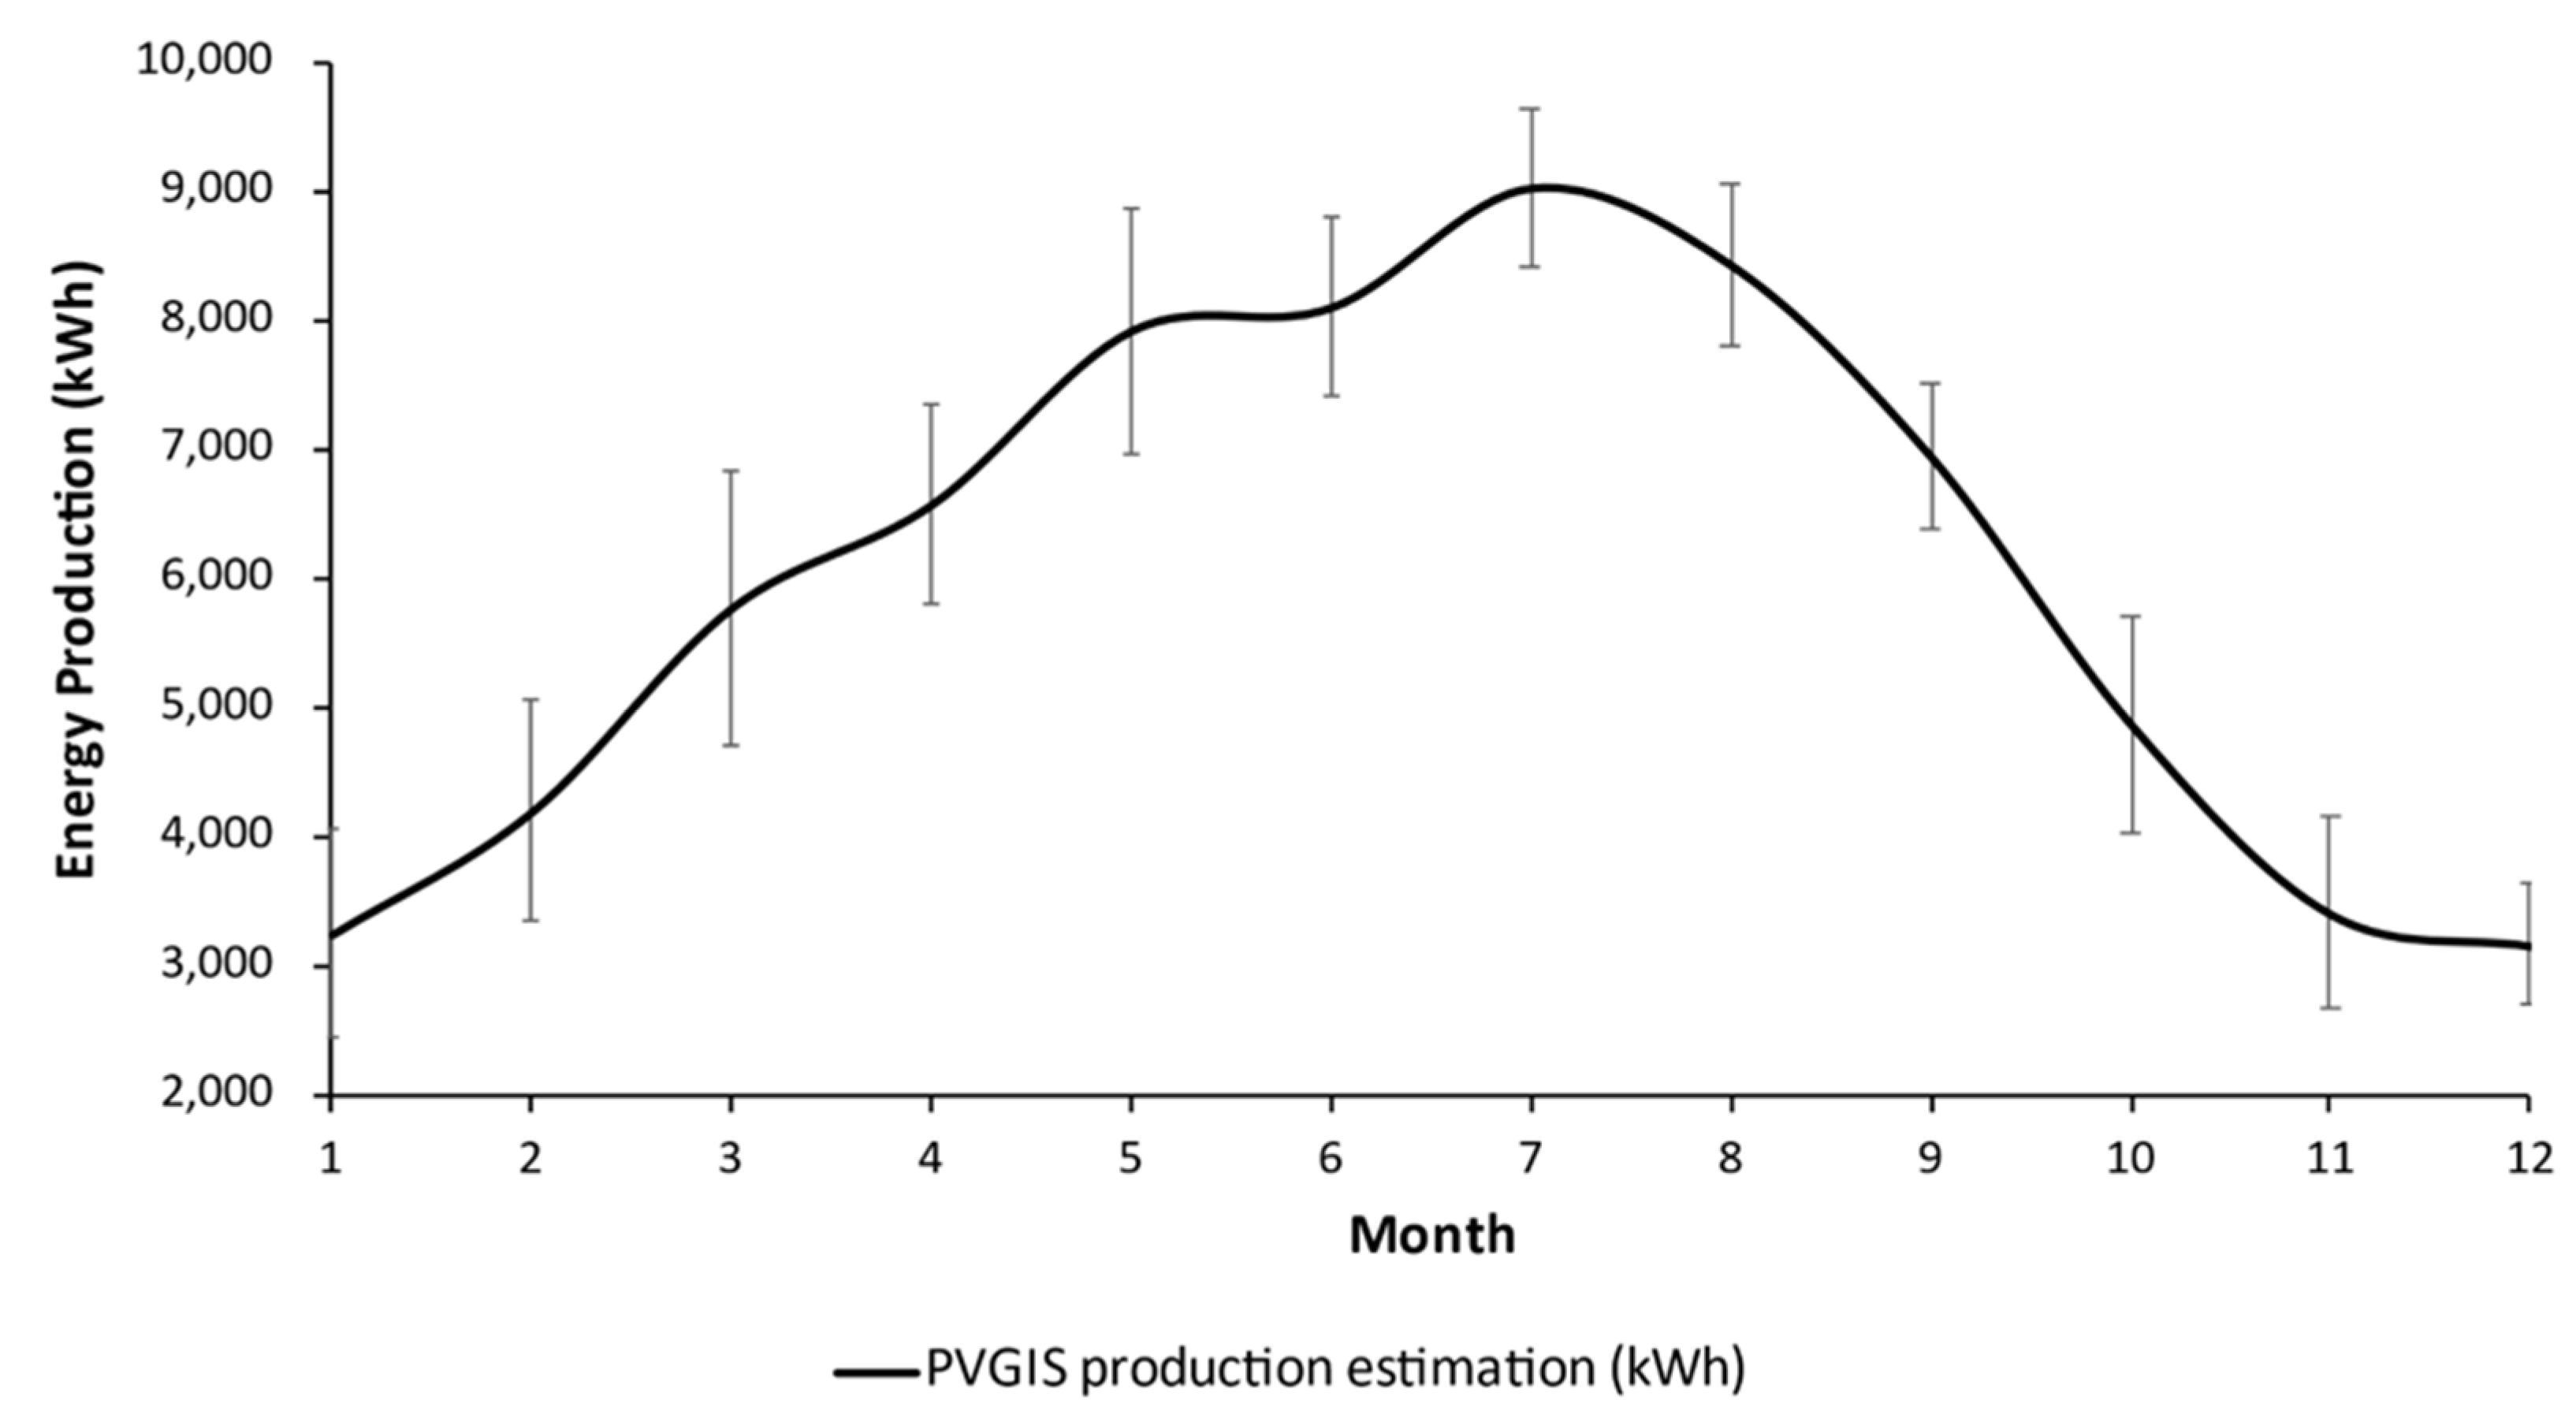
4.2. Calculation of PV Energy Production Potential and Distribution of Production by Working Hours of the Day

To estimate the PV production potential, the PVGIS (Photovoltaic Geographical Information System) platform was used (available at https://joint-research-centre.ec.europa.eu/pvgis-photovoltaic-geographical-information-system_en, accessed to 16 July 2022). This platform operates based on the geographical location chosen to install the panels, along with the technical characteristics of the PV system used. The estimated energy production is shown in Figure 3.
The lower limit of the standard deviation was assumed to be used in the following calculations since, in this way, more conservative values are obtained. Subsequently, the average hourly production and the corresponding percentage distribution were calculated based on the actual production values measured between 3 March 2022 and 31 May 2022. Then, based on the daily sunlight hours, both the average sunlight hours and the upper meridian transit were calculated. Table 3 shows the average values of PV energy production and the percentages distributed by the daily hours of sunlight.
It was found that the months can be distributed into three groups, corresponding to months with 9, 11, and 13 h of sunlight. The data corresponding to the hourly distribution, based on the real production data obtained in the period from 2 March to 31 May 2022, present a form that can be mathematically represented by a polynomial equation of degree n (depending on the degree of fit intended, considering sunrise and sunset hours as the roots of the equation), and which is similar to a representative data curve that follows a normal distribution (Figure 4).
The percentages of PV energy produced by the three groups of months mentioned above were adjusted, using the average daily values of PV energy produced and determined using the PVGIS platform as a reference. The distribution of PV energy production by daylight hours is shown in Figure 5.
Table 4 presents the estimated values based on the presented methodology.
From a statistical point of view, by applying the Student’s t-test and Snedecor’s F-test to the estimated average daily production data—calculated both from Table 3 and from the values obtained for the actual hourly production—the following can be verified: Since the p-values obtained (0.47 and 0.76, respectively) are both >0.05, they do not reject the null hypothesis (H0) for either situation. That is, there are no significant differences between the means of the two groups, as there are no differences between the variances, which are supposedly equal. Therefore, the procedure developed for estimating production and its hourly distribution is validated to overcome the lack of real production data.

4.3. Estimated Monthly Average Hourly Production and Average Building Consumption

It is important to underline that during the period from 2 March to 31 May 2022, the consumption corresponding to the building taken as a case study was monitored. The obtained results were converted into hourly average values, as shown in Figure 6.
Since the building taken as a case study is classified as a services building (with students’ residence, but also a canteen, bar, and laundry room), it is assumed that its average consumption remains constant throughout the year, except for August when, due to school holidays, the building may have a lower usage rate than usual. The estimated hourly production was projected with the verified average consumption, serving as a reference for the common use of the building and the balance between the estimated production and the consumption. The results obtained are shown in Figure 7.
Figure 7 shows a direct correlation between the number of hours of sunlight and the estimated production of PV energy, which condition the balance between consumption and production. Clearly, in the months from March to October, it is possible to verify the existence of a positive balance—that is, when production exceeds consumption—within a time interval that goes from 9 a.m. to 3 p.m. in March, followed by a peak in July and August, where the balance is positive from 9 a.m. to 6 p.m. until, in October, the balance decreases; however, it continues to be positive between 9 a.m. and 3 p.m. In the winter months, from November to February, the balance is always negative, never compensating for consumption at any stage of the day.

4.4. Analysis of the Evolution of Production, Consumption, and Balances in an Annual Time Horizon

The installation of solutions to produce renewable energy for self-consumption, as is the case of the situation under analysis in this article, assumes that the installed PV system can compensate for at least a significant part of consumption, since this is the only possible way to amortize the investment made through the reduction in electricity costs. Through a purely economistic analysis of the situation, it seems that the estimated total of PV energy produced corresponds to 59.3% of consumption, which is quite significant in terms of self-sufficiency. However, when analyzing the same issue from the perspective of summer months and winter months—that is, as seen in Section 3.3, with the months grouped according to the existence of positive and negative balances or tending towards a neutral situation between consumption and production—there are significant differences in the performance of the system, which reaches 72.8% for the summer months, while in the winter months it stands at 32.3%. This discrepancy in the performance of the system between the different phases of the year influences the profile of use of the energy produced, mainly because, according to the current model for contracts for systems for the production of renewable energy for self-consumption (which is described in several recent pieces of legislation, namely, Ministerial order no. 46/2019, of 30 December; Decree-Law no. 172/2006, of 23 August, with the new amendment given by Decree-Law no. 16/2020, of 23 January; Order no. 4/2020, of 3 February; Regulation no. 8/2021, of 7 April; Directive no. 1/2021, of 8 January; and Decree-Law no. 162/2019, of 25 October [31,32,33,34,35,36,37]), unidirectional systems cannot inject renewable energy into the grid. That is, if there is no consumption, there is no production, so there is no way to use the surplus energy to amortize the investment. Since the periods of PV energy production coincide with the times of peak use of the building, it is also certain that—even in the winter months—there will be a contribution to bringing the balance between consumption and production as close as possible to neutrality, as can be seen in Figure 8.
Figure 8 shows an approximation of the balance trending towards neutrality, mainly at the time of the superior meridian transit, which exactly represents the peak of PV energy production. However, since the number of effective hours of production is also reduced in the winter months, this period of neutrality is very short. On the other hand, in the summer months, from March to October, this balance is positive, and a potential surplus can even be envisaged (which is only produced if consumption increases), which could ensure self-sufficiency—even if temporary—of the system, as can be seen in Figure 9.
Therefore, since the daily interval for effective production is much wider, the production of PV energy is also higher, contributing to the satisfaction of needs, although limited to the average time horizon shown in Figure 9.

4.5. Management Actions to Optimize the Efficiency of Energy Use in the Building

4.5.1. Management of Tasks to Fit into the Periods of PV Energy Production

Despite the seasonal fluctuations in PV energy production periods due to the variation in the number of daily hours of sunlight, it is possible to estimate the PV energy production periods in advance, as well as the intensity of this production [38,39]. This PV energy production may still be conditioned by factors other than sunrise and sunset, e.g., by the occurrence of cloudiness—which is a random factor, but the probability of occurrence of which is determinable by the season of the year—as well as by completely controllable factors, such as the cleanliness of the panels [40,41]. In this specific case, it is mandatory to implement periodic verification and maintenance (cleaning) procedures, as a way of guaranteeing that this factor does not contribute to the reduction in PV energy production. In this way, once the PV energy production intervals are known, it is urgent to carry out an exhaustive survey of all energy-consuming activities that take place in the building—especially those that constitute routines that are associated with normal operating activities, e.g., canteen, cafeteria, or laundry services. Based on this consumption survey, it is then possible to organize—or rather, reorganize—these tasks so that, as far as possible, they are carried out at the intervals defined for the groups of winter months and summer months, as a way of guaranteeing that these activities take place during the period of PV energy production. Thus, consumption is met using the PV energy produced, and not using the energy supplied by the external distribution network, effectively contributing to the reduction in energy costs.

4.5.2. Installation of Consumption Monitoring Systems

The quantification of consumption associated with certain practices or activities (or even equipment) in the most rigorous way possible allows the establishment of the consumption profile of the building. The organization of tasks based on the consumption profile allows the reorganization of tasks to be carried out in such a way that tasks that exceed the PV energy production capacity at a given time do not overlap. This situation is of particular importance, since when the production capacity is exceeded at a given moment, the system will resort to external supply from the national distribution network which, as these are “full” and “peak” hours, charges much higher rates. This lag in tariffs requires a careful analysis of which activities must be carried out to occupy the maximum within the PV energy production schedules, leaving those activities that may exceed production capacity for “empty” hours, where tariffs are lower. This organizational approach makes it possible to combine both the self-production of PV energy and the times when tariffs have lower prices, thereby contributing to lower energy costs.

4.5.3. Education and Awareness for Energy Saving and Energy Efficiency

The education and awareness of the users of buildings with similar characteristics to the one that served as the basis for the present study are crucial for the success of the recommended measures to reduce energy costs. A group of informed users—who know the installed capacities of the PV energy production system, the production schedules, and the consumption associated with daily practices and activities—can contribute to more efficient management of the entire process. Raising users’ awareness of current issues related to the preservation of the environment and sustainability—such as saving water, reducing the carbon footprint, or mitigating climate change—has been received with great enthusiasm, which is why it is expected that awareness-raising actions aimed at changing practices will lead to the adoption of behaviors that effectively contribute to the reduction in energy consumption. The awareness and education of building users are also important so that these same users understand why certain decisions are taken. In other words, understanding the processes facilitates the implementation of new measures leading to reductions in energy costs.

4.5.4. Negotiation of the Contracted Power with the Energy Provider

It is common to find situations where the contracted power for a given consumption point significantly exceeds the user’s needs. However, these excess contracted fixed power costs add to the costs associated with energy consumption. As the object of this study is a public service building, it is possible to negotiate and subsequently reduce the contracted power to bring it closer to the real consumption needs, which can be accurately known based on the implementation of the proposal presented in Section 4.5.2. In this way, the reduction in the fixed costs of the energy bill also contributes to the effective reduction in energy costs.

4.5.5. Optimization of Surplus PV Energy by Converting It into Other Energy Forms

Especially in the period corresponding to the summer months, it is very likely that more PV energy will be produced than the consumption needs. However, this amount of surplus energy will only be produced if there is a form of consumption since, as mentioned in previous sections, the system only produces if there is consumption, because the possibility of injection into the electricity network is not foreseen. In this way, this surplus energy can be used, for example, for heating domestic hot water using electrical resistance, or for preheating water from central heating systems, which is then heated in a biomass boiler, increasing the efficiency through the reduction in fuel consumption; or for use in air conditioning systems, which can climatize the building in a regulated way only at times when excess production occurs. These possibilities make it possible to enhance the use of the PV energy production system, although there is a need to control this energy surplus—preferably in real-time. In Figure 10, the balance between production and consumption is schematically presented, with an indication of the amount of surplus energy produced.
The determination of the energy surplus of the system can be calculated through Equation (1):
E = A B f ( b ) f ( c ) d x
That is, the amount of surplus energy corresponds to the area delimited by the intersection of the function representing the balance over time, f(b), with the representative function of energy consumption over time, f(c), where A and B are the points of intersection of the two functions (roots). This calculation can be made continuously and permanently adjusted, providing information on surplus energy availability, and allowing for more assertive decision-making regarding the best use of this energy surplus.

4.5.6. Installation of Complementary Storage Systems for Surplus Production

An alternative to consider compared to the solution presented in the previous section (Section 4.5.5) could be installing a battery system to accumulate surplus energy, enabling its use at times outside the range of PV energy production. However, there is not yet a complete consensus regarding the effectiveness of such systems and, in particular, regarding the necessary investment, given the needs of the building.

4.5.7. Reinforcement of PV Energy Production Capacity

The reinforcement of the PV energy production capacity in the building should be a possibility to be considered since, mainly, the setup corresponds to the inverse months. This can be a solution for the lower verified production capacity. However, since the capacity to install more panels on the roof of the building is already completely occupied, the placement of additional panels—for example, on the south-facing facades—may encounter difficulties of another nature, e.g., related to the safeguarding of buildings classified as heritage locations. Furthermore, from the investment point of view, adopting measures to increase production always involves additional effort, which must be quantified and duly considered, with a view to the sustainability of the entire process.

5. Conclusions

Among the many types of buildings, halls of residence play a significant role in energy consumption, given the high electricity costs associated with the preparation of domestic hot water, lighting, space heating and cooling systems, and appliances, which are highly dependent on the habits of the residents. The hall of residence of the Agrarian School of Ponte de Lima, Northern Portugal, has recently undergone an energy rehabilitation process focused on improving energy efficiency, including integrating a solar photovoltaic (PV) system. However, the electricity supply provided by the panels is not enough to cover the building’s energy demand. Under these circumstances, a study was implemented to analyze the yearly contribution of the electricity produced by the solar PV system to reducing energy consumption under distinct solar radiation conditions, so as to define a strategy to optimize renewable energy use by drawing up a set of organizational measures to manage the PV solar system’s energy. The strategic measures determine that the residence tasks with higher energy consumption must fit into higher PV energy production periods. Additionally, an awareness-raising campaign should be carried out to increase residence occupants’ education about energy efficiency. It would also be strategic to optimize the PV energy produced in specific periods of overproduction by converting the surplus into other energy forms and installing complementary storage systems.

Author Contributions

Conceptualization, L.J.R.N. and A.C.; methodology, L.J.R.N. and A.C.; validation, I.A. and L.J.R.N.; formal analysis, A.C. and D.P.V.; investigation, I.A., L.J.R.N. and A.C.; resources, A.C.; data curation, I.A. and L.J.R.N.; writing—original draft preparation, I.A., L.J.R.N. and A.C.; writing—review and editing, I.A., L.J.R.N., A.C. and D.P.V.; visualization, I.A., L.J.R.N. and A.C.; supervision, L.J.R.N. and A.C. All authors have read and agreed to the published version of the manuscript.

Funding

This work is a result of the project TECH (Technology, Environment, Creativity and Health), Norte-01-0145-FEDER-000043, supported by the Norte Portugal Regional Operational Program (NORTE 2020) under the PORTUGAL 2020 Partnership Agreement, through the European Regional Development Fund (ERDF). L.J.R.N. was supported by the proMetheus Research Unit on Energy, Materials and Environment for Sustainability—UIDP/05975/2020, funded by national funds through the FCT (Fundação para a Ciência e Tecnologia).

Data Availability Statement

The data presented in this study are available upon request to the corresponding author.

Conflicts of Interest

The authors declare no conflict of interest.

References

  1. Siddique, A.; Shahzad, A.; Lawler, J.; Mahmoud, K.A.; Lee, D.S.; Ali, N.; Bilal, M.; Rasool, K. Unprecedented environmental and energy impacts and challenges of COVID-19 pandemic. Environ. Res. 2021, 193, 110443. [Google Scholar] [CrossRef] [PubMed]
  2. Potrč, S.; Čuček, L.; Martin, M.; Kravanja, Z. Sustainable renewable energy supply networks optimization—The gradual transition to a renewable energy system within the European Union by 2050. Renew. Sustain. Energy Rev. 2021, 146, 111186. [Google Scholar] [CrossRef]
  3. Tian, J.; Yu, L.; Xue, R.; Zhuang, S.; Shan, Y. Global low-carbon energy transition in the post-COVID-19 era. Appl. Energy 2022, 307, 118205. [Google Scholar] [CrossRef] [PubMed]
  4. Eckert, E.; Kovalevska, O. Sustainability in the European Union: Analyzing the discourse of the European green deal. J. Risk Financ. Manag. 2021, 14, 80. [Google Scholar] [CrossRef]
  5. De La Peña, L.; Guo, R.; Cao, X.; Ni, X.; Zhang, W. Accelerating the energy transition to achieve carbon neutrality. Resour. Conserv. Recycl. 2022, 177, 105957. [Google Scholar] [CrossRef]
  6. Steffen, B.; Patt, A. A historical turning point? Early evidence on how the Russia-Ukraine war changes public support for clean energy policies. Energy Res. Soc. Sci. 2022, 91, 102758. [Google Scholar] [CrossRef]
  7. Le Billon, P.; Lujala, P.; Singh, D.; Culbert, V.; Kristoffersen, B. Fossil fuels, climate change, and the COVID-19 crisis: Pathways for a just and green post-pandemic recovery. Clim. Policy 2021, 21, 1347–1356. [Google Scholar] [CrossRef]
  8. Mohan, A.; Geden, O.; Fridahl, M.; Buck, H.J.; Peters, G.P. UNFCCC must confront the political economy of net-negative emissions. One Earth 2021, 4, 1348–1351. [Google Scholar] [CrossRef]
  9. Jiang, Q.; Khattak, S.I.; Rahman, Z.U. Measuring the simultaneous effects of electricity consumption and production on carbon dioxide emissions (CO2e) in China: New evidence from an EKC-based assessment. Energy 2021, 229, 120616. [Google Scholar] [CrossRef]
  10. Krarti, M.; Aldubyan, M. Review analysis of COVID-19 impact on electricity demand for residential buildings. Renew. Sustain. Energy Rev. 2021, 143, 110888. [Google Scholar] [CrossRef]
  11. Deng, Y.; Gou, Z.; Gui, X.; Cheng, B. Energy consumption characteristics and influential use behaviors in university dormitory buildings in China’s hot summer-cold winter climate region. J. Build. Eng. 2021, 33, 101870. [Google Scholar] [CrossRef]
  12. Oyedepo, S.O.; Anifowose, E.G.; Obembe, E.O.; Khanmohamadi, S. Energy-saving strategies on university campus buildings: Covenant University as case study. In Energy Services Fundamentals and Financing; Elsevier: Amsterdam, The Netherlands, 2021; pp. 131–154. [Google Scholar]
  13. Alam, M.; Lin, F.-R. Internalizing Sustainability into Research Practices of Higher Education Institutions: Case of a Research University in Taiwan. Sustainability 2022, 14, 9793. [Google Scholar] [CrossRef]
  14. Caputo, F.; Ligorio, L.; Pizzi, S. The contribution of higher education institutions to the SDGs—An evaluation of sustainability reporting practices. Adm. Sci. 2021, 11, 97. [Google Scholar] [CrossRef]
  15. Sanchez-Carrillo, J.; Cadarso, M.; Tobarra, M. Embracing higher education leadership in sustainability: A systematic review. J. Clean. Prod. 2021, 298, 126675. [Google Scholar] [CrossRef]
  16. Drif, M.; Pérez, P.J.; Aguilera, J.; Almonacid, G.; Gomez, P.; De la Casa, J.; Aguilar, J.D. Univer Project. A grid connected photovoltaic system of 200 kWp at Jaén University. Overview and performance analysis. Sol. Energy Mater. Sol. Cells 2007, 91, 670–683. [Google Scholar] [CrossRef]
  17. Hasapis, D.; Savvakis, N.; Tsoutsos, T.; Kalaitzakis, K.; Psychis, S.; Nikolaidis, N.P. Design of large scale prosuming in Universities: The solar energy vision of the TUC campus. Energy Build. 2017, 141, 39–55. [Google Scholar] [CrossRef]
  18. Tsoutsos, T.; Tournaki, S.; de Santos, C.A.; Vercellotti, R. Nearly zero energy buildings application in Mediterranean hotels. Energy Procedia 2013, 42, 230–238. [Google Scholar] [CrossRef] [Green Version]
  19. Sunanda, W.; Tiandho, Y.; Gusa, R.F. Monitoring of Photovoltaic Performance as an Alternative Energy Source in Campus Buildings. Instrum. Mes. Metrol. 2021, 20, 153–159. [Google Scholar] [CrossRef]
  20. Minai, A.F.; Usmani, T.; Alotaibi, M.A.; Malik, H.; Nassar, M.E. Performance Analysis and Comparative Study of a 467.2 kWp Grid-Interactive SPV System: A Case Study. Energies 2022, 15, 1107. [Google Scholar] [CrossRef]
  21. Talavera, D.; Muñoz-Cerón, E.; De La Casa, J.; Ortega, M.; Almonacid, G. Energy and economic analysis for large-scale integration of small photovoltaic systems in buildings: The case of a public location in Southern Spain. Renew. Sustain. Energy Rev. 2011, 15, 4310–4319. [Google Scholar] [CrossRef]
  22. Mokhtara, C.; Negrou, B.; Settou, N.; Bouferrouk, A.; Yao, Y. Optimal design of grid-connected rooftop PV systems: An overview and a new approach with application to educational buildings in arid climates. Sustain. Energy Technol. Assess. 2021, 47, 101468. [Google Scholar] [CrossRef]
  23. D’Adamo, I.; de Monte, F.; Ferella, F.; Gastaldi, M. The case study of a photovoltaic plant located at the university of L’Aquila: An economic analysis. J. Clean. Prod. 2021, 278, 123561. [Google Scholar] [CrossRef]
  24. Hrayshat, E.S. Viability of solar photovoltaics as an electricity generation source for Jordan. Int. J. Sustain. Eng. 2009, 2, 67–77. [Google Scholar] [CrossRef]
  25. Al-Najideen, M.I.; Alrwashdeh, S.S. Design of a solar photovoltaic system to cover the electricity demand for the faculty of Engineering-Mu’tah University in Jordan. Resour.-Effic. Technol. 2017, 3, 440–445. [Google Scholar] [CrossRef]
  26. Ayadi, O.; Al-Assad, R.; Al Asfar, J. Techno-economic assessment of a grid connected photovoltaic system for the University of Jordan. Sustain. Cities Soc. 2018, 39, 93–98. [Google Scholar] [CrossRef]
  27. D’Adamo, I.; Falcone, P.M.; Gastaldi, M.; Morone, P. The economic viability of photovoltaic systems in public buildings: Evidence from Italy. Energy 2020, 207, 118316. [Google Scholar] [CrossRef]
  28. Mazzeo, D.; Matera, N.; Bevilacqua, P.; Arcuri, N. Energy and economic analysis of solar photovoltaic plants located at the University of Calabria. Int. J. Heat Technol. 2015, 33, 41–50. [Google Scholar] [CrossRef]
  29. Mukherji, R.; Mathur, V.; Bhati, A.; Mukherji, M. Assessment of 50 kWp rooftop solar photovoltaic plant at The ICFAI University, Jaipur: A case study. Environ. Prog. Sustain. Energy 2020, 39, e13353. [Google Scholar] [CrossRef]
  30. Silva, T.C.; Pinto, G.M.; de Souza, T.A.; Valerio, V.; Silvério, N.M.; Coronado, C.J.; Guardia, E.C. Technical and economical evaluation of the photovoltaic system in Brazilian public buildings: A case study for peak and off-peak hours. Energy 2020, 190, 116282. [Google Scholar] [CrossRef]
  31. Decree-Law n. 172/2006 of 23 of Agosto from Ministério da Economia e da Inovação; Diário da República: Lisboa, Portugal, 2006; pp. 6118–6156. Available online: https://dre.pt/dre/detalhe/decreto-lei/172-2006-540627 (accessed on 10 September 2022).
  32. Decree-Law n. 162/2019 of 25 of Outubro from Presidência do Conselho de Ministros; Diário da República: Lisboa, Portugal, 2019; pp. 45–62. Available online: https://files.dre.pt/1s/2019/10/20600/0004500062.pdf (accessed on 10 September 2022).
  33. Directive n. 1/2021 of 8 of Janeiro from Entidade Reguladora dos Serviços Energéticos; Diário da República: Lisboa, Portugal, 2021; pp. 162–255. Available online: https://files.dre.pt/2s/2021/01/005000000/0016200255.pdf (accessed on 10 September 2022).
  34. Ministerial Order n. 4/2020 of 3 of Fevereiro from Ministério do Ambiente e Ação Climática; Direção Geral de Energia e Geologia: Lisboa, Portugal, 2020; p. 24. Available online: https://www.dgeg.gov.pt/media/augmvfve/2020_despacho_4_ric_rtq-e-anexo.pdf (accessed on 10 September 2022).
  35. Ministerial Order n. 46/2019 of 30 of Dezembro from Ministério do Ambiente e Ação Climática; Direção Geral de Energia e Geologia: Lisboa, Portugal, 2019; p. 20. Available online: https://www.apren.pt/contents/legislation/despacho-46-2019-dgeg.pdf (accessed on 10 September 2022).
  36. Ordinance n. 16/2020 of 23 of Agosto from Ministério do Ambiente e Ação Climática; Diário da República: Lisboa, Portugal, 2020; pp. 6–7. Available online: https://dre.pt/dre/detalhe/portaria/16-2020-128415687 (accessed on 10 September 2022).
  37. Regulation n. 8/2021 of 7 of Abril from Entidade Reguladora dos Serviços Energéticos; Lisboa, Portugal, 2021; p. 46. Available online: https://www.erse.pt/media/b5rmusyr/regulamento-erse-n-%C2%BA-8_2021.pdf (accessed on 10 September 2022).
  38. Hathaway, D.H. The solar cycle. Living Rev. Sol. Phys. 2015, 12, 4. [Google Scholar] [CrossRef]
  39. Pesnell, W.D.; Thompson, B.J.; Chamberlin, P. The solar dynamics observatory (SDO). In The Solar Dynamics Observatory; Springer: Berlin/Heidelberg, Germany, 2011; pp. 3–15. [Google Scholar]
  40. Golestaneh, F.; Pinson, P.; Gooi, H.B. Very short-term nonparametric probabilistic forecasting of renewable energy generation—With application to solar energy. IEEE Trans. Power Syst. 2016, 31, 3850–3863. [Google Scholar] [CrossRef] [Green Version]
  41. El-Shobokshy, M.S.; Hussein, F.M. Effect of dust with different physical properties on the performance of photovoltaic cells. Sol. Energy 1993, 51, 505–511. [Google Scholar] [CrossRef]
Figure 1. Photovoltaic installation on ESA’s rooftop.
Energies 15 08412 g001
Figure 2. The methodological algorithm used in the study.
Energies 15 08412 g002
Figure 3. PV potential production estimated using the PVGIS platform, with the monthly average values and the corresponding standard deviations.
Energies 15 08412 g003
Figure 4. Distribution of average production by hours of sunlight measured from 2 March to 31 May 2022.
Energies 15 08412 g004
Figure 5. Percentage distribution of PV production for the months with 9, 11, and 13 h of sunlight per day.
Energies 15 08412 g005
Figure 6. The average hourly distribution of consumption from 3 March to 31 May 2022.
Energies 15 08412 g006
Figure 7. Distribution of production, consumption, and average monthly balance on an hourly basis.
Energies 15 08412 g007aEnergies 15 08412 g007b
Figure 8. Average daily distribution of production, consumption, and balance for the winter months (November to February).
Energies 15 08412 g008
Figure 9. Average hourly distribution of production, consumption, and balance for the summer months (March to October).
Energies 15 08412 g009
Figure 10. Schematic representation of the relationships between the different variables of the system, where f(c) is the representative function of energy consumption over time, f(b) is the representative function of the balance between PV energy production and energy consumption over time, and E represents the total amount of surplus energy. A and B are the interception points between f(b) and f(c).
Energies 15 08412 g010
Table 1. Specification of the used PV modules under standard test conditions.
ItemSpecification
ManufacturerJA SOLAR
ModelJAM72S20-455/MR/100V
Maximum Power (Pmax) (W)455
Voltage at Maximum Power (Vmp) (V)41.82
Current at Maximum Power (Impp) (A)10.88
Open-Circuit Voltage (Voc) (V)49.85
Short-Circuit Current (Isc) (A)11.41
Operating Temperature Range (°C)−40~85
Temperature Coefficient of Pmax (%/°C)−0.350
Temperature Coefficient of Voc (%/°C)−0.272
Temperature Coefficient of Isc (%/°C)+0.044
Table 2. Monthly average values for sunrise, sunset, and daily sunlight hours.
MonthSunriseSunsetUpper MeridianDaily Sunlight Hours
AverageIntegerAverageIntegerAverageIntegerAverageInteger
January07:5808:0017:2817:0012:4313:0009:3009:00
February07:3008:0018:0618:0012:4813:0010:3610:00
March06:4707:0018:3918:0012:4313:0011:5211:00
April06:5507:0020:1320:0013:3414:0013:1813:00
May06:1607:0020:4420:0013:3014:0014:2813:00
June06:0107:0021:0821:0013:3414:0015:0714:00
July06:1407:0021:0521:0013:3914:0014:5114:00
August06:4406:0020:3220:0013:3814:0013:4814:00
September07:1507:0019:4219:0013:2813:0012:2712:00
October07:4607:0018:5218:0013:1913:0011:0611:00
November07:2307:0017:1317:0012:1812:0009:5010:00
December07:5307:0017:0417:0012:2812:0009:1110:00
Table 3. Distribution of PV energy production and the respective hourly percentages.
HoursProduction (kWh)Production (%)JanuaryFebruaryMarchAprilMayJuneJulyAugustSeptemberOctoberNovemberDecember
000%000000000000
100%000000000000
200%000000000000
300%000000000000
400%000000000000
500%000000000000
600%000000000000
711%111000000000
863%222111111111
9116%333222222222
10169%444333333333
112011%555444444444
122012%666555555555
132112%777666666666
142112%888777777777
151911%999888888888
161710%01010999999999
1713 7%01111101010101010000
1874%000111111111111000
1931%0000121212120000
2000%0000131313130000
2100%000000000000
2200%000000000000
2300%000000000000
Table 4. Hourly estimated production.
MonthHours of the Day
0–67 8 9 10 11 12 13 14 15 16 17 18 19 20 21–24
January0 0.8 5.5 11.1 14.2 15.8 14.2 11.1 5.5 0.8 0 0 0 0 0 0
February0 1.19 6.0 10.7 14.3 17.9 19.0 17.9 14.28 10.7 6.0 1.2 0 0 0 0
March0 1.52 7.6 13.7 18.2 22.8 24.3 22.8 18.2 13.7 7.6 1.5 0 0 0 0
Abril0 0 1.9 9.7 17.4 23.2 29.0 30.9 29.0 23.2 17.4 9.7 1.9 0 0 0
May0 0 2.3 6.8 13.5 20.3 24.8 29.3 31.5 29.3 24.8 20.3 13.5 6.8 2.3 0
June0 0 2.5 7.4 14.8 22.2 27.8 32.1 34.6 32.1 27.8 22.2 14.9 7.4 2.5 0
July0 0 2.7 8.1 16.3 24.4 29.9 35.2 37.9 35.2 29.8 24.4 16.3 8.1 2.7 0
August0 0 2.5 7.6 15.1 22.7 27.7 32.8 35.3 32.8 27.7 22.7 15.1 7.6 2.5 0
September0 0 2.1 10.7 19.2 25.6 31.9 34.1 31.9 25.6 19.8 10.7 2.1 0 0 0
October0 0 1.3 9.1 18.2 23.4 26 23.4 18.2 9.1 1.3 0 0 0 0 0
November0 0 0.9 6.2 12.5 16.0 17.8 16.0 12.5 6.2 0.9 0 0 0 0 0
December0 0 0.9 6.1 12.2 15.7 17.4 15.7 12.2 6.1 0.9 0 0 0 0 0
Publisher’s Note: MDPI stays neutral with regard to jurisdictional claims in published maps and institutional affiliations.

