Article

Experimental Investigation of Flow-Induced Motion and Energy Conversion for Two Rigidly Coupled Triangular Prisms Arranged in Tandem

1
School of Water Conservancy and Hydroelectric Power, Hebei University of Engineering, Handan 056038, China
2
State Key Laboratory of Hydraulic Engineering Simulation and Safety, Tianjin University, 135 Yaguan Road, Jinnan District, Tianjin 300072, China
3
Hebei Key Laboratory of Intelligent Water Conservancy, Hebei University of Engineering, Handan 056038, China
*
Author to whom correspondence should be addressed.
Energies 2022, 15(21), 8190; https://doi.org/10.3390/en15218190
Submission received: 15 September 2022 / Revised: 26 October 2022 / Accepted: 28 October 2022 / Published: 2 November 2022
(This article belongs to the Topic Marine Renewable Energy, 2nd Volume)

Abstract

:
A series of experimental tests on flow-induced motion (FIM) and energy conversion of two rigidly coupled triangular prisms (TRCTP) in tandem arrangement were conducted in a recirculating water channel with the constant oscillation mass mosc. The incoming flow velocity covered the range of 0.395 m/s ≤ U ≤ 1.438 m/s, corresponding to the Reynolds number range of 3.45 × 10⁴Re ≤ 1.25 × 10⁵. The upstream and downstream triangular prisms with a width of 0.1 m and length of 0.9 m were connected by two rectangular endplates. Seven stiffness (1000 N/m ≤ K ≤ 2400 N/m), five load resistances (8 Ω ≤ RL ≤ 23 Ω), and five gap ratios (1 ≤ L/D ≤ 4) were selected as the parameters, and the FIM responses and energy conversion of TRCTP in tandem were analyzed and discussed to illustrate the effects. The experimental results indicate that the “sharp jump” phenomenon may appear at L/D = 2 and L/D = 3 significantly, with substantially increasing amplitude and decreasing oscillation frequency. The maximum amplitude ratio in the experiments is A*Max = 2.24, which appears after the “sharp jump” phenomenon at L/D = 3. In the present tests, the optimal active power Pharn = 21.04 W appears at L/D = 4 (Ur = 12.25, K = 2000 N/m, RL = 8 Ω), corresponding to the energy conversion efficiency ηharn = 4.67%.

1. Introduction

Flow-induced motion (FIM) is a complex fluid–structure interaction phenomenon which may occur on the surface of structures such as long-spanned bridges [1], offshore platform, vehicle system, deep-sea risers, and so on [2]. Due to its powerful and destructive force on structures, extensive studies on FIM have been carried out [3,4,5]. There are two typical forms of FIM: vortex-induced vibration (VIV) and galloping. VIV is a self-excited and self-limited motion. The typical VIV phenomenon can be observed on the circular cylinder, as the flow velocity increases, the circular cylinder enters into the VIV initial branch, followed by the VIV upper branch and finally the VIV lower branch. In the initial branch of VIV, the amplitude and oscillation frequency stabilize at lower values because the energy extracted from the water is limited with a lower flow velocity, but the increasing trend can be observed significantly with the flow velocity increases. For the upper branch of VIV, the amplitude becomes larger and the oscillation frequency and the natural frequency are almost the same, so the upper branch is also called “Lock-in” or “Synchronization Region”. As the flow velocity continues to increase, in the lower branch of VIV, the amplitude begins to decrease, but the oscillation frequency presents an increasing trend. For the high flow velocity, the circular cylinder appears with self-limited motions [6,7], accompanying the oscillation suppressed, which is not conducive to energy harvesting. Galloping is defined as a motion caused by instability of lift with high-amplitude and low-frequency, and the phenomenon can be observed on the non-circular section prisms such as Passive Turbulence Cylinder (PTC) [8], rectangular prism [9,10], triangular prism [11,12], T-section prism [13], etc. The galloping phenomena can be divided into two forms: soft galloping (SG) and hard galloping (HG) [14]. For SG, the galloping can be self-excited by the VIV with the increasing flow velocity. On the other hand, for HG, the complete VIV response can be observed. At the lower branch of VIV, the oscillation is suppressed, while the hard galloping can be excited by external excitation.
When the fluid flows past a cylinder, the Von Karman vortex street occurs behind the cylinder over very broad ranges of Reynolds (Re) number. The appropriate force-transfer coefficients have been determined experimentally by a Fourier averaging technique, and the results were incorporated into the equation to predict the dynamic responses of elastically mounted cylinders by Sarpkaya [15]. The experiments on FIM have been presented for several decades, and Khalak and Williamson [16] studied the VIV phenomena for a circular cylinder. With a constant mass-damping ratio m*ξ = 0.013, the results show that the amplitude of a circular cylinder decreases sharply at VIV lower branch with a larger mass ratio. Raghavan and Bernitsas [17] studied the effect of Reynolds number on VIV response, and the experimental results show that the reduced velocity range for lock-in becomes larger as the Reynolds number increases. The results also indicate that the Reynolds number has a stronger effect on A* than the mass ratio, and a large amplitude ratio of A* = 1.8 can be observed with a 3.5-inch cylinder at K = 965 N/m and Re = 8.7 × 10⁴. Bernitsas et al. [18] developed the vortex-induced vibration aquatic clean energy (VIVACE) converter, which is a new concept on the energy conversion of FIM and converts the energy of fluid flow to electricity at flow velocity as low as 0.25 m/s. The principle for energy conversion of FIM is that the displacement of a cylinder generated by vortex shedding drives the generator to produce electricity through the transmission part. Brandao et al. [19] studied the effect of non-condensable gas on a circular cylinder in cavitating flows based on a homogeneous mixture of water vapor. In the cyclic regime, cavitation was observed in periodically shedding vortices. Bahmani and Akbari [20] studied the characteristics of amplitude response and vortex shedding for an elastically mounted circular cylinder with mass ratio and damping ratio as the parameters. In the laminar flow with the Reynolds number range of 80 < Re < 160, the results show that a decrease in either the mass ratio or the damping ratio can lead to an increase of the amplitude and the reduced velocity range for lock-in. However, some flow-induced vibrations of structures are adverse, and they should be suppressed due to the powerful forces. An optimization procedure involving nonlinear aeroelastic effect is developed for galloping control and flutter control by Zhang et al. [21] and three numerical examples were analyzed. The advantages of the nonlinear control target and new optimization procedure were presented in detail, and a six-span continuous beam with a nonlinear energy sink (NES) attachment was used to numerically investigate the NES-based VIV control of a flexible structure with multiple degrees of freedom [22]. The results show that an NES designed for VIV control of the fundamental mode can effectively mitigate the VIVs of higher-order modes.
Due to the self-limited motions of a circular cylinder, scholars began to pay attention on the circular cylinders with passive turbulence control (PTC) and non-circular sectional prisms. To enhance the amplitude, Park et al. [23] and Chang et al. [8] conducted experiments on the elastically mounted circular cylinders with rectangular surface roughness strips in the steady flow, and straight roughness strips with a specific width were applied at various circumferential locations on the surface of the cylinders. When there are two 1.27 cm wide sandpapers with the thickness of 5.08 × 10⁻⁶ m and the separation angle is 80°, the maximum amplitude ratio can reach 2.7 at Ur = 13 and K = 424 N/m. Sun et al. [24] conducted the FIM experiments of a rigid circular cylinder with distributed surface roughness at 3 × 10⁴ < Re < 1.2 × 10⁵, and the mass ratio, damping, and stiffness were selected as the parameters. The maximum active power Pmax = 20 W and the energy conversion efficiency ηmax = 44% are achieved. The inclination angle (α) of a circular cylinder with respect to oncoming flow was considered to improve the energy conversion efficiency of the piezoelectric energy harvester by Wang et al. [25]. In the experimental tests, different cylinders with inclination angles from 25° to 45° can produce torsional vibration and high voltage output under high wind speed. Zhu and Gao [26] studied the numerical simulations on the VIV responses of a riser attached by a free-to-rotate impeller and the rotation response of the impeller. The results show that the rotation of impeller delays the appearance of “lock-in” to a larger reduced velocity. Hu et al. [27] studied the energy conversion of circular cylinders with two same rod-shaped attachments, which have three cross sectional forms: circle, triangle, and square. The results show that the circular cylinder with triangular attachments at 60 degrees arrangement has better VIV response. A numerical study of VIV response for a circular cylinder with an attached free-to-rotate pentagram impeller was conducted by Zhu et al. [28], and they found that the amplitude increases with the growth of reduced velocity without an upper limitation, which is beneficial to energy harvesting, and the average energy conversion efficiency is 22.6% in the tests. Andrianne et al. [29] conducted the experimental tests and numerical simulations of FIM responses for a square cylinder in the wind tunnel, and the energy conversion characteristics were evaluated by connecting a variable load resistance. A vertical set-up and a horizontal set-up were applied in the tests. Shao et al. [13] conducted a series of experimental tests on a T-section prism. They revealed the complete FIM responses and energy conversion characteristics for a T-section prism with different load resistances and aspect ratios. The results indicate that the prism with a smaller aspect ratio may have the greater energy conversion efficiency, and the maximum value of ηout = 27.44% is achieved with gap ratio α = 0.8. Zhang et al. [10] conducted the numerical simulations on the effect of the cross-sectional aspect ratio on FIM response and energy conversion for a rectangular cylinder with seven different aspect ratios from 1/6 to 2.0. The amplitude ratio increases approximately linearly, increasing the flow velocity without limit. Lian et al. [30] conducted the experimental tests of FIM responses and energy conversion on four different cross-sectional cylinders (circle, triangle, square, diamond square), and the results show that all the cylinders present “self-excited” motions, but the circular cylinders and the diamond square prisms present “self-limited” motions. The maximum amplitude ratio of A* = 1.8 can be observed on a triangular prism with a low oscillation frequency of f* = 0.6 at Ur = 7 (m* = 4.2, ξ = 0.147, K = 199 N/m). Zhang et al. [31] conducted the numerical investigation on six different oscillators (triangular prism, square prism, hexagon prism, octagon prism, 24-sided polygon prism, and circular cylinder) at 1.61 × 10⁴Re ≤ 2.42 × 10⁵, and the results show that the amplitude can be enhanced by decreasing the number of sides in the cross section. In the tests, the maximum amplitude A = 0.8 m appears at U = 3.0 m/s (Re = 2.42 × 10⁵) with a triangular prism. To examine the effect of cross sections on energy harvesting, Zhu et al. [32] studied the FIM responses and energy conversion characteristics of trapezoidal cylinders with two attack angles (α) and five aspect ratios (d/D), where d is the length of the shorter base, and D is the length of the longer base and the height of the cylinders. The maximum amplitude ratio A* = 0.703 and the maximum active power Pmax = 24.056 mW appear at d/D = 0 (Ur = 10, α = 0°), where the trapezoidal prism becomes a triangular prism, and the maximum energy conversion efficiency of ηharn = 12.151% is also achieved at d/D = 0 (Ur = 9, α = 0°) in the tests. Seyed-Aghazadeh et al. [33] conducted systematic tests on flow past a triangular prism, and the prism oscillates in the transverse direction and different attack angles from 0–60° are analyzed in detail. Liu et al. [34] studied the numerical simulation of flow past a triangular prism, and two cases were conducted in the tests. A stable rotational equilibrium between the triangular prism and the fluid was defined at 90°, which is the same as the 60° arrangement of Seyed Aghazadeh, and was applied as the most common arrangement for a triangular prism. Lian et al. [14] conducted the experiments on soft galloping and hard galloping of spring-mounted triangular prisms with damping coefficient c, system stiffness K, oscillation mass m and section aspect ratio α as the parameters in a water channel. The responses of the triangular prism are described in detail, and the critical damping coefficient CC is developed to distinguish between SG and HG. Zhang et al. [35] from Tianjin University studied the effect of damping ratio on the FIM response and energy conversion for an equilateral triangular prism with constant oscillating mass Mosc and system stiffness K. In the tests, the maximum amplitude ratio A* = 2.71 and the maximum active power Pmax = 53.56 W are achieved. Furthermore, Yan et al. [36] studied the effect of magnetic flux density on FIM response and energy conversion for a triangular prism, the energy conversion system is shown as Figure 1. The results show that the galloping performance of a triangular prism may be changed by increasing excitation voltage, which is related to the total damping Ctotal.
Cylinder-like structures can be found both alone and in groups. To improve the energy conversion of single units, multiple cylinders were applied, and studies show that multiple cylinders in proximity can synergistically work and may harness more energy from the fluid flow than the same number cylinders in isolation. Thus, the interaction among the multiple cylinders should also be considered.
Xu et al. [37] conducted the experimental tests on FIM responses of two same elastically mounted circular cylinders arranged in tandem in a water channel. The Reynolds number of 2.86 × 10⁴Re ≤ 1.14 × 10⁵ and four different gap ratios (L/D = 1.57, 2.57, 3.57, 4.57) were applied. In the tests, galloping-like vibrations can be observed on the upstream cylinder at a smaller gap ratio. Liu et al. [38] studied the flow-induced rotation of two rigidly coupled circular cylinders arranged in tandem experimentally, a large spacing ratio range of 4.0 ≤ L/D ≤ 9.0 was applied as well as the total oscillation responses were presented and analyzed in the study. Gao et al. [39] studied the FIV responses of two rigidly coupled circular cylinders with four incidence angles (α) and two gap ratios (G) numerically. For a larger gap ratio G = 4D (D is the diameter of each circular cylinder), the strong wake interference between the two cylinders can be significantly observed at α = 0. Ding et al. [40] simulated the FIM responses of multiple PTC cylinders numerically to enhance the amplitude and harvest more energy from fluid flow. Four configurations with one, two, three, and four cylinders were applied in the study at 3 × 10⁴Re ≤ 1.2 × 10⁵. Analyzing the vortex patterns of multiple cylinders arranged in tandem, it is found that the vortex shedding of the first cylinder may influence the oscillation responses of downstream cylinders. Pinarbasi et al. [41] conducted the experimental tests on flow past two identical square cylinders in tandem for the gap ratio range 0.5 < L/D < 5 in a large-scale water channel. The results show that the flow separating from the top surface of upstream cylinder impinges and reattaches on the lateral surface of the downstream cylinder. To improve the energy conversion of a circular cylinder arranged elastically in a wind tunnel, a rectangular plate was fixed rigidly behind the cylinder, and three heights and varied distances between the cylinder and the plate were applied in the experiments [42]. The results show that a 2D-high (D is the diameter of the circular cylinder) plate placed around 0.2D–0.4D downstream of the circular cylinder has the most effective effect on energy conversion of the system. Gu et al. [43] studied the effect of spacing on the vortex-induced vibration for two elastically tandem diamond cylinders, and in the numerical investigation, the nondimensional center-to-center gap ratio (G) varied from 2 to 6. The results show that the reattachment and co-shedding phenomenon appear when the spacing ratio is smaller (G = 2 and 3), but the co-shedding phenomenon only appears at a larger spacing ratio (G = 4–6). Xu et al. [44] studied flow-induced vibration of a flexible splitter plate attached behind a square cylinder numerically. The vortex shedding of the upstream square cylinder excites the vibration of the flexible plate, which can be observed significantly in the tests. Shao et al. [45] studied and analyzed the FIM responses and energy conversion of two T-section prisms arranged in tandem. In the tests, the maximum active power Pharn = 30.12 W of the oscillation system appears at Ur = 12.25 for L/D = 6 and RL = 11 Ω, and it is 1.5 times that of the isolated prism. Zhang et al. [46] studied the FIM responses and energy conversion of two tandem cylinders with various cross sections (Triangular prism, square prism, pentagon prism, circular cylinder, and Cir-Tria prism). A high damping ratio ξtotal = 0.1076, low mass ratio m* = 0.93 and a gap ratio range of 2–50 were applied in the tests. The amplitude ratio and oscillation frequency were analyzed in detail. The results show that the upstream Cir-Tria prism gives higher active power, in the tests, A* = 1.17, P ≈ 0.26 W, and ηharn = 26.5% are achieved. Shao et al. [47] conducted the experiments on FIM responses and energy conversion for two triangular prisms in staggered arrangement with variable parameters. High active power of Pharn = 26.43 W is observed at Ur = 11 (L/D = 6, RL = 13 Ω), which is much higher than that of an isolated triangular prism (Pharn = 15 W, RL = 13 Ω). For all the typical cross-sectional cylinders, the active powers of single units have been improved. For a circular cylinder with an attached free-to-rotate pentagram impeller, the maximum active power is 16.8 W [28], while the maximum active can reach 20 W with a PTC cylinder [24]. For the triangular prisms, the maximum active power Pmax = 26.43 W is observed in the study of Shao et al. [47], with two triangular prisms in staggered arrangement. The superiority of triangular prisms has been presented significantly in order to explore the FIM responses and energy conversion characteristics of two rigidly coupled triangular prisms arranged in tandem, and this paper presents experimental tests with stiffness, gap ratio, and load resistance as parameters.
This paper is organized as follows. First, the experimental setup, physical models, and the free decay test are organized in Section 2. Secondly, in Section 3.1, the overall oscillation response of the two rigidly coupled triangular prisms (TRCTP) is presented and analyzed. Then, in Section 3.2, the effects of the stiffness, gap ratio, and load resistance on FIM responses, including amplitude and frequency responses, are discussed, respectively. In Section 3.3, the energy conversion characteristics are analyzed. Two gap ratios of L/D = 1.5 and L/D = 4 are considered for the analysis of active power and energy conversion efficiency. Finally, the main conclusions are summarized.

2. Experimental Methods
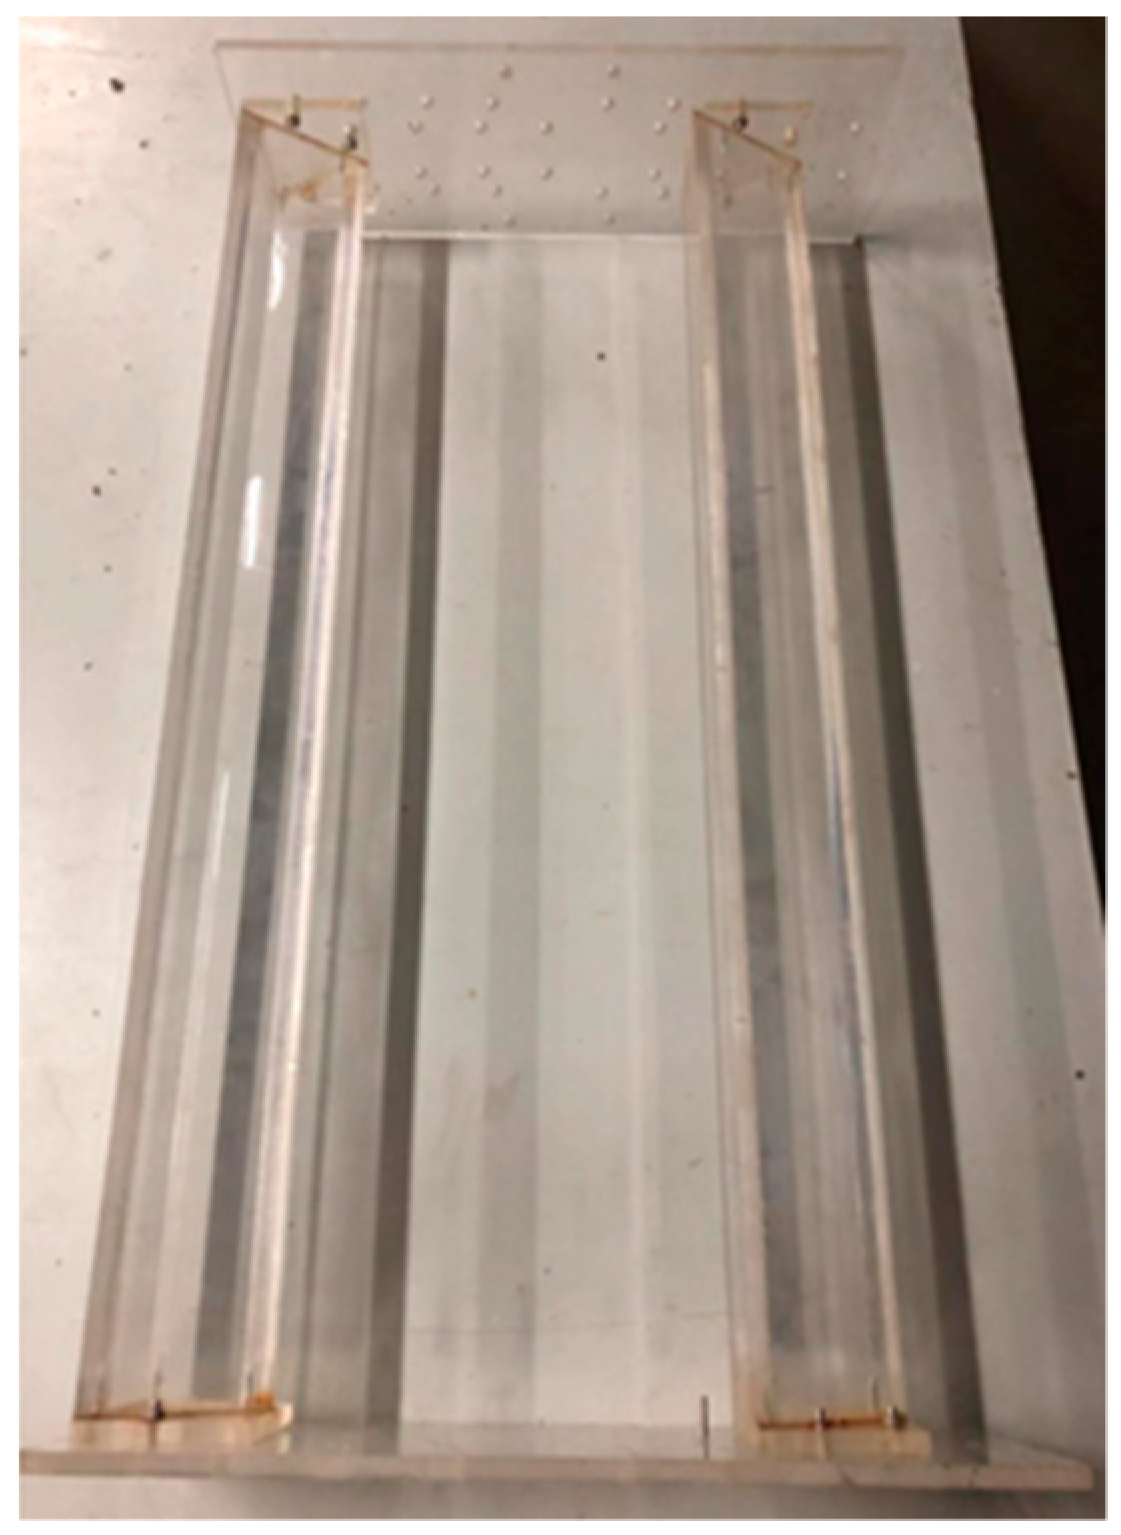
2.1. Physical Model

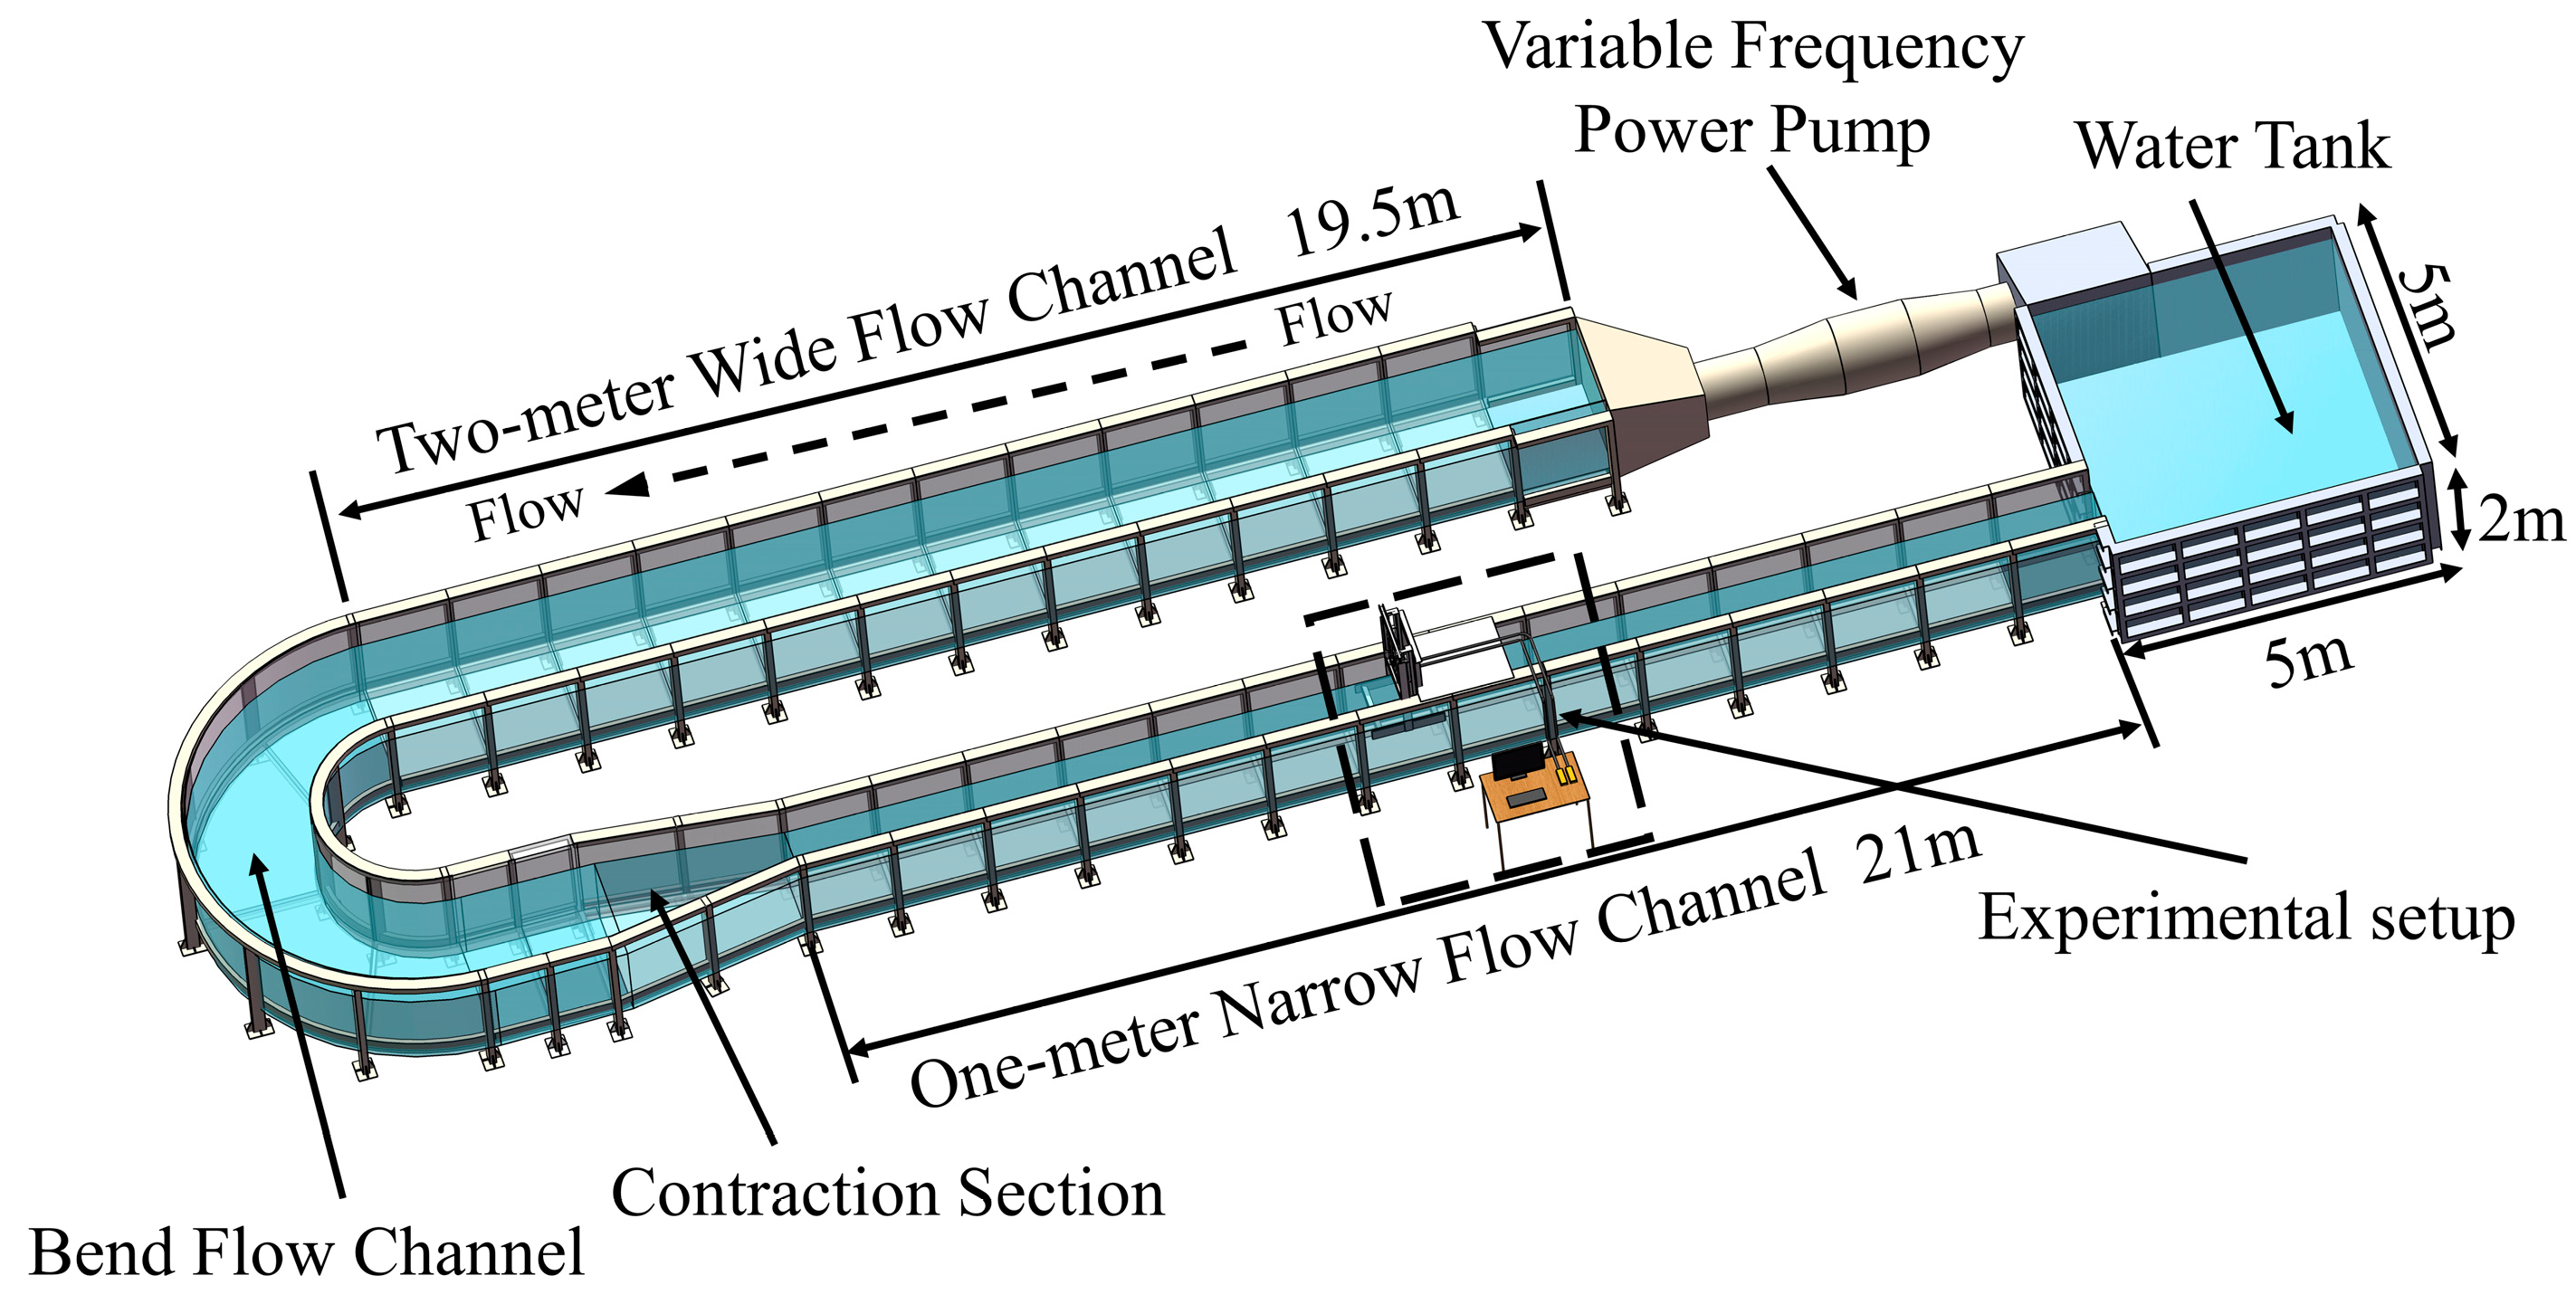
2.1.1. Recirculating Water Channel

All the experiments in this paper were conducted in the recirculating water channel. As shown in Figure 2, the recirculating water channel consists of five parts: the water tank, the variable frequency power pump, the 2 m wide flow channel, the bend flow channel, and the 1-m wide flow channel, where the experimental setup is placed. The channel can store 300 m3 water with a whole length of 50 m. The dimension of the water tank is 5 m (length) × 5 m (width) × 2 m (height). The maximum power of the variable frequency power pump is 90 kW and the water depth in the tests is controlled at 1.34 m. The Reynolds number of the experiments covers the range of 34,504 ≤ Re ≤ 125,712 (0.395 m/s ≤ U ≤ 1.438 m/s) in the TrSL3 (20,000 ≤ Re ≤ 300,000) flow regime.

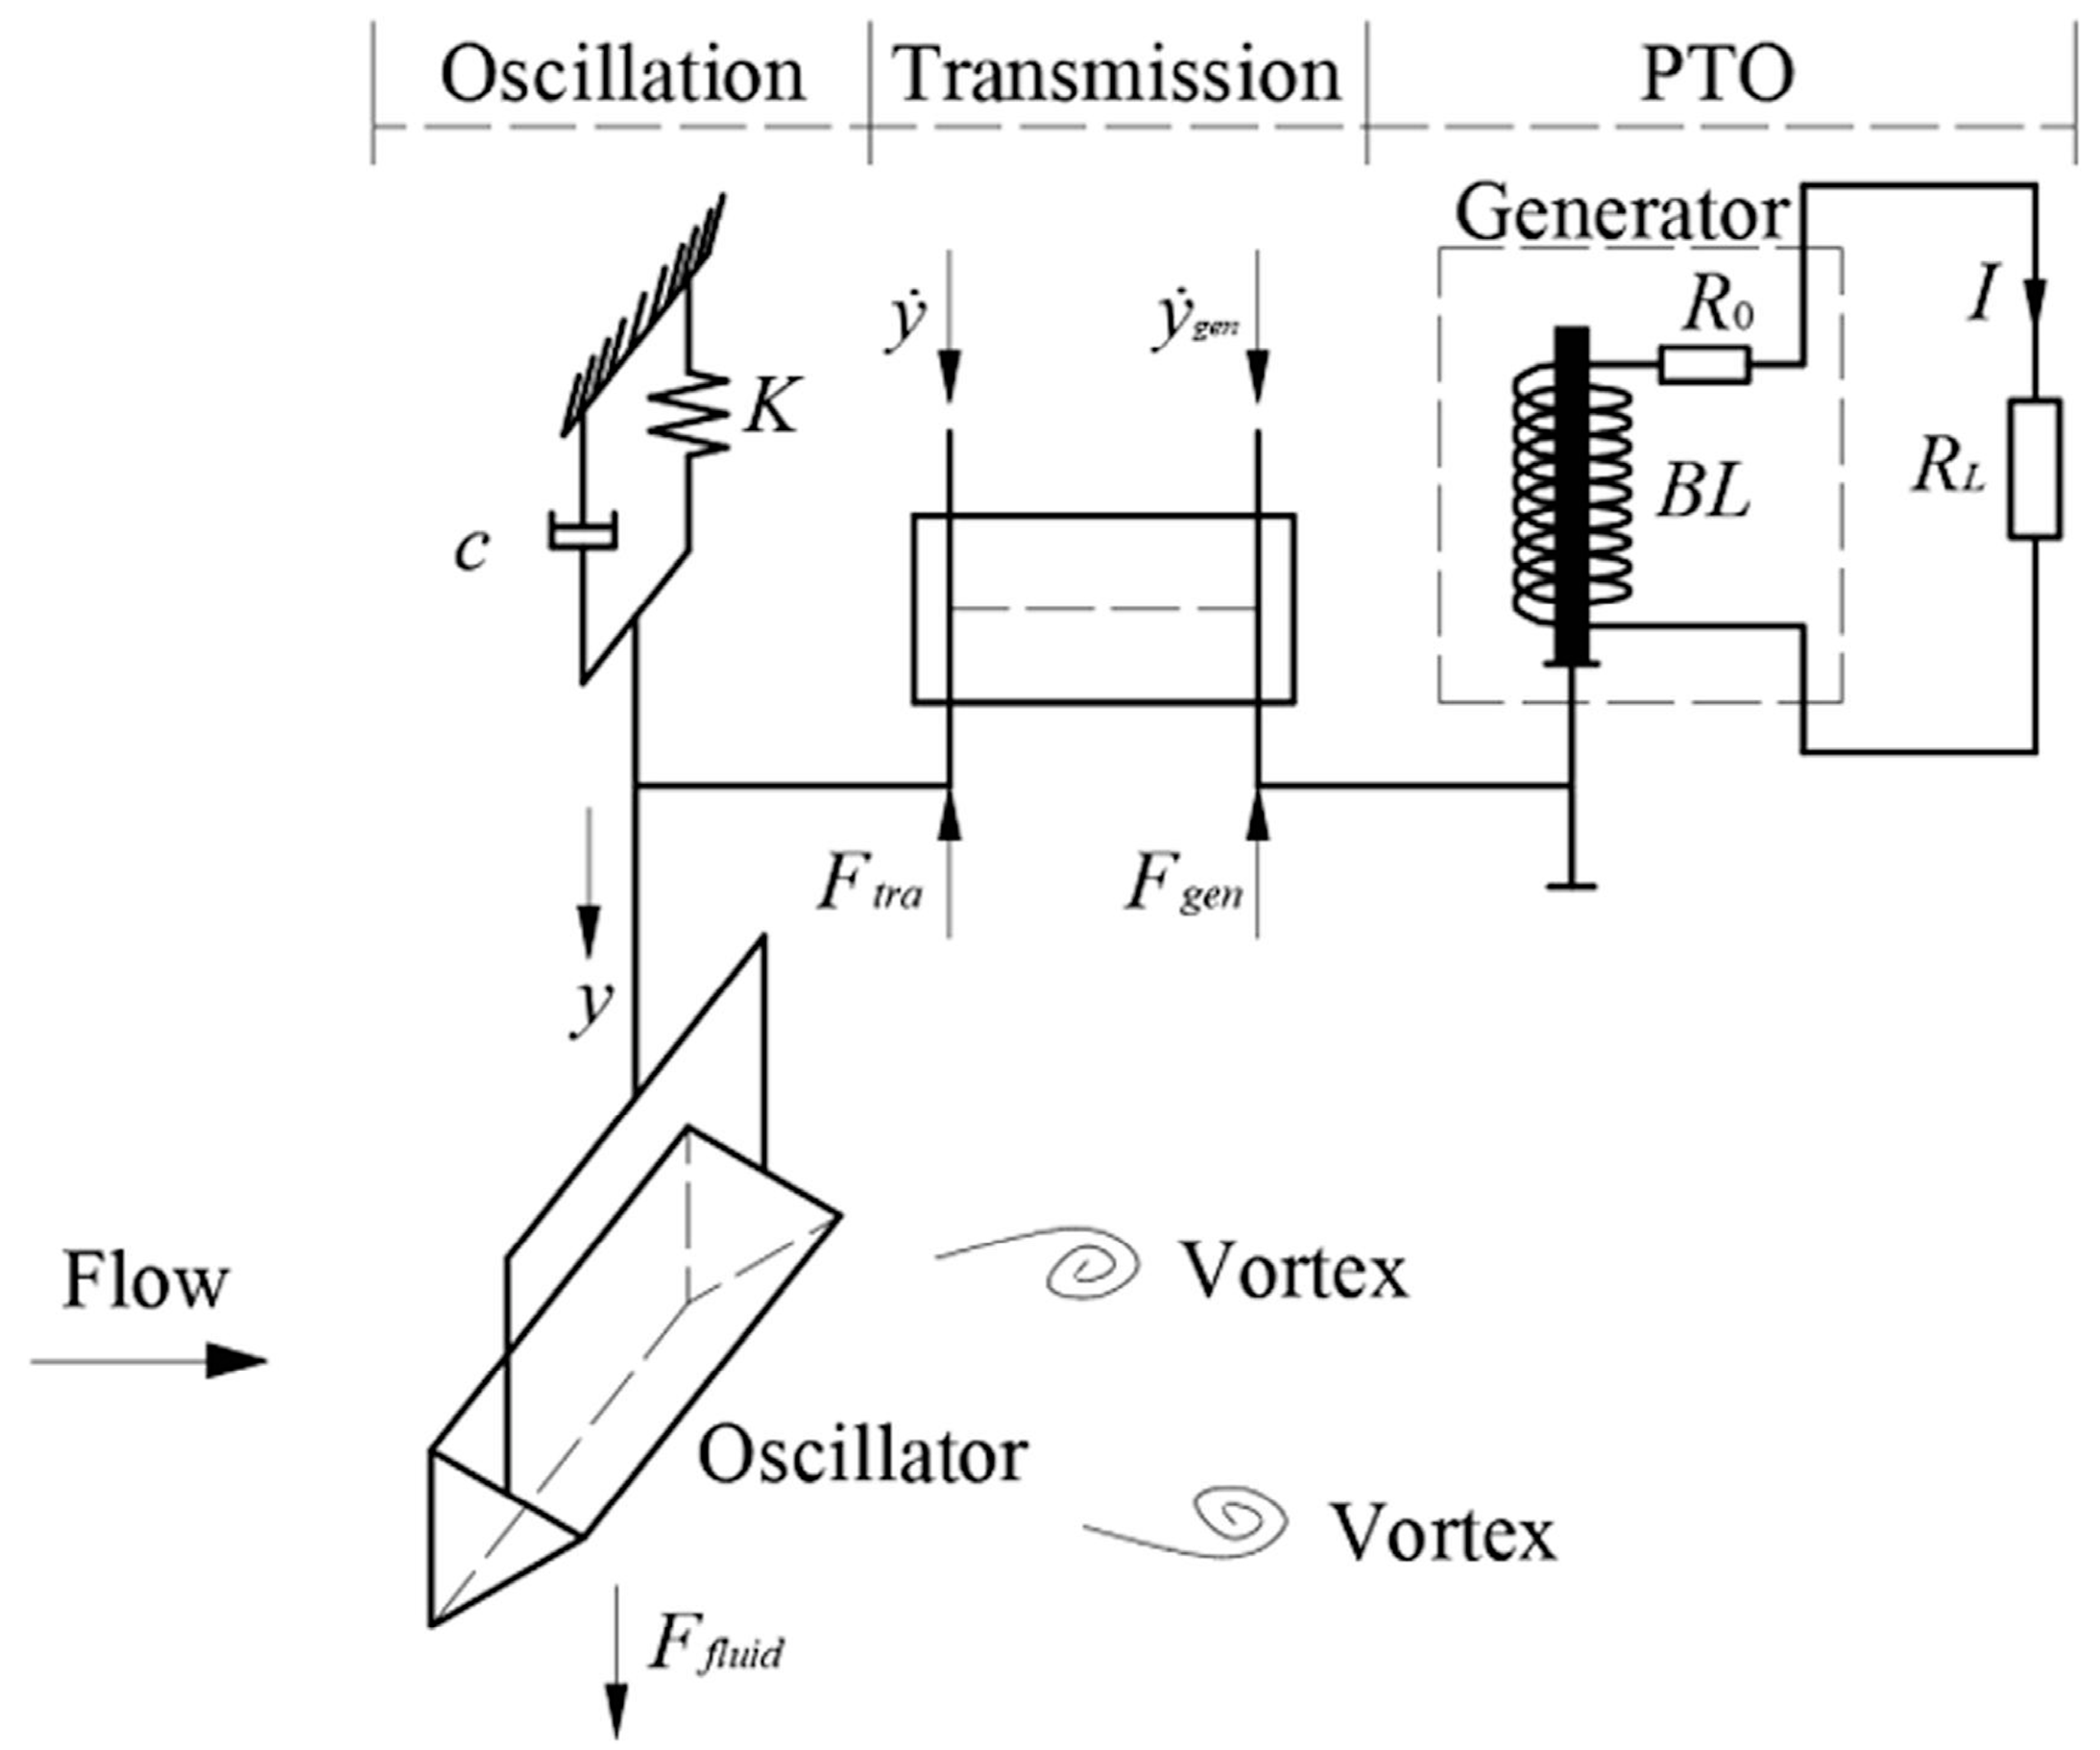
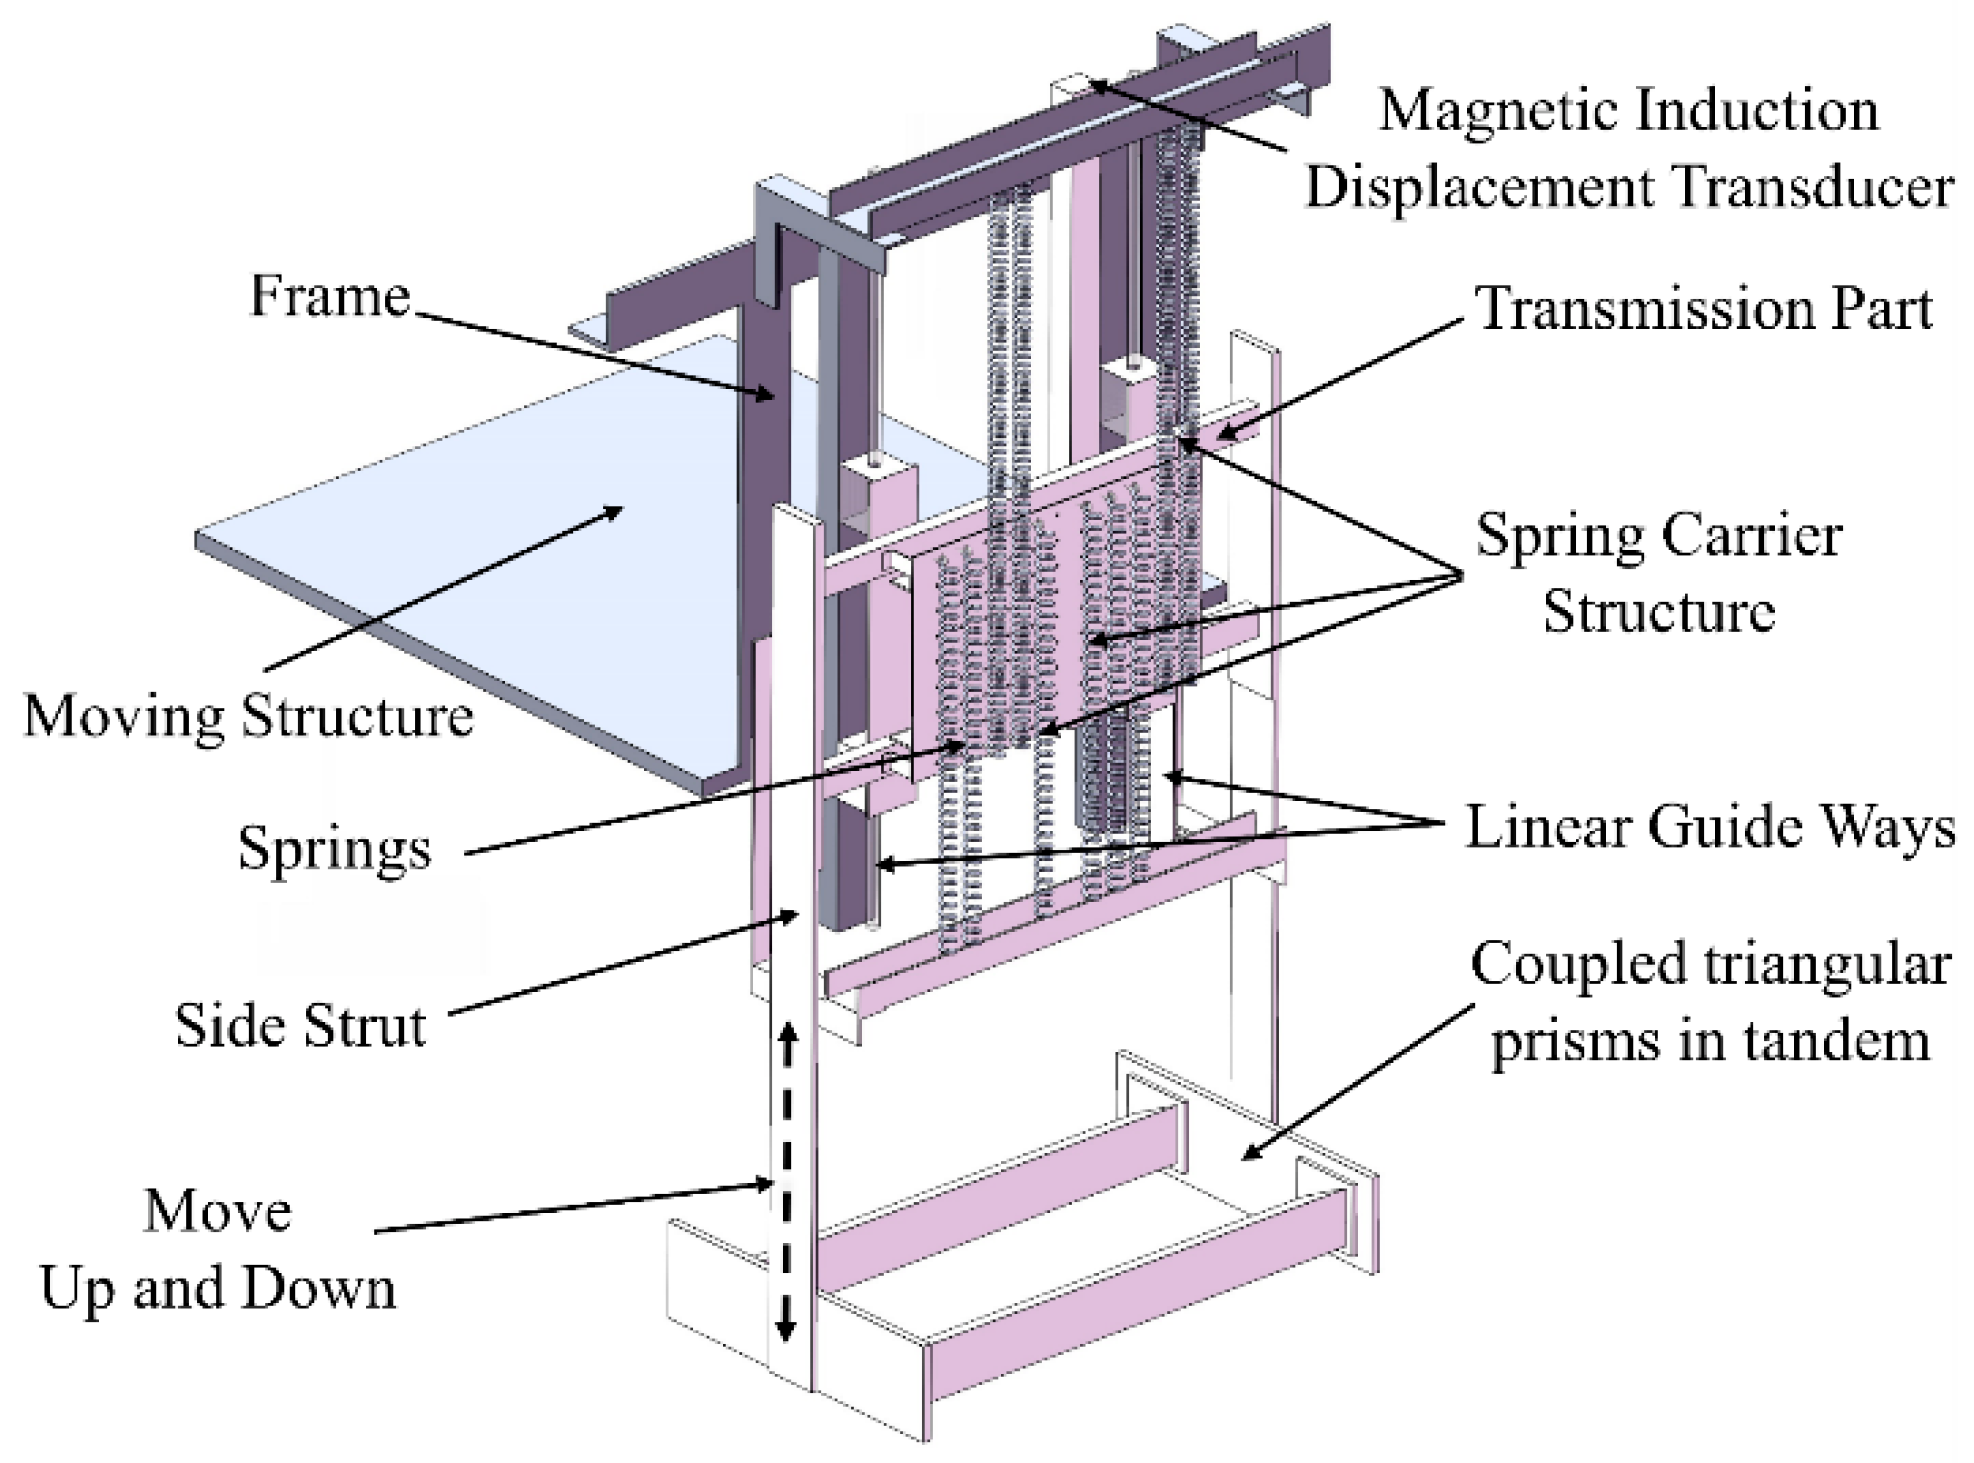
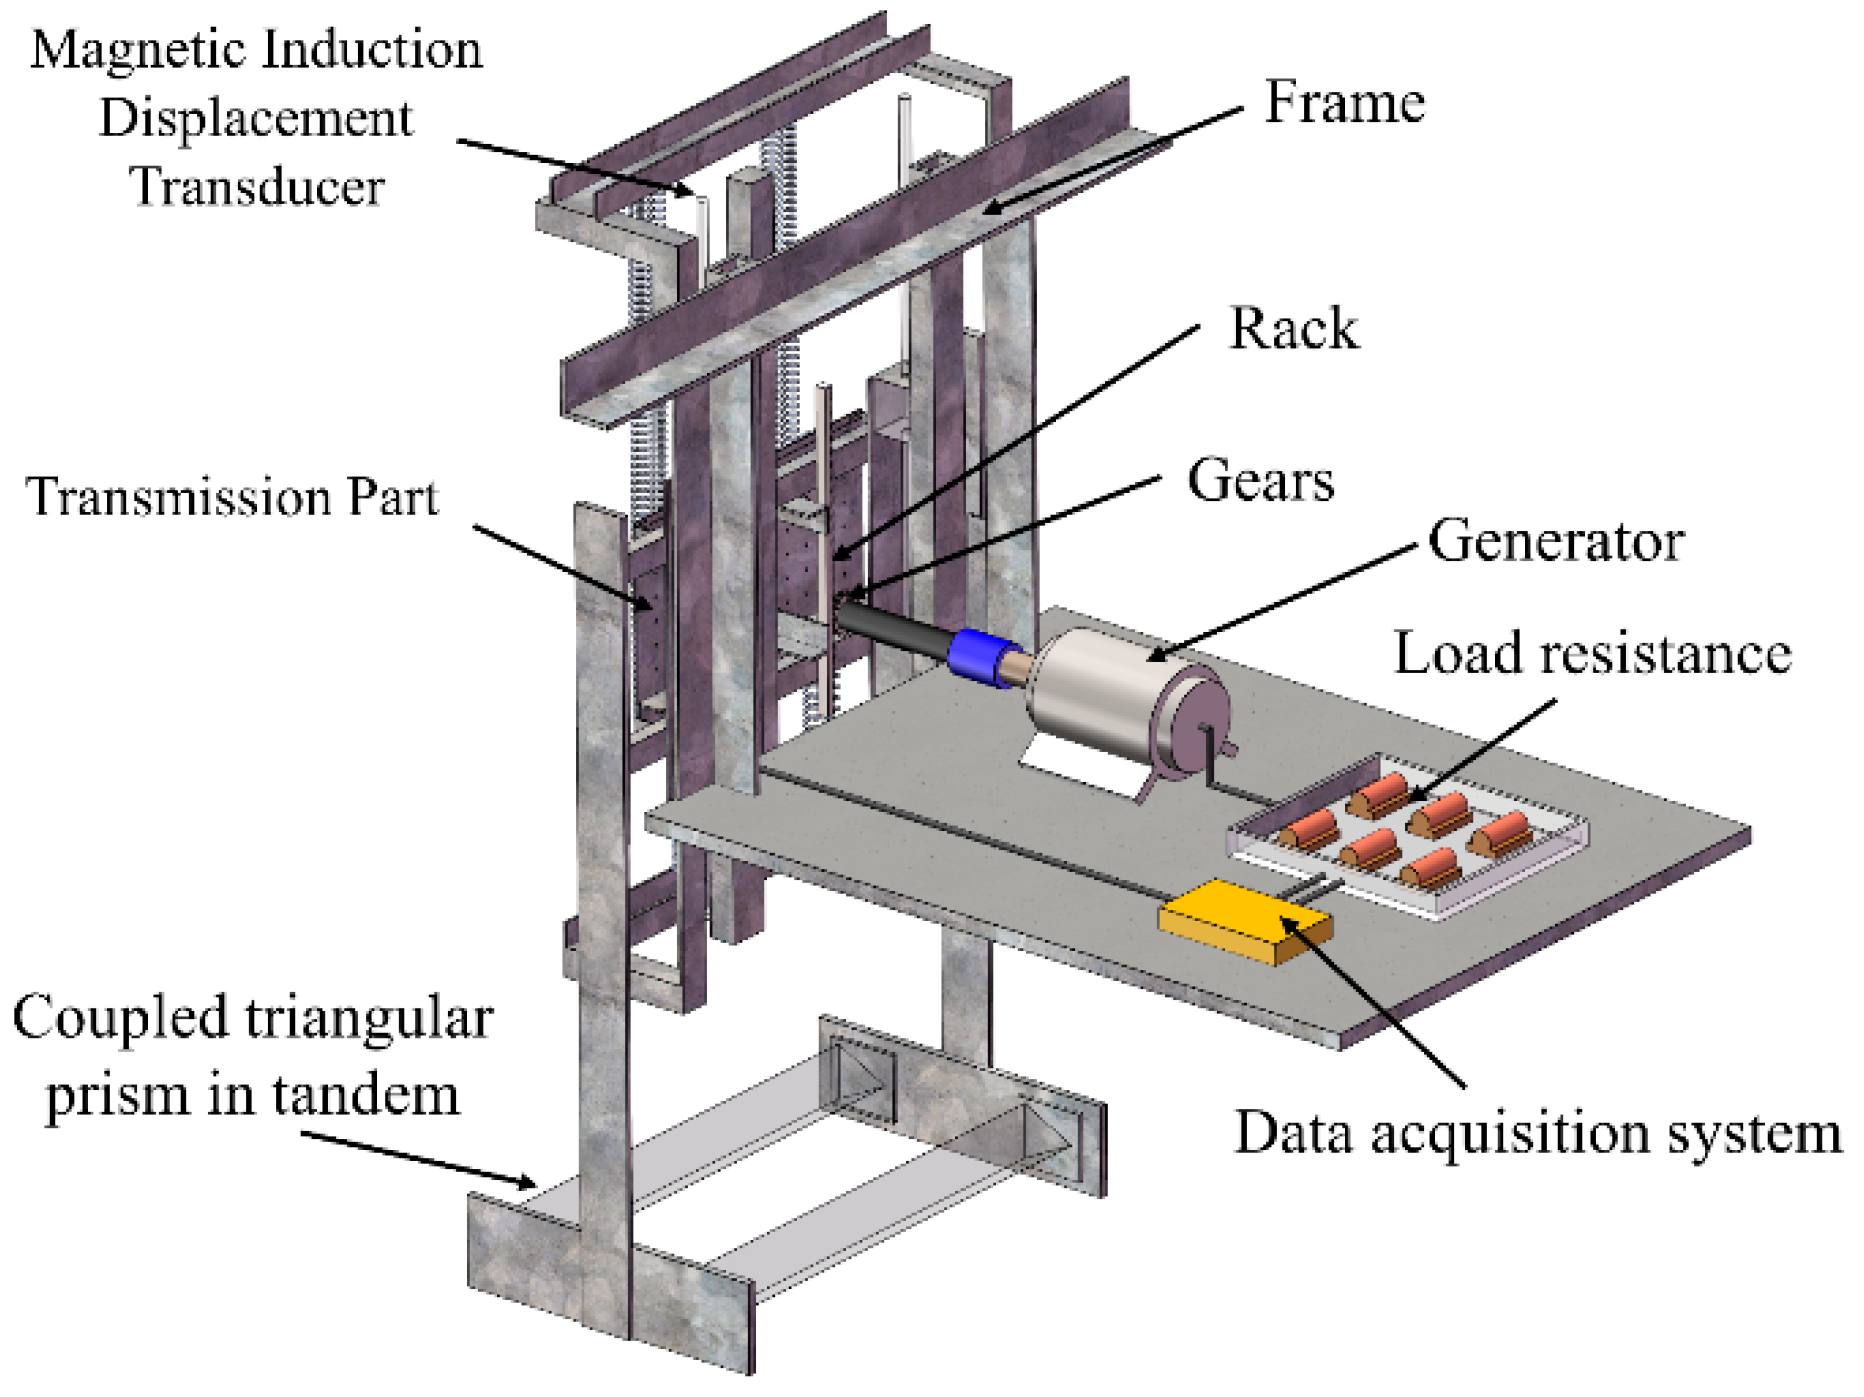
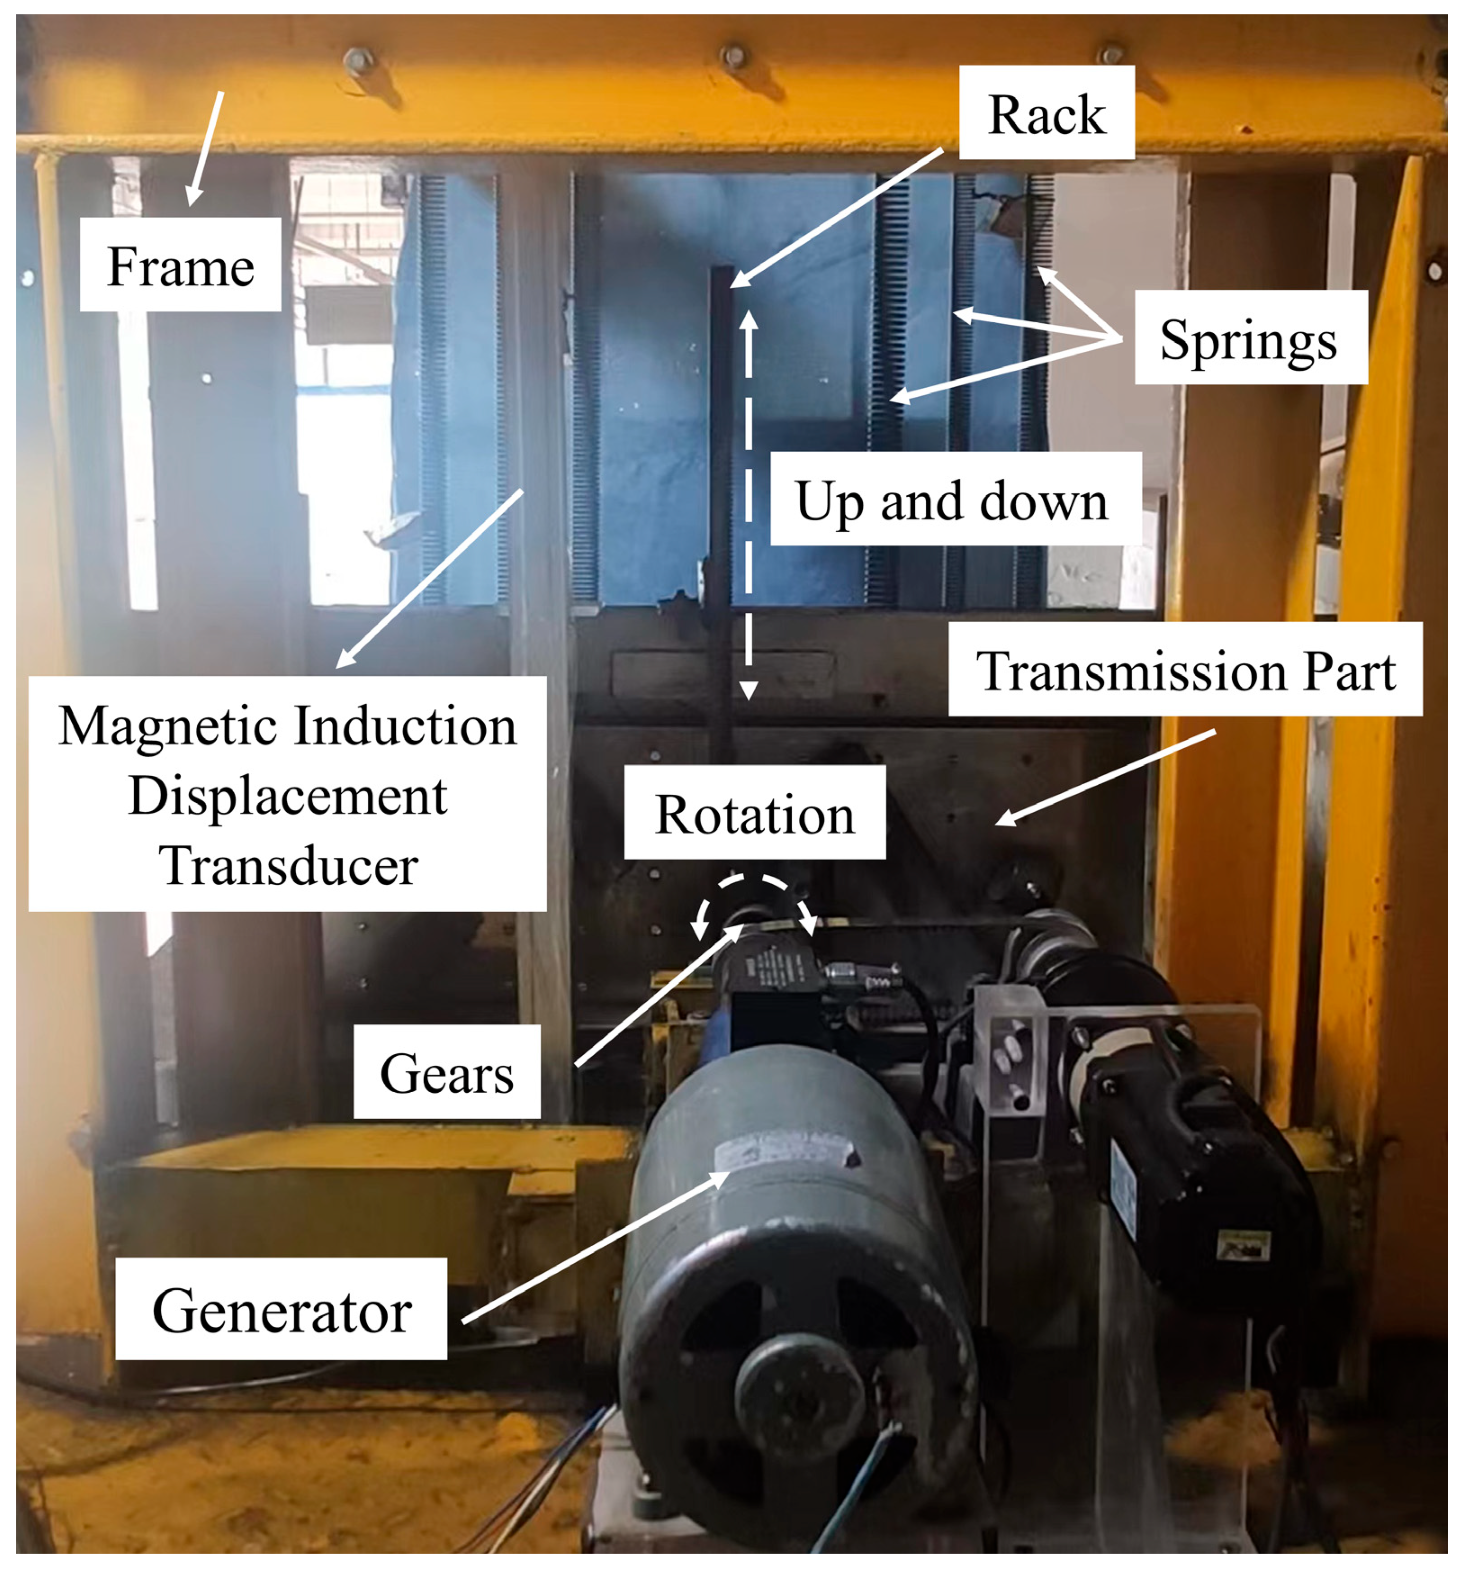
2.1.2. Oscillation and Energy Conversion System

In Figure 3, the oscillation system consists of twelve main parts: the frame, side strut, moving structure, springs, magnetic induction displacement transducer, transmission part, spring carrier structure, linear guide ways, bearing, the coupled triangular prisms, rack, and gears.
The frame is made of steel and fixed in the moving structure which can move freely on the top of the 1 m wide flow channel. The linear guide ways attached onto the steel frame are perpendicular to the direction of the incoming flow and parallel to the side struts, and are made up of stainless steel with a width of 20 mm and a length of 1500 mm. The transmission part is fixed to the linear guide ways by four linear bearings (two on the left and two on the right), therefore the triangular prisms can only move in a vertical direction in the water channel. There are spring carrier structures arranged on the transmission part regularly, and the two ends of the springs are connected vertically on the frame and the transmission part, forming an integrated linear reciprocating system.
In Figure 4, the energy conversion system consists of three main parts of the generator, load resistances, and the data acquisition system. In Figure 5, the transmission part is connected to the rotor of the generator by the gears, and the rack is fixed into it. The linear motion of the prism is transferred to the rotational motion of the generator rotor to cut the magnetic induction lines. The generator transmits electrical power to the load resistances by the output wire to simulate power consumption. The voltage signal wire transmits the voltage of load resistance to the data acquisition system, which collects the output voltage time history and the displacement time history transmitted by the magnetic induction displacement transducer in real time and provides data for the subsequent analysis of oscillation and energy conversion characteristics.

2.2. Coupled Triangular Prisms

As shown in Figure 6, the triangle with side length D = 0.1 m and height H = 0.1 m is applied as the cross section of an isolated triangular prism, and the coupled triangular prism combines two identical isolated triangular prisms rigidly with a settled distance in tandem. Rectangular endplates are installed at both sides of the prisms to decrease the effect of boundary, and the thickness of the endplate is selected as 0.01 m. In the tests, all the prisms and end plates are made of plexiglass, as shown in Figure 7. The projection width of the prism in the direction of incoming flow is 0.1 m and the length of the prism is selected as 0.9 m. In order to explore the oscillation response and energy conversion characteristics of the TRCTP, five gap ratios (L/D = 1, 1.5, 2, 3, 4) are selected in the experiments, where L is the horizontal center-to-center distance between the two coupled prisms.

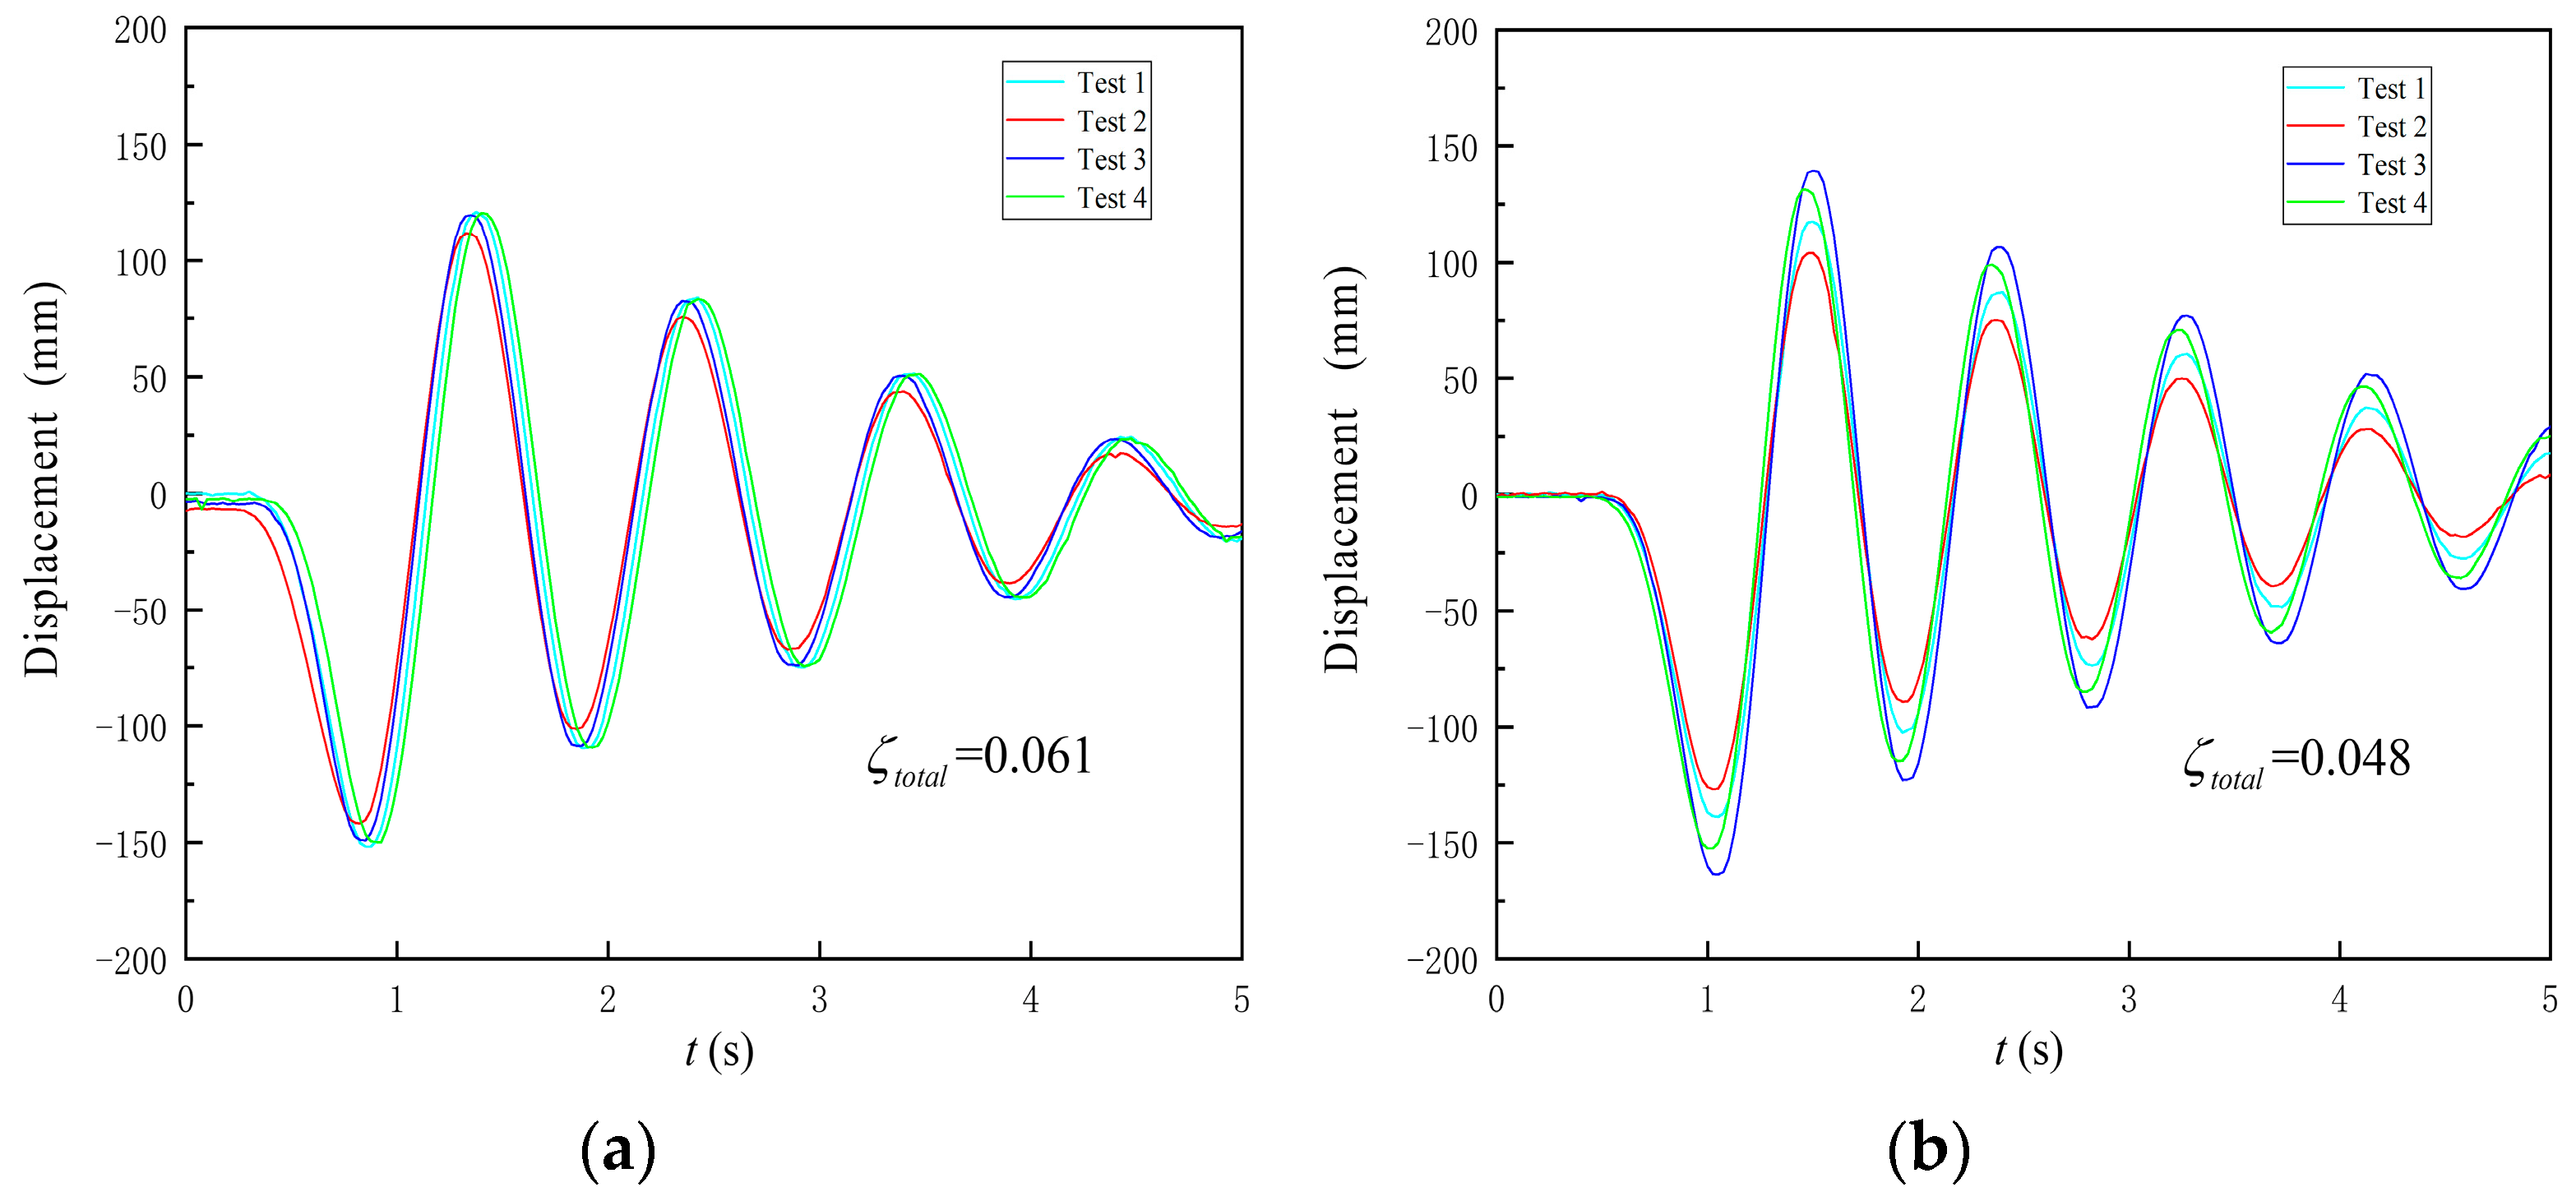
2.3. Free Decay Test

The natural frequency and damping ratio of TRCTP in the air were measured by the free decay test. In order to reduce the measurement error, four tests were conducted for each stiffness and resistance, and the average value of the four tests was taken. The results are shown in Figure 8.
The calculation formula for natural frequency of the system:
f n = 1 2 π K m o s c
where fn is the natural frequency of the system in the air, K is the stiffness, and mosc is the oscillation mass of the system.
The damping ratio of the system can be calculated by:
ζ a i r = ln η 2 π = 1 2 π ln ( A i A i + 1 )
where Ai is the ith peak amplitude and ζair is the damping ratio of the system in the air, which is derived as:
ζ a i r = C t o t a l 2 m o s c K
C t o t a l = 2 m o s c K ζ a i r
The natural frequency of the system was calculated by Equations (1)–(3), as shown in Table 1 and Table 2. In the free decay tests under different stiffness, the DC generator was in open circuit, and only mechanical damping existed in the system. The total damping error for different stiffness is within the allowable range of experimental error (less than ± 5%).

3. Results and Discussion

In the following oscillation tests of TRCTP, the DC generator is in open circuit (the oscillation system has only mechanical damping) and the gap ratio and stiffness are selected as the parameters for oscillation tests, which aims to explore the oscillation characteristics of the TRCTP, and the test parameters are shown in Table 3.

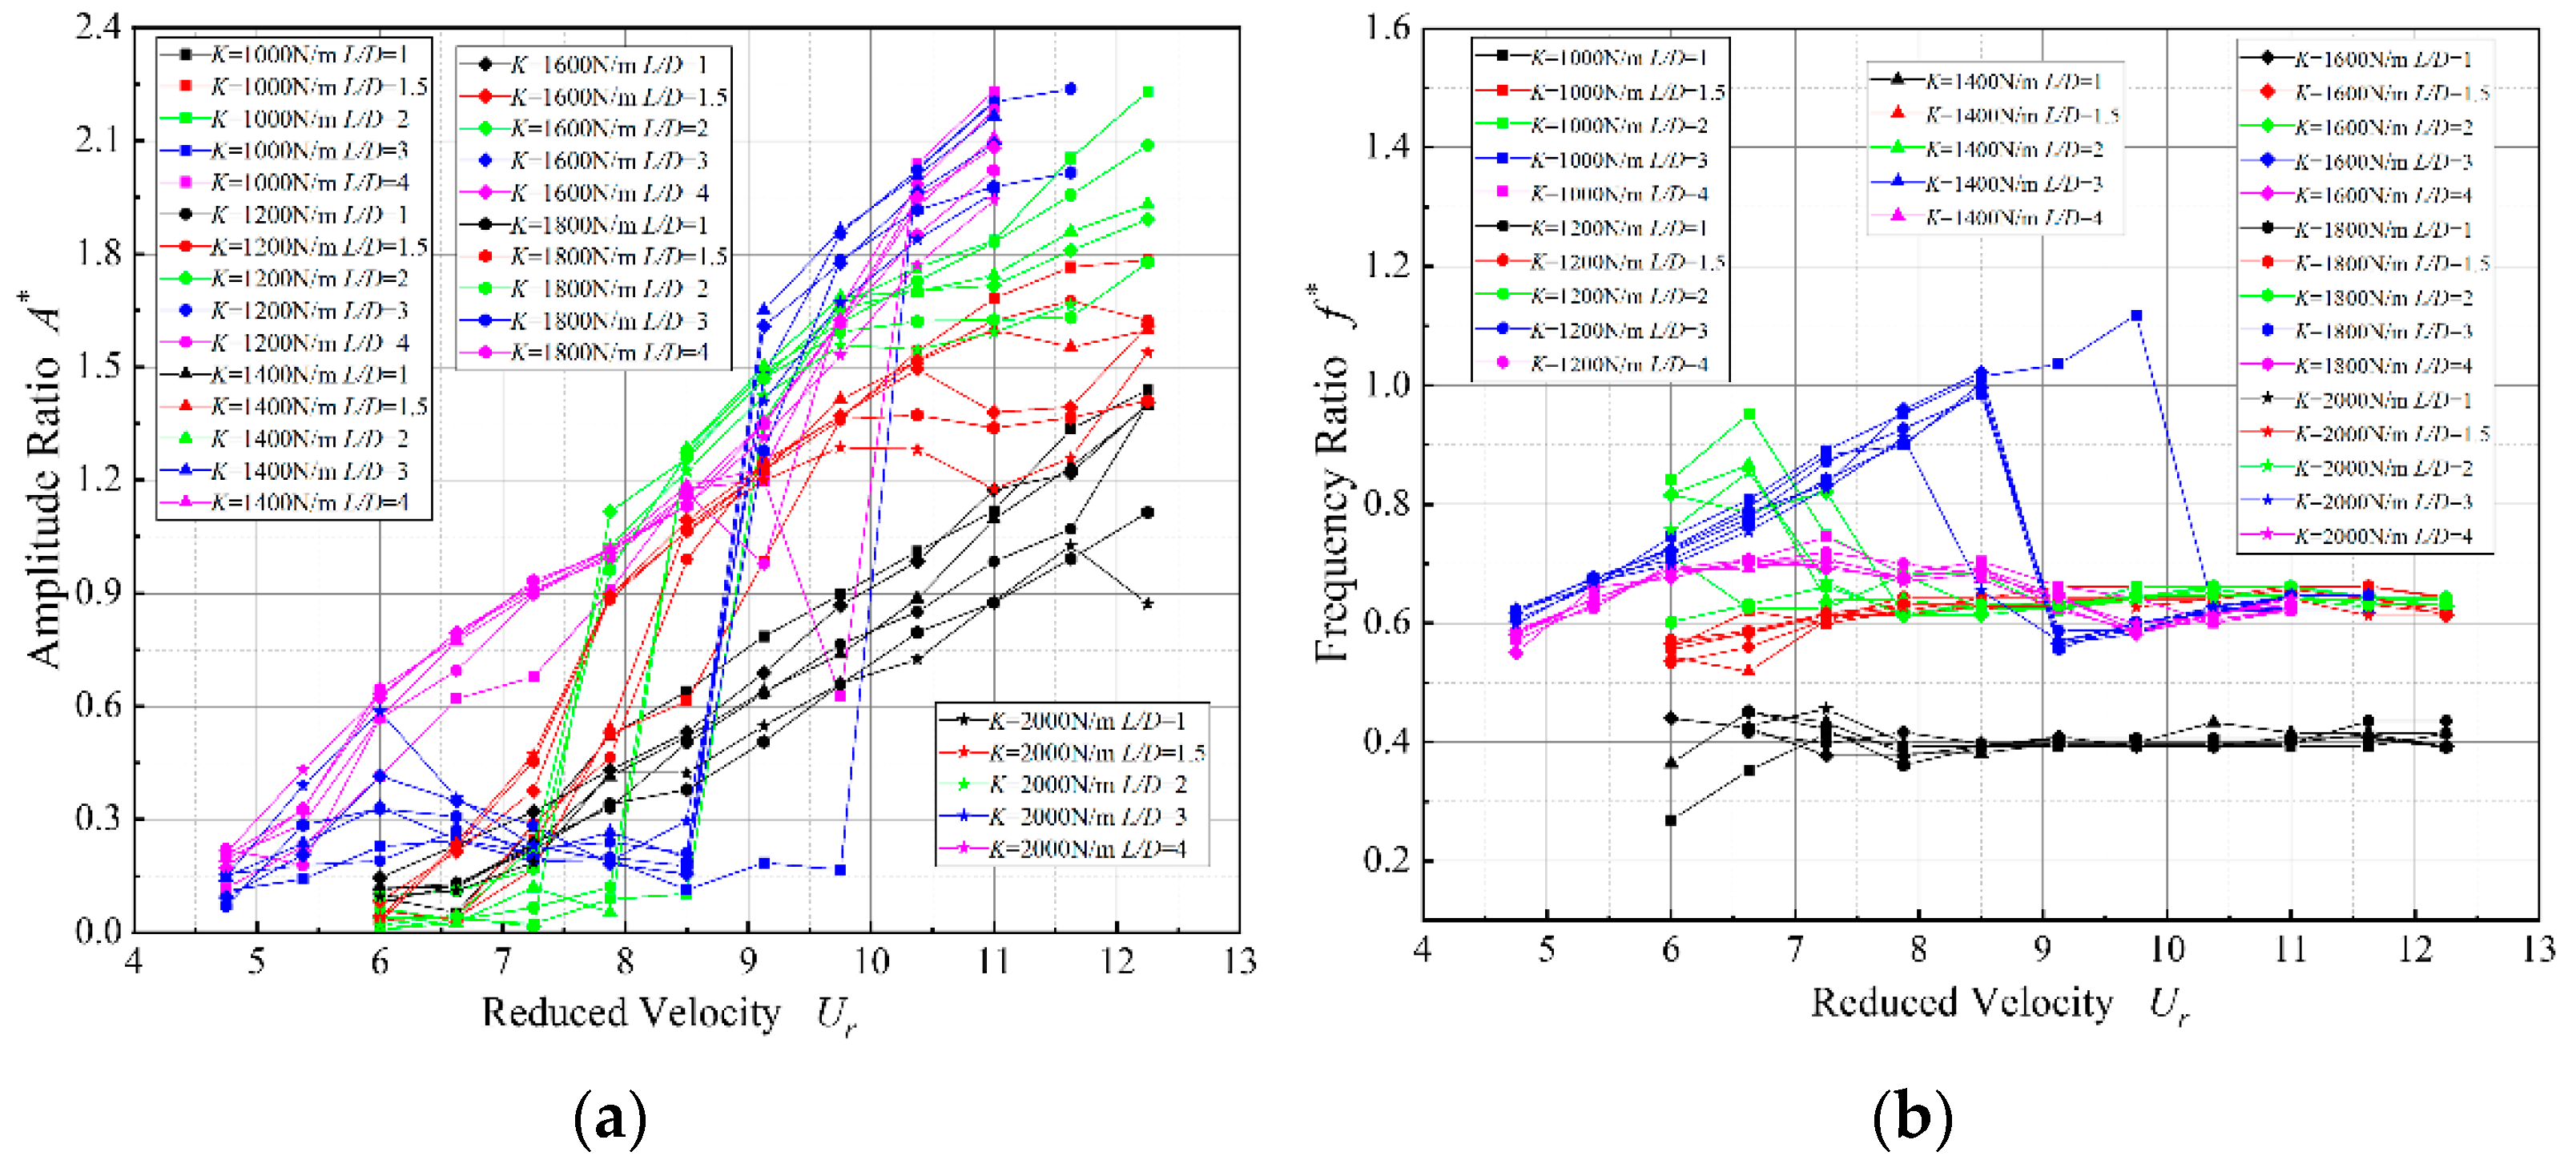
3.1. Overall Oscillation Response

For L/D = 1, the TRCTP starts to oscillate at Ur = 6. In the range of 1000 N/m ≤ K ≤ 1600 N/m, A* continues to increase as the reduced velocity grows without a downtrend, and the maximum amplitude ratio is 1.78 (Ur = 12.5, K = 1600 N/m). In the case of 1800 N/m ≤ K ≤ 2000 N/m, the oscillation is suppressed at a higher reduced velocity, as shown in Figure 9a. In the initial branch, the oscillation frequency of TRCTP is fluctuant but it mainly concentrates in 0.4–0.45 and tends to be stable gradually with the increasing reduced velocity. Compared with the isolated triangular prism, both the amplitude ratio and frequency ratio of TRCTP are smaller.
For L/D = 2, the TRCTP starts to oscillate at Ur = 6, where the amplitude ratio is lower than 0.3 and the oscillation frequency is not stable. With the increase of reduced velocity, the amplitude ratio appears the “sharp jump” phenomenon, then the TRCTP oscillates with larger amplitude and lower frequency. In the range of 1600 N/m ≤ K ≤ 2000 N/m, the “sharp jump” appears at Ur = 7.25–7.875. The amplitude ratio of TRCTP increases from 0.2 to 0.98–1.1, and the corresponding frequency ratio decreases from 0.68–0.82 to 0.62. In the case of 1200 N/m ≤ K ≤ 1400 N/m, the “sharp jump” appears at Ur = 7.875–8.5, and the amplitude ratio of TRCTP increases from 0.1 to 1.2 as the frequency ratio decreases. For K = 1000 N/m, the “sharp jump” appears at Ur = 8.5. The amplitude ratio of TRCTP increases from 0.12 to 1.38, and the corresponding frequency ratio decreases from 0.68 to 0.62. As the reduced velocity continues to increase, the amplitude ratio becomes larger, but the corresponding frequency ratio remains in the range of 0.63–0.65. For L/D = 2, the lower the stiffness is, the higher the amplitude ratio is, and the largest amplitude ratio is A*Max = 2.23, which appears at Ur = 12.25 and K = 1000 N/m.
For L/D = 3, there are larger amplitude ratios than the same cases for L/D = 2, and the TRCTP starts to oscillate at Ur = 4.75. With the increase of reduced velocity, the amplitude ratio also appears the “sharp jump” phenomenon. In the range of 1200 N/m ≤ K ≤ 2000 N/m, the “sharp jump” appears at Ur = 8.5–9.125. The amplitude ratio of TRCTP increases from 0.1–0.3 to 1.28–1.641, and the corresponding frequency ratio decreases from 0.95–1.02 to 0.55–0.58. Compared with L/D = 2 for the same case, there are larger amplitude ratios and lower frequency ratios. For K = 1000 N/m, the “sharp jump” appears at Ur = 9.75. The amplitude ratio of TRCTP increases from 0.18 to 2.04 sharply and the corresponding frequency ratio decreases from 1.12 to 0.62. The oscillation of TRCTP enters into galloping branch, and the amplitude ratio is close to that of an isolated triangular prism. Then the amplitude ratio A* continues to increase with the growth of reduced velocity, and the TRCTP oscillates with a larger amplitude and a lower frequency. Due to the limitation of the experimental conditions, the maximum reduced velocity can only increase to Ur = 11 at L/D = 3, and the lower the stiffness is, the higher the amplitude ratio is. The maximum amplitude ratio is A*Max = 2.24 (K = 1200 N/m, Ur = 11.625).
For the gap ratio L/D = 1.5 and L/D = 4, the amplitude ratio of TRCTP increases as the reduced velocity grows without the “sharp jump” phenomenon. For L/D = 1.5, the TRCTP starts to oscillate at Ur = 6. The amplitude ratio increases with the decrease of the stiffness, and the maximum amplitude ratio A* = 1.92 appears at K = 1000 N/m and Ur = 12.875. The oscillation frequency of TRCTP is unstable, which shows a trend to increase first and then it begins to decrease, but mainly concentrates in the range of 0.6–0.65. For L/D = 4, the TRCTP starts to oscillate at Ur = 4.75, and the maximum amplitude ratio A* = 2.23 appears at K = 1000 N/m and Ur = 11. Generally, the frequency ratio of TRCTP is also unstable, but it mainly concentrates in the range of 0.55–0.7. Due to the limitation of the experimental conditions, the reduced velocity for L/D = 4 only increases to Ur = 11.

3.2. Parameter Analysis

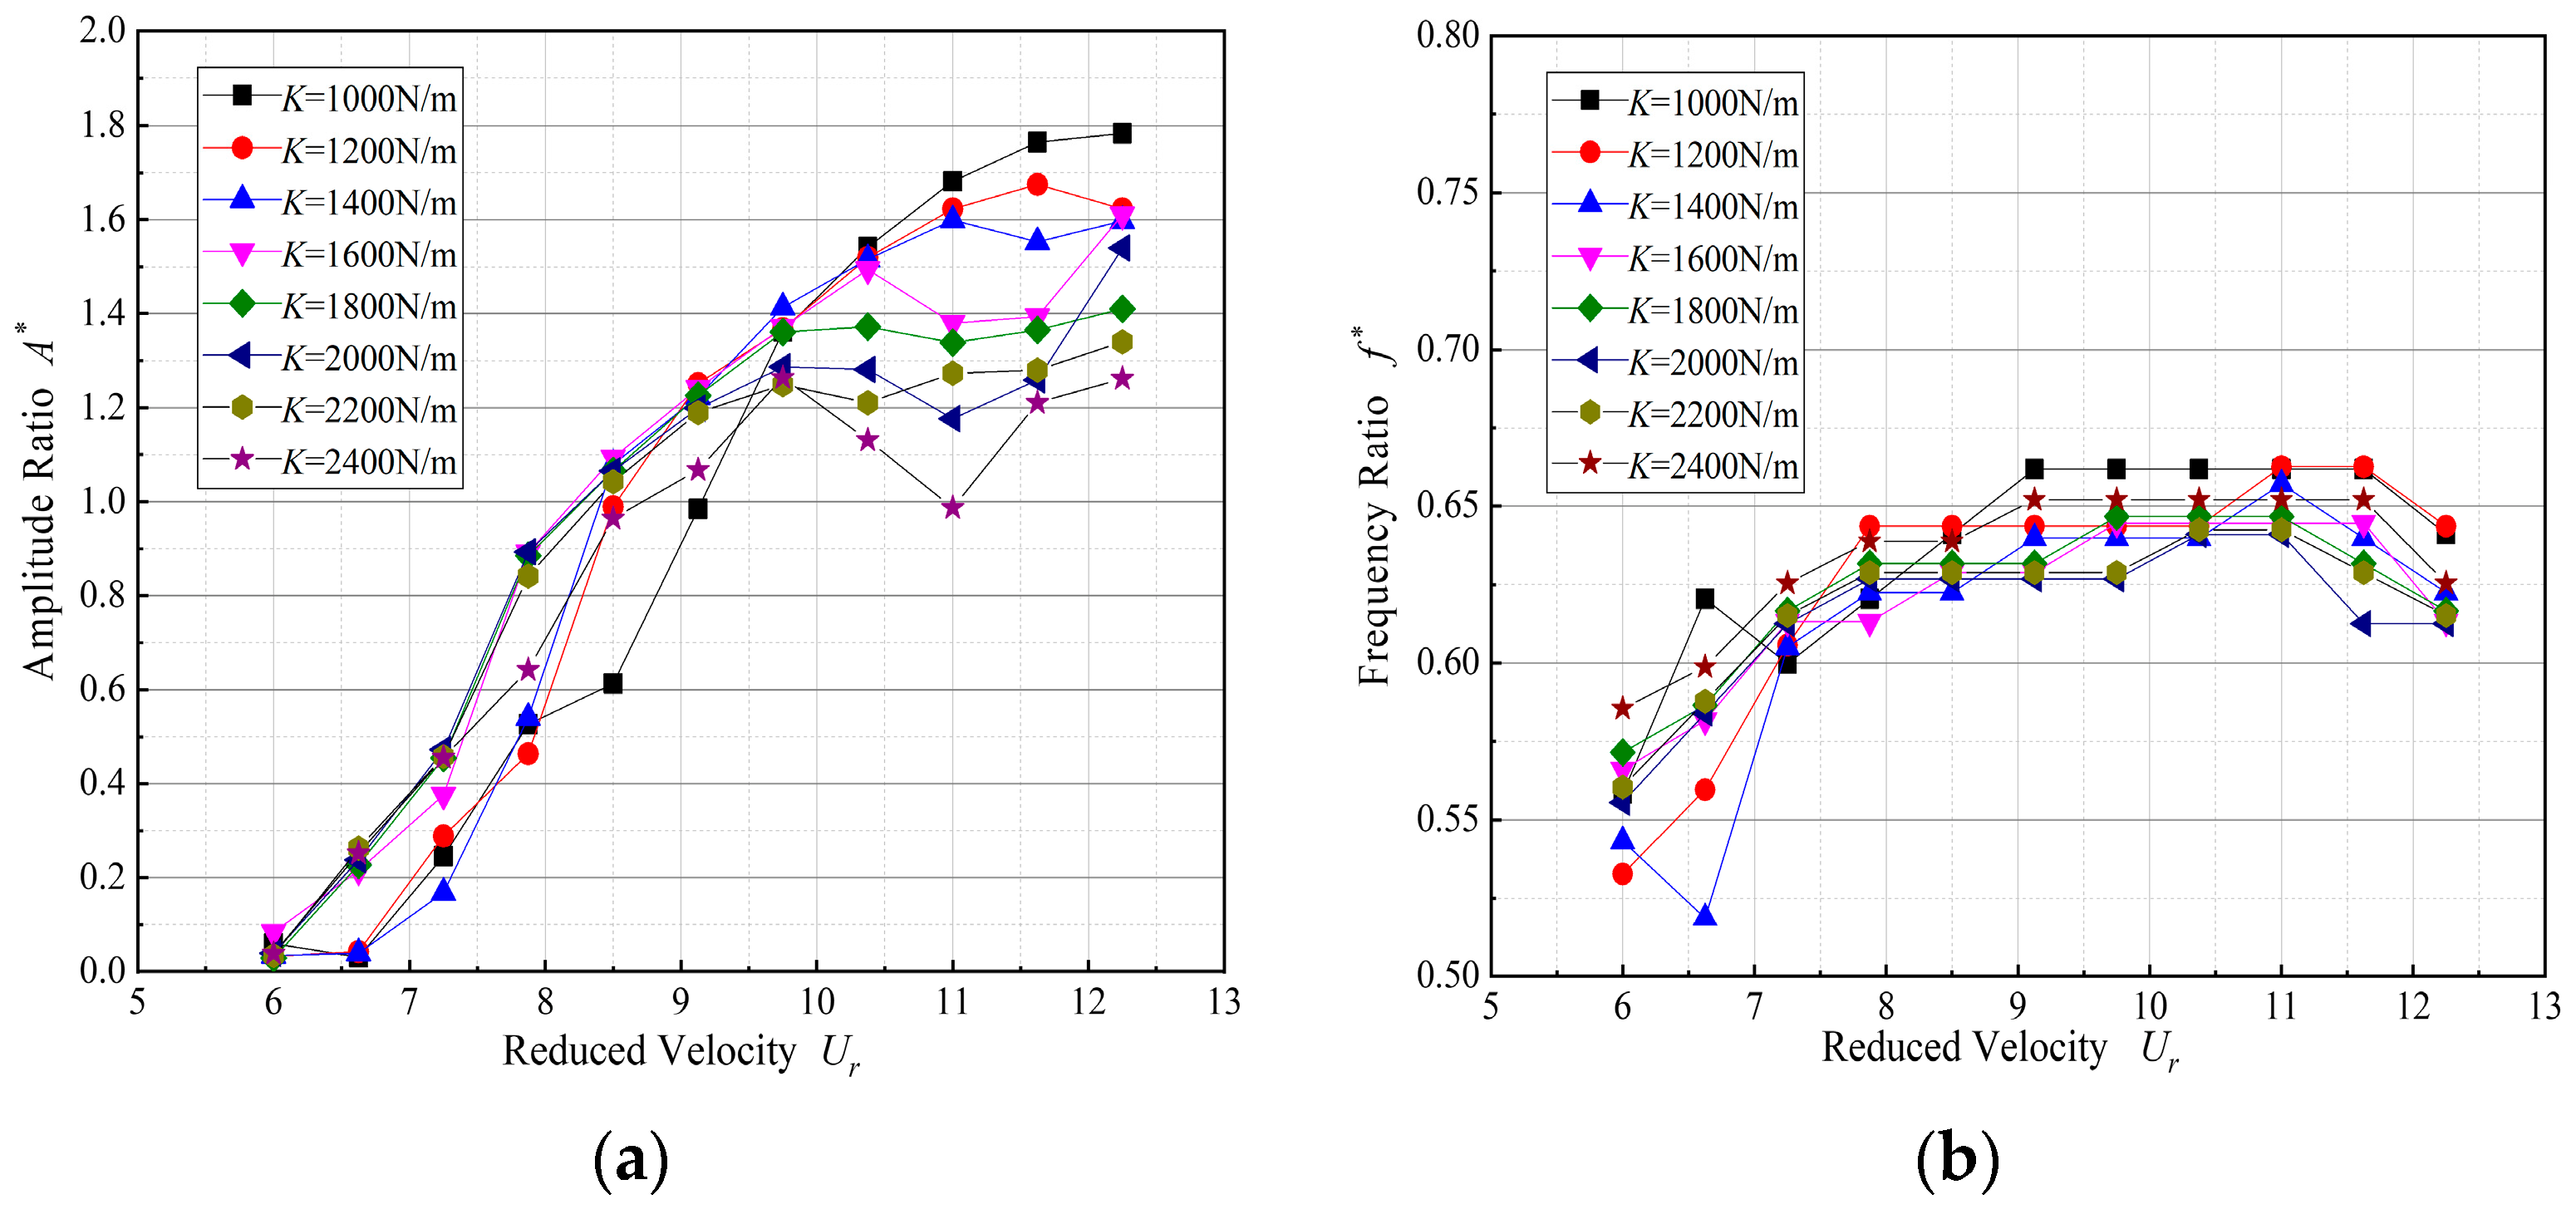
3.2.1. Effects of Stiffness on Oscillation

In the tests above, when the gap ratio is L/D = 1, L/D = 1.5 or L/D = 4, the A* curves increase gradually and linearly without the “sharp jump” phenomenon. According to the results in Section 3.1, the stiffness range is selected as 1000 N/m ≤ K ≤ 2400 N/m and the gap ratio is selected as L/D = 1.5 to explore the effect of stiffness on the FIM responses of TRCTP. In the tests, only mechanical damping exists in the system, and due to the limitations of the experimental conditions, the flow velocity can only increase to Ur = 12.25. The overall oscillation response of the TRCTP can be summarized as follows: (1) The TRCTP starts to oscillate at Ur = 6, and the amplitude ratio increases gradually with the growth of flow velocity, while the corresponding oscillation frequency also rises slowly. (2) For Ur≥ 9.75, the growth rate of amplitude ratio begins to reduce, while the corresponding oscillation frequency tends to be stable. (3) Generally, in the tests, it shows a trend that the smaller the stiffness is, the higher the amplitude ratio is, and the maximum amplitude ratio is A* = 1.78, which appears at K = 1000 N/m and Ur = 12.25. (4) The frequency ratio of TRCTP is unstable. It first increases and then begins to decrease at Ur = 11, but mainly concentrates in 0.6–0.65. Generally, the oscillation response of the TRCTP has identical rhythm with the isolated triangular prism, but the amplitude and oscillation frequency of TRCTP are relatively lower, as shown in Figure 10.
Figure 11 shows the time history of the displacements for the isolated triangular prism and TRCTP (L/D = 1.5), and the comparison of the dominant frequencies extracted by Fast Fourier Transform (FFT) at Ur = 11 (K = 1400 N/m). The results show that the oscillation of TRCTP is very regular and the time history of displacement is stable at Ur = 11. The amplitude of TRCTP is obviously lower than that of the isolated triangular prism, but the dominant frequency of the TRCTP is higher.

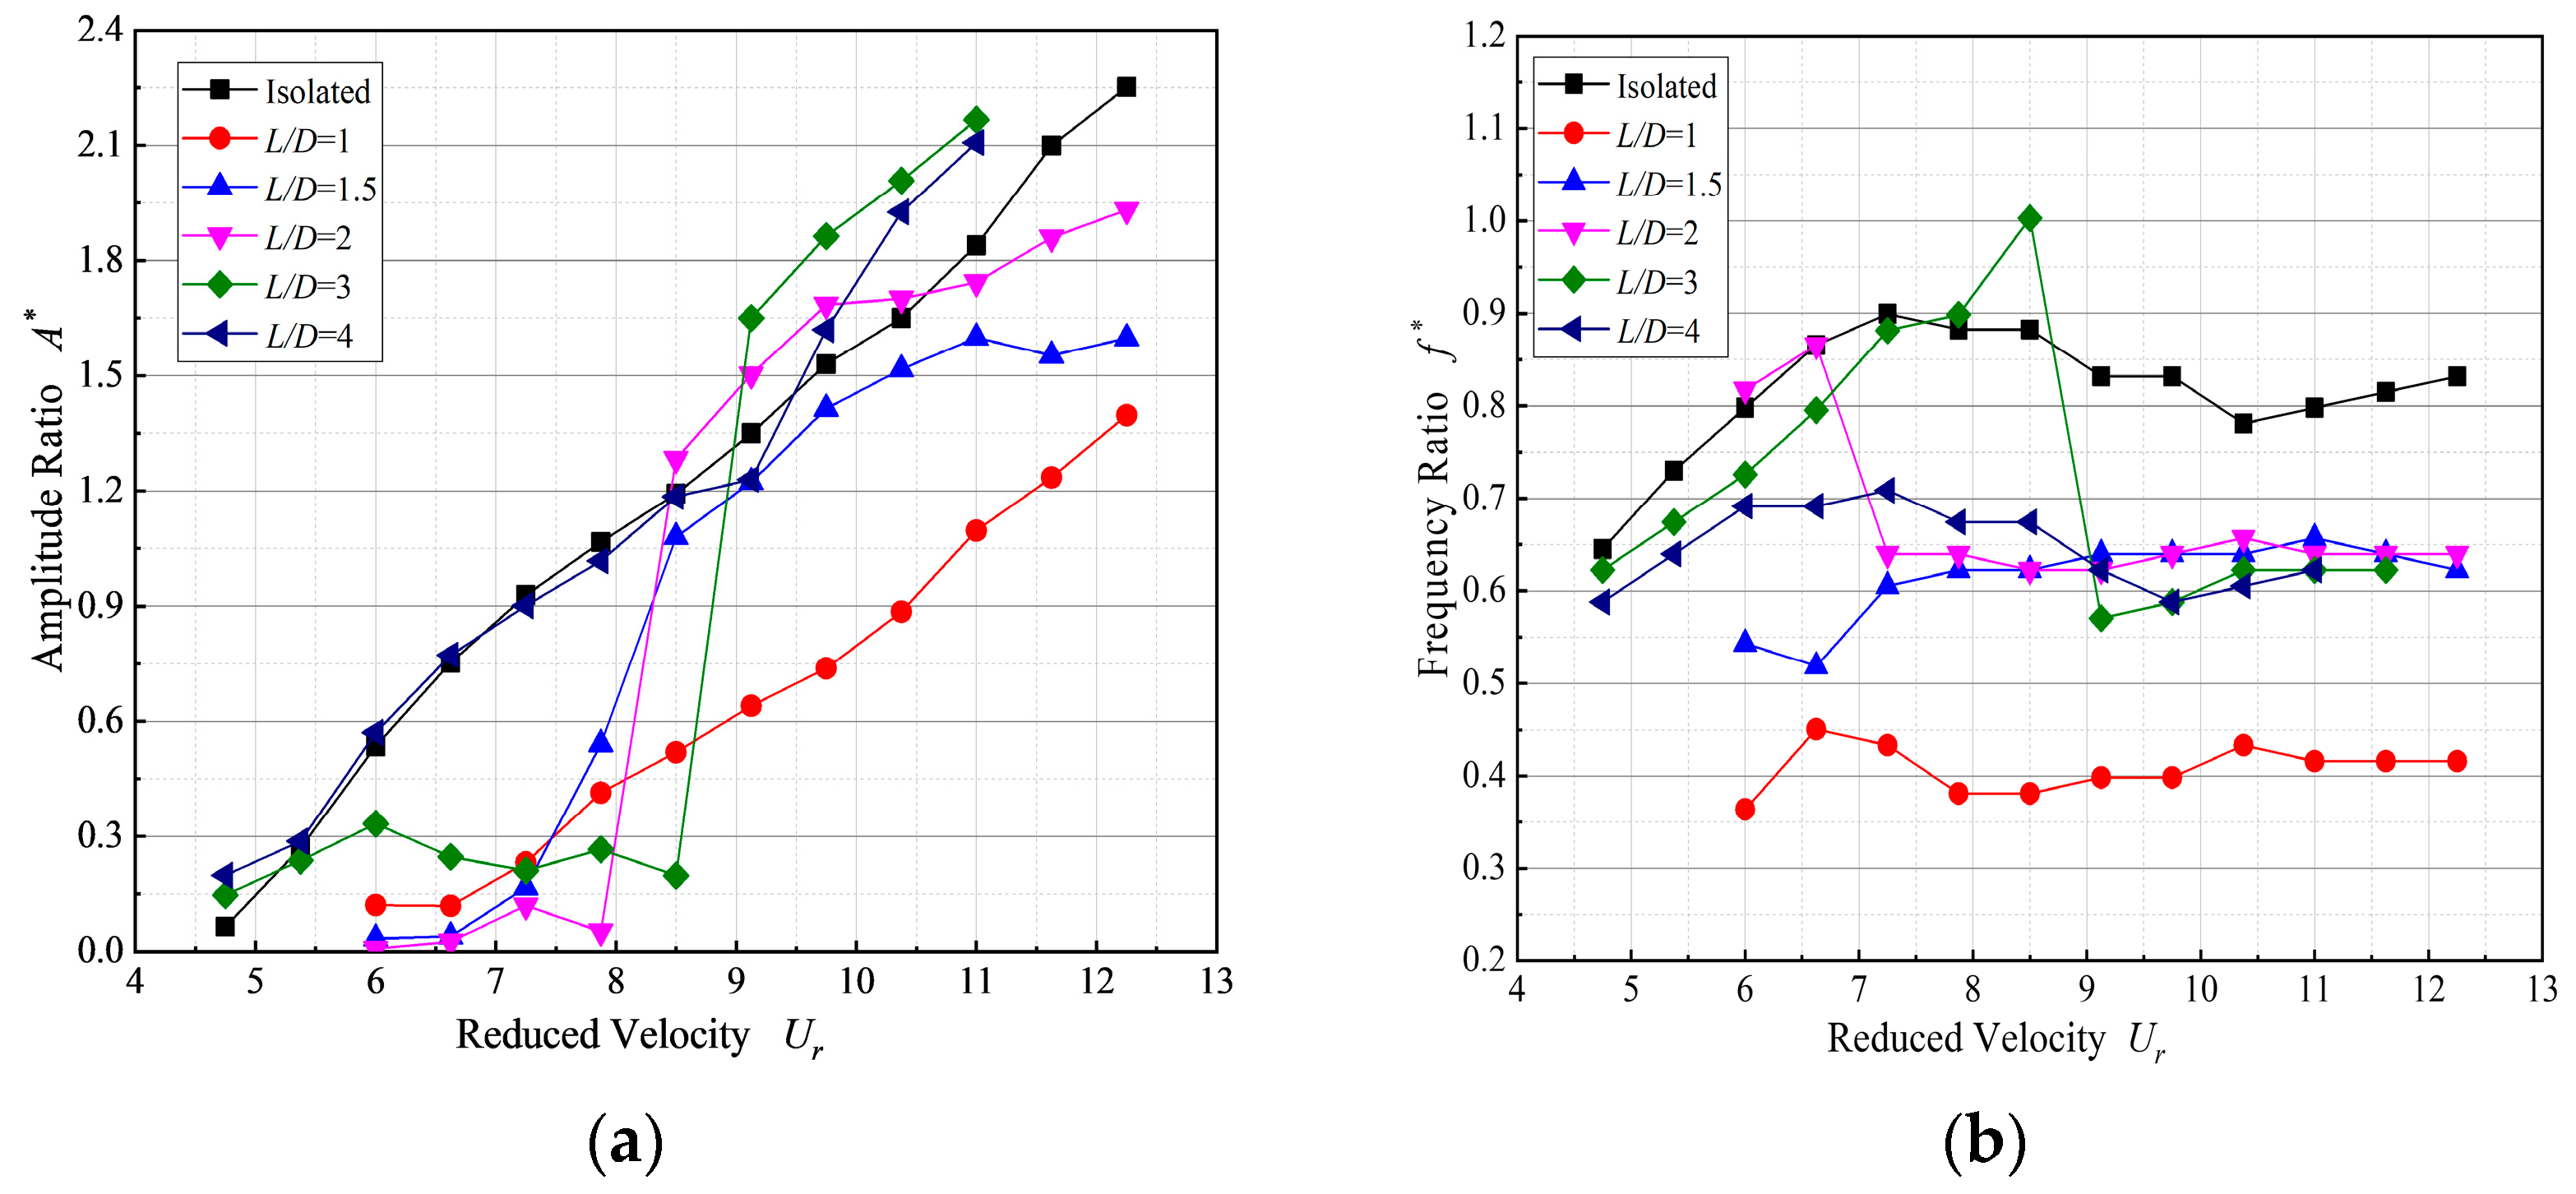
3.2.2. Effects of Gap Ratio on Oscillation

According to the results in Section 3.1, the system stiffness is selected as K = 1400 N/m and only mechanical damping exists in the system in all the oscillation tests with different gap ratios. In the cases of different gap ratios, the oscillation characteristics of the TRCTP are discussed in detail. Compared with other gap ratios, the lowest amplitude ratio exists, and the corresponding oscillation frequency is lower at L/D = 1. Therefore, the case of L/D = 1 is not discussed in the following sections. For L/D = 1.5, the A* curve increases gradually without a “sharp jump” and the amplitude is obviously higher than that at L/D = 1, and the frequency ratio is concentrated at about 0.62, as shown in Figure 12.
As mentioned above, the “sharp jump” phenomenon may appear at L/D = 2 and L/D = 3, and the oscillation is suppressed all the time at 7.875 ≤ Ur ≤ 8.5. The amplitude of TRCTP is lower than that of the isolated triangular prism obviously and the oscillation frequency is unstable, indicating that the cases of L/D = 2 and L/D = 3 are not conducive to energy conversion. The reason for this is that the wake of the upstream triangular prism is attached onto the surface of the downstream triangular prism, which results in an unstable flow filed between the two prisms. Therefore, these two cases are not considered in the following energy conversion tests.
As the flow velocity increases, for Ur = 11 at L/D = 2, the amplitude of TRCTP becomes lower than that of the isolated triangular prism. For L/D = 3, due to the experimental limitation, the flow velocity only increases to Ur = 11, but the oscillation is violent with a higher amplitude ratio (A* = 2.16), which is larger than that of the isolated triangular prism obviously. Before the “sharp jump” appears, the frequency ratio increases gradually, then it drops to about 0.58 sharply. For L/D = 4 and Ur ≤ 9.125, the amplitude ratio of TRCTP is almost the same as that of the isolated triangular prism. On the contrary, for Ur ≥ 9.75, the amplitude ratio is obviously larger, especially for the case of Ur = 11, and the amplitude ratio of TRCTP is 2.11, which is obviously larger than that of the isolated triangular prism. However, the frequency ratio is significantly lower than that of the isolated triangular prism all the time at L/D = 4. Based on the measured data and the detailed analysis above, the following energy conversion tests mainly focus on L/D = 1.5 and L/D = 4.
Figure 13 shows the time history of displacements and the comparison of the dominant frequencies for the isolated triangular prism and the TRCTP at Ur = 8.5 (L/D = 3). The result shows that the oscillation of the TRCTP is unstable and the dominant frequency is much higher, which may be not conductive to energy conversion. Figure 14 shows the time history of displacements and the comparison for dominant frequencies for the TRCTP and the isolated triangular prism at Ur = 11(L/D = 3). It can be seen that the oscillation response of the TRCTP is very regular, and the time history of displacement remains fairly constant. The amplitude is higher and the dominant frequency is lower than that of the isolated triangular prism, which agrees well with the results shown in Figure 12.

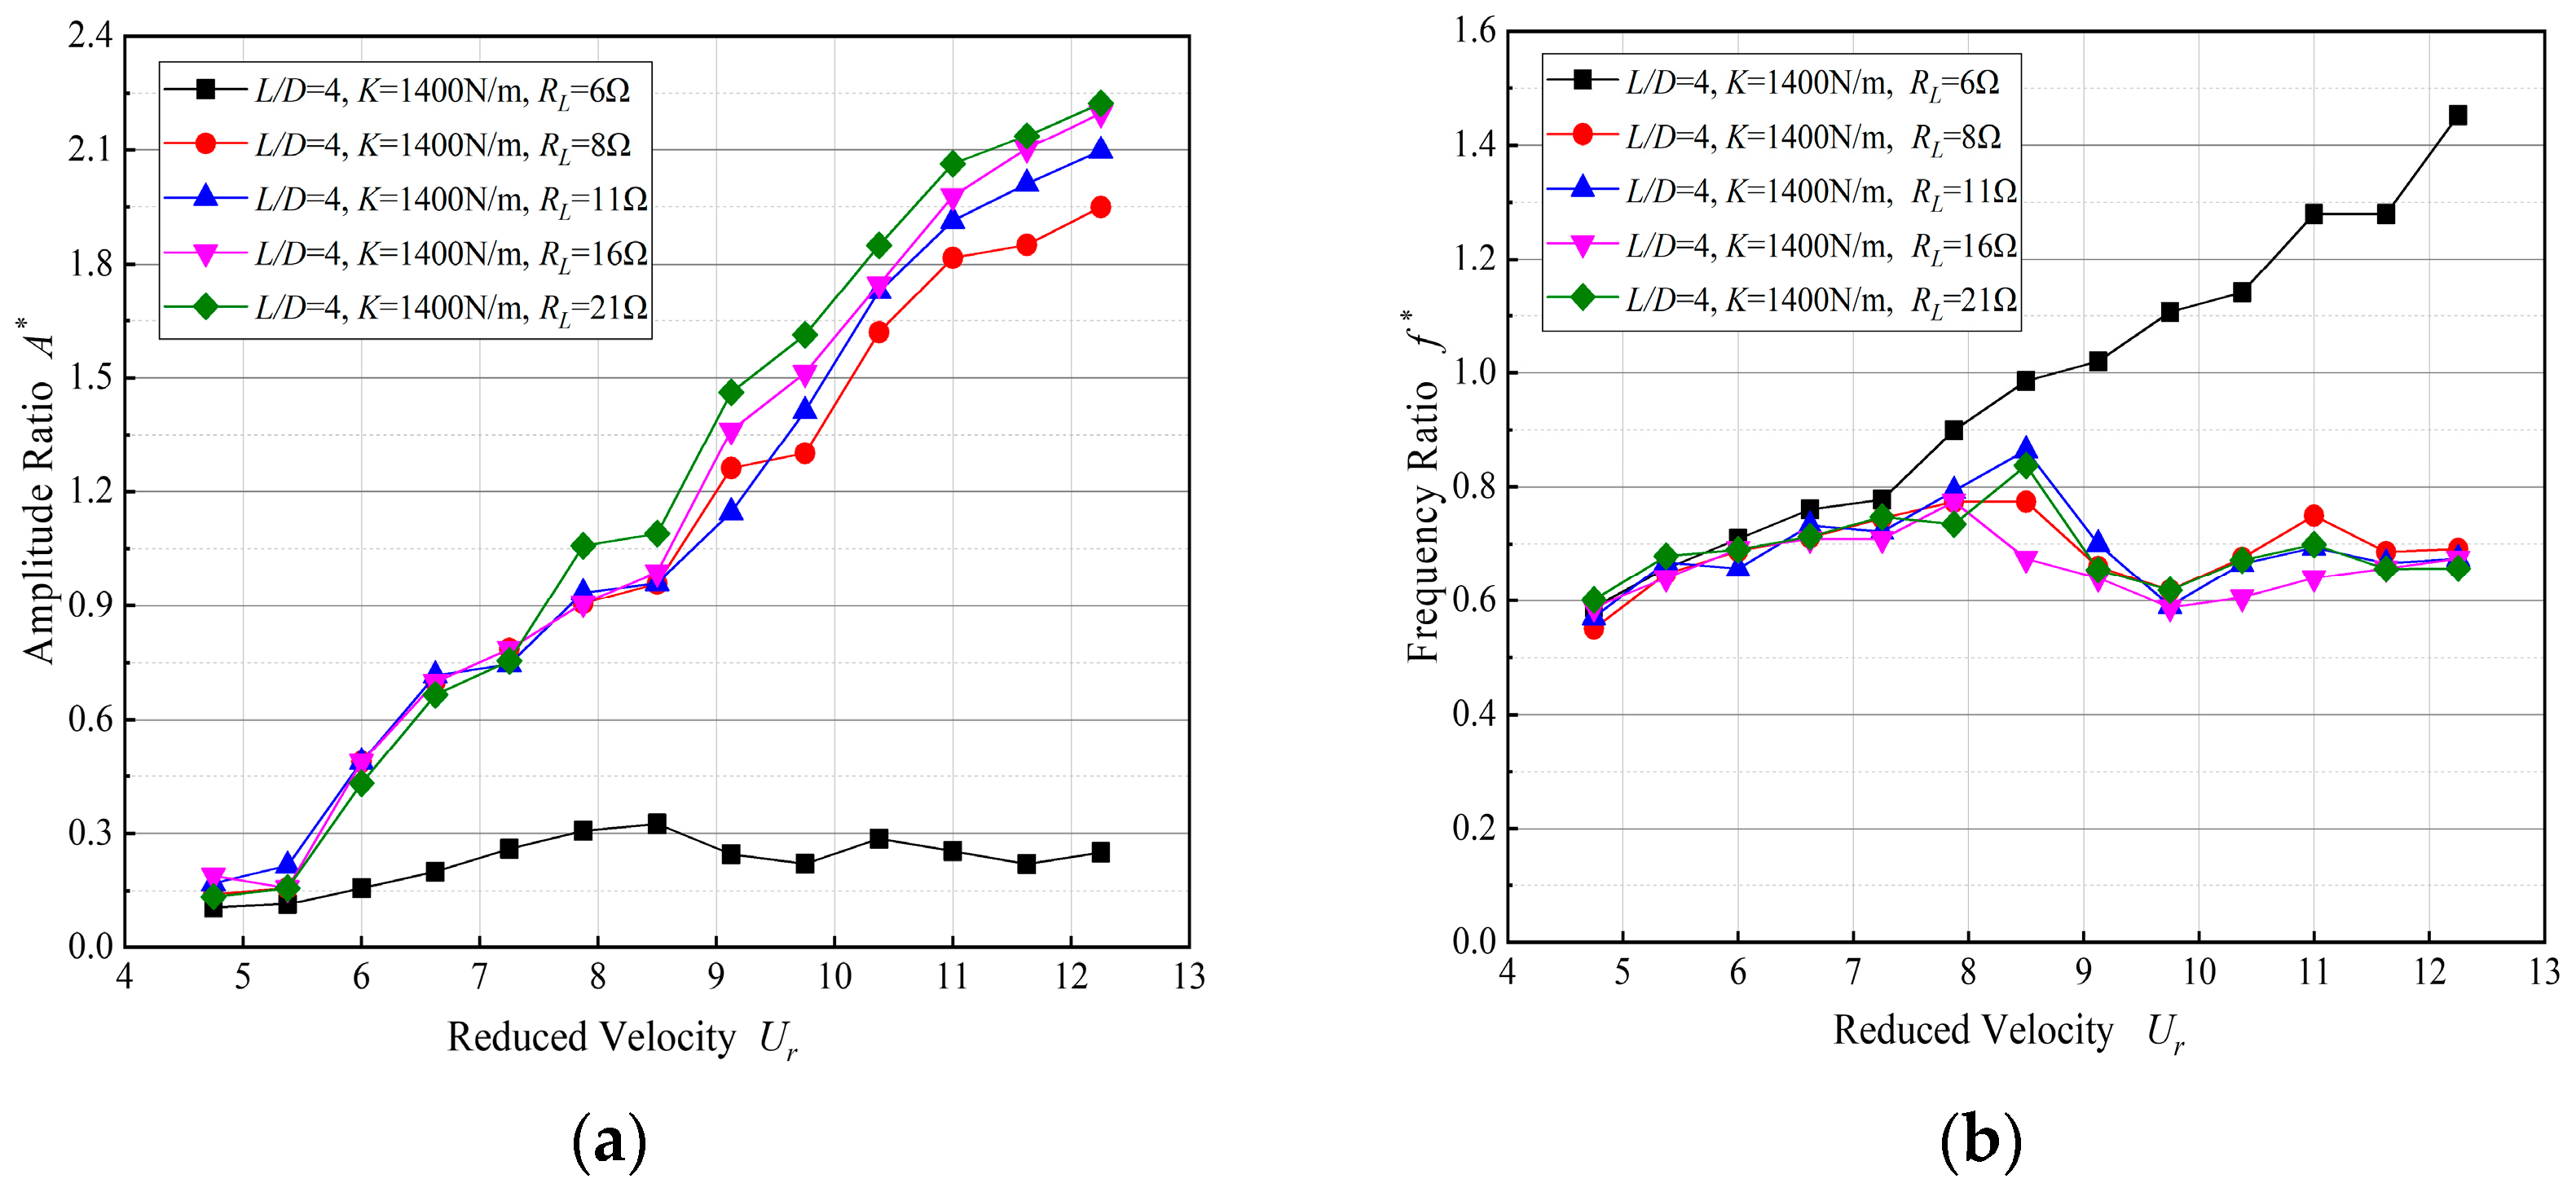
3.2.3. Effects of Load Resistance on Oscillation

To analyze the effects of the load resistance on oscillation response of the TRCTP, constant system stiffness of K = 1400 N/m and the gap ratio of L/D = 4 are selected, and five load resistances are applied (RL = 6 Ω, 8 Ω, 11 Ω, 16 Ω, 21 Ω). The results are shown in Figure 15.
The experimental results can be summarized as follows: (1) For RL = 6 Ω, the TRCTP performs a rather lower amplitude (A* ≤ 0.33), with the growth of reduced velocity, the amplitude has little fluctuation and the oscillation does not enter galloping branch. (2) For 8 Ω ≤ RL ≤ 21 Ω, the amplitude increases gradually with the growth of reduced velocity, and the oscillation is not suppressed, although the reduced velocity has already increased to Ur = 12.25. For Ur ≤ 8.5, the amplitude ratios at different load resistances are similar, but in the case of RL = 21 Ω, the amplitude ratio of the prism is relatively higher. For Ur ≥ 8.5, there exist significant differences in the amplitude ratios with different load resistances. The oscillation becomes more violent with a larger load resistance, and the corresponding amplitude ratio also becomes larger. For 8 Ω ≤ RL ≤ 21 Ω, the frequency ratios at different load resistances have similar values, which concentrate between 0.6 and 0.7. Figure 16 shows the comparisons of time history of displacements and dominant frequencies for the isolated triangular prism and the TRCTP at Ur = 11 (L/D = 4, RL = 16 Ω). The results show that the TRCTP oscillates stably and there is an obvious peak for the dominant frequency, which indicates the advantage in energy conversion. The isolated triangular prism also oscillates stably but it has more obvious peak values for the dominant frequency.

3.3. Energy Conversion Analysis

Considering that the “sharp jump” phenomenon may appear at L/D = 2 and L/D = 3 for the TRCTP, which can cause negative effects on energy conversion of the system, and the oscillation frequency is rather lower at L/D = 1, therefore, L/D = 1.5 and L/D = 4 are selected for the energy conversion tests in this section. Five different stiffness (K = 1200 N/m, 1400 N/m, 1600 N/m, 1800 N/m, 2000 N/m) and five load resistances (RL = 6 Ω, 8 Ω, 11 Ω, 16 Ω, 21 Ω) were selected to discuss the effects of parameters on the energy conversion characteristics of the TRCTP.

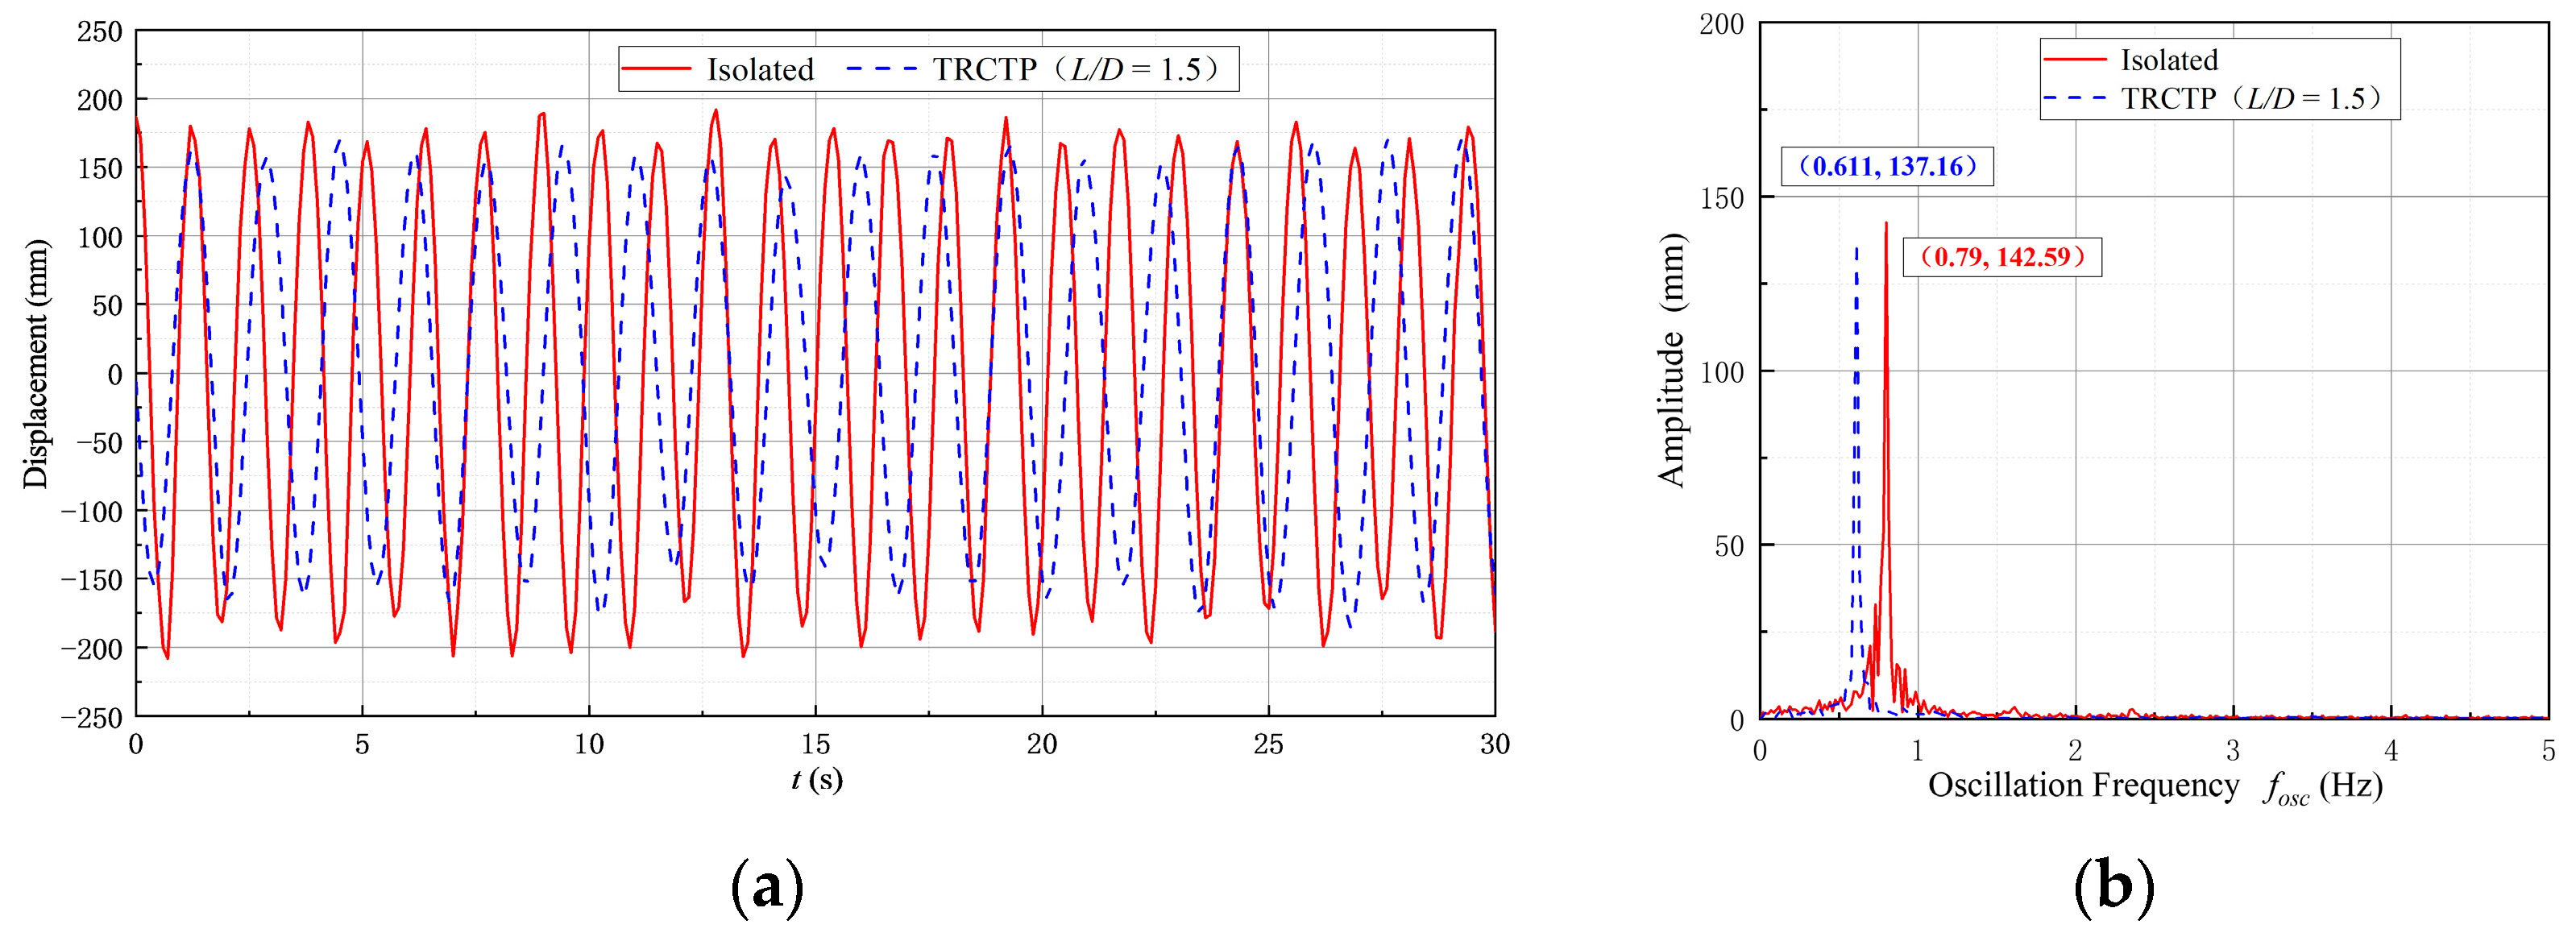
3.3.1. Energy Conversion Analysis for L/D = 1.5

For 4.75 ≤ Ur ≤ 6.625, the amplitude of the TRCTP is lower and the corresponding active power is small, and the energy conversion efficiency is lower than 0.4%. In the reduced velocity range of 6.625 ≤ Ur ≤ 9.75, the active power increases gradually with the growth of reduced velocity. In this case, the larger the load resistance is, the higher the active power will be, and the active power at a large stiffness is slightly higher. The maximum active power is Pharn = 3.27 W, which appears at RL = 21 Ω (K = 2000 N/m, Ur = 9.75), as shown in Figure 17.
However, the energy conversion efficiency begins to decrease after a little uptrend, and the maximum value ηharn = 3.52% appears at Ur = 8.5 (K = 1600 N/m, RL = 21 Ω). With the increasing reduced velocity, the energy conversion efficiency continues to decrease. For 9.75 ≤ Ur ≤ 10.375, the larger active power appears with a low load resistance, and in this case, the active power of the TRCTP with large stiffness and small load resistance has a sharp increase. For 10.375 ≤ Ur ≤ 12.25, the growth rates of active powers at most cases begin to decrease and then they tend to be stable. The maximum active power is Pharn = 5.44 W, which appears at K = 2000 N/m and RL = 8 Ω. Compared with the isolated triangular prism, the active power and the energy conversion efficiency of the TRCTP at L/D = 1.5 are lower.
Figure 18 shows the comparisons of the energy conversion characteristics for the isolated triangular prism and the TRCTP at RL = 21(L/D = 1.5). The instantaneous voltage time history and the corresponding active power at six typical reduced velocities are shown in the figure. The results show that there are obvious differences between the two types of prisms, and the isolated triangular prism has the better oscillation response and energy conversion characteristic at L/D = 1.5.

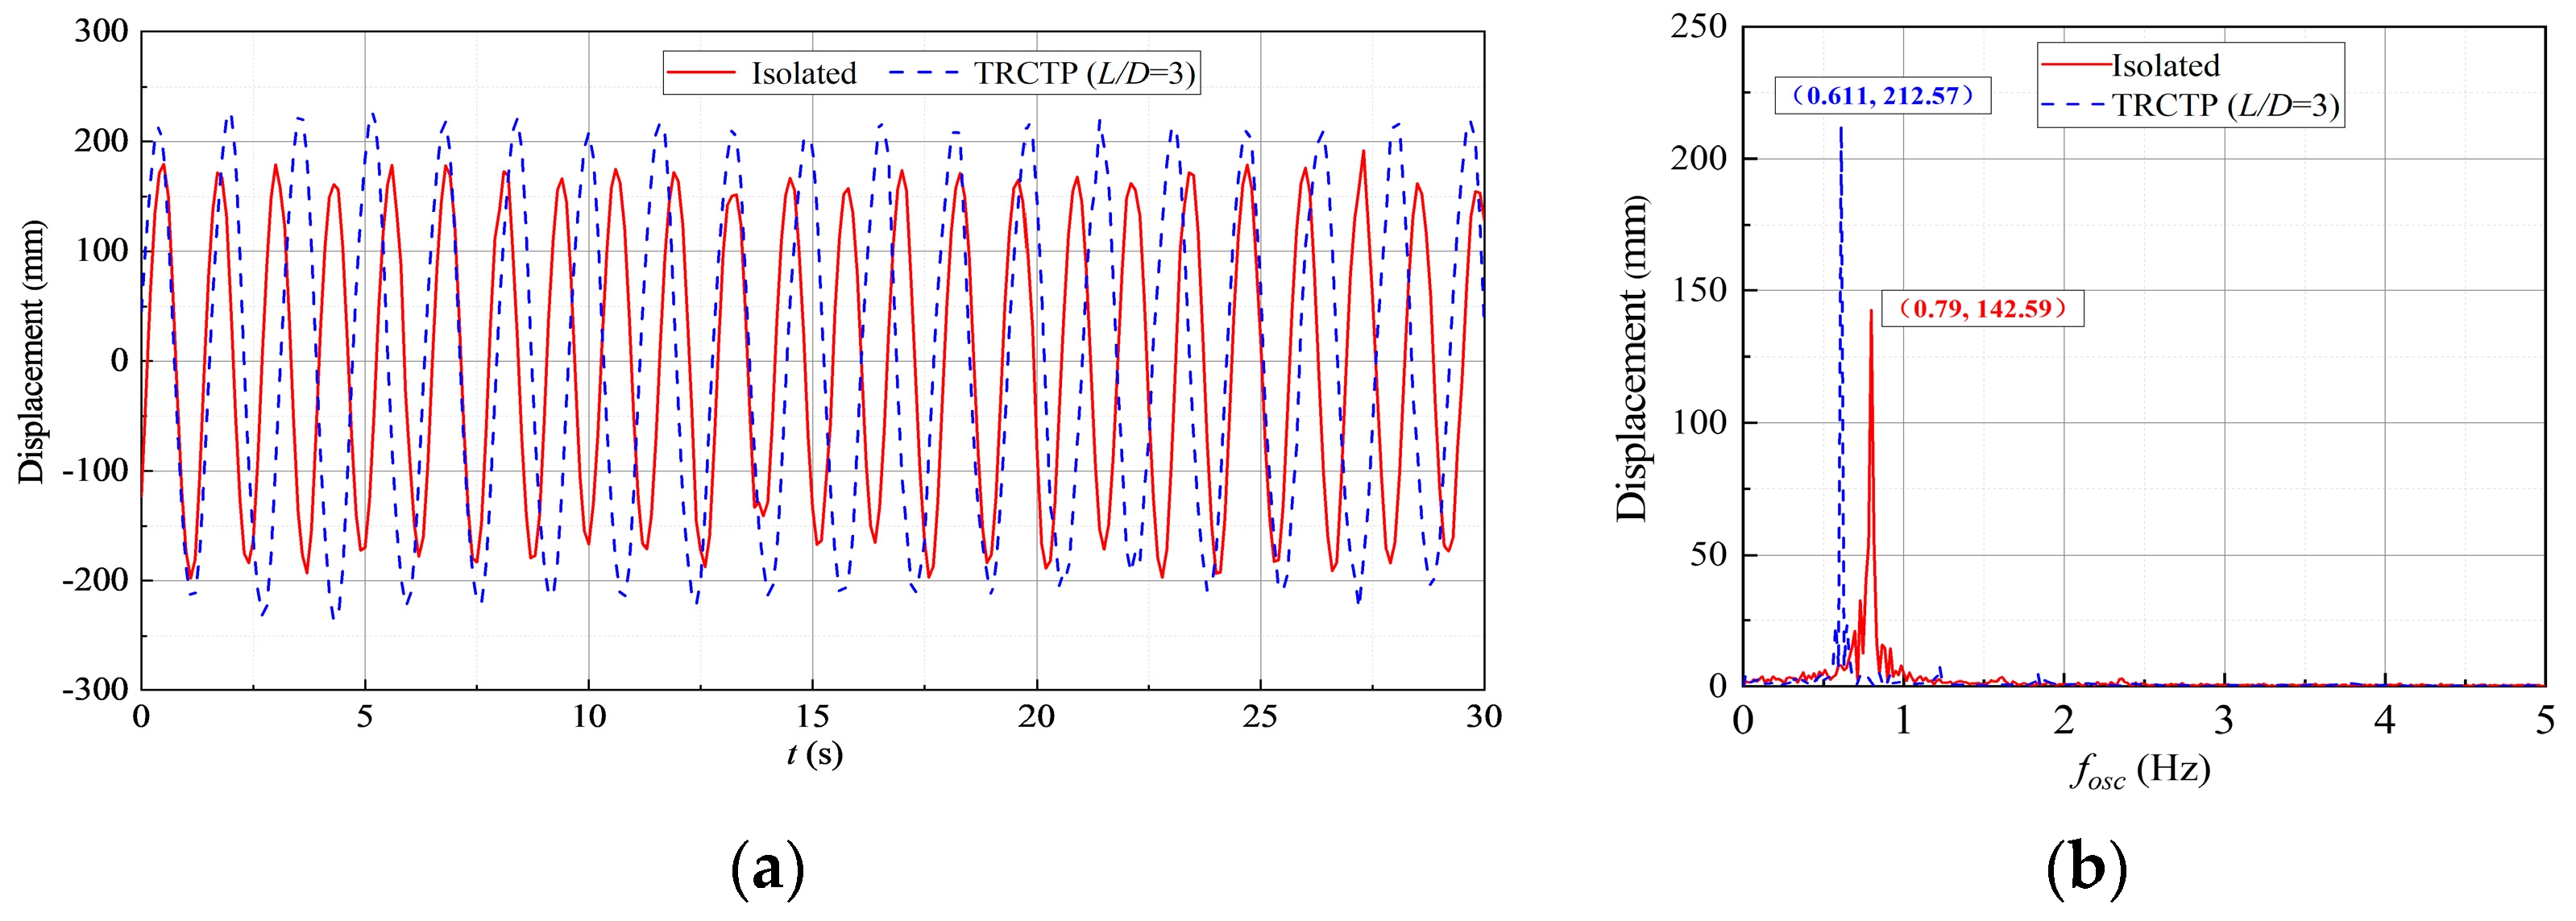
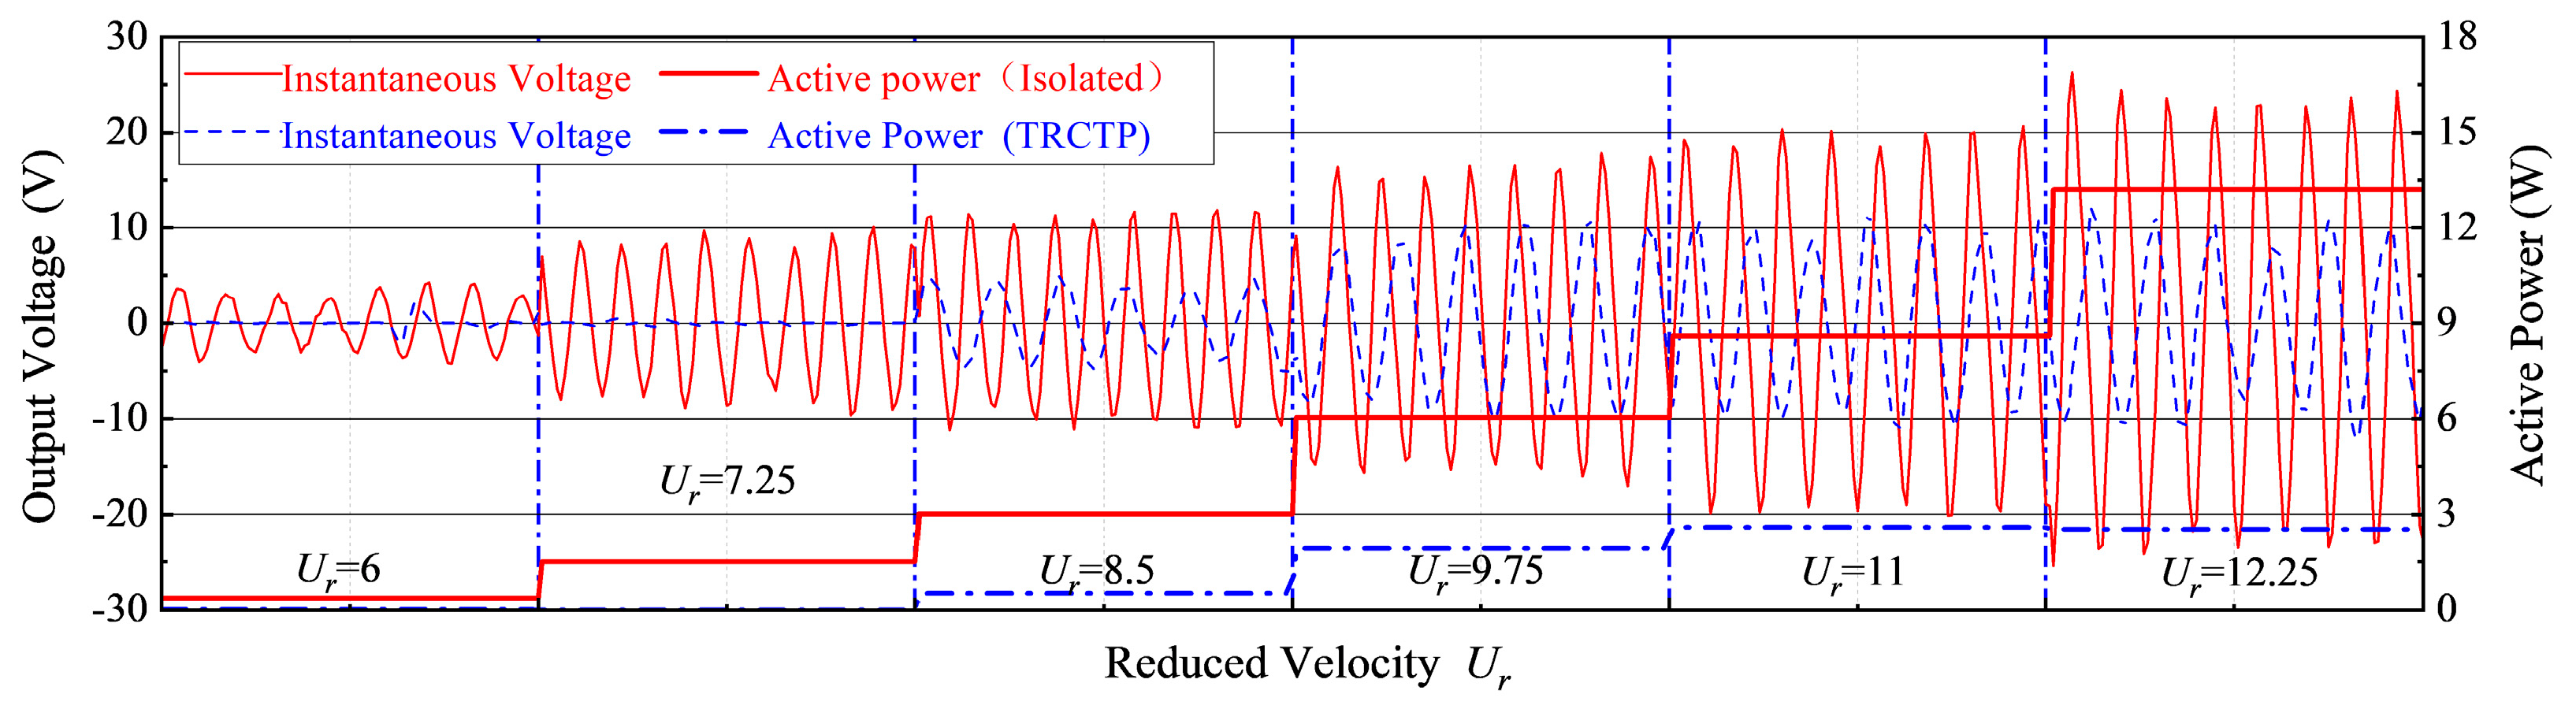
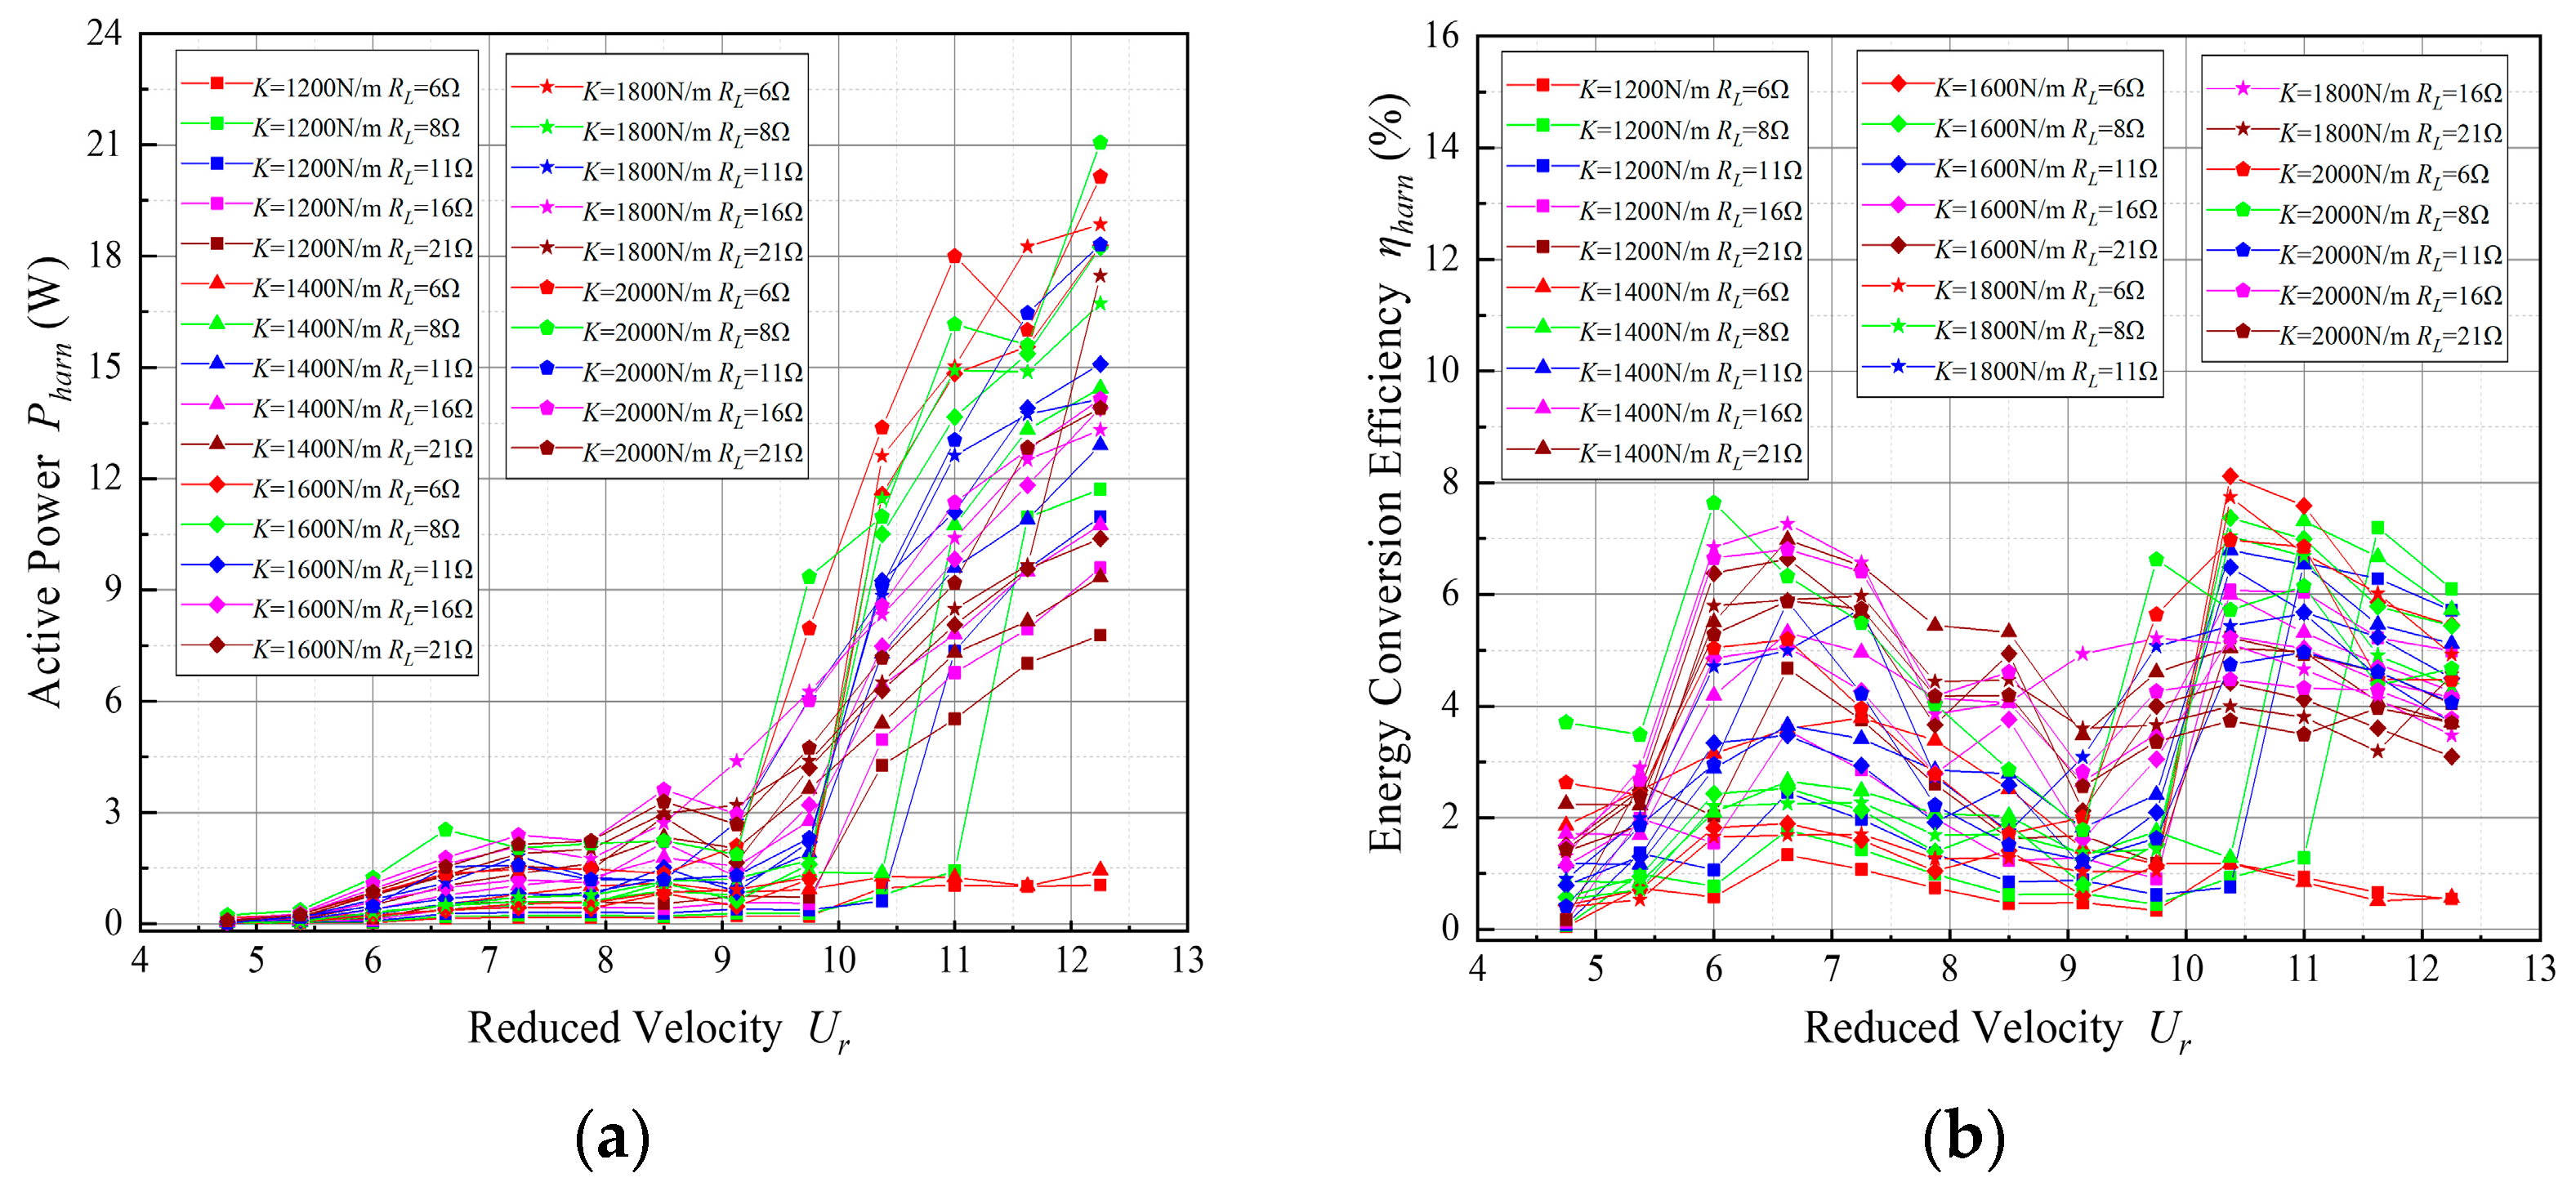
3.3.2. Energy Conversion Analysis for L/D = 4

In the range of 4.75 ≤ Ur ≤ 12.25, the active power of the TRCTP continues to increase with the growth of reduced velocity, while the energy conversion efficiency increases firstly and then begins to decrease, but finally it has an uptrend again, as shown in Figure 19. For 4.75 ≤ Ur ≤ 9.125, there are some fluctuations in the active power of TRCTP, which has a value lower than 4.5 W. The energy conversion efficiency of the oscillation system begins to decrease after an uptrend. In most cases, the maximum efficiency value appears at Ur = 6.625, but the maximum efficiency in the tests (ηharn = 7.62%) appears at Ur = 6 (K = 2000 N/m, RL = 8 Ω), and the corresponding active power is Pharn = 1.48 W. When the reduced velocity increases to 9.75 ≤ Ur ≤ 12.25, the active power of TRCTP begins to increase sharply, and the corresponding energy conversion efficiency also increases until Ur = 10.375, then it begins to decrease. In the tests, the maximum active power Pharn = 21.04 W (Ur = 12.25, K = 2000 N/m, RL = 8 Ω), and the maximum energy conversion efficiency in this range is ηharn = 8.2%, which appears at Ur = 10.375 (K = 1600 N/m, RL = 6 Ω), as shown in Figure 19. Generally, as the reduced velocity increases gradually, the active power of the oscillation system increases constantly, but the energy conversion efficiency varies without rhythm, which indicates that there exists an optimal case for energy harvesting.
Figure 20 shows the comparison of the energy conversion characteristics for the isolated triangular prism and the TRCTP at RL = 21 Ω (L/D = 4). The instantaneous voltage time history and corresponding active power with six typical reduced velocities are shown in the figure. The results show that the instantaneous voltage of the TRCTP at L/D = 4 is very similar to that of the isolated triangular prism.

4. Conclusions

In this study, the FIM responses and energy conversion of two rigidly coupled triangular prisms arranged in tandem in a water channel are studied experimentally in a wide range of flow velocity changing from 0.395 m/s to 1.438 m/s, and varied stiffness, gap ratio, and load resistance are applied to examine the effect of the parameters. Based upon the presented experimental results and the corresponding discussion, the specific conclusions can be summarized as follows:
(1)
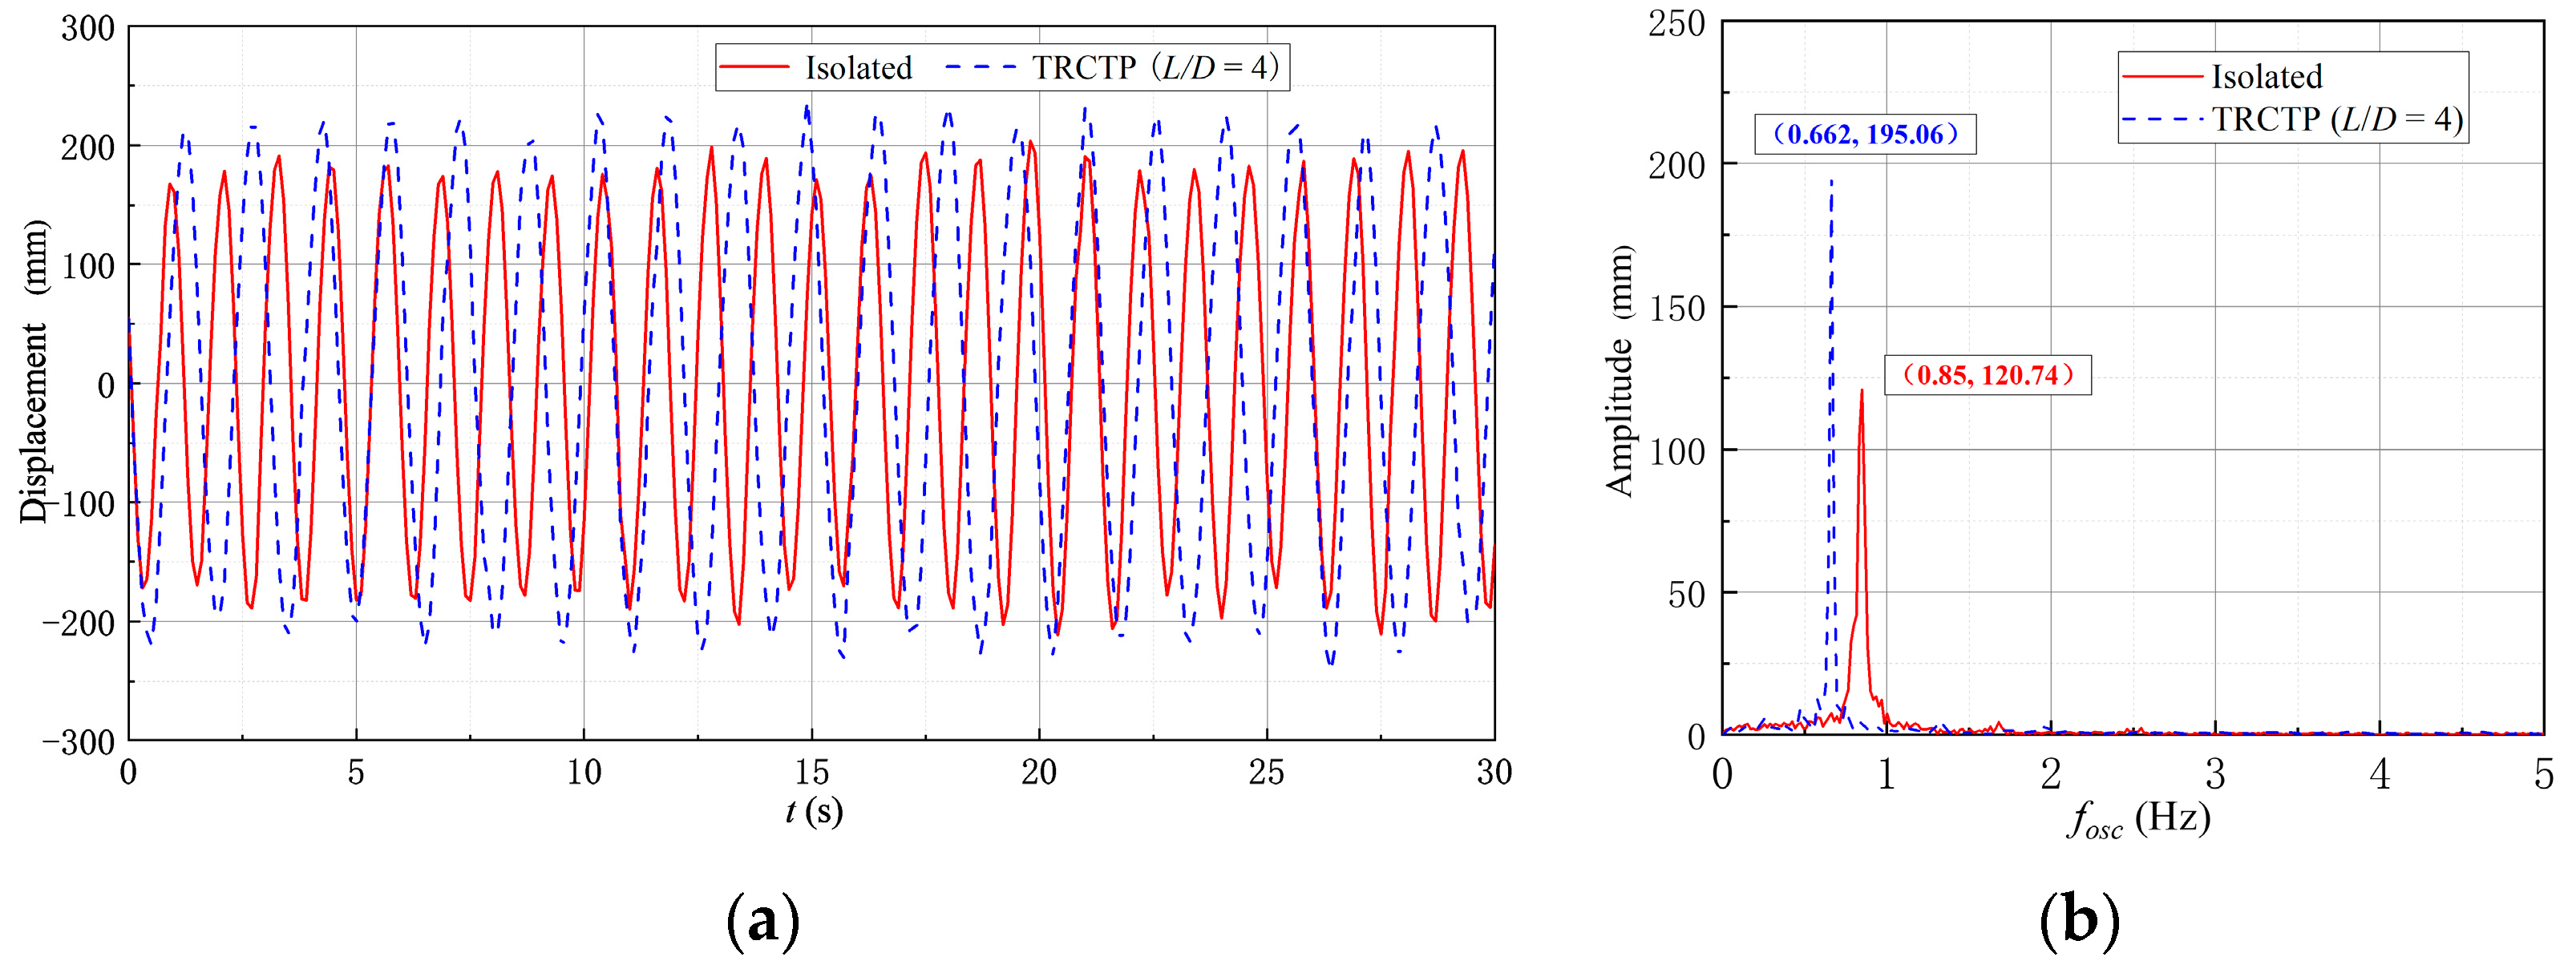
For L/D = 1, the TRCTP stabilizes at a low amplitude ratio and a low frequency ratio, which is lower than that of the isolated triangular prism. On the contrary, the TRCTP performs better in oscillation with higher amplitude and stable oscillation frequency at L/D = 4. The phenomenon illustrates that the oscillation of the TRCTP in tandem is suppressed at a lower gap ratio.
(2)
The amplitude of the TRCTP presents an increasing trend with the growth of gap ratio and load resistance in the tests; on the other hand, it decreases with the growth of stiffness within the selected values.
(3)
The “sharp jump” phenomenon occurs at 7.25 ≤ Ur ≤ 7.785 (1600 N/m ≤ K ≤ 2000 N/m) for L/D = 2 and 8.5 ≤ Ur ≤ 9.125 (1200 N/m ≤ K ≤ 2000 N/m) for L/D = 3, then the oscillation of the TRCTP becomes violent with a higher amplitude ratio. With the increasing reduced velocity, the amplitude ratio can reach 2.24 at L/D = 3, which is larger than that of the isolated triangular prism.
(4)
With the increase of flow velocity, the active power presents an increasing trend, while the energy conversion efficiency increases firstly and then decreases at Ur = 10.375. In the tests, for L/D = 4, the maximum active power is 21.04 W (Ur = 12.25, K = 2000 N/m, RL = 8 Ω) with the energy conversion efficiency of ηharn = 4.67%. The maximum energy conversion efficiency is 8.2% at L/D = 4 (Ur = 10.375, K = 1600 N/m, RL = 6 Ω) with the active power of Pharn = 11.58 W.

Author Contributions

Conceptualization, J.L. and N.S.; methodology, J.L. and Z.W.; validation, J.L., Z.W. and N.S.; formal analysis, S.Y.; investigation, S.Y. and X.Y.; resources, X.Y. and N.S.; data curation, X.W., Z.J. and Y.L.; writing-original draft preparation, Z.W.; writing-review and editing, J.L. and Z.W.; visualization, D.Y. and X.L.; project administration, J.L. and N.S.; funding acquisition, N.S. and J.L., All authors have read and agreed to the published version of the manuscript.

Funding

This research was funded by the Natural Science Foundation of Hebei Province (Grant No. E2022402074); the National Natural Science Foundation of China (Grant No. U20A20316; Grant No. 51909190; Grant No. U21A201200), the Foundation for Innovative Research Groups of the Natural Science Foundation of Hebei Province (Grant No. E2020402074); China Postdoctoral Science Foundation (Grant No. 2019M661020).

Data Availability Statement

Not applicable.

Conflicts of Interest

The authors declare no conflict of interest.

Abbreviations

AAverage of the amplitudes under continuous oscillation for 60 s
A*Amplitude ratio, A* = A/D
CtotalTotal damping of the system
DProjection width of the prism in the direction of incoming flow
fnNatural frequency of oscillator
foscDominant frequency of oscillation
f*Frequency ratio, f* = fosc/fn
KStiffness of oscillation system
LCenter-to-center distance between the two coupled triangular prisms
lLength of the triangular prism
moscOscillation mass
mdDisplaced mass, md = πρD2L/4
m*Mass ratio, m* = mosc/md
PharnActive power
RLLoad resistance
ReReynolds number
UIncoming flow velocity
UrReduced velocity, Ur = U/(fn D)
ρWater density
ξtotalDamping ratio
ηharnEnergy conversion efficiency
FIMFlow-induced vibration
VIVVortex-induced vibration
SGSoft galloping
HGHard galloping
VIVACEVortex-induced vibration for aquatic clean energy
PTCPassive turbulence cylinder

References

  1. Song, M.T.; Cao, D.Q.; Zhu, W.D. Vortex-induced vibration of a cable-stayed bridge. Shock Vib. 2016, 2016, 1928086. [Google Scholar] [CrossRef] [Green Version]
  2. Sarpkaya, T. A critical review of the intrinsic nature of vortex-induced vibrations. J. Fluids Struct. 2004, 19, 389–447. [Google Scholar] [CrossRef]
  3. Khan, M.J.; Bhuyan, G.; Iqbal, M.T.; Quaicoe, J.E. Hydrokinetic energy conversion systems and assessment of horizontal and vertical axis turbines for river and tidal applications: A technology status review. Appl. Energy 2009, 86, 1823–1835. [Google Scholar] [CrossRef]
  4. Kumar, D.; Sarkar, S. A review on the technology, performance, design optimization, reliability, techno-economics and environmental impacts of hydrokinetic energy conversion systems. Renew. Sust. Energy Rev. 2016, 58, 796–813. [Google Scholar] [CrossRef]
  5. Laws, N.D.; Epps, B.P. Hydrokinetic energy conversion: Technology, research, and outlook. Renew. Sust. Energy Rev. 2016, 57, 1245–1259. [Google Scholar] [CrossRef] [Green Version]
  6. Feng, C.C. The Measurements of Vortex-Induced Effects in Flow Past a Stationary and Oscillating Circular and D-Section Cylinders. Master’s Thesis, University of British Columbia, Vancouver, BC, Canada, 1968. [Google Scholar]
  7. Khalak, A.; Williamson, C.H.K. Fluid Forces and Dynamics of a Hydroelastic Structure with Very Low Mass and Damping. J. Fluids Struct. 1997, 11, 973–982. [Google Scholar] [CrossRef]
  8. Chang, C.; Ajith Kumar, R.; Bernitsas, M.M. VIV and galloping of single circular cylinder with surface roughness at 3.0 × 10⁴Re ≤ 1.2 × 10⁵. Ocean Eng. 2011, 38, 1713–1732. [Google Scholar] [CrossRef]
  9. Mannini, C.; Marra, A.M.; Massai, T.; Bartoli, G. Interference of vortex-induced vibration and transverse galloping for a rectangular cylinder. J. Fluids Struct. 2016, 66, 403–423. [Google Scholar] [CrossRef]
  10. Zhang, B.; Wang, K.; Song, B.; Mao, Z.; Tian, W. Numerical investigation on the effect of the cross-sectional aspect ratio of a rectangular cylinder in FIM on hydrokinetic energy conversion. Energy 2018, 165, 949–964. [Google Scholar] [CrossRef]
  11. Alonso, G.; Meseguer, J.; Pérez-Grande, I. Galloping instabilities of two-dimensional triangular cross-section bodies. Exp. Fluids 2005, 38, 789–795. [Google Scholar] [CrossRef]
  12. Iungo, G.V.; Buresti, G. Experimental investigation on the aerodynamic loads and wake flow features of low aspect-ratio triangular prisms at different wind directions. J. Fluids Struct. 2009, 25, 1119–1135. [Google Scholar] [CrossRef] [Green Version]
  13. Shao, N.; Lian, J.; Xu, G.; Liu, F.; Deng, H.; Ren, Q.; Yan, X. Experimental investigation of flow-induced motion and energy conversion of a T-Section prism. Energies 2018, 11, 2035. [Google Scholar] [CrossRef] [Green Version]
  14. Lian, J.; Yan, X.; Liu, F.; Zhang, J.; Ren, Q.; Yang, X. Experimental investigation on soft galloping and hard galloping of triangular prisms. Appl. Sci. 2017, 7, 198. [Google Scholar] [CrossRef] [Green Version]
  15. Sarpkaya, T. Fluid forces on oscillating cylinders. ASCE J. Waterw. Port Coast. Ocean. Div. 1978, 104, 275–290. [Google Scholar] [CrossRef]
  16. Khalak, A.; Williamson, C.H.K. Dynamics of a hydroelastic cylinder with very low mass and damping. J. Fluids Struct. 1996, 10, 455–472. [Google Scholar] [CrossRef]
  17. Raghavan, K.; Bernitsas, M.M. Experimental investigation of Reynolds number effect on vortex induced vibration of rigid circular cylinder on elastic supports. Ocean Eng. 2011, 38, 719–731. [Google Scholar] [CrossRef]
  18. Bernitsas, M.M.; Raghavan, K.; Ben-Simon, Y.; Garcia, E.M.H. VIVACE (Vortex Induced Vibration Aquatic Clean Energy): A new concept in generation of clean and renewable energy from fluid flow. In Proceedings of the 25th International Conference on Offshore Mechanics and Arctic Engineering, Hamburg, Germany, 4–9 June 2006. [Google Scholar]
  19. Brandao, F.L.; Bhatt, M.; Mahesh, K. Numerical study of cavitation regimes in flow over a circular cylinder. J. Fluid Mech. 2019, 885, A19. [Google Scholar] [CrossRef] [Green Version]
  20. Bahmani, M.H.; Akbari, M.H. Effects of mass and damping ratios on VIV of a circular cylinder. Ocean Eng. 2010, 37, 511–519. [Google Scholar] [CrossRef]
  21. Zhang, M.; Xu, F. Tuned mass damper for self-excited vibration control: Optimization involving nonlinear aeroelastic effect. J. Wind Eng. Ind. Aerod. 2022, 220, 104836. [Google Scholar] [CrossRef]
  22. Zhang, M.; Wu, T.; Øiseth, O. Vortex-induced vibration control of a flexible circular cylinder using a nonlinear energy sink. J. Wind Eng. Ind. Aerod. 2022, 229, 105163. [Google Scholar] [CrossRef]
  23. Park, H.; Ajith Kumar, R.; Bernitsas, M.M. Enhancement of fluid induced vibration of rigid circular cylinder on springs by localized surface roughness at 3 × 10⁴Re ≤ 1.2 × 10⁵. Ocean Eng. 2013, 72, 403–415. [Google Scholar] [CrossRef]
  24. Sun, H.; Kim, E.S.; Nowakowski, G.; Mauer, E.; Bernitsas, M.M. Effect of mass-ratio, damping, and stiffness on optimal hydrokinetic energy conversion of a single, rough cylinder in flow induced motions. Renew. Energ. 2016, 99, 936–959. [Google Scholar] [CrossRef] [Green Version]
  25. Wang, J.; Zhang, C.; Yurchenko, D.; Abdelkefi, A.; Zhang, M.; Liu, H. Usefulness of inclined circular cylinders for designing ultra-wide bandwidth piezoelectric energy harvesters: Experiments and computational investigations. Energy 2022, 239, 122203. [Google Scholar] [CrossRef]
  26. Zhu, H.; Gao, Y. Vortex induced vibration response and energy harvesting of a marine riser attached by a free-to-rotate impeller. Energy 2017, 134, 532–544. [Google Scholar] [CrossRef]
  27. Hu, G.; Tse, K.T.; Wei, M.; Naseer, R.; Abdelkefi, A.; Kwok, K.C.S. Experimental investigation on the efficiency of circular cylinder-based wind energy harvester with different rod-shaped attachments. Appl. Energy 2018, 226, 682–689. [Google Scholar] [CrossRef]
  28. Zhu, H.; Zhao, Y.; Zhou, T. CFD analysis of energy harvesting from flow induced vibration of a circular cylinder with an attached free-to-rotate pentagram impeller. Appl. Energy 2018, 212, 304–321. [Google Scholar] [CrossRef]
  29. Andrianne, T.; Aryoputro, R.P.; Laurent, P.; Laurent, P.; Colson, G.; Amandolèse, X.; Hémon, P. Energy harvesting from different aeroelastic instabilities of a square cylinder. J. Wind. Eng. Ind. Aerod. 2018, 172, 164–169. [Google Scholar] [CrossRef]
  30. Lian, J.; Yan, X.; Liu, F.; Zhang, J. Analysis on flow induced motion of cylinders with different cross sections and the potential capacity of energy transference from the flow. Shock Vib. 2017, 2017, 4356367. [Google Scholar] [CrossRef] [Green Version]
  31. Zhang, B.; Song, B.; Mao, Z.; Li, B.; Gu, M. Hydrokinetic energy harnessing by spring-mounted oscillators in FIM with different cross sections: From triangle to circle. Energy 2019, 189, 116249. [Google Scholar] [CrossRef]
  32. Zhu, H.; Tang, T.; Zhou, T.; Cai, M.; Gaidai, O.; Wang, J. High performance energy harvesting from flow-induced vibrations in trapezoidal oscillators. Energy 2021, 236, 121484. [Google Scholar] [CrossRef]
  33. Seyed-Aghazadeh, B.; Carlson, D.W.; Modarres-Sadeghi, Y. Vortex-induced vibration and galloping of prisms with triangular cross-sections. J. Fluid Mesh. 2017, 817, 590–618. [Google Scholar] [CrossRef]
  34. Liu, X.; Gui, N.; Wu, H.; Yang, X.; Tu, J.; Jiang, S. Numerical simulation of flow past a triangular prism with fluid-structure interaction. Eng. Appl. Comp. Fluid 2020, 14, 462–476. [Google Scholar] [CrossRef]
  35. Zhang, J.; Liu, F.; Lian, J.; Yan, X.; Ren, Q. Flow induced vibration and energy extraction of an equilateral triangle prism at different system damping ratios. Energies 2016, 9, 938. [Google Scholar] [CrossRef] [Green Version]
  36. Yan, X.; Lian, J.; Liu, F.; Wang, X.; Shan, N. Hydrokinetic energy conversion of Flow-induced motion for triangular prism by varying magnetic flux density of generator. Energy Convers. Manag. 2021, 227, 113553. [Google Scholar] [CrossRef]
  37. Xu, W.; Ji, C.; Sun, H.; Ding, W.; Bernitsas, M.M. Flow-induced vibration of two elastically mounted tandem cylinders in cross-flow at subcritical Reynolds numbers. Ocean Eng. 2019, 173, 375–387. [Google Scholar] [CrossRef]
  38. Liu, F.; Feng, W.; Yan, X.; Ran, D.; Shao, N.; Wang, X.; Yang, D. Experimental Investigation on Flow-Induced Rotation of Two Mechanically Tandem-Coupled Cylinders. Appl. Sci. 2022, 12, 10604. [Google Scholar] [CrossRef]
  39. Gao, Y.; Yang, B.; Zhu, H.; Peng, G.; Zhang, Z.; Pan, G. Flow induced vibration of two rigidly connected circular cylinders in different arrangements at a low Reynolds number. Ocean Eng. 2020, 217, 107741. [Google Scholar] [CrossRef]
  40. Ding, L.; Zhang, L.; Kim, E.S.; Bernitsas, M.M. URANS vs. experiments of flow induced motions of multiple circular cylinders with passive turbulence control. J. Fluids Struct. 2015, 54, 612–628. [Google Scholar] [CrossRef] [Green Version]
  41. Pinarbasi, A.; Pinar, E.; Akilli, H.; Ince, E. Shallow water experiments of flow past two identical square cylinders in tandem. Eur. J. Mech. B-Fluid. 2015, 49, 100–107. [Google Scholar] [CrossRef]
  42. Wang, J.; Zhang, C.; Zhang, M.; Abdelkefi, A.; Yu, H.; Ge, X.; Liu, H. Enhancing energy harvesting from flow-induced vibrations of a circular cylinder using a downstream rectangular plate: An experimental study. Int. J. Mech. Sci. 2021, 211, 106781. [Google Scholar] [CrossRef]
  43. Gu, W.; Xu, X.; Wei, N.; Yao, W.; Yu, G.; Lian, X.; Gao, J.; Zhou, J. The space effect on WIV interference between a fixed and oscillating diamond cylinder at a low Reynolds number of 100. Ocean Eng. 2022, 264, 112428. [Google Scholar] [CrossRef]
  44. Xu, B.; Wang, H.; Deng, Y.; Shen, X.; Geng, L.; Liu, K.; Zhang, D. Nonlinear vortex dynamic analysis of flow-induced vibration of a flexible splitter plate attached to a square cylinder. Ocean Eng. 2022, 264, 112433. [Google Scholar] [CrossRef]
  45. Shao, N.; Xu, G.; Liu, F.; Yan, X.; Wang, X.; Deng, H.; Zheng, Z. Experimental study on the flow-induced motion and hydrokinetic energy of two T-section prisms in tandem arrangement. Appl. Sci. 2020, 10, 1136. [Google Scholar] [CrossRef] [Green Version]
  46. Zhang, B.; Song, B.; Mao, Z.; Tian, W.; Li, B. Numerical investigation on VIV energy harvesting of bluff bodies with different cross sections in tandem arrangement. Energy 2017, 133, 723–736. [Google Scholar] [CrossRef]
  47. Shao, N.; Lian, J.; Yan, X.; Liu, F.; Wang, X. Experimental study on energy conversion of flow induced motion for two triangular prisms in staggered arrangement. Energy 2022, 249, 123764. [Google Scholar] [CrossRef]
Figure 1. Schematic of flow-induced motion energy conversion (FIMEC) system [36].
Energies 15 08190 g001
Figure 2. Recirculating water channel system.
Energies 15 08190 g002
Figure 3. Oscillation system.
Energies 15 08190 g003
Figure 4. Schematic of energy conversion system.
Energies 15 08190 g004
Figure 5. Transmission part-generator.
Energies 15 08190 g005
Figure 6. Physical model.
Energies 15 08190 g006
Figure 7. Actual model.
Energies 15 08190 g007
Figure 8. Free decay tests. (a) K = 1400 N/m; (b) K = 1800 N/m.
Energies 15 08190 g008
Figure 9. Amplitude and frequency responses for TRCTP. (a) Amplitude response; (b) Frequency responses.
Energies 15 08190 g009
Figure 10. Amplitude and frequency response for different stiffness at L/D = 1.5. (a) Amplitude response; (b) Frequency response.
Energies 15 08190 g010
Figure 11. Typical displacement and spectra comparison at Ur = 11 (L/D = 1.5). (a) Comparison of displacement time history; (b) Comparison of spectra.
Energies 15 08190 g011
Figure 12. Amplitude ratio and frequency ratio for different gap ratios. (a) Amplitude response; (b) Frequency response.
Energies 15 08190 g012
Figure 13. Typical displacement and spectra at Ur = 8.5 (L/D = 3). (a) Comparison of displacement time history; (b) Comparison of spectra.
Energies 15 08190 g013
Figure 14. Typical displacement and spectra at Ur = 11 (L/D = 3). (a) Comparison of displacement time history; (b) Comparison of spectra.
Energies 15 08190 g014
Figure 15. Amplitude ratio and frequency ratio for different load resistances (L/D = 4). (a) Amplitude response; (b) Frequency response.
Energies 15 08190 g015
Figure 16. Typical displacement and spectra at Ur = 11 (L/D = 4). (a) Comparison of displacement time history; (b) Comparison of spectra.
Energies 15 08190 g016
Figure 17. Active power and energy conversion efficiency for L/D = 1.5. (a) Active power; (b) Energy conversion efficiency.
Energies 15 08190 g017
Figure 18. Active power and the instantaneous voltage for L/D = 1.5.
Energies 15 08190 g018
Figure 19. Active power and energy conversion efficiency for L/D = 4. (a) Active power; (b) Energy conversion efficiency.
Energies 15 08190 g019
Figure 20. Active power and the instantaneous voltage for L/D = 4.
Energies 15 08190 g020
Table 1. The results of free decay test (I).
K (N/m)fn (Hz)mosc (Kg)Ctotal (N.s.m−1)ζair
10000.83136.71831.420 0.081
12000.91536.34327.693 0.065
14000.98236.81227.696 0.061
16001.06136.03924.534 0.052
18001.12536.06224.372 0.048
20001.17436.79424.580 0.046
22001.24336.10424.237 0.043
24001.29136.51223.3610.039
Table 2. The results of free decay test (Ⅱ).
K(N/m)ζair
RL = 21 Ω
ζair
RL = 16 Ω
ζair
RL = 13 Ω
ζair
RL = 11 Ω
ζair
RL = 8 Ω
10000.1310.1430.1540.1670.188
12000.1150.1270.1380.1510.172
14000.1110.1230.1340.1470.168
16000.1020.1140.1250.1380.159
18000.0980.1100.1210.1340.155
20000.0960.1080.1190.1320.153
22000.0930.1050.1160.1290.150
24000.0890.1010.1120.1250.146
Table 3. Parameters of the physical model.
DesignationSymbol [Unit]Values
WidthD [m]0.1
Lengthl [m]0.9
Oscillation massmosc [Kg]36.423
StiffnessK [N/m]1000, 1200, 1400, 1600, 1800, 2000, 2400
Reduced velocityUr4.75 ≤ Ur ≤ 12.25
Range of velocityU [m/s]0.395 ≤ U ≤ 1.438
Reynolds numberRe = ρUD/μ34504 ≤ Re ≤ 125712
Gap ratioL/D1.0, 1.5, 2.0, 3.0, 4.0
Load resistanceRL [Ω]8, 11, 13, 16, 21
Publisher’s Note: MDPI stays neutral with regard to jurisdictional claims in published maps and institutional affiliations.

