Article

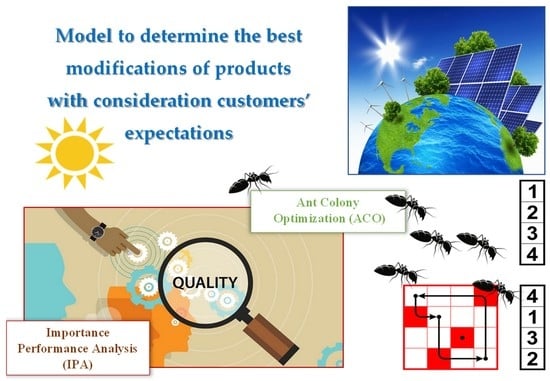
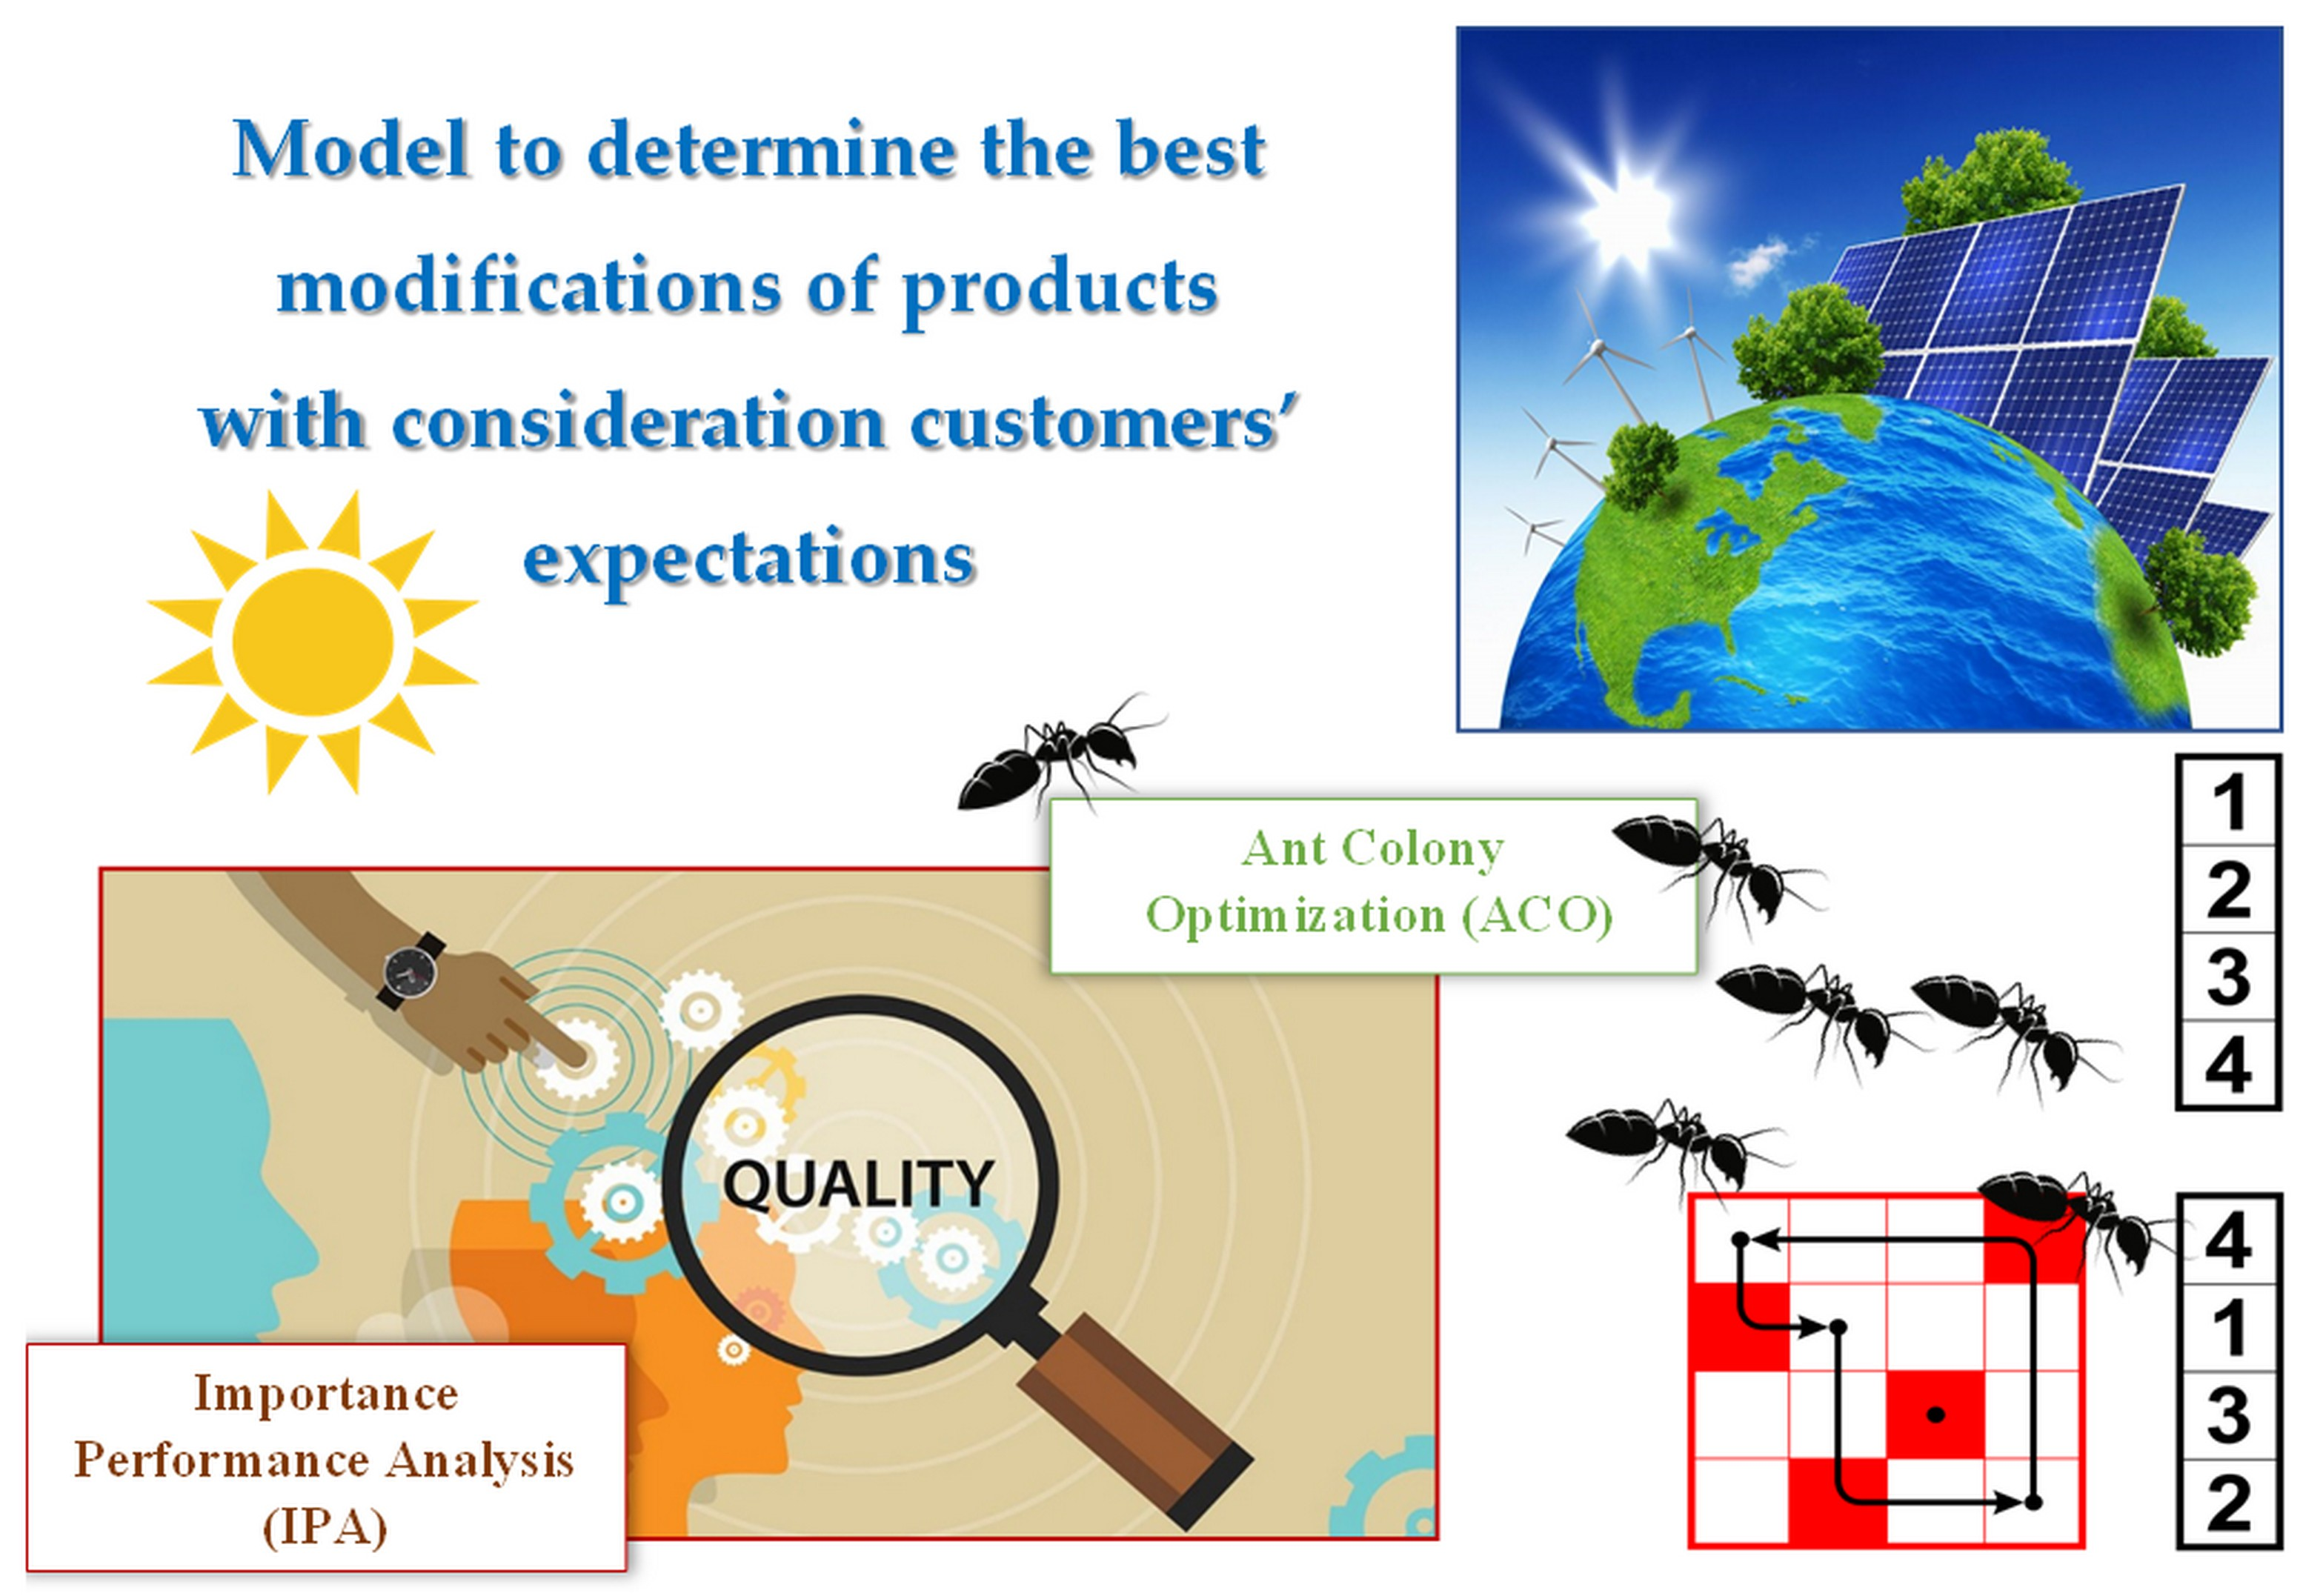
Model to Determine the Best Modifications of Products with Consideration Customers’ Expectations

1
Faculty of Management, Rzeszow University of Technology, Al. Powstancow Warszawy 12, 35-959 Rzeszow, Poland
2
Faculty of Mechanical Engineering and Aeronautics, Rzeszow University of Technology, Al. Powstancow Warszawy 12, 35-959 Rzeszow, Poland
*
Author to whom correspondence should be addressed.
Energies 2022, 15(21), 8102; https://doi.org/10.3390/en15218102
Submission received: 5 October 2022 / Revised: 25 October 2022 / Accepted: 27 October 2022 / Published: 31 October 2022
(This article belongs to the Collection Feature Papers in Energy, Environment and Well-Being)

Abstract

:
The current situation in the energy market contributes not only to the sales growth of photovoltaic panels (PV) but also to the intense search for possibilities for its improvement. The purpose of this research was to develop a model to determine, where possible, the most beneficial modifications to improve products. The model used combination techniques, i.e., the SMARTER method, brainstorming (BM), the 7 ± 2 rule, questionnaire, ant colony optimization (ACO), and importance-performance analysis (IPA). In addition, an algorithm supporting ACO was proposed in the MATLAB program. The test was carried out on PV and showed that it is possible to determine the way of product (PV) improvement by determining a sequence of modifications for product criteria states while simultaneously considering customers’ expectations. It was shown that each state of the short-circuit electricity and peak power was satisfactory for customers. It was necessary to modify the maximum current and idle voltage. In addition, the selected modification states of the weight and dimensions will be more satisfactory compared to the current states. The proposed model is based on searching for the best changes in product criteria to achieve the highest possible customer satisfaction (i.e., product quality level). Originality is the ability to define a product improvement method (PV) depending on customer expectations but also taking into account the requirements of the company.

Graphical Abstract

1. Introduction

The widely understood use of renewable energy and sustainability has the aim of reducing environmental losses and climate change [1]. In this area, the improvement of the product is also a challenge for production companies [2,3]. It results from the need to adjust products to simultaneously change with customer expectations and the dynamic market [4,5]. This can be seen in the case of photovoltaic panels (PV), which are developing rapidly and are the main tool of renewable energy sources (RES) [6,7], according to the newest reports, e.g., [8,9,10], the PV market still grows. For example, the cumulative global power of PV in 2021 was equal to 942 GW, and the total annual increase amounted to 175 GW [1]. Photovoltaic panels are relatively profitable for customers because they are considered a clean, renewable, and widely available energy source [1]. However, only a small part of it is a so-called energy mix in the world [5]. The efficiency of photovoltaic energy is dependent on many other factors, e.g., solar radiation, ambient temperatures, or wind speed. Therefore, achieving customer satisfaction with its quality is especially difficult [11,12]. According to the climate and energy framework, by 2030, it will need to improve energy efficiency by about a minimum of 32.5%, where 32% participation is predicted in RES [13]. Therefore, photovoltaics is one of the most preferred solutions to meet the global energy demand [14,15,16,17,18].
In view of that, a review of the literature was carried out for the improvement actions of PV as part of the consideration of customers’ expectations. For example, the authors of article [11] proposed a method of simulation and design following solar energy according to the operating principles of photovoltaic energy. The latitude and the duration of the sunshine were used for this. Whereas in study [6], the possibility of including PV and energy storage systems (ESS) in a unified power converter for micro-DC networks was analyzed. Another example is study [17] in which the authors verified the possibility of installing photovoltaics on the roof of electric cars to satisfy customers’ satisfaction. Similar analyses were carried out by the study authors of [12], whose purpose was to minimize the cost of electric energy and the peak demand of a smart home through the optimal operation of electric vehicles and an electricity storage system. It was based on decision methods, such as AHP (analytic hierarchy process). The author of study [19] analyzed the law regulations introduced in 2022 in Poland, which refer to electric energy and renewable micro-installations. The research was aimed at customers’ expectations, i.e., orchard farms, whereas in study [5], PVs were verified in terms of their installation, operation, and disposal in SMEs in Mexico. On the other hand, the authors of [14] defined, for example, the theoretical range of the optimal sawtooth profile for PV. The deficiencies of incident light on photovoltaics that are not covered by solar cells have been shown to still be verified. The authors of the studies [20,21,22], carried out research on improving products to achieve customer expectations, where tests were carried out based on PVs. In the article [20], a model was developed from combined methods, such as the SMARTER method, brainstorming (BM), survey with the Likert scale, weighted sum model (WSM), and naive Bayesian classifier (NBC). The customer expectations were obtained and processed using WSM to determine the quality of the photovoltaic system considering the weights of the PV criteria. NBC was used to determine the direction and development of these products. However, in article [22], a single model combined techniques, including the zero-unitarization method (MUZ) and qualitative cost analysis (AKJ). The purpose was to propose a model to support the choice of PV which would be the most favorable for customers considering different PV criteria and the cost of purchase. In turn, in study [21], a single model combined different techniques, including the DEMATEL method (decision-making trial and evaluation laboratory), the AHP method, and the weighted product model (WPM). Using this combination of methods, PV quality was predicted by taking into account customer expectations.
After a review of the literature, it was concluded that different approaches were used to improve photovoltaics. Some of these considered customers’ expectations. The focus was on the principles of their operation, materials, and the possibility of initiating them on other products (e.g., electric cars). They also developed models supporting the determination and prediction of quality. Despite this, there were no studies that concentrated on ways of determining the best solutions in proposed PV modifications so that PV could develop these products. There was also a lack of studies that would suggest the producers’ best changes in the qualitative criteria of PV, which simultaneously would include customer expectations. This was considered a research gap that we have undertaken to fill.
Therefore, the purpose of the investigation was to develop a model to determine the best modification of products considering customer expectations. During the development of the model, the following hypothesis was assumed:
Hypothesis 1.
It is possible to determine product improvement by determining a sequence of modifications for the product criteria states while simultaneously considering customer expectations toward the quality and importance of product criteria.
The model was carried out by a key producer of UE photovoltaic panels from UE. The originality of this research is the ability to define a product improvement method (PV) depending on customer expectations while also taking into account the requirements of the company.

2. Model

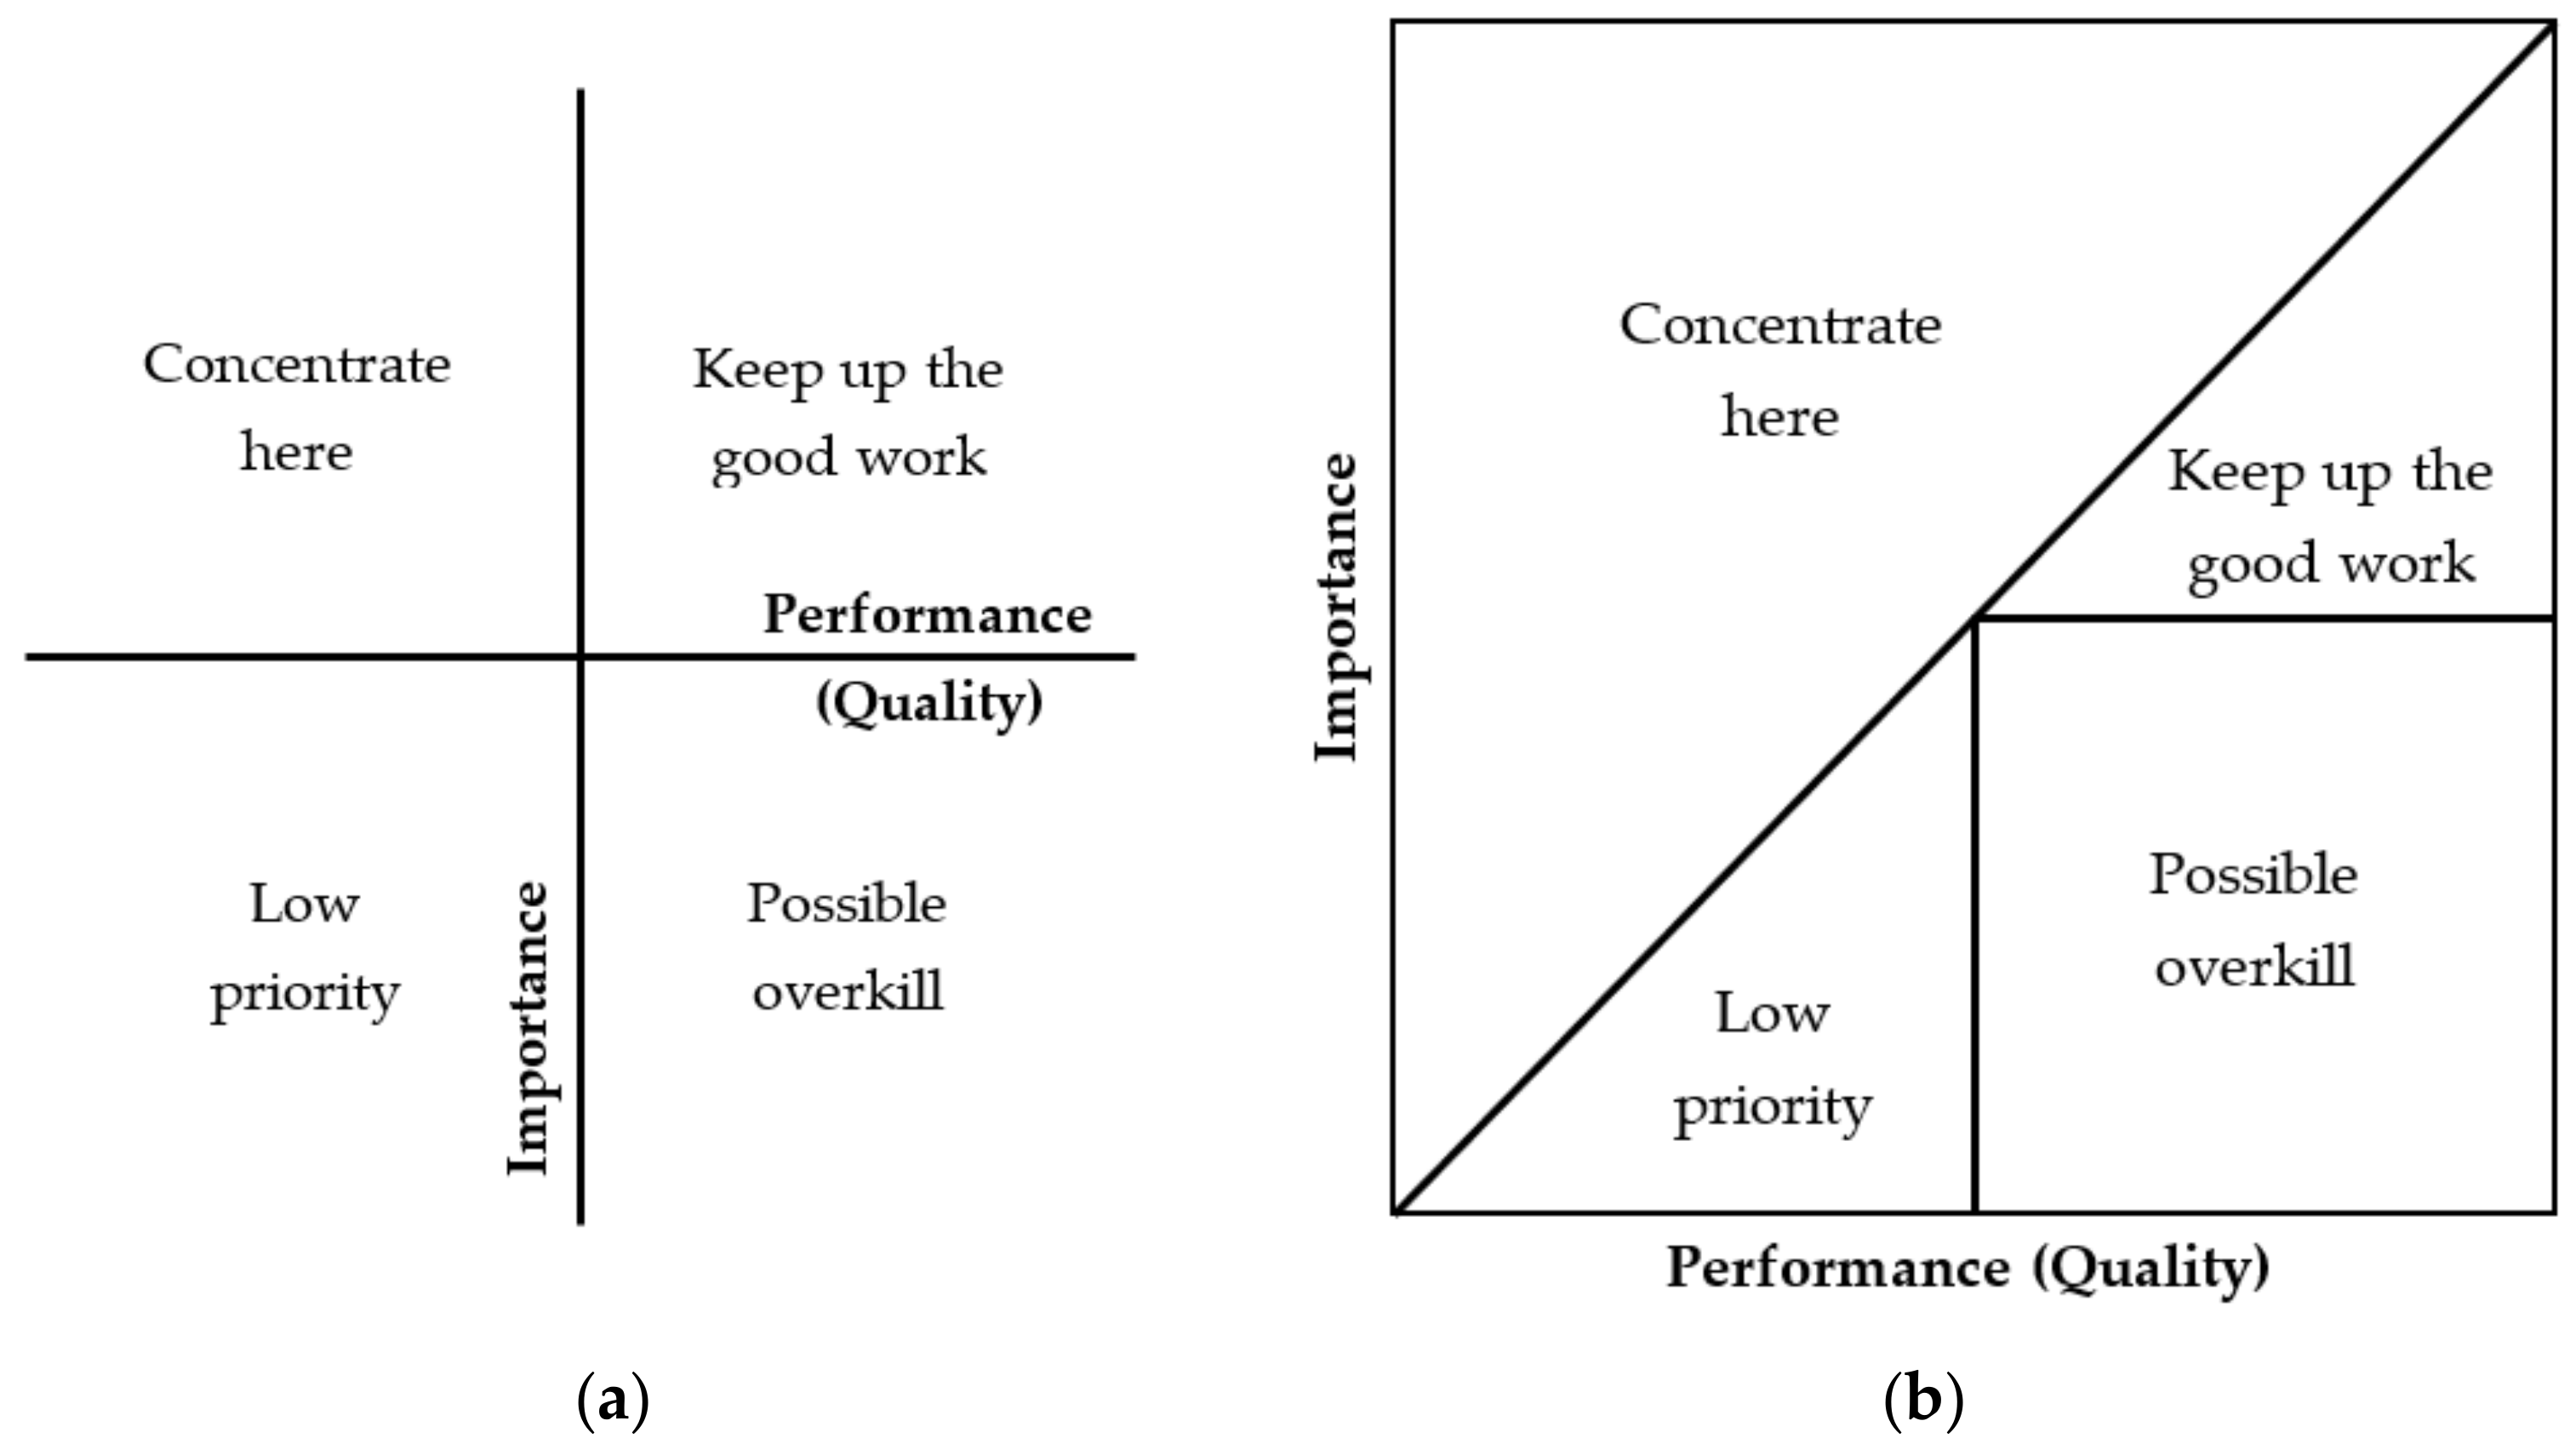
2.1. General Concept and Choice Tools Supporting Model

The concept of this research consisted of the development of a model that could support the improvement of products by changing (modifying) the selected product criteria with significant customer expectations. The general plan of the developed model aimed to support entities (expert, broker, and bidder) in product improvement by reaching for the most favorable changes in the product criteria to achieve the highest possible level of customer satisfaction (i.e., the level of product quality). The intuitive idea behind the model is shown in Figure 1.
It was assumed that this would be made possible through the use of a combined way to select the rules, methods, and tools, supporting decision-making, quality management, and the optimization of solutions, i.e., the SMARTER method (S—specific, M—measurable, A—achievable, R—relevant, realistic, or reward, T—‘based on timeline’ or timebound, E—exciting or evaluated, R—recorded or reward), brainstorming (BM), the rule 7 ±   2 , questionnaire, ant colony optimization (ACO), and importance-performance analysis (IPA). This combination of selected rules, methods, and tools to support decision-making, quality management, and the optimization of solutions has not yet been used. Therefore, it is another added value of this study.
The SMARTER method is one of the basic methods supporting the development and purpose of analysis, e.g., the process, results, impact, or even personal factors. It is the method that allows determining actions, terms, knowledge, and other aspects adequate for the problem [23]. Therefore, this method was used in the first stage of the model to determine the purpose of the research.
The brainstorming method (BM) is a method of teamwork [24] and was used in all stages of the model. This was due to the purpose of this method, which was to generate ideas in the area of the analyzed problem.
The rule 7 ±   2 [25] is the rule of multi-criteria decision-making (MCDM). According to this rule, it is possible to effectively assess (compare) the product criteria, where the decision maker can simultaneously compare from five to a maximum of nine criteria. For this reason, this principle was adopted in the stage of assessing the product criteria and the states that characterize them.
The questionnaire was used to obtain the customers’ expectations of the product. The choice of the questionnaire resulted from its popularity. Additionally, it is an easy way to obtain customers’ expectations, as shown by the authors of the previous studies, e.g., [26].
Ant colony optimization (ACO) was the first algorithm of ACO. Depending on the way of the activation of the pheromone trail, there are three types of this algorithm, i.e., ant density—the constant amount of pheromone during the route determination; ant-quantity—inversely proportional to the length of the edge of the road under construction; and the ant-cycle—leaving the pheromone after building the entire road. According to the authors of studies [27,28], the most favorable results are achieved after using the ant cycle algorithm. Therefore, it was used in the proposed model. Its application resulted from a need to solve the traveling salesman problem, where the purpose was to make a decision on which product criteria states will be the most favorable for customers in comparison to the current (actual) criteria states and other possible modified states of the criteria. This tool was used because it involved searching for which product criteria state (modifications, variants of current criteria states) allowed the most satisfactory product quality level to be achieved. According to the authors of study [29], ACO effectively solves these types of problems by using the goal function, which includes concepts related to quality and logistics. The detailed characteristics of the ACO are presented in the studies, e.g., [29,30,31,32,33].
Importance performance analysis (IPA) is a simple but efficient tool that allows for the verification of criteria according to their importance and efficiency (quality). IPA is a graphic tool that supports making decisions based on the importance and quality of criteria. IPA allows for the combination of values (assessments) to signify the importance (weight) of criteria with values (assessments) and by the quality of these criteria. Next, in a graphic way, it is possible to make the best decision for analysis, as shown authors of studies [10,34,35]. Therefore, IPA was used to combine the weights of the criteria and quality of their states to choose the criteria necessary for modification. As a result, it was possible to take action to improve the product in a way that ensured a noticeable increase in customer satisfaction.
It is possible to apply the proposed model to other sectors, as the model is developed in a general way. The stages of the model contain assumptions selected on the basis of the literature on the subject of products (physical products); therefore, their fulfillment determines the possibility of using the model for any products and other sectors.
This research is important for experts because it shows an original approach to product improvement depending on customer expectations while also taking into account the company’s requirements. Furthermore, the study shows a new and, so far, an unused combination of selected rules, methods, and tools that support decision-making, quality management, and the optimization of solutions. Furthermore, after reviewing the literature, it was concluded that there were no studies in this regard, which were concentrated on a way to determine the best solutions in proposed PV modifications to develop these products. This model allowed us to fill this research gap.

2.2. Assumptions of the Model

The assumptions for the model are assumed based on the literature review and according to the methods (tools) supporting the proposed model. These assumptions were as follows:
  • The type of product to analyze is unlimited [20,21];
  • The number of criteria to verify is 7 ±   2 [22,25];
  • The number of product states to verify is 7 ±   2 [3,25];
  • The number of customers from which expectations should be obtained results from a need of entity (expert, bidder, broker) and can be equal, even 1 [36], but it is possible to meet the choice of customers by using the method shows in the study [37];
  • Each customer distributes 100 points between the states of the criteria of the product, where less is better, and the arithmetic mean of all the points is calculated, which determines the importance of the criteria [38];
  • Each customer distributes 100 points between the product criteria states, where less is better, then the arithmetic mean of all the points calculated, which determine the quality of the criteria [22];
  • The number of ants in ACO is equal to 20;
  • The number of iterations in ACO is equal to 50;
  • The improvement of the product should be the beginning of the change in criterion states, as the most important for customers.
Based on these assumptions, the stages of the model were developed, as shown in the rest of the study.

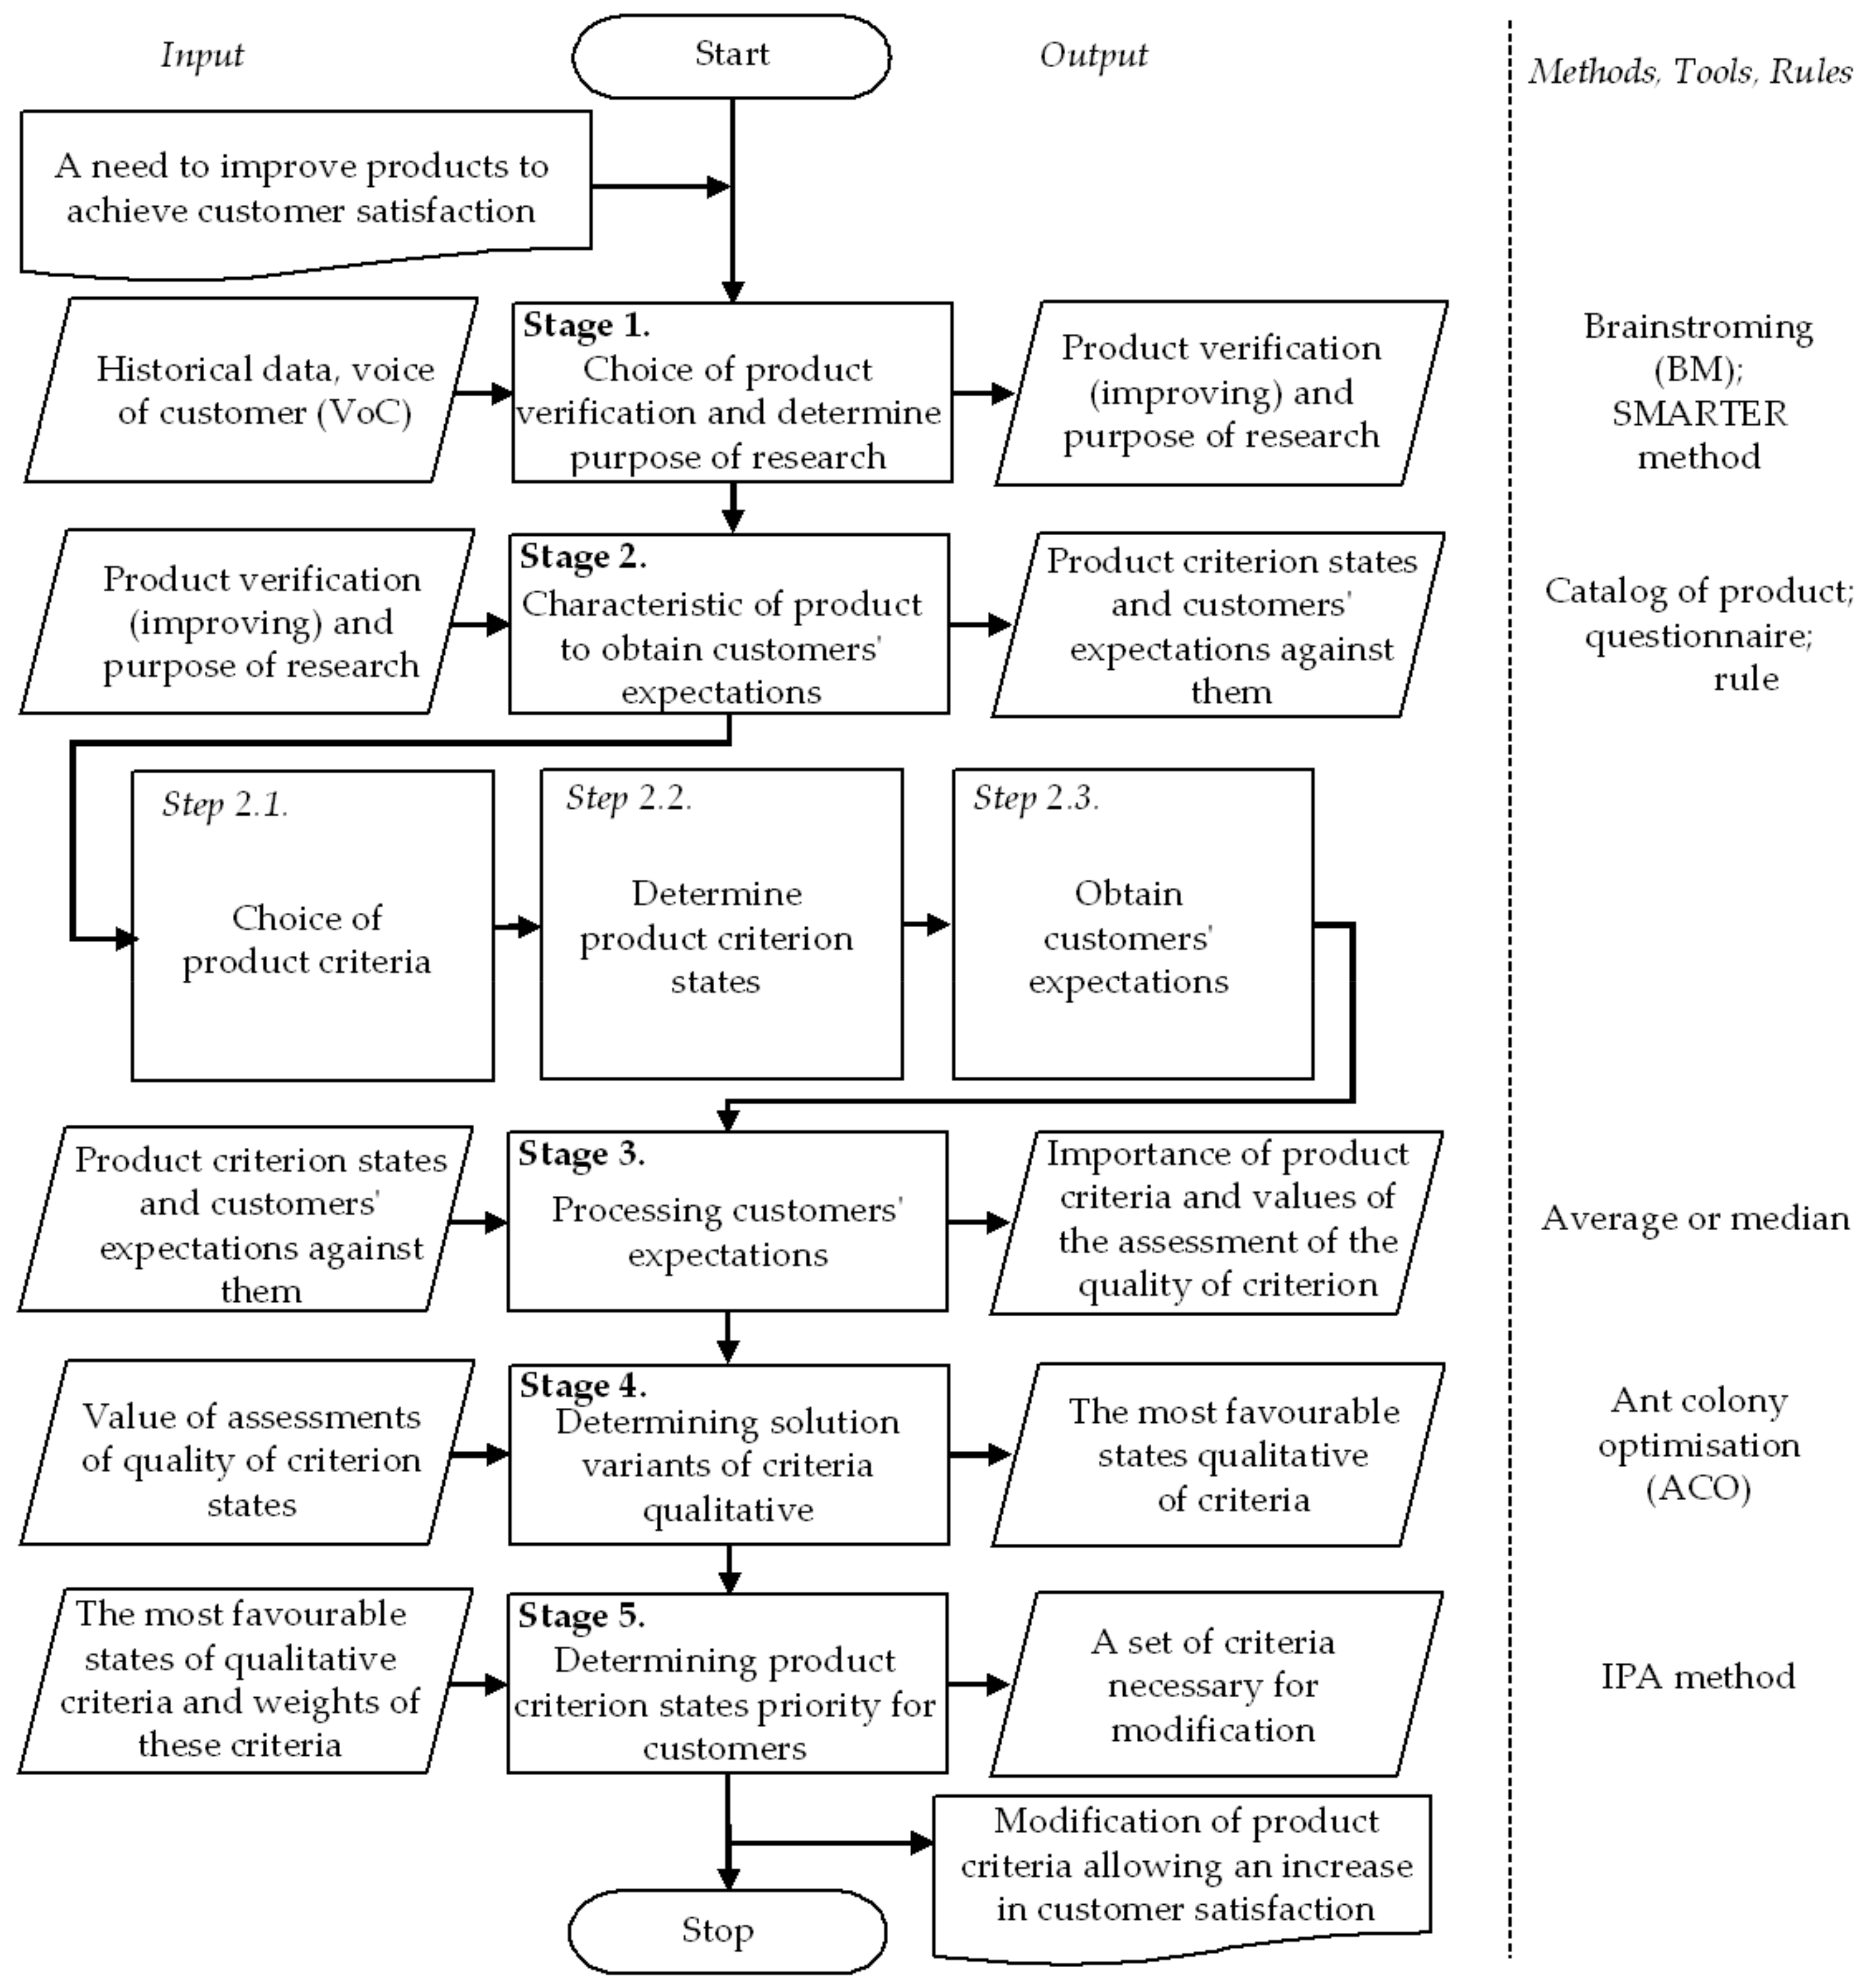
2.3. Algorithm and Characteristics of the Model

The model was developed in six main stages, as shown in Figure 2. The characteristics are shown in the next part of the study.

2.4. Stage 1. Choice of Product to Verification and Determine Purpose of Research

The idea of a model relies on predicting how to modify the product to achieve customer expectations (requirements). It was assumed that this modification would be designated to different criterion states of a single type of product. Therefore, the products to verify are unlimited, e.g., in the maturity phase or requiring the introduction of improvement actions due to the dynamics of market change. The final selection of the product results from the preferences of an expert (bidder, broker, entity), e.g., the company manager.
The purpose of this research should be the need to predict modifications of the product which will be the most favorable for customers. The purpose is determined by an entity (bidder, broker, expert) depending on the product choice to verify. During the determination of the purpose of the research, it is possible to use the SMARTER method (S—specific, M—measurable, A—achievable, R—relevant, realistic, or reward, T— ‘based on timeline’ or timebound, E—exciting or evaluated, R—recorded or reward) [23].

2.5. Stage 2. Characteristic of Product and Obtain Customers’ Expectations

2.5.1. Step 2.1. Choice of Product Criteria

The product selected for verification should be characterized by the criteria (attributes) that designate its quality level. These criteria are in the safety data sheets. These should be the basic criteria that have the biggest impact on the use of products by customers. The choice of criteria should be made during brainstorming (BM), as shown, e.g., in [24]. According to the authors of study [3,22,25], for the effective comparison of pairs, it is necessary to select the 7 ±   2 criteria. Additionally, the number should not be much bigger in view of the assumed research method, where all product criteria and their states will be verified according to ant colony optimization. As shown by the authors of study [39], a large number of criteria increases the time consumption of ACO, and in this case, approximate algorithms are more effective.

2.5.2. Step 2.2. Determine Product Criterion States

All product criteria should be described by their states, e.g., value or description. The product criterion states are available in the specification (catalog) of the product. Each criterion (attribute) of the product should have a single current state which characterizes the actual product. Despite the current state, it is necessary to determine the minimum of five states that are different from the current state (so-called modified states). The number of modified states is determined as the number of criteria, i.e., according to the 7 ±   2 rule [25] and the limitations of ACO [39,40,41. The modified states can be determined on a catalog of other products of the same type. For this aim, it is useful to use brainstorming (BM) carried out by a team of experts. All product criterion states should be characterized in terms of international metric units.

2.5.3. Step 2.3. Obtain Customers’ Expectations

The customers’ expectations are obtained for the product criteria and their states, which were determined in the earlier stages of the model. Customers’ expectations are obtained by a questionnaire, which is the most popular and effective tool for obtaining customers’ requirements [26]. The validity (significance) of the criteria for customers and the quality of the criteria states are assessed. Following the authors of studies [42,43,44], it was assumed that assessments could be awarded by dividing by 100 points, where fewer points are better. If the customer has a problem with filling out the questionnaire, e.g., a lack of adequate knowledge of the product criteria, it is recommended that the entity (expert) helps the client to complete it. The universal example of a questionnaire is shown in studies [21,22].
The number of customers for whom it is necessary to obtain the expectations to predict the quality of the product can be estimated according to the method presented in the study [37]. Generally, it can be assumed that as part of the improvement of products on the largest scale, the number of customers should be equal to 100 [43]. The model also has applications for unit production (creating a product based on individual customer expectations). Therefore, the number of customers can be small (even equal to 1), as shown in studies [20,36,44,45].

2.5.4. Stage 3. Processing Customers’ Expectations

The assessments obtained from more than a single customer should be processed for the realized next stages of the model. It refers to the calculation of the weights of the product criteria and the quality of the states of the product criteria. In this aim, the arithmetic average from the values granted by all the customers for the criteria weights are calculated, as shown in Formula (1) [37,43,46]:
x ¯ = i = 1 n x i n ,
where x—the score value for a criterion or the product criterion status; n—the number of observations (customers).
The arithmetic average values calculated for the weights of the criteria mean the importance (weights) of these criteria, whereas values of the arithmetic average for the product criteria states are analyzed in the decision matrices which are popular in MCDM (multi-criteria decision-making), e.g., in the FAHP (fuzzy analytic hierarchy process) [36,47,48]. It is necessary to create separate matrices for the comparison of pairs for each criterion. The rows and columns of the matrix are the states of a given product criterion, and the corresponding arithmetic mean values determine the quality of the criterion state according to the customers. The comparison in pairs of the states of the criteria is realized to obtain the difference between the quality of the states of these criteria. Therefore, the matrix is filled according to Formula (2):
a i j k = b i k b j k ,
where b—the value of arithmetic average for k criterion, which determines the quality of state of this criterion; k—product criterion, i, j—1,2,3…, n.
The developed matrices are used to determine variants for the solutions of the qualitative criteria.

2.5.5. Stage 4. Determining Solution Variants of Criteria Qualitative

At this stage, it is necessary to determine the possible variants for qualitative solutions to the criteria. It refers to the determination of a sequence (ranking) for the benefits of change (modification) to the state of the product criteria. The first position is the current state (the so-called state from which it is necessary to begin modification), and the next position is the modified state, which will allow the greatest customer satisfaction to be achieved. The farther you are in the queue from the current state, the less desired the state by customers. This is a traveling salesman problem (TSP), i.e., the optimization of tasks consists of determining the minimum (the shortest) path for solving the problem. In this case, it is the determining queue (ranking) of the product criteria states (modification, variants of current criteria states), where this ranking determines the possibility of increasing customer satisfaction. Hence, variants to the qualitative solutions of criteria are determined according to ant colony optimization (ACO). The analysis includes customer assessments granted to the product criteria states, which are shown in the decision matrix.
The principle of the operation of ACO is the following: each of the ants puts pheromone in adequate pheromone variables, which correspond to the edge of the road on which they were moving. These edges are more attractive to other ants. Later, the ants die. In this algorithm, pheromone evaporation is realized by alternating the ant’s activity. For this reason, the amount of pheromone τ i j t left on the edge i , j shows an attractive road from point i to point j according to this edge. The pheromone information changes with the experience the ants gain during the solution of problems. However, the amount of pheromones is proportional to the quality of the designated road, that is, the shorter the path, the more pheromone. Therefore, it is possible to move the ants in the right direction. The evaporation of the pheromone allows us to avoid the situation where all ants move on the same road. It is assumed that ants remember k visited places but also i places to which they have to go. The ant determines the graph of the state space and, in this way, finds the most favorable road to continue down [28,30,31].
Ants follow the designated trail according to the decision matrix A i = a j i t N i , which is created according to node i and is developed from local values of the pheromone trail and local heuristic values, as shown in Formula (3) [28,30]:
a i j t = τ i j t η i j β l N i τ i j t η i j β   j N i ,
where τ i j t —the amount of pheromone on the edge i ,   j in the moment t ;   η i j = 1 d i j —the heuristic shift value from point i to point j ; N i —the set of nearby (neighboring) points to point i ; β —the coefficient determining the weight of heuristic values.
The probability with which the ant k makes a decision that transitions from point i to point j N i k as part of building the road in the t - th iteration of the algorithm is determined by Formula (4) [28,31]:
p i j k t = a i j t l N i k a i j t ,
where N i k N i —the set of nodes near node i not visited by an ant k (where a member of ant k M k allows choice nodes in N i k from set N i ).
After the ants have travelled all the way, it is possible to evaporate the pheromone on all edges. Later, each ant k leave pheromones τ i j k t on the visited edges (5) [28,30,31]:
τ i j k t = q i j L k t w h e n i , j T k t 0 w h e n i , j T k t ,
where T k t —the road found by ant k in the iteration of t ; L k t —the length of the finding road; q—the dose factor of the pheromone left by the ant.
Therefore, it can be concluded that the value τ i j k t depends on the length of the road travelled by the ant, i.e., the shorter the path, the greater the amount of pheromone. The process of pairing and leaving the pheromone by ants is carried out for all the edges, as shown in the Formula (6) [28,30]:
τ i j t γ τ i j t + τ i j t w h e n τ i j t = k = 1 m τ i j k t ,
where m—the number of ants in each iteration, γ 0 ,   1 .
According to ACO, it is necessary to analyze the values of the developed decision matrices. It is necessary to assume that the so-called cost matrix is the decision matrix developed for each criterion. Therefore, the number of necessary analyses depends on the number of selected product criteria and, simultaneously, the number of states determined for them. ACO can be implemented in MATLAB software, as shown by the author of study [49]. Then, the calculation process is effective and less complicated. The results of this stage are the ranking of modifications to the current criteria states. In the next stage of the model, this ranking will depend on the weight (importance) criteria for customers.

2.5.6. Stage 5. Determining Product Criterion States Prioritize for Customers

The purpose of this stage is: (a) to determine which product criteria should be modified first to achieve customers’ expectations and (b) to determine which product criteria states can provide the greatest increase in customer satisfaction. The results of this stage will show which criteria and their states should be changed first to improve the quality product level. Having the weight of the product criteria and quality of the product criteria states, it is possible to use importance-performance analysis (IPA) and its alternative version. The alternative IPA directs the analysis to a specific distinction between the impact of weight and the quality (performance) of the criterion. IPA graph examples are shown in Figure 3.
Following the authors of study [31], it was assumed that to use an alternative version of IPA would be to predict which criteria and states of the criteria allowed the satisfaction of customers. The weight of the product criteria ( w i j ) and the quality of product criteria states ( q i j ) were calculated in the third stage of the model as arithmetic averages from the points obtained from customers. Initially, the IPA chart should be developed, which will show the relation of importance (weights) to all the product criteria for the current state of these criteria. The use of this chart is to identify which product criteria should be modified first to meet customer expectations. Then, it is necessary to develop the IPA chart separately for each product criterion. In these charts, it is necessary to show the relations between the criterion and their possible states (current and modified). The results of these charts allow us to determine which product criteria states can allow the greatest increase in customer satisfaction.
Ultimately, the results of IPA can be confronted with the results from the ACO analysis. First of all, action should be taken to improve those criteria in the product which are the most important for the customer (i.e., the area “concentrate here” from the IPA). Product improvement actions should be performed initially for those product criteria states that are both in the “concentrate here” area of the IPA and rank first in the ACO ranking. The final decision on the possible improvement actions belongs to the entity (expert, broker) and may depend on the production and financial capabilities or the possibility of correlating various modifications of the criteria states with each other.

3. Test of Model

A test of the model was carried out on photovoltaic panels of one of the key UE producers. The choice of photovoltaics resulted from the fact that it was one of the most popular RES [50,51]. The increased demand for these products but also the different preferences of these customers generated the need to adapt PV to changing customer expectations and a turbulent environment. Therefore, adjusting these products to customers’ expectations is extremely important. It was recognized that the results of the test showed not only the effectiveness of the model but also methodical support for searching for the best solutions for these products. The test of the model was carried out according to an assumed algorithm, that is, in the five main stages.

3.1. Stage 1. Choice of Product to Verification and Determine Purpose of Research

According to the first stage, the product for verification was selected. As mentioned, the product for verification was a photovoltaic panel (PV), one of the key producers from UE. Then, the purpose of the research was determined. The purpose was determined by the entity (the bidder) using the SMARTER method. The purpose was to determine modifications for the current photovoltaic system to meet customer expectations.

3.2. Stage 2. Characteristic of Product and Obtain Customers’ Expectations

The team of experts selected the criteria (attributes) of PV. The choice was made during brainstorming (BM) and according to the catalog of the product. As assumed, the basic PV criteria were selected, and these numbers were in the range of 7 ±   2 . These criteria were [21,52,53,54]:
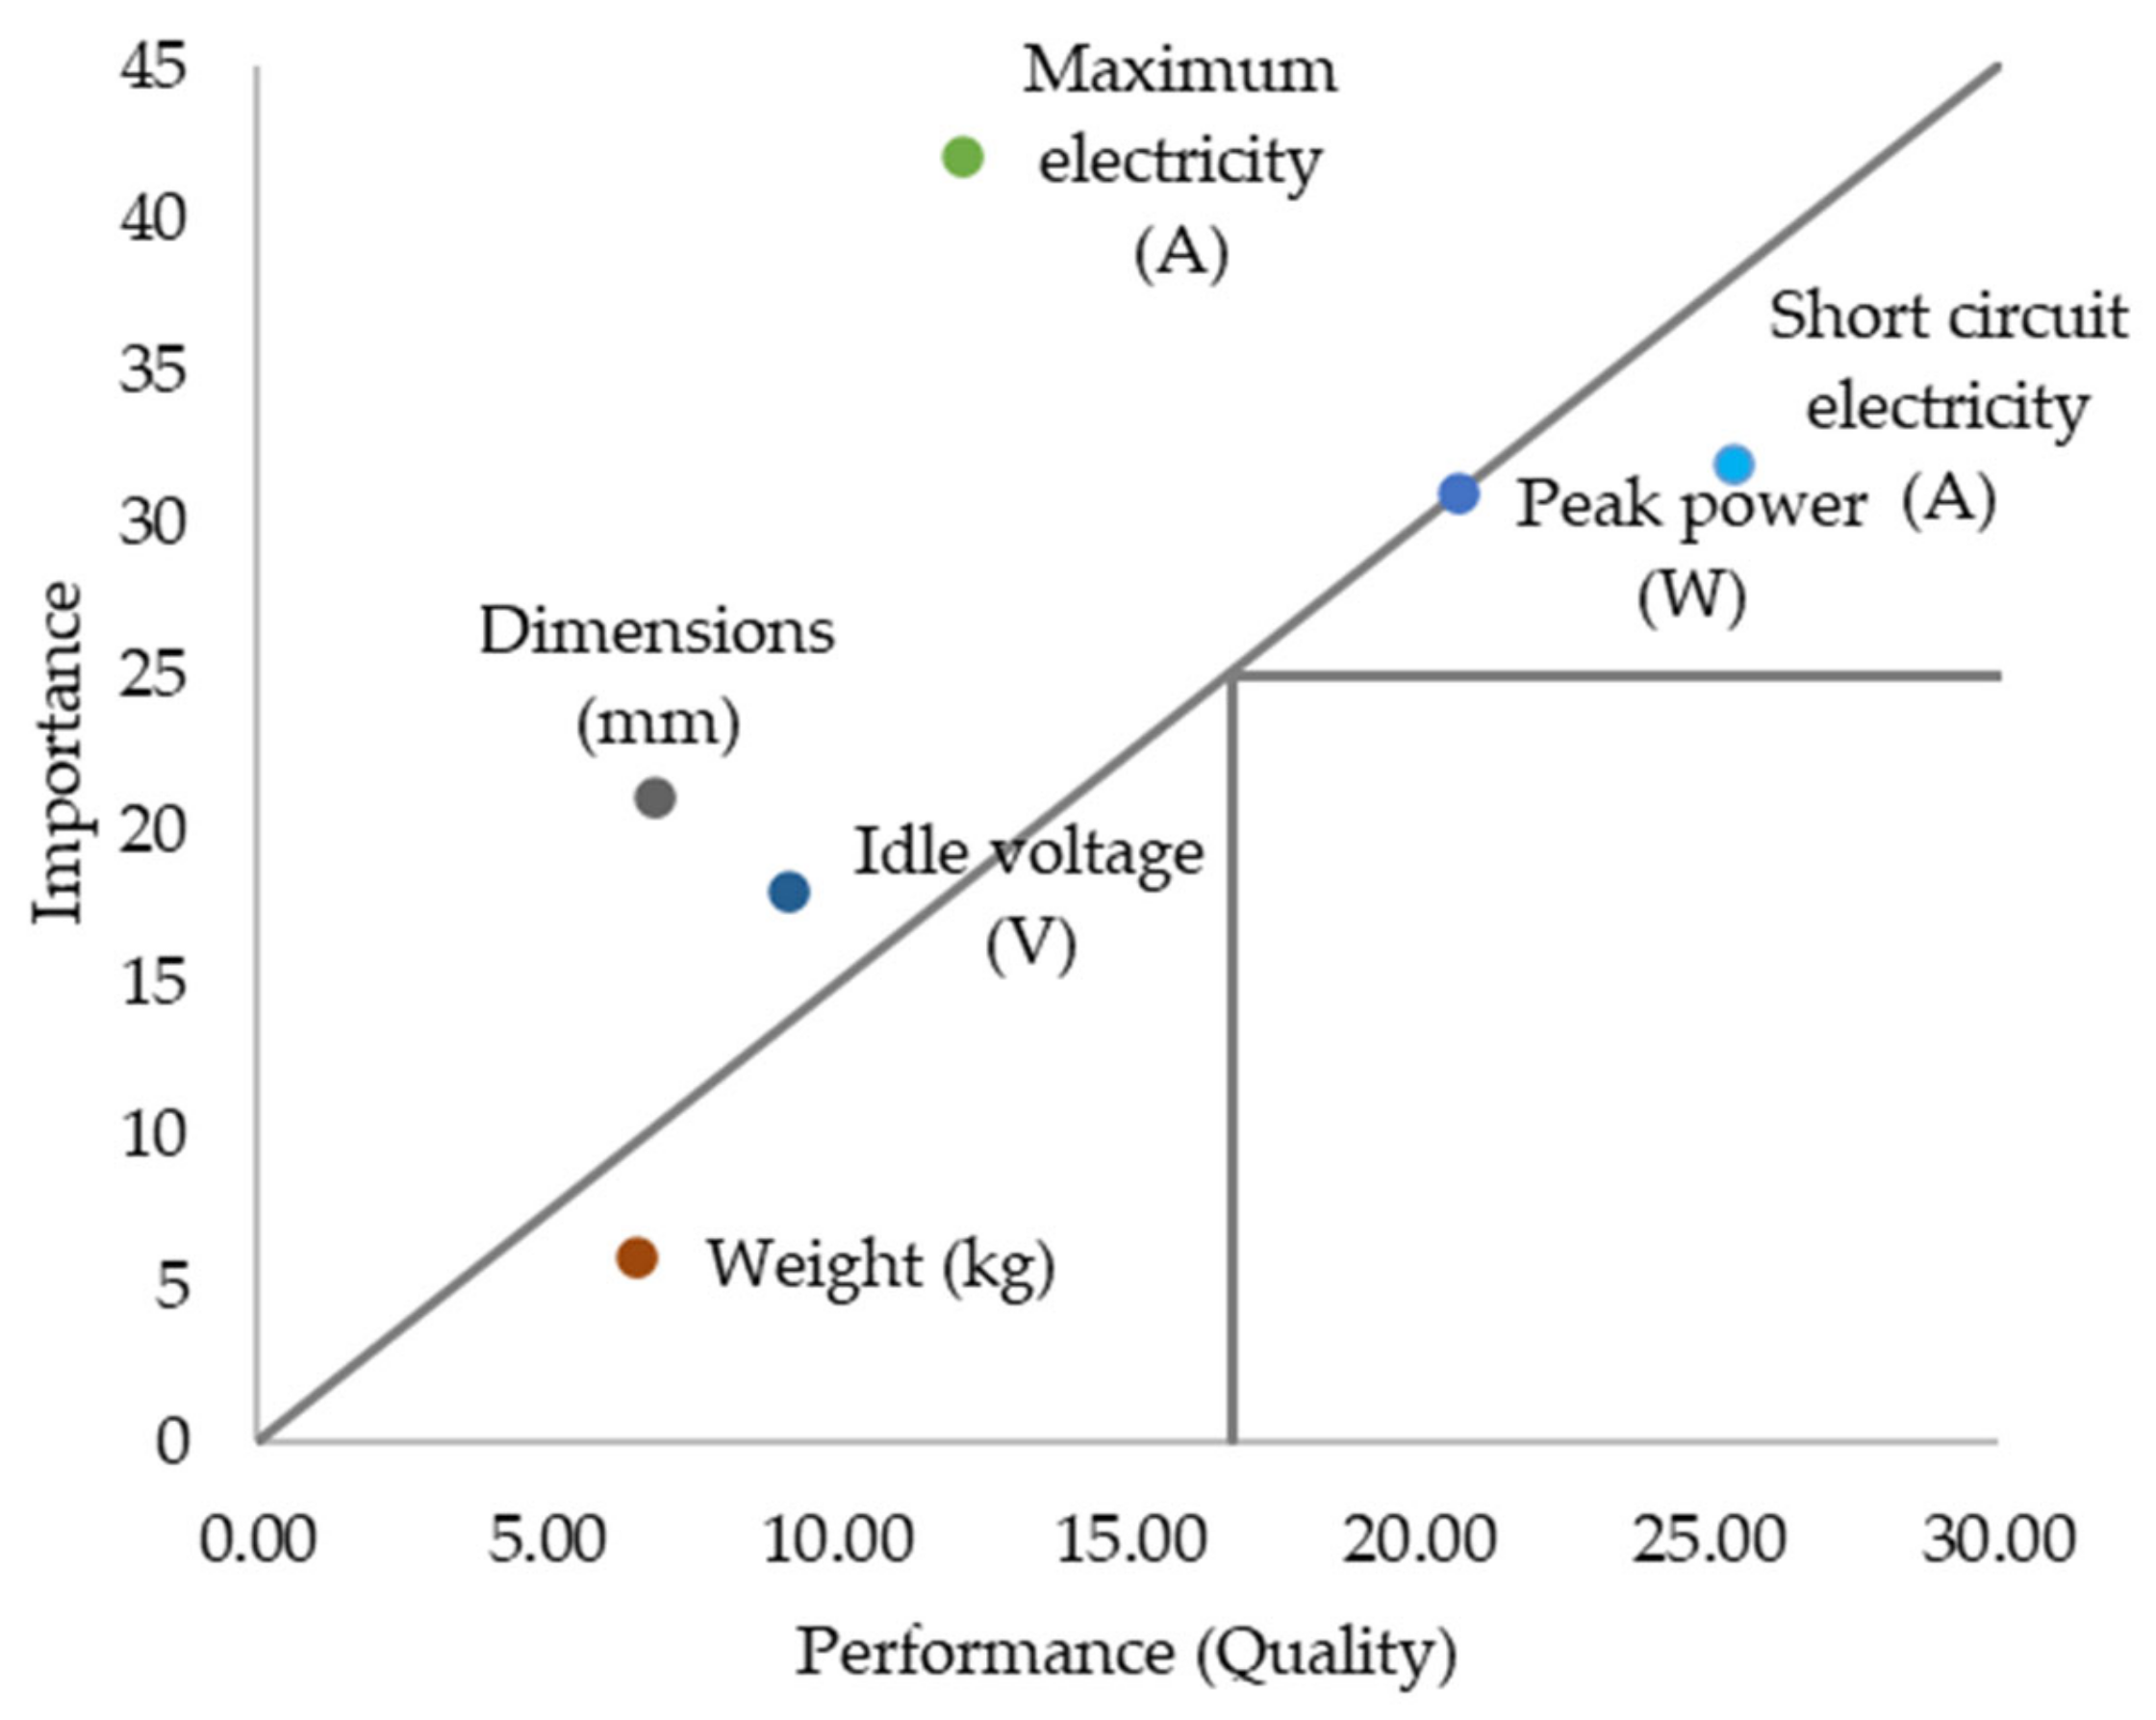
  • Short-circuit electricity (A)—this refers to electricity at a maximum load, so the intensity of electricity is achieved at the moment of a short circuit of the cell;
  • Peak power (W)—this is the highest average load measured or calculated over a specified time period;
  • Maximum electricity (A)—this is the electricity that powers the PV panel during the load;
  • Idle voltage (V)—this is the maximum (critical) voltage reached at the moment of maximum power that occurs under standard photovoltaic operating conditions;
  • Weight (kg)—total weight of the solar panel;
  • Dimensions (mm)—this refers to the length, width, and thickness of the solar panel.
After this, all PV criteria were characterized (described) by the current and modified states. The current state is the state that is currently in the photovoltaic panel selected for verification. The current states are available in the catalog (specification) of PV. The modified states are future states, which differ from the current state. The modified states were determined on the basis of the catalogs of other photovoltaic panels. The current and modified PV criteria were determined by a team of experts during brainstorming. As was assumed, the number of states of the criterion was in the range of 7 ±   2 . All states of the PV criteria are characterized by international metric units, as shown in Table 1.
Then, the customers’ expectations were obtained. The questionnaire was used for this. As part of the model test, a test sample of customers was obtained equal to seven customers (including the authors of the article). The importance of the PV criteria and the satisfaction of the state of the criteria. As assumed, the evaluations were made by dividing 100 points between the PV criteria and then the states of these criteria, where fewer points were more favorable.

3.3. Stage 3. Processing Customers’ Expectations

At this stage, the customers’ expectations were processed. In this regard, according to Formula (1), the arithmetic average was calculated for the weights of the PV criteria (Table 2) and the quality of the PV criteria (Table 3).
Based on the arithmetic average for the criteria states, decision matrices (d) were developed, which determined the differences between the quality of the states according to the criteria. The matrices were developed for each PV criterion, and Formula (2) was used for this. An example of one of these matrices is shown in Table 4.
Decision matrices were developed in the same way as for other PV criteria. On the basis of this, the possible variants of the qualitative solutions were determined.

3.4. Stage 4. Determining Solution Variants of Criteria Qualitative

Decision matrices and MATLAB software were used to determine the solution variants of the PV criteria. In the MATLAB program, the algorithm was implemented, which was developed based on the example shown in study [49].
The first criterion to analyze the ACO was the criterion of “short circuit electricity”. The fragment of the algorithm supporting the calculation of the ACO for this criterion is shown in Figure 4. This algorithm was developed on the basis of work [49] and then appropriately initiated in the MATLAB program. The presented calculation method is characterized later in the study.
Initially, the decision matrix (d) for short-circuit electricity was initiated. Then, the visibility (h) between the quality of the current states and the modified states for this criterion were determined. It consisted of determination of the reciprocal of the decision matrix for this criterion, as in Formula (3), i.e., η i j = 1 d i j —the heuristic shift value from point i to point j . The results are shown in Table 5.
Then, as in Formula (3), the same amount of pheromone   τ i j = 1 was used for each state of this criterion. In the proposed approach, it was assumed that the current state was the reference state, i.e., the state that defined how to modify the current criterion to make it satisfactory to customers. Therefore, the ranking of the modification began from state 1 (current). In view of that, the values from the column that determined state 1 were equal to 1 (i.e., in Table 5). The other values in Table 5 remained unchanged. As shown by Formula (4), the probability with which the first ant k would decide that it would go from state 1 to the modified states j N i k was calculated as part of building the road in the   i - th iteration of the algorithm, where α = 1 and β = 2.
Initially, the probability of the distance from the current state to all the modified states was calculated, as shown in Formula (7):
τ 12 η 12 2 = 0.0109 τ 13 η 13 2 = 0.0036 τ 14 η 14 2 = 0.0018 τ 15 η 15 2 = 0.0022 τ 16 η 16 2 = 0.0015 τ 17 η 17 2 = 0.0013 ,
The total value of the probability of traveling this way from the current state by all the modified states was equal to 0.0012. Then, according to Formula (4), the probability of travel for the first ant from the current state to all the modified states was calculated. The results are shown in Formula (8):
p 12 1 = 0.0109 0.0012 = 0.5140 p 13 1 = 0.0036 0.0012 = 0.1686 p 14 1 = 0.0018 0.0012 = 0.0827 p 15 1 = 0.0022 0.0012 = 0.1025 p 16 1 = 0.0015 0.0012 = 0.0690 p 17 1 = 0.0013 0.0012 = 0.0632 ,
Next, the cumulative value was calculated ( c p i j k )   for the probability of travel from the current to the modified state of the short-circuit electricity. The results are shown by Formula (9):
c p 12 1 = 0.5140 c p 13 1 = 0.1686 + 0.5140 = 0.6826 c p 14 1 = 0.0827 + 0.6825 = 0.7653   c p 15 1 = 0.1025 + 0.7653 = 0.8678 c p 16 1 = 0.0690 + 0.8678 = 0.9368 c p 17 1 = 0.0632 + 0.9368 = 1.0000 ,
Then, following the author of study [49], a random number was drawn in the computer system (MATLAB). This number was equal to 0.8147. This number was comparable (but not higher) than the fifth cumulative value c p 15 1 , where 0.8147 0.8678 . Therefore, from the current (first) state, the first ant followed the fifth state of the short-circuit electricity criterion.
Again, all values in the fifth status column (that is, in Table 5) were zeroed. At the same time, the column for the first state was still zeroed, whereas the other values in Table 5 remained unchanged. Later, calculations were carried out as for state 1. Therefore, in accordance with the previous assumptions, the probability of the distance from the fifth state to all the other modified states was calculated, as shown in Formula (10):
τ 52 η 52 2 = 0.0071 τ 53 η 53 2 = 0.0451 τ 54 η 54 2 = 0.1694 τ 56 η 56 2 = 0.0451 τ 57 η 57 2 = 0.0291 ,
The total value of the probability of traveling from the fifth state through all the other modified states was 0.2957. Later, the transition of the probability of the first ant from the current state to all the modified states was calculated according to Formula (4). The results are presented in Formula (11):
p 52 1 = 0.0071 0.2957 = 0.0240 p 53 1 = 0.0451 0.2957 = 0.1524 p 54 1 = 0.1694 0.2957 = 0.5726 p 52 1 = 0.0451 0.2957 = 0.1524 p 52 1 = 0.0291 0.2957 = 0.0985 ,
Then, a cumulative value ( c p i j k )   from the value probability of travelling from the fifth modified state to other states was calculated (12):
c p 52 1 = 0.0240 c p 53 1 = 0.1524 + 0.0240 = 0.1765 c p 54 1 = 0.5726 + 0.1765 = 0.7491   p 56 1 = 0.1524 + 0.7491 = 0.9015 p 57 1 = 0.0985 + 0.9015 = 1.0000 ,
After this, again following the author of study [49], the random number was drawn by using the MATLAB program. This number was equal to 0.9058. The number was comparable (but not higher) to the seventh accumulated value c p 57 1 , where 0.9058 1.0000 . Therefore, from the fifth state, the first ant followed later to the seventh state of the short-circuit electricity criterion. The procedure was the same for the remaining states of the short-circuit current criterion as before until the verification of all the states of this criterion. The first ant’s path (i.e., the order of modification of the current state of the short-circuit electricity) was as follows (13):
r 1 = S t a t e   1 ;   S t a t e   5 ;   S t a t e   7 ;   S t a t e   6 ;   S t a t e   4 ;   S t a t e   3 ;   S t a t e   2 ;   S t a t e   1
The transition of the first ant back to its present state was even   r 1 = 54.57 . Then, the algorithm in the MATLAB program was started, an example of which was shown by the author of study [49]. It was assumed that the number of iterations (the number of ant passes) was equal to 50. The number of ants was equal to 20. After traveling all roads with the ants, it was possible to pair pheromones on all edges. Later, each ant k left the pheromone τ i j k t on the edge, which was visited, as shown in Formulas (5) and (6). As a result, the most favorable order of modification for the current state was determined for the photovoltaic criterion, such as short-circuit electricity (14):
r t h e   b e s t   t o u r s h o r t c i r c u i t   e l e c t r i c i t y = S t a t e   1 ;   S t a t e   2 ;   S t a t e   3 ;   S t a t e   5 ;   S t a t e   4 ;   S t a t e   6 ;   S t a t e   7 ;   S t a t e   1 = 54.56
The passage of all 20 ants with 50 repetitions from the current state and back was equal to r t h e   b e s t   t o u r s h o r t c i r c u i t   e l e c t r i c i t y = 54.56 . Hence, this order of modification was adopted for the “short-circuit electricity” criterion.
Subsequently, all other PV criteria were verified. The calculations for the remaining criteria were carried out in accordance with the methodology presented for the “short-circuit electricity” criterion. In this way, the most advantageous order of modification for the current states was determined for all the verified photovoltaic criteria. The ACO result for the states of the PV criteria is shown in Table 6.

3.5. Stage 5. Determining Product Criterion States Prioritize for Customers

At this stage, the IPA (importance-performance analysis) was used. As in the assumed method, first the PV criteria and then simultaneously the states of these criteria were analyzed. At this stage, the weights of the PV criteria were combined with the states of the quality of the PV criteria (from stage 3, i.e., Table 2 and Table 3). Initially, an IPA chart was developed with the importance of all PV criteria only for the current states of these criteria (Figure 5).
It was shown that, at the first, it was necessary to modify the current state for the PV criteria, i.e., the dimensions, maximum current, and idle voltage. Modifying these criteria would allow them to increase their satisfaction.
Then, separate IPA charts were developed for each PV criteria. These graphs show the relationship between the importance of the PV criterion and their states (current and modified). The result is shown in Figure 6.
The analysis of results from the IPA charts allowed us to conclude that:
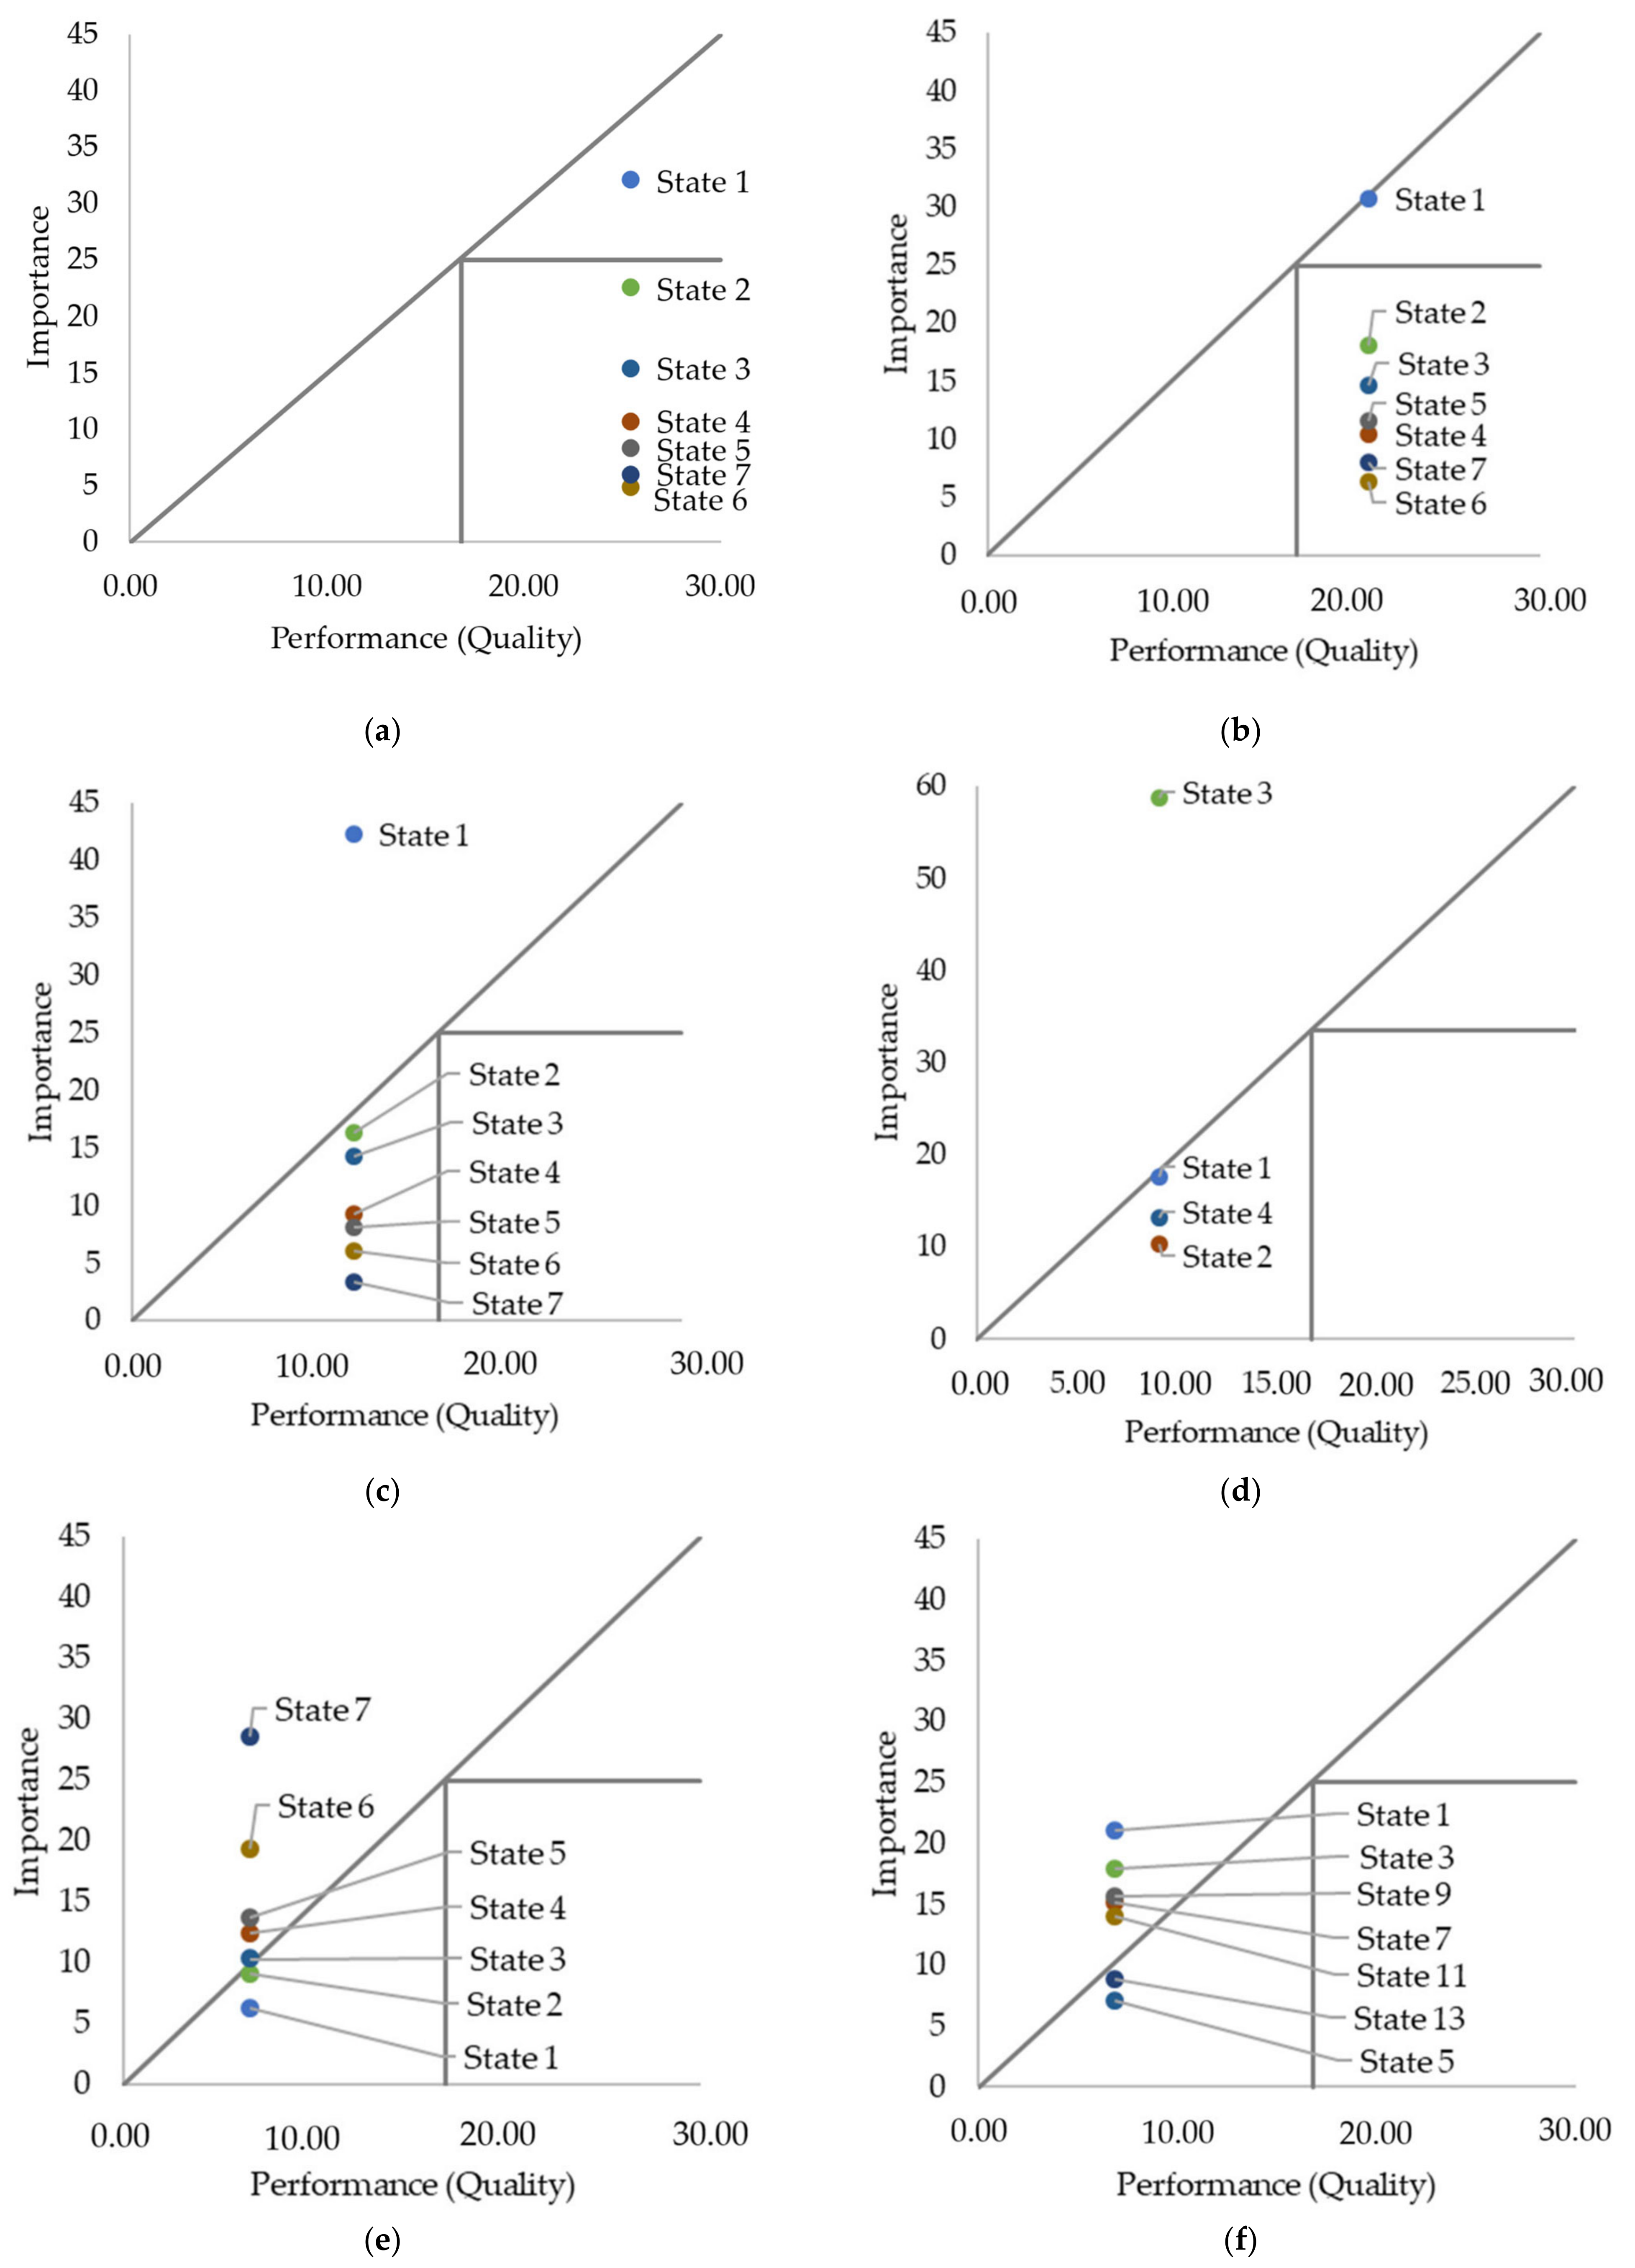
  • There is no difference in how the PV short-circuit electricity will be modified because the current state is sufficient for the customers and all proposed modifications are fully satisfactory for the customers;
  • There is no difference in how the PV peak power will be modified because the current status is sufficient for customers and all proposed modifications are fully satisfactory for customers;
  • To modification of the current state to the maximum current should be undertaken, where all proposed modifications will surely be more satisfactory for customers;
  • The third state of the idle voltage should be a priority in modifying this criterion, where the remaining states of this criterion will be comparatively satisfactory for customers;
  • State 7, state 6, state 5, and state 4 for the PV weight should be the priority in modifying this criterion;
  • State 2, state 3, and state 5 for the PV dimensions should be the priority in modifying this criterion.
In the final stage, improvement activities are carried out for PV. For this purpose, the entity (expert) should compare the ACO results with the IPA results. On their basis, the final decision should be made on what improvement actions to take and in what sequence to meet customer expectations. An example of this type of analysis is presented in the discussion.

4. Discussion

Renewable energy sources (RES), mainly photovoltaic panels (PV), are the main tools to improve the natural environment [6]. It has been shown that different approaches to improve PV were used [11,14,17]. Some of these included customers’ expectations [10,55]. Despite this, there are no studies that focus on the ways of determining the best solutions based on the modification of PV criteria. There are no works that match the producers with the best changes in the quality criteria of photovoltaics and that take into account customer expectations. Therefore, the purpose of this investigation was to develop a model to determine the best modification of products considering the expectations of the customers. The model was carried out for a key producer of PV from UE. The basic criteria of PV were verified, i.e., short-circuit electricity, peak power, maximum current, idle voltage, weight, and dimensions. All criteria were described by current and modified states. For these criteria and these states, customer expectations were obtained, where these requirements referred to the importance of PV criteria and the quality of PV criteria states. A questionnaire was used for this. Then, the ways of modifying these criteria to achieve customer satisfaction were determined. ACO was used for this. Then, IPA was used for the combination of the states of the weight and quality of the PV criteria. The results of ACO and IPA were presented to indicate PV improvement activities in line with the expectations of customers and, at the same time, the entity (expert, company).
The final result from the confrontation of the model results for the verified PV is presented in Table 7.
Based on the results of the model, it is possible to improve the PV selected for verification. The main benefits of the proposed model include the possibility of defining:
  • A way of modifying the current state of the product criteria to achieve customers’ satisfaction;
  • A product criteria necessary to improve at first to achieve the expected quality product level;
  • Benefit modifications to the product criteria even for slight differences between the customers satisfaction from states of these criteria.
The proposed model has also business implications, i.e., a low-costed tool which can be effective and uncomplicated for the possible initiation of it in the computer program, e.g., MATLAB. Therefore, the search for benefit solutions in the product is free from errors caused by calculation errors carried out in the traditional way. Another advantage of the model is the fact that the solutions in the product, designated according to the model, can be made dependent not only on customer expectations but also on the capabilities of the production company (entity—expert), e.g., production capabilities, implementation possibilities due to the state of other criteria, and financial possibilities.
On the other hand, the limitations of the model are its adequacy in verifying a small number of criteria (<9). Additionally, using the model without computer support can be time-consuming. It is possible to expand the methodology academically by comparing the choices made with other methodologies that are based on the same or similar decision support and optimization methods. IT support for selected stages of the model is also an added value, e.g., the MATLAB program for ACO. Another added value would be to implement this model in its entirety as a computer tool for later, easier utilitarian use.

5. Conclusions

The challenges to the environment resulting from climate change have caused the popularization of RES. Among the most popular are photovoltaic panels. However, dynamic changes in customers’ expectations make it difficult to achieve the quality needed for these products. Therefore, the purpose of this investigation was to develop a model to determine the best modification of products considering the expectations of the customers. The model was developed by integrated techniques, i.e., the SMARTER method, brainstorming (BM), rule 7 ±   2 ,   questionnaire, ant colony optimization (ACO), and importance-performance analysis (IPA).
After the test of the model, it was shown that it was possible to determine the a of product improvement through a sequence of modifications to the product criteria states while simultaneously considering customers’ expectations toward the quality and importance of product criteria.
Future research will be based on the verification of other kinds of products and initiation techniques to support the determination of accurate results for the model, depending on the number of customers from which expectations are obtained.

Author Contributions

Conceptualization, A.P., D.S. and G.O.; methodology, A.P. and D.S.; formal analysis, D.S. and G.O.; writing—original draft preparation, D.S. and G.O; writing—review and editing, A.P.; visualization, A.P. and D.S.; supervision, A.P.; project administration, A.P., G.O. and D.S. All authors have read and agreed to the published version of the manuscript.

Funding

This research received no external funding.

Institutional Review Board Statement

Not applicable.

Informed Consent Statement

Not applicable.

Data Availability Statement

Not applicable.

Conflicts of Interest

The authors declare no conflict of interest.

References

  1. Calì, M.; Hajji, B.; Nitto, G.; Acri, A. The Design Value for Recycling End-of-Life Photovoltaic Panels. Appl. Sci. 2022, 12, 9092. [Google Scholar] [CrossRef]
  2. Armendáriz-Ontiveros, M.M.; Dévora-Isiordia, G.E.; Rodríguez-López, J.; Sánchez-Duarte, R.G.; Álvarez-Sánchez, J.; Villegas-Peralta, Y.; Martínez-Macias, M.d.R. Effect of Temperature on Energy Consumption and Polarization in Reverse Osmosis Desalination Using a Spray-Cooled Photovoltaic System. Energies 2022, 15, 7787. [Google Scholar] [CrossRef]
  3. Pacana, A.; Siwiec, D. Method of Determining Sequence Actions of Products Improvement. Materials 2022, 15, 6321. [Google Scholar] [CrossRef] [PubMed]
  4. Barakat, S.; Emam, A.; Samy, M. Investigating grid-connected green power systems’ energy storage solutions in the event of frequent blackouts. Energy Rep. J. 2022, 8, 5177–5191. [Google Scholar] [CrossRef]
  5. Pérez, C.; Ponce, P.; Meier, A.; Dorantes, L.; Sandoval, J.O.; Palma, J.; Molina, A. S4 Framework for the Integration of Solar Energy Systems in Small and Medium-Sized Manufacturing Companies in Mexico. Energies 2022, 15, 6882. [Google Scholar] [CrossRef]
  6. Tawalbeh, M.; Al-Othman, A.; Kafiah, F.; Abdelsalam, E.; Almomani, F.; Alkasrawi, M. Environmental impacts of solar photovoltaic systems: A critical review of recent progress and future outlook. Sci. Total Environ. 2021, 759, 143528. [Google Scholar] [CrossRef]
  7. Olczak, P. Energy Productivity of Microinverter Photovoltaic Microinstallation: Comparison of Simulation and Measured Results—Poland Case Study. Energies 2022, 15, 7582. [Google Scholar] [CrossRef]
  8. Amaral, T.G.; Pires, V.F.; Pires, A.J. Fault Detection in PV Tracking Systems Using an Image Processing Algorithm Based on PCA. Energies 2021, 14, 7278. [Google Scholar] [CrossRef]
  9. Deshpande, K.; Möhl, P.; Hämmerle, A.; Weichhart, G.; Zörrer, H.; Pichler, A. Energy Management Simulation with Multi-Agent Reinforcement Learning: An Approach to Achieve Reliability and Resilience. Energies 2022, 15, 7381. [Google Scholar] [CrossRef]
  10. Siwiec, D.; Pacana, A. A New Model Supporting Stability Quality of Materials and Industrial Products. Materials 2022, 15, 4440. [Google Scholar] [CrossRef]
  11. Baouche, F.Z.; Abderezzak, B.; Ladmi, A.; Arbaoui, K.; Suciu, G.; Mihaltan, T.C.; Raboaca, M.S.; Hudișteanu, S.V.; Țurcanu, F.E. Design and Simulation of a Solar Tracking System for PV. Appl. Sci. 2022, 12, 9682. [Google Scholar] [CrossRef]
  12. Sarbu, I.; Mirza, M.; Muntean, D. Integration of Renewable Energy Sources into Low-Temperature District Heating Systems: A Review. Energies 2022, 15, 6523. [Google Scholar] [CrossRef]
  13. Al Siyabi, I.; Al Mayasi, A.; Al Shukaili, A.; Khanna, S. Effect of Soiling on Solar Photovoltaic Performance under Desert Climatic Conditions. Energies 2021, 14, 659. [Google Scholar] [CrossRef]
  14. Jeremiasz, O.; Nowak, P.; Szendera, F.; Sobik, P.; Kulesza-Matlak, G.; Karasiński, P.; Filipowski, W.; Drabczyk, K. Laser Modified Glass for High-Performance Photovoltaic Module. Energies 2022, 15, 6742. [Google Scholar] [CrossRef]
  15. Samy, M.; Barakat, S.; Mossad, M.I. Optimal Economic Study of Hybrid PV-Wind-Fuel Cell System Integrated to Unreliable Electric Utility Using Hybrid Search Optimization Technique. Int. J. Hydrogen Energy 2021, 46, 11217–11231. [Google Scholar] [CrossRef]
  16. Coelho, S.; Monteiro, V.; Sousa, T.J.C.; Barros, L.A.M.; Pedrosa, D.; Couto, C.; Afonso, J.L. A Unified Power Converter for Solar PV and Energy Storage in dc Microgrids. Batteries 2022, 8, 143. [Google Scholar] [CrossRef]
  17. Vu, H.; Vu, N.H.; Shin, S. Static Concentrator Photovoltaics Module for Electric Vehicle Applications Based on Compound Parabolic Concentrator. Energies 2022, 15, 6951. [Google Scholar] [CrossRef]
  18. Alilou, M.; Gharehpetian, G.B.; Ahmadiahangar, R.; Rosin, A.; Anvari-Moghaddam, A. Day-Ahead Scheduling of Electric Vehicles and Electrical Storage Systems in Smart Homes Using a Novel Decision Vector and AHP Method. Sustainability 2022, 14, 11773. [Google Scholar] [CrossRef]
  19. Łakomiak, A. Civic Energy in an Orchard Farm–Prosumer and Energy Cooperative—A New Approach to Electricity Generation. Energies 2022, 15, 6918. [Google Scholar] [CrossRef]
  20. Ostasz, G.; Siwiec, D.; Pacana, A. Universal Model to Predict Expected Direction of Products Quality Improvement. Energies 2022, 15, 1751. [Google Scholar] [CrossRef]
  21. Pacana, A.; Siwiec, D. Model to Predict Quality of Photovoltaic Panels Considering Customers’ Expectations. Energies 2022, 15, 1101. [Google Scholar] [CrossRef]
  22. Siwiec, D.; Pacana, A. Model of Choice Photovoltaic Panels Considering Customers’ Expectations. Energies 2021, 14, 5977. [Google Scholar] [CrossRef]
  23. Lawlor, K.B.; Hornyak, M.J. Smart Goals: How The Application Of Smart Goals Can Contribute To Achievement Of Student Learning Outcomes. Dev. Bus. Simul. Exp. Learn. 2012, 39, 259–267. [Google Scholar]
  24. Putman, V.; Paulus, P. Brainstorming, Brainstorming. Rules and Decision Making. J. Creat. Behav. 2009, 43, 29–40. [Google Scholar] [CrossRef]
  25. Mu, E.; Pereyra-Rojas, M. Practical Decision Making. In Springer Briefs in Operations Research, Appendix A: Practical Questions Related to AHP Modeling; Springer Nature: Basel, Switzerland, 2017; pp. 105–106. [Google Scholar]
  26. Kohr, R.; Suydam, N. An instrument for evaluating survey research. J. Educ. Res. 1970, 64, 78–85. [Google Scholar] [CrossRef]
  27. Guven, A.; Yorukeren, N.; Samy, M. Design Optimization of a Stand-Alone Green Energy System of University Campus Based on JAYA-Harmony Search and Ant Colony Optimization Algorithms Approaches. Energy 2022, 253, 124089. [Google Scholar] [CrossRef]
  28. Optimization of an Ant Colony as Applied to the Traveling Salesman Problem [Optymalizacja Kolonii Mrówej w Zastosowaniu do Problemu Komiwojażera]. Available online: https://www.ii.pwr.edu.pl/~kwasnicka/tekstystudenckie/algorytmymrowkowe.pdf (accessed on 4 September 2022).
  29. Palma-Heredia, D.; Verdaguer, M.; Puig, V.; Poch, M.; Cugueró-Escofet, M.À. Comparison of Optimisation Algorithms for Centralised Anaerobic Co-Digestion in a Real River Basin Case Study in Catalonia. Sensors 2022, 22, 1857. [Google Scholar] [CrossRef]
  30. Szmygelska, A.; Hoos, H. An ant colony optimisation algorithm for the 2D and 3D hydrophobic polar protein folding problem. BMC Bioinform. 2005, 6, 1–22. [Google Scholar] [CrossRef] [Green Version]
  31. Abalo, J.; Varela, J.; Manzano, V. Importance values for Importance-Performance Analysis: A formula for spreading out values derived from preference rankings. J. Bus. Res. 2007, 60, 115–121. [Google Scholar] [CrossRef]
  32. Hu, J.; Zhang, Z.; Qiu, H.; Zhao, J.; Xu, X. Enhanced Hybrid Ant Colony Optimization for Machining Line Balancing Problem with Compound and Complex Constraints. Appl. Sci. 2022, 12, 4200. [Google Scholar] [CrossRef]
  33. Ahmed, A.A.M.; Sharma, E.; Jui, S.J.J.; Deo, R.C.; Nguyen-Huy, T.; Ali, M. Kernel Ridge Regression Hybrid Method for Wheat Yield Prediction with Satellite-Derived Predictors. Remote Sens. 2022, 14, 1136. [Google Scholar] [CrossRef]
  34. Kim, B.-Y.; Oh, H. An extended application of Importance-Performance Analysis. J. Hosp. Leis. Mark. 2001, 9, 107–125. [Google Scholar] [CrossRef]
  35. Choi, J.; Boher, C. Association Planners’ Satisfaction An Application of Importance-Performance Analysis. J. Conv. Exhib. Manag. 2000, 2, 113–129. [Google Scholar] [CrossRef]
  36. Ulewicz, R.; Siwiec, D.; Pacana, A.; Tutak, M.; Brodny, J. Multi-Criteria Method for the Selection of Renewable Energy Sources in the Polish Industrial Sector. Energies 2021, 14, 2386. [Google Scholar] [CrossRef]
  37. Siwiec, D.; Pacana, A. A Pro-Environmental Method of Sample Size Determination to Predict the Quality Level of Products Considering Current Customers’ Expectations. Sustainability 2021, 13, 5542. [Google Scholar] [CrossRef]
  38. Wolniak, R. The use of QFD method advantages and limitation. Prod. Eng. Arch. 2018, 18, 14–17. [Google Scholar] [CrossRef] [Green Version]
  39. Jakubowska, A.; Piechocka, K. In Search Of The Optimal Route -Selected Algorithms Applicable To The Traveling Salesman Problem [W poszukiwaniu optymalnej trasy–wybrane algorytmy w zastosowaniu do problemu Komiwojażera]. J. Translogistics 2015, 1, 7–23. [Google Scholar]
  40. Wakita, T.; Ueshima, N.; Noguchi, H. Psychological Distance Between Categories in the Likert Scale: Comparing Different Numbers of Options. Educ. Psychol. Meas. 2012, 72, 533–546. [Google Scholar] [CrossRef]
  41. Sullivan, G.; Artino, A. Analyzing and Interpreting Data From Likert-Type Scales. J. Grad. Med. Educ. 2013, 5, 541–542. [Google Scholar] [CrossRef] [Green Version]
  42. Joshi, A.; Kale, S.; Chandel, S.; Pal, D. Likert Scale: Explored and Explained. Curr. J. Appl. Sci. Technol. 2015, 7, 396–403. [Google Scholar] [CrossRef]
  43. Tadeusiewicz, R.; Izworski, A.; Majewski, J. Biometria; AGH: Cracow, Poland, 1993; pp. 1–379. Available online: https://winntbg.bg.agh.edu.pl/skrypty2/0086/main.html (accessed on 2 September 2022).
  44. SoonHu, S. A decision model for evaluating third-party logistics providers using fuzzy analytic hierarchy process. Afr. J. Bus. Manag. 2010, 4, 339–349. [Google Scholar]
  45. Gawilk, R. Stratification of research target group and selection of experts for AHP-based decision making model. In The Application of Analytic Hierarchy Process for Analyzing Material and Non-material Determinants of Life Quality of Young Europeans. Misc. Oeconomicae 2016, 3, 193–200. [Google Scholar]
  46. Winiarski, J. The Risk In It Projects—Statistical Evaluation Tools [Ryzyko w projektach artystycznych–statystycznych narzędzi oceny]. Współczesna gospodarka. Elektron. Nauka. J. 2012, 3, 35–42. [Google Scholar]
  47. Jinturkar, A.; Deshmukh, S.; Sarode, A.; Sunapwar, V.; Khodke, P. Fuzzy-AHP Approach to Improve Effectivness of Supply Chain. In Supply Chain Management Under Fuzziness; Springer: Berlin/Heidelberg, Germany, 2014; pp. 35–59. [Google Scholar] [CrossRef]
  48. Liu, Y.; Eckert, C.; Earl, C. A review of fuzzy AHP methods for decision-making with subjective judgements. Expert Syst. Appl. 2020, 161, 113738. [Google Scholar] [CrossRef]
  49. Santosa, B. Tutorial on Ant Colony Optimization. Available online: https://bsantosa.files.wordpress.com/2015/03/aco-tutorial-english2.pdf (accessed on 25 September 2022).
  50. Jie, Y.; Ji, X.; Yue, A.; Chen, J.; Deng, Y.; Chen, J.; Zhang, Y. Combined Multi-Layer Feature Fusion and Edge Detection Method for Distributed Photovoltaic Power Station Identification. Energies 2020, 13, 6742. [Google Scholar] [CrossRef]
  51. Jastrzębska, M. Installation’s Conception in the Field of Renewable Energy Sources for the Needs of the Silesian Botanical Garden. Energies 2022, 15, 6598. [Google Scholar] [CrossRef]
  52. Lucchi, E.; Polo, C.S.; Franco, G. A conceptual framework on the integration of solar energy systems in heritage sites and buildings. In Proceedings of the IOP Conference Series: Materials Science and Engineering International Conference Florence Heri-tech: The Future of Heritage Science and Technologies, Florence, Italy, 14–16 October 2020; Volume 949. [Google Scholar]
  53. Sánchez-Pantoja, N.; Vidal, R.; Pastor, M.C. EU-Funded Projects with Actual Implementation of Renewable Energies in Cities. Analysis of Their Concern for Aesthetic Impact. Energies 2021, 14, 1627. [Google Scholar] [CrossRef]
  54. Yildirim, M.A.; Nowak-Ocłoń, M. Modified Maximum Power Point Tracking Algorithm under Time-Varying Solar Irradiation. Energies 2020, 13, 6722. [Google Scholar] [CrossRef]
  55. Wilkins, H. Using Importance-Performance Analysis to Appreciate Satisfaction in Hotels. J. Hosp. Mark. Manag. 2010, 19, 866–888. [Google Scholar] [CrossRef]
Figure 1. General concept of model.
Energies 15 08102 g001
Figure 2. Framework of the proposed model supporting the selection of heat pumps with significant consideration of customer expectations.
Energies 15 08102 g002
Figure 3. IPA chart: (a) basic, (b) alternative. Own study based on [22].
Energies 15 08102 g003
Figure 4. Fragment of algorithm initiated in MATLAB program for PV criterion: (a) first part, (b) second part.
Energies 15 08102 g004
Figure 5. IPA chart for PV criteria.
Energies 15 08102 g005
Figure 6. IPA charts for the PV criteria states: (a) short-circuit electricity, (b) peak power, (c) maximum current, (d) idle voltage, (e) weight, (f) dimensions.
Energies 15 08102 g006
Table 1. States of PV criteria.
Criteria of PVState 1State 2State 3State 4State 5State 6State 7
Short circuit electricity (A)0.621.111.842.63.273.067.94
Peak power (W)102030455550130
Maximum electricity (A)0.561.111.672.432.972.787.22
Idle voltage (V)21.62121.722.222.221.621.6
Weight (kg)1.11.72.24.23.63.48.5
Dimensions (mm)430 × 190 × 25430 × 345 × 25545 × 345 × 25450 × 660 × 25640 × 540 × 30636 × 505 × 301190 × 669 × 35
State 1—current state; states 2–7—modified states.
Table 2. Weights of PV criteria.
Criteria of PVWeight (w)
Short circuit electricity (A)25.43
Peak power (W)18.71
Maximum electricity (A)20.71
Idle voltage (V)12.14
Weight (kg)9.14
Dimensions (mm)6.57
Table 3. Values of the arithmetic means determining the quality of the PV criteria states.
Criteria of PVState 1State 2State 3State 4State 5State 6State 7
Short circuit electricity (A)32231581165
Peak power (W)311815121086
Maximum electricity (A)4216149863
Idle voltage (V)18591310---
Weight (kg)691019141229
Dimensions (mm)211618141579
State 1—current state; states 2–7—modified states.
Table 4. The decision matrix for the PV criterion (short circuit electricity) with differences between the quality of states for this criterion according to customers.
Short Circuit
Electricity (A)
State 1
(32)
State 2
(23)
State 3
(15)
State 4
(8)
State 5
(11)
State 6
(6)
State 7
(5)
State 1 (32)0.009.5716.7123.8621.4326.1427.29
State 2 (23)9.570.007.1414.2911.8616.5717.71
State 3 (15)16.717.140.007.144.719.4310.57
State 4 (8)23.8614.297.140.002.432.293.43
State 5 (11)21.4311.864.712.430.004.715.86
State 6 (6) 26.1416.579.432.294.710.001.14
State 7 (5)27.2917.7110.573.435.861.140.00
State 1—current state; states 2–7—modified states.
Table 5. Values determining the visibility of the distance between the quality of states of the PV criterion, i.e., short-circuit electricity.
Short Circuit
Electricity (A)
State 1State 2State 3State 4State 5State 6State 7
State 10.000.100.060.040.050.040.04
State 20.100.000.140.070.080.060.06
State 30.060.140.000.140.210.110.09
State 40.040.070.140.000.410.440.29
State 50.050.080.210.410.000.210.17
State 6 0.040.060.110.440.210.000.88
State 70.040.060.090.290.170.880.00
State 1—current state; states 2–7—modified states.
Table 6. Results from ACO for the most favorable order of modification of the PV criteria state.
Short Circuit
Electricity (A)
Peak
Power (W)
Maximum
Current (A)
Idle
Voltage (V)
Weight
(kg)
Dimensions (mm)
State 132.14State 130.71State 142.29State 117.71State 16.29State 121.14
State 222.57State 218.14State 216.43State 358.71State 29.14State 318.00
State 315.43State 314.71State 314.29State 413.14State 310.43State 47.14
State 510.71State 410.43State 49.29State 210.43State 612.43State 515.14
State 48.29State 511.57State 58.14State 117.71State 513.71State 215.71
State 64.86State 66.43State 66.14 State 419.43State 614.00
State 76.00State 78.00State 73.43 State 728.57State 78.86
State 132.14State 130.71State 142.29 State 16.29State 121.14
The length of the best tour of modification for PV criterion states
54.5648.4877.7196.5744.5831.42
State 1—current state; states 2–7—modified states.
Table 7. Confrontation results of the model to support the process of improving PV.
Criteria
of PV
Results from ACOResults from IPAConclusion (Decision) after Confrontation Results from ACO and IPA
maximum
current (A)
State 142.29It is necessary to modify the current state, all proposed modifications will definitely be satisfactory for customers; where state 1—current state,
states 2–7—modified states.
Choice of the modification state according to the result of ACO, where the decision depends on the need of the entity (expert), e.g., production possibilities, the possibilities of implementation due to the state of other criteria, and financial
possibilities.
State 216.43
State 314.29
State 49.29
State 58.14
State 66.14
State 73.43
State 142.29
dimensions
(mm)
State 121.14State 2, state 3, and state 5 for the dimensions of PV should be the priority during modification of this criterion; where state 1—current state,
states 2–7—modified states.
The modification of the current state of criteria
to achieve state 3, if this is not possible
try to achieve state 5 and if this is not possible try to achieve state 2, in another case make a decision according to ACO.
State 318.00
State 47.14
State 515.14
State 215.71
State 614.00
State 78.86
State 121.14
idle voltage (V)State 117.71State 3 should be a priority in modification of this criterion, whereas other states for this criterion should be comparably satisfactory for customers; where state 1—current state,
states 2–7—modified states.
The modification of the current state of criteria to achieve state 3, in another case make
a decision according to ACO.
State 358.71
State 413.14
State 210.43
State 117.71
Publisher’s Note: MDPI stays neutral with regard to jurisdictional claims in published maps and institutional affiliations.

