Article

Effects of Grain Size and Layer Thickness on the Physical and Mechanical Properties of 3D-Printed Rock Analogs

1
School of Civil Engineering and Architecture, Southwest University of Science and Technology, Mianyang 621010, China
2
Shock and Vibration of Engineering Materials and Structures Key Lab of Sichuan Province, Southwest University of Science and Technology, Mianyang 621010, China
3
State Key Laboratory of Geomechanics and Geotechnical Engineering, Institute of Rock and Soil Mechanics, Chinese Academy of Sciences, Wuhan 430071, China
4
School of Mathematics and Physics, Southwest University of Science and Technology, Mianyang 621010, China
5
Nuclear Power Institute of China, Chengdu 610000, China
*
Authors to whom correspondence should be addressed.
Energies 2022, 15(20), 7641; https://doi.org/10.3390/en15207641
Submission received: 12 September 2022 / Revised: 4 October 2022 / Accepted: 11 October 2022 / Published: 16 October 2022

Abstract

:
Due to the complexity of the sedimentary and diagenetic processes, natural rocks generally exhibit strong heterogeneity in mineral composition, physicochemical properties, and pore structure. Currently, 3D printed (3DP) rock analogs fabricated from sandy materials (silica sand) are widely applied to study the petrophysical and geomechanical characteristics of reservoir rocks, which provides an alternative and novel approach for laboratory tests to calibrate the environmental uncertainties, resolve up-scaling issues, and manufacture customized rock specimens with consistent structure and controllable petrophysical properties in a repeatable fashion. In this paper, silica sand with various grain sizes (GS) and Furan resin were used to fabricate rock analogs with different layer thicknesses (LTs) using the binder-jetting 3DP technique. A comprehensive experimental study was conducted on 3DP rock analogs, including helium porosity measurement, micro-CT scanning, SEM, and uniaxial compression. The results indicate that the LT and GS have a great influence on the physical properties, compression strength, and failure behavior of 3DP rock analogs. The porosity decreases (the difference is 7.09%) with the decrease in the LT, while the density and peak strength increase (showing a difference of 0.12 g/cm3 and 5.67 MPa). The specimens printed at the 200 and 300 μm LT mainly experience tensile shear destruction with brittle failure characteristics. The ductility of the 3DP rocks increases with the printing LT. The higher the content of the coarse grain (CG), the larger the density and the lower the porosity of the specimens (showing a difference of 0.16 g/cm3 and 8.8%). The largest peak compression strength with a mean value of 8.53 MPa was recorded in the specimens printed with CG (i.e., 100% CG), and the peak strength experiences a decrease with the increment in the content percentage of the fine grain (FG) (showing a difference of 2.01 MPa). The presented work helps to clarify the controlling factors of the printing process and materials characteristics on the physical and mechanical properties of the 3DP rock analogs, and allows for providing customizable rock analogs with more controllable properties and printing schemes for laboratory tests.

1. Introduction

The physical tests based on natural rock specimens are essential to many rock mechanics-related engineering applications including oil/gas exploitation, geothermal extraction, and geotechnical engineering [1,2]. Due to the complexity and strong heterogeneity in mineral composition and pore/fracture system of the rock mass in the natural scenario, quantitative characterization and accurate prediction of the mechanical response and failure behavior of rock mass are still challenging [3]. With certain assumptions, researchers have established various types of analytical models to help predict the stress–strain relationship of rock mass under load, although those models are limited to quantifying the stress–strain distribution and structural evolution of inner rock mass [4,5]. Numerical approaches allow us to visualize the stress and strain fields of inner rock mass, as well as capture structure evolution locally and globally [6]. However, the limitation of the numerical simulation lies in that the accuracy is highly dependent on the selection of constitutive models, as well as the calibration of the material parameters [7]. Moreover, it is necessary to make appropriate simplifications on the numerical model of the complex rock mass to balance the computation cost and accuracy. In view of this, the laboratory tests performed on rock specimens are still regarded as the most valuable and effective way in rock mechanics and geoscience studies to capture the physical and mechanical properties of rock mass, as well as to calibrate and validate the analytical models and numerical simulations.
The heterogeneity of natural rock specimens and the destructive laboratory tests not only limit the parallel experiments of the multi-factor response of the same sample, but also increase the uncertainty of test results from sample to sample. Therefore, researchers have attempted to fabricate artificial cores by casting and sand-filling methods to resolve the aforementioned limitations in laboratory tests [8,9,10]. However, the artificial cores made by those traditional methods failed to mimic the sedimentation process of the natural rocks, and they cannot yet guarantee a consistent inner structure from sample to sample. What is more, since those methods were very manually intensive and environmentally sensitive, the physical and mechanical properties can be varied from sample to sample, which may cause a large deviation in the test results [11,12]. Recent developments in 3D printing, also known as additive manufacturing (AM), in rock mechanics, and geosciences provide an alternative scheme for fabricating rock analogs with consistent structure and controllable properties in a more cost-effective and time-saving way [13,14,15,16]. Compared to traditional artificial cores, 3DP rock analogs fabricated from digital rock models can mimic rock texture accurately from the perspective of pore morphology and topological property [17]. Moreover, thousands of materials have been used for 3D printing to fabricate rock analogs to date. For that reason, 3D printing has been widely adopted to explore potential applications in the rock mechanics and geoscience engineering fields. Researchers have attempted to 3D print rock analogs with various types of polymer materials including photosensitive resin, plastic, and nylon [18,19,20,21]. However, those resin-based 3DP rock analogs were proved to be too ductile to simulate the brittleness of the natural rocks [22,23]. On the plus side, resin-based 3D printing techniques, such as the PolyJet and stereolithography (SLA), generally achieved a high printing resolution. Thus, those types of 3D printing techniques were very suitable to capture and characterize the pore morphology and pore-throat connectivity of natural rocks. Various studies have reported on the 3D printing of rock pore structure from 2D to 3D at microscale [24,25]. Among the resin-based 3DP rock analogs, transparent resin was the most widely used material for mimicking rock structure. Due to its transparent property, the internal stress field and fluids flow process could be visualized and dynamically monitored with the help of visualization techniques such as the photoelastic stress freeze method, digital image correlation (DIC), particle image velocimetry (PIV), and in situ CT scanning [26,27,28]. Several research teams have attempted to resolve the pore features of natural rocks at original dimensions without upscaling, which is essential for understanding the effect of pore morphology on fluids flow process [22,25]. In addition, complex fracture networks can be easily fabricated via 3D printing with controlled parameters including aperture, surface roughness, and orientation. On the basis of the 3DP fractured rock mass, the hydraulic characteristics are comprehensively investigated to validate those classical empirical equations and analytical model [29,30]. Although the super high resolution (~2 μm in theory) of the resin-based 3D printing allowed the printing of the pore/fracture structure at its original dimensions, the inherent physicochemical properties of the resin materials failed to mimic the surface roughness and fluid–solid interaction of the natural rocks. In view of this, those natural powder materials, such as silica sand, gypsum, and ceramic, were used to 3D-print rock analogs.
The powder-based 3D printing, such as binder jetting, utilizes a print head to jet “cement” onto the printing bed to bond the discrete grains [31]. Natural sandstones are mainly composed of mineral grains (quartz) and corresponding cementing agents, which makes the aforementioned powder-based 3D printing technique very suitable for fabricating sandstone analogs [32]. Compared to resin materials, 3DP rock analogs printed with natural powder materials have shown remarkable advantages in mimicking the surface physicochemical properties of natural rock, as well as the mechanical and deformation behaviors [33]. Researchers have attempted to 3D print rock analogs with ceramic and gypsum powders, and the ceramic powder-based specimens showed an abnormal brittleness property compared to the natural rocks, while the gypsum powder-based specimens showed good ductile strength. Various types of post-processing techniques have been utilized to improve the physical and mechanical properties of the 3DP rock analogs, which made the 3DP rock analogs suitable for mimicking many types of natural rocks, including brittle rocks and highly-stressed soft rocks [34,35,36]. With the powder-based 3DP rock analogs, researchers have explored the similarity of mechanical, transport, acoustic, and electrical properties in comparison to the natural rocks for potential applications in laboratory tests [37,38,39,40]. Flaws, i.e., single fracture or fracture networks, were embedded into the 3DP specimens to simulate the effect of the fracture system on the mechanical and transport properties of rock mass, as well as the fracture propagation evolution property by using acoustic emission (AE) and DIC measurements [41,42]. With the help of 3D printing, the defective rock specimens could be fabricated in a more customized fashion with various types of fracture length, aperture, number, orientation, spacing, and even the intersection angle of fracture networks [43,44]. Limited by the inherent properties of gypsum and ceramic powder, the pore geometry and morphology differed from the natural sandstone, which has a great influence on modeling transport properties in laboratory tests. Thus, silica sand (~98% quartz) was used to 3D print the rock analogs. Compared to ceramic and gypsum powder, the “sandstone” 3D printed with silica sand exhibits superior properties to mimic natural rocks both in macroscopic physical–mechanical properties and microstructural characteristics (e.g., mineral composition, grain cementing mode, and pore structure) [45,46]. Although the matrix material has a great influence on the properties of the 3DP specimens, the influence of the printing process (including printing orientation, LT, binder saturation, and drying time) on the specimens cannot be ignored. Previous studies have investigated the effect of different matrix materials and printing processes on the macroscopic properties of 3DP rock analogs individually. However, they failed to explore the effect of the GS on the 3DP rock analogs, which is a great influence factor on natural sandstone properties according to the corresponding studies on grain sorting during the sedimentary process [47,48]. In addition, corresponding studies related to the synergetic influence mechanism on the 3DP rock analogs between the GS of the matrix material and printing LT are still rare.
The main motivation of this study was to reveal the influencing mechanism of the sand GS and printing LT on the physical and mechanical properties of silica sand-based 3DP rock analogs. To this end, five types of matrix material combinations with different GS and three types of printing LT were designed to fabricate 3DP sandstones. The physical and mechanical properties of the 3DP sandstones were comprehensively investigated and the effect of the GS and printing LT on the 3DP sandstones was discussed in an integrated way. The present work might aid in clarifying the main controlling factors affecting the macroscopic properties of the 3DP rock analogs, and provides a recommended printing scheme for 3DP rock fabrication for various application scenarios and purposes in the rock mechanics and geoscience engineering fields.

2. Materials and Methods

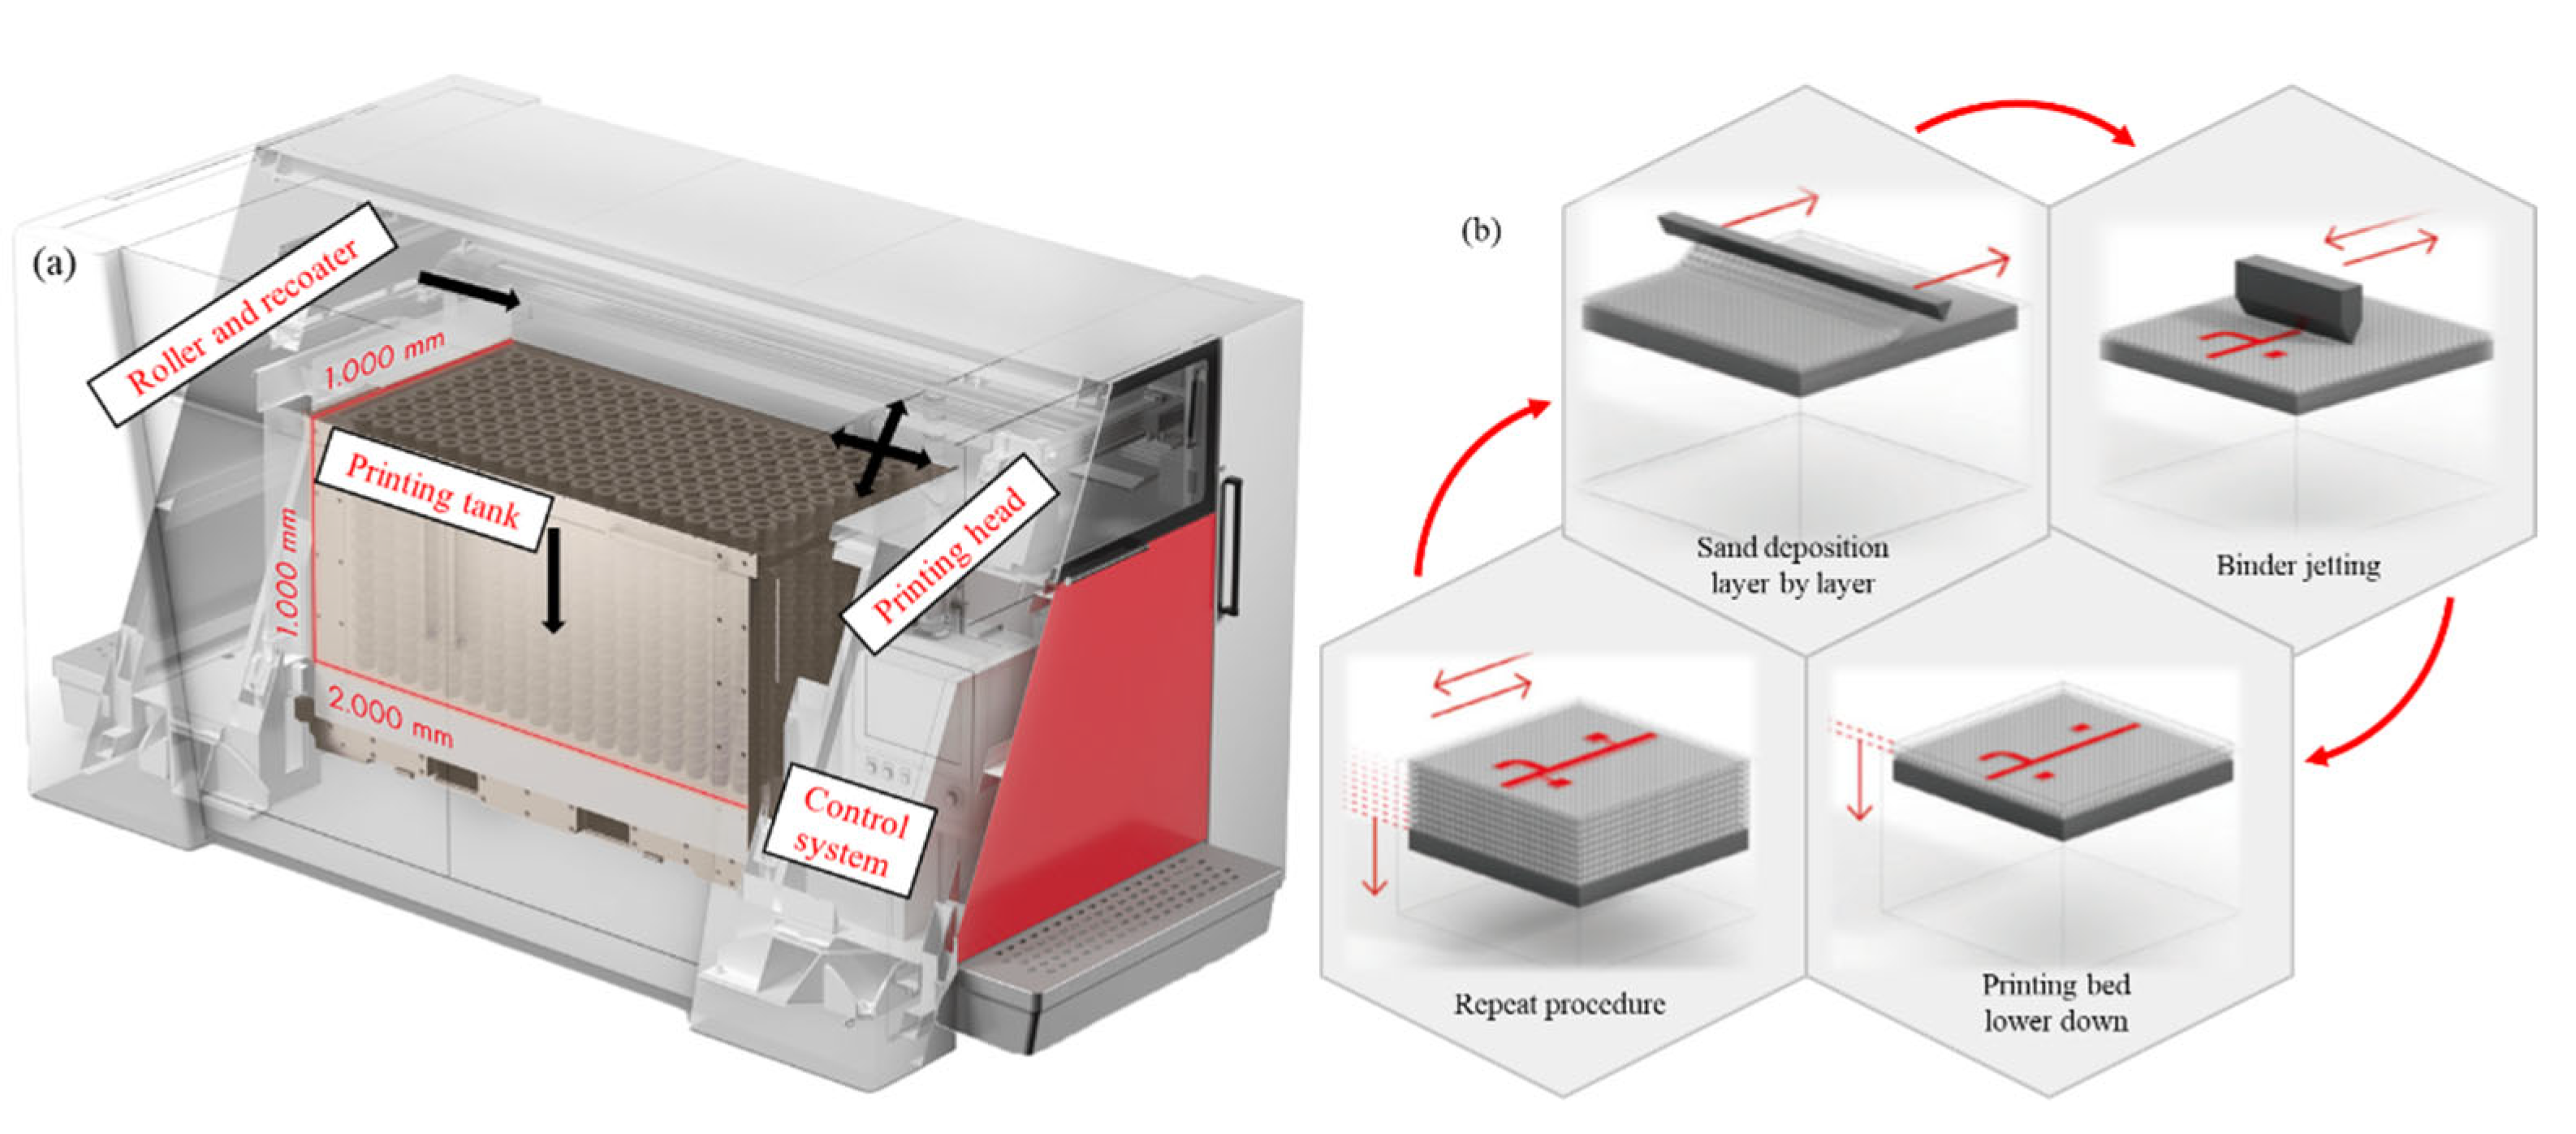
2.1. 3D Printing of Rock Analogs

Prior to 3D printing, the corresponding digital model should be designed and processed first to meet the requirements of the 3D printer. Generally, the printing procedures differ from other 3D printing techniques, and the main printing process can be divided into four parts: digital data acquisition, model discretization, printing layer by layer, and post-processing [49]. The VX-2000 3D printer (VoxelJet, Suzhou Branch, China) was adopted to fabricate the silica sand-based 3DP rock analogs used in this study, which uses the binder jetting (BJ) technique for bonding silica sand with an organic binder, as shown in Figure 1a. According to the manufacturer’s datasheets, the printer used in this study has a large printing volume of 2000 L with a high printing resolution (plane) of up to 300 dpi and a low printing LT of ~200 μm.
The main manufacturing process of the 3D printer is as follows: Prior to printing, the silica sand is pre-mixed with acid activator (p-toluene sulfonic acid) with a certain ratio and loaded into the recoater. Then, the recoater moves from left to right above the printing bed in the job box to deposit the sands, followed by the rotating roller behind the recoater to spread the sands. After that, the print head passes over the printing bed to jet binder on the sand layer to form the bonding neck at the designed location controlled by the digital model. Afterwards, the heater travels over the printing bed to accelerate the curing process between layers. The printing bed is then lowered by one layer with a designed LT, and the aforementioned procedures are repeated until the objective is complete, as shown in Figure 1b. After the printing process, the job box is removed from the printer. No waiting times are required since an adequate level of unpacking strength of the printing objective already forms during the printing process. To facilitate the curing of the binder, as well as to remove the extra moisture to achieve designed strength, the job box is placed into a furnace to dry the specimens at 80 °C [16]. After the drying process, the rock analogs are removed from the job box, and rough cleaning is conducted manually using brushes to remove the unbound sands. More intensive cleaning can be carried out by compressed air.

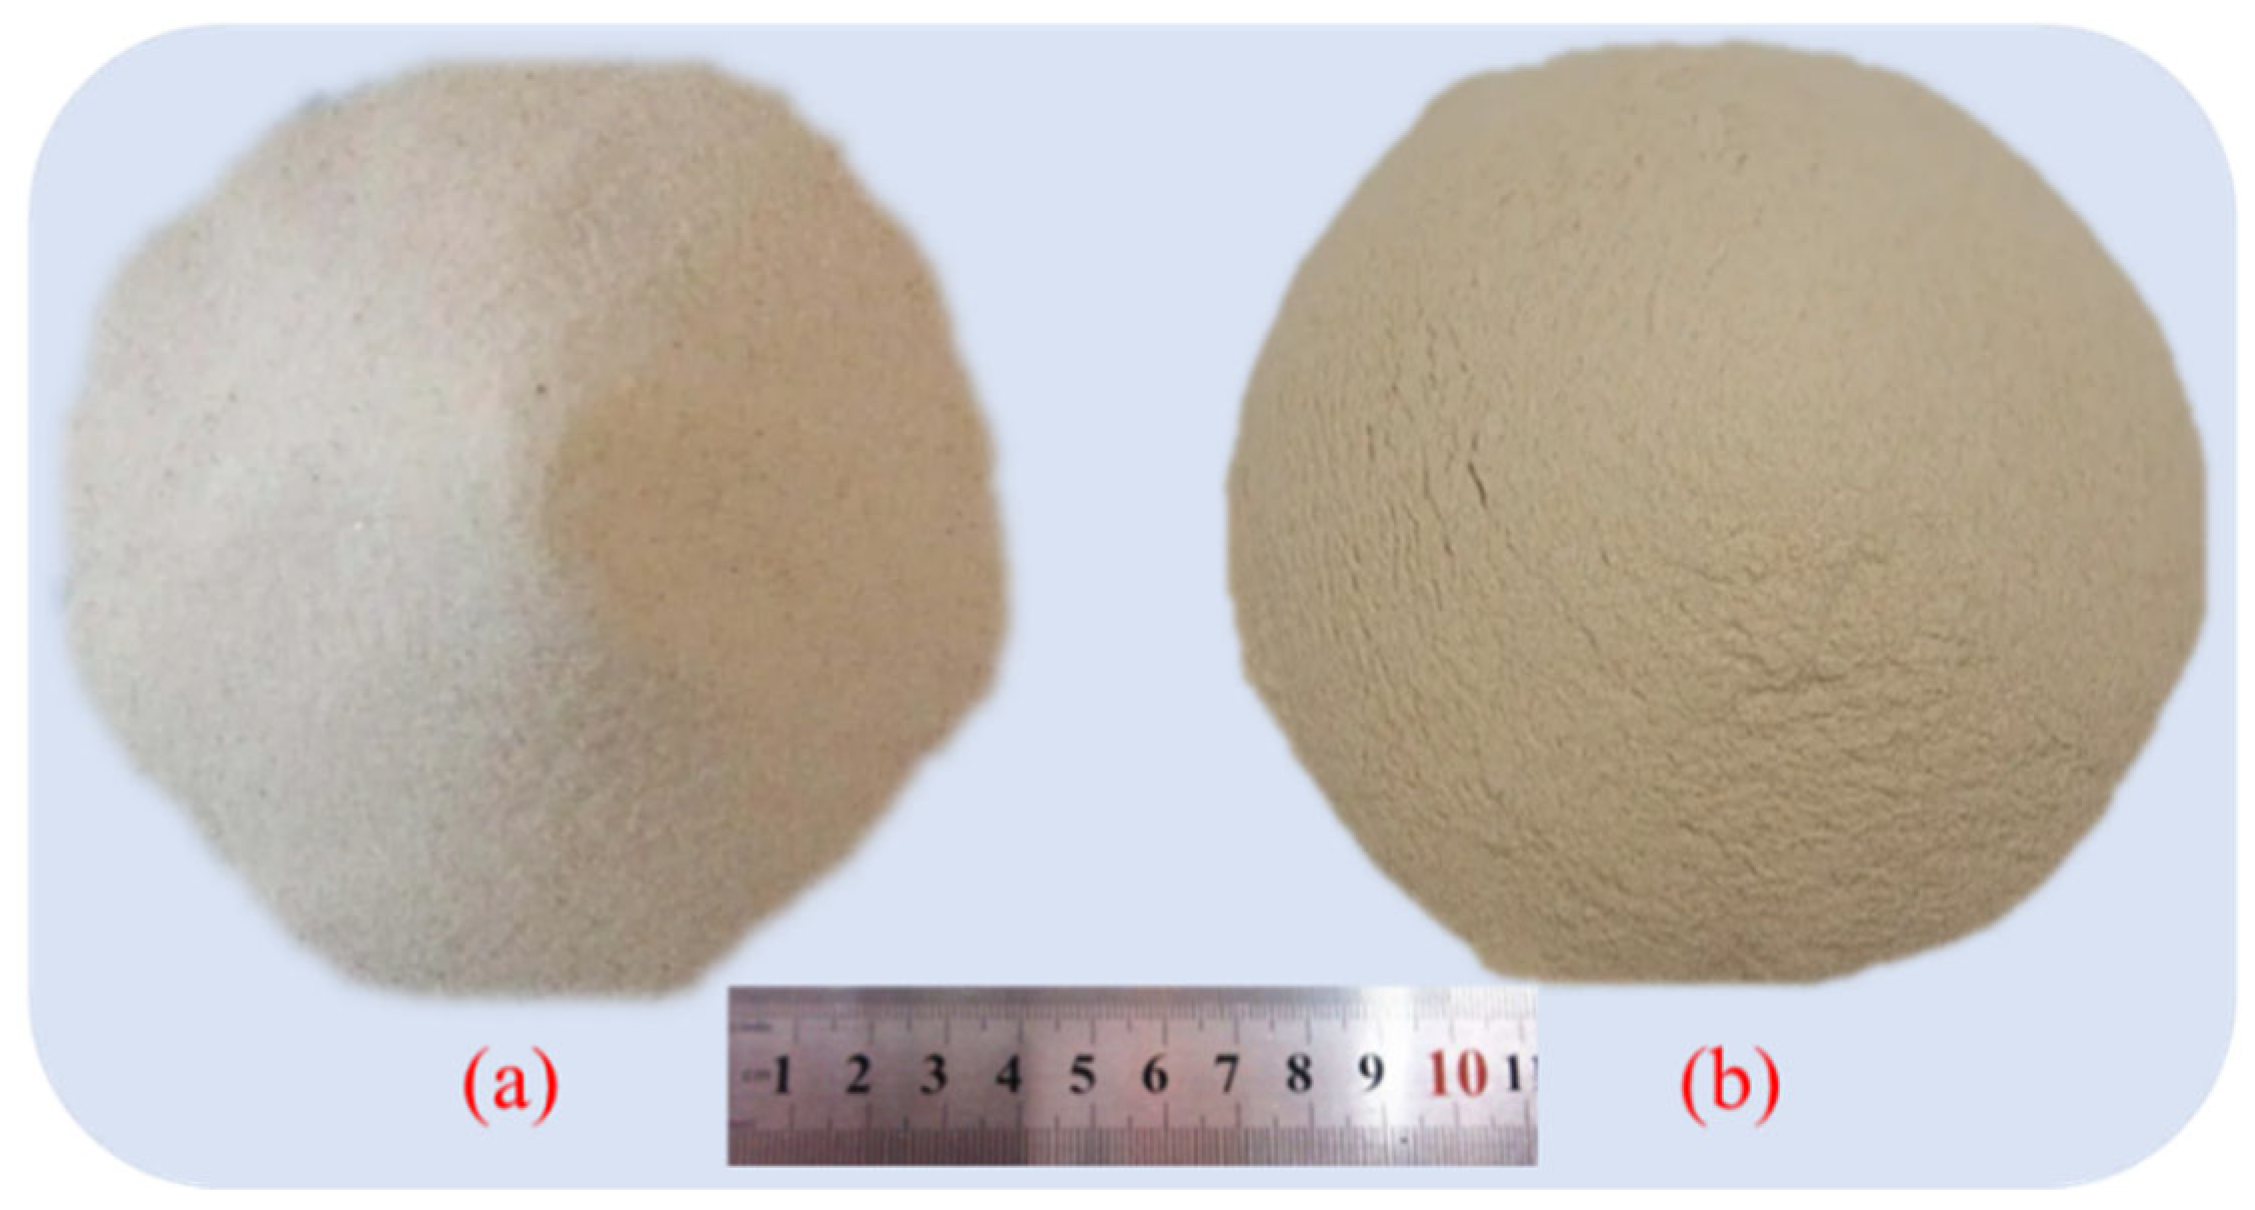
2.2. Matrix Material and Printing Parameters

The silica sands with different GS were utilized as printing matrix material in this study (Figure 2). The CS (GS 19 type) and FS (GS 12 type) purchased from the VoxelJet, Suzhou Branch, China, have a medium grain size of 190 and 120 μm, respectively, and according to vendor datasheets, both silica sands are composed of ~98% quartz. Five types of blends of sand mixture were designed with coarse and fine sands, i.e., 100% CS (Type I), 70% CS and 30% FS (Type II), 50% CS and 50% FS (Type III), 30% CS and 70% FS (Type IV), and 100% FS (Type V), and the ratios of the different sands were determined by weight. The furan resin (the active ingredients consist of 70–90% α-furfuryl alcohol, 5–15% bisphenol A, 1–10% resorcinol, and 0.1–0.2% 3-aminopropyltriethoxysilane) purchased from the ASK (Zhejiang) New Materials Technology Co., Ltd. was chosen as the binder. The default setting of binder saturation was 10% for all the 3DP rock analogs in this study.
The printing resolution was set to 300 dpi on the plane, and the printing direction was along the z direction. For different types of sand mixtures, 200 μm LT was set to print rock analogs to investigate the effect of the GS on 3DP rocks. Type I sand mixture was used to print rock analogs with various LTs of 200 μm, 300 μm, and 400 μm to investigate the effect of LT on 3DP rocks. The designed schemes of the sand mixtures and printing parameters for 3DP rock fabricating used in this study are shown in Table 1. In this study, the 3DP rock specimens were fabricated in cylindrical shape with two types of dimensions, i.e., 50 mm × 100 mm for UCS testing, and 25 mm × 50 mm for microscopic structure characterization followed by the ASTM D4543-19 [50], as shown in Figure 3.

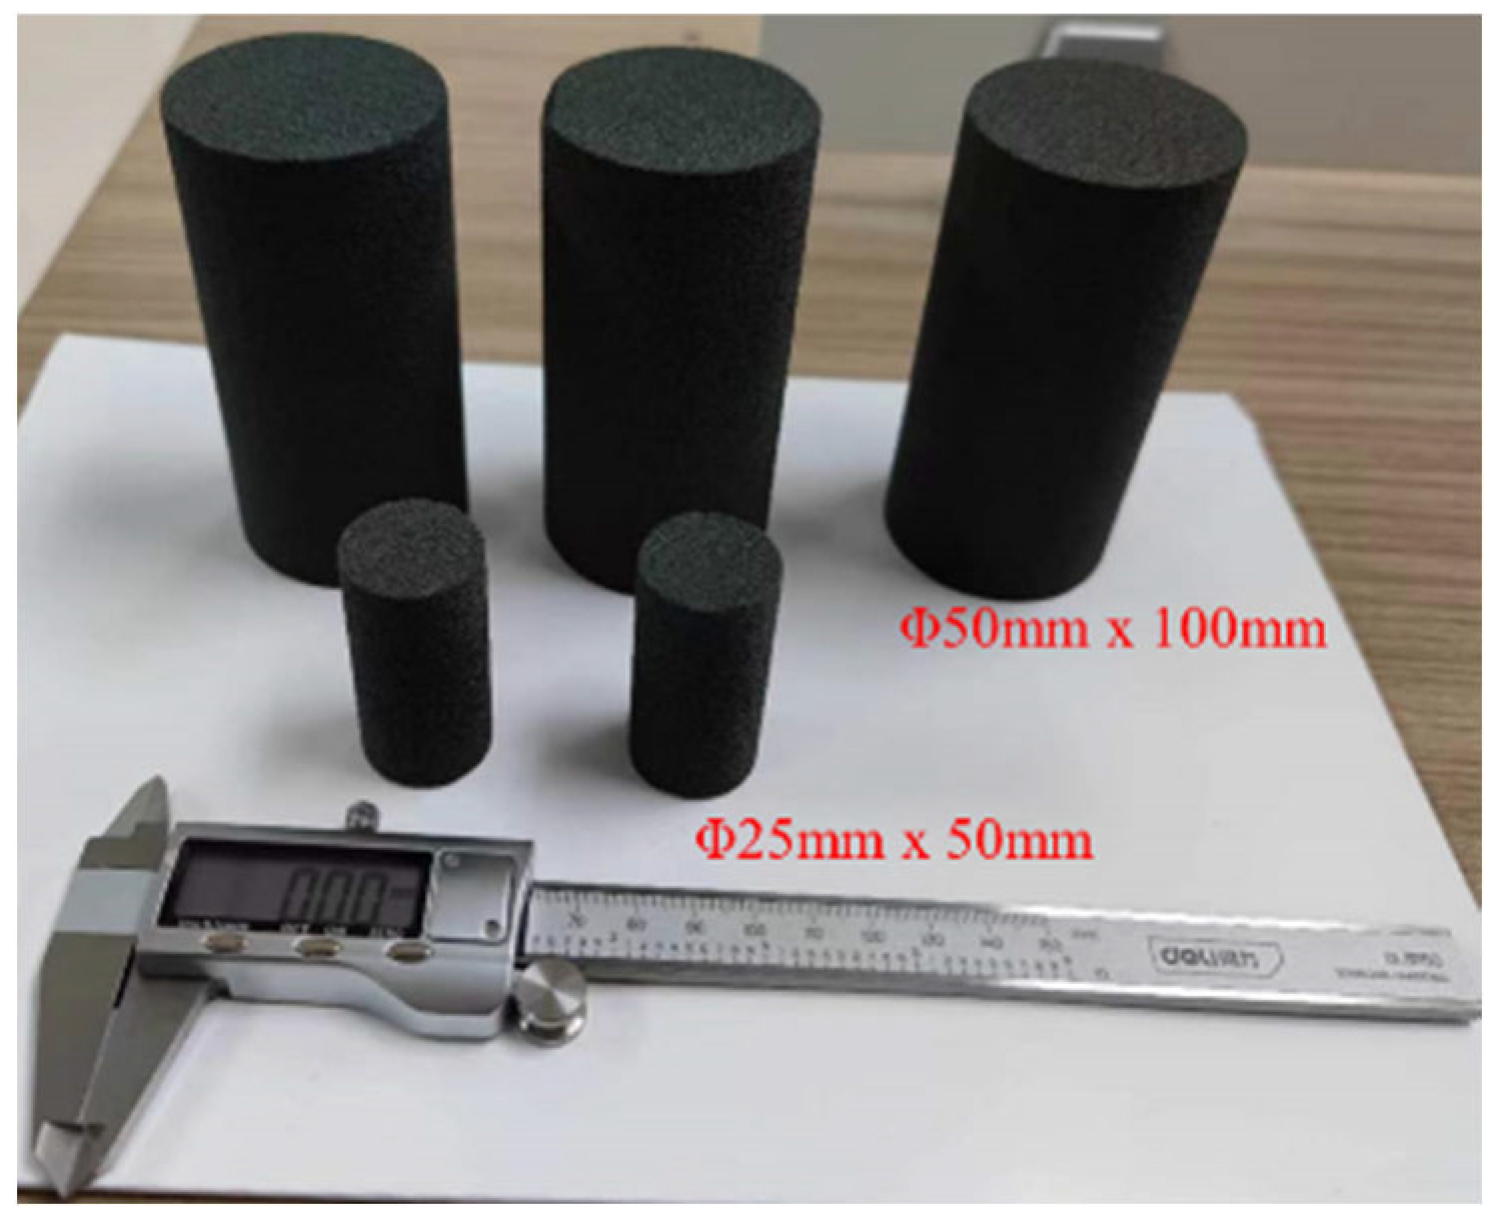
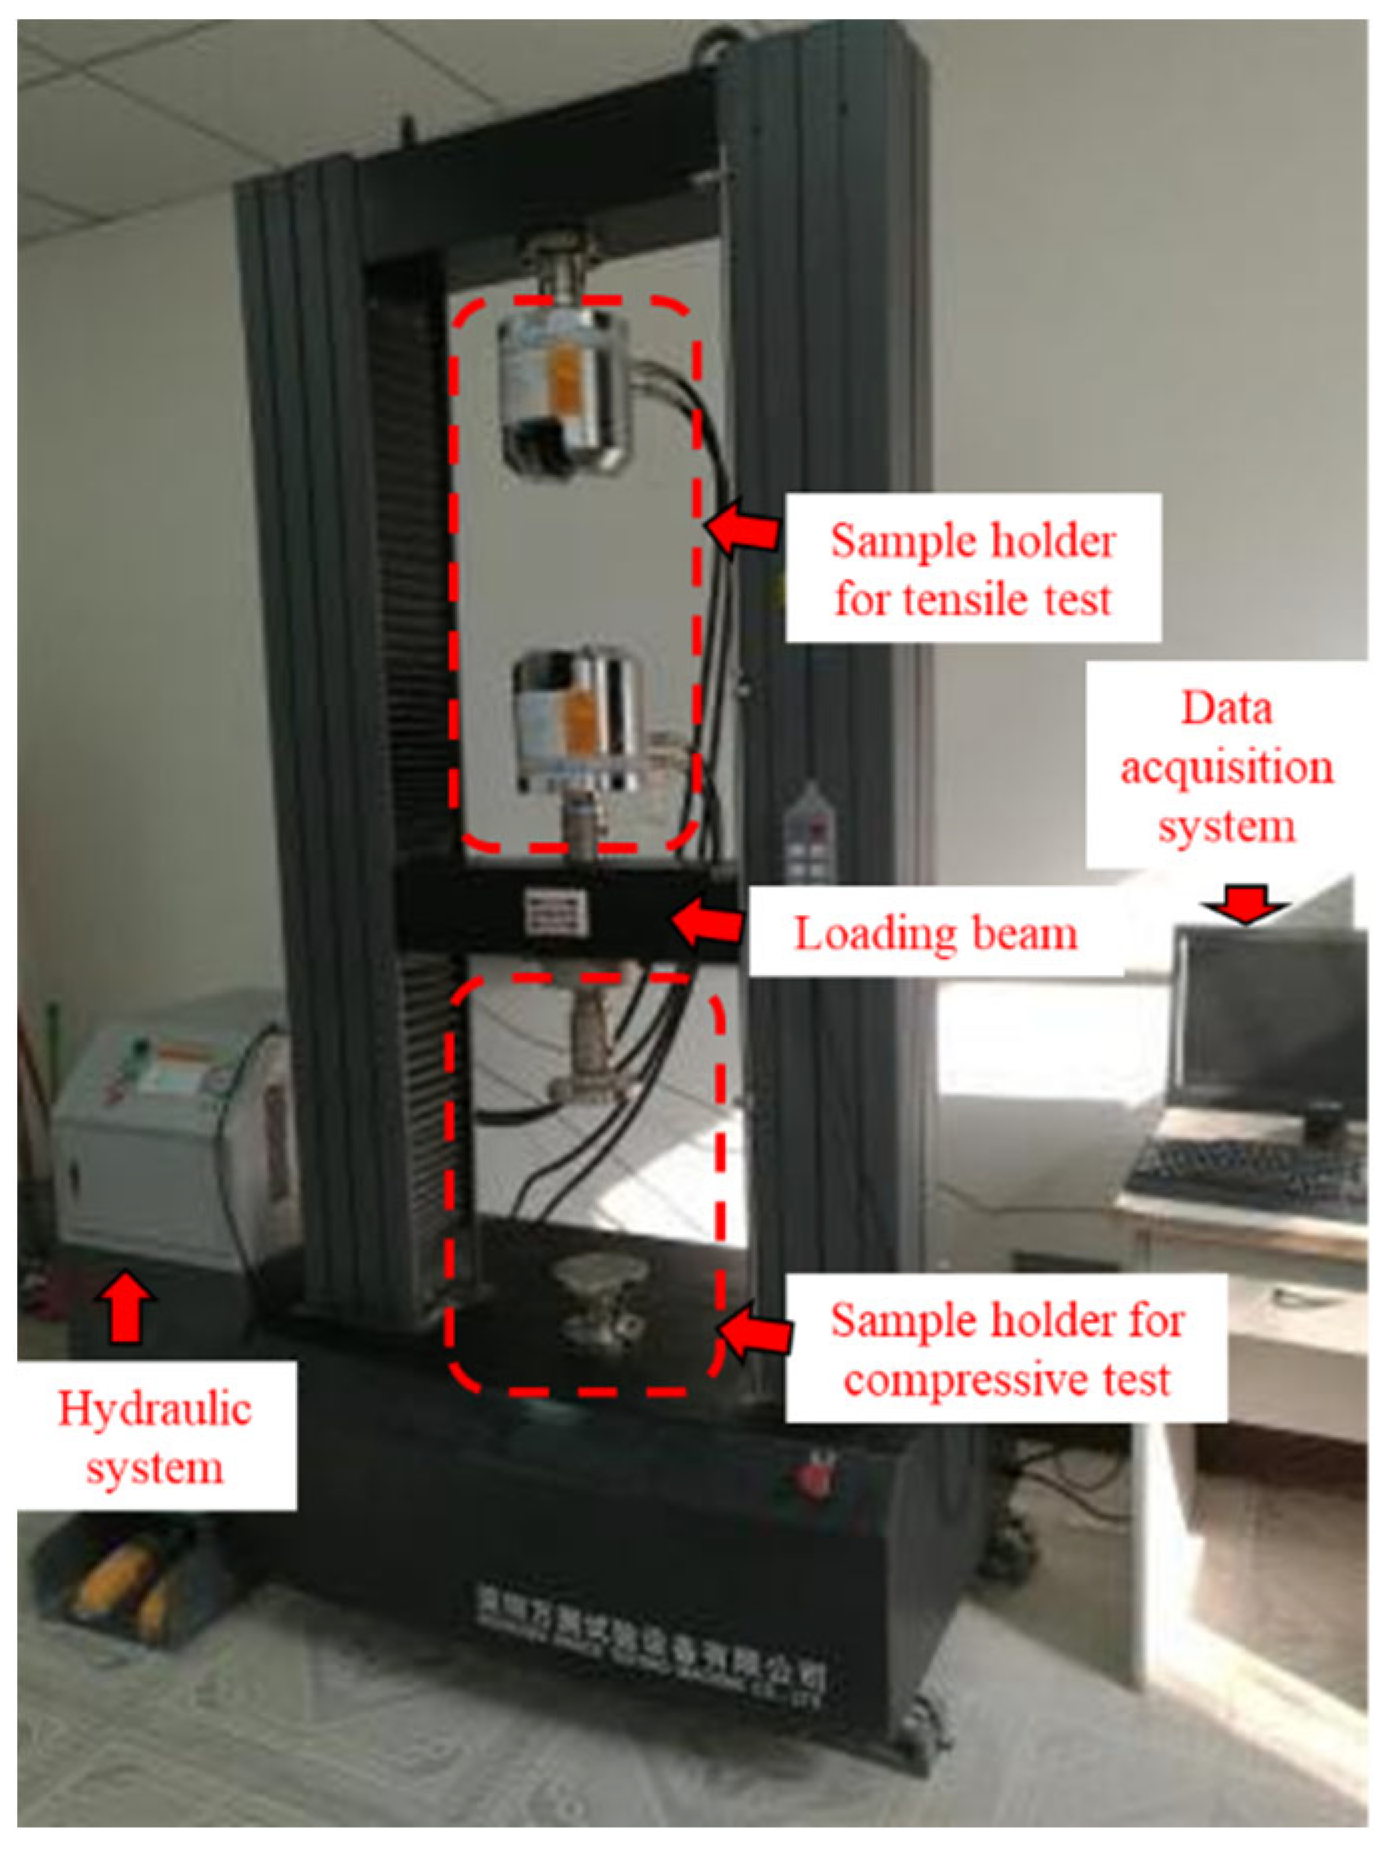
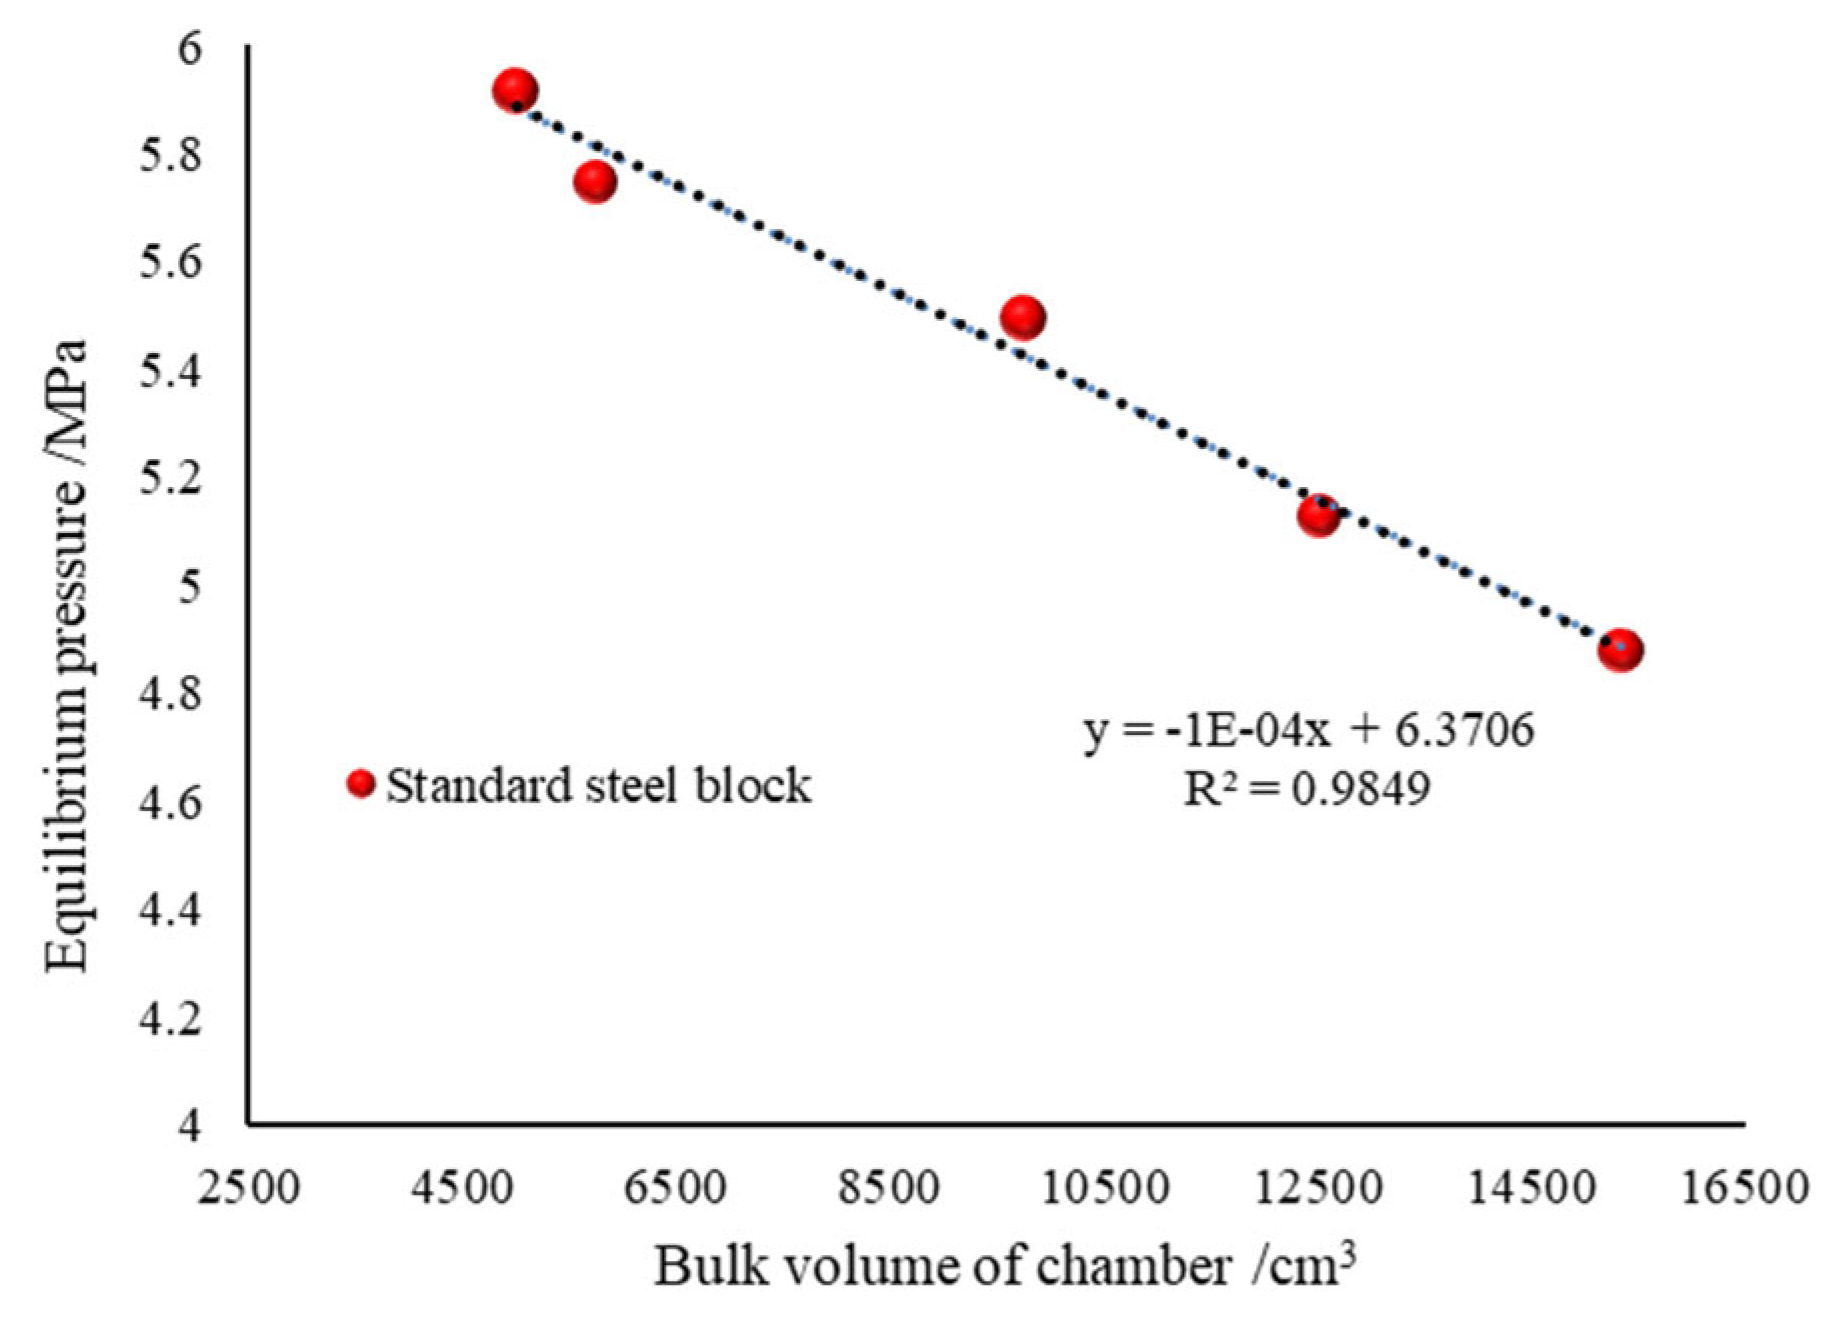
2.3. Uniaxial Compression Testing

The unconfined compressive strength (UCS) of the 3DP rock analogs was tested following ASTM D7012-14e1 [51] on an ETM105D universal material testing system (Figure 4) located in the Experimental Center for Structure and Mechanics, at Southwest University of Science and Technology. Two copies of each type of 3DP rock were used for UCS testing to reduce the testing deviation. The testing system has a maximum operating load of up to 100 KN, and the measurement accuracy of the force and deformation control rate can achieve 0.005~5% and 0.02~5% FS/s, respectively. During the compression, the sample was pre-loaded at a rate of 0.5 kN/s to establish contact between the rock sample and the loading plate. Afterward, the force control mode was utilized to initiate the loading procedure with a rate of 0.05 KN/s until failure.

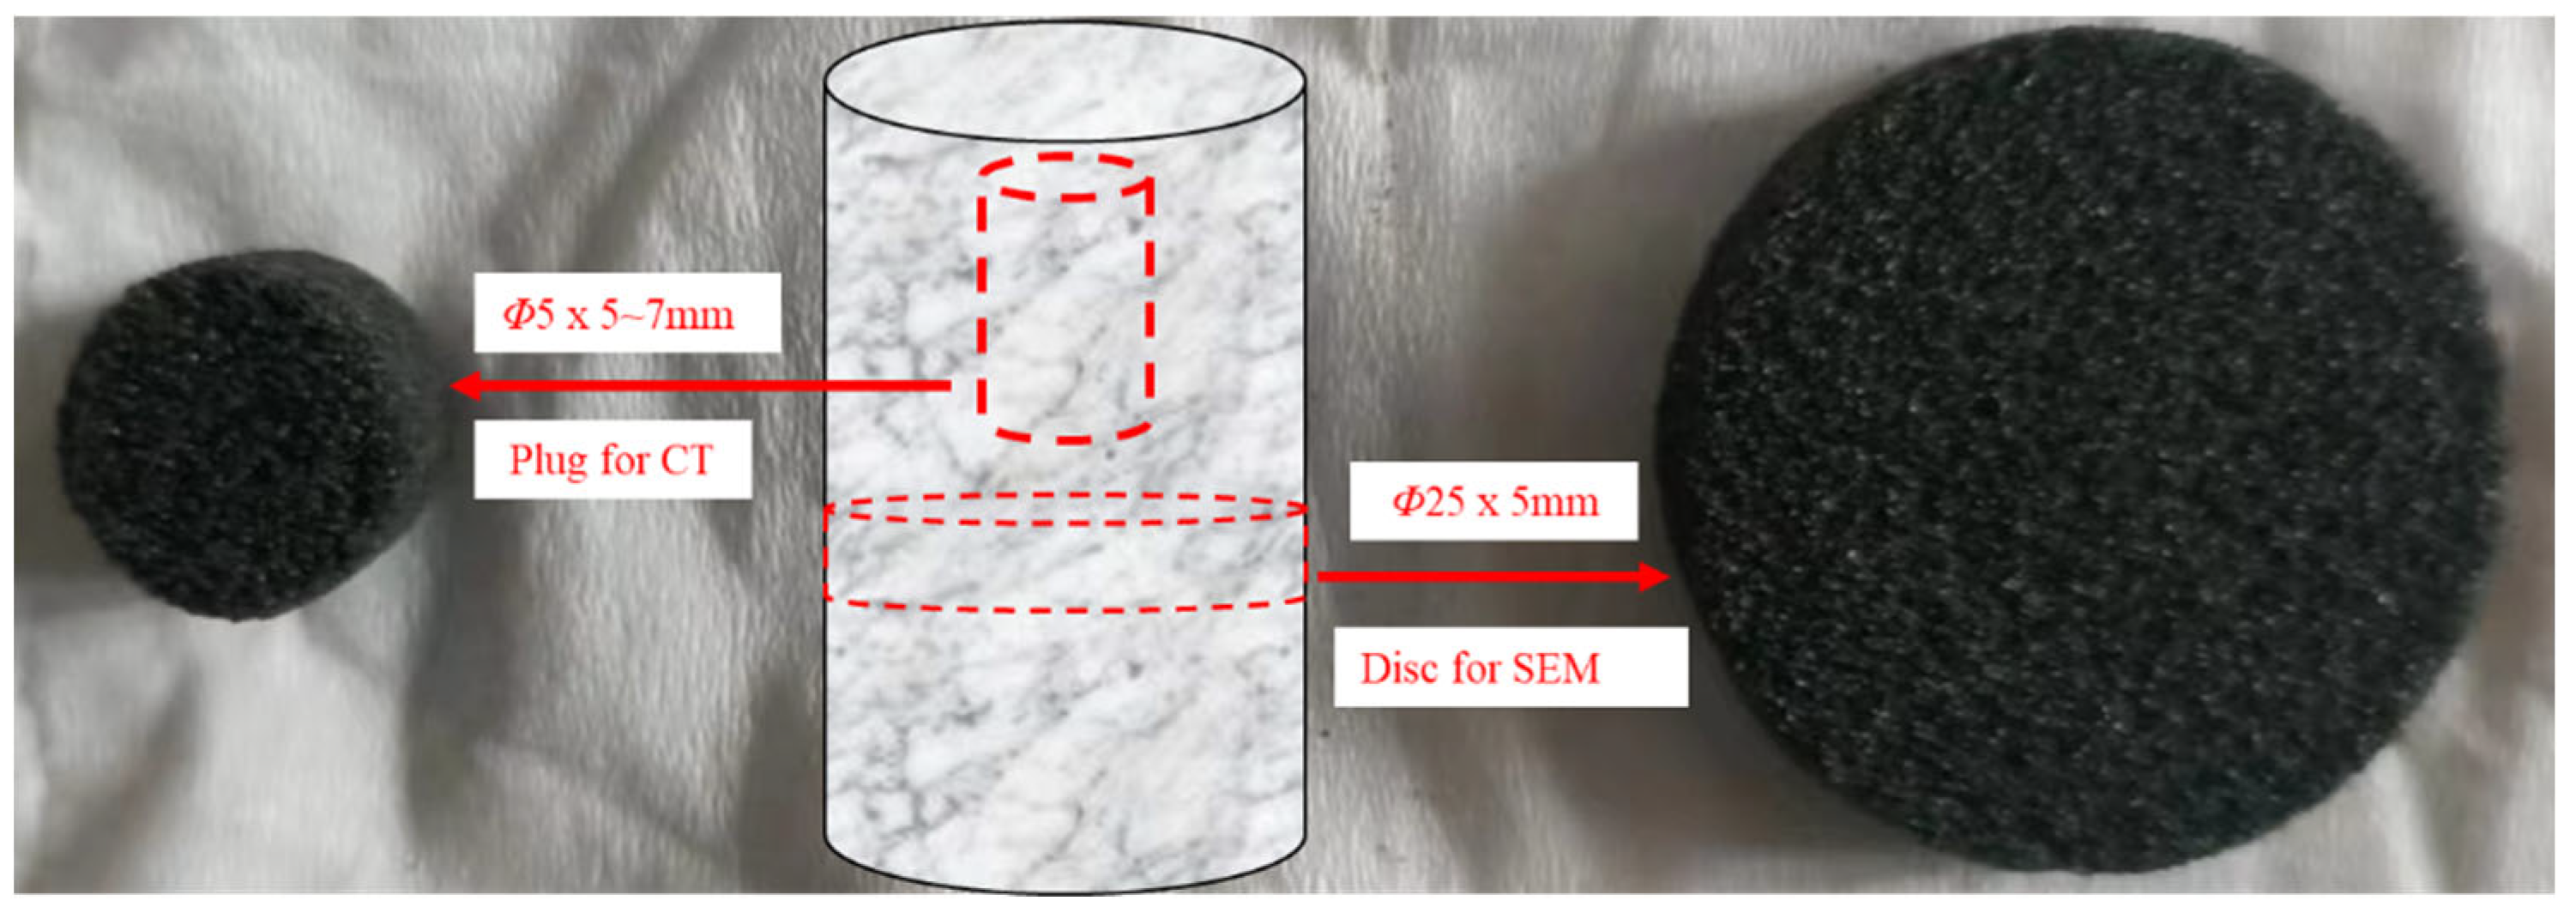
2.4. Physical Properties Measurements

The physical dimensions and weight of the 3DP rocks were measured by vernier caliper and electronic balance manually prior to other tests to calculate the bulk density. The porosity was determined by measuring the grain phase volume of the 3DP rocks by using helium pycnometry under laboratory conditions. A QYK-II helium porosimeter was utilized to measure the grain phase volume located at the Material Testing Center at Southwest University of Science and Technology. The details of the test processes can be referred to in our previous study [49]. Prior to measuring the porosity of the 3DP rocks, five intact steel blocks with standard dimensions were used to calibrate the testing system and establish the fitting curve between the equilibrium pressure and the bulk volume of the sample chamber for porosity calculation, as shown in Figure 5. The grain phase volume of the 3DP rocks could be calculated by introducing the corresponding equilibrium pressure value from the test into the aforementioned fitting equation [52]. Afterward, pore phase volume can be acquired by subtracting the grain phase volume from the apparent volume [53].

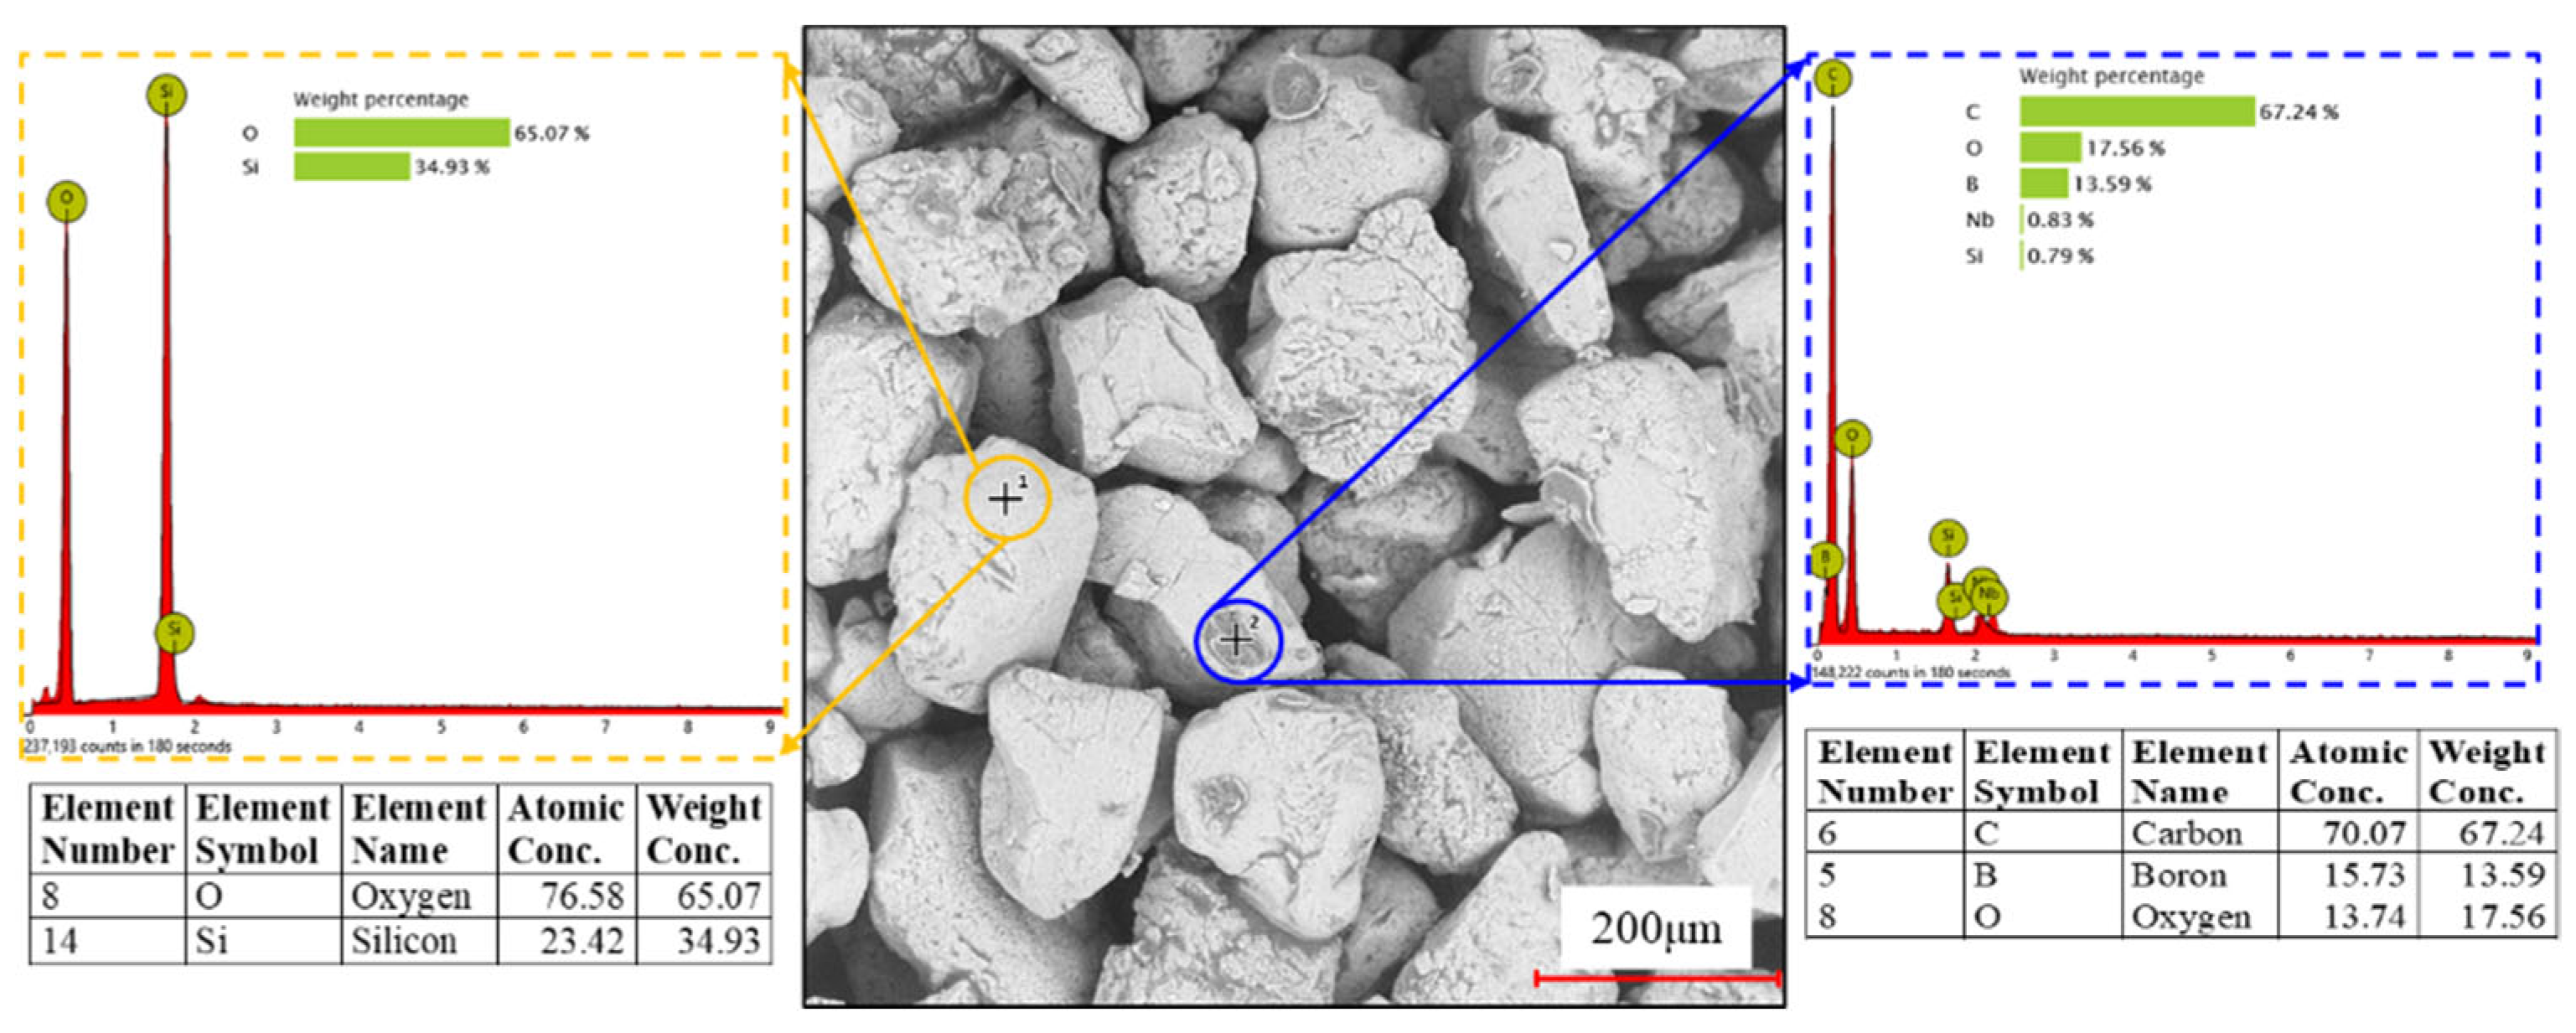
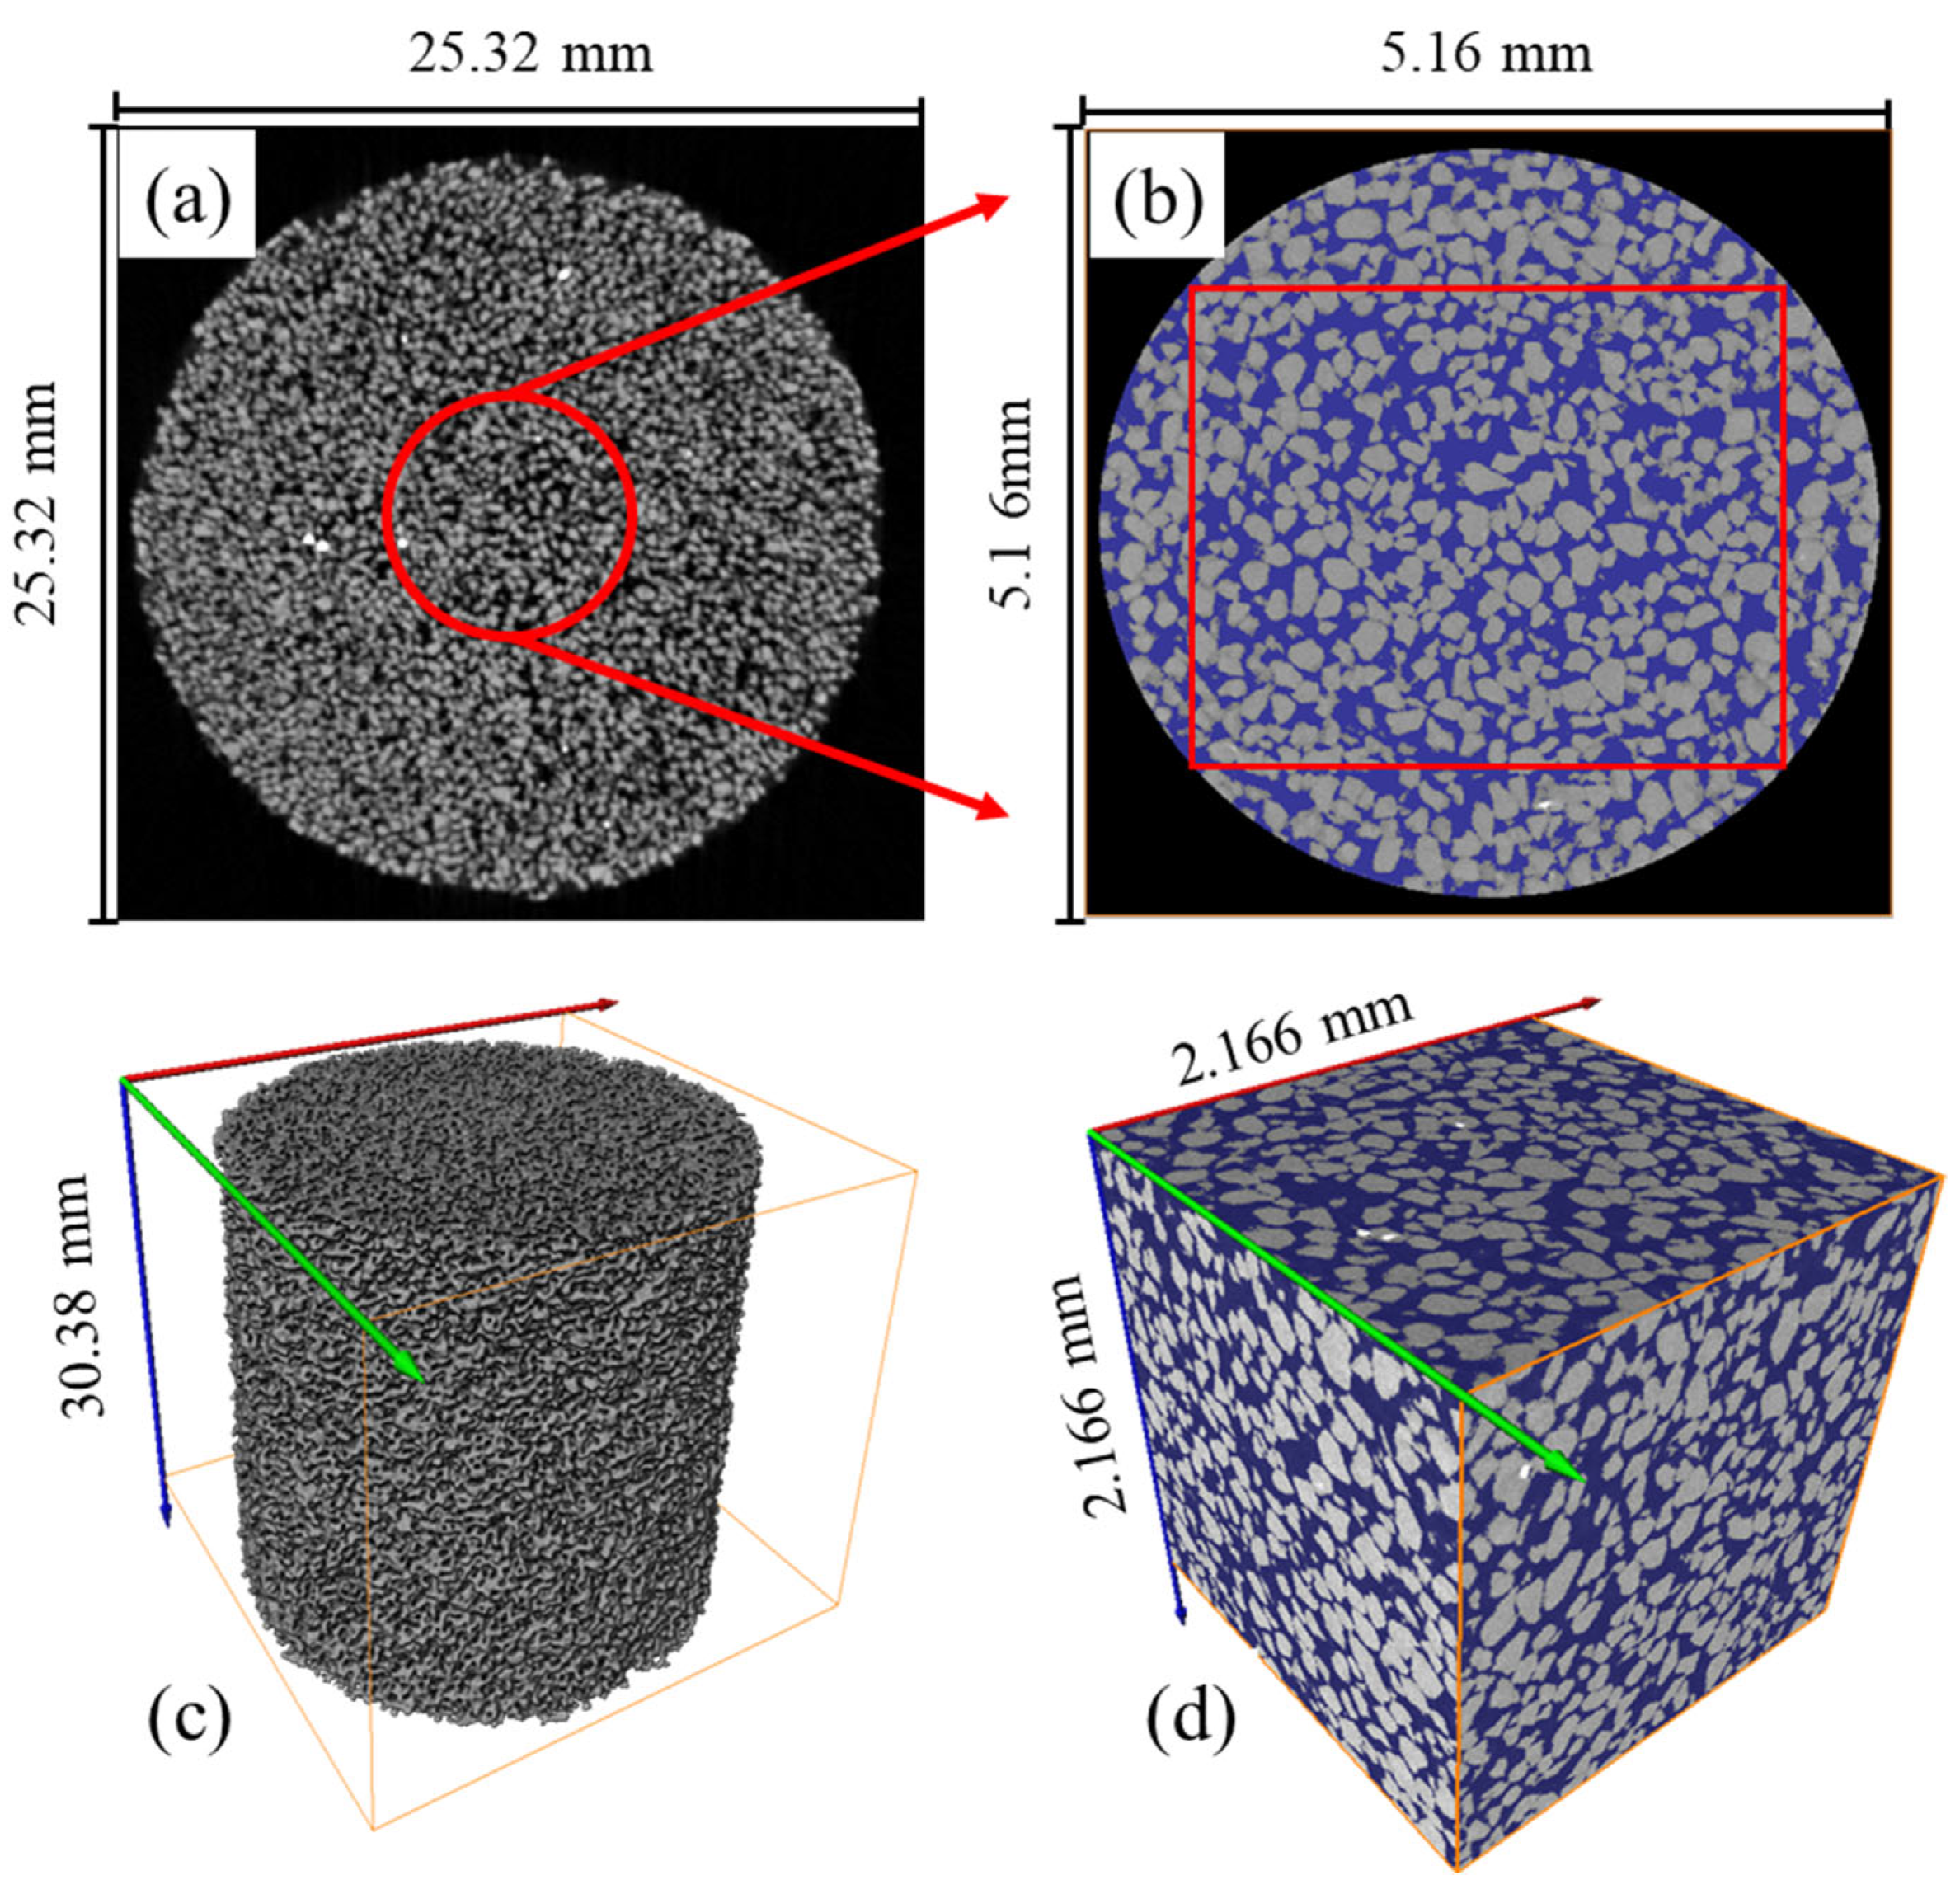
2.5. Microscopic Structure Characterization

SEM scanning was carried out to capture the grain distribution and pore geometry of the 3DP rocks using the Phenom ProX scanner located at the Fundamental Science on Nuclear Waste and Environmental Safety Laboratory at Southwest University of Science and Technology. The SEM scanner is equipped with a highsensitivity quadrate backscattered electron detector which can provide 20,000× magnification and better than 1 μm resolution. In addition, the grain cementing mode and binder distribution can be determined with the help of the Energy Dispersive Spectrum (EDS) analysis on the same area captured in the backscattering mode simultaneously with the SEM scanning. Prior to scanning, small discs measuring 5 mm in length were cut off from the 3DP rock core plugs, as shown in Figure 6.
CT scanning was conducted using the nano Voxel 2000 micro-CT scanner (Tianjin Sanying Precision Instrument Co., Ltd., Tianjin, China) to investigate the spatial topology of the pore structure of the 3DP rocks. The CT scanner is equipped with various lenses to achieve multiple magnification (4×, 10×, and 20×). The high-resolution CCD camera can achieve an image resolution larger than 4096 × 4096/pixels with a high pixel spatial resolution of 1 μm. To achieve ideal imaging quality, a mini core plug was drilled from the whole specimen with a dimension of 5mm in diameter and 5–7 mm in length, as shown in Figure 6.

3. Results and Discussion

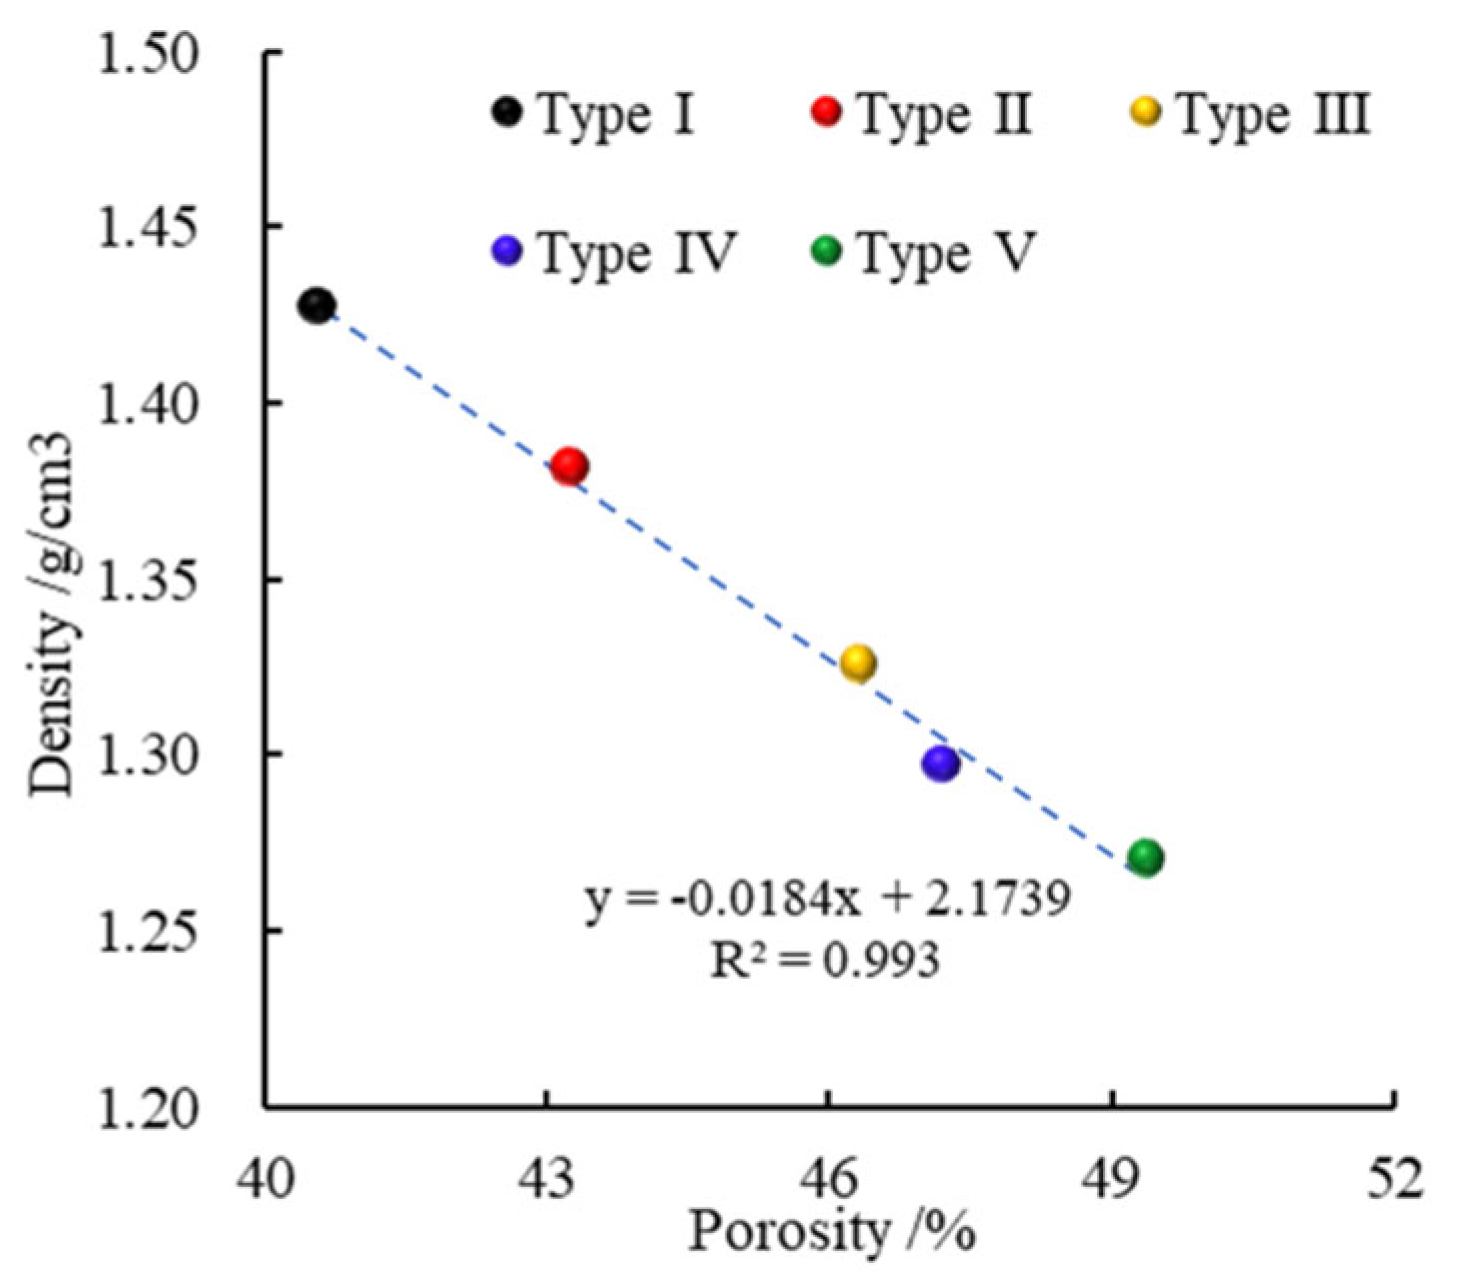
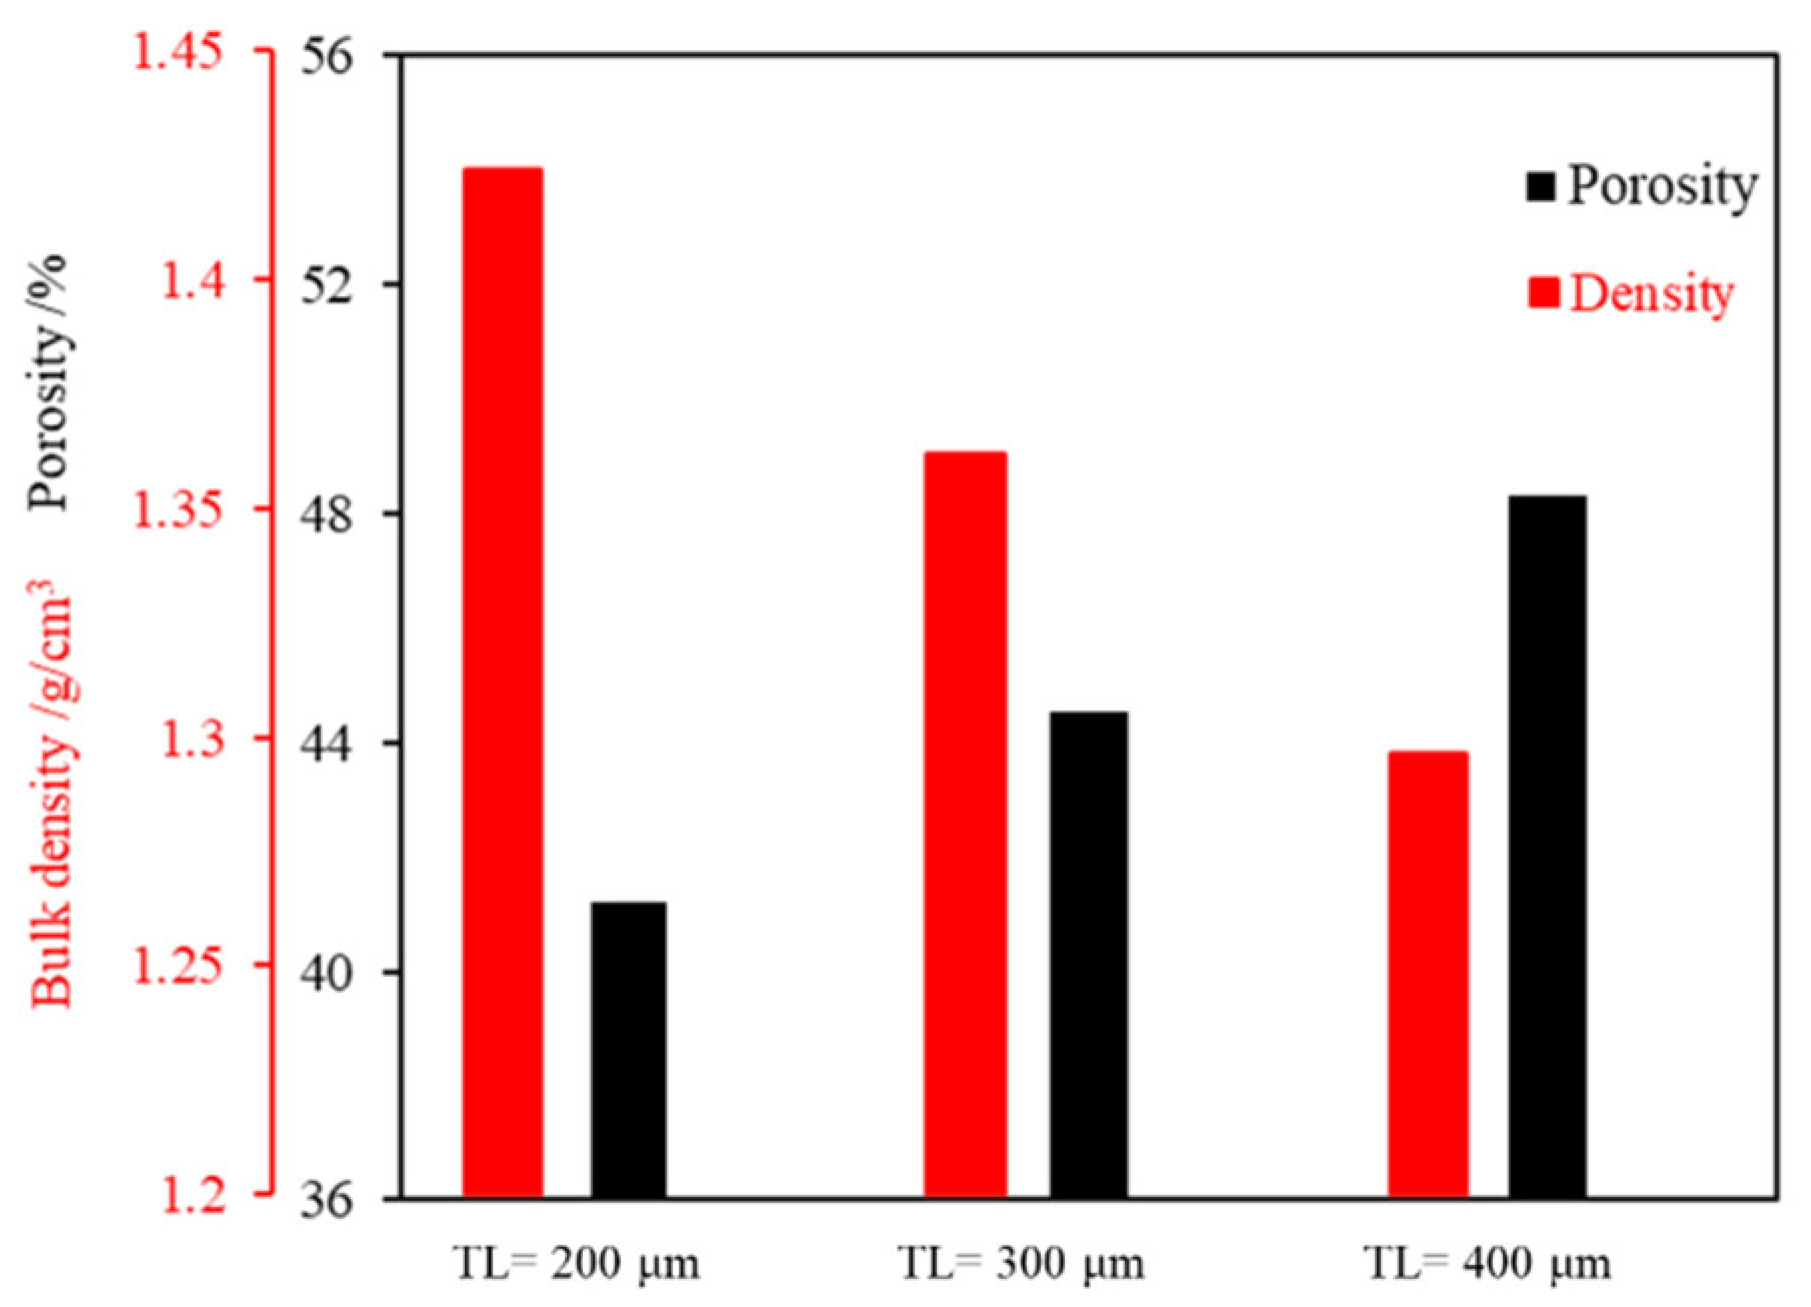
3.1. Porosity and Density

The porosity and density of the 3DP rock analogs were calculated with the physical measurements, as listed in Table 2. The 3DP rock analogs in group I printed with various sand mixtures with a 200 μm LT show a rapid increase and decrease in porosity and density with the increase in the content percentages of the CG respectively. The results indicate that the porosity and density show a difference of 8.8% and 0.16, respectively. The unit mass of the 3DP rocks printed with coarser sands is heavier than the rock analogs printed with finer sands with the same dimension. Hence the density is larger. What is more, according to random packing theory (RPT) [54], the size distribution of the sand mixtures has a great influence on the sand packing mode, which directly determines the porosity and density of the 3DP rock analogs. The RPT suggests the grain size ratio of the sand mixtures has a great influence on the porosity and density of the granular medium. It means that the density increases with the grain size ratio, while the porosity decreases since the pore space between the coarse sands can be filled by extra-fine sands. According to the vendor datasheets, the coarse sands and the fine sands used in this study exhibit the bi-modal and mono-modal GS distribution, respectively. Therefore, the 3DP rock analogs with a higher percentage of the coarse sands can achieve denser packing since the grain size ratio between the smallest and the largest grains is higher. However, with the increment in fine sand percentage, the grain size ratio decreases rapidly, and the GS distribution tends to the mono-modal. The effect of the grain size ratio on the porosity and density of 3DP rocks printed with different blends of sand mixtures is shown in Figure 7. An empirical relation between the porosity and density of the 3DP rocks printed with different blends of sand mixtures was fitted and the correlation coefficient of the linear trend shows an R2 value of 0.993. It can help to estimate and validate the physical properties of the 3DP rocks with controllable dimensions and matrix materials prior to printing. According to previous studies [55,56], increasing the size ratio between the largest and smallest grains in the sand mixtures can effectively improve the packing ability, which means the size of the CG should be seven times larger than the FG. However, the size of the FG cannot be deduced without limit; on the one hand, the manufacturing of FG is a challenge, on the other hand, the extremely small size of the FG can strongly affect the flowability during the sand deposition and recoating process during 3D printing.
As shown in Figure 8, the 3DP rocks in group II printed with different LTs with Type I sand mixture show an increase and decrease in porosity and density with the increment in LT, respectively. There is a difference of 7.09% and 0.12 g/cm3 in porosity and density, respectively. Since the default setting of binder saturation is invariable for all specimens printed with different printing parameters, the dosage of the binder jetted onto the sand at each layer is the same. However, with the increment in the LT, the amount of the total sand at each layer increases rapidly, which means a reduction in the binder-to-sand ratio. On the one hand, with the reduction in the binder-to-sand ratio, the amount of unbonded sand at each layer increases, which means the sand packing is not efficient, with more voids between the sands. On the other hand, the interface effect of printing layer amplified with the increase in printing LT, which has a great influence on the physical and mechanical properties of the 3DP rocks.

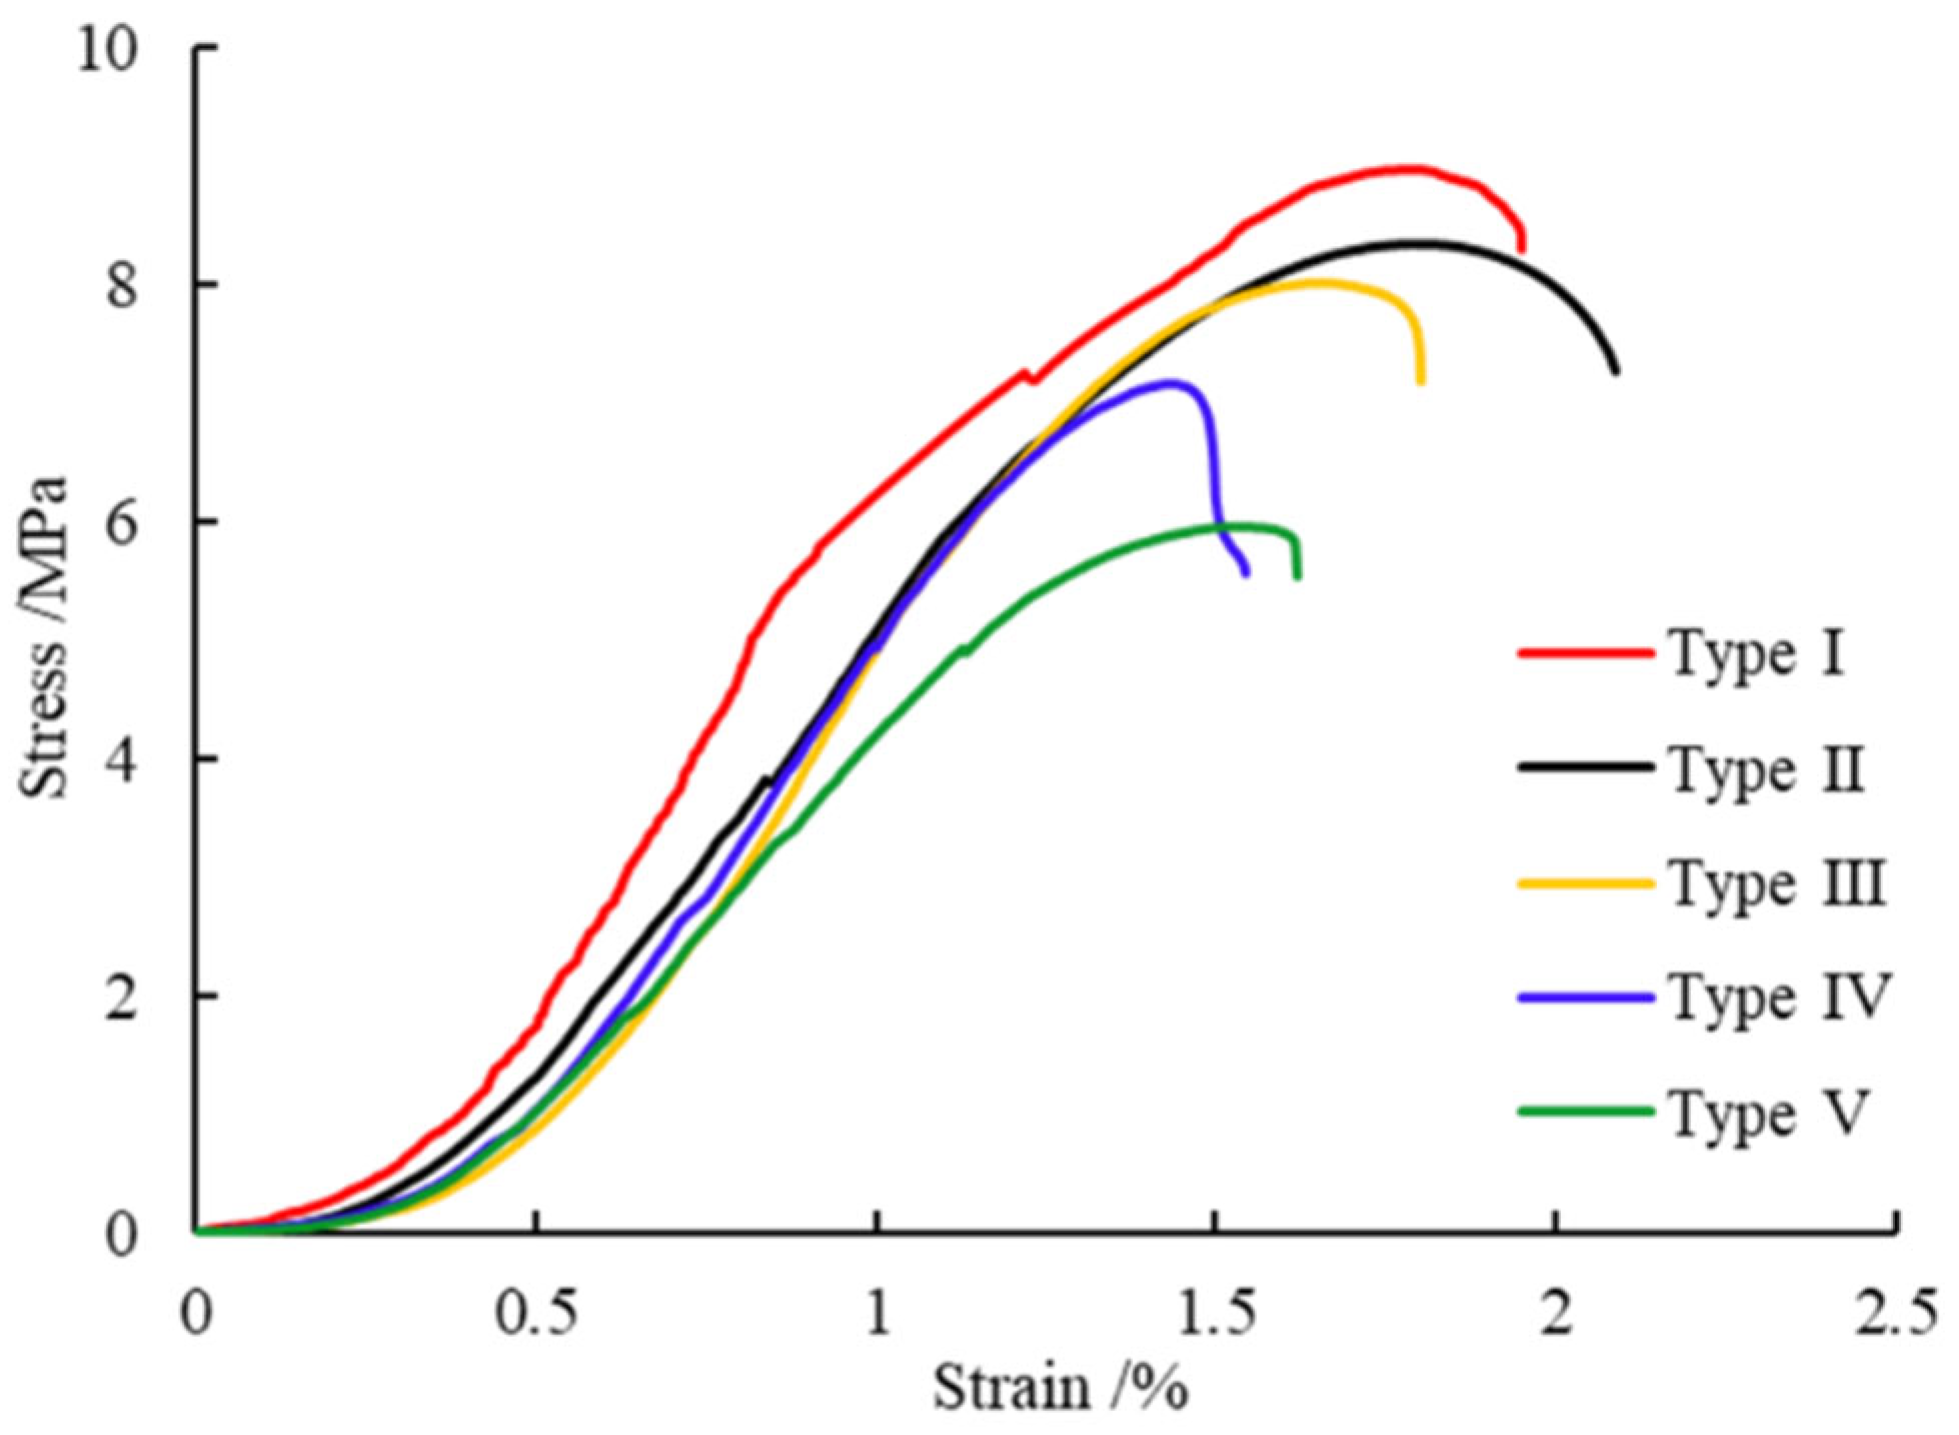
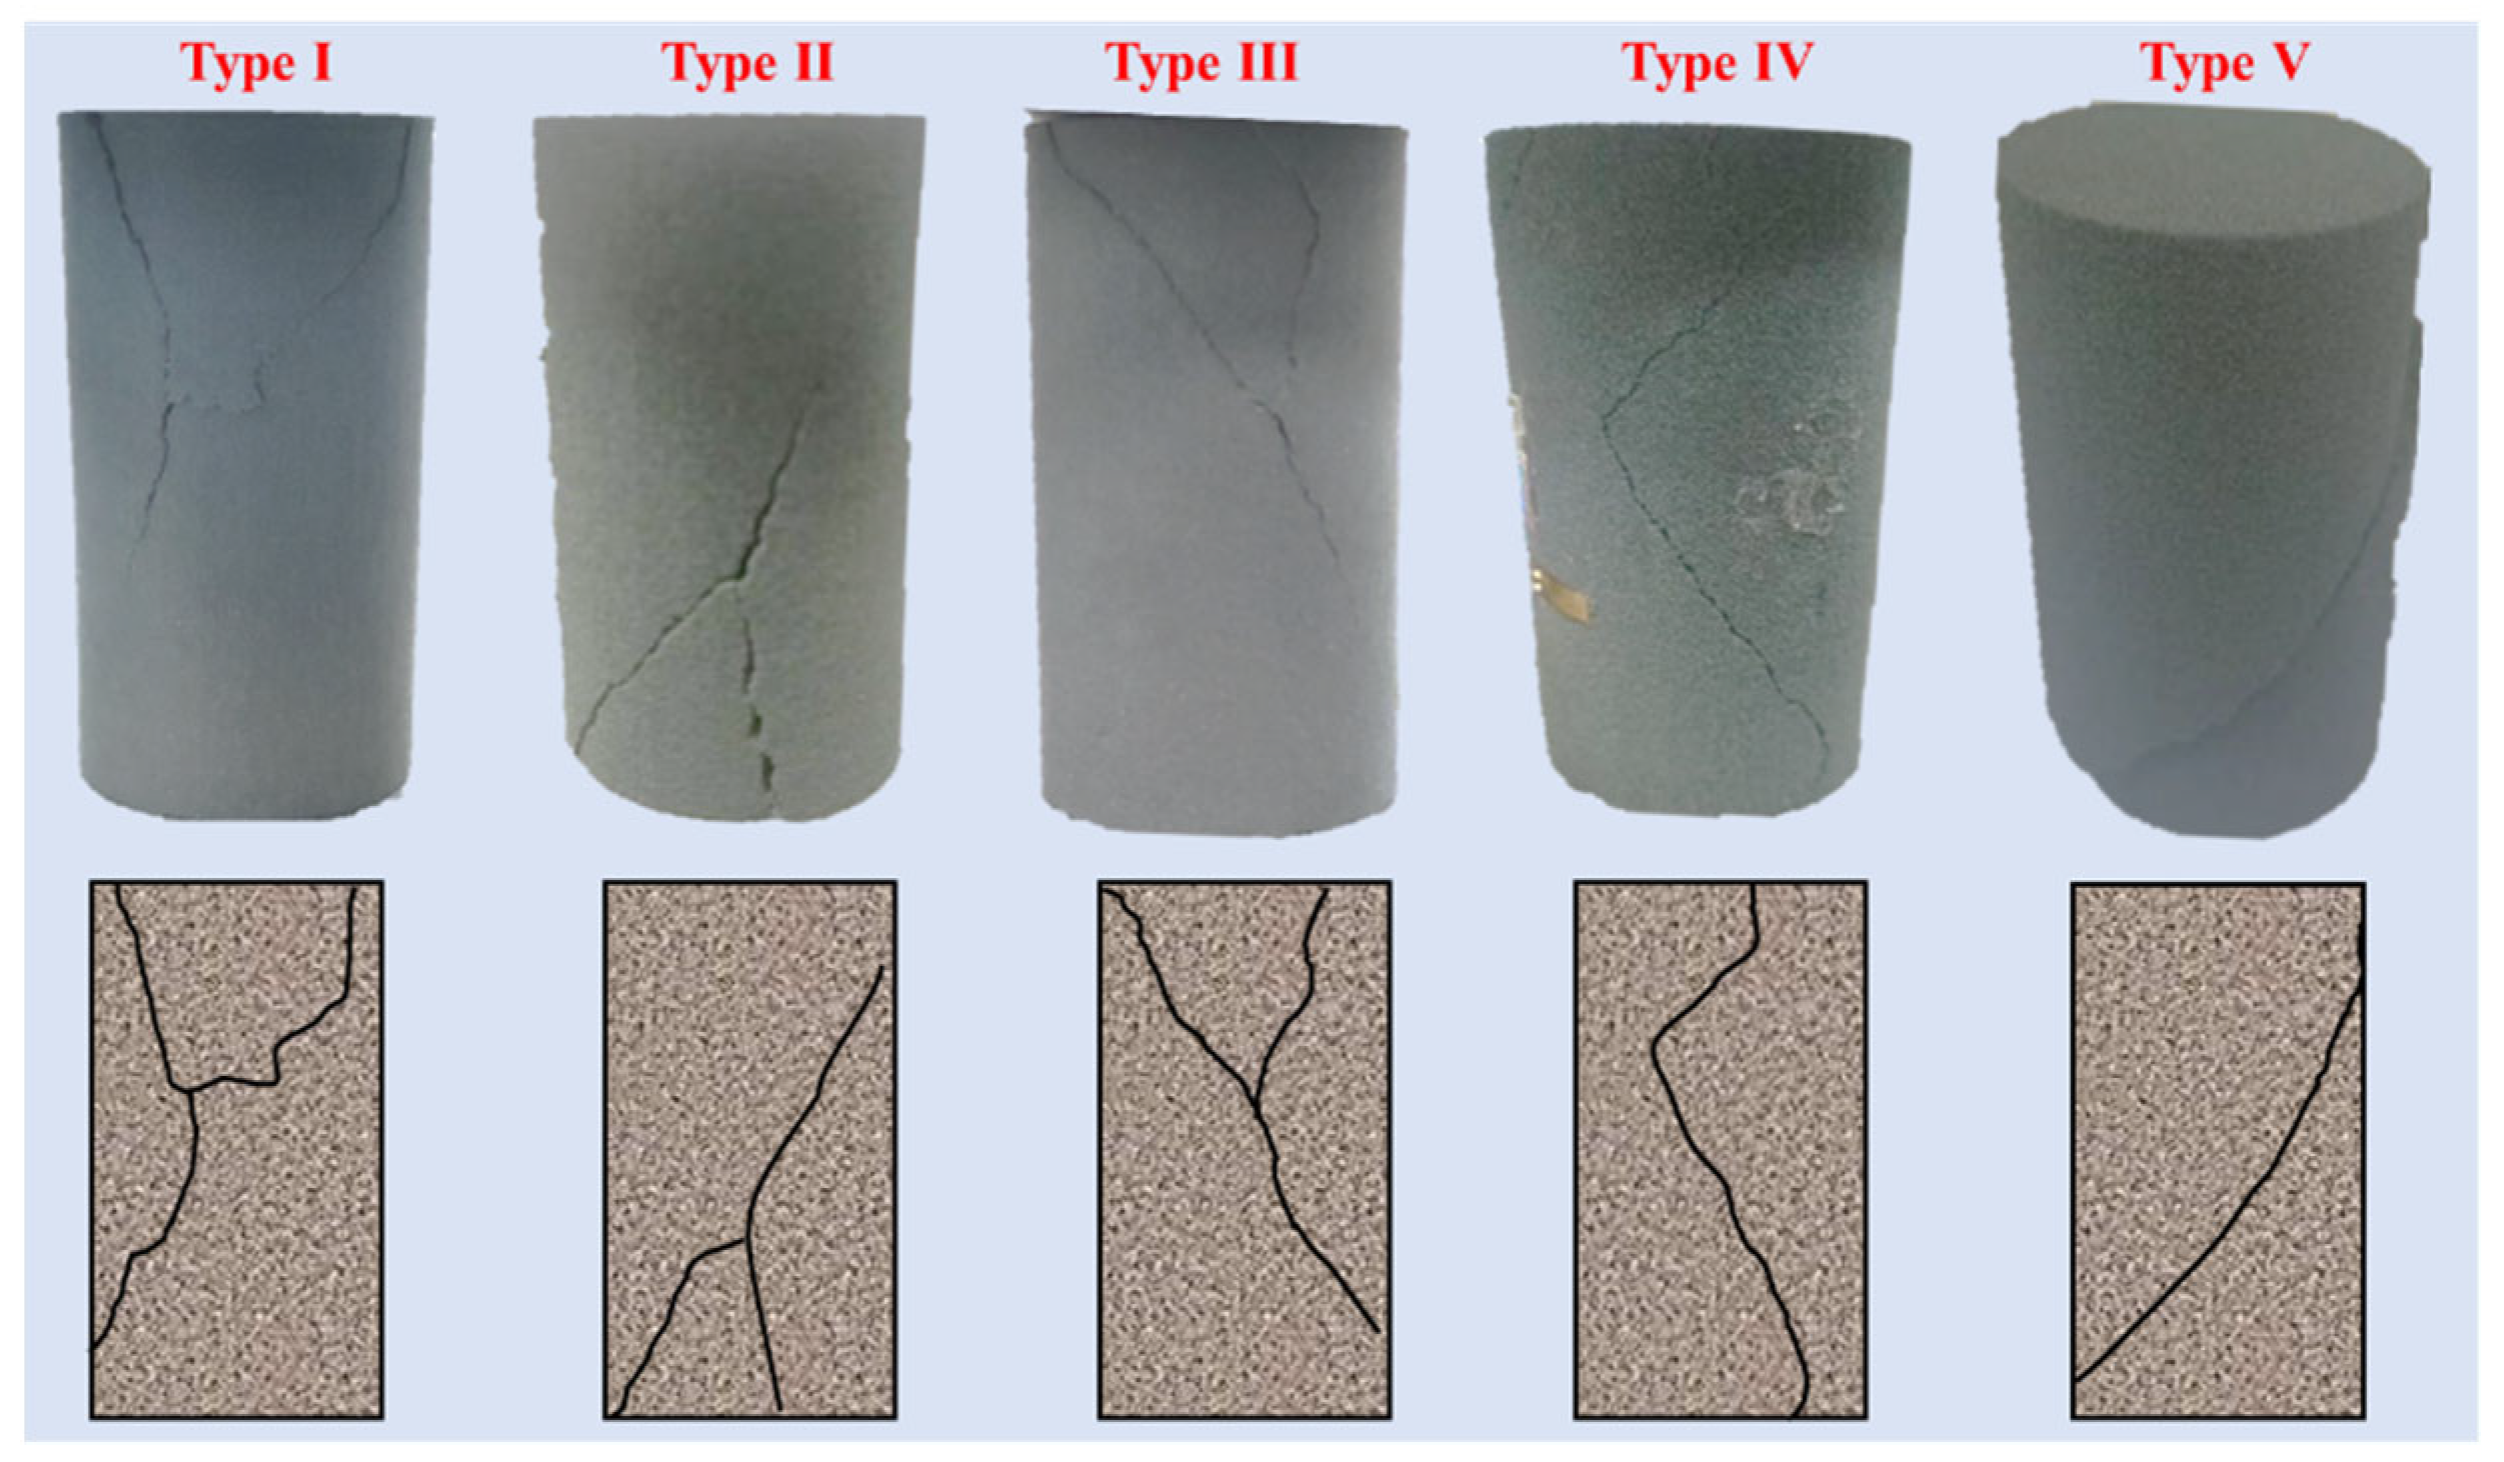
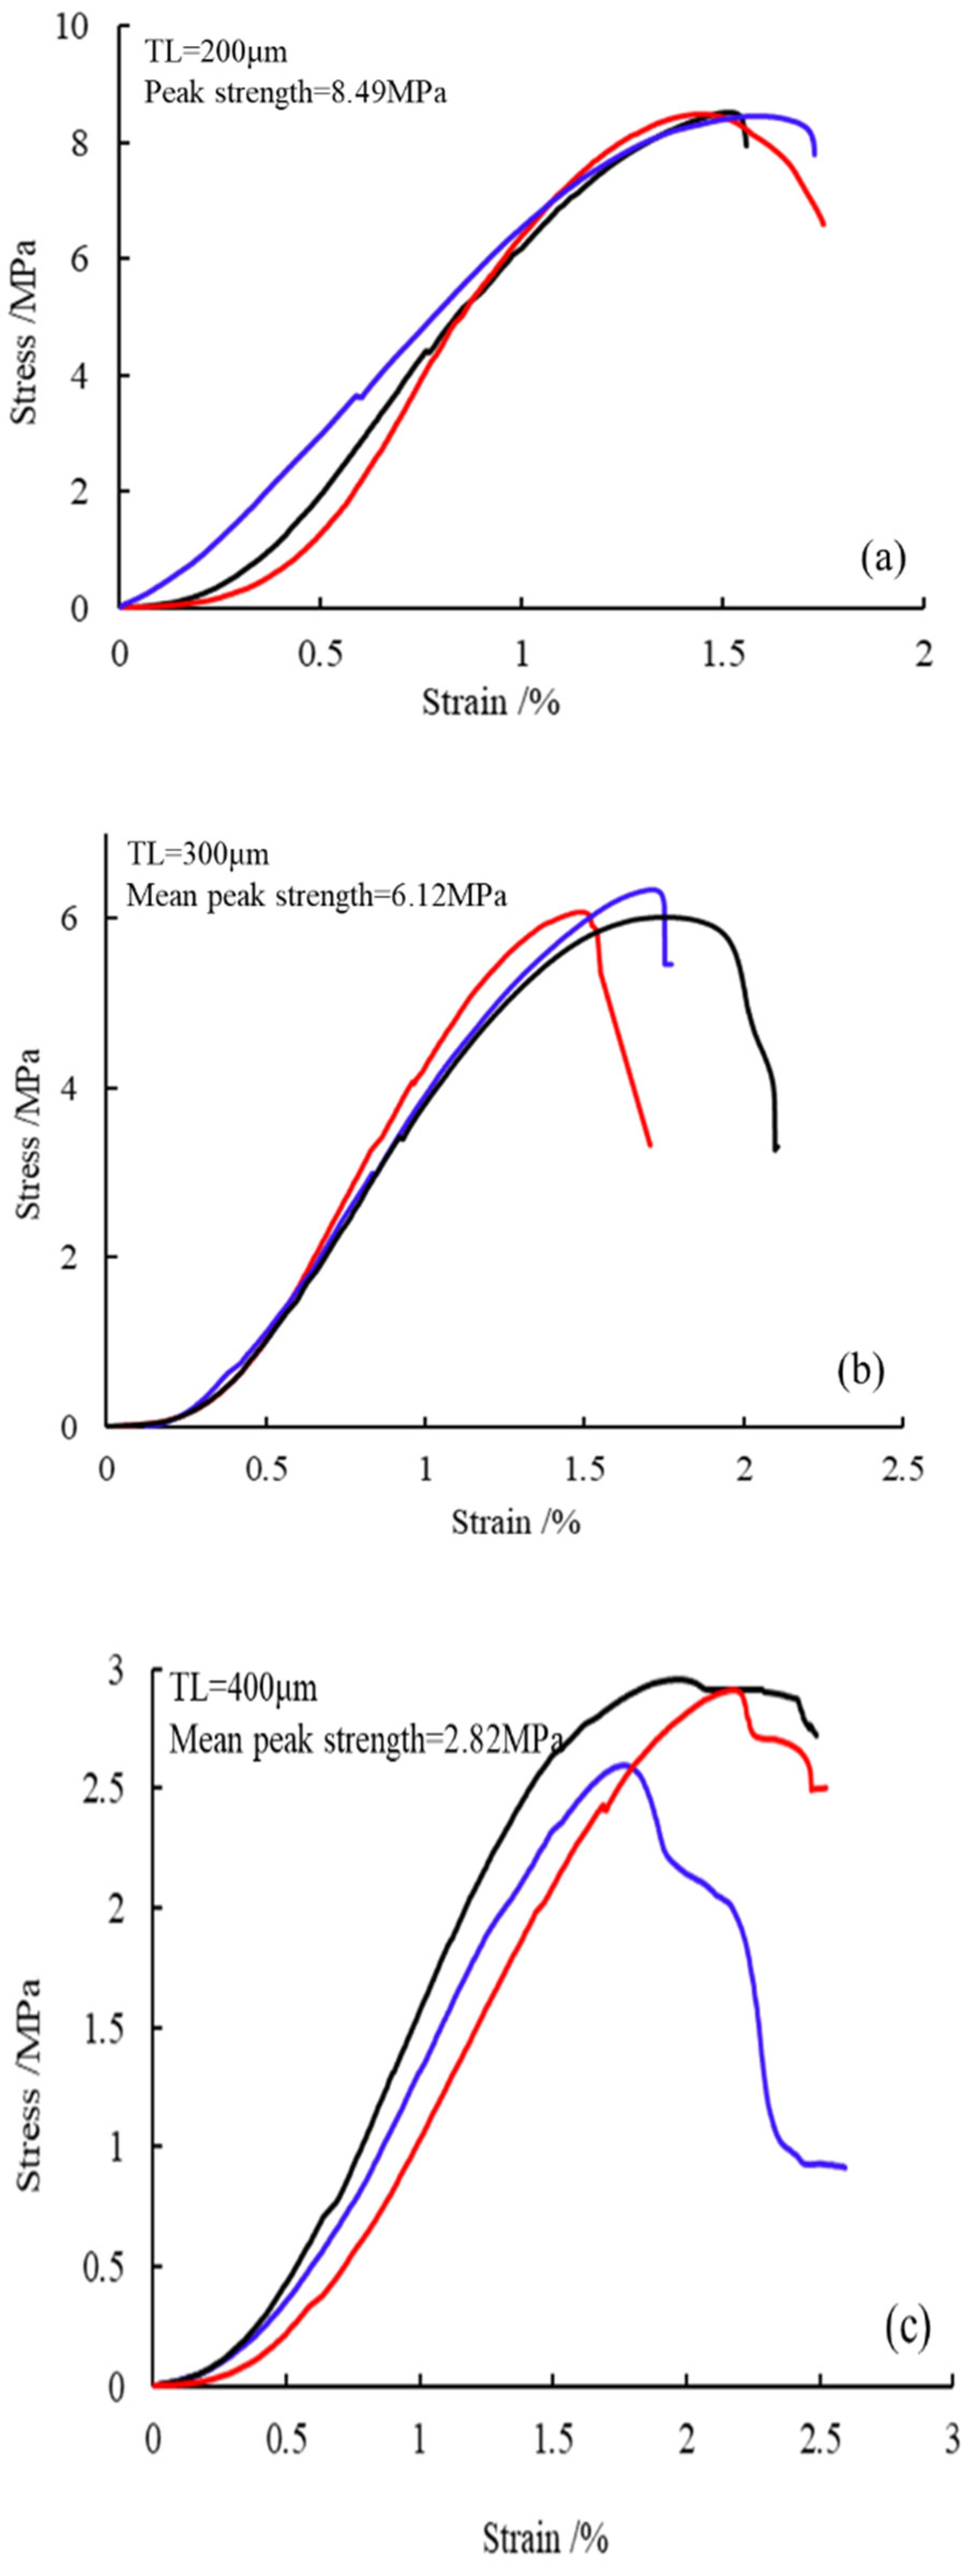
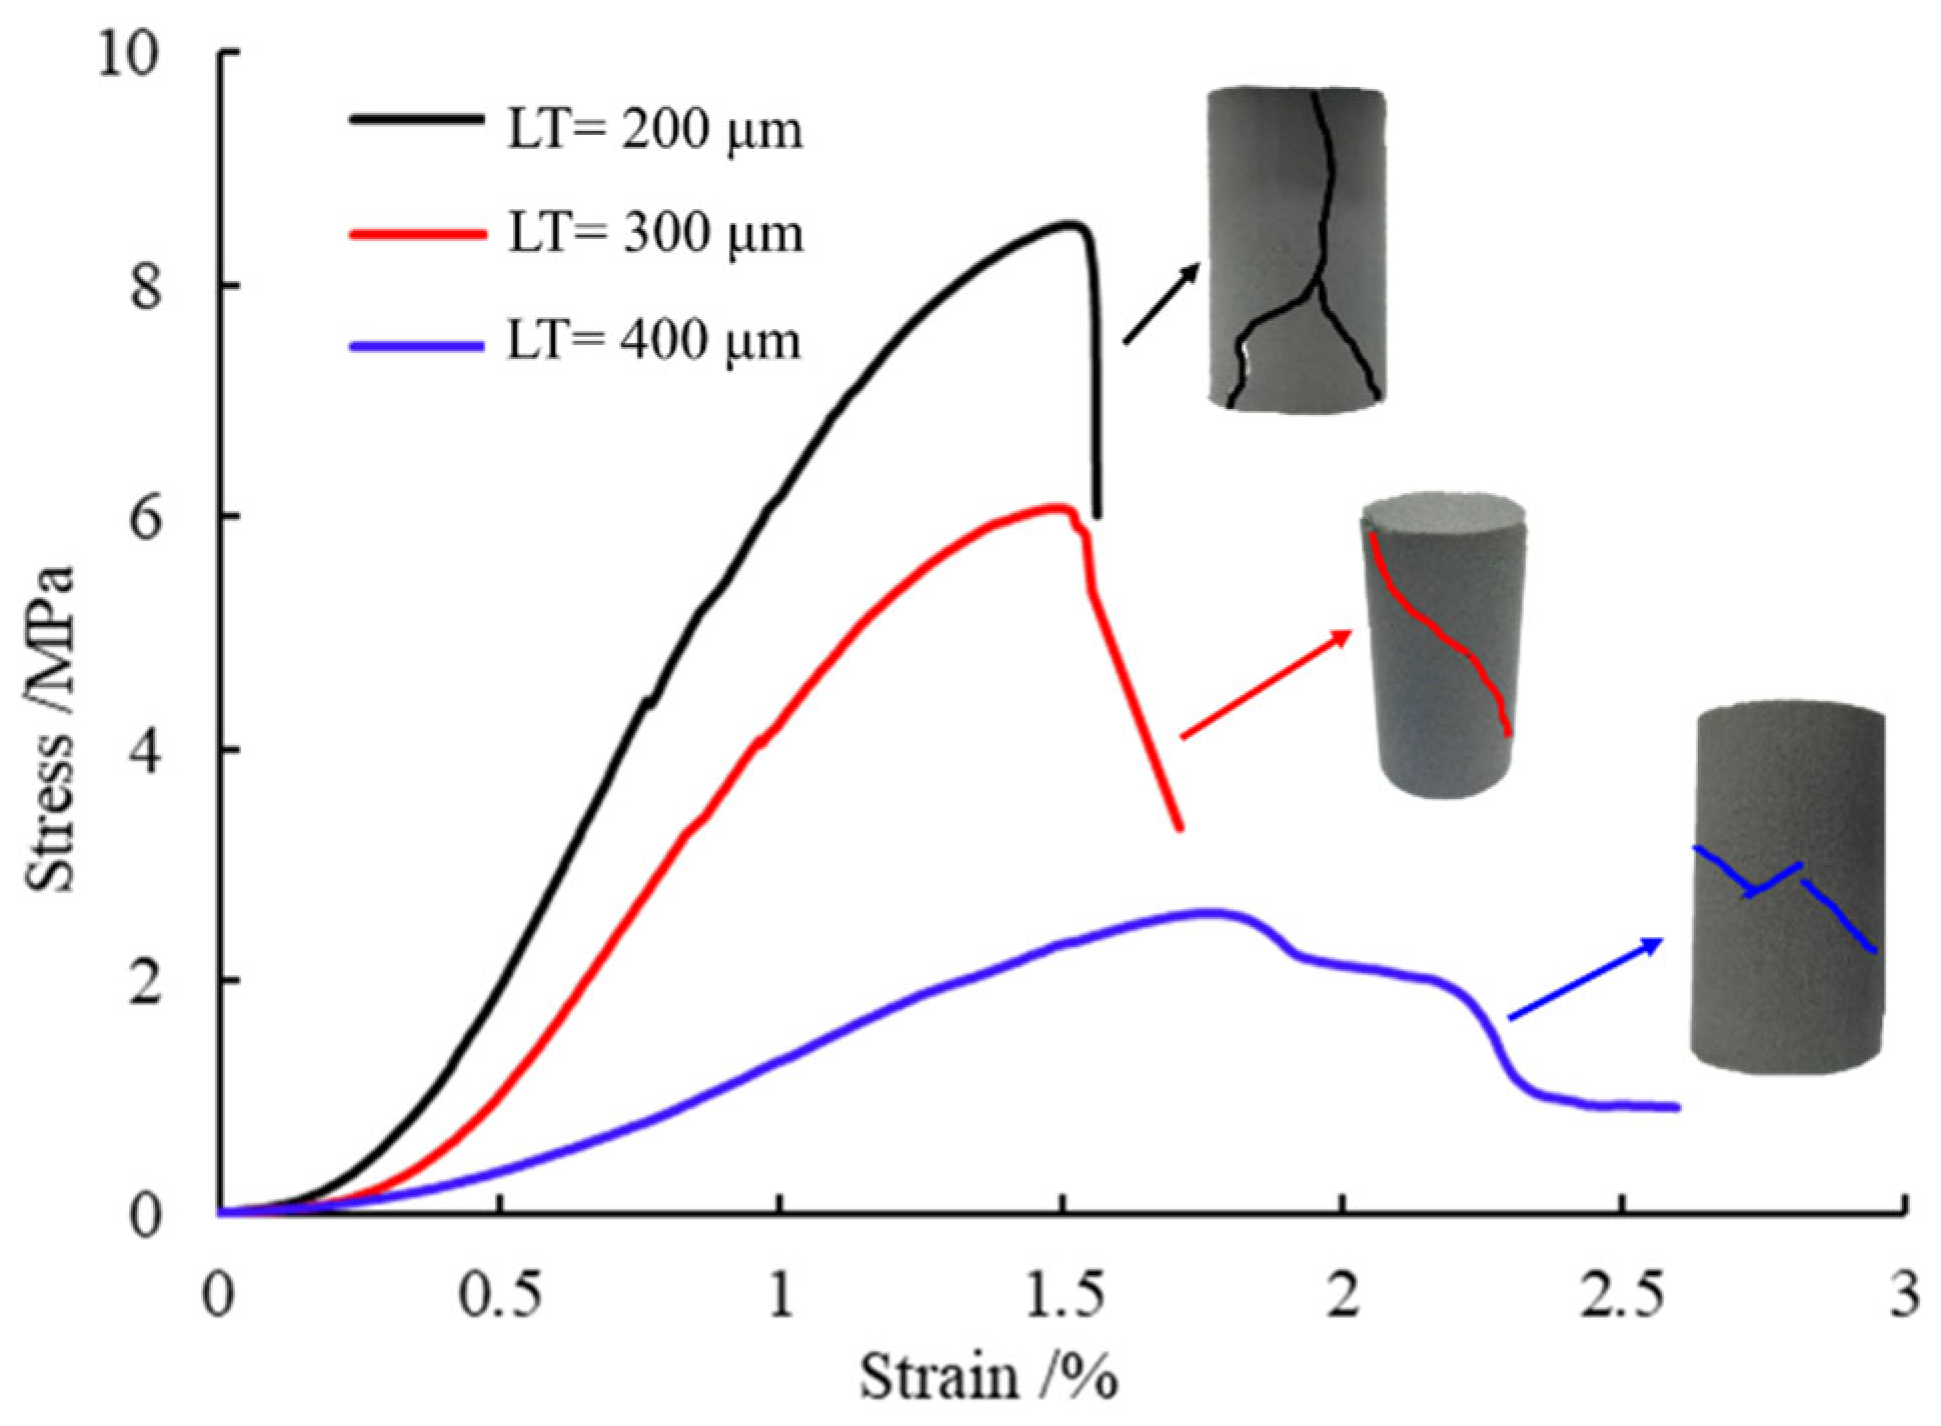
3.2. Unconfined Compressive Strength and Failure Behavior

The UCS and failure behavior of the 3DP rock analogs were investigated by unconfined compression testing. To avoid the test error, three specimens of each type of 3DP rock analogs were tested and used to calculate the mean value of the peak strength of the UCS. The test results are listed in Table 3. The axial stress–strain curves of the 3DP rock analogs printed with different blends of sand mixtures are recorded and shown in Figure 9. For the 3DP rocks printed with different blends of sand mixtures (group I), the largest peak strength of the UCS was recorded in type I (100% CG) with a mean value of 8.53 MPa. Moreover, the UCS decreases with the increment in the percentage of the FG in the sand mixtures. As mentioned above, the higher the percentage of the FG in the sand mixtures, the looser the structure of the 3DP rocks, with higher porosity and lower density. Hence, the stage of the pore space compaction is more obvious. The GS tends to the mono-modal distribution with the increment in the FG. Since the pore space between the large grains cannot be filled by the small grains, it limits the efficient compaction of the sand layer during printing. According to our previous study [15], the strength of the 3DP rocks is mainly provided by the “binder neck” bonding between the sand grains. In addition, the engaging force between the sand grains during the post-compression stage also contributes to the full strength of the 3DP rocks. In view of these points, the strength of the 3DP rocks printed with a higher percentage of the FG decreases rapidly since the “binder neck” bonding between the sand grains is relatively sparse and can provide limited strength.
The failure patterns of the 3DP rocks printed with different blends of sand mixtures are plotted and re-drawn in Figure 10. For the specimens with a higher percentage of CG, the tensile failures with shear cracks at the end of the cores are the main failure mode (Type I~III). These phenomena are also named as the “end cap” cone, which has been reported in a previous study, i.e., a failure zone with a cone shape at the end of the core [39]. There are multiple crack planes and many sand grains fall down from the crack planes during compression. Finally, the specimen breaks into several fragments. With the increment in the FG, the specimens mainly experience compression shear damage with a main shear crack plane through the core, which exists at a certain inclination angle with the loading direction (Type IV~V).
The various types of macroscopic failure behaviors of the 3DP sandstones are mainly caused by the different microscopic failure modes of the binder neck and the grain-to-grain interaction. The failure modes observed in the different types of the 3DP rocks agree well with some weak-cemented sandstones in a natural scenario, which proves the suitability of using the 3DP rocks printed with different blends of sand mixtures to simulate different types of natural sandstones.
The axial stress–strain curves of the 3DP rocks printed with different LTs are shown in Figure 11. The figure shows that the specimens printed with the same LT are very similar, whereas the specimens printed with different LTs show a large difference with various mechanical and deformation properties. The calculated mean values of the peak strength of the UCS are 8.49 MPa, 6.12 MPa, and 2.82 MPa for the 3DP rocks printed with 200 μm, 300 μm, and 400 μm LT, respectively. The peak strength decreases rapidly with the increment in LT. In addition, the reduction trend is much larger than the specimens printed with different blends of sand mixtures. To distinguish the difference between mechanical and failure behaviors, the typical stress–strain curves and destructive specimens of the 3DP rocks printed with different LTs are selected for comparison, as shown in Figure 12. The specimens printed with 200 μm and 300 μm LT exhibit similar deformation behavior after the pore compaction stage. Since the gaps are larger between the layers, the specimen (LT = 300 μm) has a longer pore compaction period than the one (LT = 200 μm). After that, both specimens experience the elastic deformation stage, the plastic deformation stage, and the crack stage. Finally, the specimen (LT = 200μm) experiences tensile shear failure with a “Y-shape” crack through the core (highlighted by a black line), while the specimen (LT = 300 μm) undergoes compressive shear damage with a single shear plane (highlighted by a red line). Compared to the aforementioned specimens, the specimen (LT = 400 μm) exhibits strong ductility with a lower USC of 2.82 MPa. The pore compaction stage is much longer than for the other two types of specimens, and the stress increases slowly with large deformation in the loading direction. The specimen reaches the peak stress under a small axial loading force, but the peak strain is relatively larger than for the other two types of specimens, with a value approaching 2%. Finally, the failure mainly occurred in the middle region of the specimen with multiple irregular cracks. As mentioned above, the binder saturation was the default for all types of 3DP sandstones, which means the binder-to-sand ratio will reduce with the increment in the LT both at each layer level and the entire specimen level. The reduction in the binder-to-sand ratio can significantly influence the effective packing, which is the main cause of abnormal mechanical responses and failure behaviors. The test results indicate that the printing LT has a great influence on the mechanical and deformation behaviors of the 3DP rocks. A small printing LT contributes to a higher UCS value, and the deformation process and failure mode are more similar to the natural rocks.

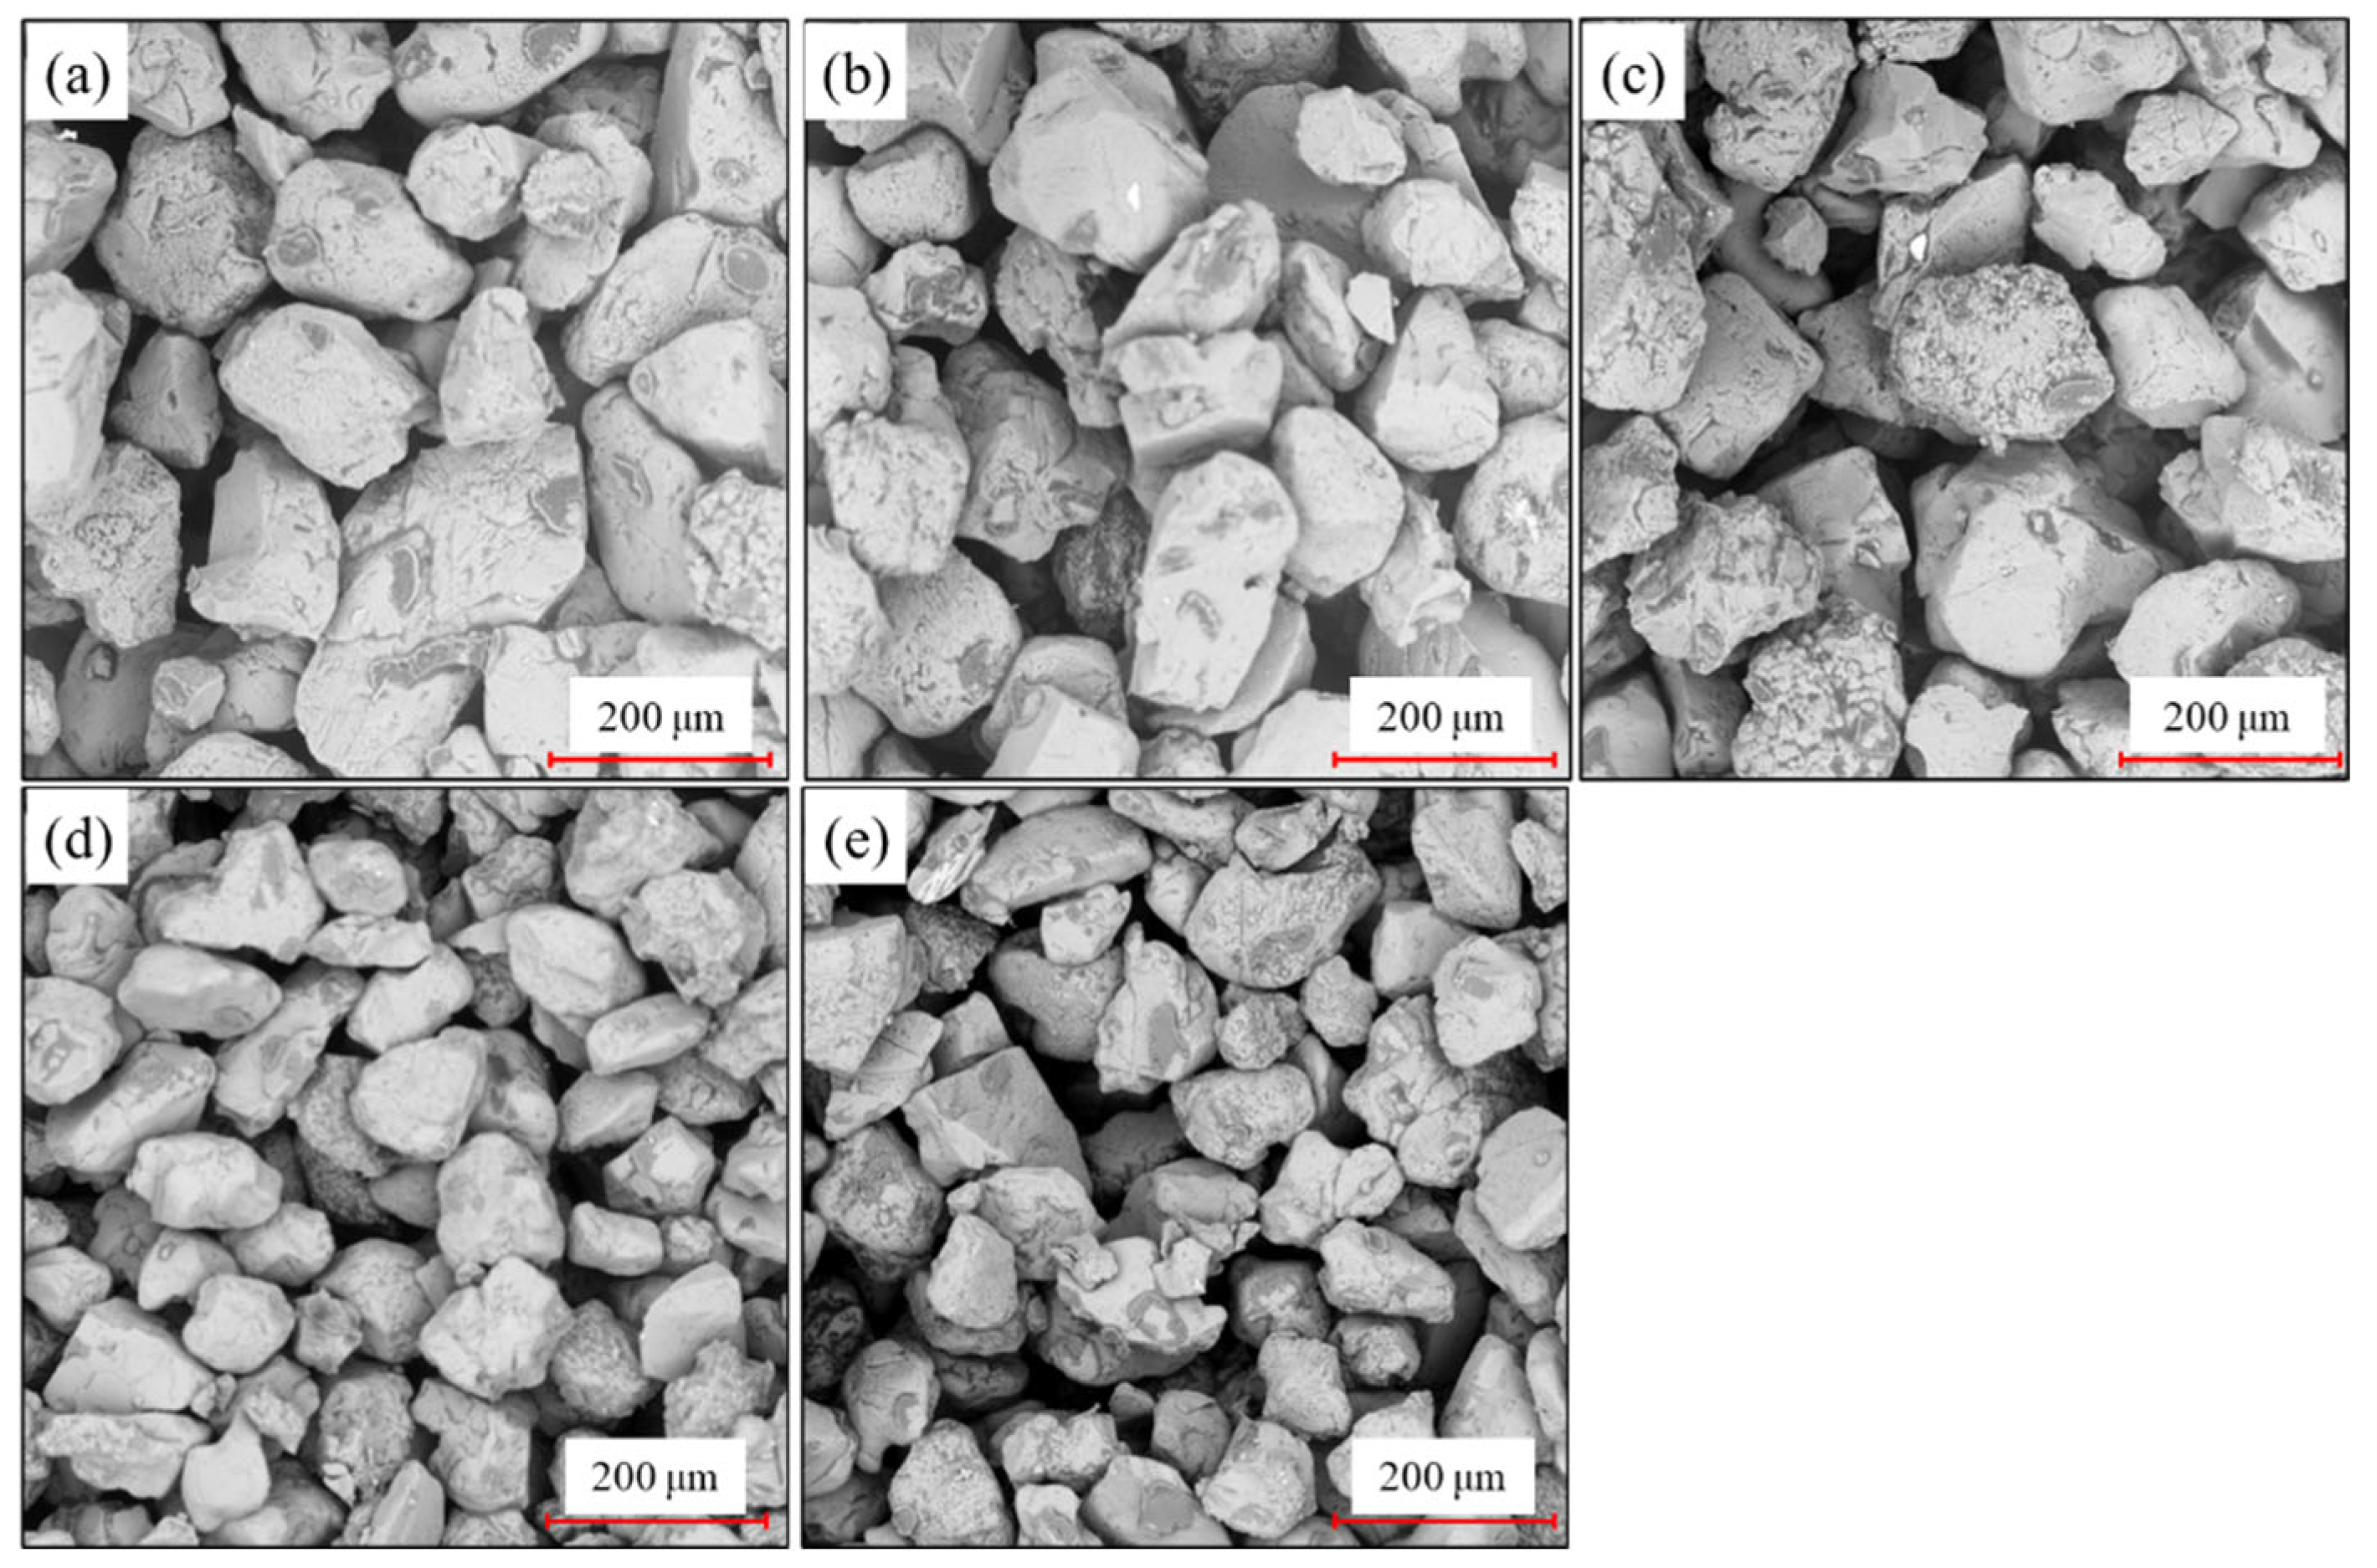
3.3. Sand Grain Packing and Pore Morphology

To reveal the mechanism behind the variations of the physical and mechanical properties of the 3DP rocks fabricated with different blends of sand mixtures and printing LTs, visualization equipment was utilized to extract the microstructure for quantitative characterization of the sand grain packing and pore morphology. SEM and EDS were used to investigate the sand grain packing, pore morphology, and the binder bonding mode in an integrated way.
As shown in Figure 13, the compositions of the 3DP rocks were determined using an integrated SEM–EDS test. Two test points were selected, and the silica sand (point 1) and binder (point 2) were identified and highlighted in blue and yellow circles, respectively. Since the main active ingredients of the silica sand and binder are quartz (SiO2) and organic matter, the element distribution of the test points are main silicon (oxygen) and carbon for point 1 and point 2, respectively. The test results indicated that the binder was mainly distributed in the gap between the sand grains and formed the bond in a “binder neck” shape with a point (or line) contact. Based on the results of the binder distribution, the binder bonding mode of the sand grain and the pore type of the 3DP rocks were investigated in the selected region of a part of the SEM image, as shown in Figure 14.
Part of the SEM image is selected to identify the grain bonding shape and perform the pore space extraction, as shown in Figure 14a. The cementation between the grains is observed in a “binder neck” shape, which is marked by the red dashed lines (Figure 14c). The “binder neck” bonding form has a great influence not only on the mechanical properties of the 3DP rocks, but also on the microstructure. It can be noted from the extracted pore space, as shown in Figure 14b highlighted in red, the pore type of the 3DP rocks is mainly intergranular pore. The phenomenon of pore filling by the binder is not occurring. The SEM images of the 3DP rocks printed with different blends of sand mixtures are shown in Figure 15. It can be noted from the SEM images that the porosity of the 3DP rocks increases with the increment in the percentage of the FG in the sand mixtures. The sand grain size distribution of the coarse sand exhibits is bi-modal, and the pore space between the coarse sands is filled by the fine sand. The phenomenon is similar to some natural sandstone with poor grain sorting, which can lead to low porosity [57,58]. What is more, the larger the size ratio between the largest and the smallest grains, the worse the grain sorting of the sand mixtures (i.e., the better the gradation of the sand grains), and this can result in a denser structure with more effective compaction. Further, the effective compaction of the 3DP rocks means more “binder necks” (i.e., bonding points) between the coarse and fine grains, which can provide an extra cohesive force to the full strength of the 3DP rocks.
Furthermore, the micro-CT is performed on the 3DP rocks to capture the spatial morphology and topological characteristics of the pore structure, as shown in Figure 16. The 3DP specimen printed with Type I sand mixtures at 200 μm LT is used as an example for micro-CT imaging. At first, the large view mode is utilized to capture the sand grain distribution of the whole 3DP rock with a resolution of 31.65 μm, as shown in Figure 16a. The dimensions of the scanned region are 800 × 800 × 960. From the image, it can be noted that the sand grain shows a relatively homogeneous distribution and effective compaction. The 3D view of the grain phase exhibits excellent morphology in the cylindrical shape (Figure 16c). Tiny deficiencies occur in the edge area in both diametric directions, which may be caused by the shifting of the sand grains during recoating and binder jetting at every individual layer. For a more intensive visualization of the internal structure of the 3DP rocks, a mini core plug (shown in Figure 6 and highlighted by the red circle in Figure 16a) is drilled from the original core sample for micro-CT imaging with a higher resolution of 3.61 μm. The dimensions of the scanned region are 1430 × 1430 × 1130, as shown in Figure 16b. The sand grain and pore phase are shown in light gray and blue, respectively. It can be noted from the image that the pore structure shows a relatively homogeneous distribution, and the intergranular pore is the main type as mentioned above. The compaction of the sand grains is also denser than in the specimens fabricated in our previous study [15]. What is more, it can be noted from the image that the sand grains experience more effective compaction near the edge area than the center area. This phenomenon is believed to be caused by the uneven distribution of the packing pressure provided by the roller pressure during the recoating process at every individual layer. A sub-domain with a dimension of 600 × 600 × 600 voxels is extracted to visualize the morphology of the pore structure, as shown in Figure 16d. Based on the extracted pore phase, the image porosity is calculated by counting the pore phase volume. The calculated image porosity (41.32%) agrees well with the corresponding helium-measured porosity (40.56%). Compared to our previous study, there are no significant morphological variations in the topology and connectivity properties of the pore structure. Investigations of the binder bonding mode and the microstructural properties of the 3DP rocks can strengthen the understanding of the influencing mechanism on the variations of the macroscopic characteristics of the 3DP rocks, and help design the fabrication scheme of the 3DP rocks (models) with more controllable properties.

3.4. Current Challenges and Prospects of the 3DP Sandstones

Considering the physical and mechanical properties of the 3DP sandstones fabricated with different blends of sand mixtures and printing LTs, the 3DP sandstones are very suitable to mimic weak-cemented natural sandstones. Despite the low strength of the conventional 3DP sandstones, they can contribute to meeting the load requirements between the physical model and the engineering prototype when a similar theory is considered. Besides, the physical strength of the 3DP sandstones can be improved rapidly with certain post-processing operations, such as the epoxy resin penetration in a vacuum condition, which makes it suitable to model those highly stressed rocks. However, the microstructure of the 3DP sandstone could be changed significantly since the pore space will be clogged, which has a great influence on the hydraulic property. The deformation and failure behaviors of the 3DP sandstones also vary based on the used sand grains and printing settings, as well as the post-processing operations.
Nowadays, despite the research on the 3DP sandstones, especially in combination with digital rock physics, the state-of-the-art approaches in rock mechanics and geosciences, the applications of the 3DP sandstones are still at an early stage. There are several challenging issues in completely replacing natural rocks with 3DP sandstones in rock mechanics research, in view of the inherent limitations of the 3DP sandstones involving material issues, fabrication, and post-processing operations. One of the biggest challenges lies in the limited printing LT of the 3DP sandstones. Limited by the smallest size of the sand grains and the mechanical capacity of the 3D printers, the sedimentary property (bedding thickness) of the natural sandstones cannot be mimicked well by the current 3D printer. Once the GS of the sand grains is determined, the printing LT cannot be lower than the GS of the sand grain. On the other hand, with the decrease in the sand grain size, the flowability decreases rapidly, which has a great influence on the deposition and spreading of the sand grains on the printing bed. To resolve the aforementioned limitations, an effective way is to rely on the further development of the 3D printer and the design and control techniques of the printing materials. The surface physicochemical properties of the 3DP sandstones can be adjusted via the appropriate post-processing operations, such as coating technology, to better simulate the interface characteristics, such as non-uniform wettability, so as to better mimic the fluid flow process in natural scenarios.

4. Conclusions

The aim of this paper was to reveal the effect of the different printing parameters and blends of sand mixtures on the physical and mechanical properties of the 3DP sandstones. To this end, 3DP sandstones were fabricated with various types of sand mixtures and printing LTs in this study. Then, a comprehensive experimental investigation was conducted to investigate the bulk properties (i.e., porosity and density), microstructural characteristics (i.e., sand grain packing and bonding mode, pore morphology), and mechanical and failure behaviors of the 3DP sandstones. The results confirm that both the sand mixtures and printing LT contribute to the variation in the physical and mechanical properties of the 3DP sandstones, and the following conclusions can be reached:
(1)
The porosity of the 3DP sandstones increases with the increment in the percentage of the FG in the sand mixtures, while the density decreases. With the increment in the printing LT, the same trend is also observed in the evolution of porosity and density of the 3DP sandstones. Based on that, an empirical relation between the porosity and density of the 3DP sandstones is fitted, which can help estimate and validate the physical properties of the 3DP sandstones with designed dimensions and controllable matrix materials prior to printing.
(2)
The UCS of the 3DP sandstones decreases with the increment in the percentage of the FG in the sand mixtures, as well as the printing LT. Various failure patterns occurred in the 3DP sandstones printed with different blends of sand mixtures and printing LTs, which agree well with some weak-cemented sandstones in a natural scenario and prove the suitability of using the 3DP sandstones to simulate different types of natural sandstones. What is more, the 3DP sandstones printed with a smaller LT and a higher percentage of CG contribute to a higher UCS value, and the deformation process and failure mode are also more similar to the natural rocks.
(3)
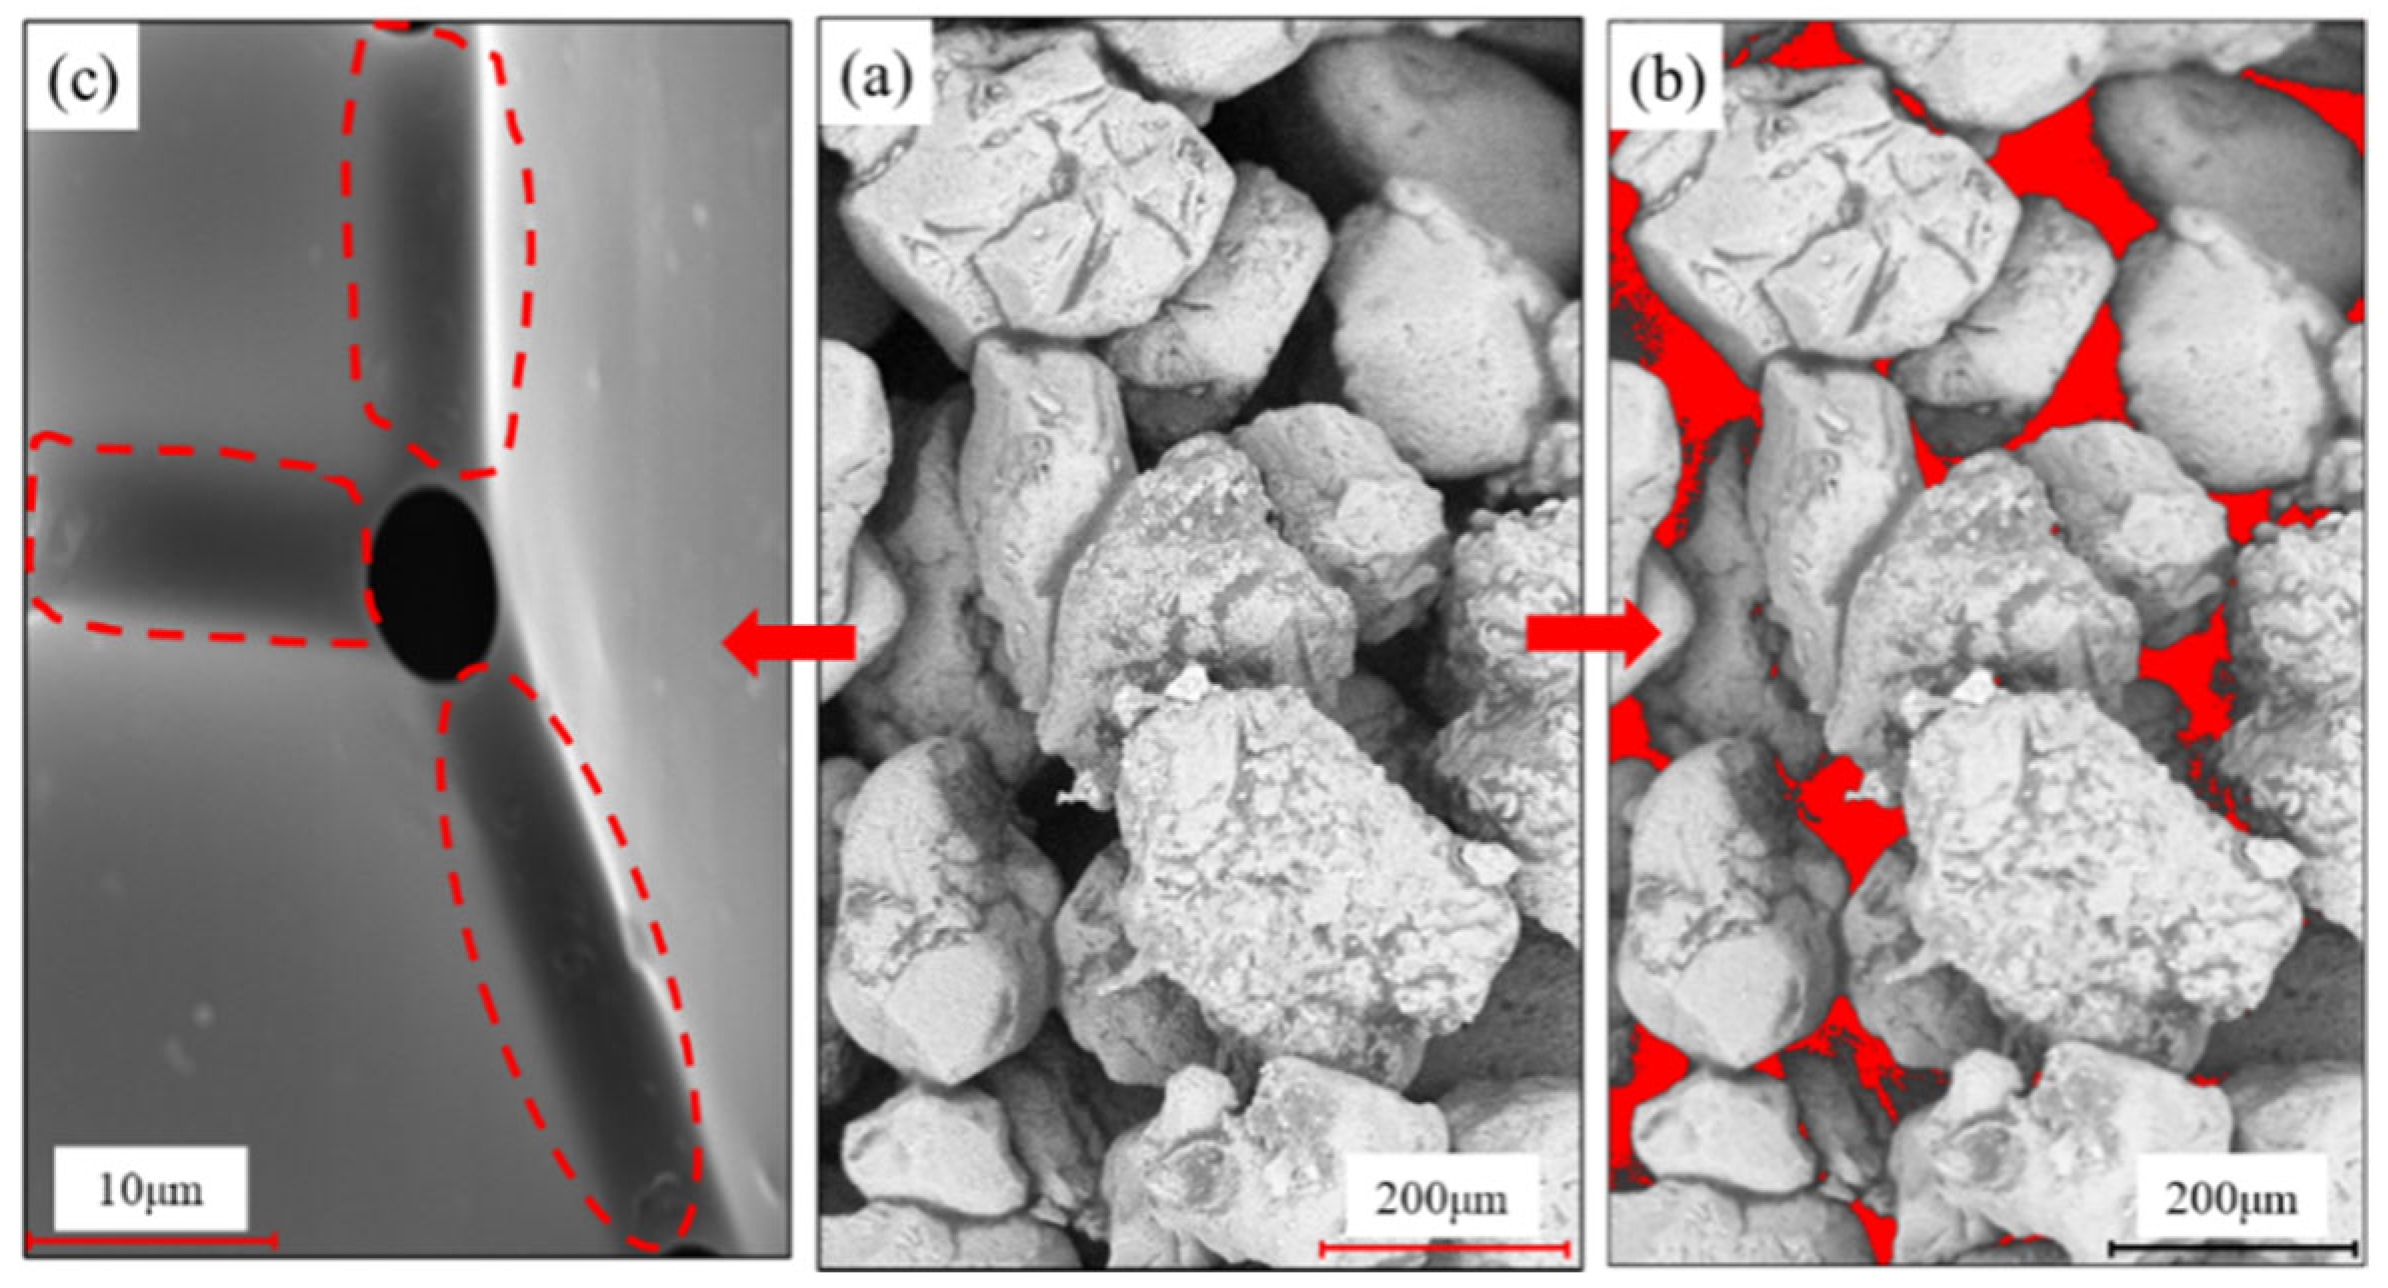
The 3DP sandstones have a much more homogeneous pore structure and looser compaction of sand grain compared to the natural sandstones. The cementation between the sand grains of the 3DP sandstones is observed in a “binder neck” shape, which has a great influence not only on the mechanical properties, but also on the microstructure. Benefiting from the sand grain bonding form, the pore type of the 3DP rocks is mainly an intergranular pore.
Based on the findings in this paper, we attempt to establish a customized workflow for fabricating 3DP rock analogs with designed properties and structures in a more controllable way for various applications and purposes in the rock mechanics and geoscience engineering fields. Finally, there are still challenges to overcome in future work on 3DP rock analogs, including multitype components printing with various types of minerals, the non-uniform wettability design, and the accurate control of the brittle–ductile conversion.

Author Contributions

Conceptualization, Y.W.; Formal analysis, M.Y. and S.P.; Funding acquisition, Y.W.; Investigation, Y.W.; Writing—original draft, Y.W. and S.L.; Writing—review and editing, R.S., J.L. and Y.D. All authors have read and agreed to the published version of the manuscript.

Funding

This research was funded by National Natural Science Foundation of China grant number [51909225]; Natural Science Foundation of Sichuan, grant number [2022NSFSC1161], and Doctoral Foundation of SWUST, grant number [20zx7129]. And The APC was funded by [2022NSFC1161 and 20zx7129].

Institutional Review Board Statement

Not applicable.

Informed Consent Statement

Not applicable.

Data Availability Statement

All the data and materials used in this paper are available from the corresponding authors upon request.

Acknowledgments

Hao Zhou and Xiaoyu Li are acknowledged for providing the assistance on the CT and SEM test.

Conflicts of Interest

The authors declare that there are no competing financial interests with any other people or groups regarding the publication of this manuscript.

References

  1. Liu, L.; Deisman, N.; Chalaturnyk, R. Elastic stiffness modelling of opalinus clay based on laboratory measurements with implications for in-situ testing. Rock Mech. Rock Eng. 2022, 55, 1832–1842. [Google Scholar] [CrossRef]
  2. Almetwally, A.; Jabbari, H. Experimental investigation of 3D printed rock samples replicas. J. Nat. Gas Sci. Eng. 2020, 76, 103192. [Google Scholar] [CrossRef]
  3. Zheng, Y.; Liu, J.; Zhang, B. An investigation into the effects of weak interfaces on fracture height containment in hydraulic fracturing. Energies 2019, 12, 3245. [Google Scholar] [CrossRef] [Green Version]
  4. Patsoukis, D.; Menke, H.; Maes, J. Benchmarking the viability of 3D printed micromodels for single phase flow using particle image velocimetry and direct numerical simulations. Transp. Porous Media 2022, 141, 279–294. [Google Scholar] [CrossRef]
  5. You, M.; Hua, A. The failure mode and decrease of compressive strength of rock under uniaxial compression condition. Chin. J. Rock Mech. Eng. 1998, 17, 292–296. [Google Scholar]
  6. Ju, Y.; Wang, H.; Yang, Y.; Hu, Q.; Peng, R. Numerical simulation of mechanisms of deformation, failure and energy dissipation in porous rock media subjected to wave stresses. Sci. China Tech. Sci. 2010, 53, 1098–1113. [Google Scholar] [CrossRef]
  7. Wang, Y.; Song, R.; Liu, J.; Cui, M.; Ranjith, P. Pore scale investigation on scaling-up micro-macro capillary number and wettability on trapping and mobilization of residual fluid. J Contam. Hydrol. 2019, 225, 103499. [Google Scholar] [CrossRef]
  8. Shi, D.; Li, L.; Liu, J.; Wu, M.; Pan, Y.; Tang, J. Effect of discrete fractures with or without roughness on seepage characteristics of fractured rocks. Phys. Fluids 2022, 34, 073611. [Google Scholar] [CrossRef]
  9. Gell, E.; Walley, S.; Braithwaite, C. Review of the validity of the use of artificial specimens for characterizing the mechanical properties of rocks. Rock Mech. Rock Eng. 2019, 52, 2946–2961. [Google Scholar] [CrossRef] [Green Version]
  10. Li, W.; Yu, H.; Yang, Z.; Li, J.; Chen, X.; Ma, L. Experimental study on the sweep law of CO2 miscible flooding in heterogeneous reservoir in Jilin. Energies 2022, 15, 5755. [Google Scholar] [CrossRef]
  11. Charalampos, K.; Giovanna, B.; Jiang, N.; Kenichi, S. Application of microbially induced carbonate precipitation to form bio-cemented artificial sandstone. J. Rock Mech. Geotech. Eng. 2021, 13, 579–592. [Google Scholar]
  12. Zhou, T.; Zhu, J.; Ju, Y.; Xie, H. Volumetric fracturing behavior of 3D printed artificial rocks containing single and double 3D internal flaws under static uniaxial compression. Eng. Fract. Mech. 2019, 205, 190–204. [Google Scholar] [CrossRef]
  13. Wang, H.; Shao, J.; Zhang, J.; Zou, D.; Sun, X. Bond shear performances and constitutive model of interfaces between vertical and horizontal filaments of 3D printed concrete. Constr. Build. Mater. 2022, 316, 125819. [Google Scholar] [CrossRef]
  14. Ren, Z.; Zhang, Q.; Ju, Y.; Xie, H. Determination of the full-field stress and displacement using photoelasticity and sampling moiré method in a 3D-printed model. Theor. Appl. Mech. Lett. 2022, 100380. [Google Scholar] [CrossRef]
  15. Song, R.; Wang, Y.; Ishutov, S.; Narvaez, G.; Hodder, K.; Chalaturnyk, R.; Sun, S.; Liu, J.; Ranjith, P. A comprehensive experimental study on mechanical behavior, microstructure and transport properties of 3D-printed rock analogs. Rock Mech. Rock Eng. 2020, 53, 5745–5765. [Google Scholar] [CrossRef]
  16. Primkulov, B.; Chalaturnyk, J.; Chalaturnyk, R.; Narvaez, G. 3D printed sandstone strength: Curing of furfuryl alcohol resin-based sandstones. 3D Print Addit. Manuf. 2017, 4, 149–155. [Google Scholar] [CrossRef]
  17. Ishutov, S.; Hasiuk, F. 3D printing Berea sandstone: Testing a new tool for petrophysical analysis of reservoirs. Petrophysics 2017, 58, 592–602. [Google Scholar]
  18. Ishutov, S.; Hasiuk, F.; Harding, C.; Gray, J. 3D printing sandstone porosity models. Interpretation 2015, 3, SX49–SX61. [Google Scholar] [CrossRef]
  19. Ishutov, S.; Hasiuk, F.; Fullmer, S.; Buono, A.; Gray, J.; Harding, C. Resurrection of a reservoir sandstone from tomographic data using three-dimensional printing. AAPG Bull. 2017, 101, 1425–1443. [Google Scholar] [CrossRef]
  20. Jiang, C.; Zhao, G. A preliminary study of 3D printing on rock mechanics. Rock Mech. Rock Eng. 2015, 48, 1041–1050. [Google Scholar] [CrossRef]
  21. Ma, G.; Wang, L.; Ju, Y. State-of-the-art of 3D printing technology of cementitious material-An emerging technique for construction. Sci. China Technol. Sci. 2018, 61, 475–495. [Google Scholar] [CrossRef]
  22. Song, R.; Wang, Y.; Tang, Y.; Peng, J.; Liu, J.; Yang, C. 3D Printing of natural sandstone at pore scale and comparative analysis on micro-structure and single/two-phase flow properties. Energy 2022, 261, 125226. [Google Scholar] [CrossRef]
  23. Ngo, T.; Kashani, A.; Imbalzano, G.; Nguyen, K.; Hui, D. Additive manufacturing (3D printing): A review of materials, methods, applications and challenges. Compos. Part B-Eng. 2018, 143, 172–196. [Google Scholar] [CrossRef]
  24. Kofi, O.; Paul, G.; Nima, S. Investigation of foam flow in a 3D printed porous medium in the presence of oil. J. Colloid Interf. Sci. 2017, 490, 850–858. [Google Scholar]
  25. Ishutov, S.; Hodder, K.; Chalaturnyk, R.; Narvaez, G. Replication of carbonate reservoir pores at the original size using 3D printing. Petrophysics 2021, 62, 477–485. [Google Scholar] [CrossRef]
  26. Liu, P.; Ju, Y.; Ranjith, P.; Zheng, Z.; Wang, L.; Wanniarachchi, A. Visual representation and characterization of three-dimensional hydrofracturing cracks within heterogeneous rock through 3D printing and transparent models. Int. J. Coal Sci. Technol. 2016, 3, 284–294. [Google Scholar] [CrossRef] [Green Version]
  27. Ahkami, M.; Roesgen, T.; Saar, M.; Kong, X. High-resolution temporo-ensemble PIV to resolve pore-scale flow in 3D-printed fractured porous media. Transp. Porous Media 2019, 129, 467–483. [Google Scholar] [CrossRef]
  28. Sharafisafa, M.; Shen, L.; Xu, Q. Characterisation of mechanical behaviour of 3D printed rock-like material with digital image correlation. Int. J. Rock Mech. Min. Sci. 2018, 112, 122–138. [Google Scholar] [CrossRef]
  29. Suzuki, A.; Minto, J.; Watanabe, N.; Li, K.; Horne, R. Contributions of 3D printed fracture networks to development of flow and transport models. Transp. Porous Media 2019, 129, 485–500. [Google Scholar] [CrossRef] [Green Version]
  30. Zhang, Y.; Ye, J.; Li, P. Flow characteristics in a 3D-printed rough fracture. Rock Mech. Rock Eng. 2022, 55, 4329–4349. [Google Scholar] [CrossRef]
  31. Hodder, K.; Nychka, J. Silane treatment of 3D-printed sandstone models for improved spontaneous imbibition of water. Transp. Porous Media 2019, 129, 583–598. [Google Scholar] [CrossRef]
  32. Kong, L.; Ostadhassan, M.; Li, C. Can 3-D printed gypsum samples replicate natural rocks? An experimental study. Rock Mech. Rock Eng. 2018, 51, 3061–3074. [Google Scholar] [CrossRef]
  33. Kong, L.; Ostadhassan, M.; Hou, X.; Mann, M.; Li, C. Microstructure characteristics and fractal analysis of 3D-printed sandstone using micro-CT and SEM-EDS. J. Petro. Sci. Eng. 2019, 175, 1039–1048. [Google Scholar] [CrossRef]
  34. Song, L.; Jiang, Q.; Shi, Y.; Feng, X.; Li, Y.; Su, F.; Liu, C. Feasibility investigation of 3D printing technology for geotechnical physical models: Study of tunnels. Rock Mech. Rock Eng. 2018, 51, 2617–2637. [Google Scholar] [CrossRef]
  35. Hodder, K.; Craplewe, K.; Ishutov, S.; Chalaturnyk, R. Binder saturation as a controlling factor for porosity variation in 3D-printed sandstone. Petrophysics 2021, 62, 450–462. [Google Scholar] [CrossRef]
  36. Wu, Z.; Zhang, B.; Weng, L.; Liu, Q.; Wong, L. A new way to replicate the highly stressed soft rock: 3D printing exploration. Rock Mech. Rock Eng. 2020, 53, 467–476. [Google Scholar] [CrossRef]
  37. Li, Y.; Zhou, H.; Zhang, L.; Zhu, W.; Li, S.; Liu, J. Experimental and numerical investigations on mechanical property and reinforcement effect of bolted jointed rock mass. Constr. Build. Mater. 2016, 126, 843–856. [Google Scholar] [CrossRef]
  38. Kong, L.; Ostadhassan, M.; Li, C.; Tamimi, N. Pore characterization of 3D-printed gypsum rocks: A comprehensive approach. J. Mat. Sci. 2018, 53, 5063–5078. [Google Scholar] [CrossRef]
  39. Hodder, K.; Nychka, J.; Chalaturnyk, R. Improvement of the unconfined compressive strength of 3D-printed model rock via silica sand functionalization using silane coupling agents. Int. J. Adhes. Adhes. 2018, 85, 274–280. [Google Scholar] [CrossRef]
  40. Gomez, J.; Chalaturnyk, R.; Navaez, G. Experimental investigation of the mechanical behavior and permeability of 3D printed sandstone analogs under triaxial conditions. Transp. Porous Media 2019, 129, 541–557. [Google Scholar] [CrossRef] [Green Version]
  41. Ardila, N.; Narvaez, G.; Chalaturnyk, R. Wettability measurements on 3D printed sandstone analogues and its implications for fluid transport phenomena. Transp. Porous Media 2019, 129, 521–539. [Google Scholar] [CrossRef]
  42. Kong, L.; Ishutov, S.; Hasiuk, F.; Xu, C. 3D Printing for experiments in petrophysics, rock physics, and rock mechanics: A review. SPE Reserv. Eval. Eng. 2021, 24, 721–732. [Google Scholar] [CrossRef]
  43. Alyafei, N.; Al, M.; Bautista, J.; Idris, M.; Seers, T. Enhanced learning of fundamental petrophysical concepts through image processing and 3D printing. Petrophysics 2021, 62, 463–476. [Google Scholar] [CrossRef]
  44. Zhou, T.; Zhu, J. Identification of a suiTable 3D printing material for mimicking brittle and hard rocks and its brittleness enhancements. Rock Mech. Rock Eng. 2018, 51, 765–777. [Google Scholar] [CrossRef]
  45. Zhu, J.; Zhou, T.; Liao, Z.; Sun, L.; Li, X.; Chen, R. Replication of internal defects and investigation of mechanical and fracture behavior of rock using 3D printing and 3D numerical methods in combination with x-ray computerized tomography. Int. J. Rock Mech. Min. Sci. 2018, 106, 198–212. [Google Scholar] [CrossRef]
  46. Hodder, K.; Sanchez, A.; Ishutov, S.; Narvaez, Z.; Chalaturnyk, R. Increasing density of 3D-printed sandstone through compaction. Energies 2022, 15, 1813. [Google Scholar] [CrossRef]
  47. Xu, Q.; Jiang, L.; Ma, C.; Niu, Q.; Wang, X. Effect of layer thickness on the physical and mechanical properties of sand powder 3D printing specimens. Front. Earth Sci. 2021, 9, 763202. [Google Scholar] [CrossRef]
  48. Mostafaei, A.; Rodriguez De Vecchis, P.; Nettleship, P.; Chmielus, M. Effect of powder size distribution on densification and microstructural evolution of Binder-Jet 3D printed alloy 625. Mater. Des. 2019, 162, 375–383. [Google Scholar] [CrossRef]
  49. Song, R.; Wang, Y.; Sun, S.; Liu, J. Characterization and microfabrication of natural porous rocks: From micro-CT imaging and digital rock modelling to micro-3D-printed rock analogs. J. Petro. Sci. Eng. 2021, 205, 108827. [Google Scholar] [CrossRef]
  50. ASTM International. D4543-19 Standard Practices for Preparing Rock Core As Cylindrical Test Specimens and Verifying Conformance to Dimensional and Shape Tolerances; ASTM International: West Conshohocken, PA, USA, 2019. [Google Scholar]
  51. ASTM International. D7012-14e1 Standard Test Methods for Compressive Strength and Elastic Moduli of Intact Rock Core Specimens Under Varying States of Stress and Temperatures; ASTM International: West Conshohocken, PA, USA, 2014. [Google Scholar]
  52. Xiao, B.; Wang, W.; Zhang, X.; Long, G.; Fan, J.; Chen, H.; Deng, L. A novel fractal solution for permeability and Kozeny-Carman constant of fibrous porous media made up of solid particles and porous fibers. Powder Technol. 2019, 349, 92–98. [Google Scholar] [CrossRef]
  53. Liang, M.; Fu, G.; Xiao, B.; Luo, L.; Wang, Z. A fractal study for the effective electrolyte diffusion through charged porous media. Int. J. Heat Mass Transf. 2019, 137, 365–371. [Google Scholar] [CrossRef]
  54. Bertei, A.; Nicolella, C. A comparative study and an extended theory of percolation for random packings of rigid spheres. Powder Technol. 2011, 213, 100–108. [Google Scholar] [CrossRef]
  55. Gregorski, S. High Green Density Metal Parts by Vibrational Compaction of Dry Powder in the Three-Dimensional Printing Process. Ph.D. Thesis, Massachusetts Institute of Technology MIT, Cambridge, MA, USA, 1996. [Google Scholar]
  56. Real, D.; Orzan, L.; Leonardi, D.; Salomon, C. Improving the dissolution of triclabendazole from stable crystalline solid dispersions formulated for oral delivery. AAPS PharmSciTech 2020, 21, 16. [Google Scholar] [CrossRef] [PubMed]
  57. Song, R.; Liu, J.; Yang, C.; Sun, S. Study on the multiphase heat and mass transfer mechanism in the dissociation of methane hydrate in reconstructed real-shape porous sediments. Energy 2022, 254, 124421. [Google Scholar] [CrossRef]
  58. Wang, Y.; Song, R.; Liu, J.; Qin, M.; Zheng, Z.; Qin, Y. Comprehensive investigation of the petrophysical and two-phase flow properties of the tight sandstone in Yanchang formation, Ordos Basin, China insights from computed tomography imaging and pore scale modelling. Lithosphere 2022, 12, 8766247. [Google Scholar] [CrossRef]
Figure 1. Schematic of the internal structure (a) and the main printing procedure (b) of the VX-2000 3D printer (the black arrows show the working orientation of different components).
Energies 15 07641 g001
Figure 2. Silica sand used in this study with different grain sizes (a) coarse; (b) fine.
Energies 15 07641 g002
Figure 3. 3DP rock specimens of different sizes (The large cores and small cores are used for mechanical testing and microscopic structure characterization, respectively).
Energies 15 07641 g003
Figure 4. ETM105D universal material testing system.
Energies 15 07641 g004
Figure 5. The fitting curve between the bulk volume of the chamber and equilibrium pressure.
Energies 15 07641 g005
Figure 6. Sample preparation for SEM and CT scanning.
Energies 15 07641 g006
Figure 7. Comparison of porosity and density of the 3DP rocks printed with different blends of sand mixtures.
Energies 15 07641 g007
Figure 8. Comparison of porosity and density of the 3DP rocks printed with different LTs.
Energies 15 07641 g008
Figure 9. Stress–strain curves of the 3DP rock analogs printed with different blends of sand mixtures.
Energies 15 07641 g009
Figure 10. Pictures and re-drawn schematic of the failure pattern of the 3DP rock analogs printed with different blends of sand mixtures.
Energies 15 07641 g010
Figure 11. Stress–strain curves of the 3DP rock analogs printed with different LTs: (a) 200 μm, (b) 300 μm, (c) 400 μm.
Energies 15 07641 g011
Figure 12. Comparison of stress–strain curves and failure patterns of the 3DP rocks printed with different LTs.
Energies 15 07641 g012
Figure 13. SEM–EDS test of sand grain and binder distribution (Type I sand mixture is used as an example).
Energies 15 07641 g013
Figure 14. Binder bonding form between sand grains (a) (“binder neck” is highlighted by red dashed lines (c)) and (b) pore space extraction of the 3DP rocks (highlighted in red) (Type I sand mixture is used as an example).
Energies 15 07641 g014
Figure 15. Collage of the SEM images of the 3DP rocks printed with different blends of sand mixtures: (a) Type I, (b) Type II, (c) Type III, (d) Type IV, (e) Type V.
Energies 15 07641 g015
Figure 16. Pore structure characterization of the 3DP rocks via micro-CT imaging under large view mode (a,c) and high-resolution mode (b,d); the sand grain and pore phase are shown in gray and blue color, respectively.
Energies 15 07641 g016
Table 1. Printing schemes of 3DP rocks.
Group ISand MixtureLT/μmGroup IISand MixtureLT/μm
Type I200Type I200
Type II
Type III300
Type IV400
Type V
Note that the default settings of binder saturation, printing resolution, and orientation are the same for the two groups.
Table 2. Porosity and density of the 3DP rocks.
Rock TypeSand MixtureLT
/μm
Weight
/g
Porosity
/%
Density
/g/cm3
Group IType I200281.540.561.43
Type II272.543.241.38
Type III261.546.311.33
Type IV258.047.21.30
Type V252.549.361.27
Group IIType I200279.541.231.42
300268.4 44.561.36
400258.548.321.30
Note that the default settings of binder saturation, printing resolution, and orientation are the same for the two groups.
Table 3. Results of the UCS test on the 3DP rock analogs.
Rock TypeSand MixtureLT
/μm
Peak Strength
/MPa
Group IType I2008.53
Type II8.22
Type III7.92
Type IV7.45
Type V6.52
Group IIType I2008.49
3006.12
4002.82
Publisher’s Note: MDPI stays neutral with regard to jurisdictional claims in published maps and institutional affiliations.

