Article

Performance Evaluation and Optimization of a Photovoltaic/Thermal (PV/T) System according to Climatic Conditions

1
School of Chemical Engineering, Yeungnam University, Gyeongsan 38541, Korea
2
Department of Mechanical Engineering, Dezful Branch, Islamic Azad University, Dezful 313, Iran
3
Department of Management and Engineering, University of Padua, 36100 Vicenza, Italy
4
Department of Mechanical Engineering, Jundi-Shapur University of Technology, Dezful 334-64615, Iran
5
Jundi-Shapur Research Institute, Jundi-Shapur University of Technology, Dezful 334-64615, Iran
*
Authors to whom correspondence should be addressed.
Energies 2022, 15(20), 7489; https://doi.org/10.3390/en15207489
Submission received: 7 September 2022 / Revised: 2 October 2022 / Accepted: 6 October 2022 / Published: 12 October 2022

Abstract

:
Population and economic growth, industrial activities, development of technology, and depletion of fossil fuels have all led to increasing energy demand. As a result, there is an increasing ambition towards implementation of sustainable energy sources. In this study, first, a review of the literature is conducted to learn about various methods and objectives for optimization of photovoltaic and thermal (PV/T) systems. Then, a case study is considered, and the seasonal and hourly solar radiation are studied. Further, two methods of multiobjective evolutionary algorithm based on decomposition (MOEA/D) and multiobjective particle swarm optimization (MOPSO) are compared. On this basis, the energy and exergy efficiencies are analyzed for a proposed PV/T system. The outcomes are validated by taking into account the previous studies, and a sufficient agreement is found indicating the validity and accuracy of the results. It is also found that the efficiency rates for both energy and exergy soar with a rise in the ambient temperature. Additionally, a growth in the warm water flow rate from 0.4 to 1 kg/s increases the exergy efficiency by 0.6%. It is concluded that the MOEA/D method outperforms the MOPSO in terms of the optimization of the proposed PV/T system.

1. Introduction

Today, political and economic crises, limited fossil fuel resources, high energy price, population growth, and consumption growth have all stimulated planners to think of more efficient alternatives for traditional power sources. Sustainable energy is clean and cost-effective. An efficient renewable energy source is solar power. Two forms of solar energy systems can be utilized, i.e., thermal systems and PV systems. The former converts sunlight into heat while the latter converts sunlight into electricity power. Typically, such systems are utilized in a separate manner. However, in a photovoltaic/thermal (PV/T) setup, both electricity and heat can practically be harnessed. Therefore, these systems have higher energy and exergy efficiencies compared with PV modules and solar thermal systems, and this has been confirmed by many scholars.
The integration possibility of solar energy has been grounds for many studies to undertake optimization of exergy and energy. Exergy analysis, according to the second rule of thermodynamics, is a fundamental process in order to study the power systems. In addition, it explains thermodynamically ineffective and unsuitable processes. Exergy has recently become a cornerstone to achieve a better insight into the processes, inefficient resource quantities, and quality detection of energy consumption [1,2].
Large-scale building-integrated photovoltaic/thermal (BIPV/T) systems incorporating façade as well as roof can be developed in EnergyPlus and TRNSYS. Vuong et al. [3] concluded that what make the outcome between EnergyPlus and TRNSYS different are model calculations regarding weather data, sky temperature, and electricity. In order to meet annual demand and decrease energy consumption in buildings, Xu et al. [4] introduced a novel BIPV/T system. During the summer, the system offers passive cooling with efficiency of 7.6%, whilst in winter it offers heating with efficiency of 12.5%. In order to enhance the heat transfer between photovoltaic modules and flowing air, a novel BIPV/T system was proposed by Yang and Athienitis [5]. It was shown that the thermal efficiency is, respectively, 5% and 7.6% more by considering two inlets, rather than one, and utilizing semitransparent, compared to opaque, PV.
There are two ways to determine the best performance point of each PV/T system; performing a lot of experiments and using intelligent computer methods. Nowadays, computer methods can direct us to discovering the best solution for each complex system rapidly and more accurately [6]. Shahsavar et al. [7] focused on several designated variables, e.g., channel depth, length, width, and the outlet air temperature of the channel in an air-based PV/T system. They used the non-dominated sorting genetic algorithm (NSGA) to optimize the system and reported the best cases. In addition, the optimal case was weighed and examined according to the experimental data, and a sufficient compatibility was shown. In another study, Cao et al. [8] studied a PV system cooled with a nanofluid. They investigated the impacts of three major variations of the nanofluid properties, solar irradiation, and the nanofluid flow rate. The adaptive neuro-fuzzy inference system (ANFIS) was utilized in order to optimize the system, and the optimum electrical efficiency of the considered system was estimated.
On the basis of the literature review analysis, a few studies in the area of optimization of PV/T systems were carried out. A novel optimization methodology for specific use in a microchannel was presented by Karathanassis et al. [9] in 2013. The model can be used for a linear parabolic trough concentrating photovoltaic system, cooled by plate-fins. The thermal resistance of the utilized plate-fins was also considered in their assessments. Khaki et al. [10] adopted the genetic algorithm (GA) to improve energy together with exergy in BIPV/T systems. As a result, higher efficiencies were observed. Vera et al. [11] proposed a mathematical model and predicted the efficiency of a BIPV/T system both mathematically and experimentally. They employed the GA to determine the best decision parameters having influence on the system’s mechanism and general operation. The following parameters were investigated: air gap, aspect ratio, collector’s length, number of collectors, fluid mass-flow rate, and storage tank capacity. Singh et al. [12] focused on using the GA incorporated with the optimization goals to enhance the overall efficiency of a PV/T system in New Delhi in India by considering the climatic factors. Sohani et al. [13] performed multiobjective optimization of a BIPV/T system incorporating the phase change material (PCM), under the climate of Tehran, capital of Iran. The optimization was performed in terms of energy, environment, and economics. As a result, the optimal thickness of the PCM for the test conditions was found to be 77.2 mm. Moreover, 17.7% lower CO2 was annually emitted in comparison to the base case, and the energy payback period of the system was discovered to be 3.3 years. Sarhaddi et al. [14] analyzed the operation of a PV/T setup. They presented a new technique to study the design parameters of a typical air-based PV/T setup. In addition, the general energy analysis of an air-based PV/T setup was performed by considering electrical, thermal, and environmental parameters. Their results indicated that the overall energy, electrical, and thermal efficiencies of the investigated system were approximately 45%, 10%, and 17.18%, respectively. In the most recent study, in 2022, Sattar et al. [15] performed an analytical model for a photovoltaic module integrated with the air flow as a coolant. The main considered parameters were cell temperature, irradiation, and mass flow rate, as well as the duct geometrical specifications. Moreover, the primary optimizing goal was to maximize the output electrical power. To achieve this objective, a multiobjective multivariable optimization was applied to the system. As result, a multipass duct with 31 passes and with the mass flow rate of 0.14 kg/s was introduced as the optimum case, resulting in the maximum electrical output power of 186.7 W.
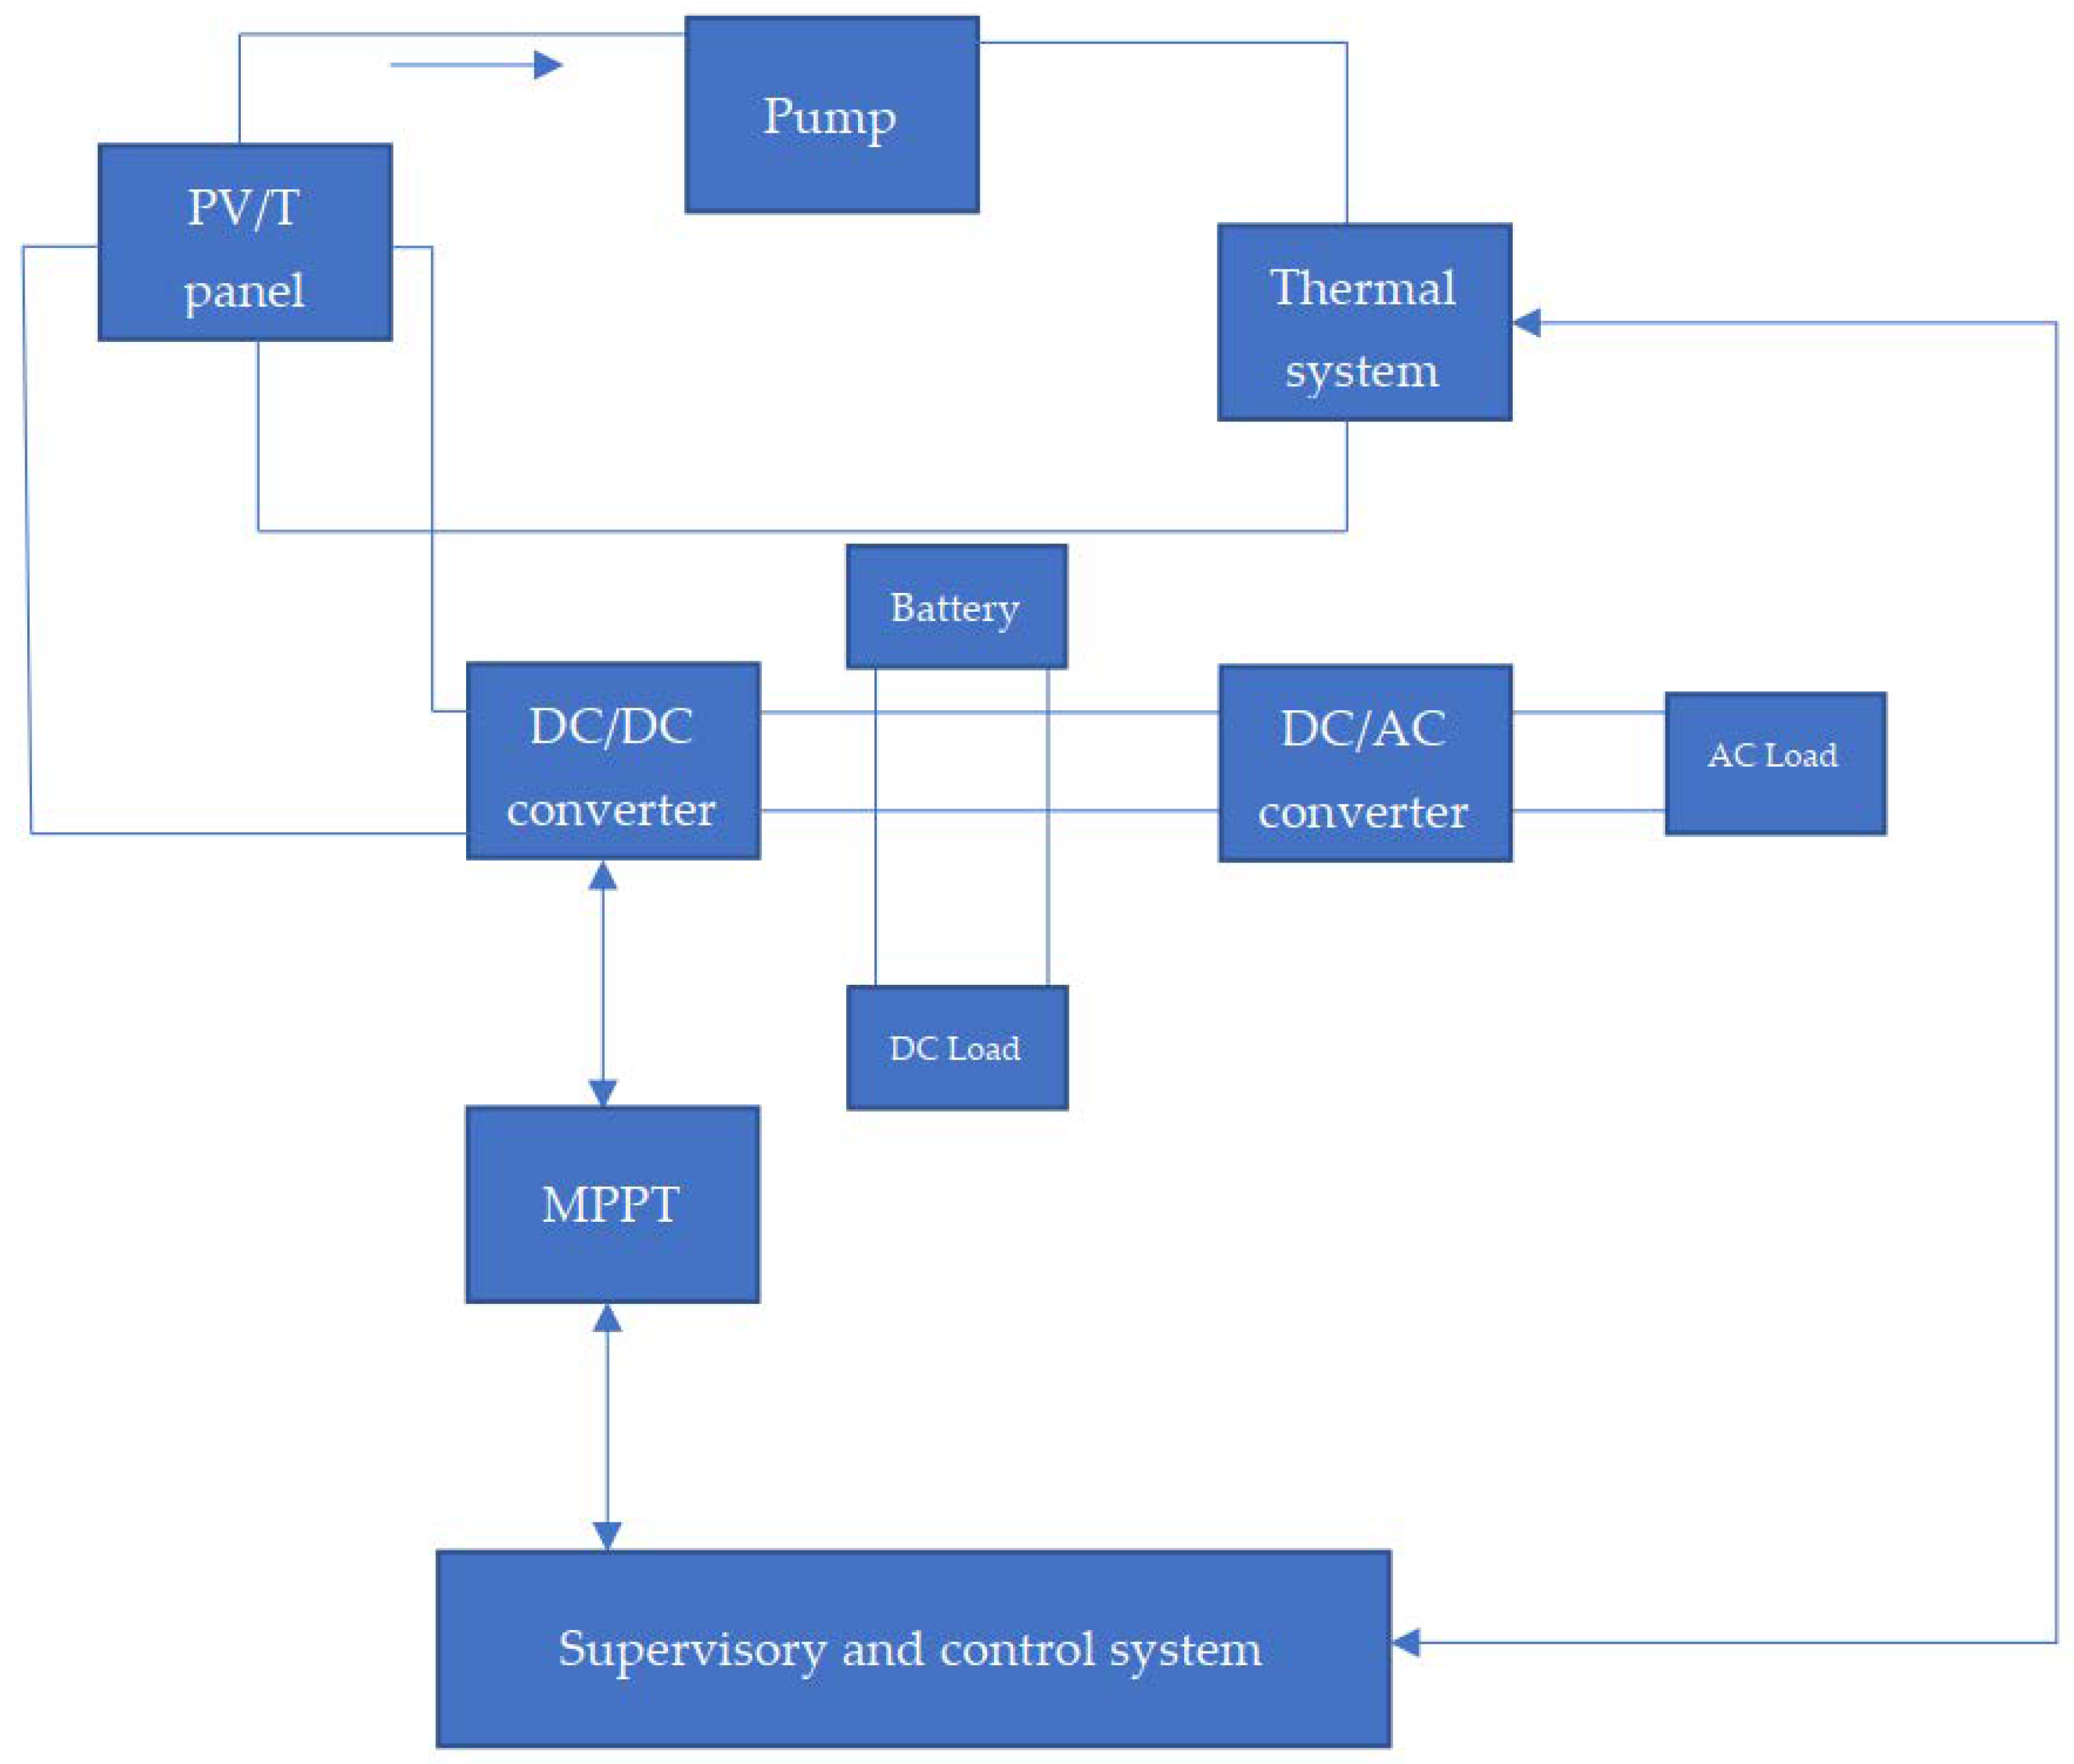
The purpose of the current research is to find the most appropriate method to optimize a PV/T system according to multiobjective optimization. Another goal is to study the performance evaluation of a proposed PV/T system by considering the climate of Ilam, Iran, as a case study. For these purposes, a new approach according to a multiobjective evolutionary algorithm based on decomposition (MOEA/D) along with multiobjective particle swarm optimization (MOPSO) is developed. The proposed method maximizes the effectiveness of a PV/T system from a novel perspective.

2. Methodology

2.1. Multiobjective Particle Swarm Optimization (MOPSO)

There are a wide variety of methods for optimization purposes. Among these methods, MOPSO is one of the most efficient techniques due to its simple implementation and adequate convergence speed. Table 1 shows the framework of the MOPSO algorithm:
Where pbest is the personal best position determined by a designated particle, and gbest is the global best position considered by the whole swarm of particles [16].

2.2. Multiobjective Evolutionary Algorithm Based on Decomposition (MOEA/D)

Decomposition has widely been utilized in mathematics for the purpose of investigating the multiobjective optimization problems (MOPs). As a matter of fact, most multiobjective evolutionary algorithms (MEAs) treat an MOP in an overall manner and primarily depend on domination for determining the solution quality during their search. Such methods are not appropriate for producing an even distribution of solution along the Pareto front. MOEA/D adopts a decomposition approach to distribute the MOP into a series of scalar optimization issues. Every individual solution in the population of MOEA/D is linked with a subprocedure or subproblem. A neighborhood association among all the subprocedures is established according to the lengths of their weight vectors. In MOEA/D, enhancement of a subprocedure utilizes the existing data of its neighboring subprocedures because two neighboring subprocedures should have the best solutions that are close to one another. Complete formulations of the algorithm are fully described in [17].

2.3. Thermal Analysis

For the purpose of thermal analysis, the following assumptions were considered:
  • The flow is steady and constant.
  • All of the components are considered adiabatic.
The energy equilibrium equations of PV/T components with thermal parameters and the thermal efficiency are written as
T c e l l = ( τ α ) e f f I s + U t o p T a m b + U T T p U t o p + U T
where T c e l l is the solar cell temperature, τ is transmissivity, α is absorptivity, I s is incident solar intensity, Utop represents the net heat transfer coefficient from the solar cell to the ambient atmosphere by considering the glass, Tamb represents the ambient air temperature, UT represents the heat transfer coefficient from solar cell to ambient through glass cover, and Tp represents the plate temperature [18].
For the purpose of estimating the thermal efficiency of the PV/T, η t h , the heat, Q, is estimated according to the following equation:
Q = m ˙ C p ( T 0 T i )
where m ˙ is the rate for the mass flow, C p is indicative of the specific heat, and T 0 and T i , are the temperatures of the fluid situated at the outlet and inlet of the heat absorbing unit.
The thermal efficiency of the PV/T system, η t h , can be defined according to Equations (3) and (4):
η t h = Q A . S r
η t h = η 0 H l ( T i T a S r )
where Q is the collected heat, A is the collector area, S r is the solar radiation, η 0 is the thermal efficiency in the occasion that | T i T a | = 0 , and H l is the heat loss factor [19].

2.4. Electrical Efficiency

The electrical efficiency, η e , can be calculated according to Equations (5) and (6):
P m a x = V o c × I s c × F F
η e = P m a x A . S r
where P m a x is the highest level of electrical power, V o c is the open-circuit voltage, I s c is the short-circuit current, and FF is the fill factor [19].

2.5. Overall Energy Efficiency

The overall energy efficiency, η o , is defined as the sum of thermal and electrical efficiecies [19]:
η o = η t h + η e

2.6. Exergy Analysis

Exergy, which is indicative of the second rule of thermodynamics, is expressed as the highest effective activity that is hypothetically accessible from a thermodynamic system. Hence, the exergy efficiency of a PV/T collector is explained according to the allocation of this highest theoretically accessible output that can be considered as an actual intended output. Further to the electrical and thermal efficiencies, the exergy efficiency is also calculated, as this definitely leads to a more realistic indication of the system’s operation. The exergy efficiency of a PV/T system is defined as follows:
  E ˙ x o u t =   E ˙ x t h e r m a l +   E ˙ x e l e c t r i c a l
where E ˙ x o u t , E ˙ x t h e r m a l , and E ˙ x e l e c t r i c a l are the total output exergy rate, thermal, and electrical exergy, in the order given.
  E ˙ x i n = A × S R × [ 1 4 3 × ( T a T s ) + 1 3 × ( T a T s ) 4 ]
where E ˙ x i n is the total input exergy rate, and T a and T s are ambient and surface temperatures in °C.
  E ˙ x t h e r m a l = Q ˙ u [ 1 T a + 273 T o u t + 273 ]
  E ˙ x e l e c t r i c a l = I m p × V m p
η e x =   E ˙ x o u t   E ˙ x i n
where Q ˙ u is the rate of practical and effective heat absorbed by the module, I m p is the maximum current of the panel, V m p is the maximum voltage of the panel, and η e x is the PV/T collector exergy efficiency [20].

2.7. Schematic of the Proposed System

The illustration of the proposed PV/T system is explained according to Figure 1. In this system, the thermal output of the PV/T panel is linked with the thermal system, which produces hot water. The system’s fluid is flowed and moved round by a pump.

2.8. Analysis of the Sunlight Data

The sunlight per square meter, which is the most important parameter of a photovoltaic module, should be estimated to specify the power as well as heat generated by the solar panel. Figure 2 shows the sunlight data estimated according to [21] for all hours and seasons.

3. Results and Discussion

This study discusses the thermodynamic analysis of a PV/T system according to the first and second rules of thermodynamics. The proposed system’s outcomes are evaluated according to different design conditions.
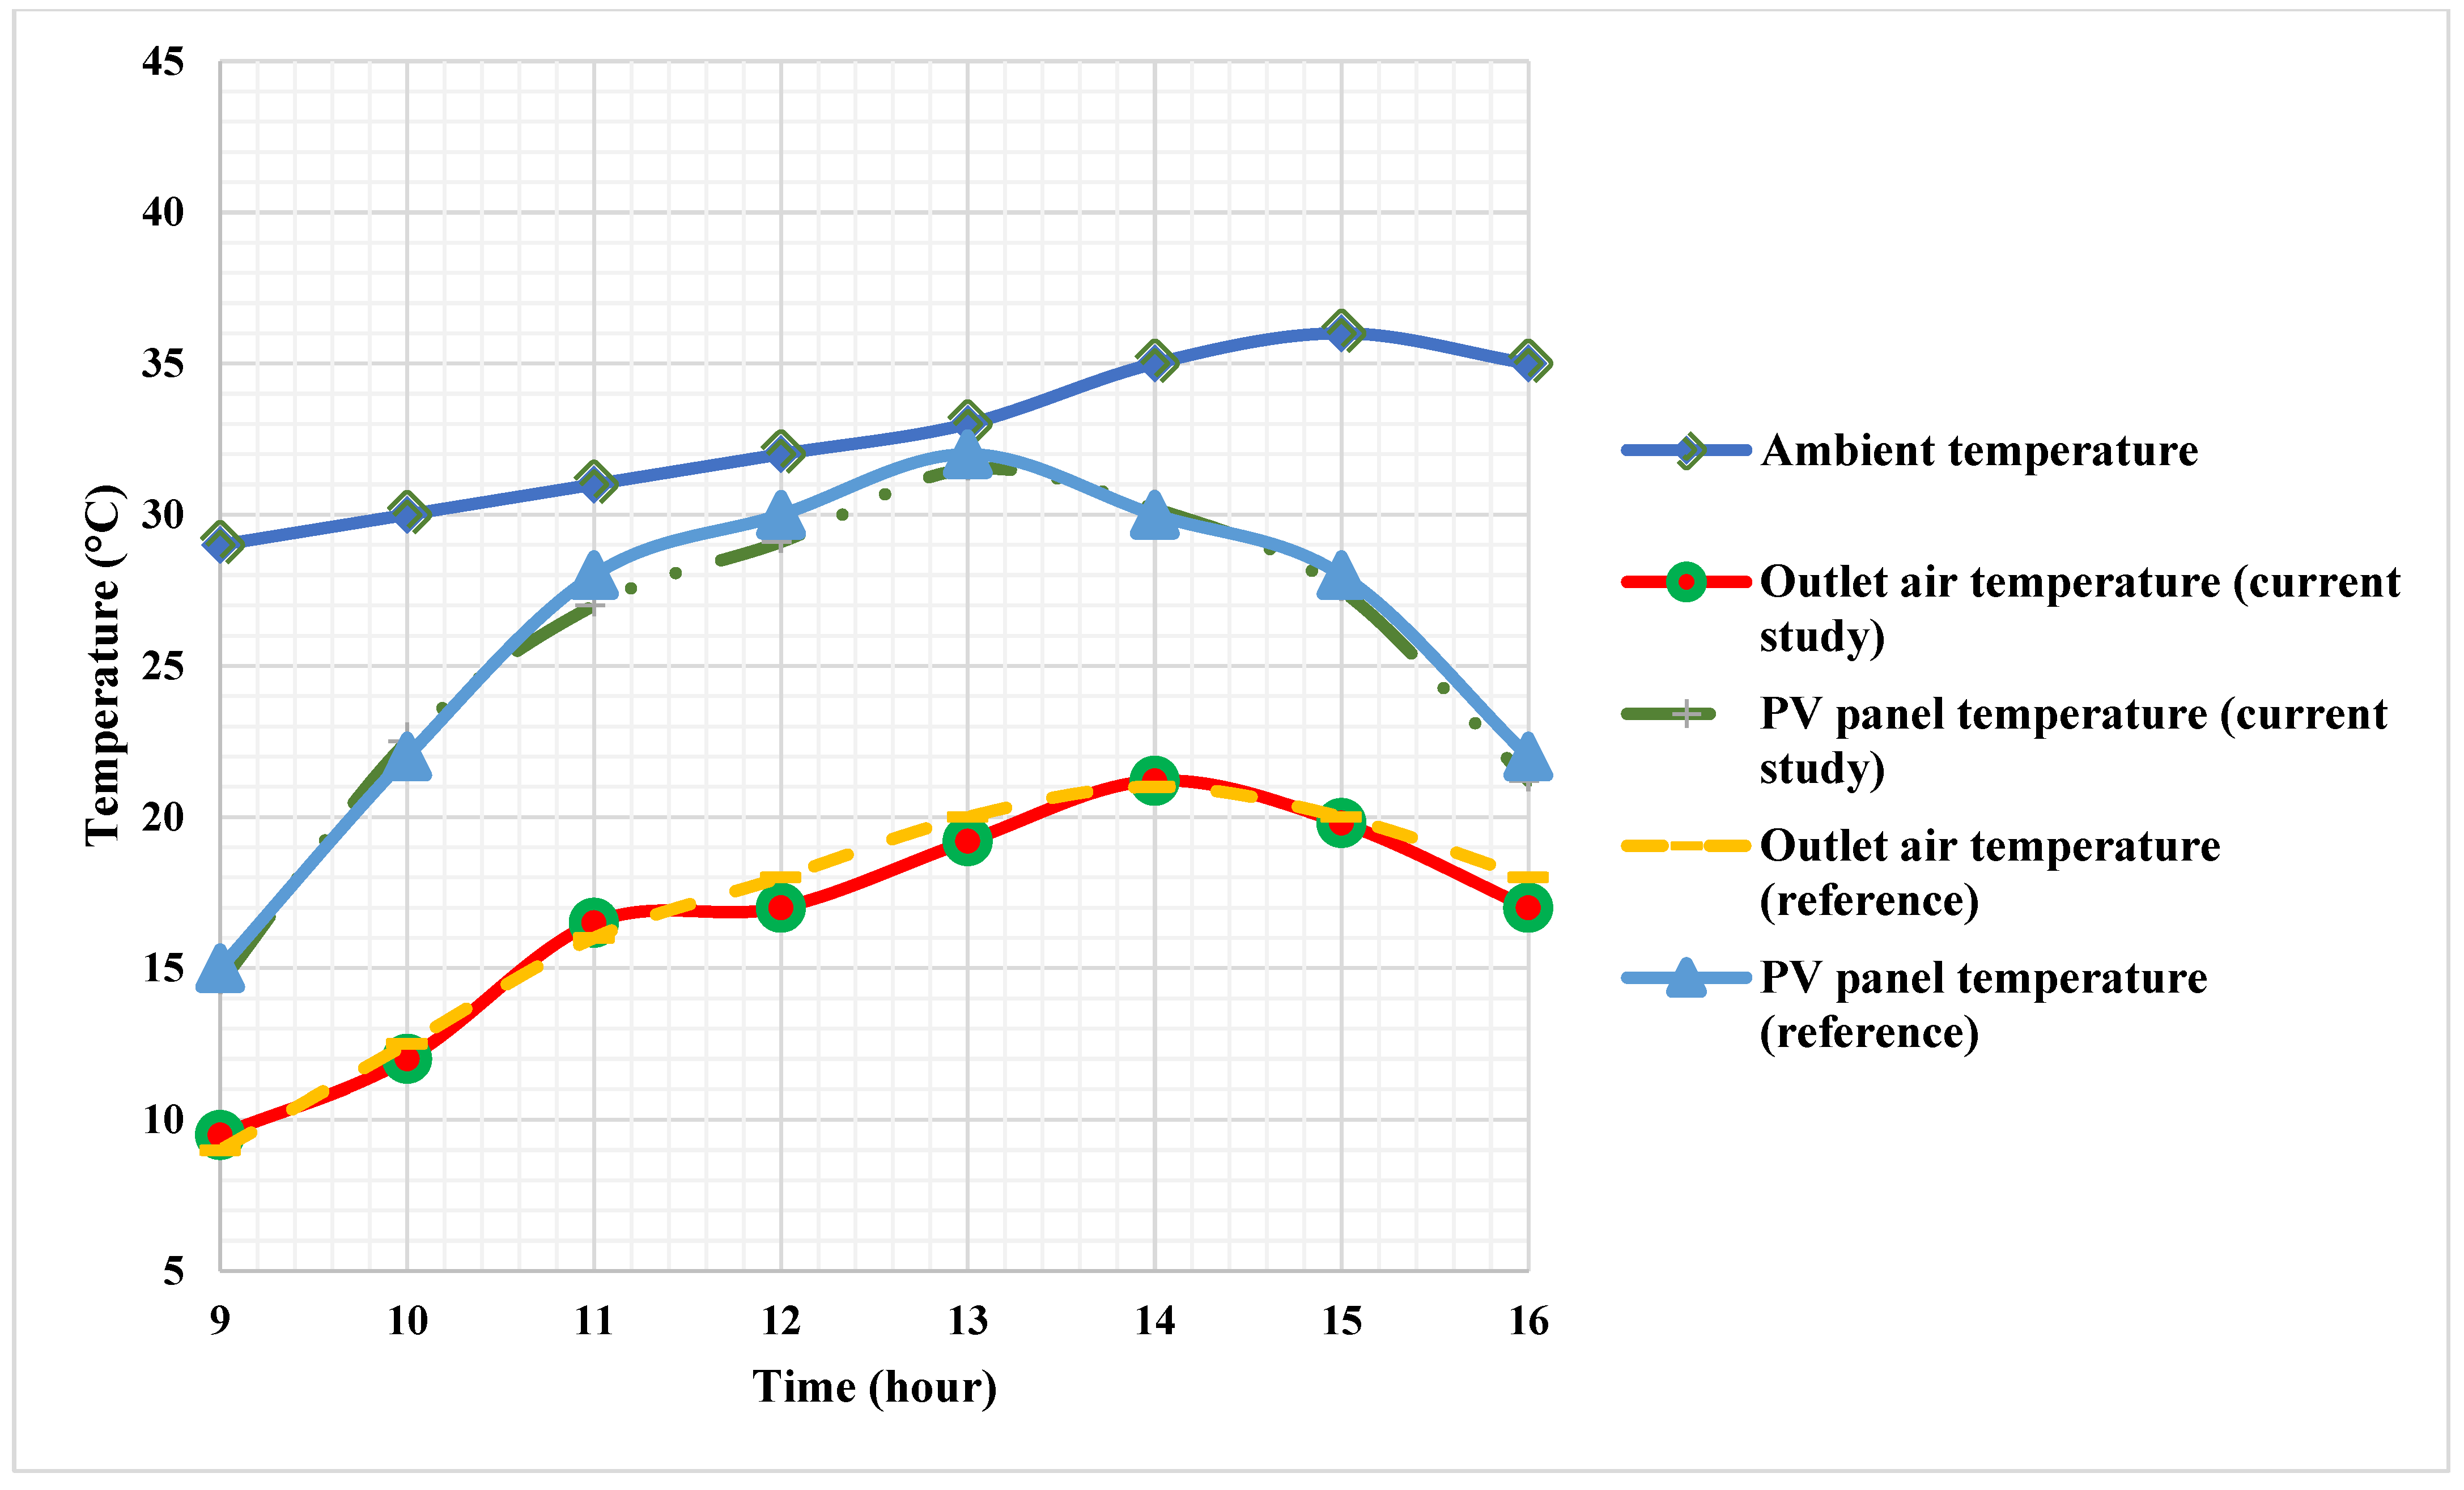
To validate the proposed mathematical model, the photovoltaic module temperature and output air temperature were examined according to the data of Ref. [10], as shown in Figure 3. Clearly, it is inferred that the outcomes of this study and those of [10] are in good agreement. Hence, the validity of the presented approach is shown. The model can therefore be used to simulate, optimize, and analyze the electrical and thermal aspects of the proposed PV/T system. Table 2 shows the calculated errors. The lower the error rate, the more precise the results are.
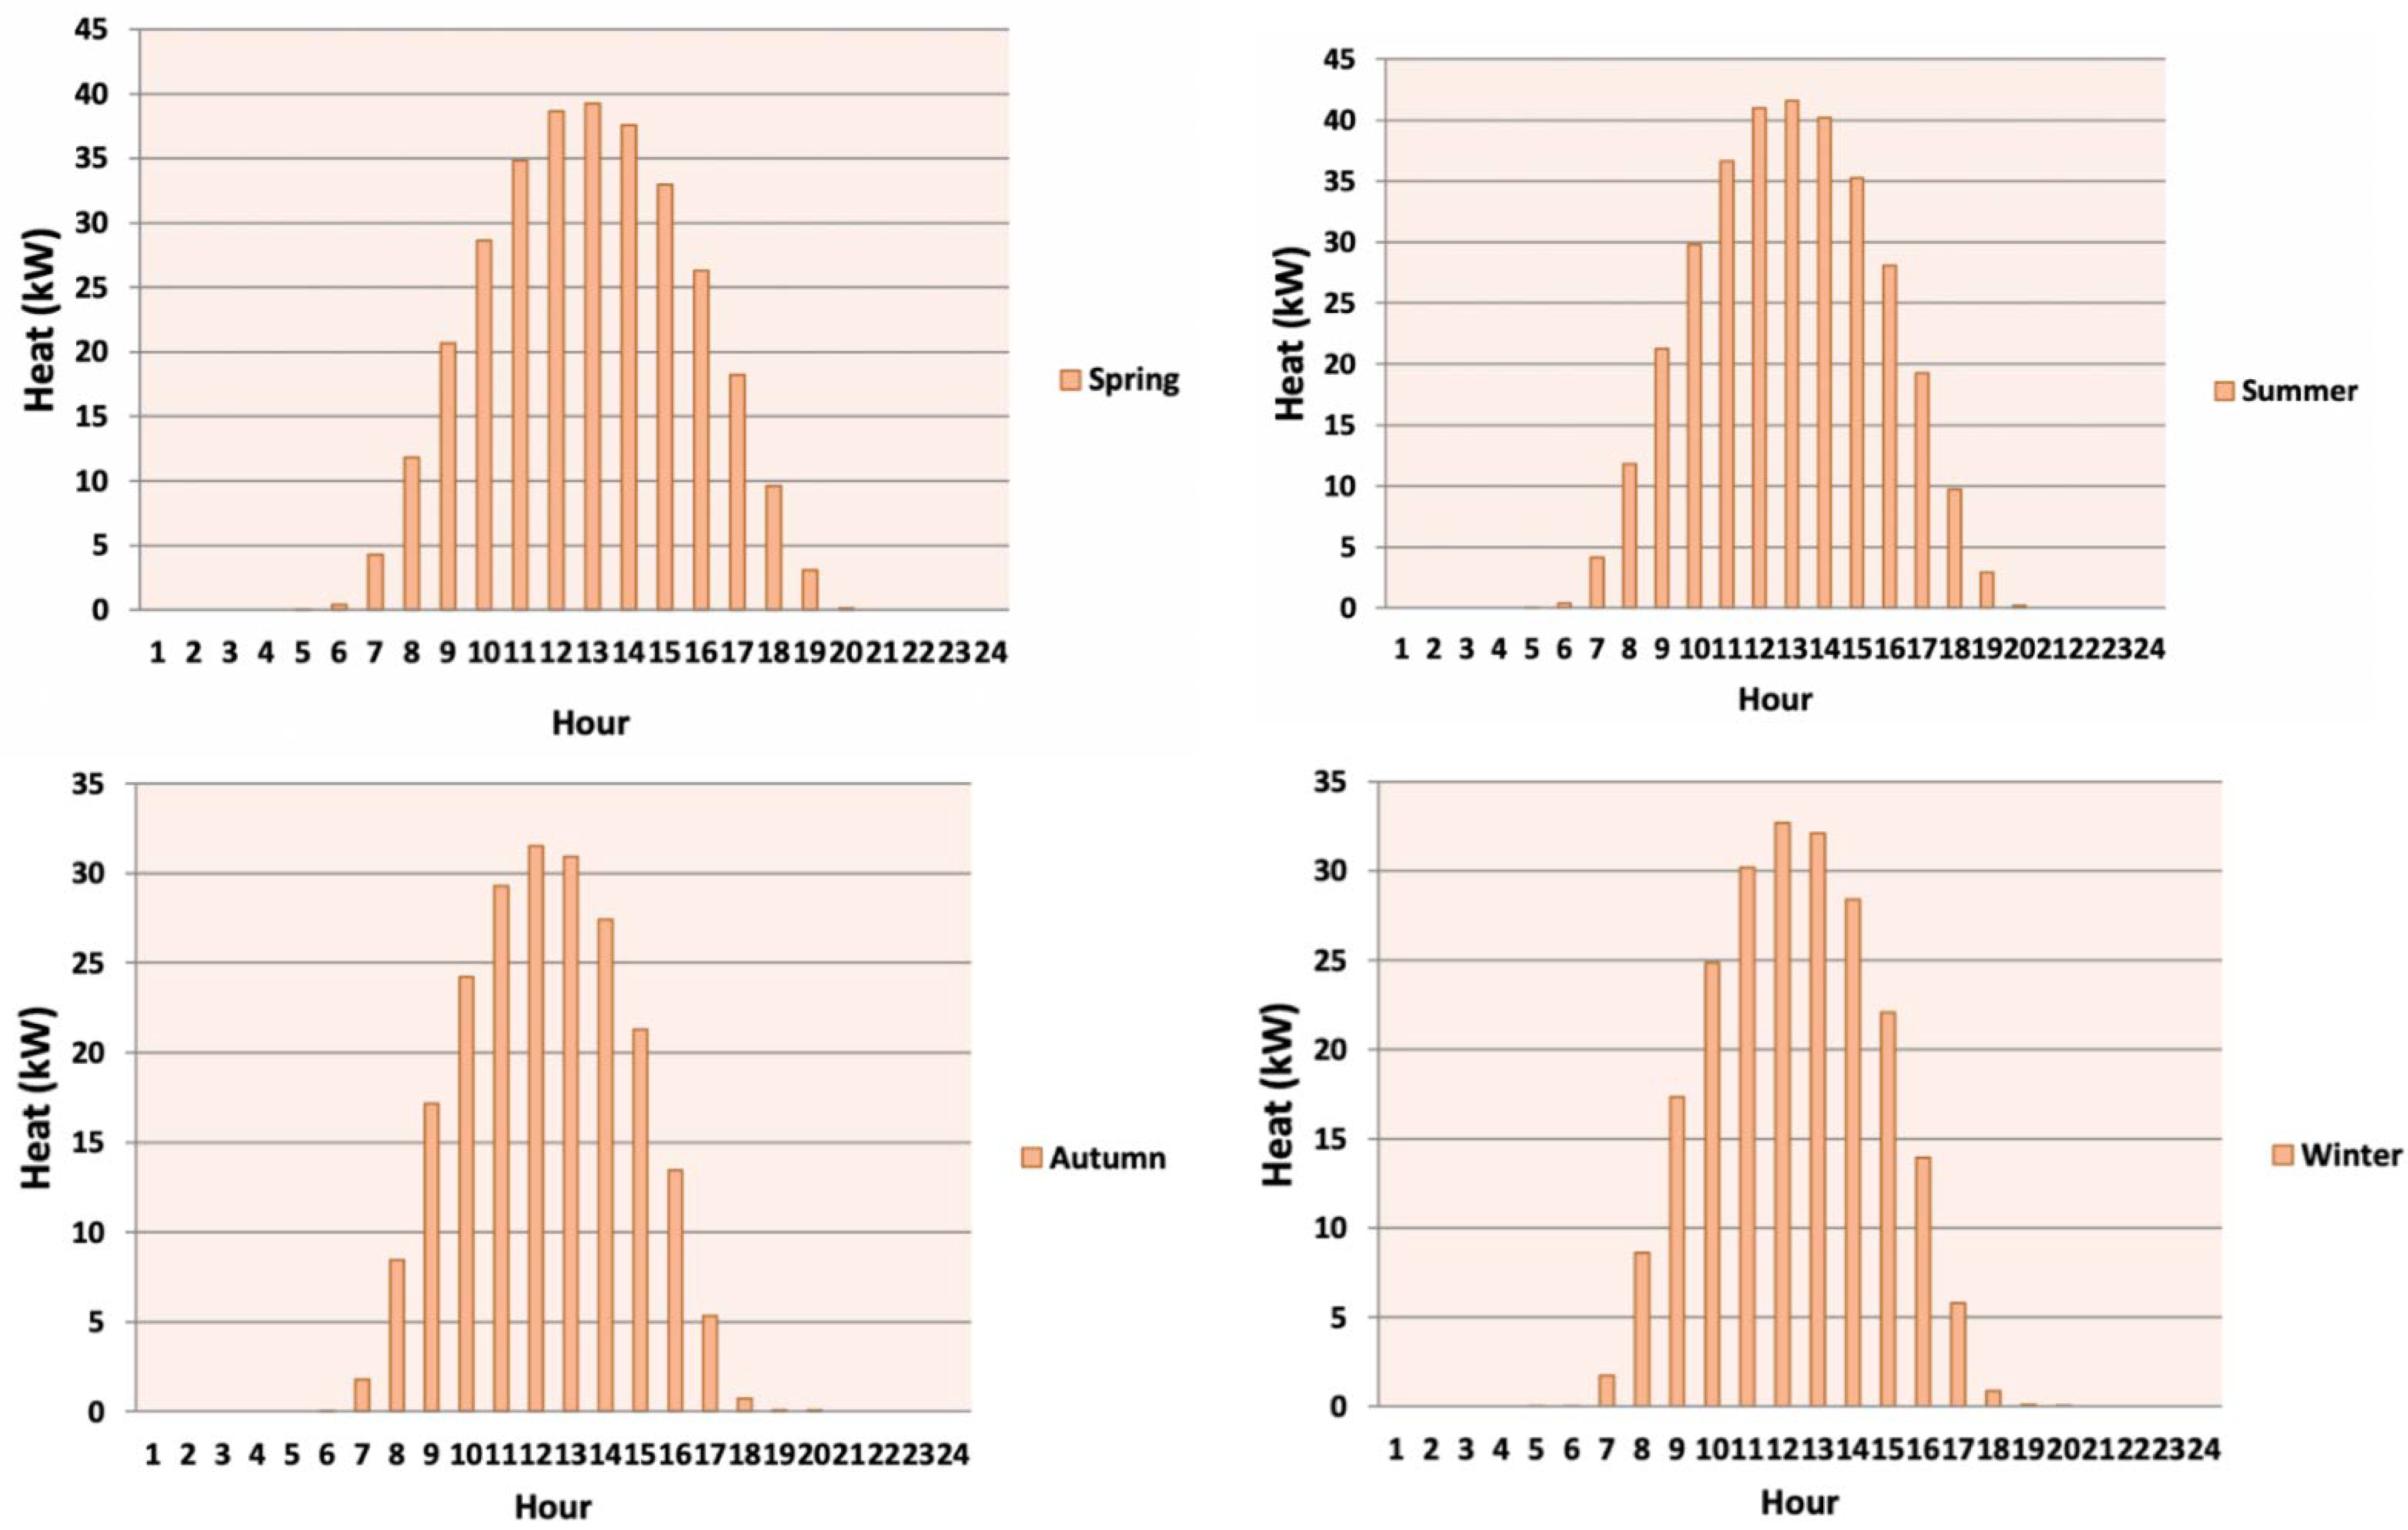
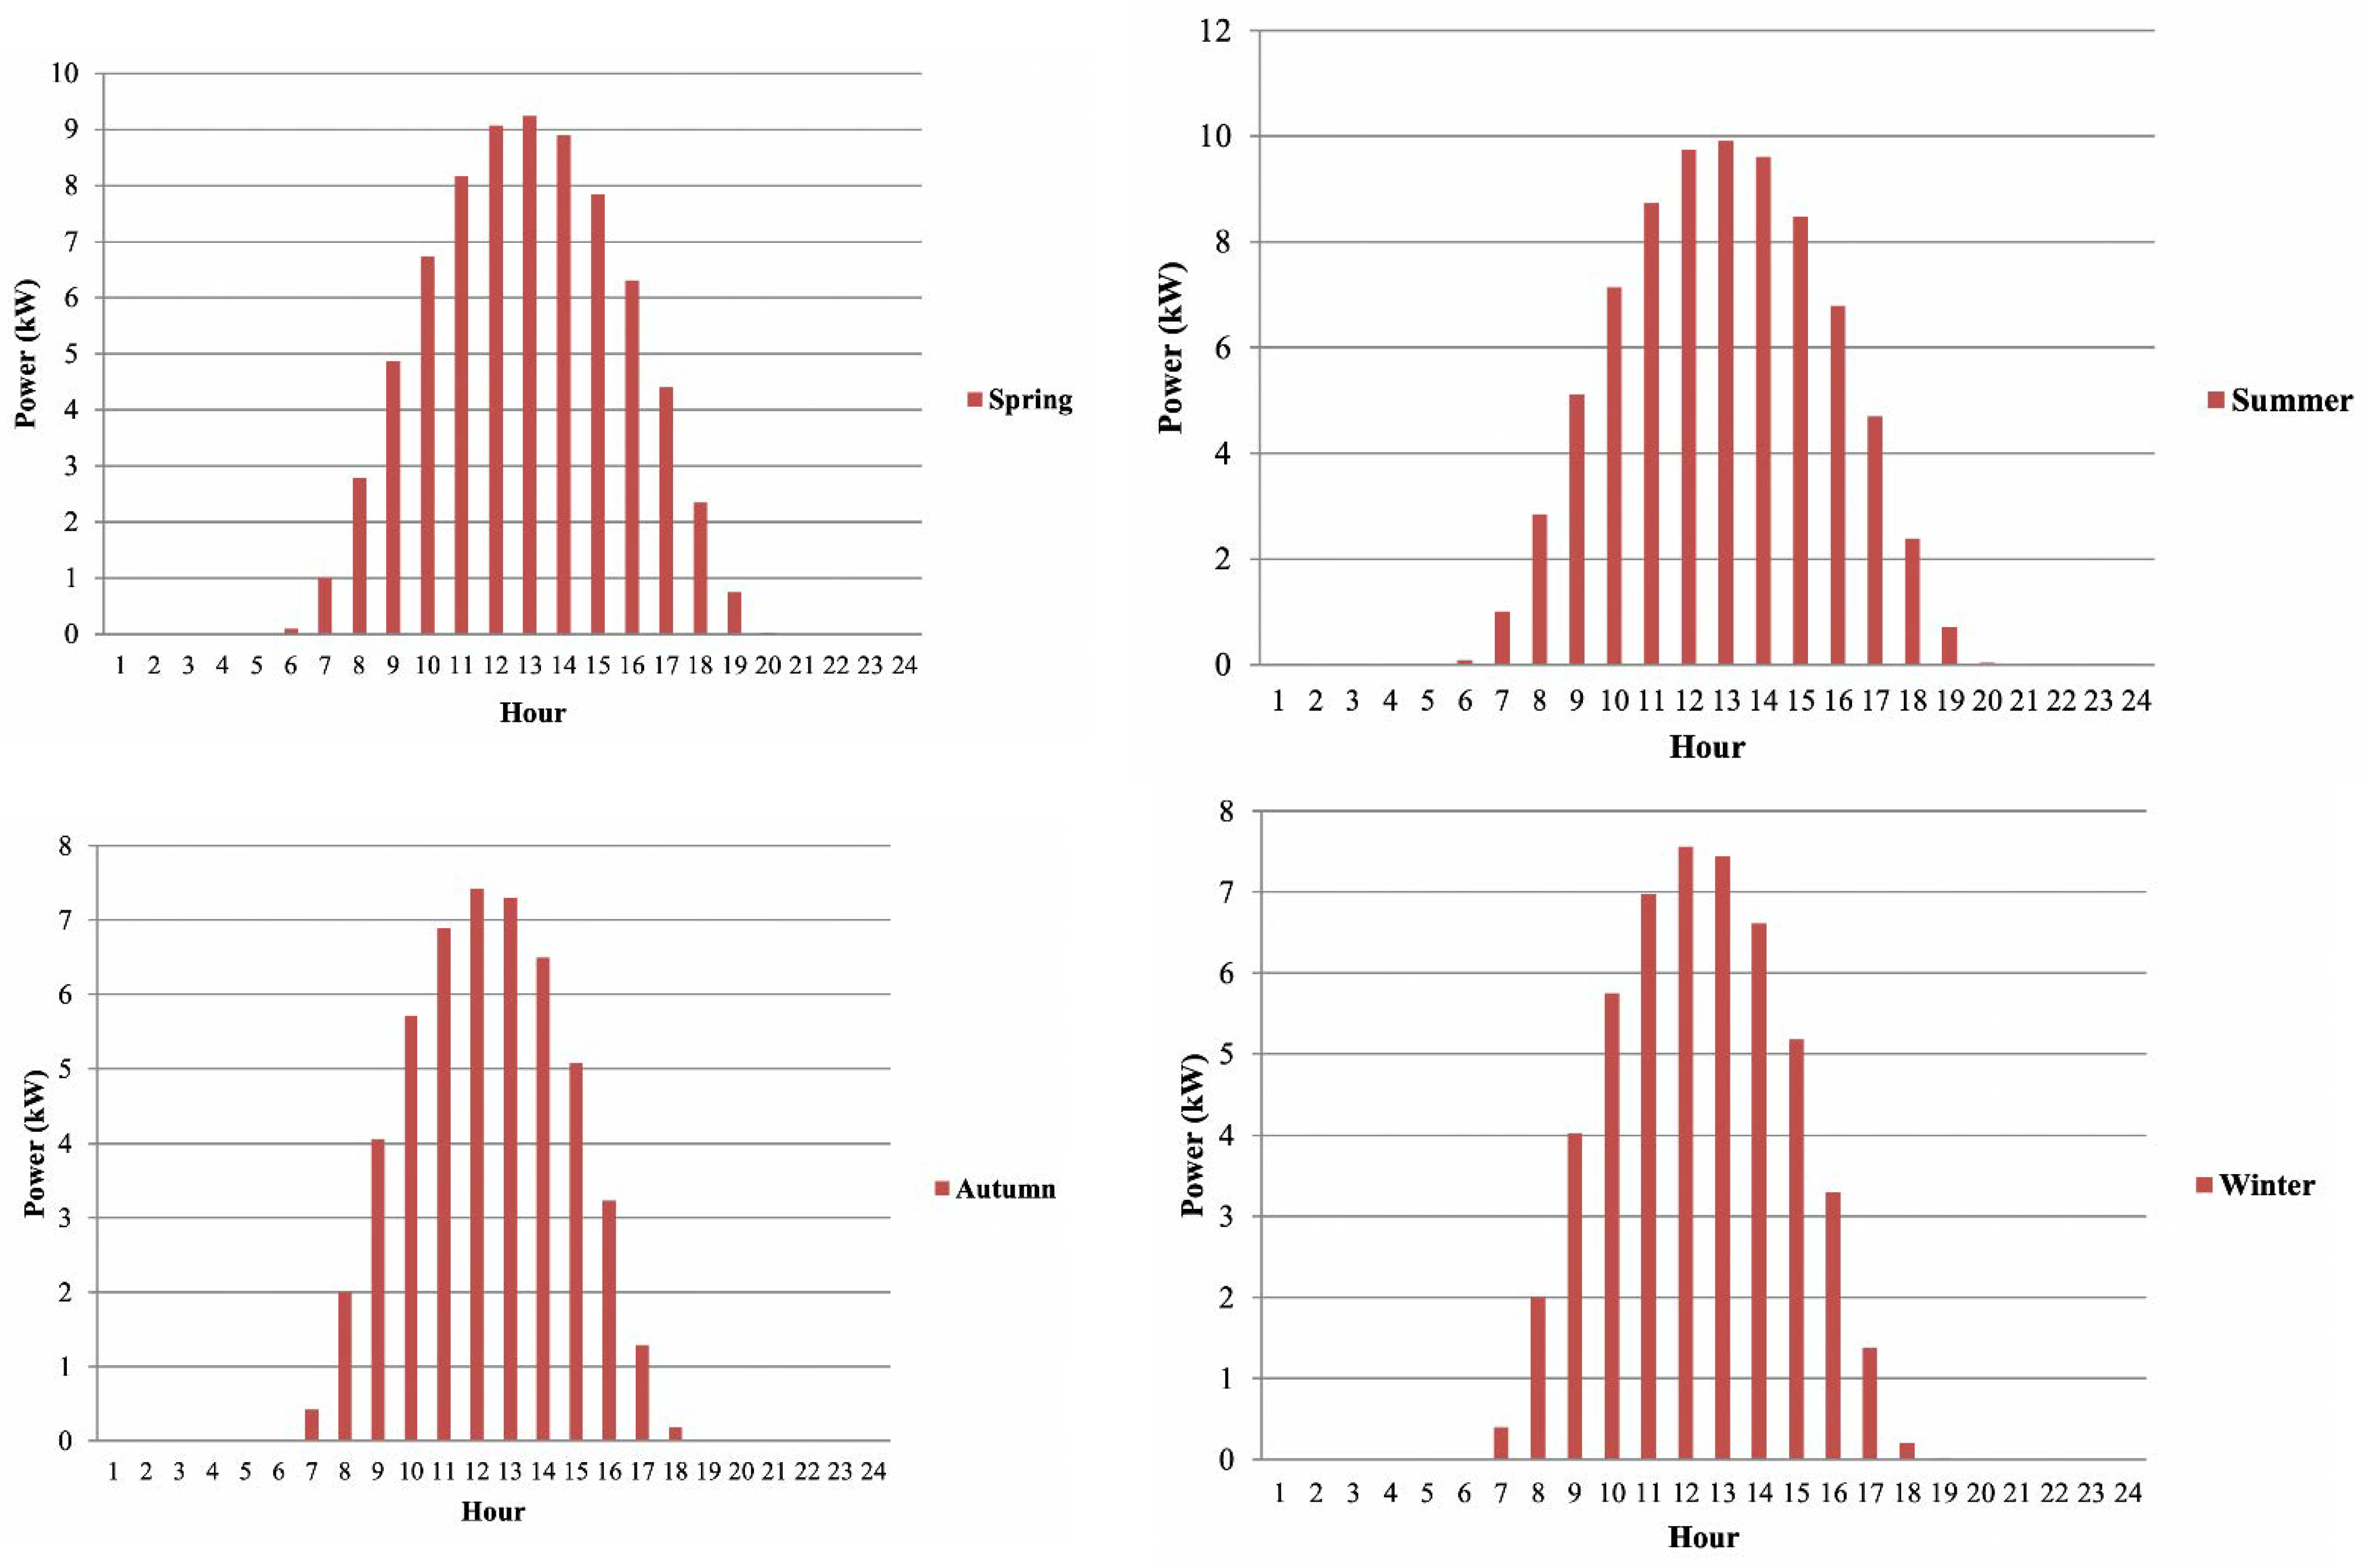
Figure 4 depicts the heat generation of the photovoltaic system for different hours and different seasons. As can be seen, the solar panels generated more heat during sunny hours.
Figure 5 illustrates the proposed system’s power generation. According to Figure 5, power generation increased as sunlight enhanced during the day, when the PV/T system was in operation. Additionally, power and heat generation decreased as sunlight declined in cold seasons. The generation of no power at night was another result. Given that a large portion of power is consumed by buildings and the peak power consumption time is 16:00–22:00, a support or storage system should be employed at nights.
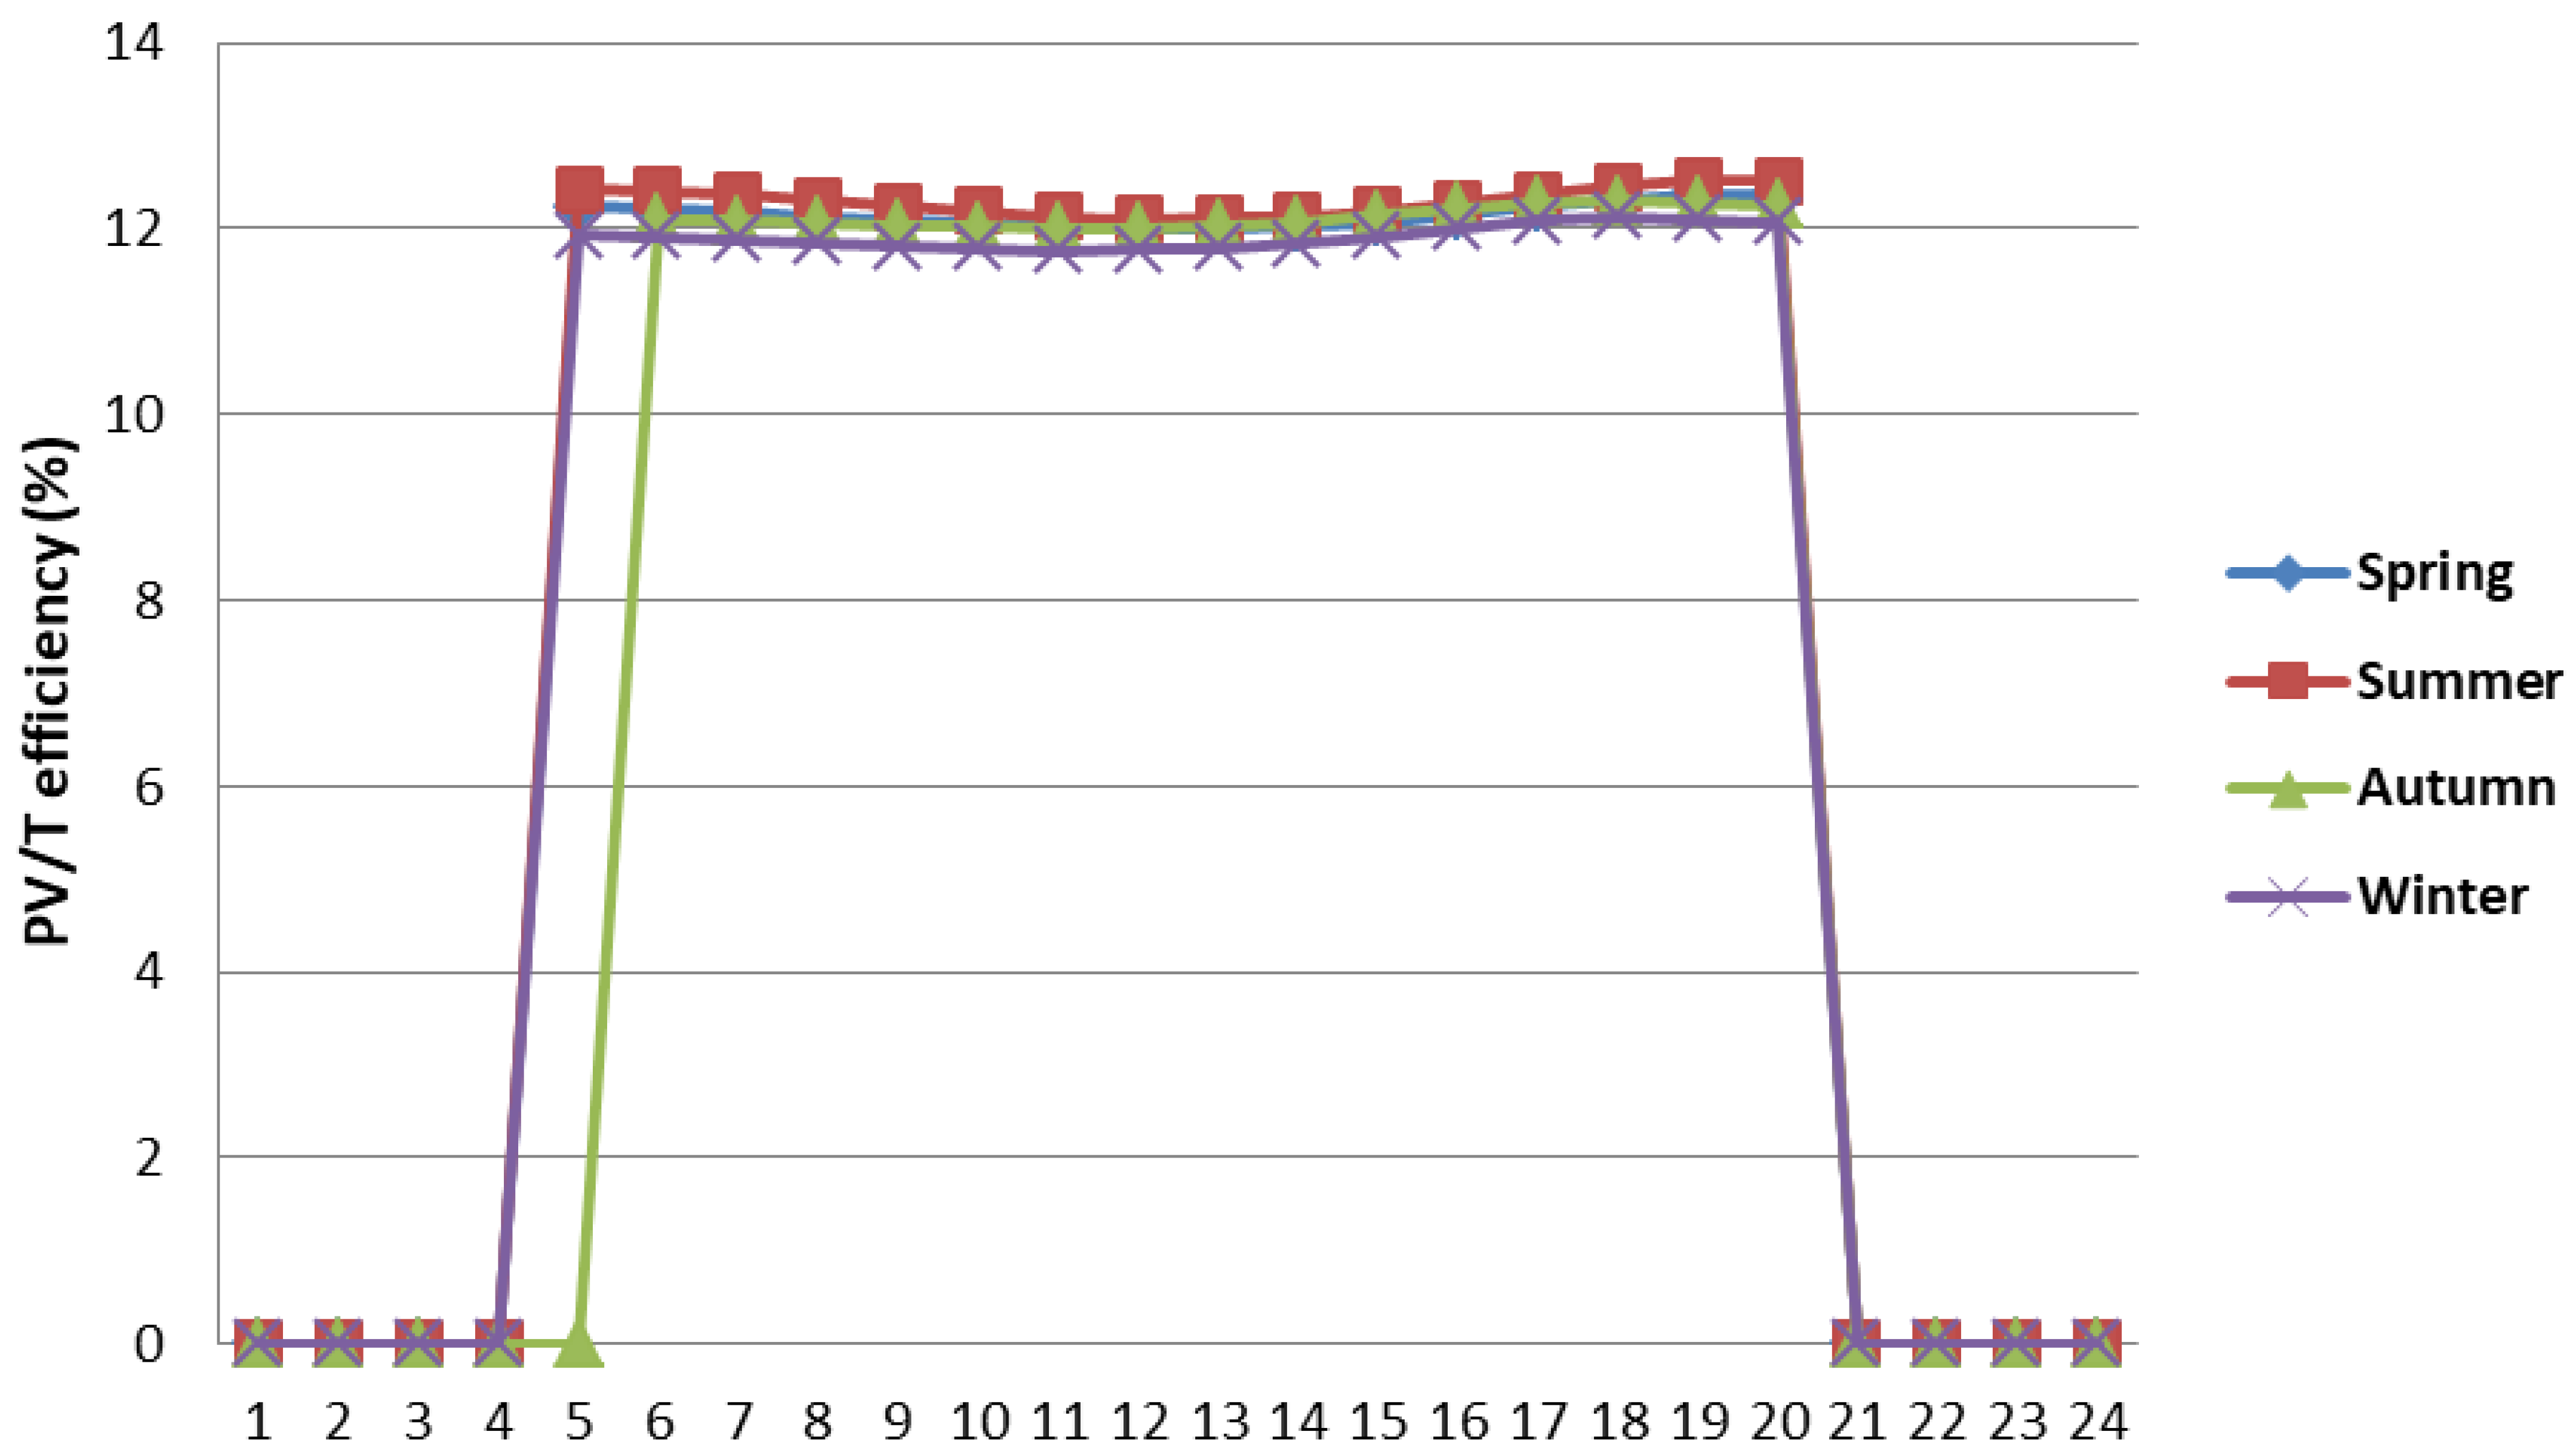
The electrical efficiency of the PV/T system at different hours and in different seasons is depicted in Figure 6. A solar panel’s efficiency is dependent on environmental conditions, including sunlight, and the panel type. As expected, the electrical efficiency is zero when there is no sunlight, and it slightly changes in the remaining hours due to the sunlight and its angle.
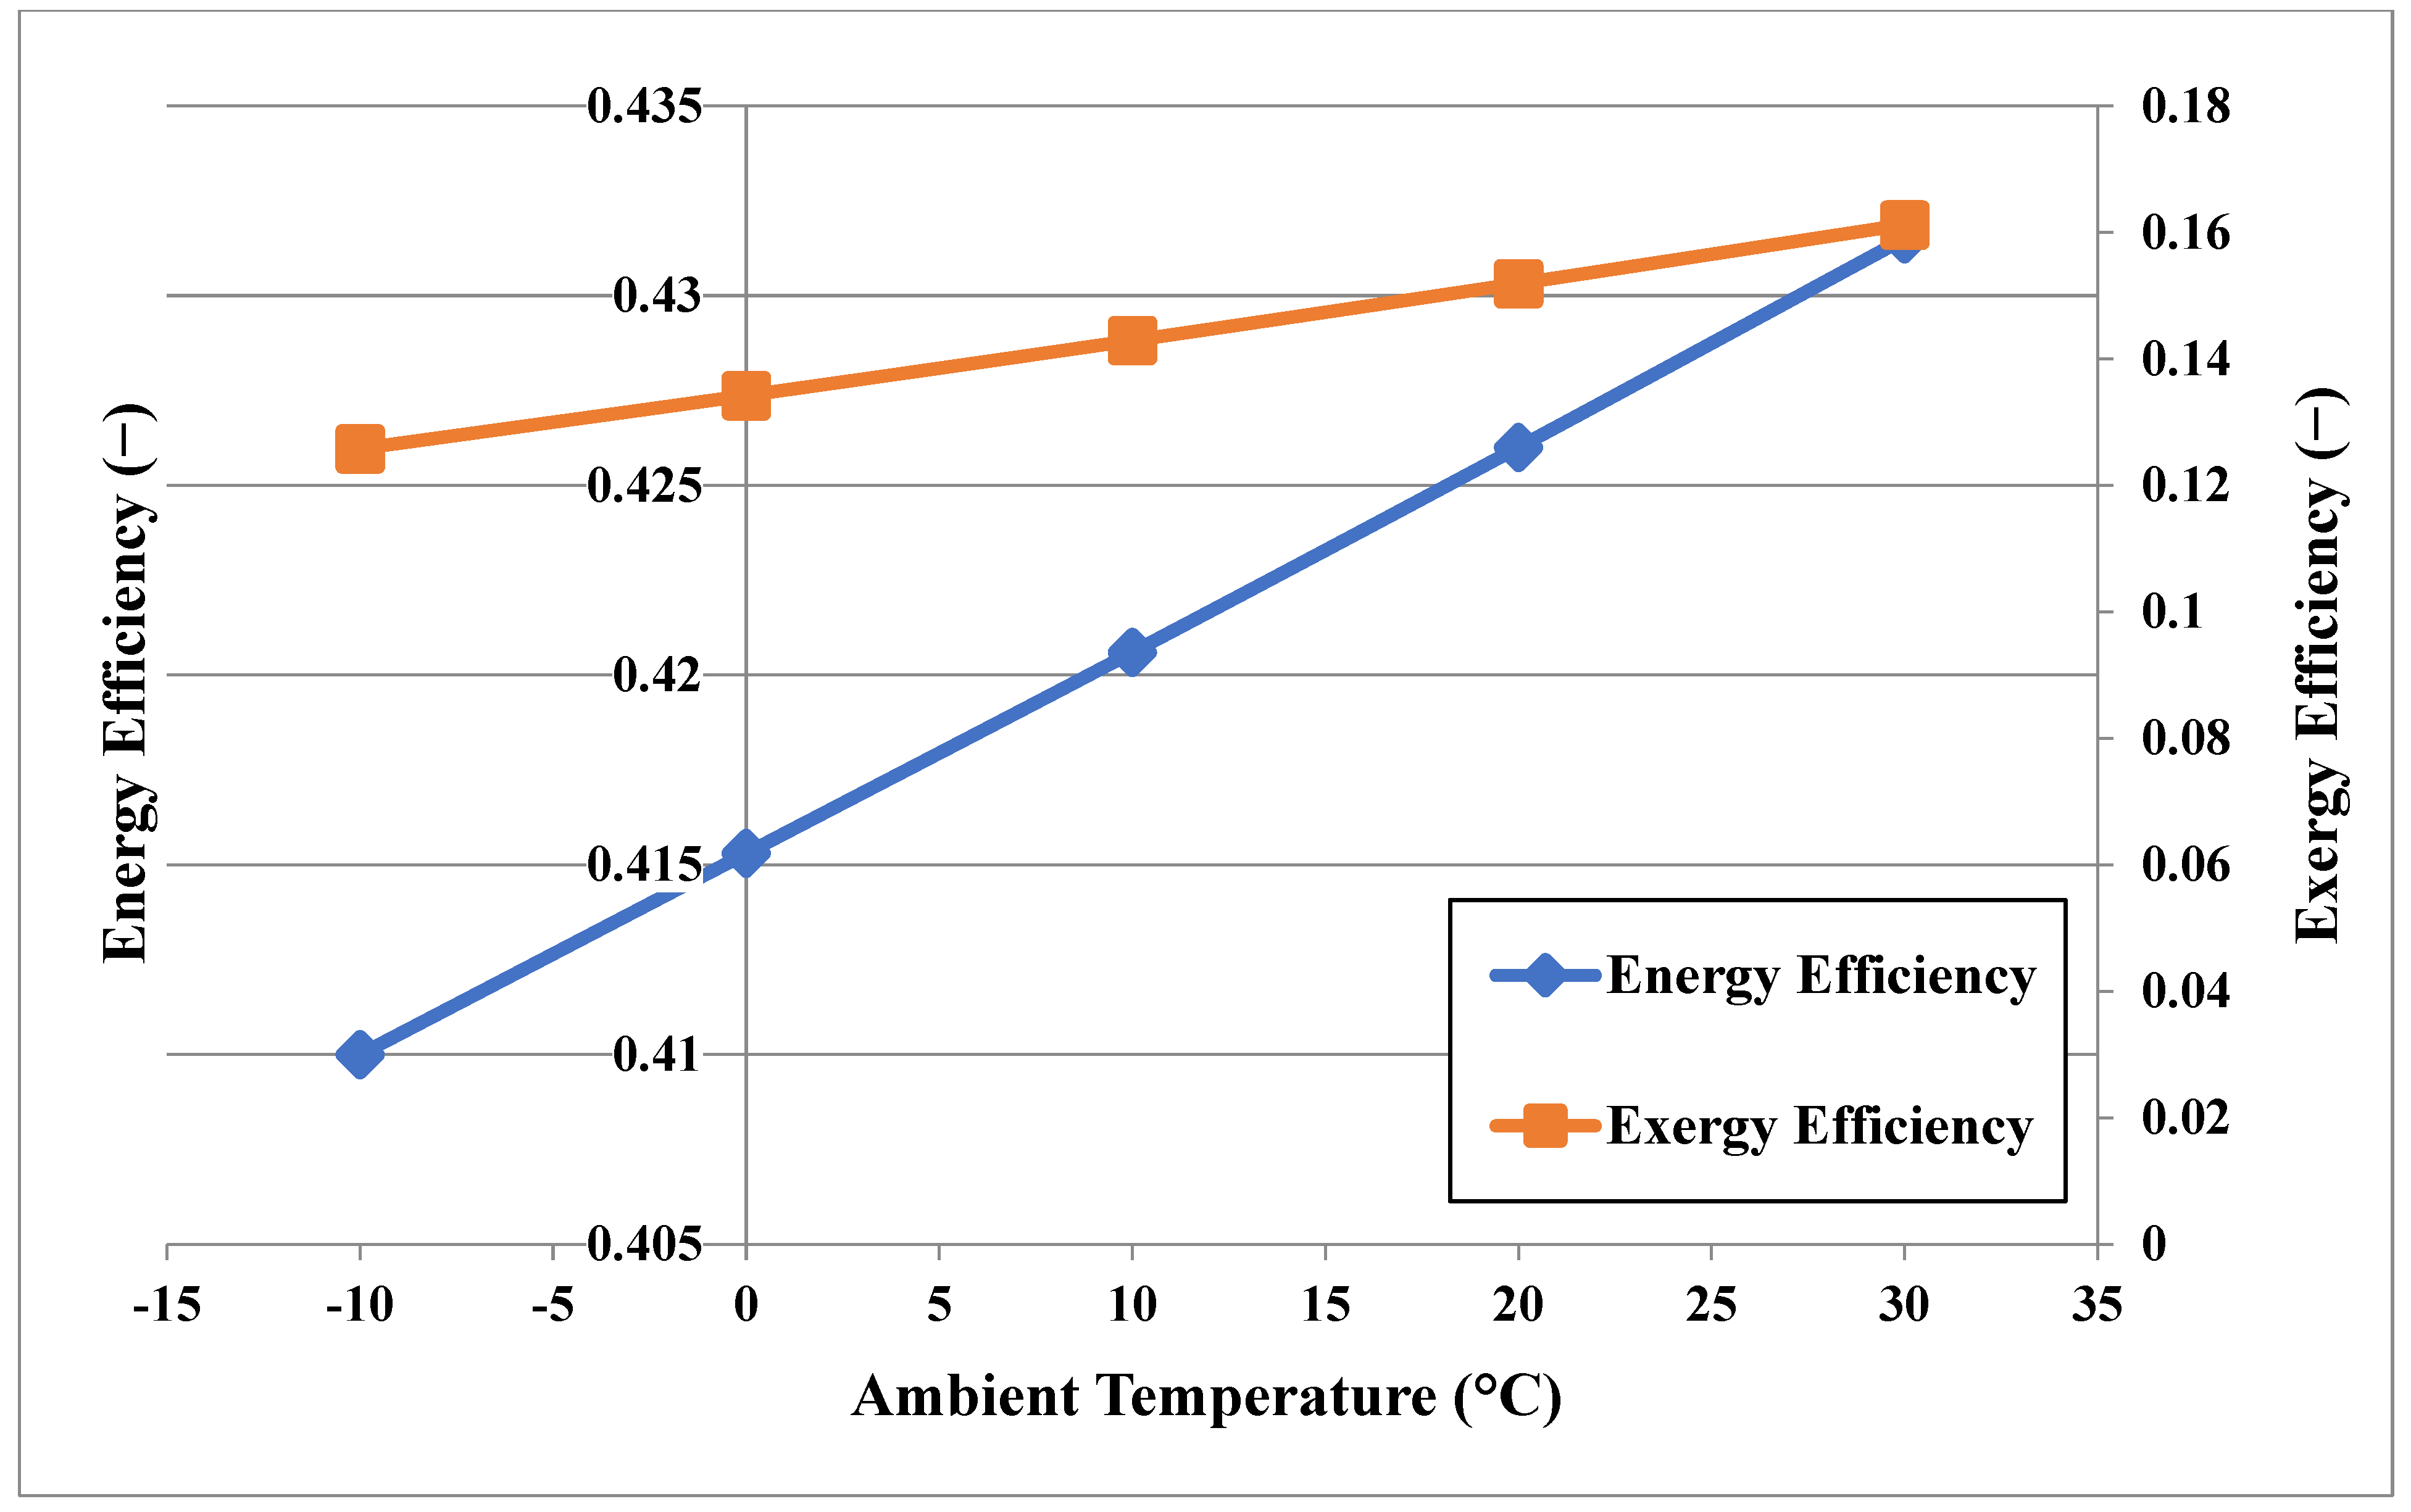
Both energy and exergy efficiencies increased as the ambient temperature increased, as depicted in Figure 7. The energy efficiency rose by approximately 2% as the ambient temperature increased from −10 °C to 30 °C. The exergy efficiency was increased by more than 2% by the same change in the ambient temperature.
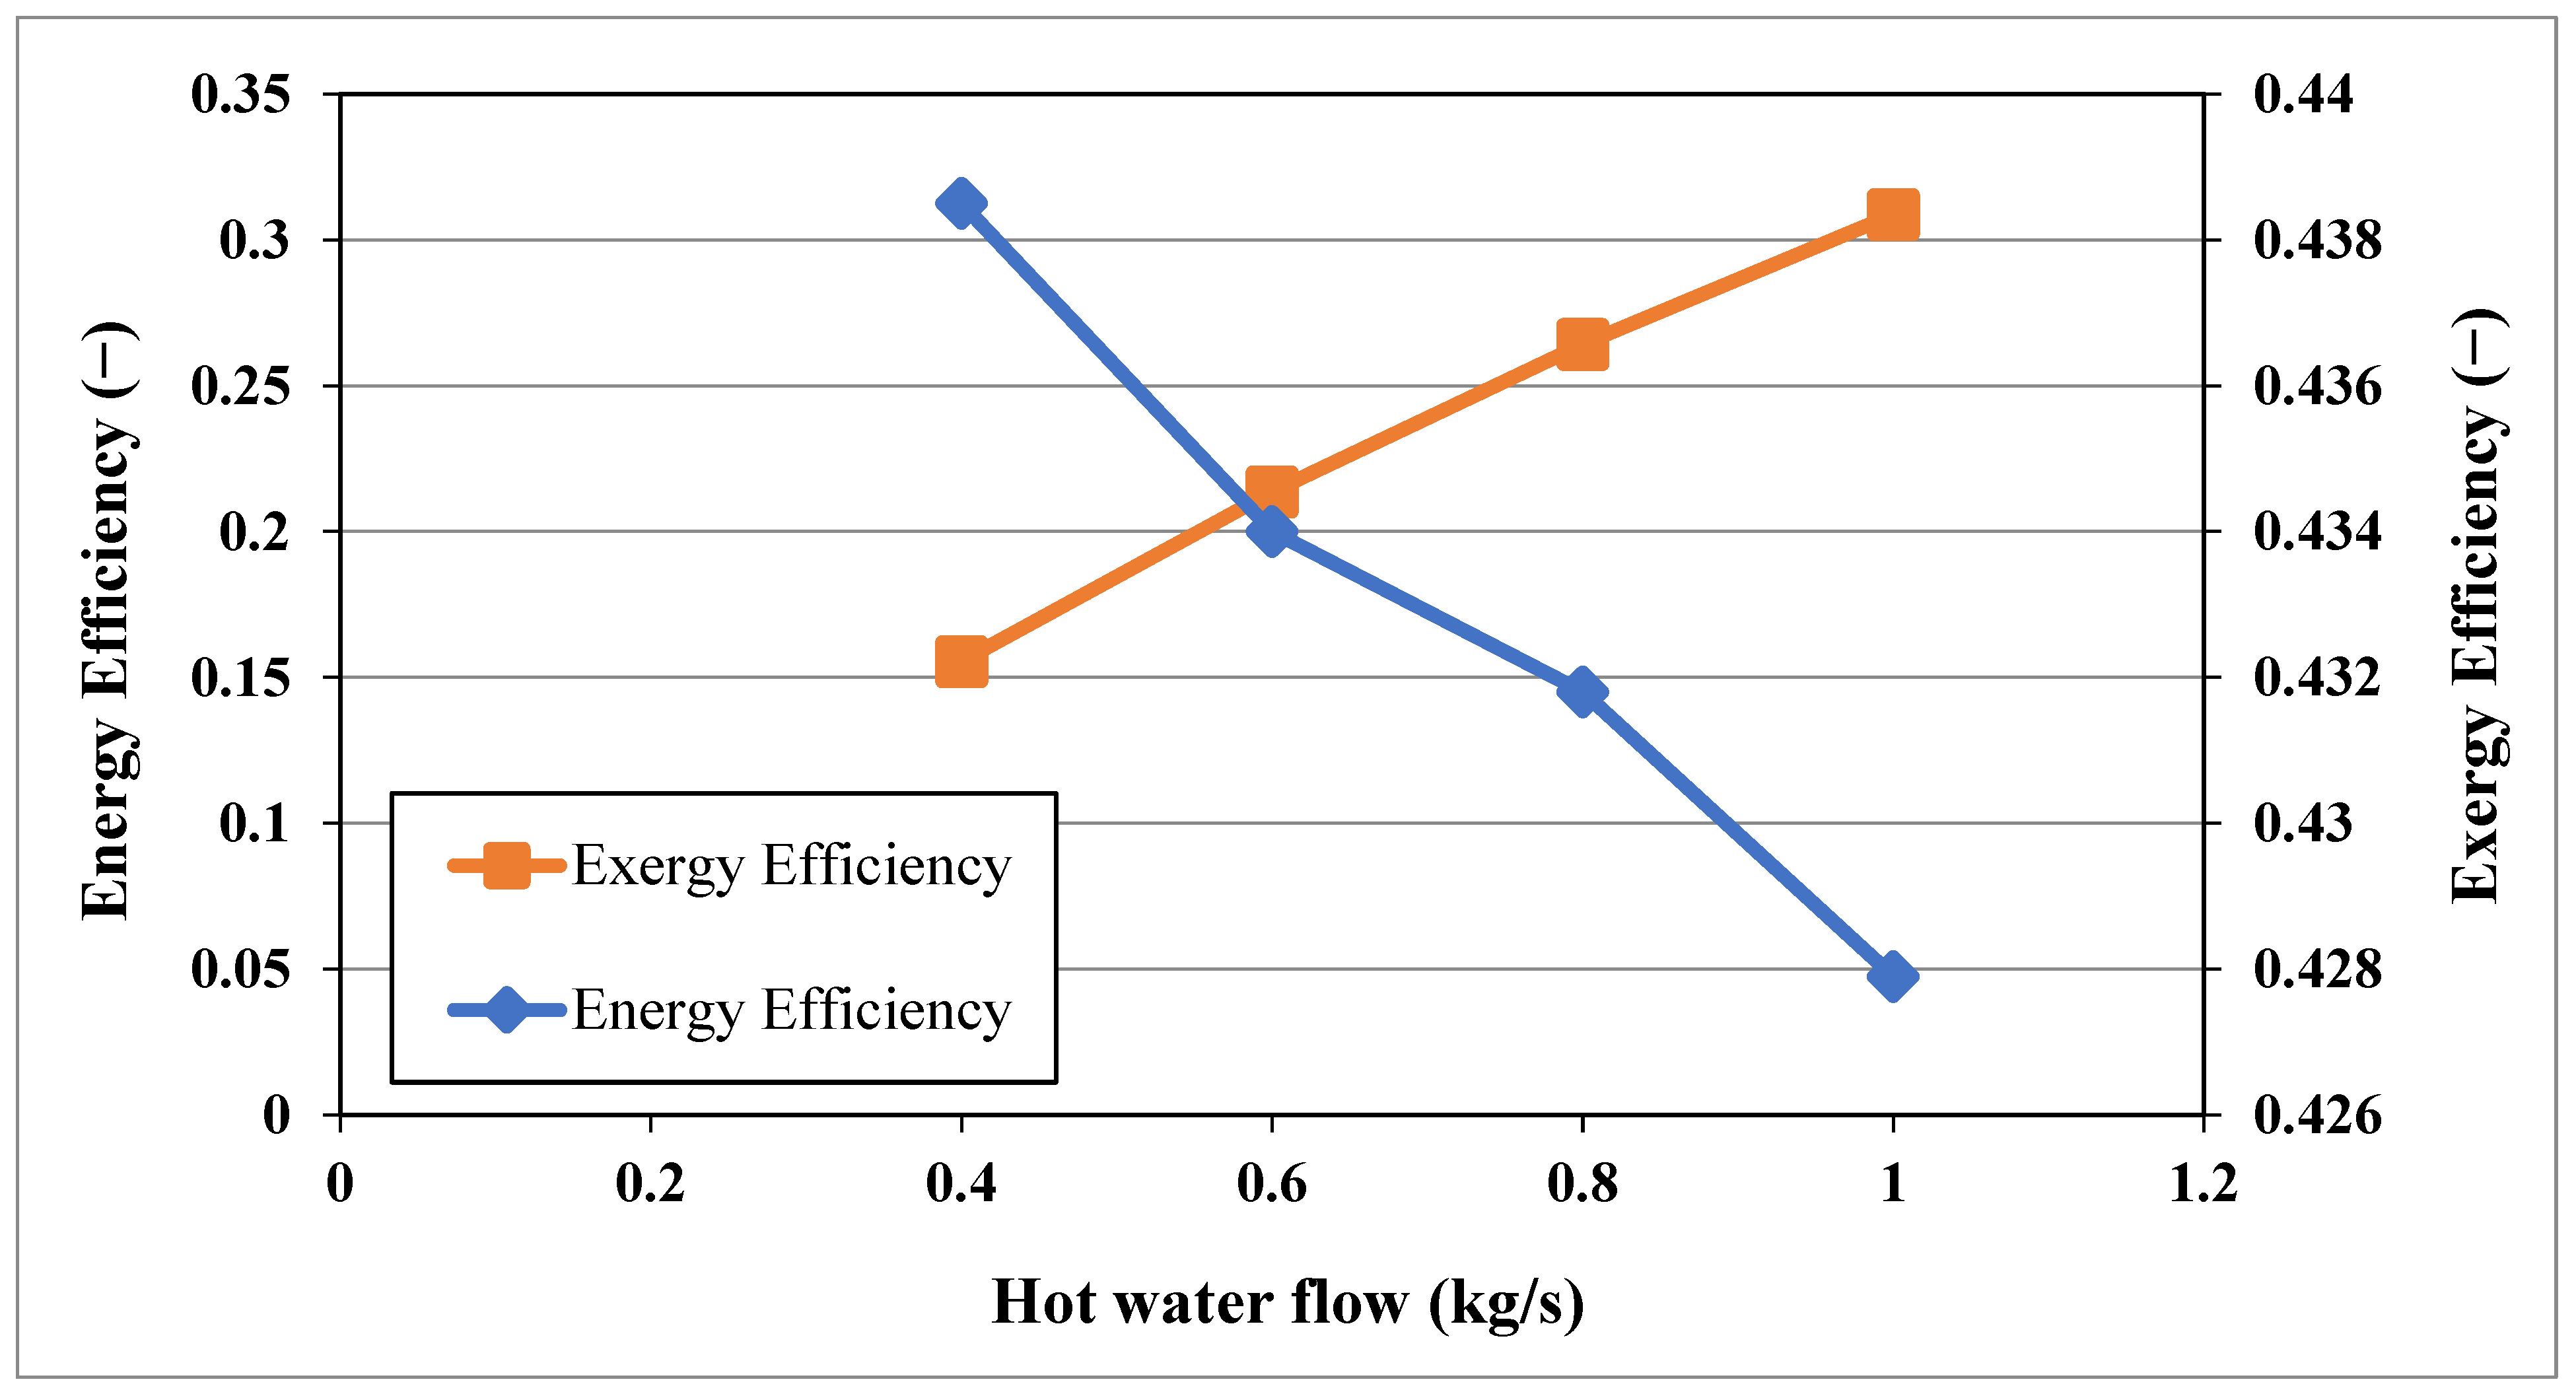
Additionally, the exergy efficiency was enhanced as the warm water flow rate of the panels was increased. A rise in the warm water flow rate from 0.4 to 1 kg/s increased the exergy efficiency by 0.6%. The energy efficiency was reduced by more than 20% by the rise of the warm water flow rate. This is depicted in Figure 8.
Table 3 provides the decision variables that influence the objective function along with acceptable values to maximize the exergy and energy efficiencies at the same time.
As a result, the objective functions reached their highest values by changing the variables shown in Table 3. The optimal point was also identified. The diagram in 
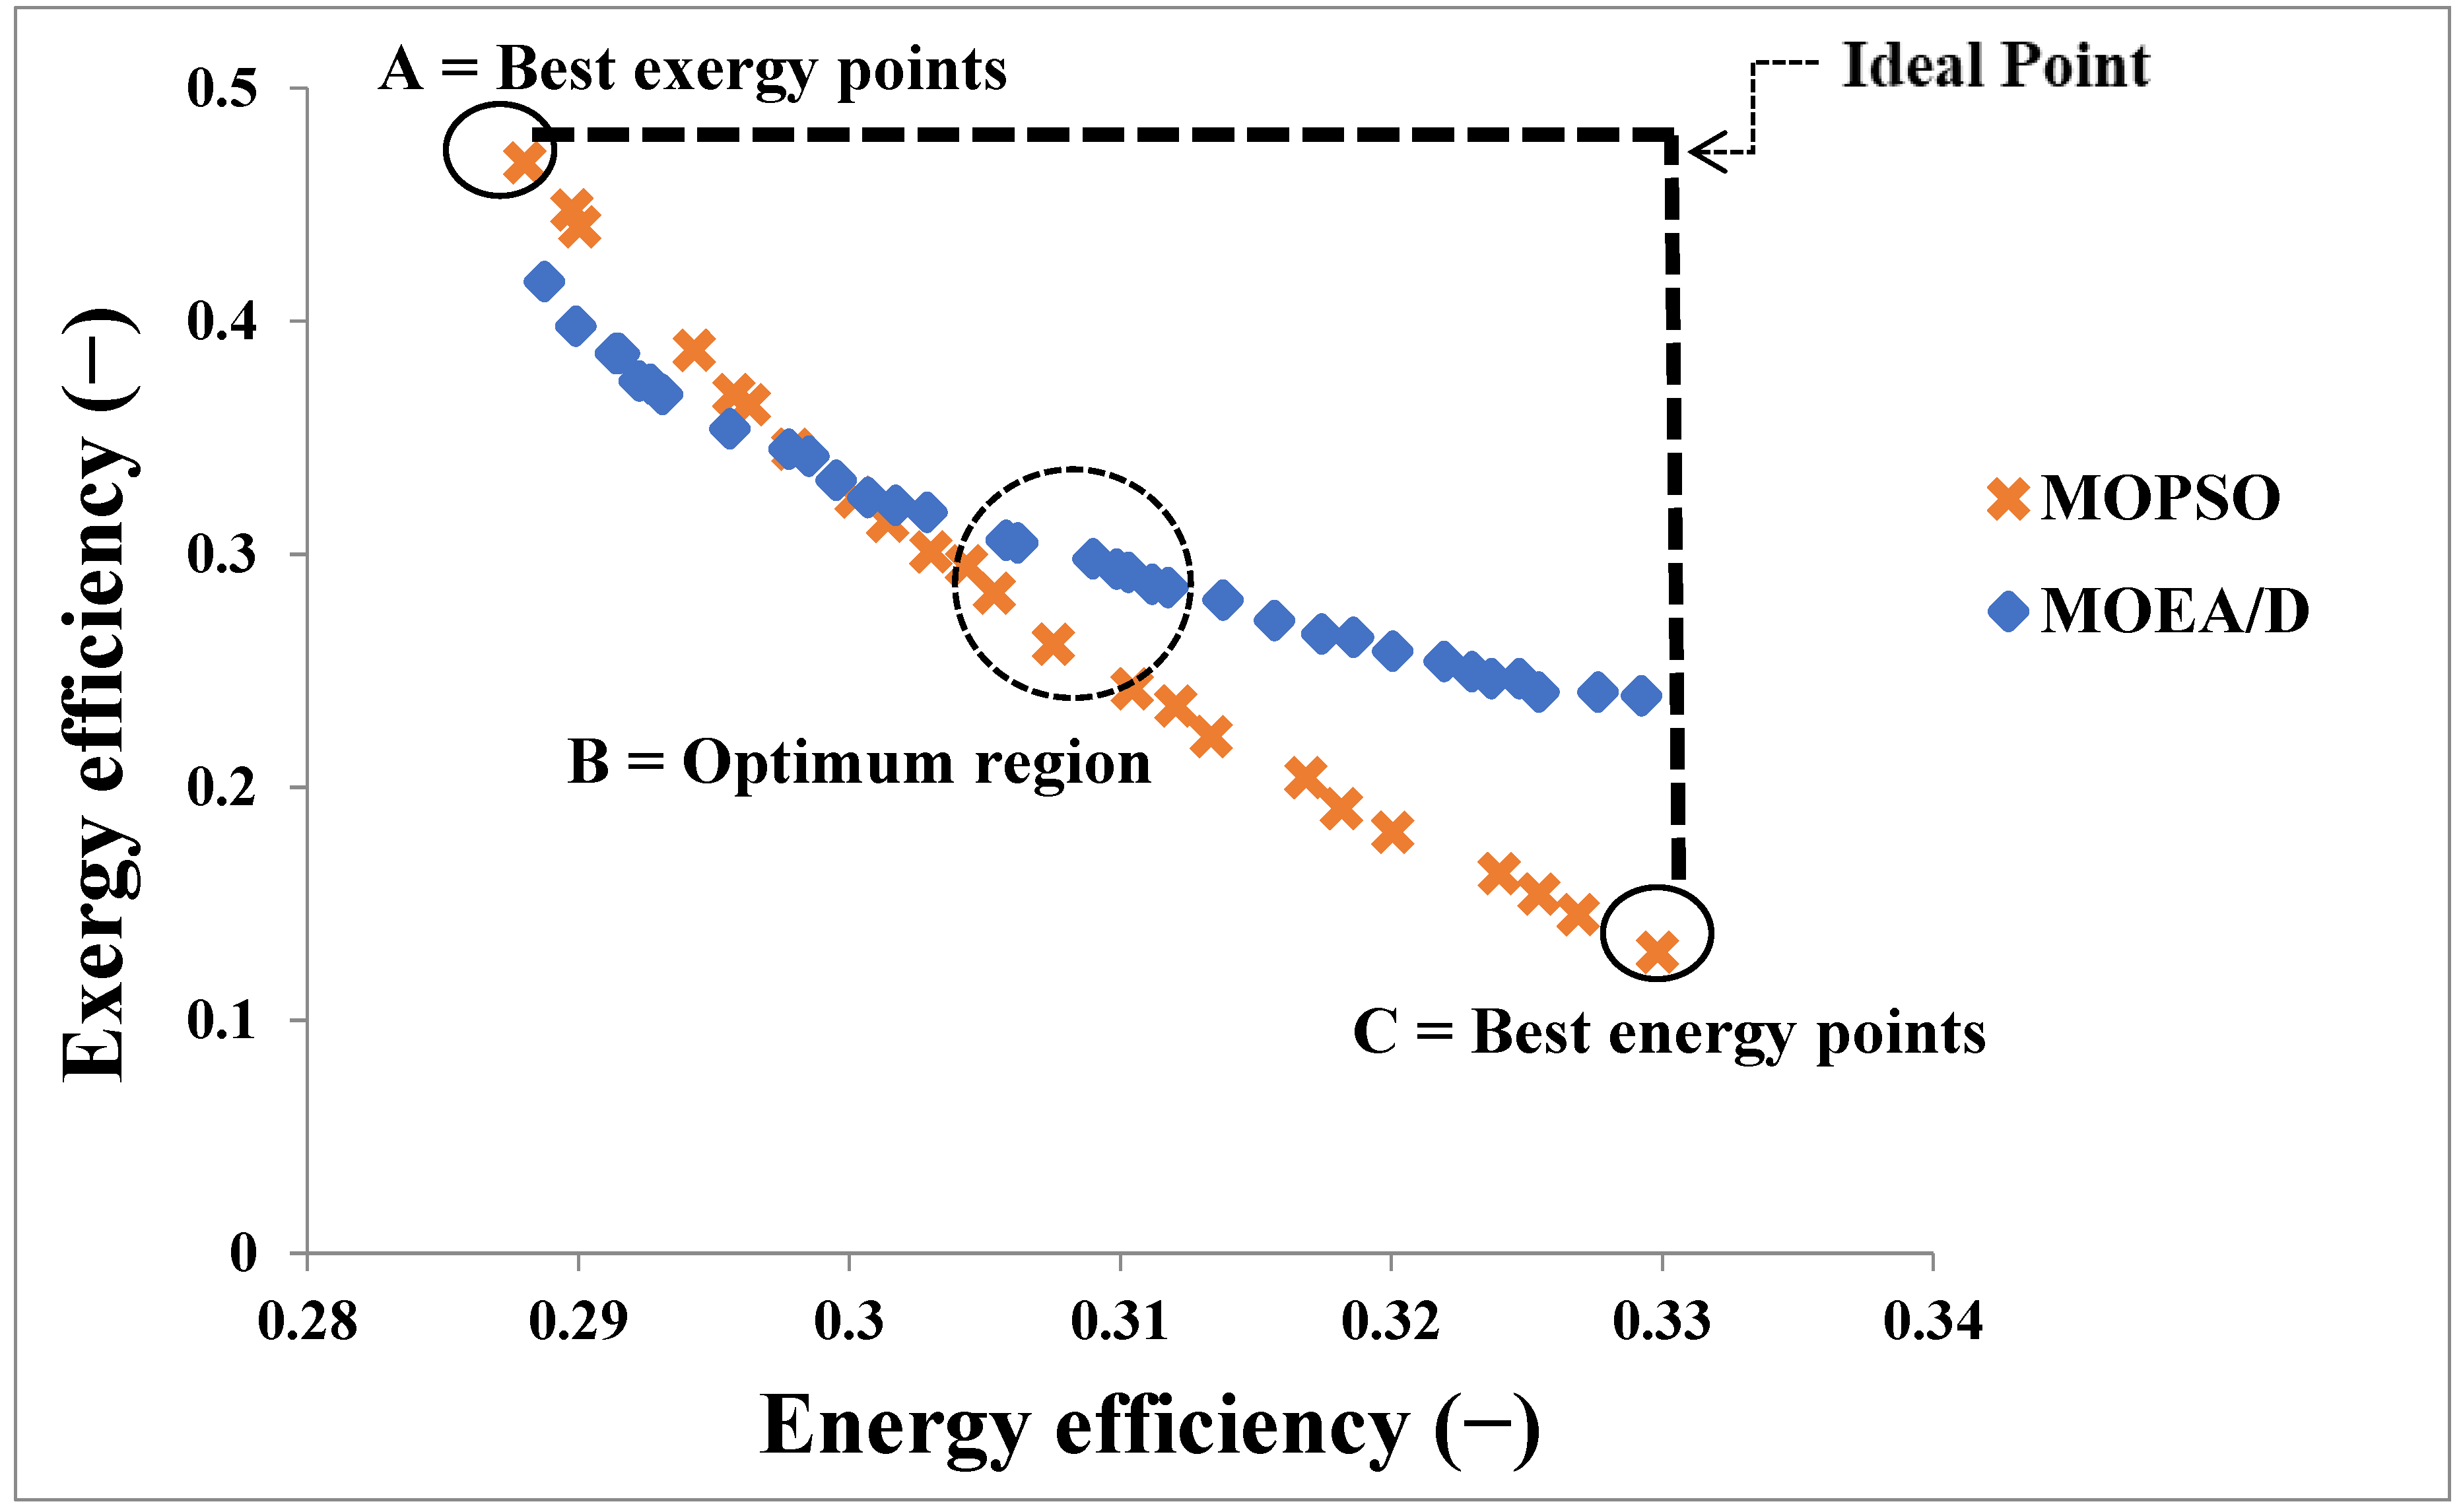
Figure 9 was obtained by dual-objective optimization and its purpose is to achieve satisfactory levels of the design variables as well as the optimization goals, including energy and exergy efficiencies. It divides the solution space into two domains: an acceptable domain and an unacceptable domain. The ideal point of the curve is the one with the highest energy and exergy efficiencies. According to Figure 9, a spot on the diagram with the shortest length from the ideal point is the optimal region. The diagram illustrates the optimal points of the two objective functions. The optimization of the PV/T system is fulfilled by the MOPSO and MOEA/D methods in the same conditions. In general, the optimal point of the exergy efficiency was found to be approximately 1.23% higher in the MOEA/D method than in the MOPSO method. In addition, the optimal point of the energy efficiency was 1.9% larger in the MOEA/D approach than in the MOPSO approach. Thus, it is indicated that the MOEA/D method can be more suitable for the multiobjective optimization of the PV/T system.
According to Figure 9, an increase in the energy efficiency decreases the exergy efficiency. Given the exergy efficiency’s behavior, it can be found that the excessive use of panels directly elevates the exergy efficiency. A decision-making process was employed to choose the final solution from the optimal points. According to Table 4, the maximum energy efficiency of 33% and the minimum exergy efficiency of 13% are observed at point C. In addition, the minimum energy efficiency of 29% and maximum exergy efficiency of 46% are obtained at point A. The satisfactory exergy efficiency is achieved by considering an objective function at point C.
Table 5 shows decision variables at points A, B, and C. Clearly, an increase in the energy efficiency enhances the warm water flow rate in each panel and the number of panels. Thus, the exergy efficiency can increase by reducing the warm water flow rate and the number of panels when the objective is only to increase the exergy efficiency; however, this would reduce the energy efficiency. Moreover, reducing the number of panels in the given range and the hot air flow rate increases energy efficiency while decreasing the exergy efficiency. This suggests that a rise in the number of panels and the solar energy-receiving area increases the energy efficiency fraction’s denominator such that it can be neutralized by the fraction’s nominator—that is, the effective energy generation.

4. Conclusions

Solar energy is an affordable and easily accessible source of energy. To utilize solar energy effectively, it is necessary to absorb the sunlight by solar collectors and convert it into heat. With this perspective, this study investigated the multiobjective optimization of a photovoltaic/thermal (PV/T) system. In order to achieve this goal, the most appropriate method of optimizing the proposed PV/T system was determined. In addition, the efficiency of the system under climatic conditions was studied. A case study of Ilam in Iran was considered. Solar radiation data for all seasons were analyzed. Then, heat and electricity generation distributions of the PV/T system were determined and studied. Then, in order to assess the proposed approach, the current results were verified according to the previous studies, and a proper agreement was found. Further, the decision variables that influence the objective functions were determined and their variations for optimization were examined.
The following results are highlighted:
  • Solar collectors generated more heat during the sunny hours when the amount of sunlight was high. In addition, power generation was higher during days, when the PV/T system was in operation, due to higher sunlight. On the other hand, the reduction of sunlight in cold seasons decreased the proposed system’s power and heat generation.
  • The electrical efficiency of the solar panels slightly changed as the sunlight and its angle changed.
  • Results showed that an increase in the energy efficiency decreased the exergy efficiency. Given the exergy efficiency’s patterns, it was found that the excessive use of panels directly elevated the exergy efficiency.
  • The optimal point for the energy efficiency of the MOEA/D method was approximately 1.23% higher than that of the MOPSO method. In addition, the exergy efficiency of the MOEA/D method was 1.9% higher than that of the MOPSO method.
  • It was found that the MOEA/D method is more suitable for the multiobjective optimization of the PV/T system.

Author Contributions

E.A.: conceptualization, methodology, writing, software. M.J.: conceptualization and investigation. M.N.: writing, reviewing, editing, and revising. M.F.: writing, reviewing, editing, and revising. M.L.: writing, reviewing, editing, and revising. All authors have read and agreed to the published version of the manuscript.

Funding

This work was supported by the 2022 Yeungnam University Research Grant.

Institutional Review Board Statement

Not applicable.

Informed Consent Statement

Not applicable.

Data Availability Statement

Not applicable.

Conflicts of Interest

The authors declare no conflict of interest.

Nomenclature

Mathematical notations:
Greek symbols:
Mathematical notationDefinitionUnit
α AbsorptivityWs0.5/m/k
τ TransmissivityW/m.k
Greek symbols with subscripts:
Mathematical notationDefinitionUnit
η t h Thermal efficiency%
η o Overall energy efficiency%
η 0 Thermal efficiency (note: this efficiency is considered in the occasion that | T i T a | = 0 )%
η e Electrical efficiency%
η e x PV/T collector exergy efficiency%
Latin symbols:
Mathematical notationDefinitionUnit
A Collector aream2
QCollected heatJ
S r Solar radiationW/m2
Latin symbols with subscripts:
Mathematical notationDefinitionUnit
H l Heat loss coefficientUnitless
I m p Maximum current of the panelA
I s c Short-circuit currentA
I s Incident solar intensityW/m2
T 0 Fluid’s temperature in the absorbing unit (in the outlet section)°C
T a Ambient temperature°C
TambAmbient air temperature°C
T c e l l Solar cell temperature°C
T i Fluid’s temperature in the absorbing unit (in the inlet section)°C
TpPlate temperature°C
T s Surface temperature°C
UTThe heat transfer coefficient from solar cell to ambient air by considering the cover of the glassUnitless
UtopTotal heat transfer coefficient from the solar cell to the ambient atmosphere through the glassUnitless
V m p Maximum voltage of panelVolt
V o c Open-circuit voltageVolt
Latin symbols with superscripts:
Mathematical notationDefinitionUnit
m ˙ Mass flow ratekg/s
Latin symbols with both subscripts and superscripts:
Mathematical notationDefinitionUnit
E ˙ x e l e c t r i c a l Electrical exergyJ
E ˙ x i n Total input exergy ratekW
E ˙ x o u t Net output exergy ratekW
E ˙ x t h e r m a l Thermal exergyJ
Q ˙ u Rate of useful heat absorbed by the panelkJ/kW

Abbreviations

AbbreviationDefinition
ANFISAdaptive neuro-fuzzy inference system
BIPV/TBuilding-integrated photovoltaic/thermal
FFFill factor
GAGenetic algorithm
MEAsMultiobjective evolutionary algorithms
MOEA/DMultiobjective evolutionary algorithm based on decomposition
MOPsMultiobjective optimization problems
MOPSOMultiobjective particle swarm optimization
MPPTMaximum power point tracking
NSGANon-dominated sorting genetic algorithm
PCMPhase change material
PV/TPhotovoltaic/thermal

References

  1. Dincer, I.; Al-Muslim, H. Thermodynamic analysis of reheat cycle steam power plants. Int. J. Energy Res. 2001, 25, 727–739. [Google Scholar] [CrossRef]
  2. Jin, H.; Ishida, M.; Kobayashi, M.; Nunokawa, M. Exergy evaluation of two current advanced power plants: Supercritical steam turbine and combined cycle. J. Energy Resour. Technol. 1997, 119, 250–256. [Google Scholar] [CrossRef]
  3. Vuong, E.; Kamel, R.S.; Fung, A.S. Modelling and simulation of BIPV/T in EnergyPlus and TRNSYS. Energy Procedia 2015, 78, 1883–1888. [Google Scholar] [CrossRef] [Green Version]
  4. Xu, L.; Luo, K.; Ji, J.; Yu, B.; Li, Z.; Huang, S. Study of a hybrid BIPV/T solar wall system. Energy 2020, 193, 116578. [Google Scholar] [CrossRef]
  5. Yang, T.; Athienitis, A.K. Experimental investigation of a two-inlet air-based building integrated photovoltaic/thermal (BIPV/T) system. Appl. Energy 2015, 159, 70–79. [Google Scholar] [CrossRef]
  6. Chinipardaz, M.; Amraee, S. Study on IoT networks with the combined use of wireless power transmission and solar energy harvesting. Sādhanā 2022, 47, 1–16. [Google Scholar] [CrossRef]
  7. Shahsavar, A.; Talebizadeh, P.; Tabaei, H. Optimization with genetic algorithm of a PV/T air collector with natural air flow and a case study. J. Renew. Sustain. Energy 2013, 5, 023118. [Google Scholar] [CrossRef]
  8. Cao, Y.; Kamrani, E.; Mirzaei, S.; Khandakar, A.; Vaferi, B. Electrical efficiency of the photovoltaic/thermal collectors cooled by nanofluids: Machine learning simulation and optimization by evolutionary algorithm. Energy Rep. 2022, 8, 24–36. [Google Scholar] [CrossRef]
  9. Karathanassis, I.K.; Papanicolaou, E.; Belessiotis, V.; Bergeles, G.C. Multi-objective design optimization of a micro heat sink for Concentrating Photovoltaic/Thermal (CPVT) systems using a genetic algorithm. Appl. Therm. Eng. 2013, 59, 733–744. [Google Scholar] [CrossRef]
  10. Khaki, M.; Shahsavar, A.; Khanmohammadi, S.; Salmanzadeh, M. Energy and exergy analysis and multi-objective optimization of an air based building integrated photovoltaic/thermal (BIPV/T) system. Sol. Energy 2017, 158, 380–395. [Google Scholar] [CrossRef]
  11. Vera, J.T.; Laukkanen, T.; Sirén, K. Multi-objective optimization of hybrid photovoltaic–thermal collectors integrated in a DHW heating system. Energy Build. 2014, 74, 78–90. [Google Scholar] [CrossRef]
  12. Singh, S.; Agarwal, S.; Tiwari, G.N.; Chauhan, D. Application of genetic algorithm with multi-objective function to improve the efficiency of glazed photovoltaic thermal system for New Delhi (India) climatic condition. Sol. Energy 2015, 117, 153–166. [Google Scholar] [CrossRef]
  13. Sohani, A.; Dehnavi, A.; Sayyaadi, H.; Hoseinzadeh, S.; Goodarzi, E.; Garcia, D.A.; Groppi, D. The real-time dynamic multi-objective optimization of a building integrated photovoltaic thermal (BIPV/T) system enhanced by phase change materials. J. Energy Storage 2022, 46, 103777. [Google Scholar] [CrossRef]
  14. Sarhaddi, F.; Farahat, S.; Ajam, H.; Behzadmehr, A.; Adeli, M.M. An improved thermal and electrical model for a solar photovoltaic thermal (PV/T) air collector. Appl. Energy 2010, 87, 2328–2339. [Google Scholar] [CrossRef]
  15. Sattar, M.; Rehman, A.; Ahmad, N.; Mohammad, A.; Al Ahmadi, A.A.; Ullah, N. Performance Analysis and Optimization of a Cooling System for Hybrid Solar Panels Based on Climatic Conditions of Islamabad, Pakistan. Energies 2022, 15, 6278. [Google Scholar] [CrossRef]
  16. Dasheng, L. Multi Objective Particle Swarm Optimization: Algorithms and Applications. Ph.D. Thesis, National University of Singapore, Singapore, 2009. [Google Scholar]
  17. Zhang, Q.; Li, H. MOEA/D: A multiobjective evolutionary algorithm based on decomposition. IEEE Trans. Evol. Comput. 2007, 11, 712–731. [Google Scholar] [CrossRef]
  18. Mishra, R.; Tiwari, G. Energy and exergy analysis of hybrid photovoltaic thermal water collector for constant collection temperature mode. Sol. Energy 2013, 90, 58–67. [Google Scholar] [CrossRef]
  19. Lee, J.H.; Hwang, S.G.; Lee, G.H. Efficiency improvement of a photovoltaic thermal (PVT) system using nanofluids. Energies 2019, 12, 3063. [Google Scholar] [CrossRef] [Green Version]
  20. Aberoumand, S.; Ghamari, S.; Shabani, B. Energy and exergy analysis of a photovoltaic thermal (PV/T) system using nanofluids: An experimental study. Sol. Energy 2018, 165, 167–177. [Google Scholar] [CrossRef]
  21. Weather Spark, The Weather Year Round Anywhere on Earth, Cedar Lake Ventures, Inc. Available online: www.weatherspark.com (accessed on 1 February 2021).
Figure 1. The demonstration of the proposed PV/T system.
Energies 15 07489 g001
Figure 2. Solar irradiation data for Ilam (Iran).
Energies 15 07489 g002
Figure 3. Evaluation of the validity of the results by comparing the current results and the results of the studied reference.
Energies 15 07489 g003
Figure 4. PV/T heat generation distribution based on time.
Energies 15 07489 g004
Figure 5. PV/T electricity power generation distribution based on time.
Energies 15 07489 g005
Figure 6. The electrical efficiency of the proposed PV/T system.
Energies 15 07489 g006
Figure 7. Energy and exergy efficiencies versus ambient temperature.
Energies 15 07489 g007
Figure 8. Energy and exergy efficiencies versus the flow rate of the hot water.
Energies 15 07489 g008
Figure 9. Comparing the optimal points between the MOPSO and MOEA/D approaches.
Energies 15 07489 g009
Table 1. Framework of the MOPSO.
Particle initializationEnergies 15 07489 i001P
Create archiveEnergies 15 07489 i001A
WhileEnergies 15 07489 i001Stopping criteria is not satisfied
Evaluate(P)Energies 15 07489 i001P
Update(A)Energies 15 07489 i001A
Select pbest(P) Energies 15 07489 i001P
Select gbest(P)Energies 15 07489 i001P
Update(P)Energies 15 07489 i001P
EndEnergies 15 07489 i001While
Table 2. Calculated errors for the studied parameters.
HourError Regarding the Photovoltaic Panel Temperature (%)Error in Case of Outlet Air
Temperature (%)
90.0050.005
100.0050.005
110.010.005
120.0090.01
130.0050.008
140.0020.002
150.0050.002
160.0080.01
Table 3. Design parameters and their variation ranges for optimization.
ParametersSymbolLower LimitUpper Limit
Number of PV panelsNPanel (−)0200
Warm water flow ratemd (kg/s)03
Solar irradiationI (W/m2)0900
Ambient temperatureT (°C)−2040
Table 4. The optimal exergy and energy efficiency values for points A, B, and C at suitable Pareto parameters for the given inputs.
Parameter(With Consideration of Heat Recovery)
AB (The Optimal Point)C
ηex0.4680.2900.129
ɳenergy0.2880.3140.330
Table 5. Optimal parameters at points A, B, and C in the optimal Pareto front.
ParameterAB (The Optimal Point)C
Number of PV panels416065
Warm water flow rate (kg/s)0.4780.4330.450
Solar irradiation (W/m2)254328800
Ambient temperature (°C)313313313
Publisher’s Note: MDPI stays neutral with regard to jurisdictional claims in published maps and institutional affiliations.

