
Evolution of Solar Energy in Chile: Residential Opportunities in Arica and Parinacota

 ,
,  , and
, and 
Abstract
:1. Introduction
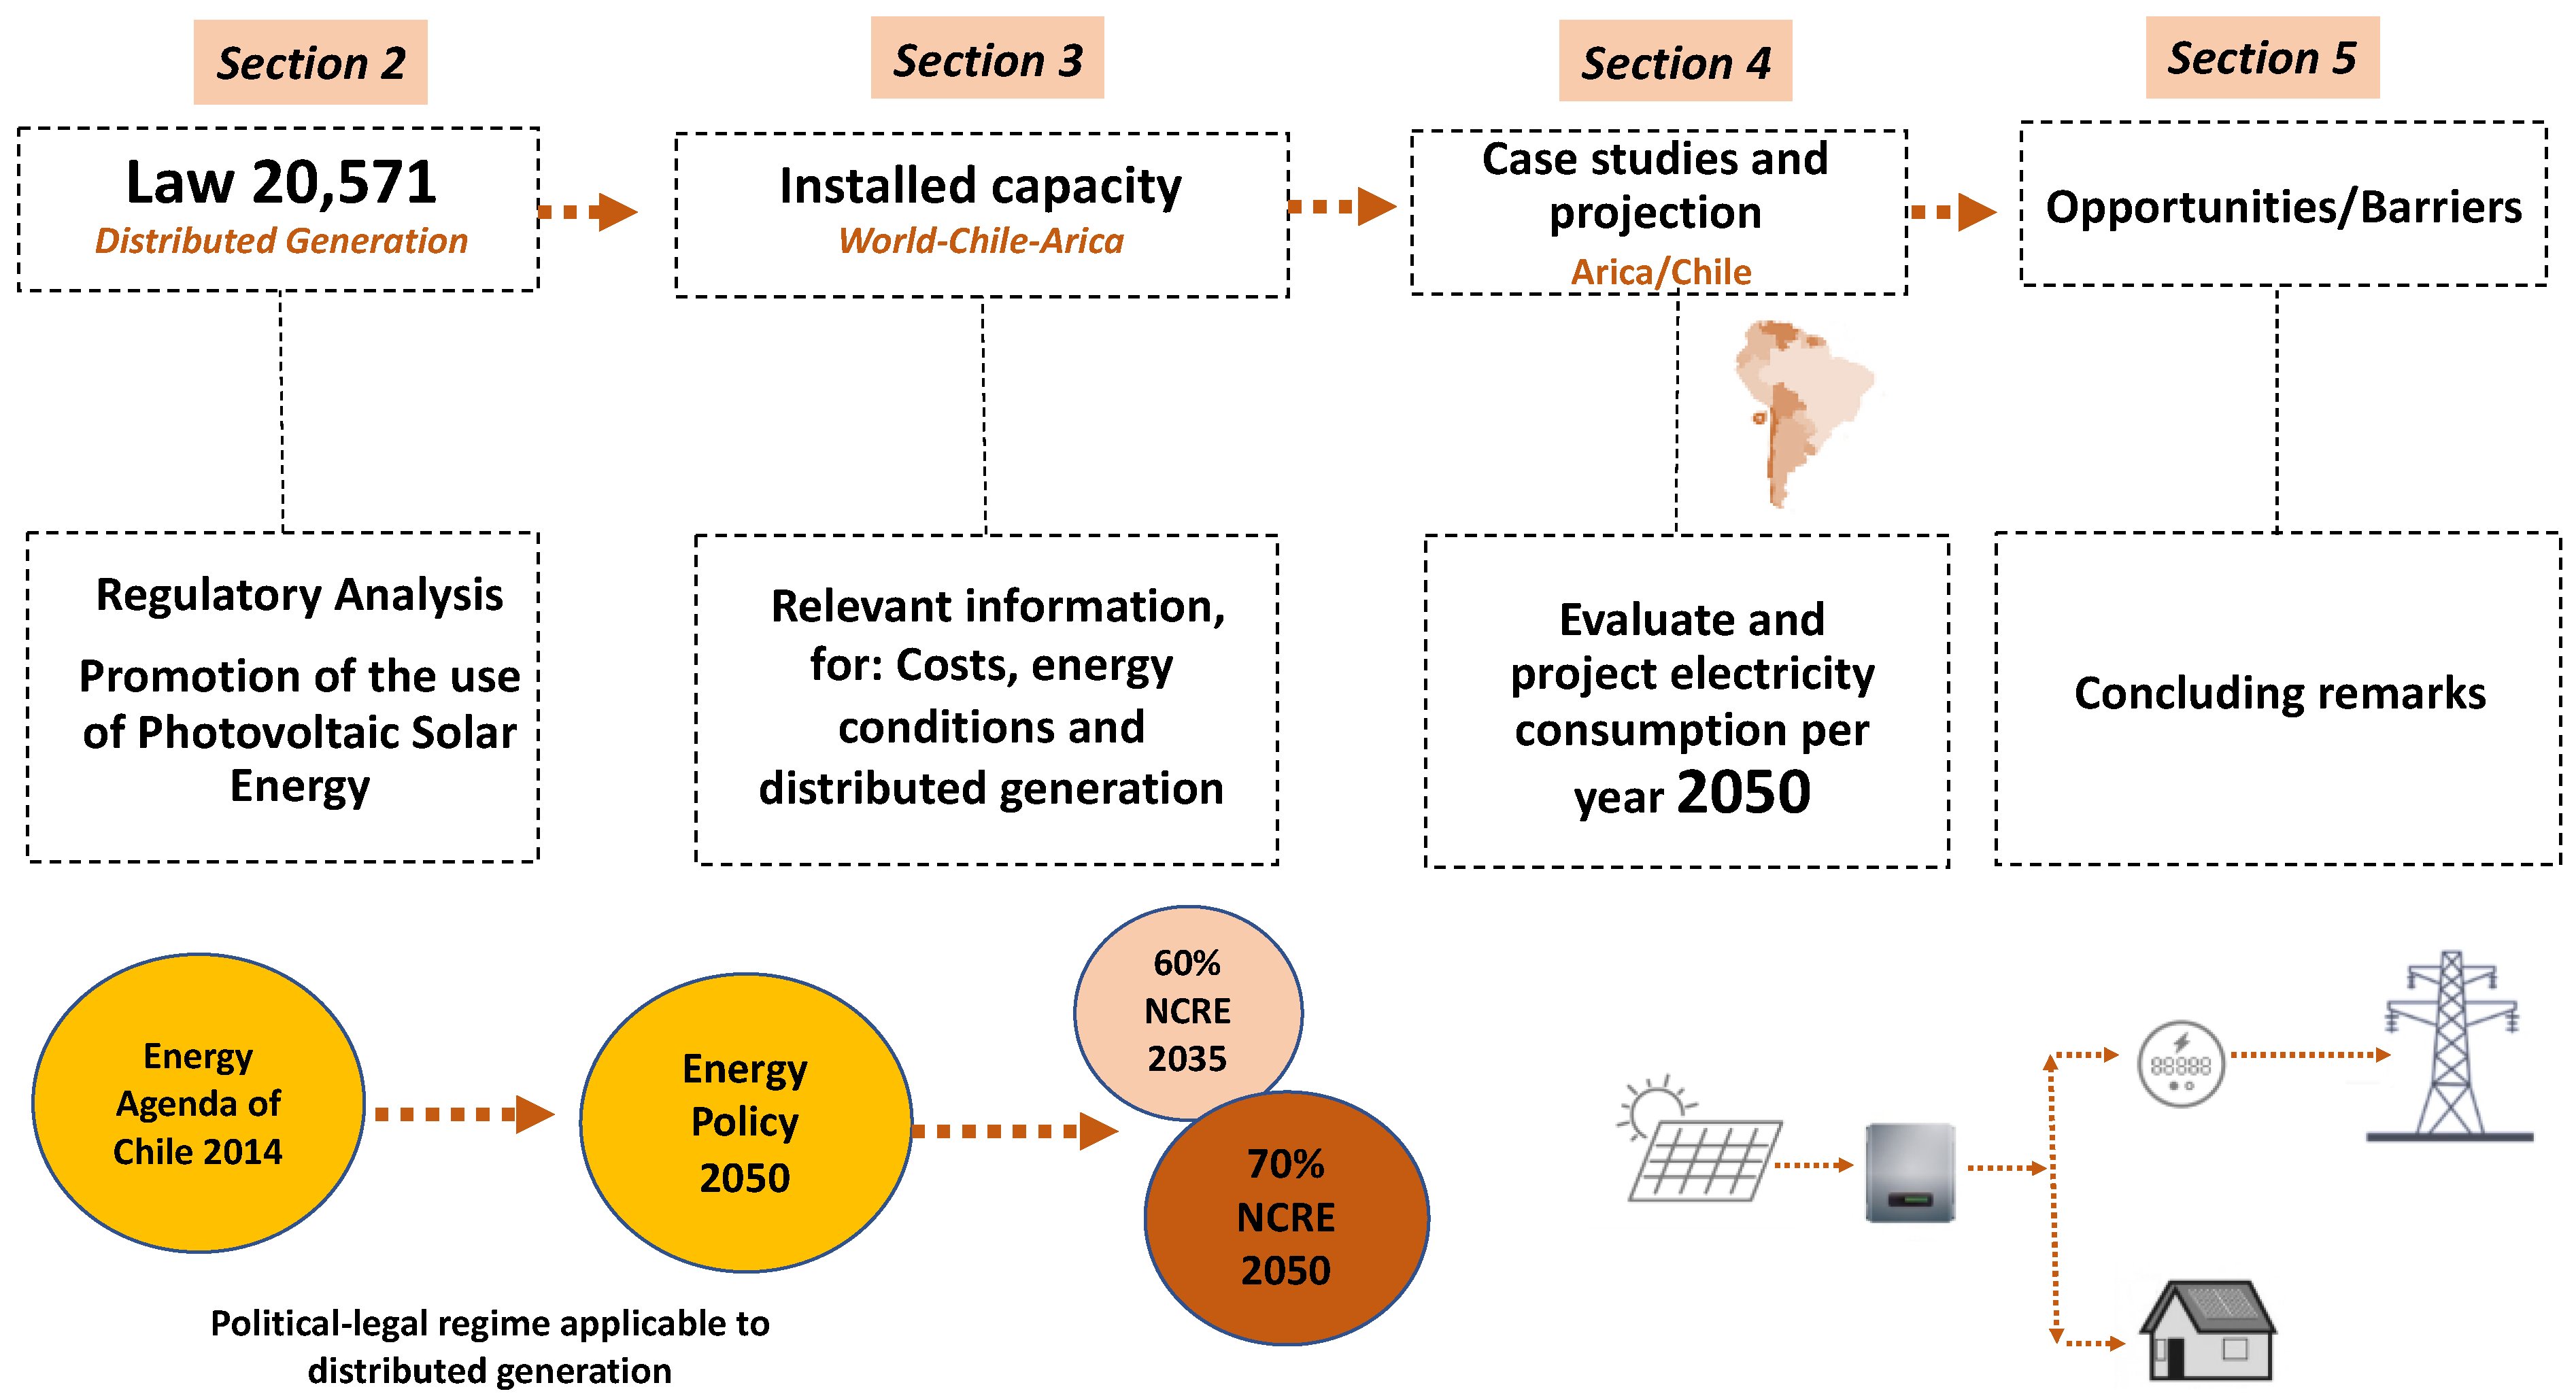
2. Methodology
3. Residential Level NCRE Promoting Regulations
3.1. Political-Legal Regime Applicable to Distributed Generation in Chile
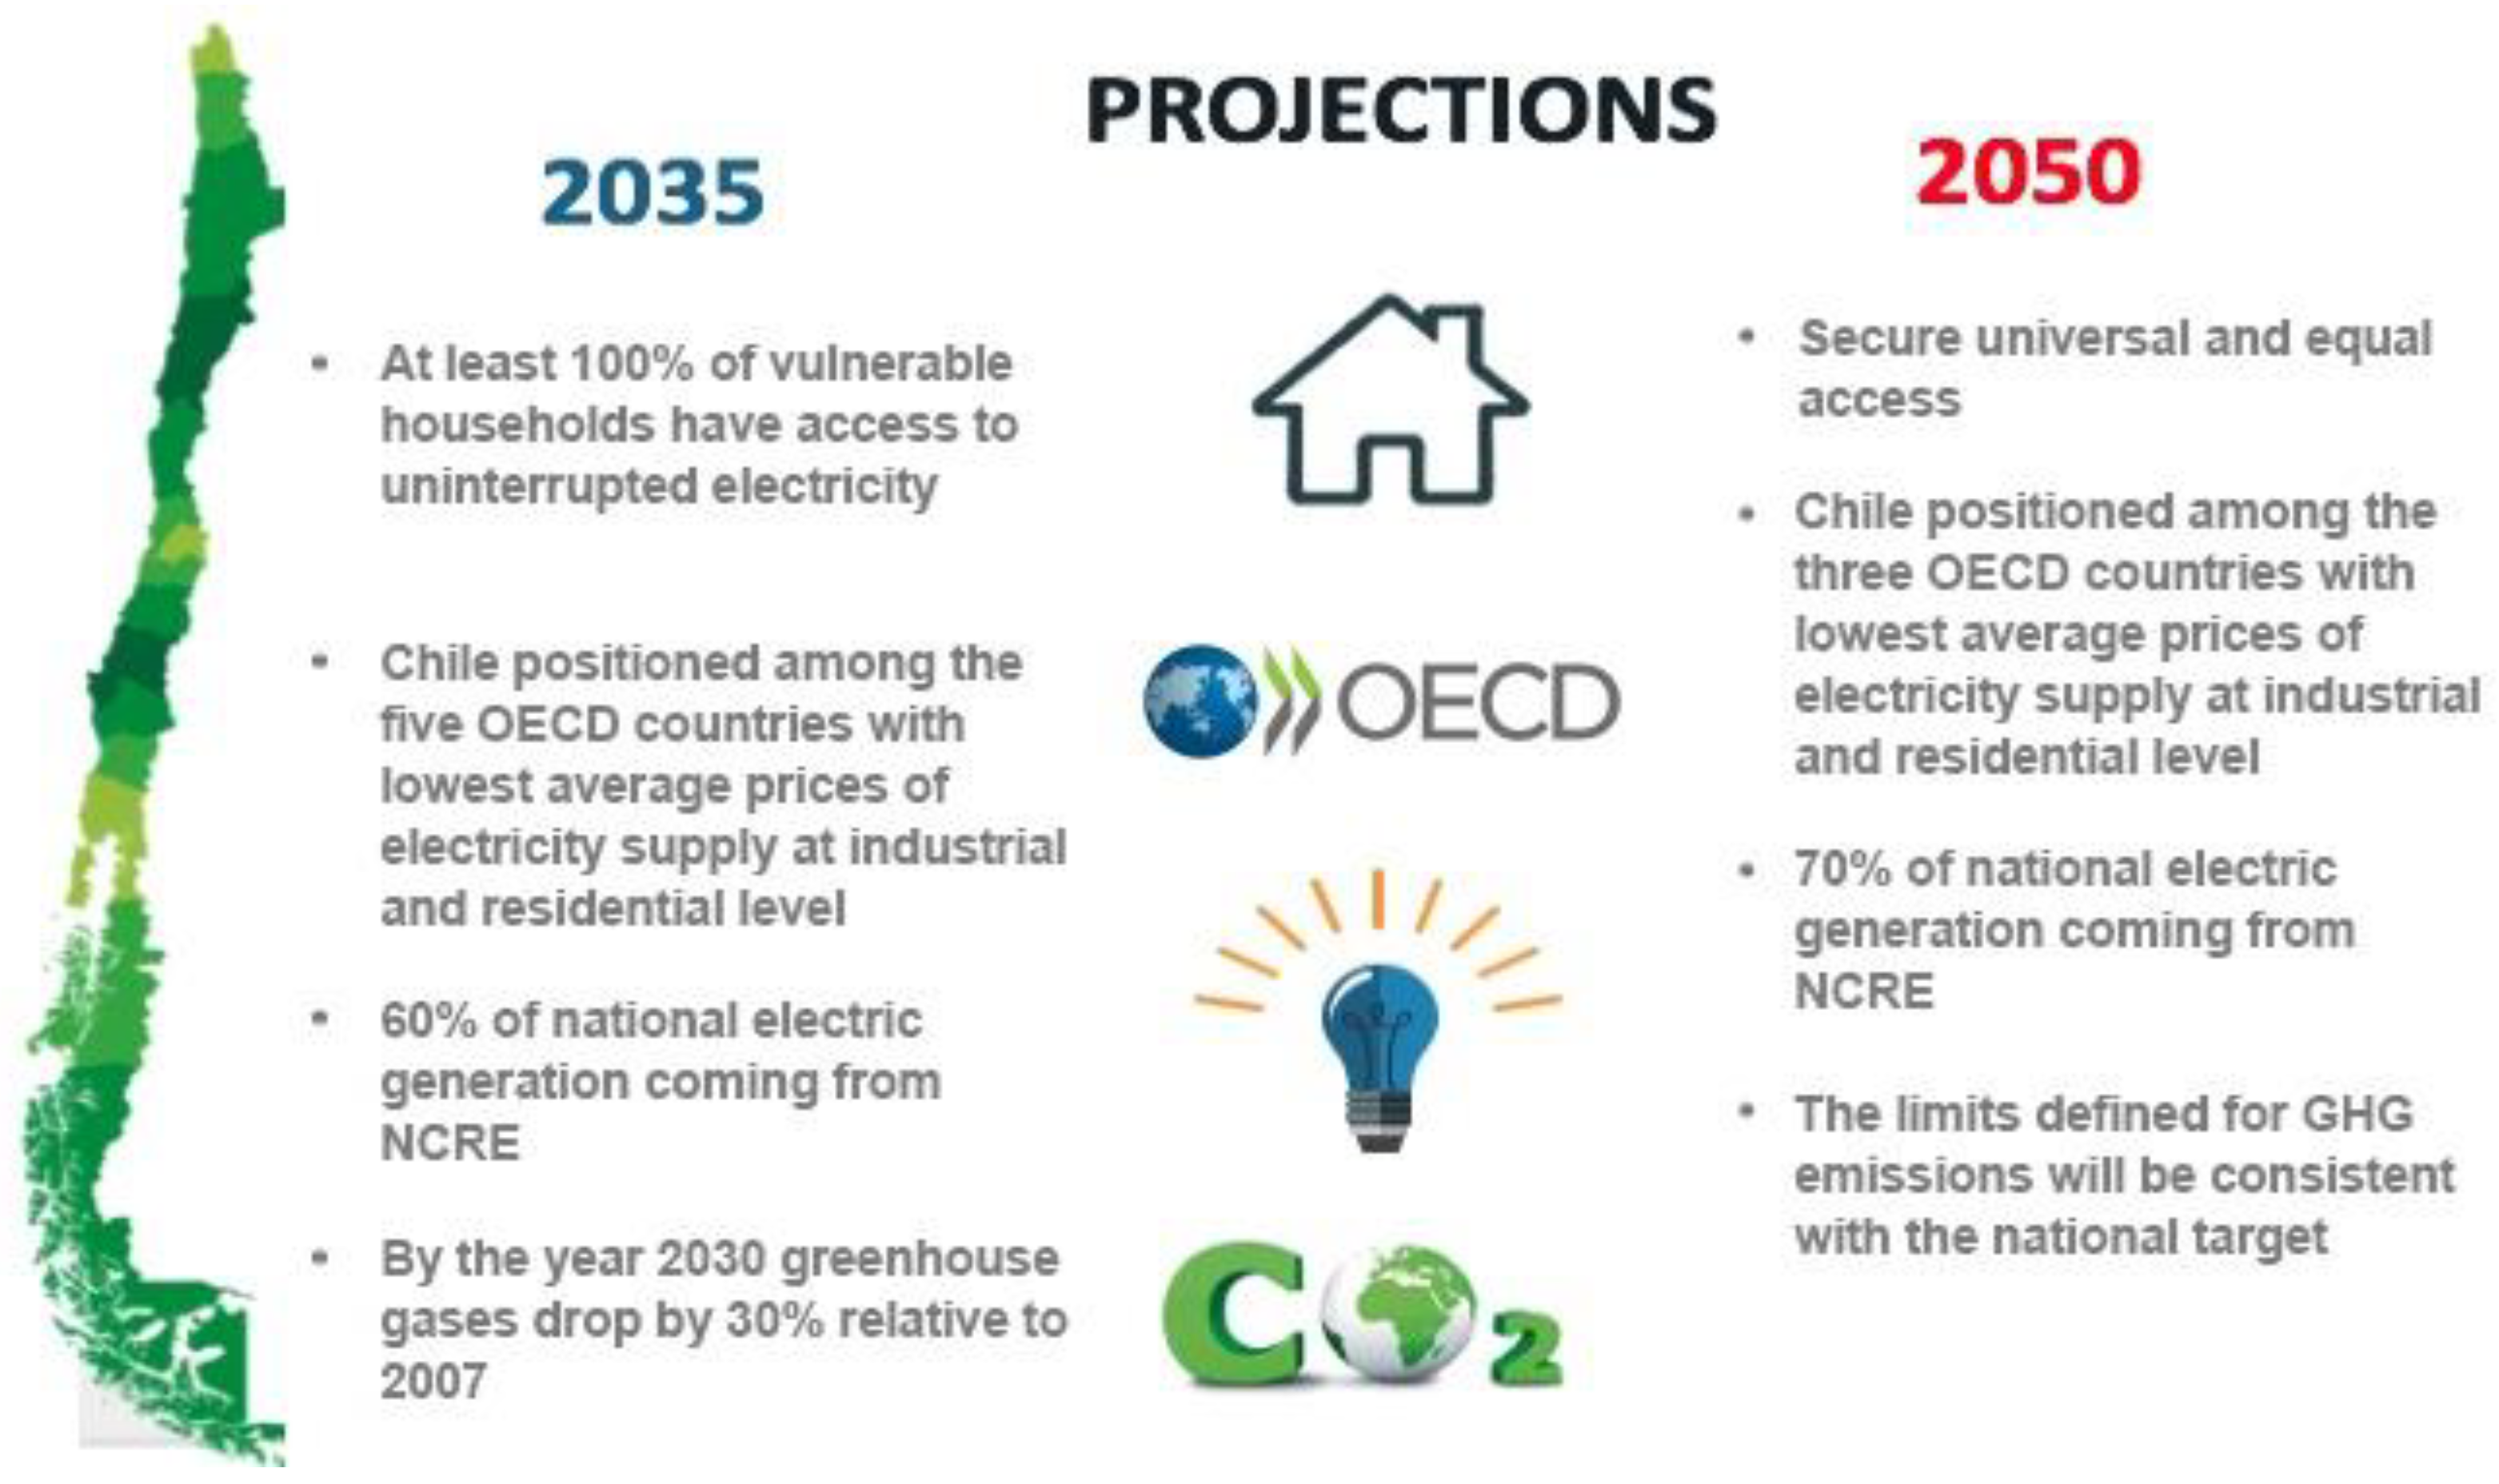
Energy Policy towards 2050
- -
- Lifting existing barriers for NCRE in the country. 45% of the electricity generation capacity to be installed in the country between 2014 and 2025 will come from this type of source.
- -
- Promoting efficient use of energy as an energy resource, establishing a savings goal of 20% by 2025.
- -
- Developing a long-term Energy Policy, validated by Chilean society, through a participatory and regional process, among others.
3.2. Payment of Electricity Tariffs of Residential Generators
3.3. Main Provisions of Law No. 20571
3.4. Main Provisions of Law No. 21118 and Its Regulations
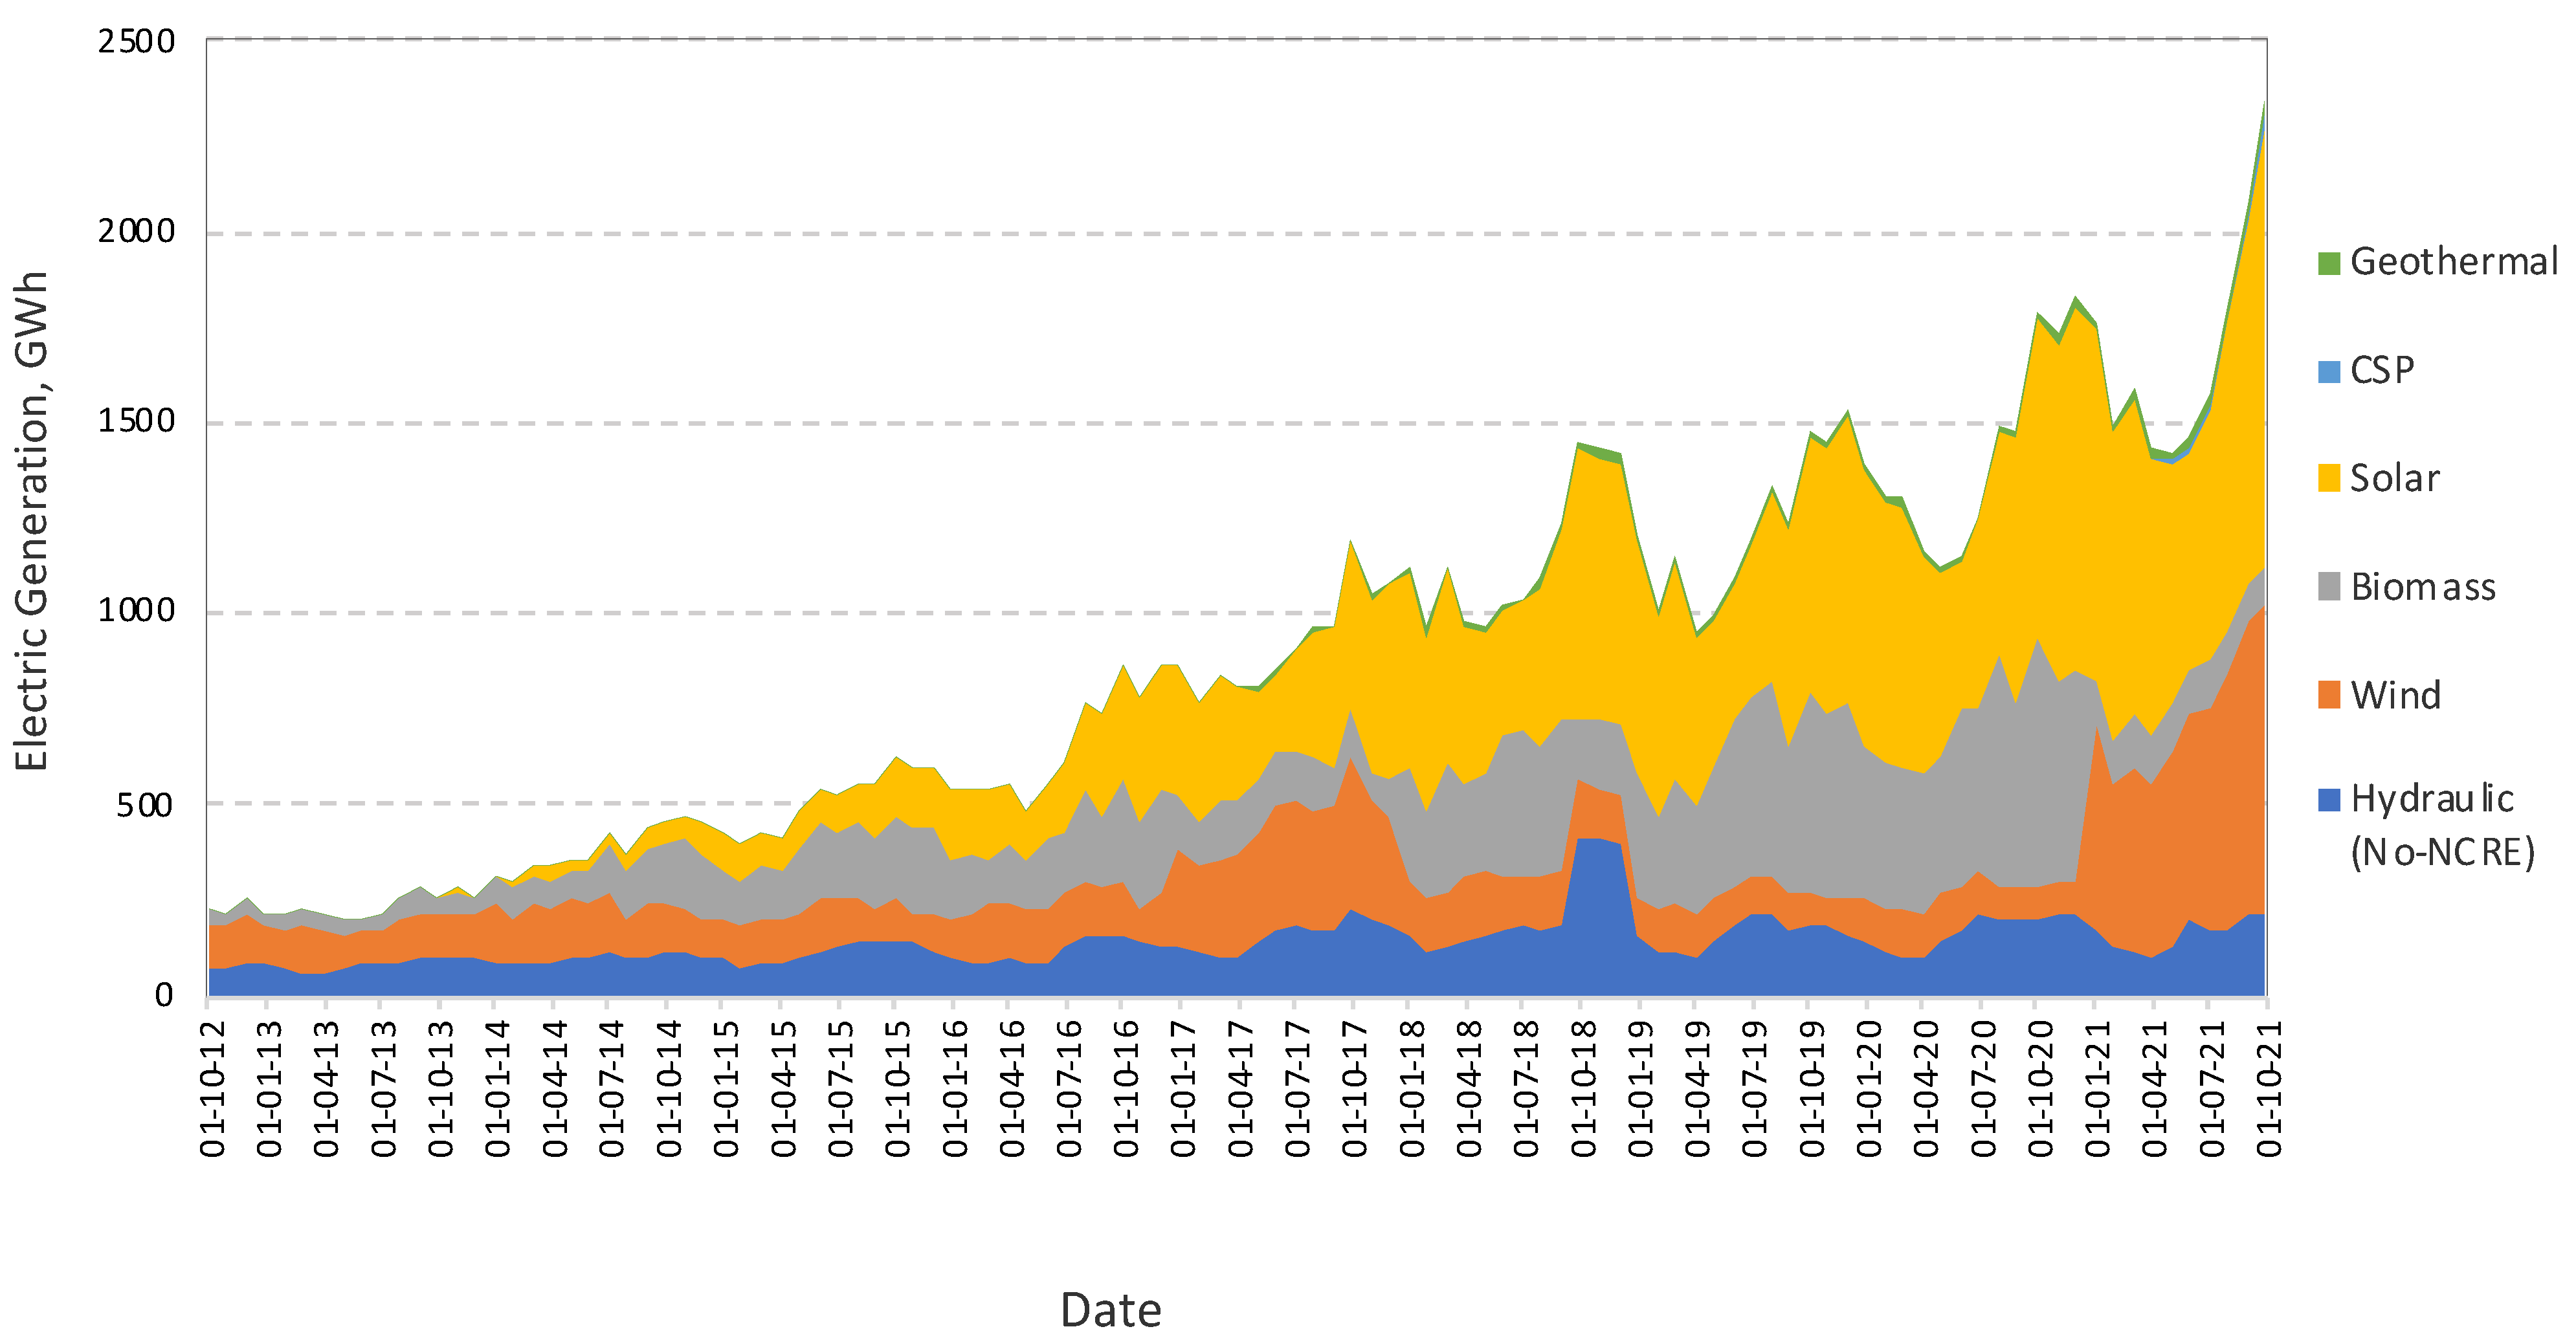
4. Installed Capacity of Solar Photovoltaic Energy in the World and Chile
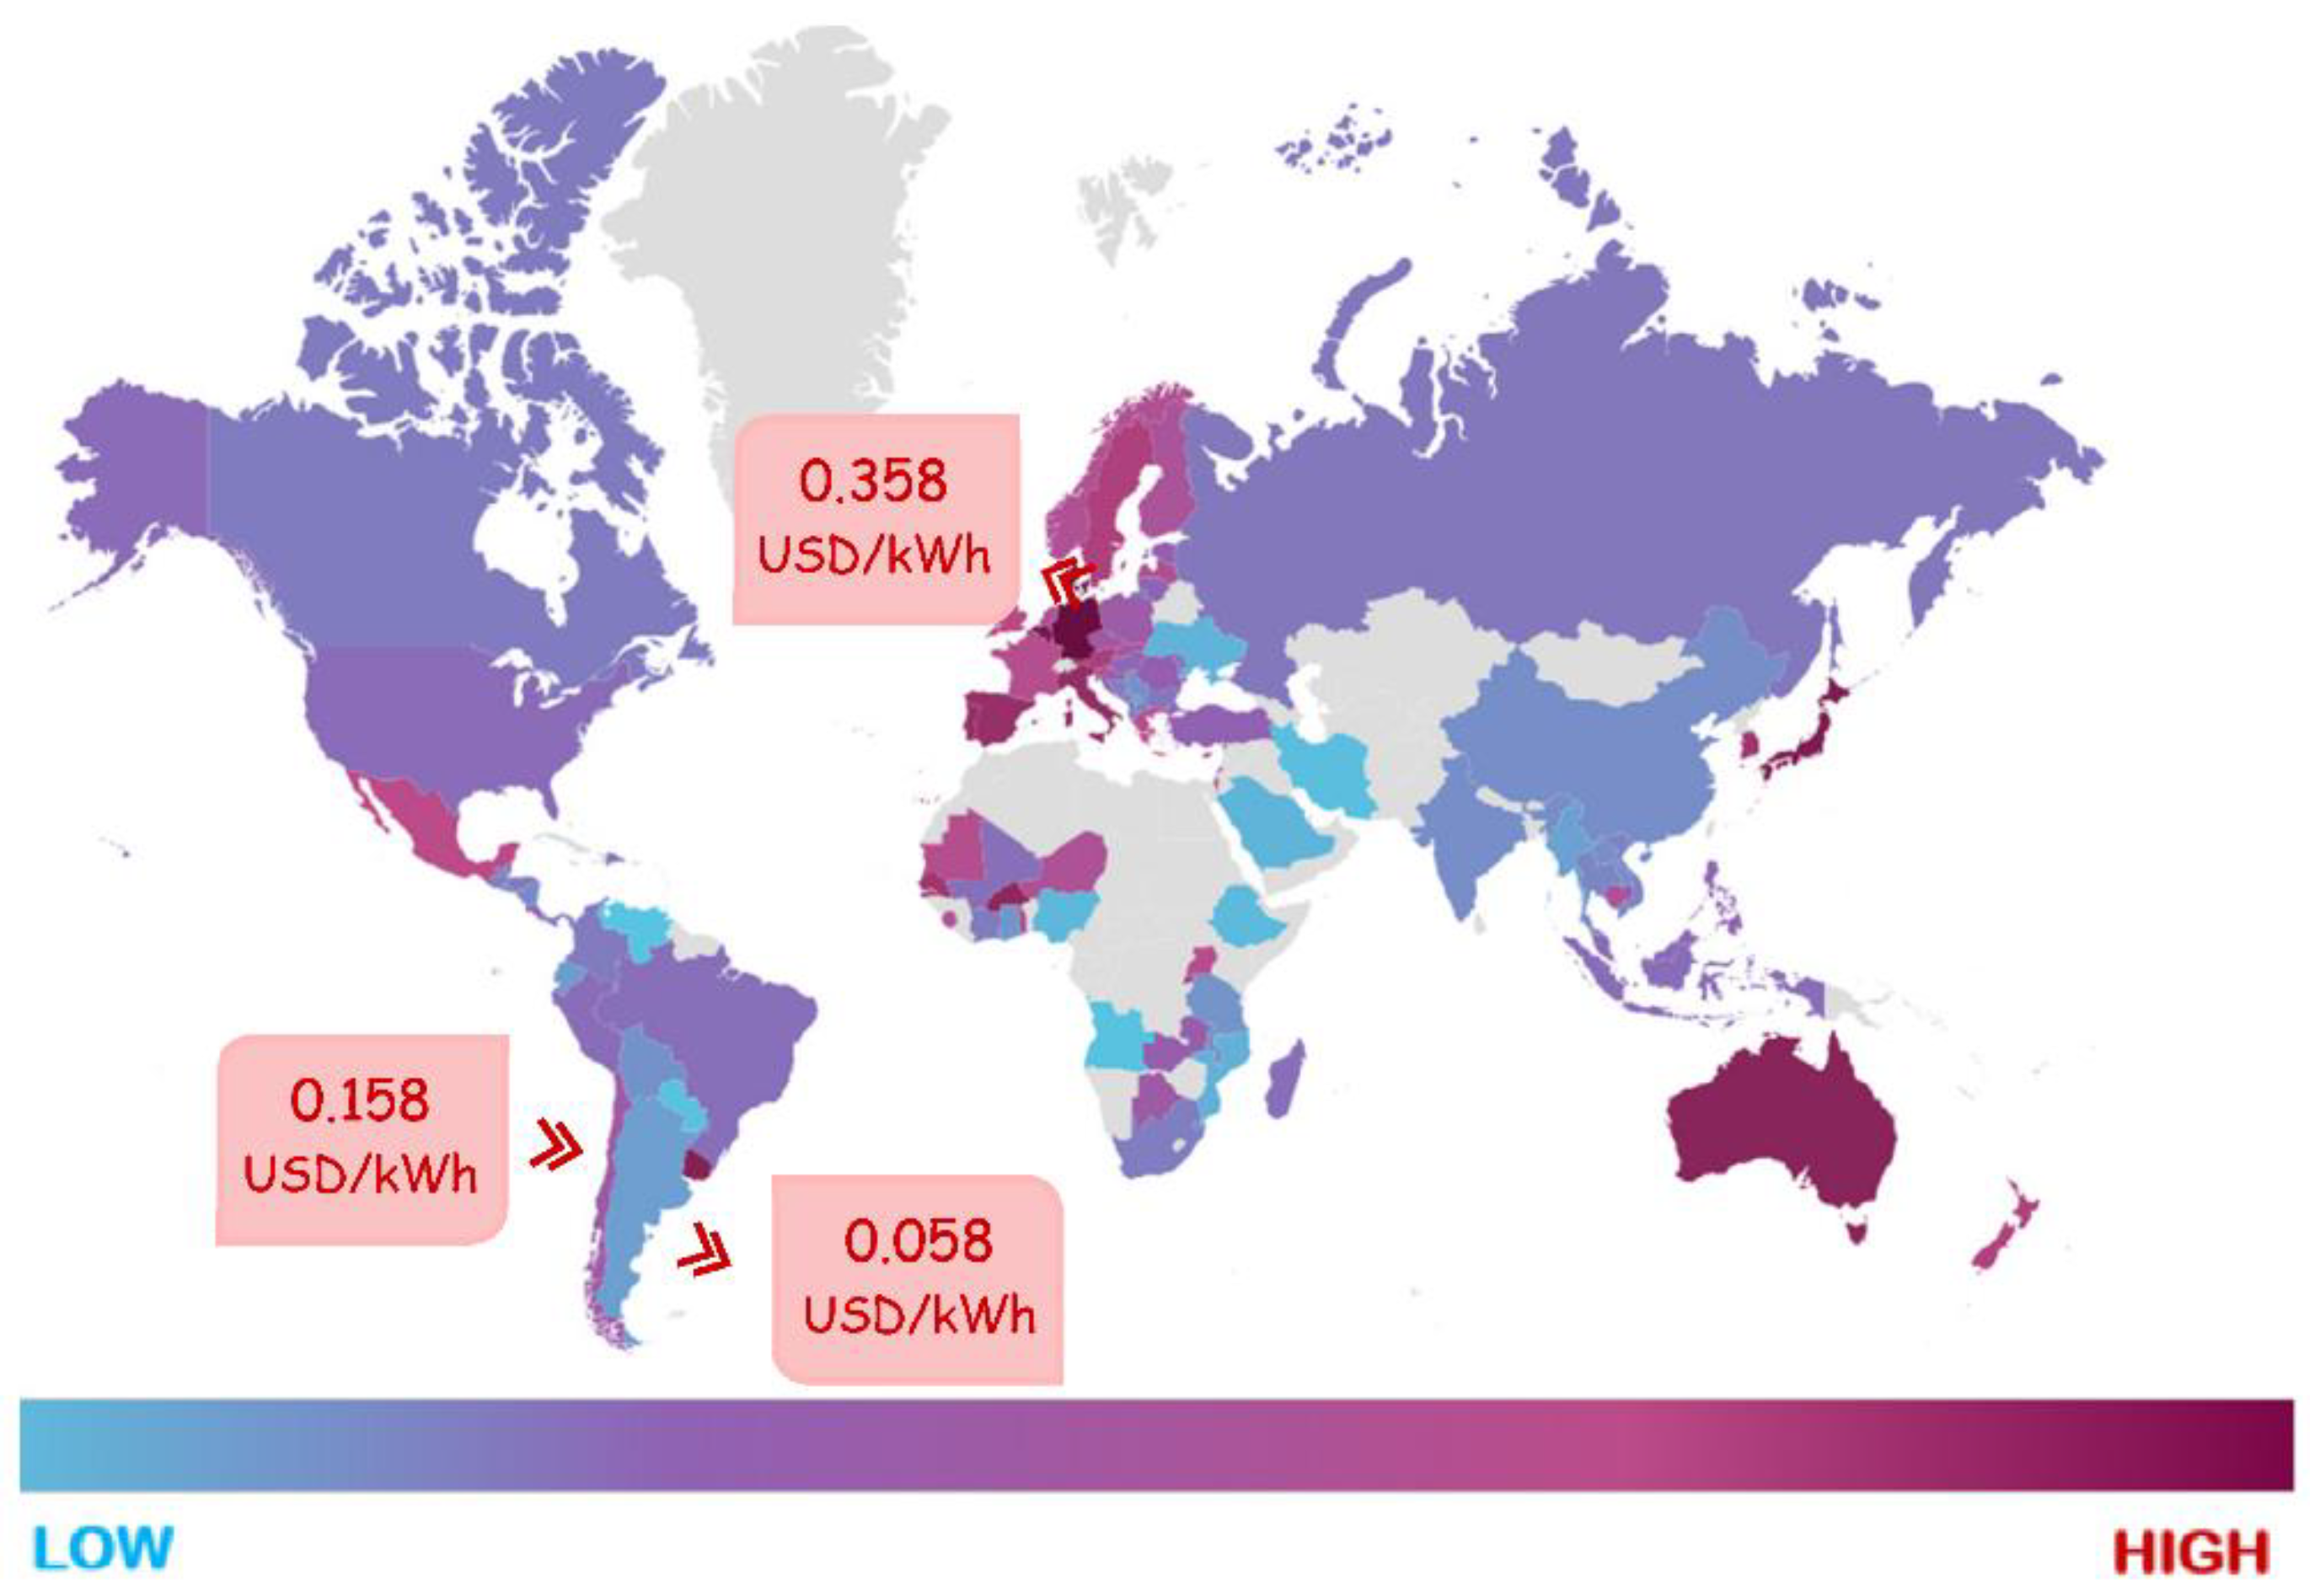
4.1. Cost of Electricity Worldwide
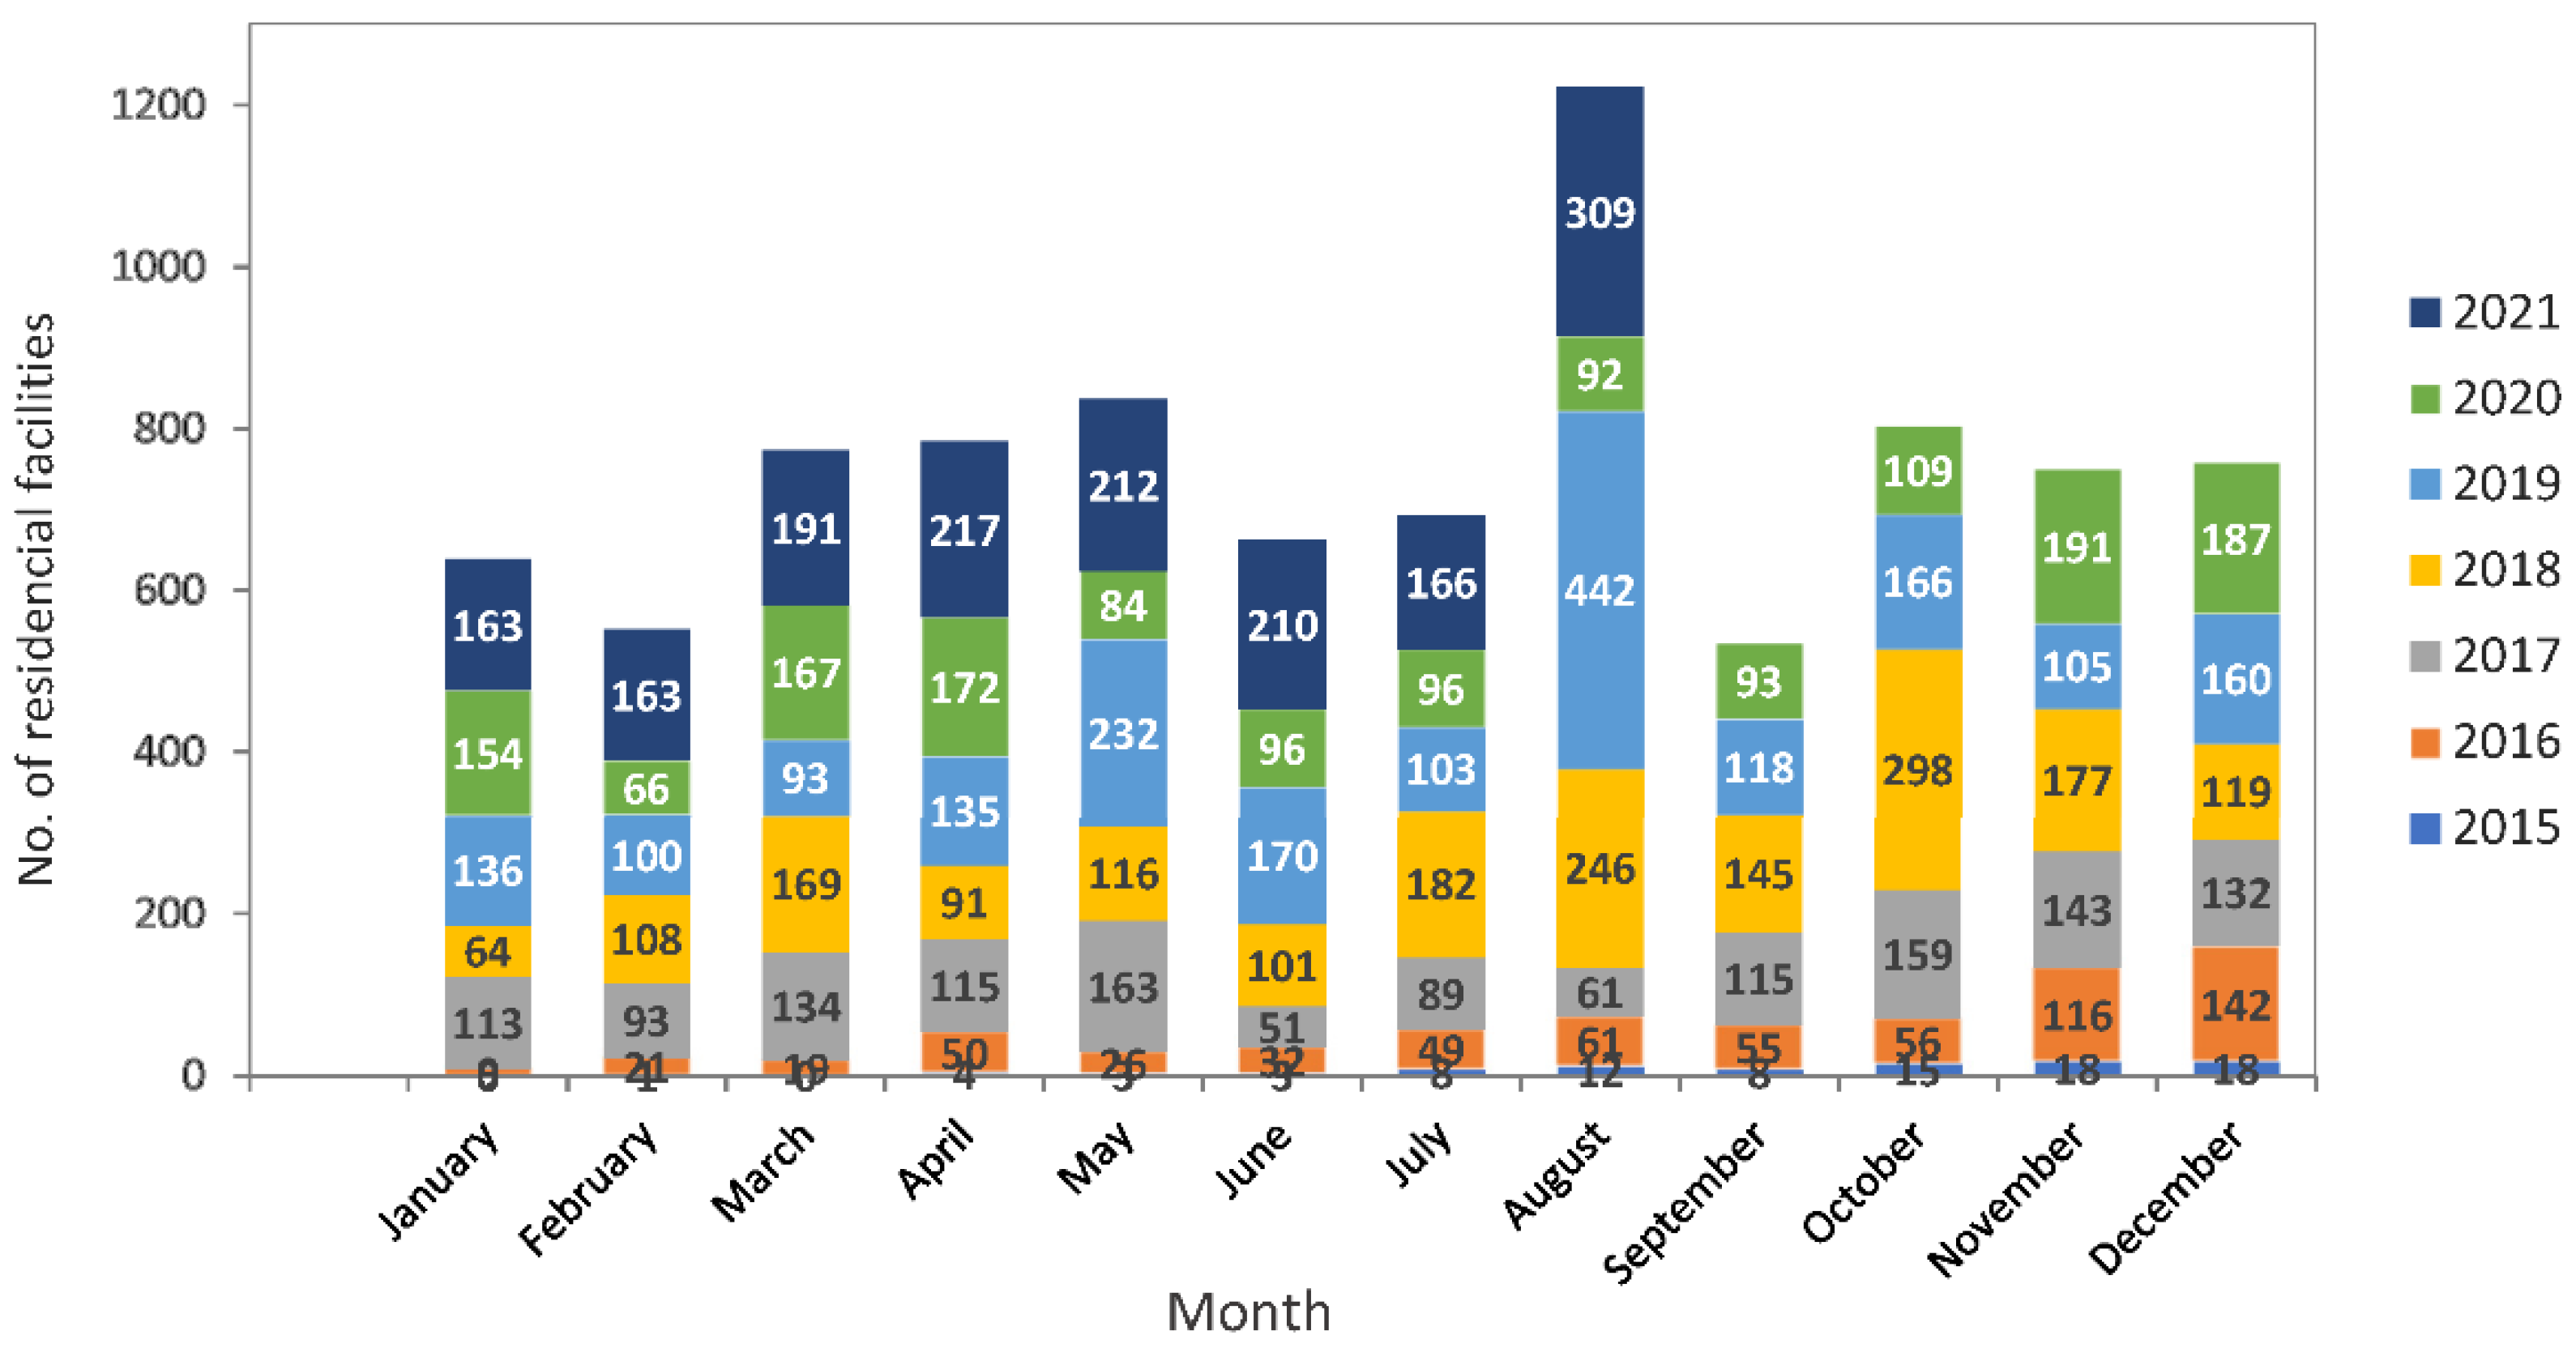
4.2. Facilities Declared before the SEC at National Level
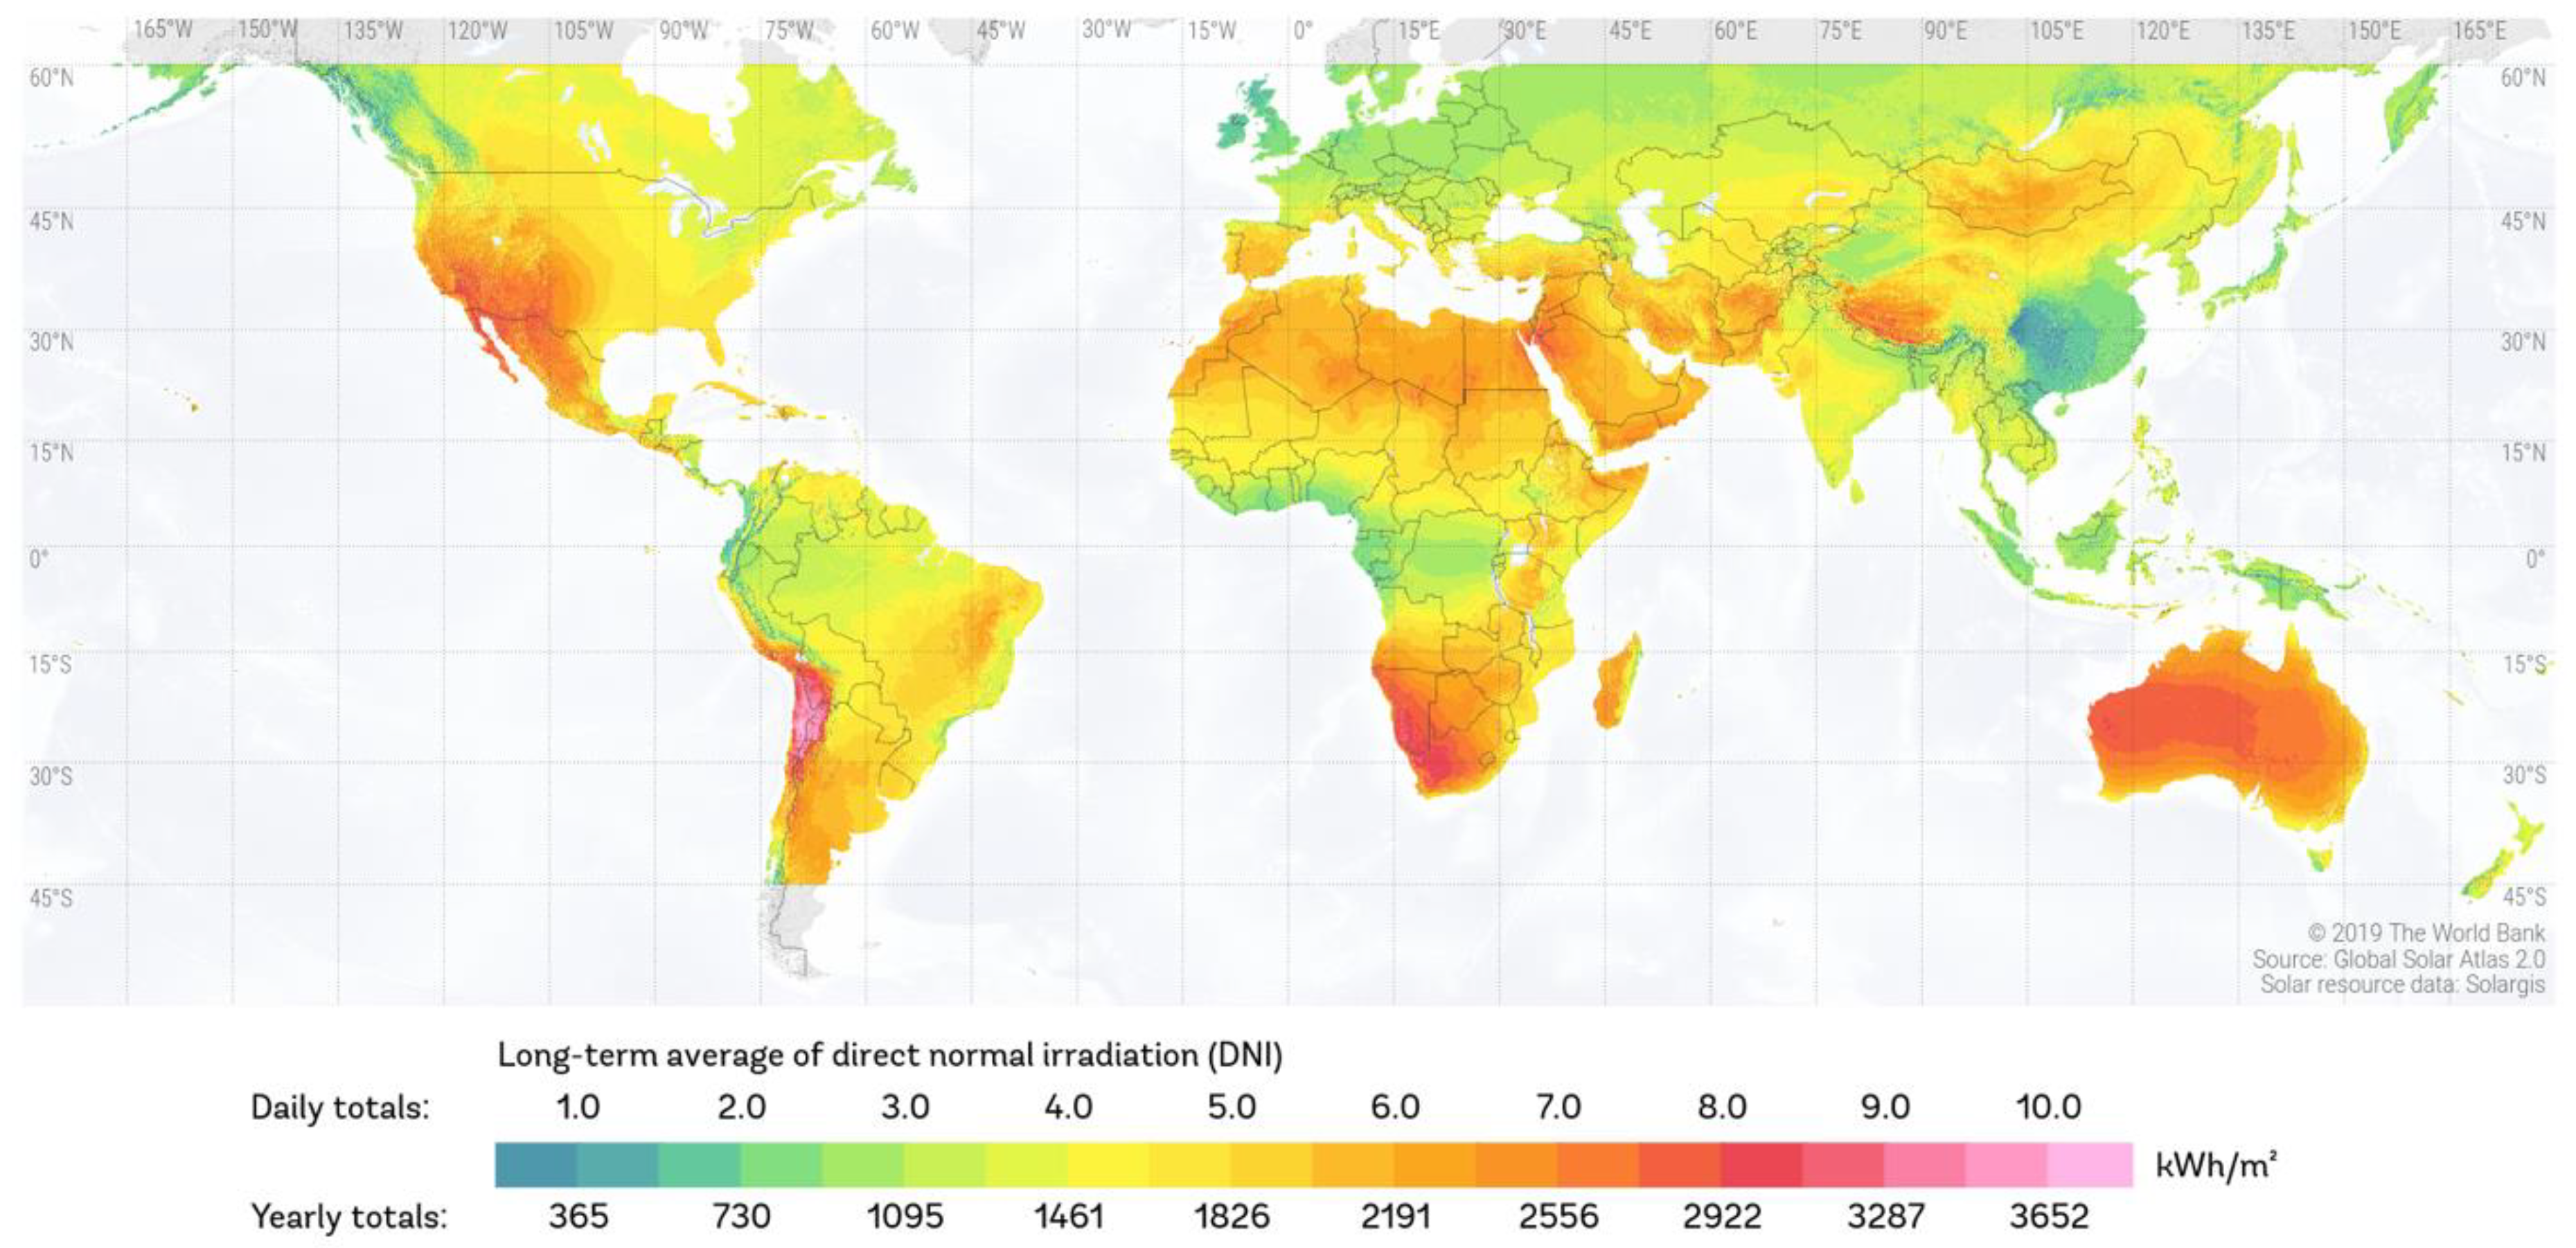
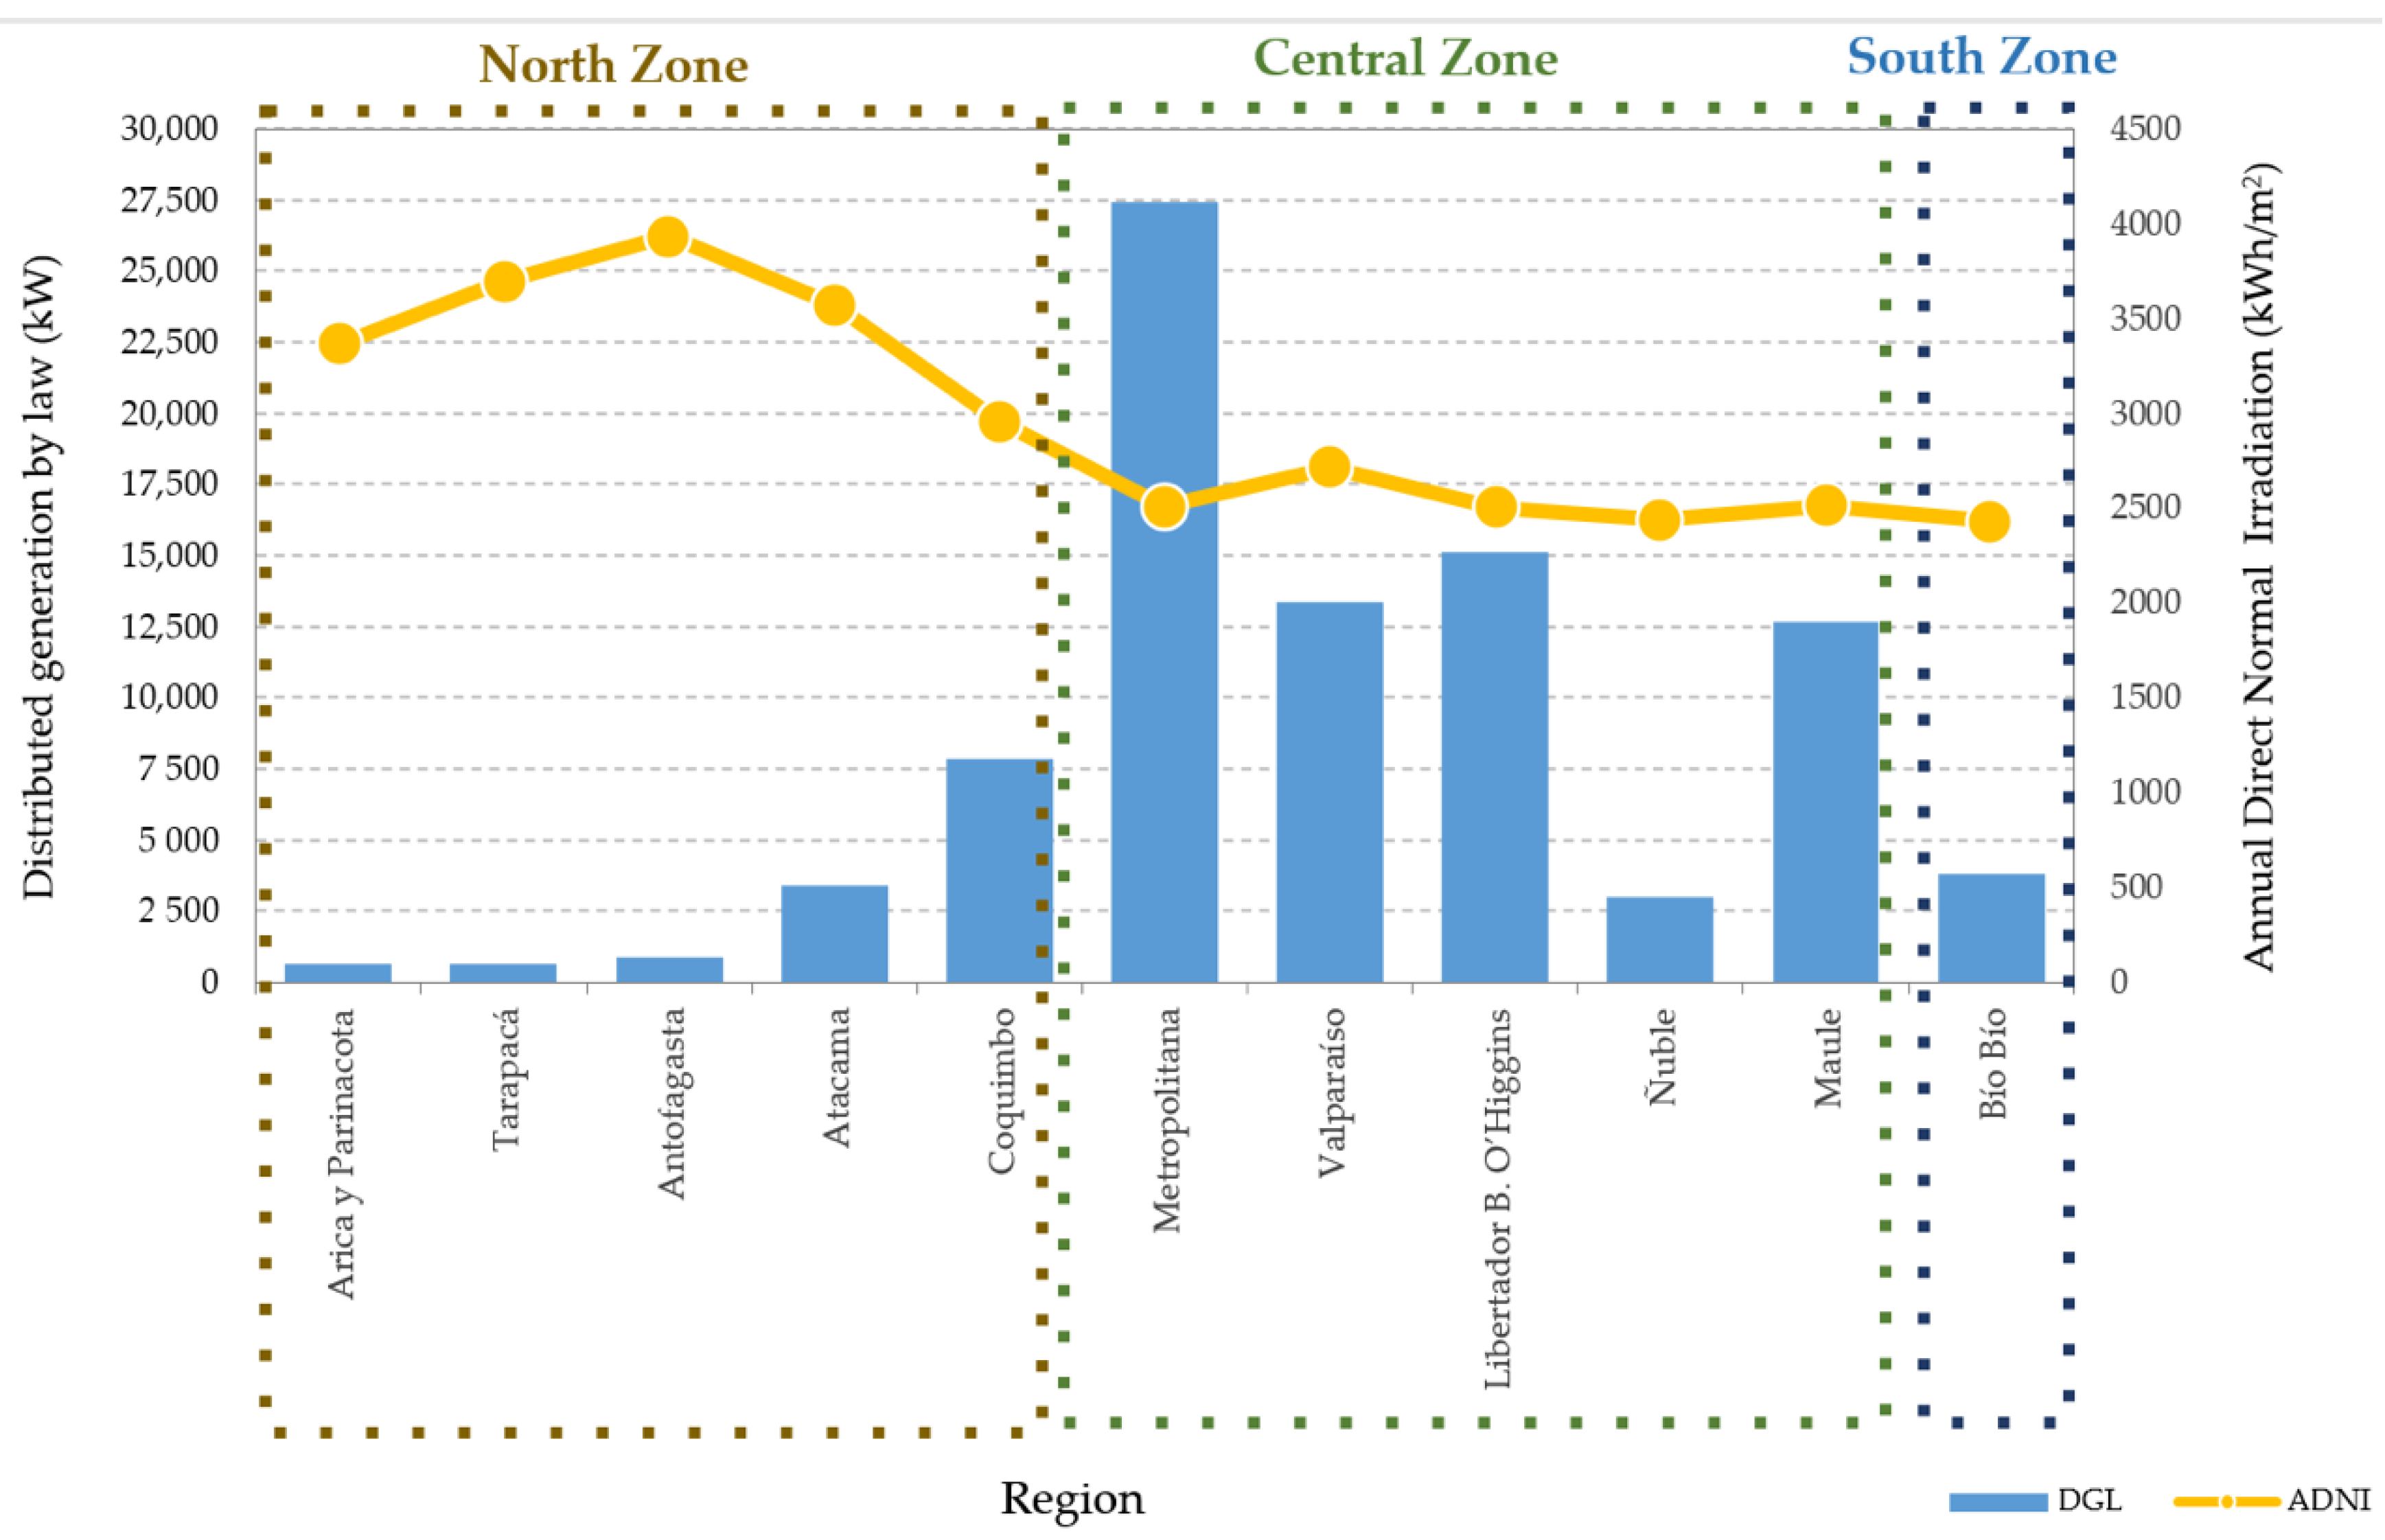
4.3. Solar Radiation Conditions in the City of Arica, Costs, Distributed Generation and Distribution Cases
4.3.1. Solar Radiation and Solar Energy Production Capacity
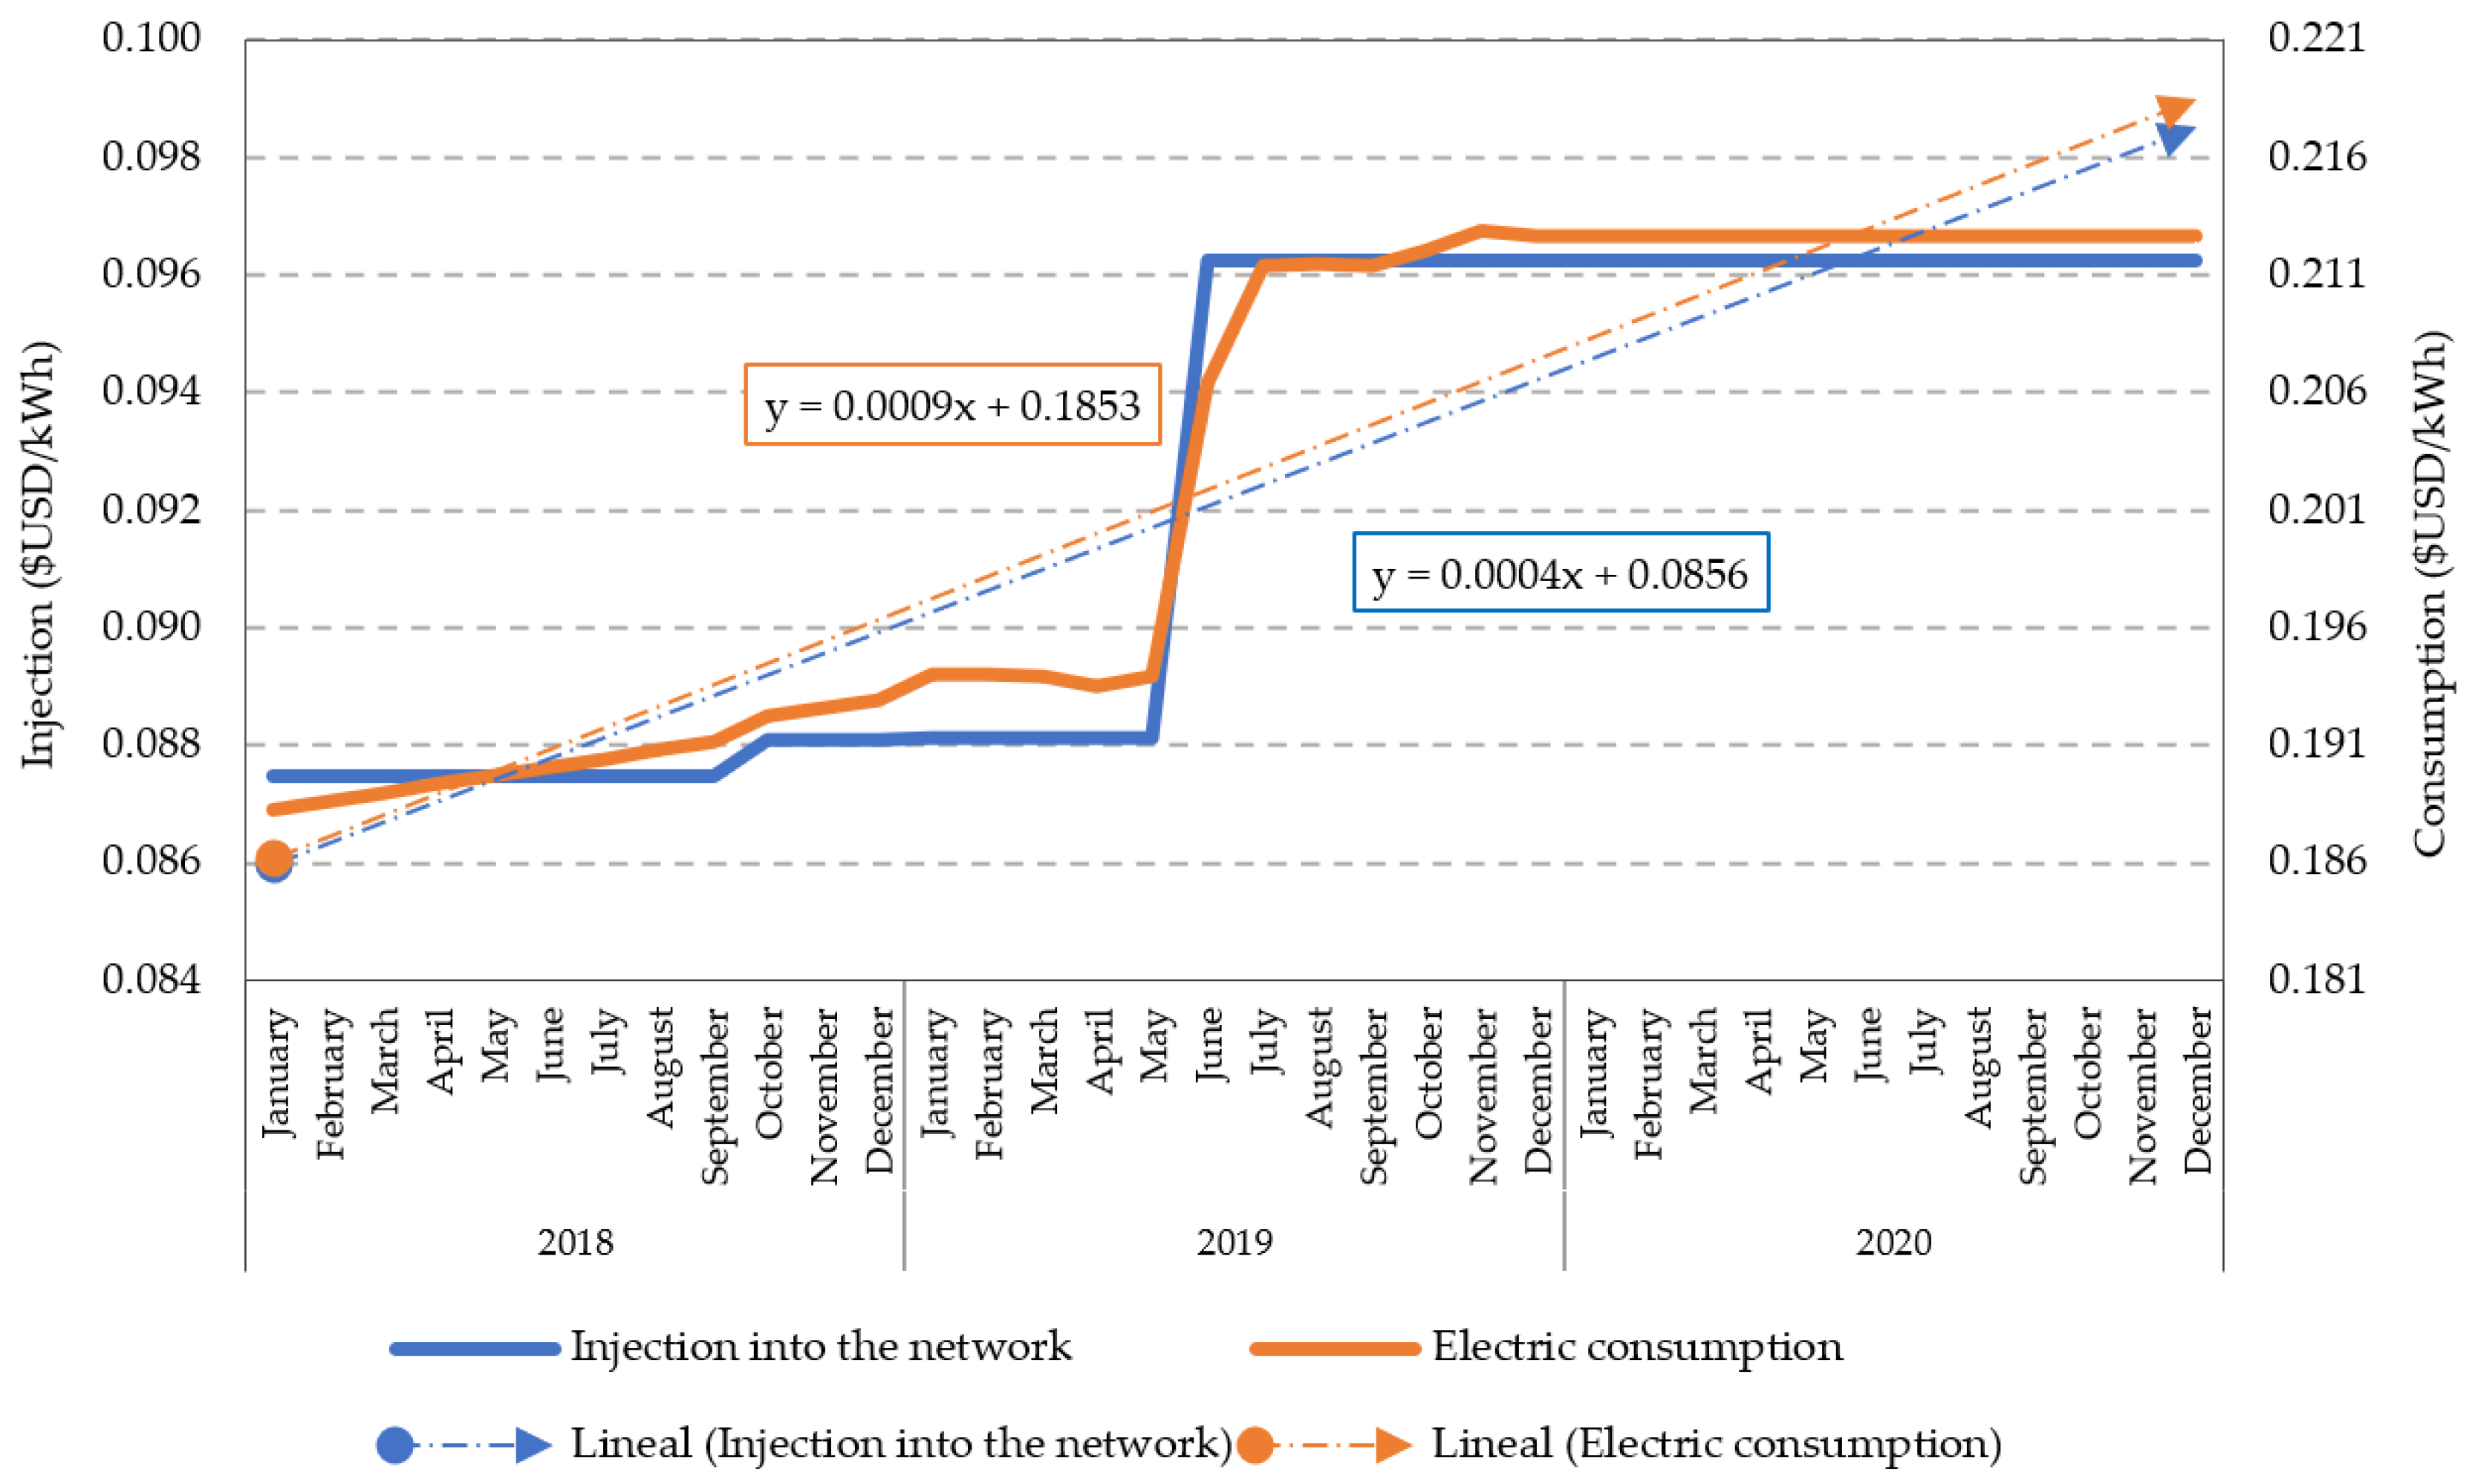
4.3.2. Cost of Electricity
- Monthly Fixed Charge: Billed every month of the year, regardless of the customer’s consumption.
- Lease Charge: Billed every month to customers who choose to lease metering equipment from the company.
- Base Energy Charge: Obtained by multiplying the monthly energy consumed (kWh) by the unit price of basal energy (USD/kWh).
- Additional Energy Charge: It is applied from April to September, when consumption is higher than 430 kWh, and additionally, higher than winter limit.
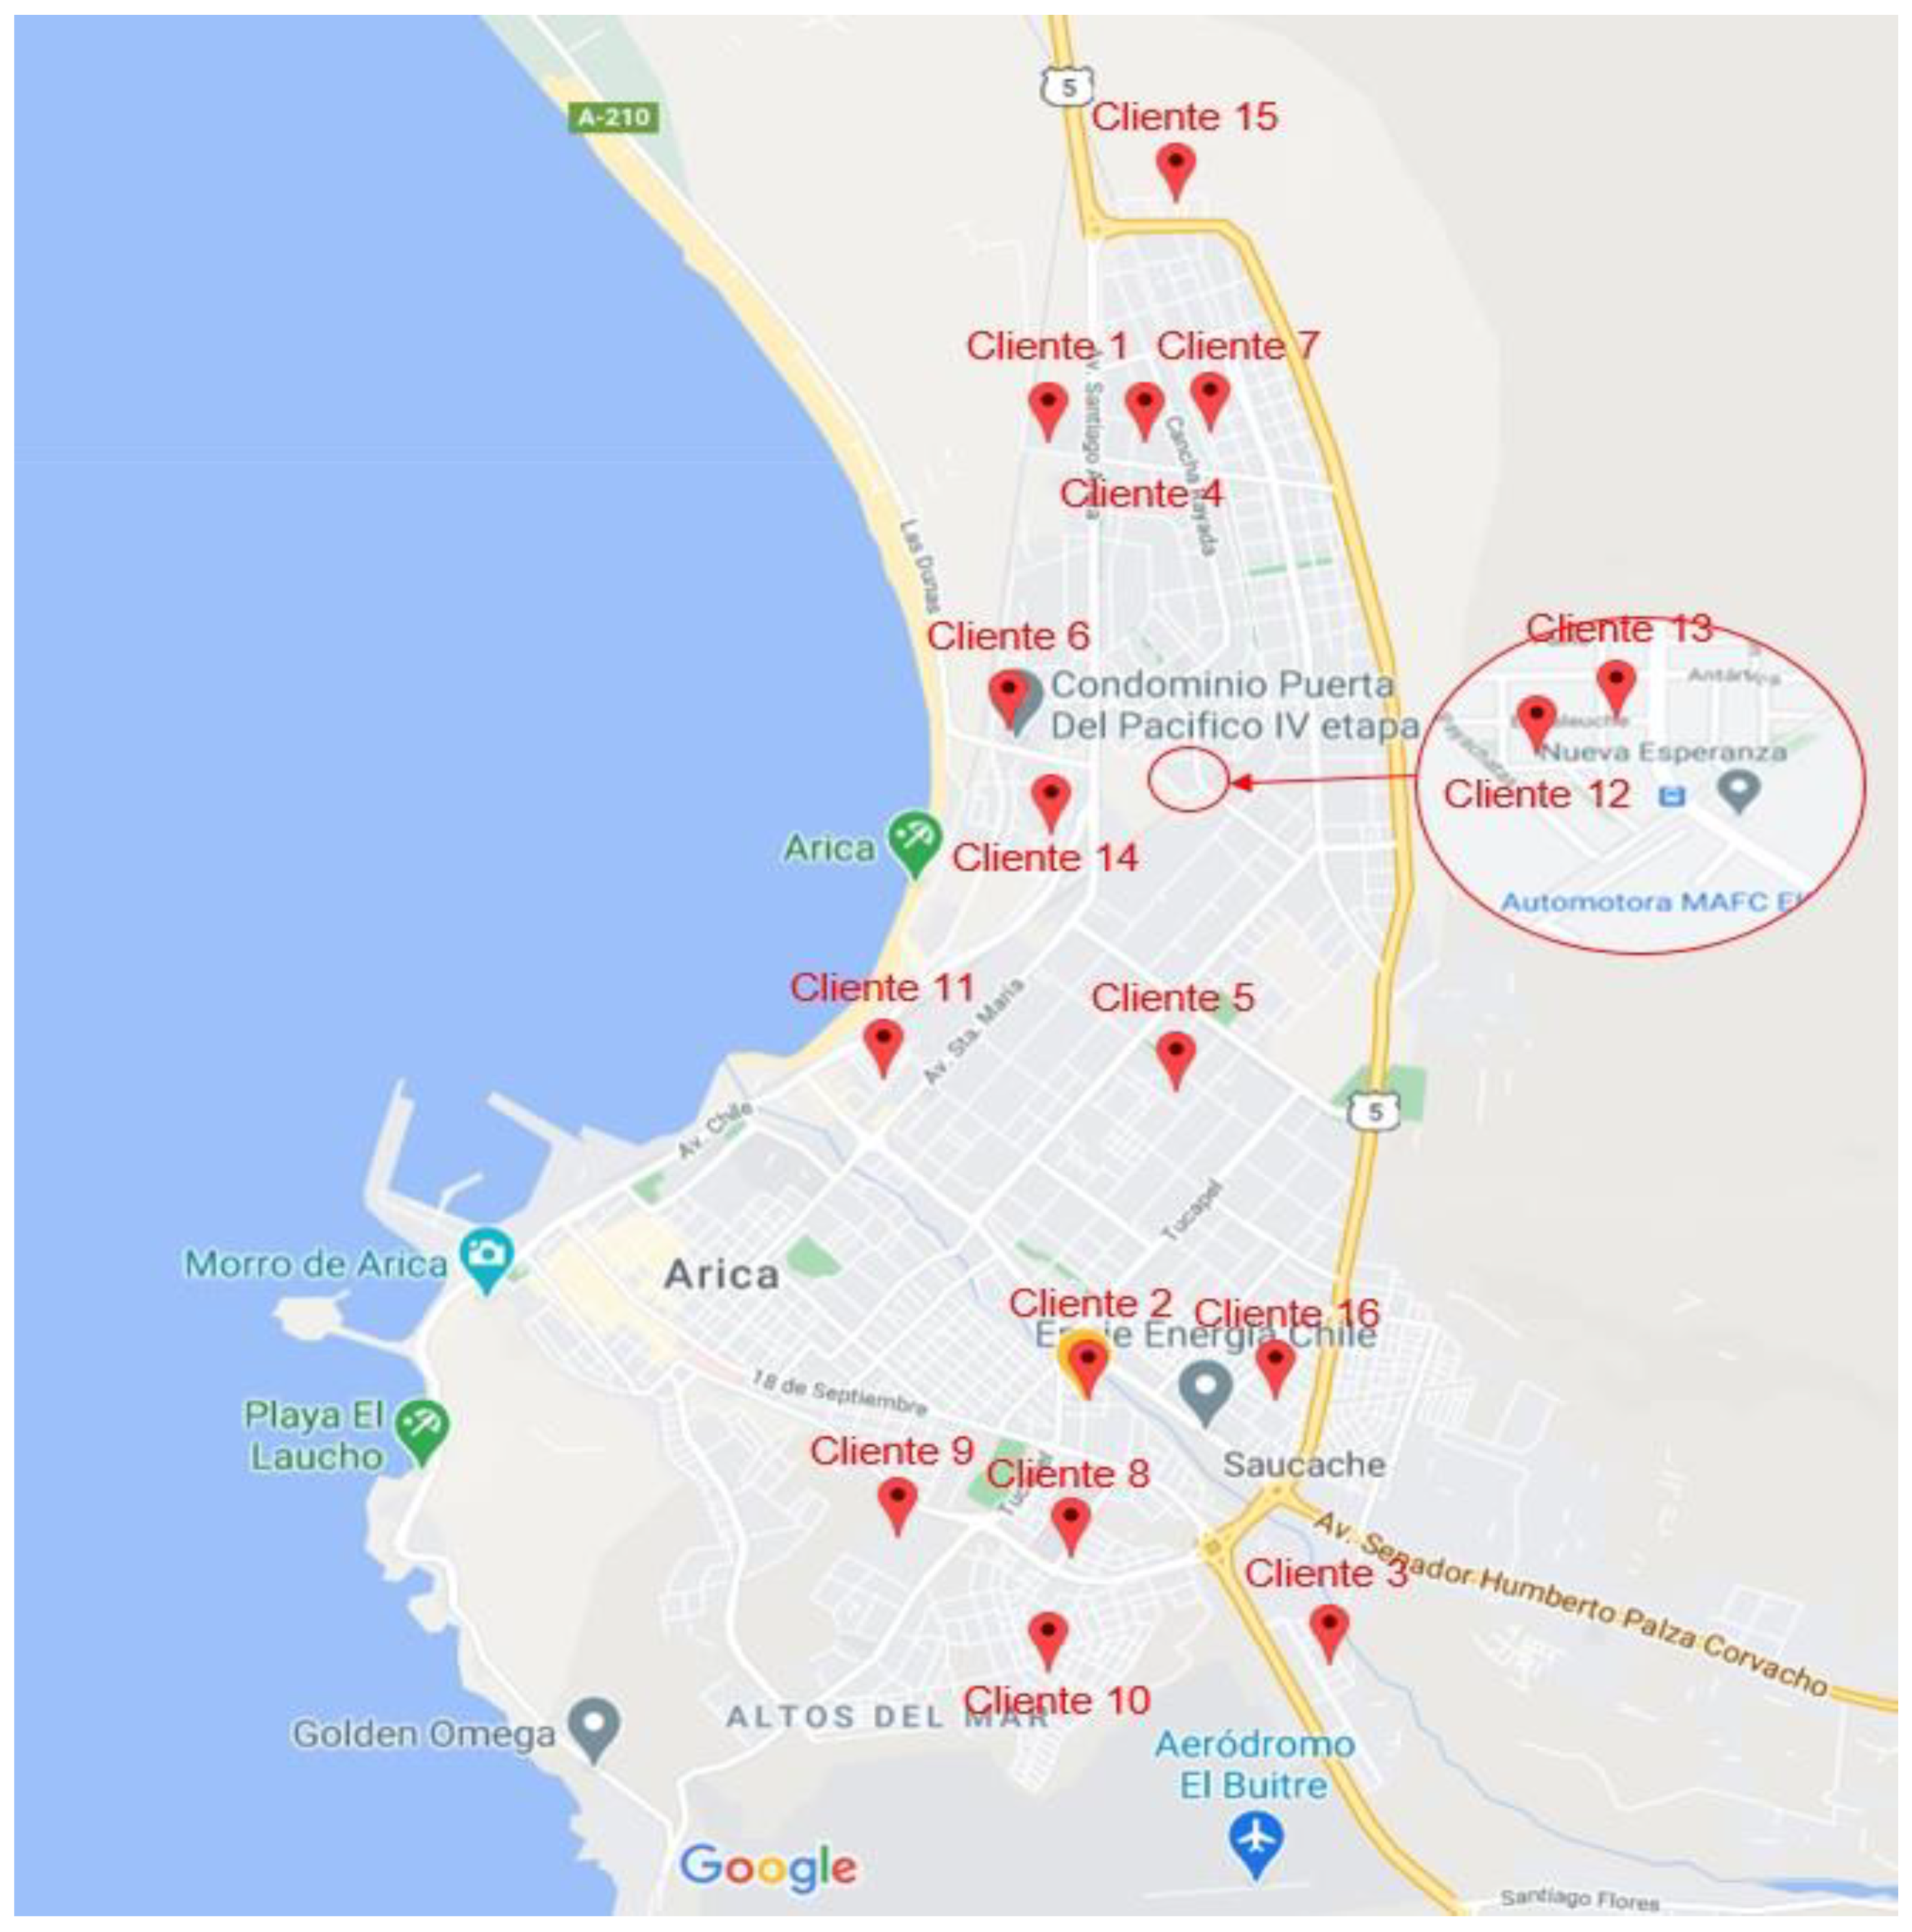
4.3.3. Distributed Generation in the Region of Arica and Parinacota
4.3.4. Cases of Public Distribution
5. Case Studies and Projections
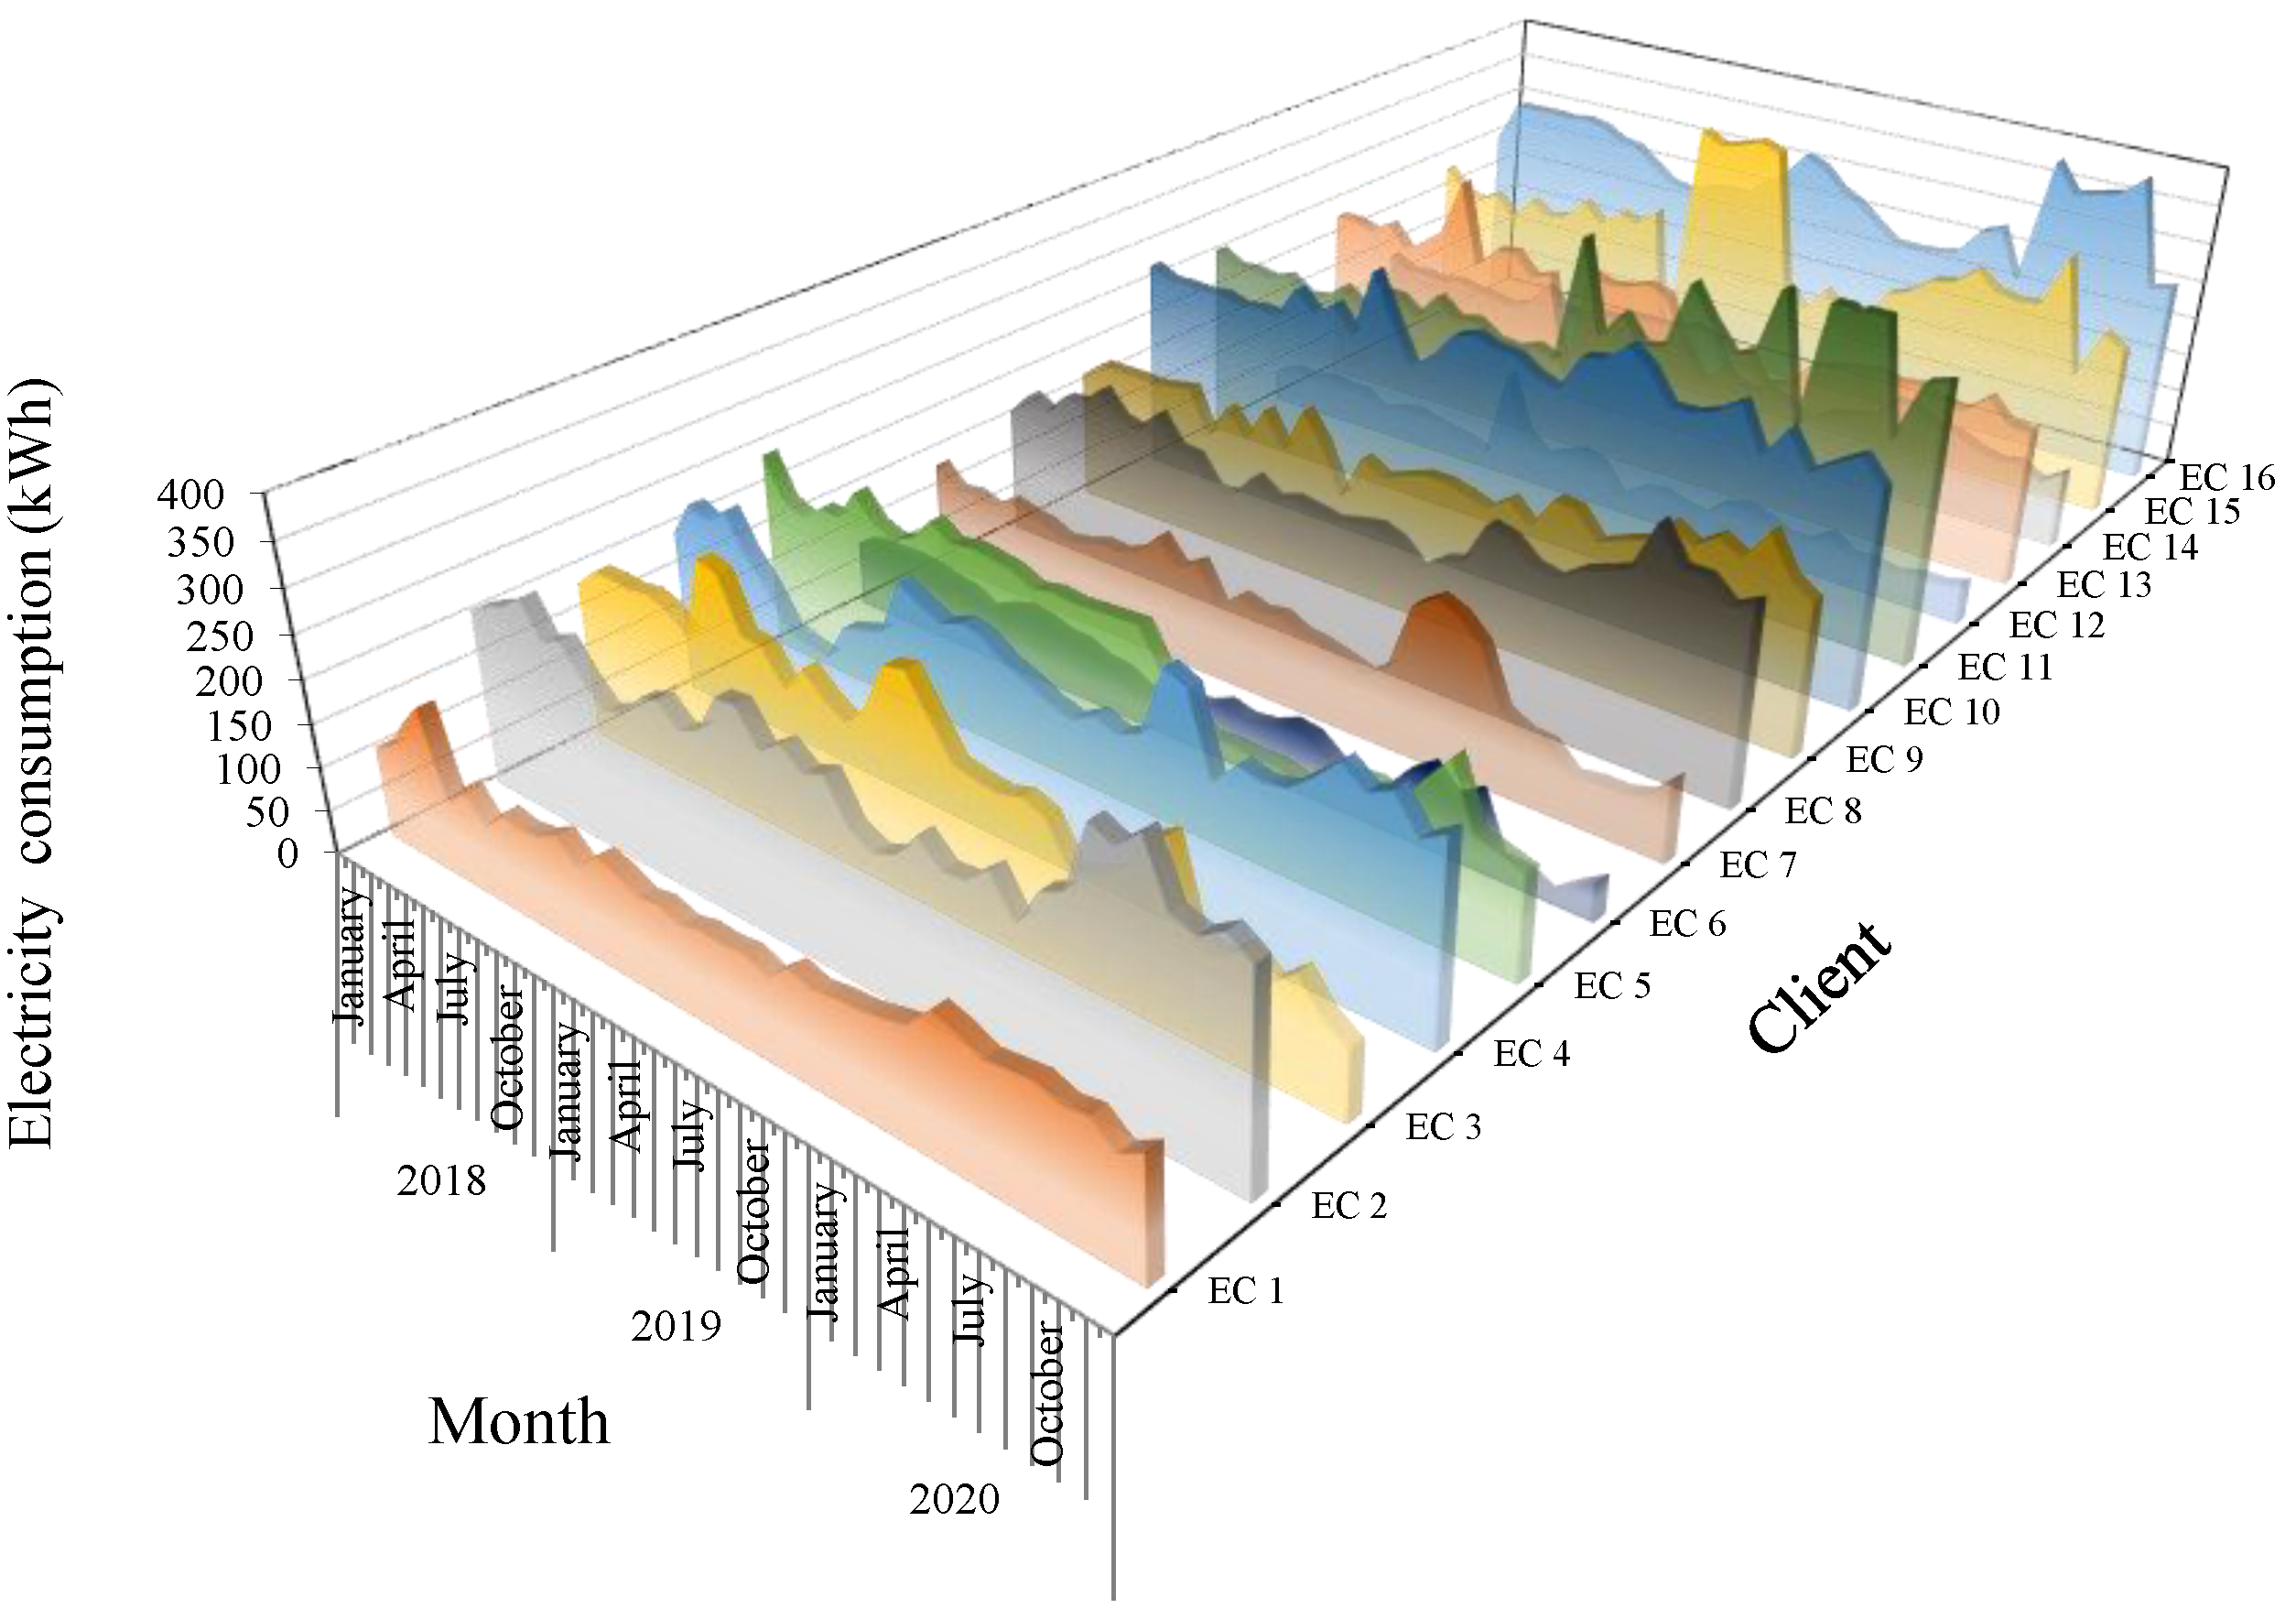
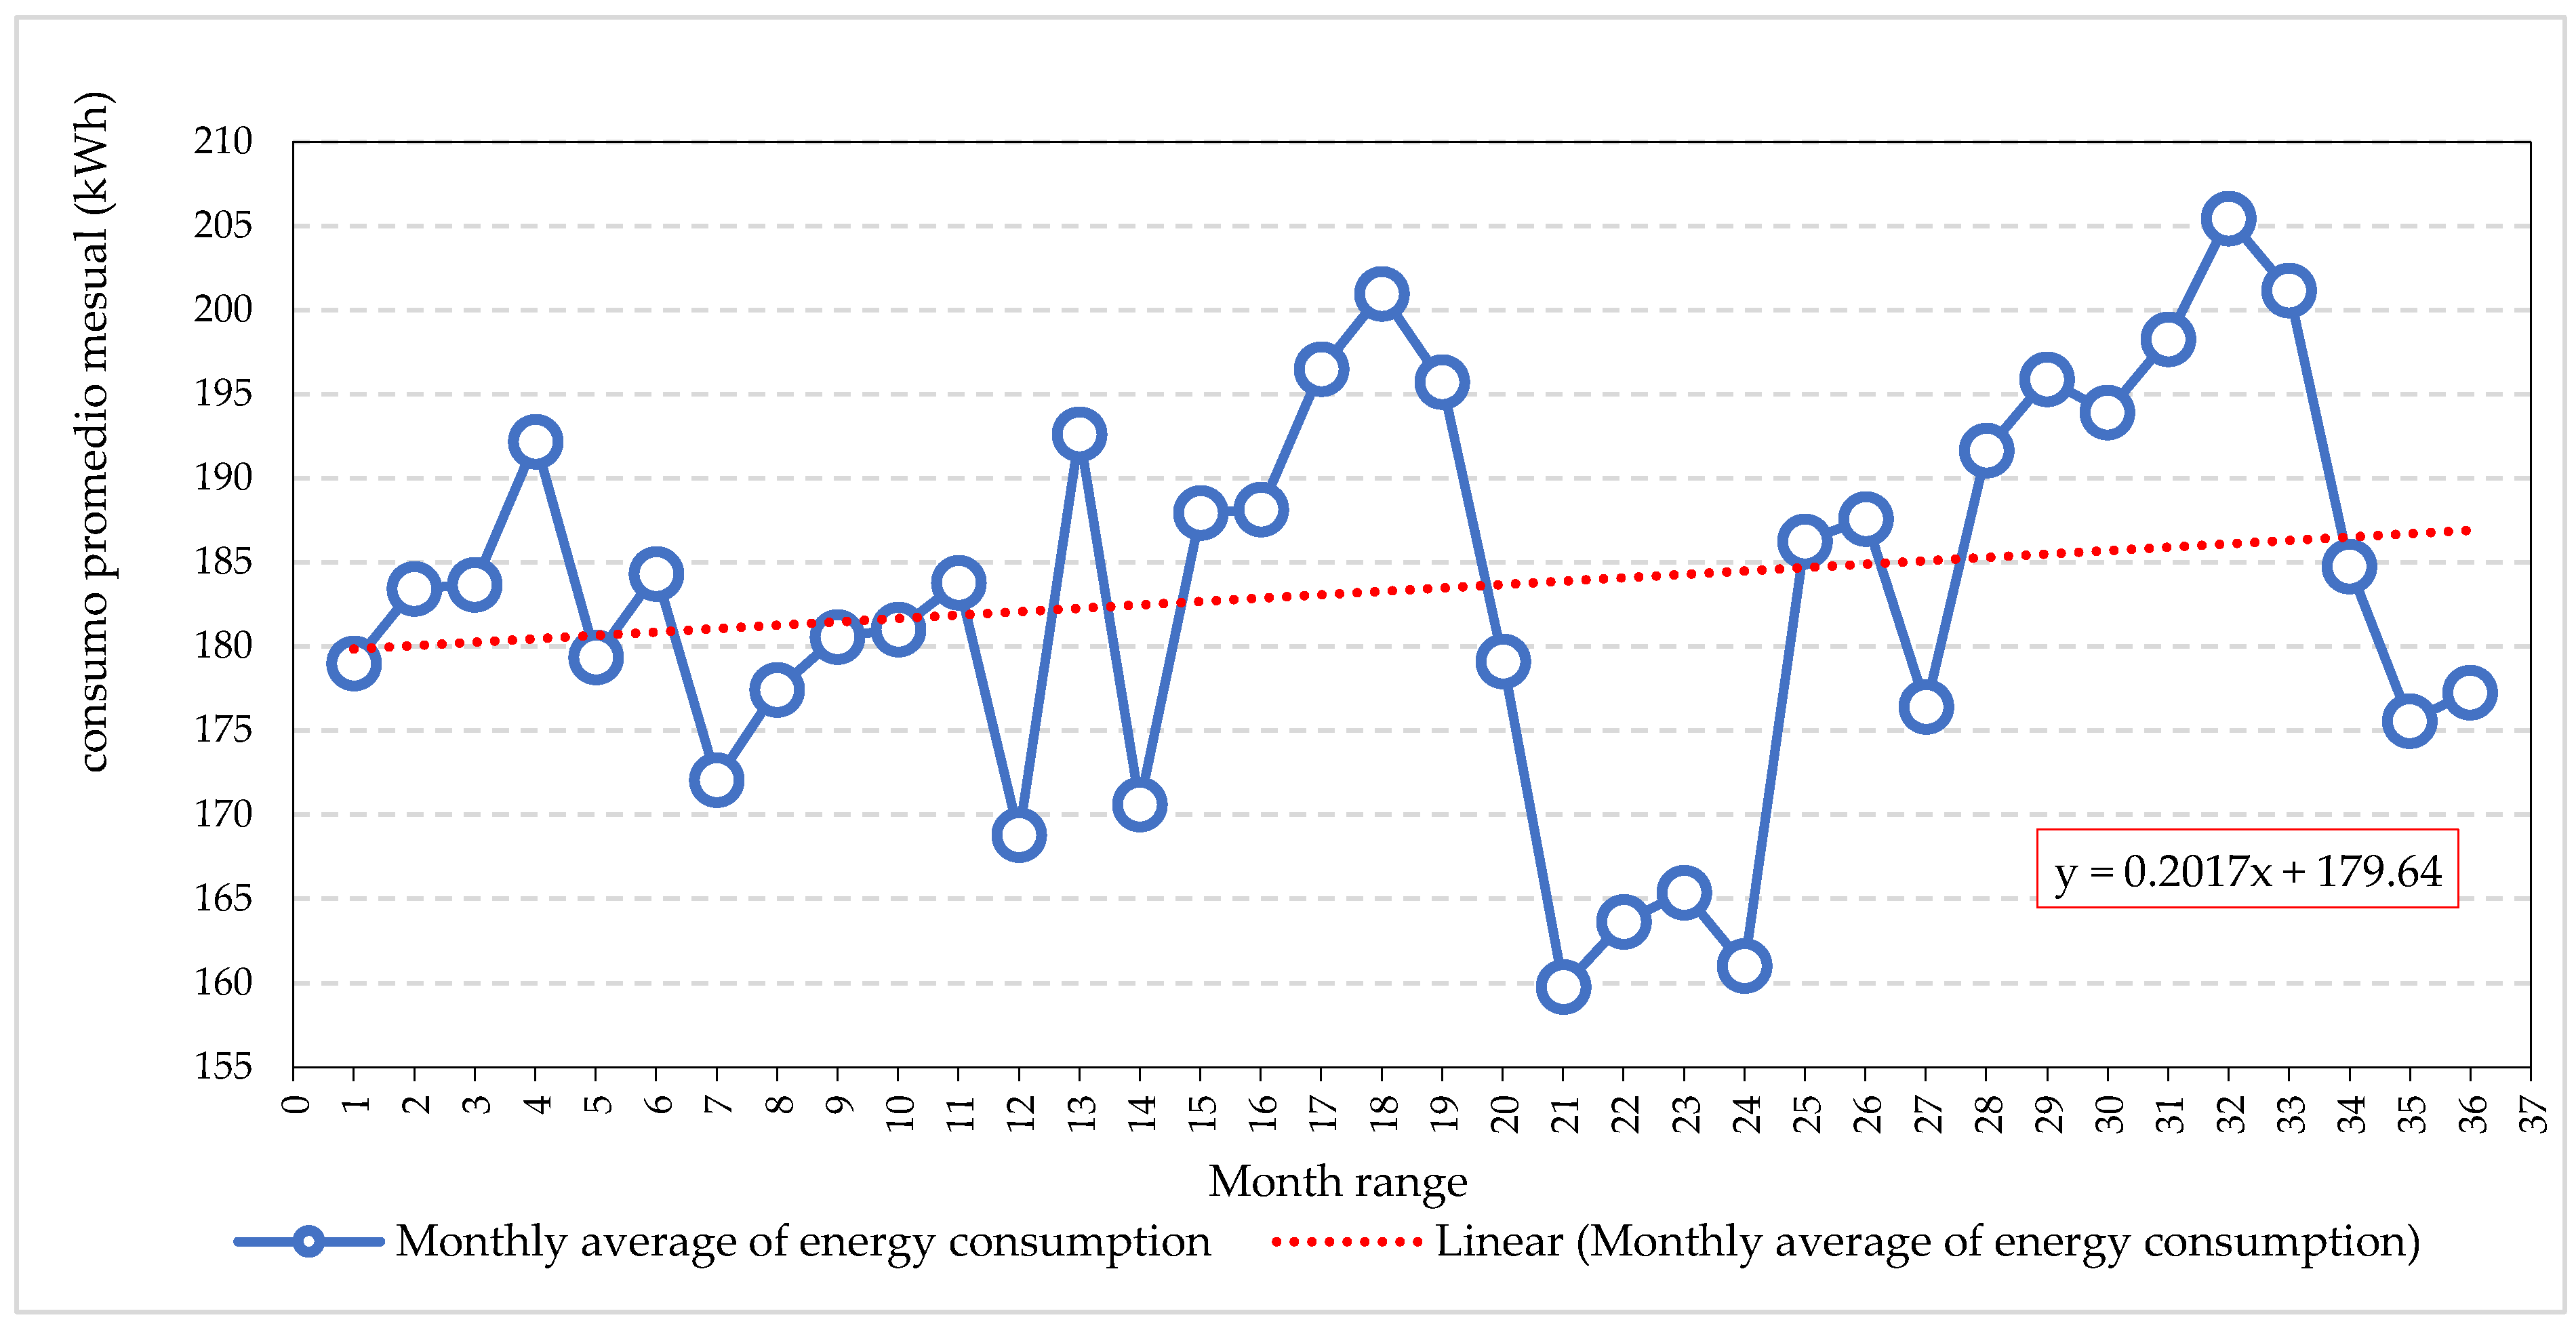
5.1. Current and Projected Energy Consumption in the City of Arica
- Service administration: Fixed monthly charge BT1 (USD/client)
- Electricity transport (USD/kWh): Transmission system use charge, Public service charge, Energy charge, Power purchase charge
- Charge for electricity consumed: Charge for base power in its distribution component (USD/kWh)
5.2. Uncertainties
5.3. Projection of Electricity and Economic Demand in the Region of Arica and Parinacota to 2050
5.3.1. Electricity Demand Projection for 2050
5.3.2. Economic Projection for 2050
- -
- Technical details of polycrystalline solar module KYL-30P
- -
- SUN2000L-2KTL Inverter Technical Details
- -
- System Design (Azimuth = 0, Inclination = 20, Module Area = 11.2 m2)
- -
- Lifetime and Degradation (total annual AC production of the system is 0.5%/year, typical for PV)
- Nominal Energy of the plane of the array (POA): 27,936 (kWh). The percentage of energy loss are: 0% shading, 5% Soiling and 2.542% Reflection;
- Nominal DC Energy: 4398 (kWh). The percentage of energy loss are: 0% Snow, 6.34% Module deviation from STC (standard test conditions), 0% Inverter MPPT clipping, 2% Module mismatch, 0.5% Diodes and connections, 2% DC wiring, 0% Tracking error, 0% Nameplate, 0% DC power optimizer, 0% DC availability and curtailment, and 0% DC Lifetime daily losses- year one;
- Net DC energy: 3937 (kWh). The percentage of energy loss are: 0% Inverter power clipping, 0% Inverter power consumption, 0.11% Inverter nighttime consumption, and 1.601% Inverter efficiency;
- Gross AC energy: 3869 (kWh). The percentage of energy loss are: 1% AC wiring, 0% AC Lifetime daily losses; year one, 0% Transformer loss, 0% AC Availability and curtailment, 0% Grid interconnection limit;
- Annual energy (kWh): 3830.
6. Discussion and Comments
7. Conclusions
Author Contributions
Funding
Institutional Review Board Statement
Informed Consent Statement
Data Availability Statement
Acknowledgments
Conflicts of Interest
Abbreviations
| AC | Alternating current |
| BT1 | It is the base monomic electricity tariff in Chile for household customers at low voltage (BT: baja tensión). |
| CGE | Compañía General de Electricidad Industrial S.A, electric company of the city of Arica, Chile. |
| CNE | Comisión Nacional de Energía (National Energy Commission) |
| CSV | Comma-Separated Value format |
| DGL | Distributed Generation Law |
| FLBPV | Bill without PV |
| FLWPV | Bill with PV |
| GDP | Gross domestic product |
| GHG | Greenhouse Gas |
| LCOE | Levelized Cost of Energy |
| LEAP | Long-Range Energy Alternatives Planning System |
| Mini–Hydro | Mini-hydraulic power plant |
| NaN | Not a Number |
| NCRE | Non-Conventional Renewable Energies |
| NPV | Net present value |
| OECD | Organization for Economic Co-operation and Development |
| O&M | Operation and Maintenance |
| PV system | Solar Photovoltaic System |
| SAM | System Advisor Model |
| SERC-Chile | Chilean Solar Energy Research Center |
| PV | System Photovoltaic |
| SEC | Superintendencia de Electricidad y Combustibles (Superintendency of Electricity and Fuels) |
| VAT | Value Added Tax |
References
- Banco Mundial. Energía. Panorama General. 2018. Available online: https://www.bancomundial.org/es/topic/energy/overview (accessed on 3 June 2021).
- Naciones Unidas. Goal 7. Ensure Access to Affordable, Reliable, Sustainable and Modern Energy for All. Sustainable Development Goals; División de Estadística de las Naciones Unidas (UNSD): New York, NY, USA, 2021; Available online: https://unstats.un.org/sdgs/report/2019/goal-07/ (accessed on 5 April 2021).
- Banco Mundial. Datos. Producción de Electricidad a Partir de Fuentes de Petróleo, Gas y Carbón (% del Total). Grupo Reporte Mundial. 2019. Available online: https://datos.bancomundial.org/indicator/EG.ELC.FOSL.ZS?end=2015&start=1960 (accessed on 10 January 2021).
- Kibria, A.; Sherzod, B.; Akhundjanov, S.B.; Oladi, R. Fossil fuel share in the energy mix and economic growth. Int. Rev. Econ. Financ. 2019, 59, 253–264. [Google Scholar] [CrossRef]
- NDC. Contribución Determinada a Nivel Nacional de Chile. 2020. Available online: https://mma.gob.cl/wp-content/uploads/2020/04/NDC_Chile_2020_espan%CC%83ol-1.pdf (accessed on 15 April 2021).
- Ministerio de Energía. Energía 2050, Política Energética de Chile; Ministerior de Energía: Santiago, Chile, 2015; p. 46. Available online: http://www.energia.gob.cl/sites/default/files/energia_2050_-_politica_energetica_de_chile.pdf (accessed on 10 February 2021).
- Simsek, Y.; Lorca, A.; Urmee, T.; ABahrid, P.; Escobar, R. Review and assessment of energy policy developments in Chile. Energy Policy 2019, 127, 87–101. [Google Scholar] [CrossRef]
- Gobierno de Chile. Estrategia Nacional de Energía, 2012–2030. Energía para el futuro. Available online: https://mma.gob.cl/wp-content/uploads/2014/10/3_Estrategia-Nacional-de-Energia-2012-2030_Energia-para-el-Futuro.pdf (accessed on 2 June 2021).
- Ministerio de Economía, Fomento y Reconstrucción. Ley Ernc 20.257. Introduce Modificaciones a la Ley General de Servicios Eléctricos Respecto de la Generación de Energía Eléctrica con Fuentes de Energías Renovables no Convencionales; Ministerio de Economía, Fomento y Reconstrucción: Santiago, Chile, 2008. Available online: https://www.bcn.cl/leychile/navegar?idNorma=270212&idVersion=2013-10-22&idParte=8021629 (accessed on 25 September 2021).
- Comisión Nacional de Energía. Energia Abierta. Cumplimiento de Ley ERNC 20.257. 2021. Available online: http://datos.energiaabierta.cl/dataviews/92666/cumplimento-de-ley-ernc-20257/ (accessed on 25 September 2021).
- Cornejo, L.; Martín-Pomares, L.; Alarcón, D.; Blanco, J.; Polo, J. A Through analysis of solar irradiation measurements in the region of Arica Parinacota, Chile. Renew. Energy 2017, 112, 197–208. [Google Scholar] [CrossRef]
- Cornejo-Ponce, L.; Moraga-Contreras, C.; Vilca-Salinas, P. Analysis of Chilean legal regime for brine obtained from desalination processes. Desalination Water Treat. 2020, 203, 91–103. [Google Scholar] [CrossRef]
- Haas, J.; Palma-Behnke, R.; Valencia, F.; Araya, P.; Díaz-Ferrána, G.; Telsnigc, T.; Eltrop, L.; Díaz, M.; Püschela, S.; Grandel, M.; et al. Sunset or sunrise? Understanding the barriers and options for the massive deployment of solar technologies in Chile. Energy Policy 2018, 112, 399–414. [Google Scholar] [CrossRef]
- Solargis. Solar Resource Maps of Chile. Irradiación Directa Normal de Chile. © 2019 The World Bank, Source: Global Solar Atlas 2.0, Solar resource data: Solargis. 2019. Available online: https://solargis.com/es/maps-and-gis-data/download/world (accessed on 10 February 2021).
- CNE. Comisión Nacional de Energía. Reporte Mensual; CNE: Santiago, Chile, 2021; Volume 60, Available online: https://www.cne.cl/wp-content/uploads/2021/08/RMensual_ERNC_v202108.pdf (accessed on 25 September 2021).
- Instituto Nacional de Estadística. Comuna de Camarones. Región de Arica y Parinacota. Resultados Censo 2017; Instituto Nacional Estadistica: Santiago, Chile, 2017. Available online: http://resultados.censo2017.cl/Region?R=R15 (accessed on 10 May 2020).
- Ministerio de Energía. Energía Región. Resumen de Estadísticas Energéticas. 2019. Available online: https://www.energiaregion.cl/dashboardregional/XV (accessed on 20 September 2021).
- SAM. System Advisor Model. General Description. 2021. Available online: https://www.nrel.gov/docs/fy18osti/70414.pdf (accessed on 10 February 2021).
- Dobos, A.; Neises, T.; Wagner, M. Advances in CSP Simulation Technology in the System Advisor Model. Energy Procedia 2014, 49, 2482–2489. [Google Scholar] [CrossRef] [Green Version]
- Ministerio de Energía. Ley 20.571: Regula el Pago de las Tarifas Eléctricas de Las Generadoras Residenciales; Congreso Nacional de Chile (National Congress of Chile): Santiago, Chile. Available online: https://www.leychile.cl/Navegar?idNorma=1038211 (accessed on 5 January 2021).
- Ministerio de Energía. Explorador Solar. 2021. Available online: https://solar.minenergia.cl/exploracion (accessed on 10 February 2021).
- LEAP. Introduction. 2020. Available online: https://leap.sei.org/default.asp?action=introduction (accessed on 20 February 2021).
- Global Climate Risk Index 2017. Germanwatch. Available online: https://www.germanwatch.org/es/12978 (accessed on 20 February 2021).
- Nicole, T. Chile se Encuentra Entre Los Diez Países Más Afectados Por el Cambio Climático en 2015, Universidad de Chile. 2016. Available online: http://www.uchile.cl/noticias/128419/chile-entre-los-diez-paises-mas-afectados-por-el-cambio-climatico (accessed on 10 February 2021).
- Selvam, K.; Kumar, D.M.V.; Siripuram, R. Distributed Generation Planning using Peer Enhanced Multi-objective Teaching–Learning based Optimization in Distribution Networks. J. Inst. Eng. 2016, 98, 203–211. [Google Scholar] [CrossRef]
- Minsiterio de Energía. Decreto 57, 2020. Aprueba Reglamento de Generación Distribuida Para Autoconsumo; Minsiterio de Energía: Santiago, Chile, 2020. Available online: https://www.bcn.cl/leychile/navegar?idNorma=1149788&idParte=10161866&idVersion=2020-11-06 (accessed on 10 March 2021).
- Vita, V.; Ekonomou, L.; Christodoulou, C. The impact of distributed generation to the lightning protection of modern distribution lines. Energy Syst. 2016, 7, 357–364. [Google Scholar] [CrossRef]
- Ministerio de Energía. Agenda de Energía-Un Desafío País, Progreso Para Todos. 2014. Available online: http://www.energia.gob.cl/sites/default/files/agenda_de_energia_-_resumen_en_espanol.pdf (accessed on 10 February 2021).
- Ministerio de Energía. Ley Nº 20.698. Propicia la Ampliación de la Matriz Energética, Mediante Fuentes Renovables No Convencionales. Available online: https://www.leychile.cl/Navegar?idNorma=1055402 (accessed on 10 February 2021).
- Ministerio de Energía. Programa de Techos Solares Públicos. 2020. Available online: http://www.minenergia.cl/techossolares/?page_id=33 (accessed on 10 February 2021).
- BCN. Biblioteca del Congreso Nacional de Chile. Historia de la Ley Nº 20.571. Regula el Pago de Las Tarifas Eléctricas de Las Generadoras Residenciales; Primer Trámite Constitucional: Senado, Chile, 2020; Available online: //www.bcn.cl/historiadelaley/nc/historia-de-la-ley/vista-expandida/4547/#h2_1_1 (accessed on 10 February 2021).
- Ministerio de Economía, Fomento y Reconstrucción. Ley 20.257: Introduce modificaciones a la Ley General de Servicios Eléctricos Respecto de la Generación de Energía Eléctrica con Fuentes de Energías Renovables no Convencionales; Congreso Nacional de Chile (National Congress of Chile): Santiago, Chile, 2013; Available online: https://www.bcn.cl/leychile/navegar?idNorma=270212&idVersion=2013-10-22&idParte= (accessed on 10 September 2021).
- Ministerio de Energía. Ley Nº 21.118: Modifica la Ley General de Servicios Eléctricos, Con el Fin de Incentivar el Desarrollo de Las Generadoras Residenciales. 2018. Available online: https://www.leychile.cl/Navegar?idNorma=1125560 (accessed on 10 February 2021).
- OECD/IEA. Global Energy and CO2 Status Report. The Latest Trends in Energy and emissions in 2018. 2018. Available online: https://www.iea.org/geco/ (accessed on 25 May 2019).
- REN21. Renewable Now. 2019. Available online: https://www.ren21.net/gsr-2019/chapters/chapter_01/chapter_01/ (accessed on 10 February 2021).
- IRENA. Trends in Renewable Energy. International Renewable Energy Agency. 2021. Available online: https://www.irena.org/Statistics/View-Data-by-Topic/Capacity-and-Generation/Statistics-Time-Series) (accessed on 23 September 2021).
- CNE. Comisión Nacional de Energía. Reporte Mensual ERNC; CNE: Santiago, Chile, 2020; Volume 46, p. 5. Available online: https://www.cne.cl/wp-content/uploads/2020/06/RMensual_ERNC_v202006.pdf (accessed on 25 September 2021).
- Energia Abierta; Comisión Nacional de Energía. Dashboard región. 2021. Available online: https://energiaregion.cl/dashboardregional/I (accessed on 25 September 2021).
- Emol. Mapa: Cuánto Cuesta la Energía Eléctrica de Uso Residencial en Chile y el Mundo. 2017. Available online: https://www.emol.com/noticias/Economia/2017/07/19/867452/Mapa-Cuanto-cuesta-la-energia-electrica-en-el-mundo.html (accessed on 25 September 2021).
- SEC. Resumen Mensual de la Industria Energetica, Informe SEC, Agosto 2021. Super Intendencia de Electricidad y Combustible, SEC. 2021. Available online: https://www.sec.cl/sitio-web/wp-content/uploads/2021/09/Informe-SEC-Agosto-2021.pdf (accessed on 25 September 2021).
- Almusaied, Z.; Asiabanpour, B.; Aslan, S. Optimization of Solar Energy Harvesting: An Empirical Approach. J. Sol. Energy. 2018, 2018, 9609735. [Google Scholar] [CrossRef] [Green Version]
- Parrado, C.; Girard, A.; Simon, F.; Fuentealba, E. 2050 LCOE (Levelized Cost of Energy) projection for a hybrid PV (photovoltaic)-CSP (concentrated solar power) plant in the Atacama Desert, Chile. Energy 2016, 94, 422–430. [Google Scholar] [CrossRef]
- CGE. Tarifa de Suministro. 2021. Available online: https://www.cge.cl/informacion-comercial/tarifas-y-procesos-tarifarios/tarifa-de-suministro/ (accessed on 27 December 2021).
- Energía Abierta. Datos Que Consideran Las Instalaciones Declaradas Ante la SEC Mediante el Trámite eléctrico TE4, Región de Arica y Parinacota. 2021. Available online: https://energiaregion.cl/region/AyP (accessed on 25 September 2021).
- Proyecto Ayllu Solar. Iniciativa SERC Chile. 2021. Available online: www.ayllusolar.cl (accessed on 25 September 2021).
- Google Maps. Búsqueda de Arica y Parinacota. Arica, Chile. Available online: https://www.google.cl/maps/place/Arica,+Arica+y+Parinacota/@-18.4723921,-70.3242532,13z/data=!3m1!4b1!4m5!3m4!1s0x915aa98ad932c235:0x27f5886c04d8d71d!8m2!3d-18.4782534!4d-70.3125988 (accessed on 19 April 2021).
- Palma-Behnke, R.; Abarca del Río, R.; Agostini, C.; Alvear, C.; Amaya, J.; Araya, P.; Arellano, N.; Arriagada, P.; Avilés, C.; Barría, C.; et al. The Chilean Potential for Exporting Renewable Energy; Mitigation and Energy Working Group Report; Comité Científico de Cambio Climático; Ministerio de Ciencia, Tecnología, Conocimiento e Innovación: Santiago, Chile, 2021.
- La fuerza del Sol. 2º Edición. ISBN: 978-956-393-154-9. Available online: http://ayllusolar.cl/wp-content/uploads/2020/03/LIBRO_LA_FUERZA_DEL_SOL.pdf (accessed on 10 February 2021).
- Kuhn, Panel Solar Fotovoltaico Policristalino 330 WATTS KYL-330P KUHN. Available online: https://www.kuhn.cl/webstore/energiasolar/fotovoltaica/panelsolar/panel-solar-fotovoltaico-policristalino-330-watts-kyl-330p-kuhn.html (accessed on 5 May 2021).
- Solarstore. Estructuras de montaje. Kit Montaje 6 Paneles 1 Fila Coplanar. Available online: https://www.solarstore.cl/producto/kit-estructura-soporte-montaje-6-paneles-1-fila-co (accessed on 5 May 2021).
- Solarstore. Inversores on Grid. Obtenido de Inversor on Grid 2 kw HUAWEI Certificado SEC. Available online: https://www.solarstore.cl/producto/inversor-huawei-on-grid-2kw-huawei/ (accessed on 5 May 2021).
- Echile. (diciembre de 2019). Programa de Energías Renovables y Eficiencia Energética en Chile. Obtenido de Índice de Precios Fotovoltaico v2019. Available online: https://4echile-datastore.s3.eu-central-1.amazonaws.com/wp-content/uploads/2020/08/03195541/Factsheet-IP-FV_menor-resoluci%C3%B3n_Final.pdf (accessed on 23 December 2021).
- Lazard. Levelized Cost of Energy and Levelized Cost of Storage—2020. Obtenido de View the Full Levelized Cost of Energy Report. 2020. Available online: https://www.lazard.com/media/451419/lazards-levelized-cost-of-energy-version-140.pdf (accessed on 10 February 2021).


| Technology | Operation (1) (MW) | Construction (MW) | RCA Approved (2) (MW) |
|---|---|---|---|
| Biomass (3) | 416 | 166 | 0 |
| Wind | 2492 | 1176 | 11,286 |
| Geothermal | 40 | 0 | 155 |
| Mini-Hydro (4) | 612 | 53 | 752 |
| PV | 3777 | 3338 | 26,525 |
| CSP | 0 | 0 | 2032 |
| Total | 7338 | 4733 | 40,749 |
| Region | Surface Area (km2) | Population (Inhabitants) | Number of Regulated Clients | Electric Residential Consumption per Client (kWh/month) | Installed Photovoltaic Solar Capacity (MW) | Gross Photovoltaic Electric Generation (GWh) | Public Solar Roofs Total Capacity (kW) | Monthly Tariff BT1 (Estimated Consumption of 180 kWh) (USD) | Distributed Generation by Law (kW) |
|---|---|---|---|---|---|---|---|---|---|
| Arica y Parinacota | 16,873 | 252,110 | 81,214 | 176 | 8 | 1.45 | 200 | 28.9 | 657 |
| Tarapacá | 42,226 | 382,773 | 111,478 | 183.1 | 415.83 | 72.96 | 365 | 28.4 | 664 |
| Antofagasta | 126,049 | 691,854 | 194,054 | 198.8 | 1341.64 | 203.02 | 465 | 25.5 | 864 |
| Atacama | 75,176 | 314,709 | 110,300 | 149.8 | 1302.46 | 169.83 | 512 | 29.0 | 3422 |
| Coquimbo | 40,580 | 836,096 | 336,665 | 136.4 | 297.48 | 36.09 | 325 | 30.3 | 7850 |
| Metropolitana | 15,403 | 8,125,072 | 2,660,897 | 197.3 | 395.60 | 35.41 | 1225 | 24.3 | 27,434 |
| Valparaíso | 16,396 | 1,960,170 | 883,511 | 147.2 | 185.42 | 17.44 | 325 | 30.2 | 13,355 |
| Libertador B. O’Higgins | 16,387 | 991,063 | 389,821 | 155.1 | 231.56 | 27.95 | 500 | 27.0 | 15,103 |
| Ñuble | 13,179 | 491,204 | 223,030 | 0 | 62.01 | 2.94 | 115 | 30.4 | 2975 |
| Maule | 30,269 | 1,131,939 | 482,187 | 137.2 | 158.96 | 8.69 | 830 | 29.1 | 12,646 |
| Bío Bío | 23,890 | 1,663,696 | 639,565 | 142.3 | 13.98 | 0 | 300 | 30.0 | 3834 |
| BT1 TARIFF | |||||||||||||
|---|---|---|---|---|---|---|---|---|---|---|---|---|---|
| Commune | Tariff Sector | Aerial or Underground | Service Administration | Electricity Transport | Consumed Electricity | ||||||||
| Fixed Monthly Charge BT1 (USD/Client) | Transmission System Usage Charge (USD/kWh) | Public Service Charge (USD/kWh) | Energy Charge (USD/kWh) | Power Purchase Charge (USD/kWh) | Charge for Base Power in Its Distribution Component (USD/kWh) * | ||||||||
| 1 | 2 | 3 | 4 | 5 | 6 | ||||||||
| Arica | StxA-1-A | Aerial | 1.35 | 0.02 | 0.0006 | 0.096 | 0.023 | 0.037 | 0.037 | 0.037 | 0.037 | 0.037 | 0.037 |
| Arica | StxA-1-S1 | Underground. 1 | 1.35 | 0.02 | 0.0006 | 0.096 | 0.023 | 0.047 | 0.047 | 0.047 | 0.047 | 0.047 | 0.047 |
| Arica | StxA-1-S2 | Underground. 2 | 1.35 | 0.02 | 0.0006 | 0.096 | 0.023 | 0.043 | 0.043 | 0.043 | 0.043 | 0.043 | 0.043 |
| Arica | StxA-1-S3 | Underground. 3 | 1.35 | 0.02 | 0.0006 | 0.096 | 0.023 | 0.053 | 0.053 | 0.053 | 0.053 | 0.053 | 0.053 |
| Camarones | StxA-1-A | Aerial | 1.35 | 0.02 | 0.0006 | 0.086 | 0.023 | 0.037 | 0.037 | 0.037 | 0.037 | 0.037 | 0.037 |
| Year | 2017 | 2018 | 2019 | 2020 | 2021 | 2022 | 2023 | 2024 | 2025 | 2026 | 2027 | 2028 | 2029 | 2030 | 2031 | 2032 | 2033 |
|---|---|---|---|---|---|---|---|---|---|---|---|---|---|---|---|---|---|
| Industry | 78 | 77 | 77 | 77 | 78 | 78 | 79 | 80 | 80 | 81 | 82 | 82 | 83 | 83 | 84 | 84 | 84 |
| Mining | 21 | 22 | 22 | 22 | 23 | 23 | 23 | 23 | 24 | 24 | 24 | 25 | 25 | 25 | 25 | 26 | 26 |
| Transportation | 0 | 0 | 0 | 4 | 8 | 11 | 15 | 18 | 22 | 30 | 39 | 49 | 61 | 74 | 93 | 115 | 115 |
| Residential | 137 | 142 | 147 | 151 | 156 | 160 | 164 | 168 | 172 | 177 | 181 | 186 | 191 | 196 | 201 | 207 | 207 |
| Commercial | 90 | 91 | 94 | 98 | 104 | 110 | 116 | 122 | 128 | 135 | 141 | 149 | 156 | 164 | 171 | 179 | 179 |
| Public | 20 | 21 | 22 | 22 | 22 | 22 | 22 | 24 | 25 | 27 | 28 | 30 | 31 | 33 | 34 | 36 | 37 |
| Total | 345 | 354 | 362 | 374 | 390 | 404 | 420 | 436 | 453 | 474 | 497 | 522 | 548 | 576 | 611 | 648 | 648 |
| Year | 2034 | 2035 | 2036 | 2037 | 2038 | 2039 | 2040 | 2041 | 2042 | 2043 | 2044 | 2045 | 2046 | 2047 | 2048 | 2049 | 2050 |
| Industry | 85 | 85 | 85 | 85 | 85 | 85 | 85 | 86 | 86 | 86 | 87 | 87 | 88 | 89 | 89 | 90 | 91 |
| Mining | 26 | 27 | 27 | 27 | 28 | 28 | 28 | 29 | 29 | 29 | 30 | 30 | 30 | 31 | 31 | 31 | 32 |
| Transportation | 169 | 203 | 238 | 290 | 348 | 410 | 472 | 530 | 598 | 671 | 759 | 857 | 963 | 1088 | 1233 | 1382 | 1558 |
| Residential | 220 | 227 | 234 | 241 | 248 | 254 | 260 | 266 | 272 | 277 | 283 | 288 | 293 | 298 | 304 | 309 | 315 |
| Commercial | 196 | 205 | 213 | 223 | 232 | 242 | 252 | 262 | 273 | 283 | 294 | 305 | 316 | 328 | 340 | 352 | 364 |
| Public | 40 | 42 | 43 | 46 | 48 | 49 | 51 | 52 | 55 | 56 | 58 | 61 | 62 | 64 | 67 | 68 | 70 |
| Total | 736 | 788 | 840 | 912 | 988 | 1068 | 1149 | 1224 | 1313 | 1404 | 1511 | 1629 | 1754 | 1897 | 2064 | 2233 | 2430 |
| Metric | Value |
|---|---|
| Annual energy (Year 1) | 3831 kWh |
| Capacity factor (Year 1) | 22.0% |
| Energy yield (Year 1) | 1931 kWh/kW |
| Performance Ratio (Year 1) | 0.81 |
| Nominal levelized cost of energy (nominal LCOE) | 0.0555 USD/kWh |
| Actual levelized cost of energy (actual LCOE) | 0.0417 USD/kWh |
| Electric bill without system (year 1) | USD 187 |
| Electric bill with system (year 1) | USD −78 |
| Net savings with system (year 1) | USD 265 |
| Net present value (NPV) | USD 399 |
| Simple payback period | 10 years and 9 months (Approximately in 11 years) |
| Discounted payback period | NaN |
| Net capital cost | USD 2209 |
| Capital | USD 0 |
| Debt | USD 2209 |
| Financial Parameters | American Dollars (USD) |
|---|---|
| Bill without PV (year 1) (FLBPV) | 187 |
| Bill with PV (year 1) (FLWPV) | (-)78 |
| Net savings with the system (year 1) | 265 |
| Year | Bill without PV (USD) | Bill with PV (USD) |
|---|---|---|
| 2021 | 187.1 | (-)78.0 |
| 2022 | 193.1 | (-)78.5 |
| 2023 | 199.3 | (-)79.0 |
| 2024 | 205.7 | (-)79.4 |
| 2025 | 212.3 | (-)79.8 |
| 2026 | 219.1 | (-)80.2 |
| 2027 | 226.1 | (-)80.5 |
| 2028 | 233.3 | (-)80.7 |
| 2029 | 240.8 | (-)80.9 |
| 2030 | 248.5 | (-)81.1 |
| 2031 | 256.5 | (-)81.2 |
| 2032 | 264.7 | (-)81.3 |
| 2033 | 273.2 | (-)81.2 |
| 2034 | 282.0 | (-)81.2 |
| 2035 | 291.0 | (-)81.0 |
| 2036 | 300.3 | (-)80.8 |
| 2037 | 309.9 | (-)80.5 |
| 2038 | 319.9 | (-)80.1 |
| 2039 | 330.1 | (-)79.6 |
| 2040 | 340.7 | (-)79.0 |
| 2041 | 351.6 | (-)78.4 |
| 2042 | 362.9 | (-)77.6 |
| 2043 | 374.5 | (-)76.7 |
| 2044 | 386.5 | (-)75.7 |
| 2045 | 398.9 | (-)74.6 |
| 2046 | 411.7 | (-)73.4 |
| 2047 | 424.9 | (-)72.0 |
| 2048 | 438.5 | (-)70.5 |
| 2049 | 452.6 | (-)68.8 |
| 2050 | 467.1 | (-)67.0 |
| Σ | 9.203,0 | (-)2338.7 |
| Barriers | Opportunities |
|---|---|
| Lower price of electricity generated by households covered by Law No. 20571, with a value almost 50% lower than the value applied by electric companies to their regulated customers. | Solar potential of the sector, better than worldwide. |
| High initial investment costs, considering the GDP of the region of Arica and Parinacota, which translates into financial barriers. | Desert climate, sunny days almost all year round. |
| Lack of offers. There are few companies that offer services of photovoltaic panels installations at residential level. | Duty-free zone, which allows tax benefits for the development of this type of solution. |
Publisher’s Note: MDPI stays neutral with regard to jurisdictional claims in published maps and institutional affiliations. |
© 2022 by the authors. Licensee MDPI, Basel, Switzerland. This article is an open access article distributed under the terms and conditions of the Creative Commons Attribution (CC BY) license (https://creativecommons.org/licenses/by/4.0/).
Share and Cite
Moraga-Contreras, C.; Cornejo-Ponce, L.; Vilca-Salinas, P.; Estupiñan, E.; Zuñiga, A.; Palma-Behnke, R.; Tapia-Caroca, H. Evolution of Solar Energy in Chile: Residential Opportunities in Arica and Parinacota. Energies 2022, 15, 551. https://doi.org/10.3390/en15020551
Moraga-Contreras C, Cornejo-Ponce L, Vilca-Salinas P, Estupiñan E, Zuñiga A, Palma-Behnke R, Tapia-Caroca H. Evolution of Solar Energy in Chile: Residential Opportunities in Arica and Parinacota. Energies. 2022; 15(2):551. https://doi.org/10.3390/en15020551
Chicago/Turabian StyleMoraga-Contreras, Claudia, Lorena Cornejo-Ponce, Patricia Vilca-Salinas, Edgar Estupiñan, Alejandro Zuñiga, Rodrigo Palma-Behnke, and Héctor Tapia-Caroca. 2022. "Evolution of Solar Energy in Chile: Residential Opportunities in Arica and Parinacota" Energies 15, no. 2: 551. https://doi.org/10.3390/en15020551