1. Introduction
Natural gas furnaces are a common method of heating homes, providing heat in approximately 38% of US homes [
1]. Each of these furnaces requires a fan to move the air through the home. These fans, powered by electricity, can consume significant electric power, up to 1000 kW-h per year [
2]. In addition, interruptions of power during the winter can last several weeks and have had increasing durations [
3]. Conventional natural gas furnaces use energy both in the form of natural gas supplied through underground piping networks and electricity supplied by the electric grid. Energy from the combustion of fuel is the main source of heat that is supplied to the conditioned space. Electricity is used to power fans and controls, such as the microprocessor-based furnace control, gas valve, and thermostat. However, in a self-powered furnace, a portion of the energy from combustion can be converted to electricity to power the fan and control loads. In this way, a self-powered furnace requires no electricity from the grid.
There are two areas of advantage for self-powered furnaces. The first is energy efficiency. A self-powered furnace does not use electricity from which transmission and distribution losses have been subtracted. Additionally, depending on the source of electric power, total carbon emissions could be reduced if the furnace makes its own electricity. These characteristics have been analytically shown to demonstrate the increased energy efficiency of self-powered products [
4]. The second advantage is that the product no longer depends on the electric grid for operation. If the electric supply is interrupted—for example, in the case of a blackout—the occupants will still have heating, as the natural gas supply is rarely interrupted. This mode of operation could allow the furnace to operate “off the grid” if a supply of natural gas is available or if the self-powered furnace technology can be adapted to liquid propane-fueled furnaces.
Several methods to power furnaces have been studied [
5]. Two of the promising methods are thermoelectric generation (TEG) and thermophotovoltaic (TPV) cells. TEG uses the Seebeck effect to create a potential difference between two sections of a semiconductor material that are at different temperatures [
6]. For a self-powered furnace, the heat from the burner can be applied to one side of the semiconductor material with the other side isolated from the burner heat. This can supply the potential difference to power the electrical components of the furnace. The efficiency of the TEG process is relatively low [
7], but is sufficient to create the amount of power required to drive the electric loads of the furnace when powered by the furnace burner. TPV cells, on the other hand, use an absorber and emitter combination between the heat source and a photovoltaic cell so that the conversion of heat to electricity has an intermediate thermal radiation step in between [
8]. Filters at the absorber and the emitter can be used to selectively transmit the spectrum, such that optimum operation can be accomplished. Earlier work has shown the efficiency of a solar thermophotovoltaic cell using an Er-YAG selective emitter and an ideal photovoltaic cell at 15 to 17% [
9]. However, efficiencies of more than 30% were observed when using GaSb photovoltaic cells [
10]. Further, efficiency of even more than 35% has been shown to be possible [
11].
Self-powered appliances have been studied in the past. Qiu and Hayden [
12] built and tested a prototype appliance that featured TEG elements. The authors also created a model that demonstrated good agreement with test data. Their work focused on how the power and efficiency delivered by the TEG elements can be changed by varying the heat transfer surface temperatures. The authors found that optimization of the design is important, and the temperature of the heat source and hot side heat transfer coefficient were especially important. Though both affected the system efficiency, they worked in opposing ways: this resulted in the ability to select an optimum set of conditions for maximum system efficiency. There are two key differences between the cited work and our present study. First, our work was completed assuming the use of TPV rather than TEG to convert thermal energy to electrical energy. Next, in our work, the efficiency value for the process of converting natural gas to electrical power in the TPV is assumed. The result is that we can determine the overall primary fuel efficiency achievable with various amounts of electrical energy generated.
Another study using TEG was completed by Alptekin et al. [
13], who built a combi-boiler equipped with Bi
2Te
3-based thermoelectric generation modules. They cut channels into the heat exchanger assembly of an existing production combi-boiler and inserted a total of 14 TEG cells of two different sizes, 56 × 56 × 3.5 mm and 40 × 40 × 3.5 mm. The larger was rated at 14.6 W nominal, and the smaller was rated at 5.2 W nominal. Although not explicitly stated, the figures in this work appear to denote the maximum number of modules that could fit in the existing combi-boiler cabinet. Experiments showed that the TEG modules produced approximately 36 W of power, which the authors found to be one-third of the total power needed for the pump and controls. The authors suggested that further work could result in a self-powered system, but no specific changes were specified.
Butcher et al. [
14] developed a self-powered, oil-fired boiler that used TPV rather than TEG cells. The author suggested that TPV cells were selected for their lower cost based on previous work [
15], but they did not provide any cost data. More recent work by some of the present authors has shown cost parity between TPV and TEG—or even a cost advantage to TEG [
5]. The study featured a constraint of using conventional yellow flame burners employed in standard oil-fired boilers. They investigated three systems, each using a different material for the emitter. They pointed out the need for electric power outside the steady-state operation window. This electric power is needed to allow for a cell warmup period and for a period of pump operation after the burner is off. They developed a model showing that the convective mode had a much lesser effect than the radiative mode on heat transfer to the hot side of the TPV cell. In further testing, they found that power density dramatically changed with excess air; lower excess air was shown to result in higher cell power output. Though actual values of excess air are not reported, the cell power output increased from approximately 1.6 W/m
2 to over 2.0 W/m
2. Finally, they completed testing with a residential-sized burner and achieved 119 W from an array of 99 cells, each with an area of 1.0 × 10
−5 m
2, resulting in a total area of 9.9 × 10
−3 m
2. This resulted in power with reduced warmup time; however, the flue contained increased NOx. They noted that they did not employ spectral filters, which allow for thermal management of the cells for higher reliability.
Qiu and Hayden [
16] built and tested a gas-fired residential boiler equipped with TPV devices. They characterized the electrical output under various conditions. Their results showed that the TPV cells generated 246.4 W, enough to power the electrical component and charge the starting battery. They found that the TPV had little effect on heating efficiency and that heat recuperation could be a method to increase the efficiency of heat to electric power.
For the present work, the team selected TPV generation as the technology to power the electrical components of the furnace. TPV generation was selected based on previous work that analyzed several candidate electricity-generating technologies that could be selected for a self-powered furnace [
5]. In that work, the authors rated the various technologies on several characteristics and then analytically determined the heat transfer characteristics of the combustion system that would be required for each system. TPV was not the highest-rated technology in meeting the required attributes, but its reasonable heat transfer requirements coupled with low maintenance requirements and operating noise make it a reasonable choice of technology for the modeling of this work.
Given the benefits associated with a self-powered furnace configuration, the primary objective of this work was to assess different TPV integration schemes suitable for an optimal residential scale furnace. The developed model provides the ability to represent the entire power–thermal system, including associated energy conversion stages of the TPV power module. The influence of power output and TPV’s electric efficiency on energy savings and carbon footprint reduction potential was investigated and compared with a baseline gas furnace.
This article presents new information in three areas. First, we present an investigation of the primary energy efficiency, utility cost savings, and carbon dioxide emissions that result from the use of a self-powered natural gas furnace. Second, a complete model representing the thermodynamic performance of an integrated TPV–furnace system is presented. Third, to the best of our knowledge, we are presenting the first results of modeling a self-powered furnace that is powered by hydrogen. We believe these advances in the science are useful, as energy reductions from residential heating and the use of green hydrogen will be very important in the coming years as steps to achieve the goals of decarbonization.
2. Methodology
The main method involved thermodynamic modeling of the integrated energy system using the CHEMCAD
® (NXT 1.0.2, Chemstations, Houston, TX, USA) process simulation software package to evaluate the thermal and electrical output for supporting building’s thermal needs [
17]. The Soave–Redlich–Kwong equation of state was used for the global K-value and enthalpy models utilized in the presented configurations. The main energy sources considered were natural gas (baseline), electric grid, and hydrogen. A detailed performance analysis of the TPV-based self-powered furnace system was conducted. Different models were developed to help analyze an integrated system consisting of a TPV power generator module, along with an emitter, heat exchangers, and combustion reactors. The main objective was to evaluate the integrated system from thermal and material balancing standpoints while achieving optimal efficiency and assessing the carbon dioxide footprint of a given configuration. The key requirement of generating electrical power in the desired range while utilizing all heat streams of varying temperatures was analyzed at different TPV efficiencies. The primary criterion was to develop a simulation model to analyze the maximum achievable energy efficiency while producing up to 400 W of onsite electric power to power electrical balance-of-plant (BOP) load requirements such as air handler, combustion air blower, control board, ignitor, sensing, etc. It must be noted that the model did not consider any physical or material constraints with regard to complete system integration—particularly that of utilizing all heat streams and their temperatures.
The impact of an integrated energy system’s design was studied for applications in residential buildings. Primary components and unit operations included:
Gibbs free reactor—combustion module/burner;
Heat exchanger—primary heat recovery;
TPV module—power generation;
Combustion air preheater heat exchanger;
Stream divider and mixer.
Major design parameters included:
Power rating of the TPV module;
Energy conversion efficiency of the TPV cell and its subcomponents;
Flue gas temperature;
Air to fuel ratio of the combustion module;
Adiabatic flame temperature (AFT) of the combustion module;
Primary energy efficiency of the electric grid;
Carbon dioxide footprint of the electric grid;
Cost of electricity.
In Chem CAD, a Gibbs reactor assumes that at chemical equilibrium, the total Gibbs free energy is minimized, and equilibrium constants are not taken into consideration. The distribution of reaction species is recognized using mathematical equations to minimize the system’s free energy. All species are determined, and a solution is developed irrespective of the system’s chemistry-related knowledge, satisfying equilibria per thermodynamic limitations.
Similarly, the heat exchanger consists of one or multiple streams. The heat exchanger acts as a heater or a cooler with key input parameters such as stream temperature or heat duty or temperature difference defined. Chem CAD calculates the thermal property of the undefined stream to achieve material and energy balance. Combined heat transfer coefficient, U, or area are also calculated assuming ideal heat transfer.
Representation of the TPV module in the thermodynamic model was set such that various energy conversion losses are accounted for during the power generation cycle. A typical TPV power generation cycle includes chemical to radiation efficiency (η
CR), spectral efficiency (η
SP), cell to emitter view factor efficiency (η
VF), and cell conversion efficiency (η
PV) [
11,
18]. Energy loss across each conversion stage is simply assumed by splitting the stream according to the predefined efficiency rating, where one stream continues toward the primary electrical energy pathway while the balance is mixed with the rest of the thermal energy of the system. Details related to individual TPV module setup are provided in
Section 3. All the systems presented in this study simply account for total fuel conversion while transferring the heat produced during combustion reactions either in a heat exchanger serving the thermal load or further energy conversion in subsequent stages for electrical power generation.
2.1. Configurations
Several design configurations were analyzed and compared in order to recognize energy losses across each conversion stage and develop a model that closely represents a realistic TPV-based self-powered furnace. Additionally, opportunities to further improve the energy efficiency to achieve desired operating conditions for optimal TPV performance were also investigated. Primary configurations evaluated in this study include:
2.2. Assumptions
The impact of design parameters and configurations mentioned above was studied to assess the annual primary energy consumption, utility cost savings, and carbon dioxide emissions. Primary energy is the energy consumed at the source (power plant) and/or at the site in the form of natural gas fuel consumption. Total carbon dioxide emissions associated with individual configurations were estimated based on the carbon intensity of the electrical grid, hydrogen’s carbon footprint, and the CO
2 produced via natural gas combustion in the burner. All the corresponding assumptions made in this analysis are presented in
Table 1. The electrical demand chosen here is typical for an average residential building heating furnace system.
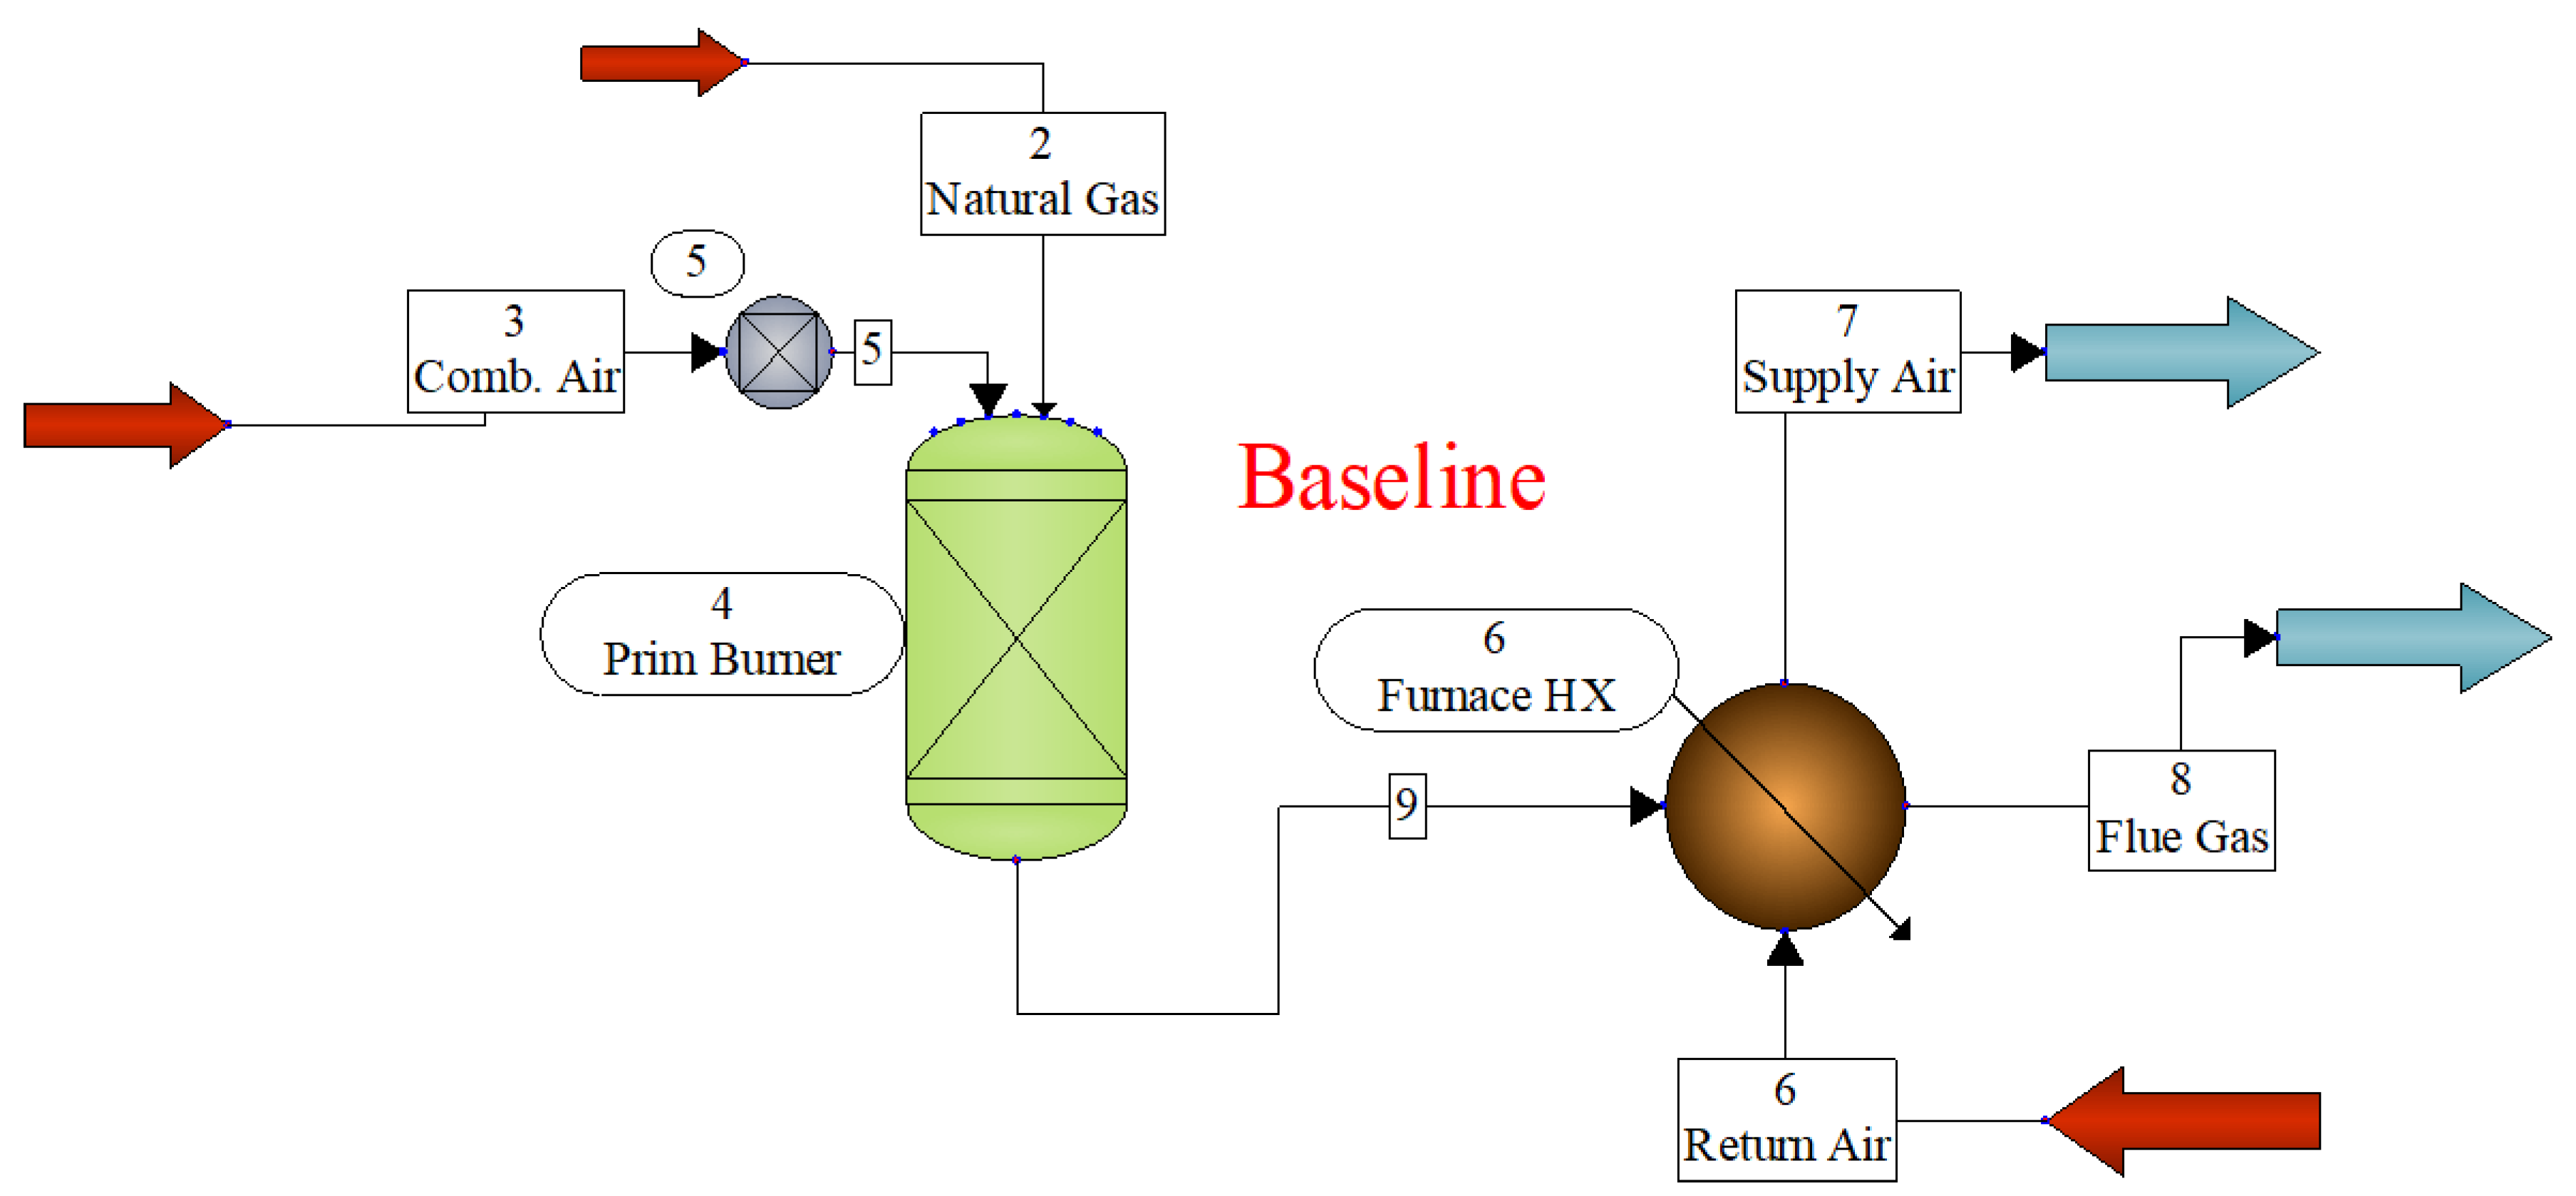
Figure 1 depicts a conventional space heating furnace fueled by natural gas. A primary burner (unit ID 4) assumed to be operating at an AFT of 1300–1400 °C supplies the energy for elevating the return air temperature (stream ID 6) by ~25 °C at a nominal capacity of 40,000 Btu/h (~800 CFM of air flow rate) via a primary heat exchanger (unit operation 6).
Table 1 presents the assumptions made for all configurations analyzed and presented in this study. The return air temperature was assumed as 25 °C, whereas the flue gas exiting the furnace system was maintained at 50 °C. For the baseline case consisting of a natural gas-fueled furnace operated via an electrical grid for supporting the parasitic load, the site delivery efficiency (electrical supply to the furnace) was assumed to be 34%. Efficiency calculations were performed using the fuel’s higher heating value (HHV) of 55.5 MJ/kg since the furnace system considered is a high-efficiency condensing design. The AFT of the burner was specified between 1300 and 1600 °C for the rest of the TPV configurations analyzed. Combustion energy to radiant heat energy efficiency was assumed to be 75%, whereas the spectral and view factor efficiencies were assumed to be 60% and 80%, respectively. The electrical power conversion efficiency of the TPV module was assumed to be in the range of 28–38%, where each simulation uses a fixed value within this range for the case study being investigated. The carbon dioxide footprint of the electrical grid varied between 0.1 and 0.9 kg of carbon dioxide per kilowatt hour of electric power generation [
19]. The cost of electricity varied in the range of USD 0.05 and 0.30 per kilowatt hour, representing different tariff structures in the continental USA. The carbon dioxide emission associated with electrical grid-based systems shown in
Figure 2 was calculated by multiplying the combined grid energy supply with the carbon intensity.
2.3. Calculations
Primary energy efficiency (
ηPE) is defined in Equation (1), where
kWthermal is the thermal power rating of the furnace in kW, whereas
kWGrid is the furnace’s parasitic load, provided by the grid.
ηGrid is the primary energy efficiency of the electrical grid.
Furnacefuel is the primary fuel consumed by the furnace (in kg/s), and
HHVfuel is the fuel’s higher heating value (in kJ/kg).
Reduction in carbon dioxide emissions is evaluated by comparing the carbon intensity of the electrical grid and the local fuel consumption associated with the furnace. Net annual emission reduction is calculated per Equation (2) by considering the carbon intensity (
CO2,grid, kg/kWh) of the electrical grid, utility grid purchase offset (
kWhgrid savings/year), carbon intensity of fuel (
CO2,fuel, 0.18 kg/kWh, considering 1 mole of carbon dioxide production per mole of methane), and the variance in fuel consumption between baseline and TPV integrated furnace (
kWhfuel savings/year).
Operational cost savings
($savings) are evaluated via Equation (3) by considering the net cost of on-site fuel consumption reduction (
m3fuel savings/year), lower utility grid purchases (
kWhgrid, sales), and cost of electricity
($grid). Fuel savings are estimated from the difference in primary energy efficiency assessed from the thermodynamic model.
3. Results and Discussion
This section presents the performance analysis of different furnace configurations integrated with the TPV power source. A standard, high-efficiency, condensing type natural gas-fueled furnace was assumed as the baseline system. The influence of design configuration, heat recovery methodology, TPV integration approach, electrical grid’s efficiency, and carbon intensity, along with the cost of energy supplied, were factored into comparing the relative advantage of each design configuration. As stated in the previous section, the key objective was to predict the carbon dioxide emissions and primary energy consumption of each of these configurations.
A preliminary energy balance study of the furnace configuration with and without the TPV power module was initially conducted to assess the energy-saving potential of each design configuration along with the heat recovery approach selected.
Figure 2 shows the modified baseline model (
Figure 1) with an emitter–TPV power module (unit ID 74) added in between the burner (unit ID 71) and the primary heat exchanger (unit ID 73).
Table 2 elaborates on the role of the individual major unit operations along with key specifications and the calculated thermal property values for individual streams.
The key objective of this model was to evaluate the net energy efficiency of the self-powered furnace system generating up to 400 W of electric power with complete waste heat recovery from the TPV module. Heat duty across the unit operation (unit ID 74) simulating the TPV module’s power output was assumed by simply subtracting a set amount of energy across this device. The energy released from the combustion module (unit ID 71) was assumed to pass across the combined emitter–TPV module (unit ID 74), at an AFT of 1385 °C operated at an oxygen-to-carbon ratio of 6.75 (stoichiometric ratio is 4.0).
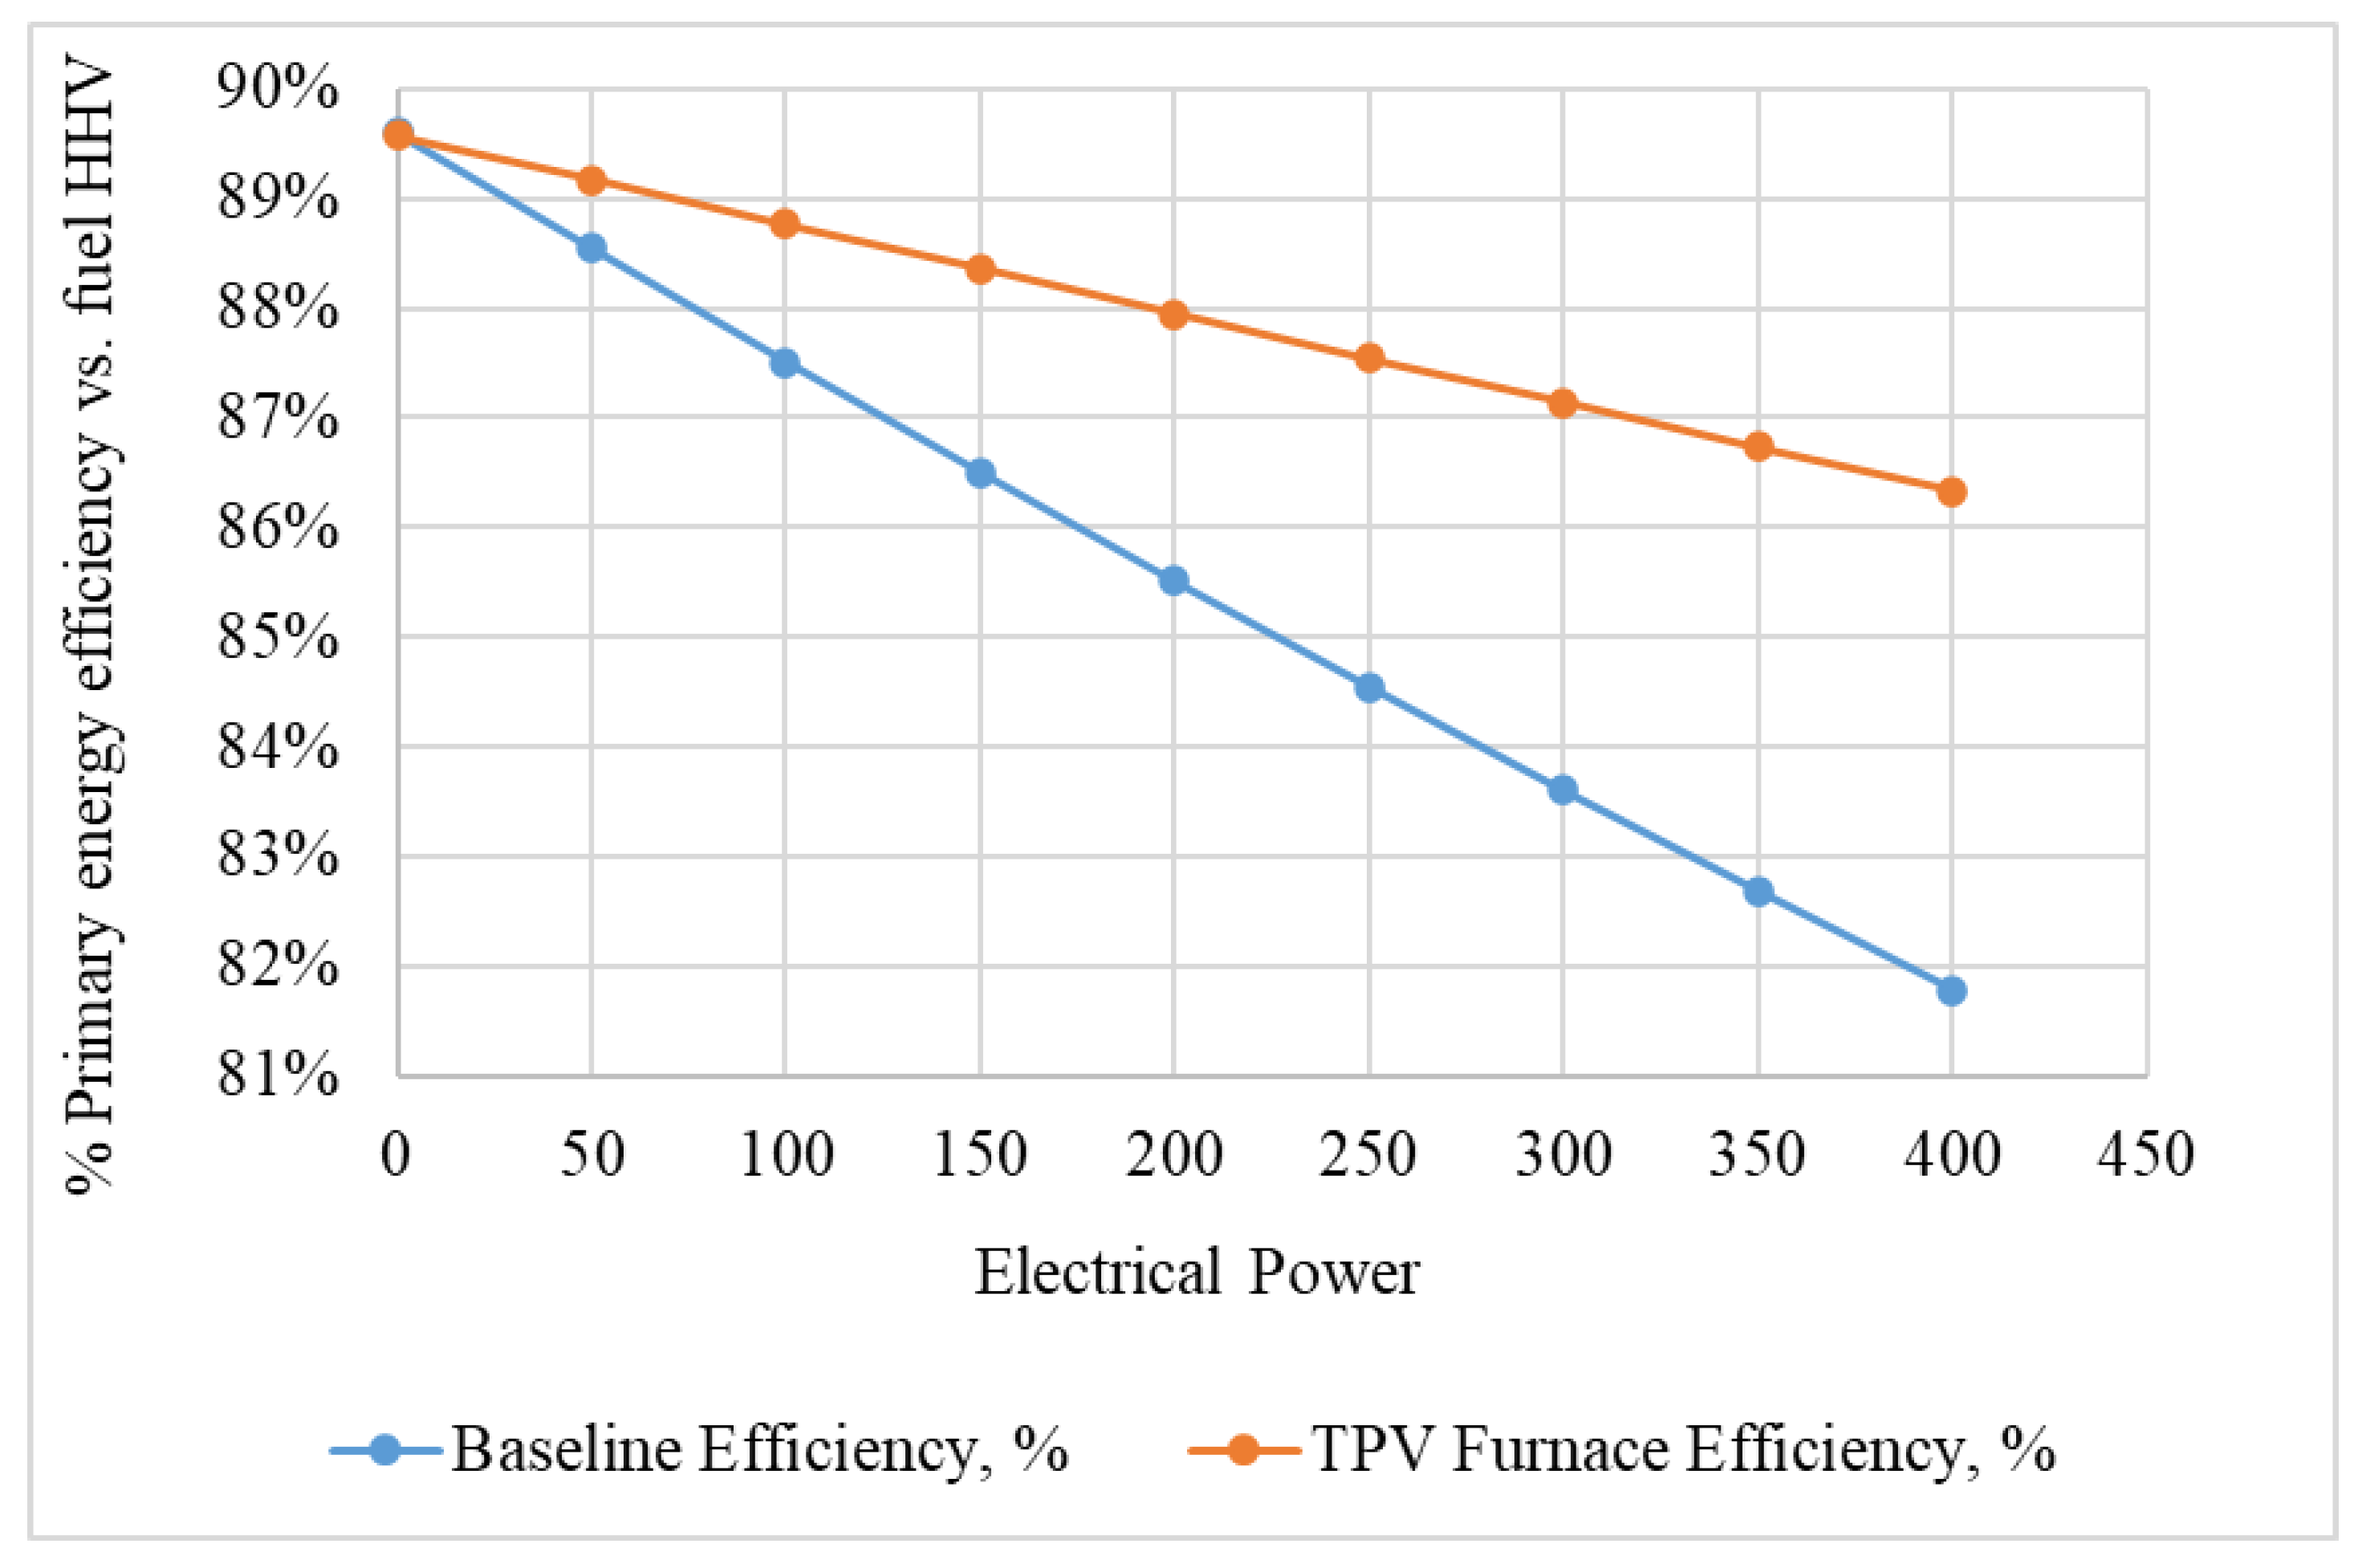
Figure 3 compares the primary energy efficiency of the self-powered furnace with that of a baseline gas furnace system providing the same amount of useful thermal energy while operated at different levels of electrical power demand. As shown, the self-powered furnace offers higher primary energy conversion efficiency at all power levels examined. For instance, at 400 W of balance-of-plant electrical power demand, the self-powered configuration achieves ~86.3% primary energy efficiency, whereas the baseline electric grid-powered gas furnace achieves ~81.8% energy efficiency.
The process flow diagram shown in
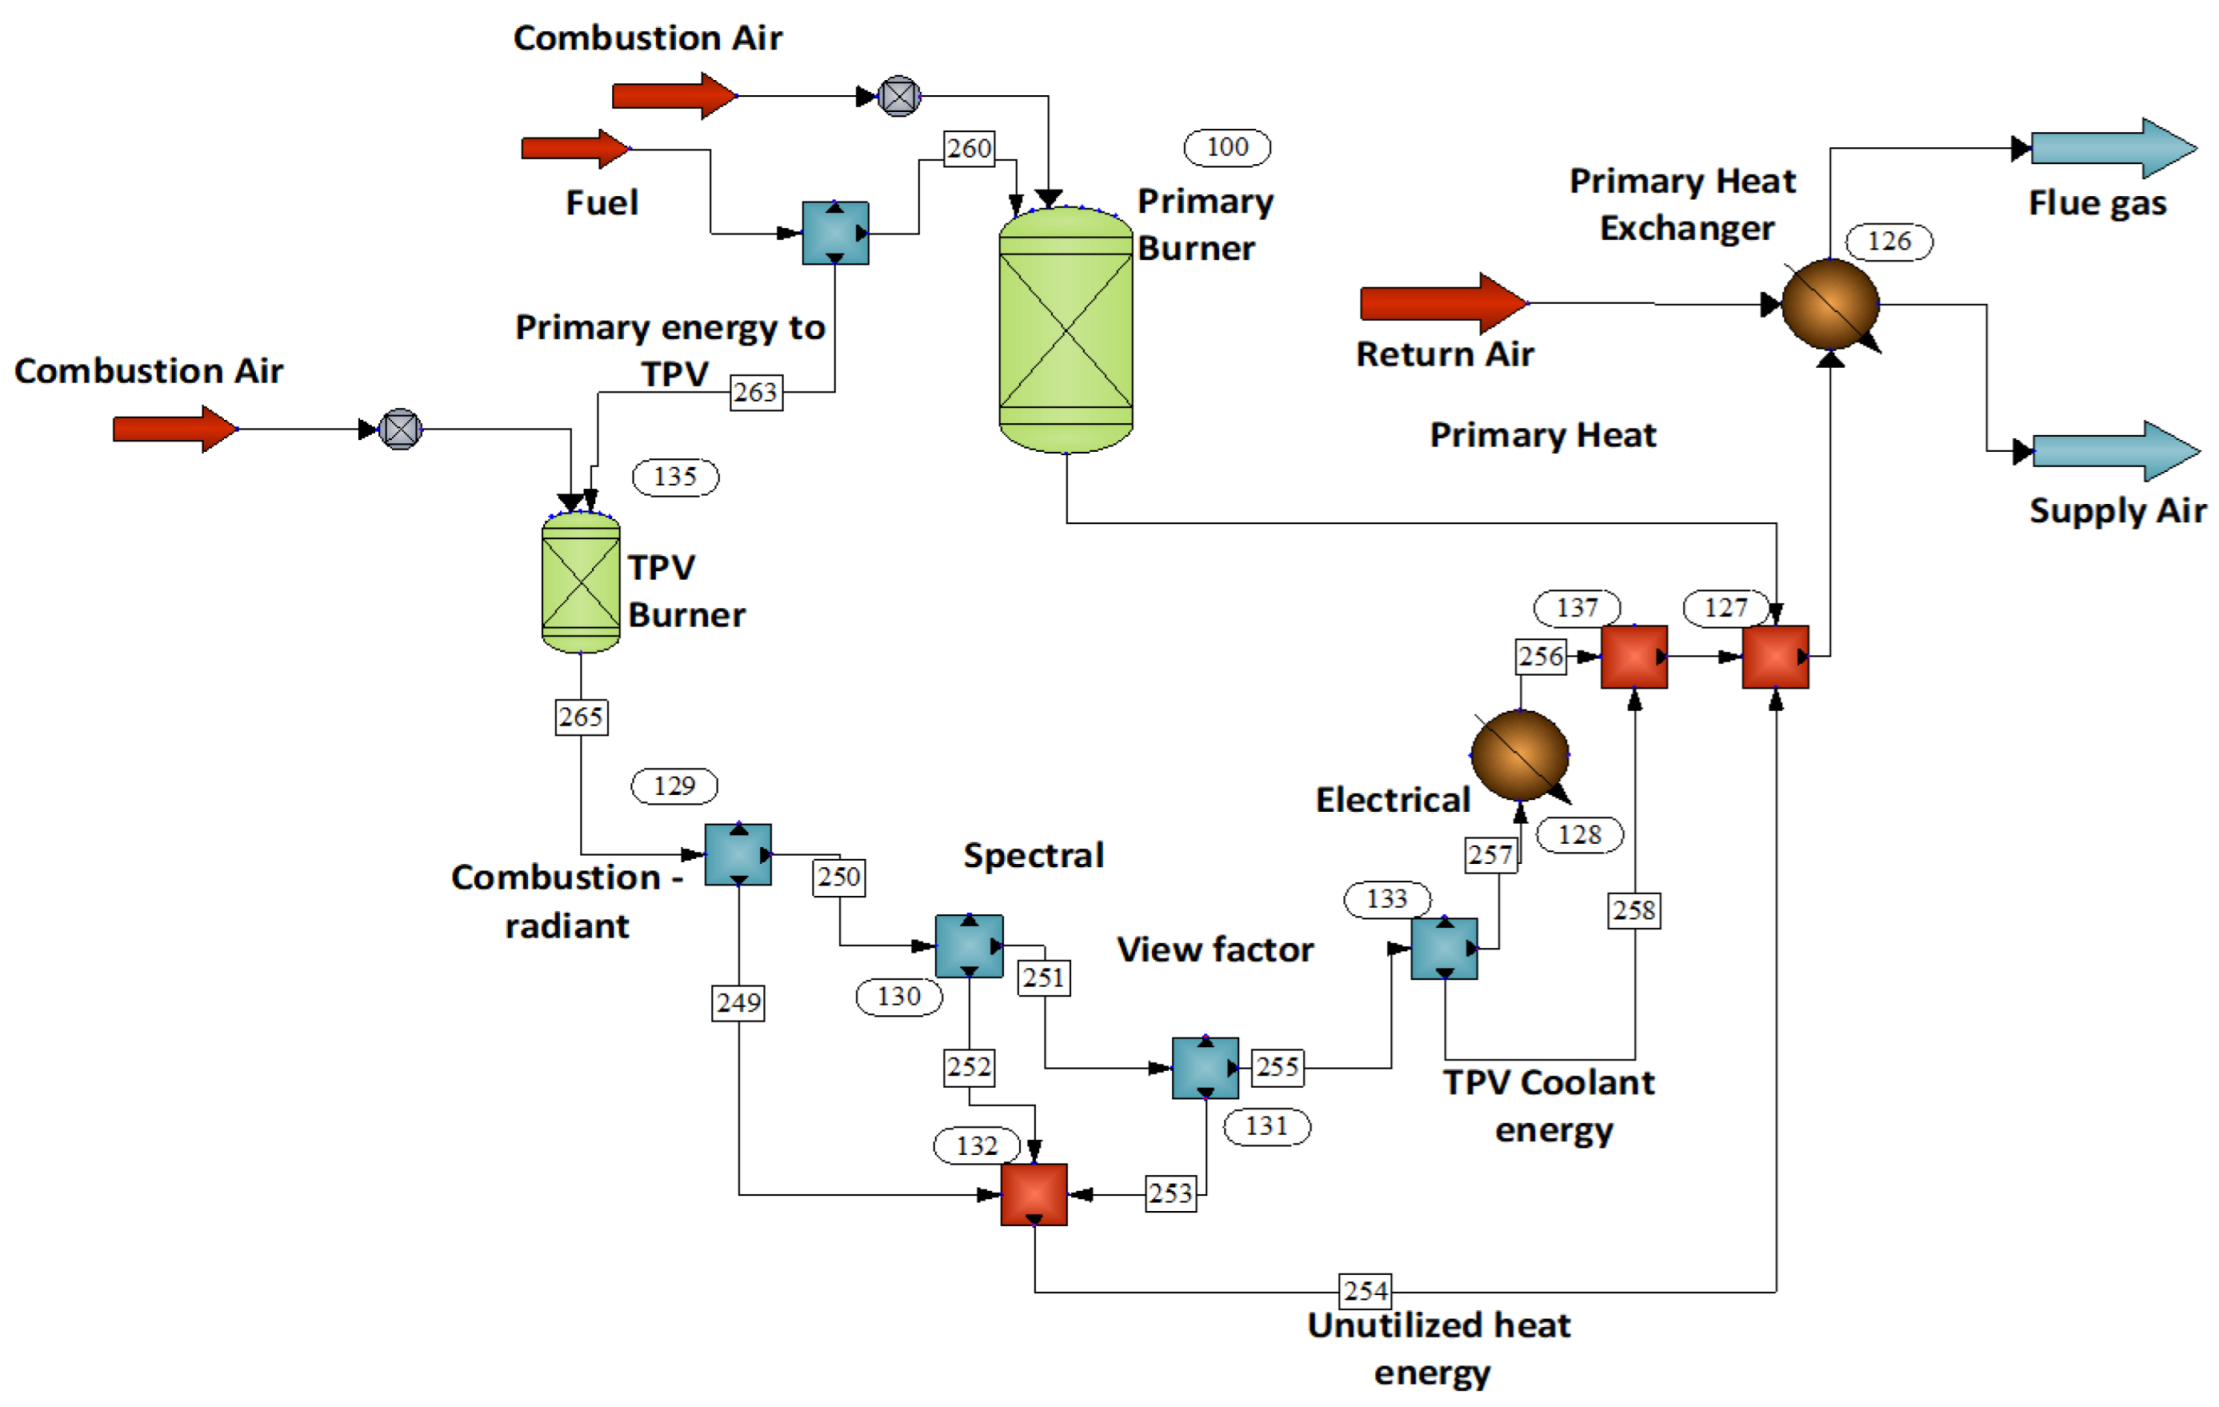
Figure 4 was utilized for a detailed analysis of the combined TPV-based self-powered system configuration while accounting for heat recovery from the power generation module. The primary difference between this configuration and the configuration presented in
Figure 2 is the addition of a dedicated burner (unit ID 135) to support the power generation operation and utilize the waste heat stream in the primary heat exchanger. The TPV module’s overall electrical efficiency is strongly correlated with the radiant heat quality, which is directly dependent upon the AFT provided by the burner. The analysis presented so far assumed an AFT of 1385 °C, typical of gas furnaces; however, temperatures in the range of 1500–2000 °C are necessary to provide the desired infrared wavelength from the emitter for efficient power generation from TPV configurations [
20,
25].
Design approaches for achieving higher emitter temperatures for efficient power generation are hence necessary. Two different process models were investigated to achieve the desired thermal condition. The first approach is based on lowering the excess combustion air (as shown in
Figure 4) for achieving higher adiabatic flame temperatures, resulting in higher electrical efficiency, the impact of which can be seen in the overall energy efficiency, as shown in
Figure 5. The second approach is based on preheating the combustion air prior to entering the combustion chamber (as shown in
Figure 6).
In the first design configuration, the natural gas fuel supply was divided into two streams to support a primary burner (unit ID 100) and a secondary TPV burner module (unit ID 135). Such an approach allows independent operation of the TPV module, avoiding interference with the primary burner operation and its sensitivity toward emissions.
The primary burner was assumed to operate at an AFT of 1385 °C and supplied with an oxygen-to-carbon ratio of 6.75, whereas the TPV burner was supplied with an oxygen-to-carbon ratio of 5.25, resulting in an AFT of 1680 °C. The enthalpy of the resultant stream from the TPV burner was split at four different stages representing combustion-to-radiant heat conversion (unit ID 129), spectral efficiency (unit ID 130), cell to emitter view factor efficiency (unit ID 131), and TPV electrical efficiency (unit ID 133). This model allows simulation of the TPV power system at a sub-component level and provides flexibility to implement empirical efficiencies as well as the ability to consider or disregard certain thermal streams in order to account for heat loss. Combined waste heat from the power generation module (stream 254) from the TPV was mixed with the combustion products generated from the primary burner.
Table 3 elaborates on the role of individual major unit operations along with key specifications and the calculated thermal property values for individual streams.
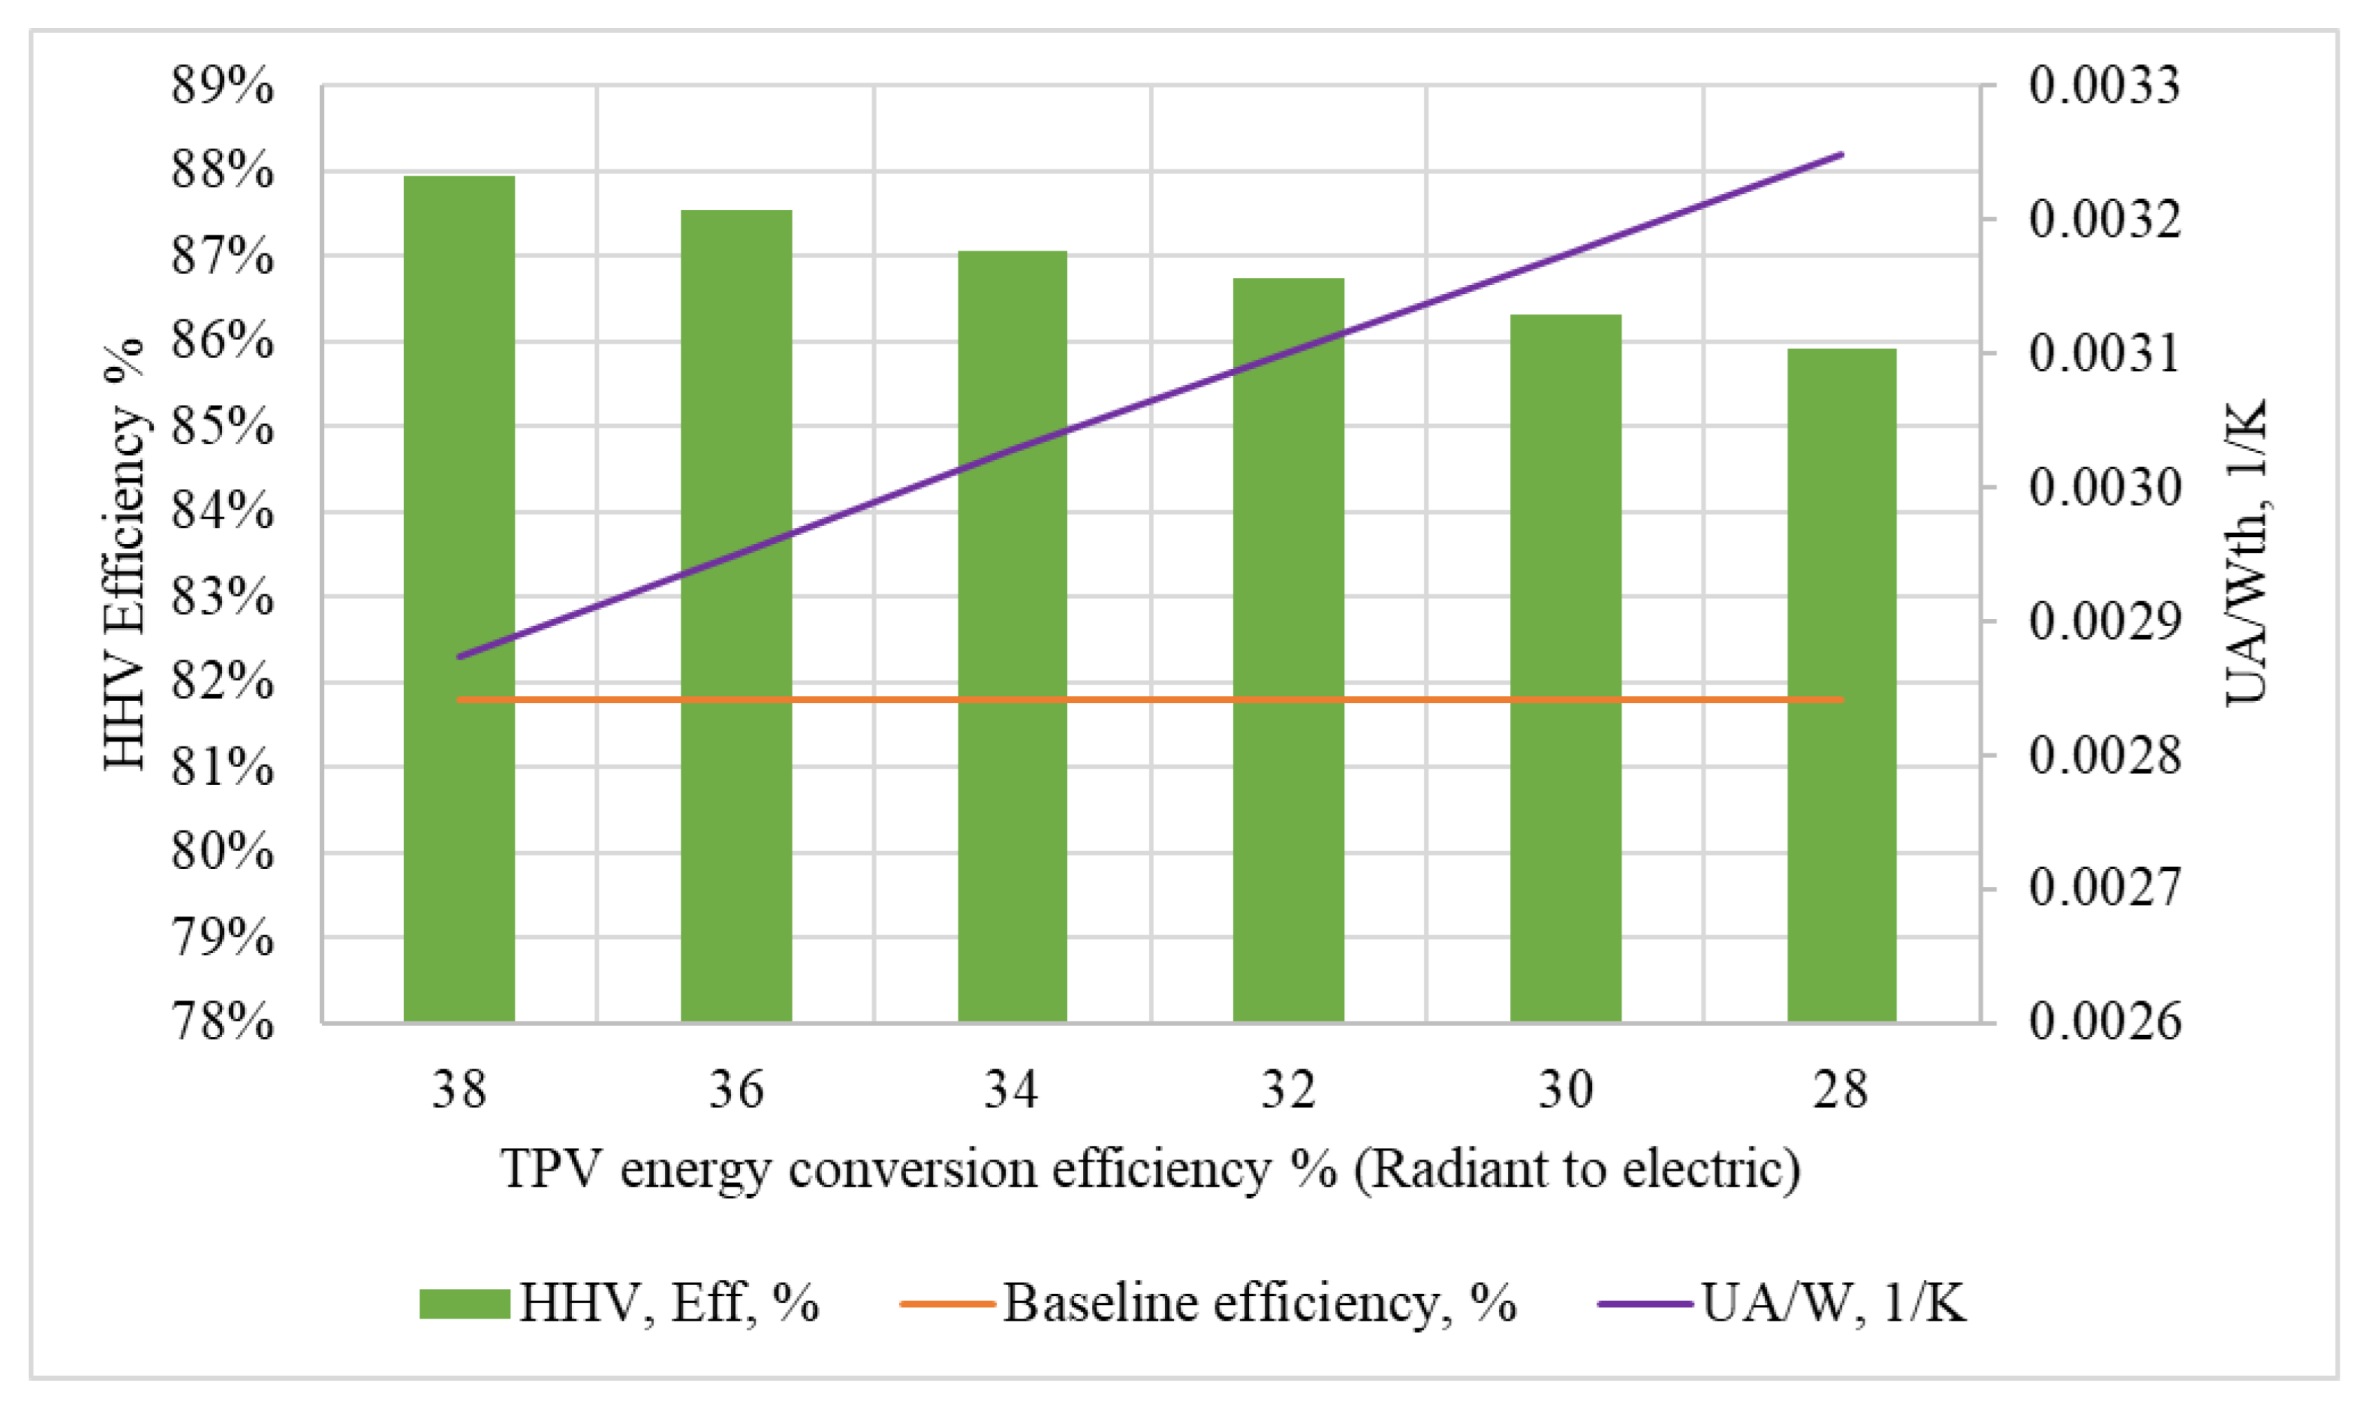
Figure 5 presents the primary energy efficiency of the self-powered furnace system generating 400 W of parasitic power in supporting the balance of plant. Also shown is the effective UA of the heat exchanger for each Watt of thermal energy supplied. The electrical efficiency of the TPV cell varied from 28% to 38% while adjusting the amount of primary energy supplied to the TPV burner (unit ID 135 in
Figure 4). As shown, the primary energy efficiency rises from 85.9% to 88% as the TPV efficiency increases from 28% to 38%, whereas the radiant, spectral, and view factor efficiencies were assumed to be 75%, 60%, and 80%, respectively [
18,
25]. Further, the required UA of the heat exchanger decreases as the power generation efficiency increases.
As discussed above, the addition of a secondary burner to design a self-contained power module for thermal integration with the primary burner and heat exchanger is one approach to achieving the desired operating temperature for the TPV module.
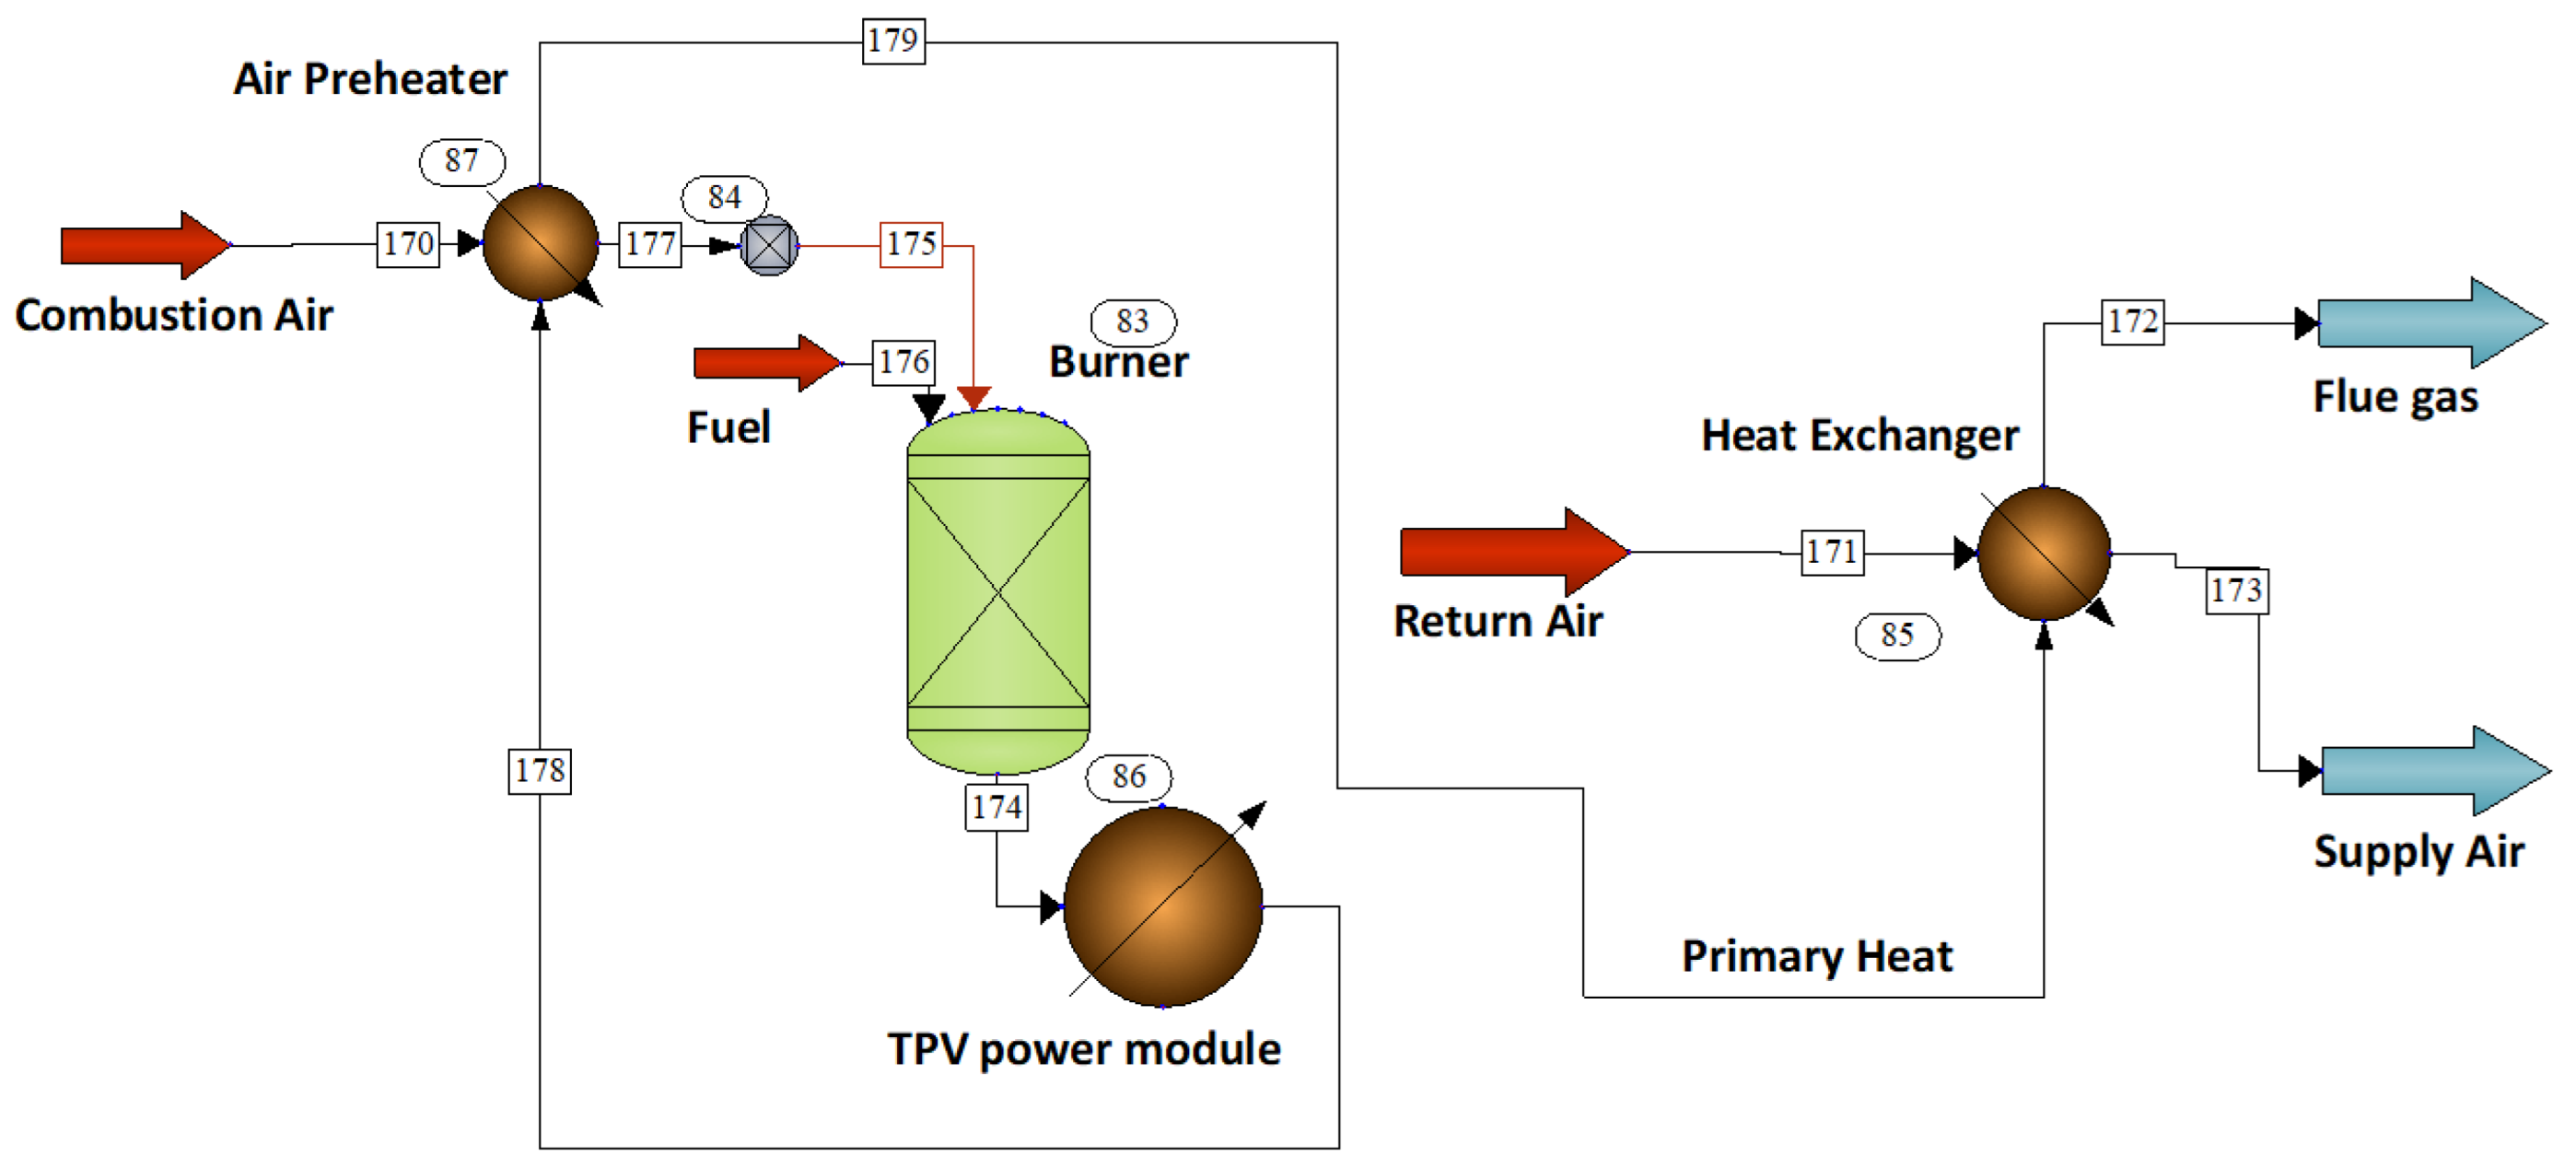
The second approach of preheating the combustion air in order to achieve higher operating temperatures targeting higher electrical efficiencies was investigated by preheating the combustion air using the combustion products (
Figure 6). The combustion air temperature was elevated by adding a heat exchanger module (unit 87) where the crossflow of the combustion products provides the necessary thermal energy.
Table 4 elaborates on the role of individual major unit operations along with key specifications and the calculated thermal property values for individual streams.
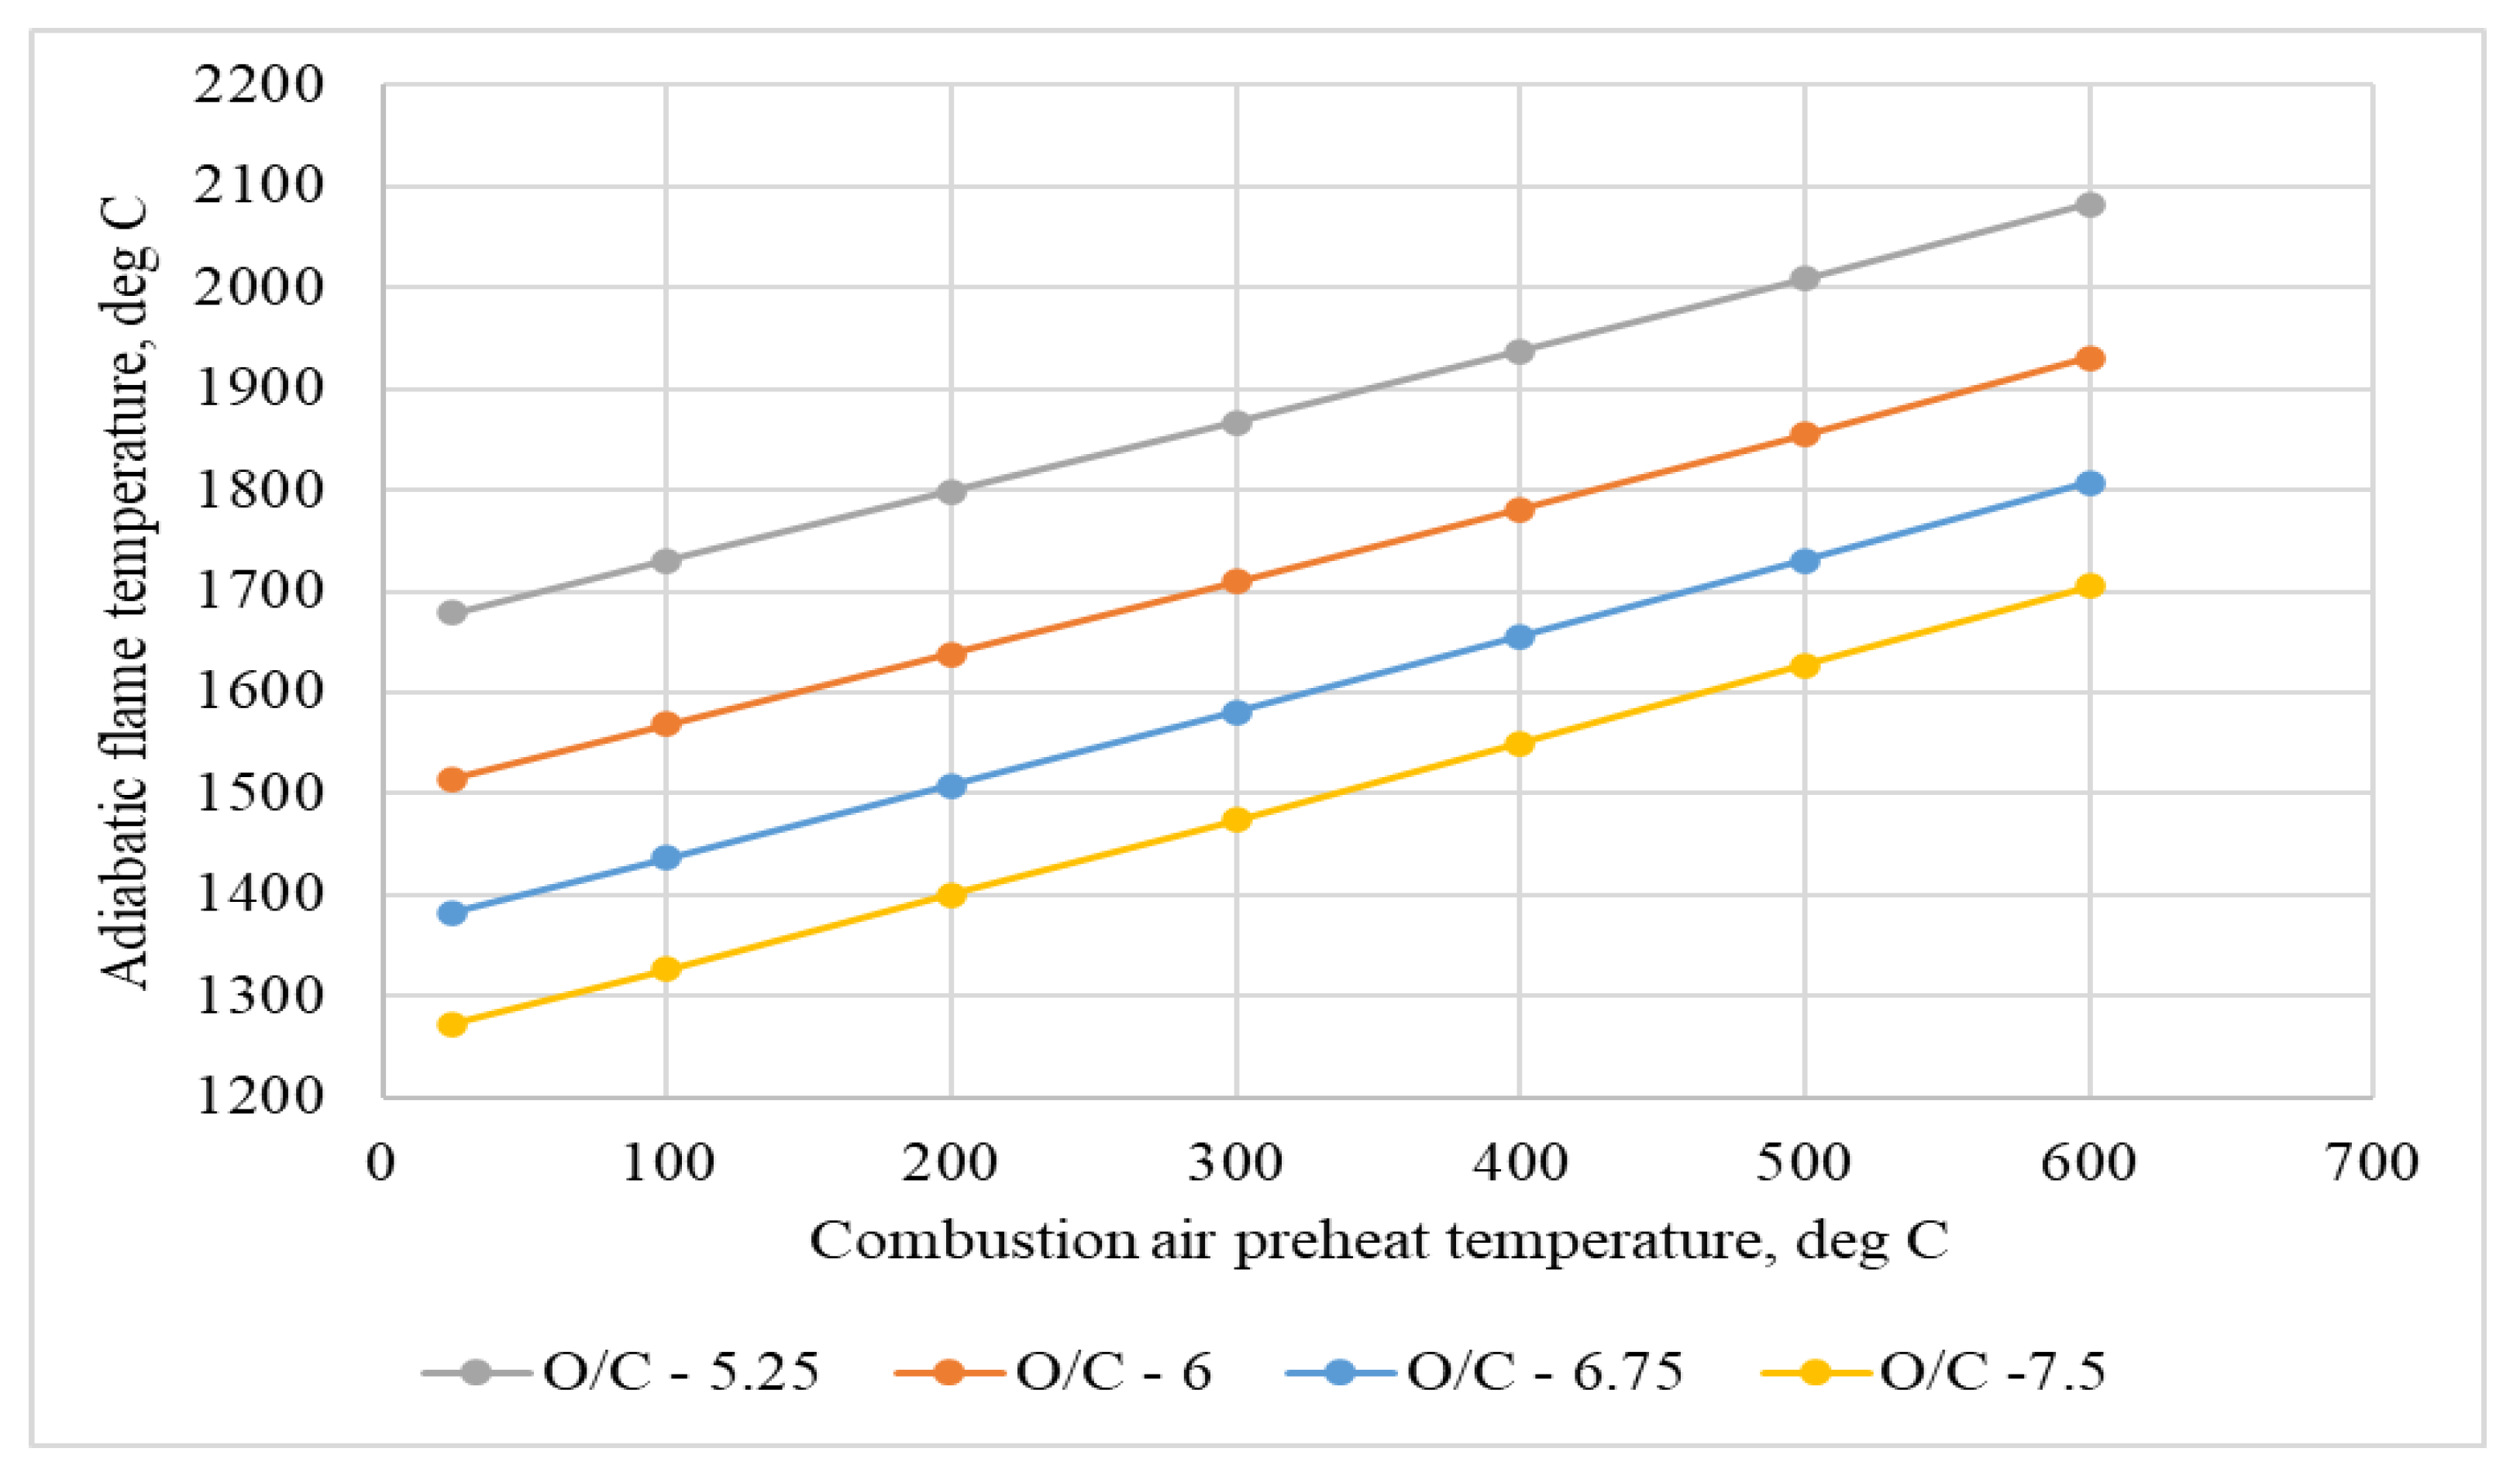
Figure 7 displays the impact of combustion air preheat temperature on the AFT when operated at different oxygen-to-carbon ratios (O/C) in the range of 5.25 to 7.5. Note that flame temperatures up to 2100 °C are possible by preheating the burner’s combustion air stream. Such a design configuration allows the desired temperature for the TPV power module; however, the system’s complexity and capital cost increase due to the additional heat exchanger. Together, these results offer design conditions and configurations possibilities for increasing the emitter temperature to achieve the higher electrical efficiencies presented in
Figure 5.
Residential gas furnaces are typically operated at an excess air-to-fuel ratio of 50 to 80% (vs. stoichiometric requirement) to meet various regulatory standards related to emissions, safety, and ventilation [
26]. Modulation of the feed ratio of the primary burner requires careful consideration due to its potential influence on emissions and safety. Thus, the standalone TPV module with its own combustion module (presented in
Figure 4) offers better controllability, design flexibility, and integration capability.
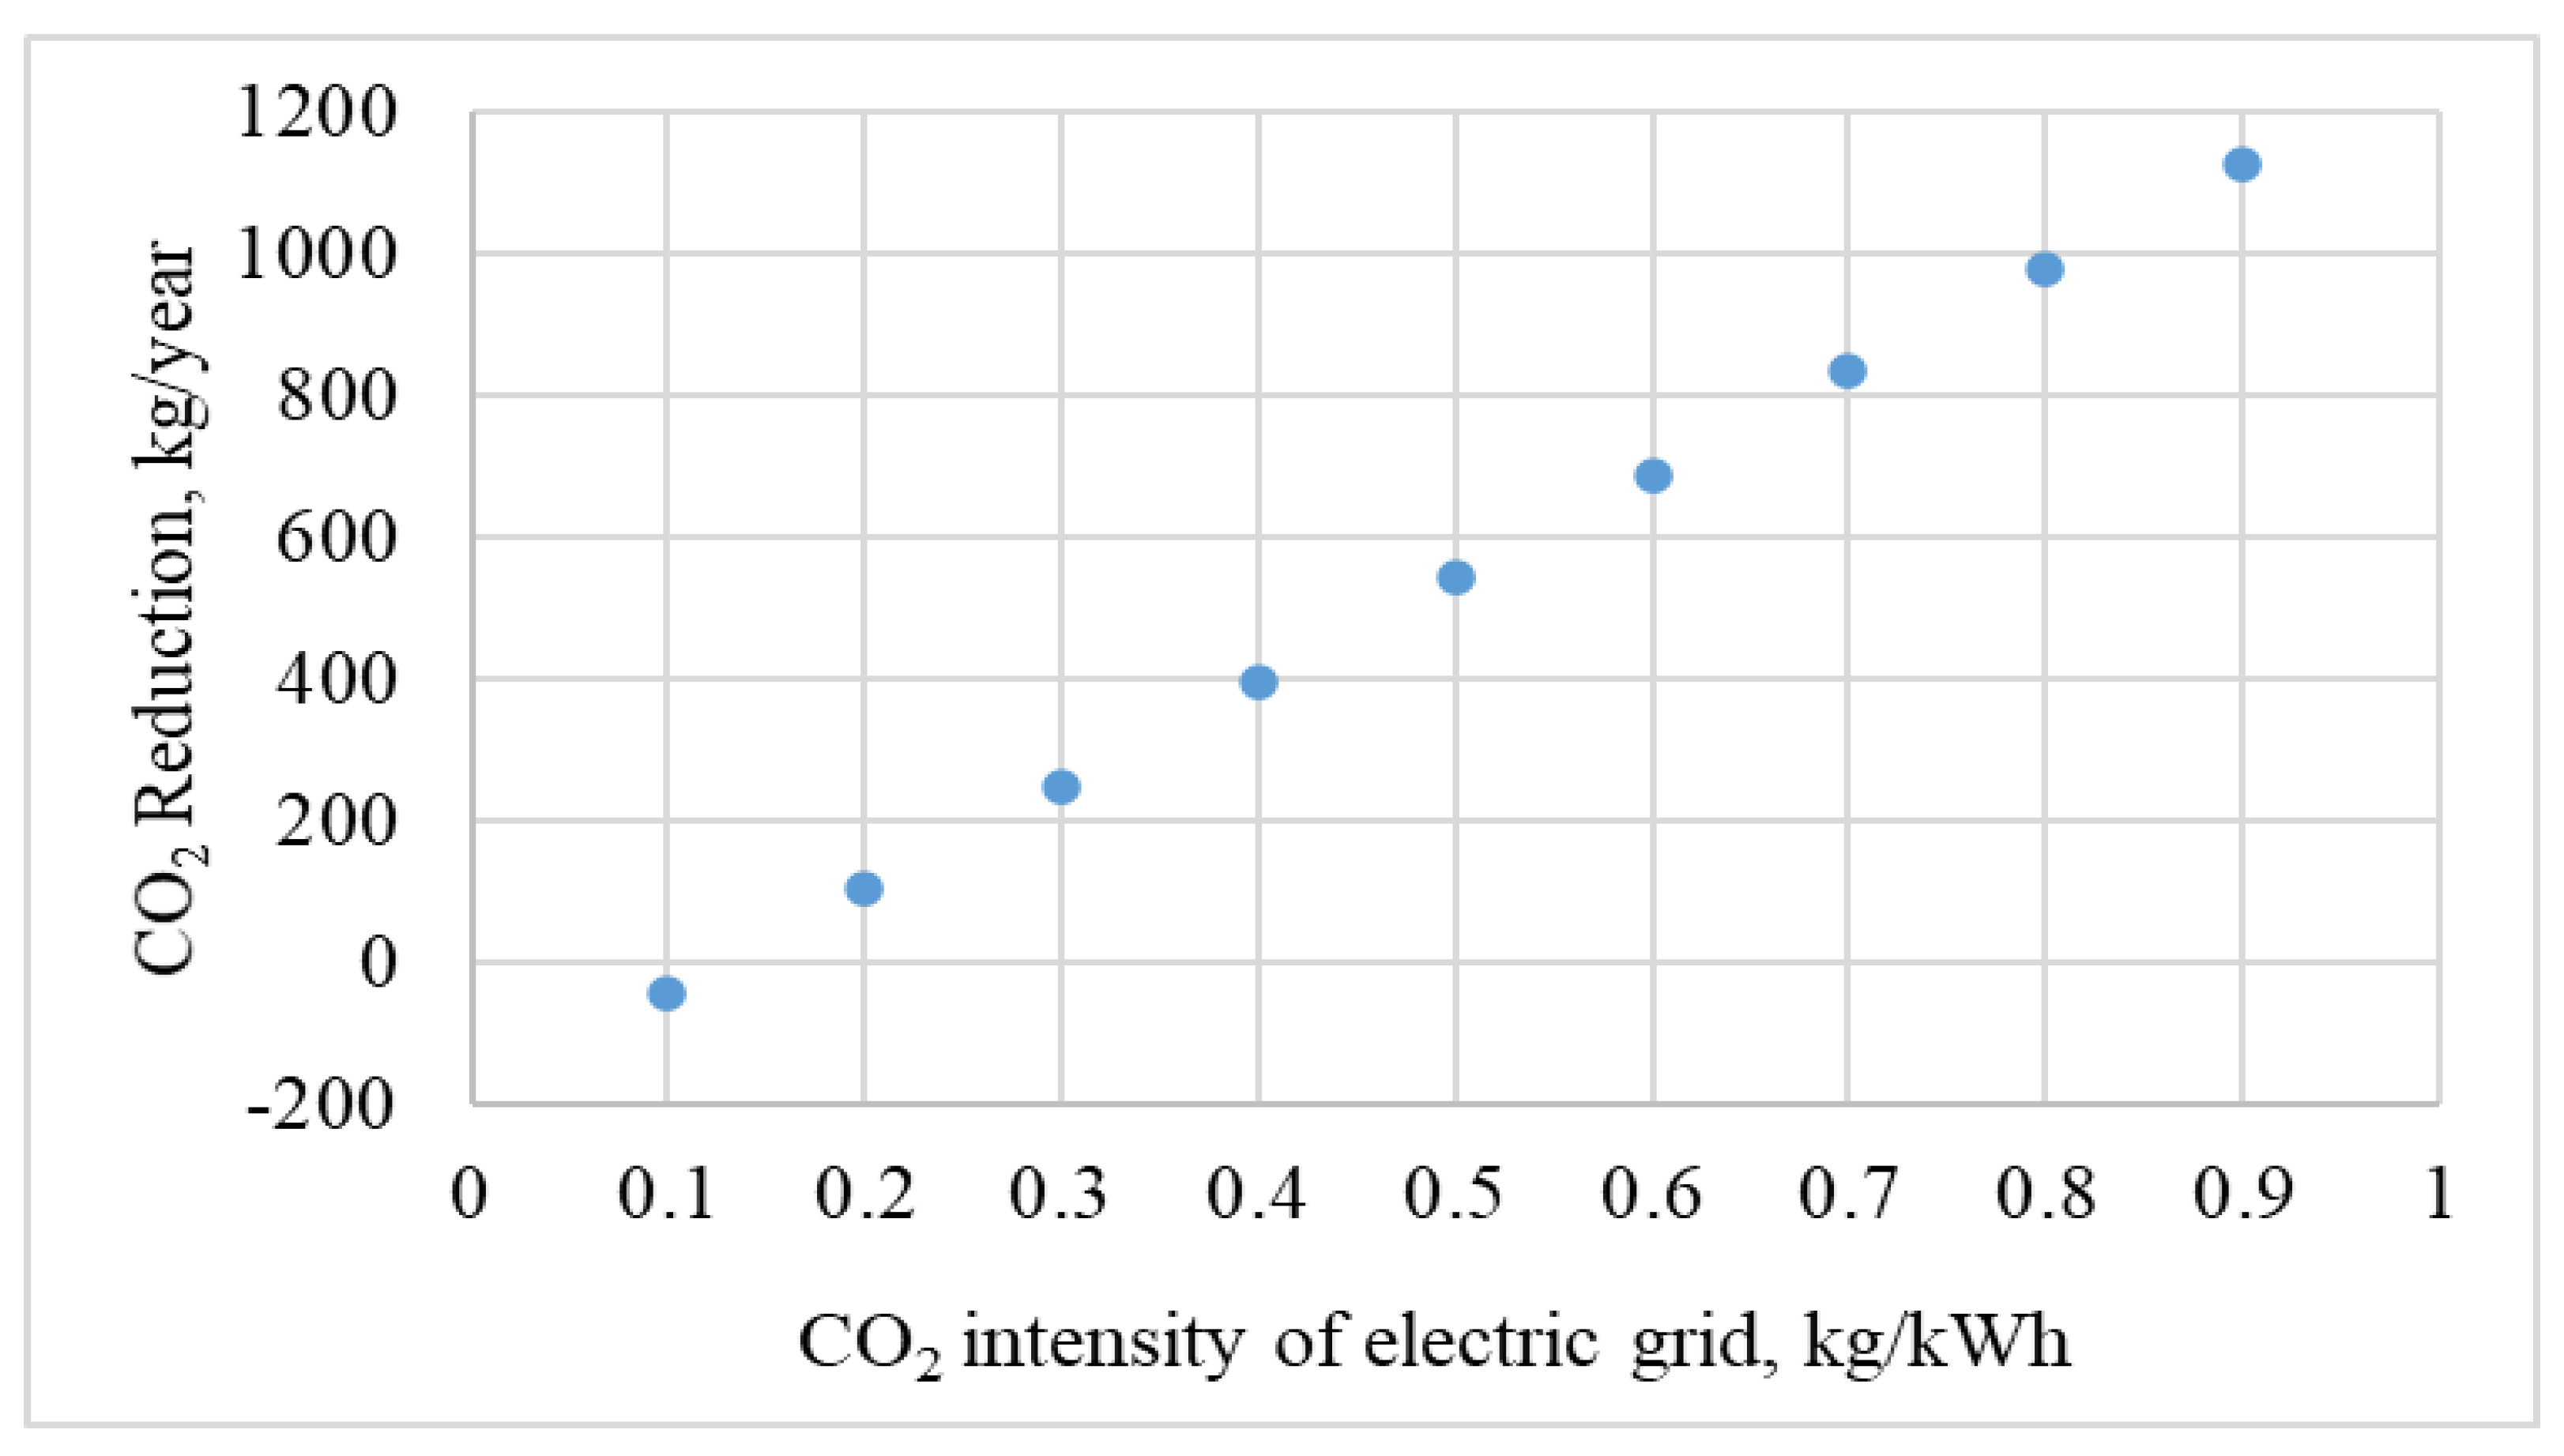
The environmental impact of a TPV-integrated self-powered furnace was also studied for potential applications in different regions, delivering the rated thermal energy. The reduction in carbon dioxide emissions for a furnace consuming 4 kWh of electric power per day was calculated for the TPV-powered furnace (0.4 kW BOP) installed in different regions.
Figure 8 shows the annual carbon dioxide emissions reduction associated with utilizing a TPV-powered furnace operated in buildings supplied with grid electricity with carbon dioxide intensities in the range of 0.2 to 0.9 kg
CO2/kWh, representative of the US electrical grid [
27]. As can be seen, compared with the baseline gas furnace, the annual carbon dioxide savings of the self-powered configuration with TPV can reach up to 1100 kg at a high grid carbon intensity of 0.9 kg/kWh and up to 550 kg at moderate carbon intensity of 0.5 kg/kWh. The benefit begins to diminish as the grid becomes cleaner and offers no environmental benefit if the electrical grid’s carbon intensity falls below 0.1 kg/kWh.
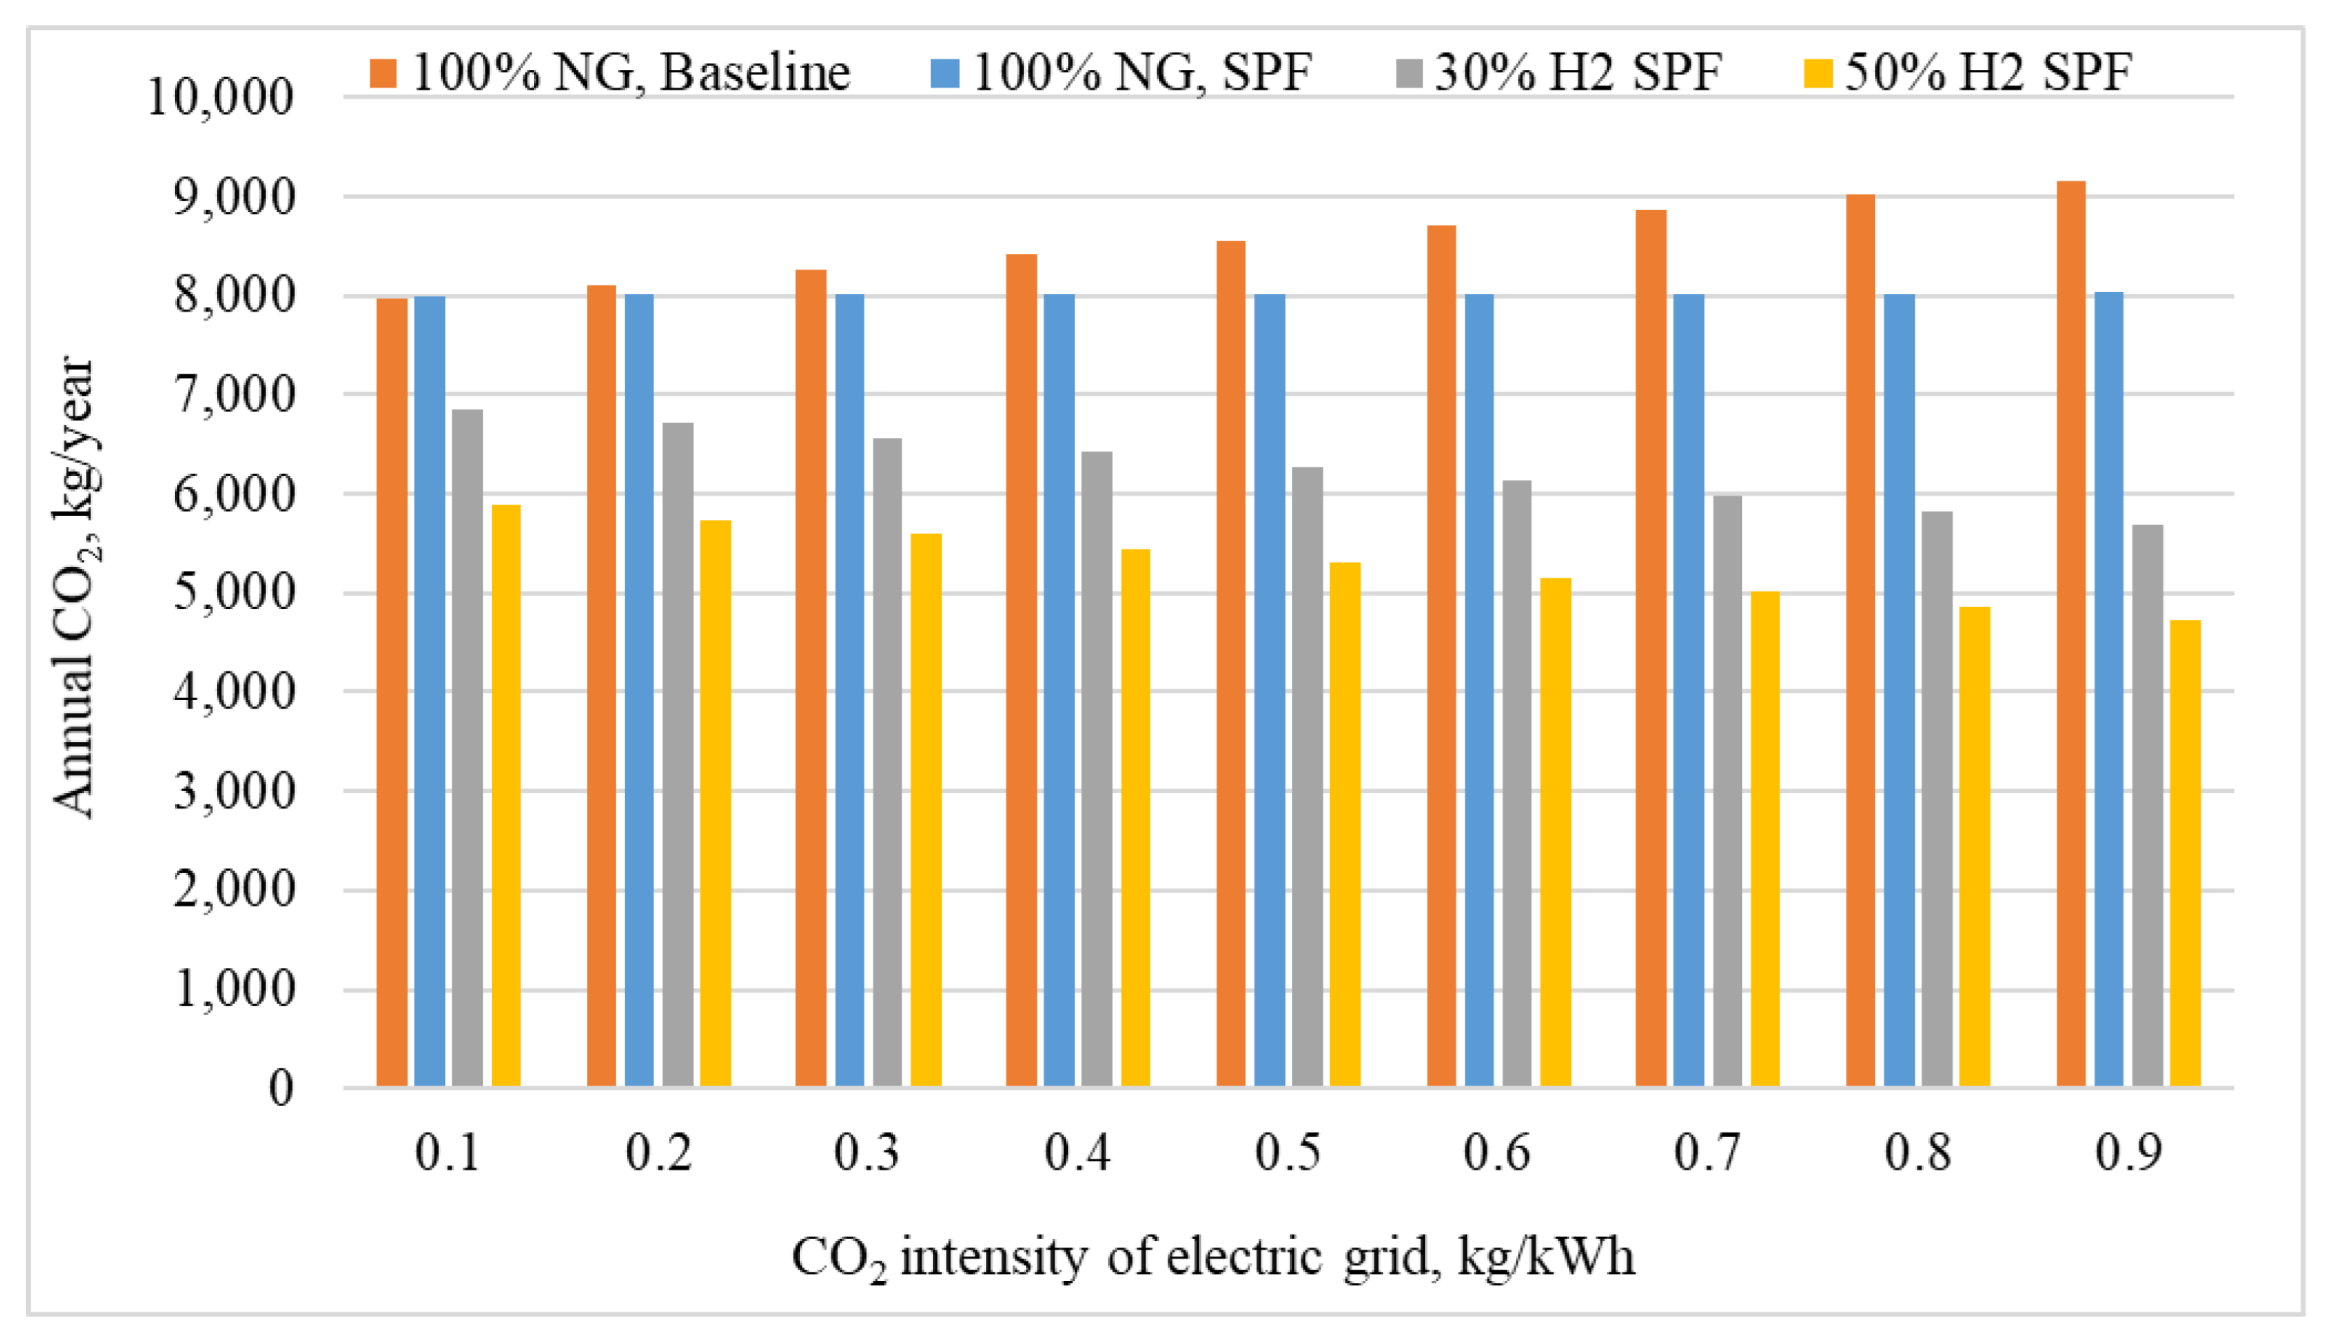
The analysis presented so far assumes natural gas as the primary fuel; however, hydrogen is being considered as a renewable fuel to help offset the carbon dioxide emissions associated with building equipment [
28]. Therefore, the impact of blending green hydrogen (with zero carbon intensity) on the carbon reduction potential of the self-powered configuration was investigated. The model presented in
Figure 4 was further analyzed with 30% and 50% renewable hydrogen blend concentration (molar percentage) in natural gas supply. The primary fuel flow rate’s energy content (higher heating value of the combined blend) was adjusted to meet the thermal rating of the furnace after generating the 0.4 kW onsite power (BOP), for a daily thermal load demand of 120 kWh. The effective carbon dioxide intensity for the 30% and 50% molar hydrogen blend in natural gas fuel was assumed to be 0.156 kg/kWh and 0.135 kg/kWh, respectively, calculated by the model presented in
Figure 4.
Figure 9 displays annual carbon dioxide emissions for the baseline and self-powered configuration operating on 100% natural gas. As shown, lower emissions are possible from the self-powered configuration due to the lower carbon intensity associated with producing 0.4 kW of parasitic power onsite vs. that generated by the electrical grid at a wide range of carbon intensities. The self-powered furnace fueled with green hydrogen blends at molar concentrations of 30% and 50% further decreases the annual carbon dioxide emissions due to a lower carbon footprint per kilowatt hour of energy supplied by the primary fuel. At a higher electric grid carbon factor of 0.9 kg/kWh, the annual carbon dioxide emissions decrease by almost half (vs. the baseline furnace operated with natural gas) when fueled with 50% hydrogen blended in a self-powered configuration.
Similarly, the economic benefit of utilizing a TPV-powered furnace consuming 4 kWh of electrical energy per day was also analyzed at different costs of electricity.
Figure 10 displays the annual utility bill savings of the TPV furnace operated in regions with electric costs ranging from USD 0.05 to 0.33 per kWh, which is representative of US regional tariffs [
23]. The annual operational energy savings of up to USD 450 can be realized as a result of lower fuel consumption and avoiding electrical grid purchases.
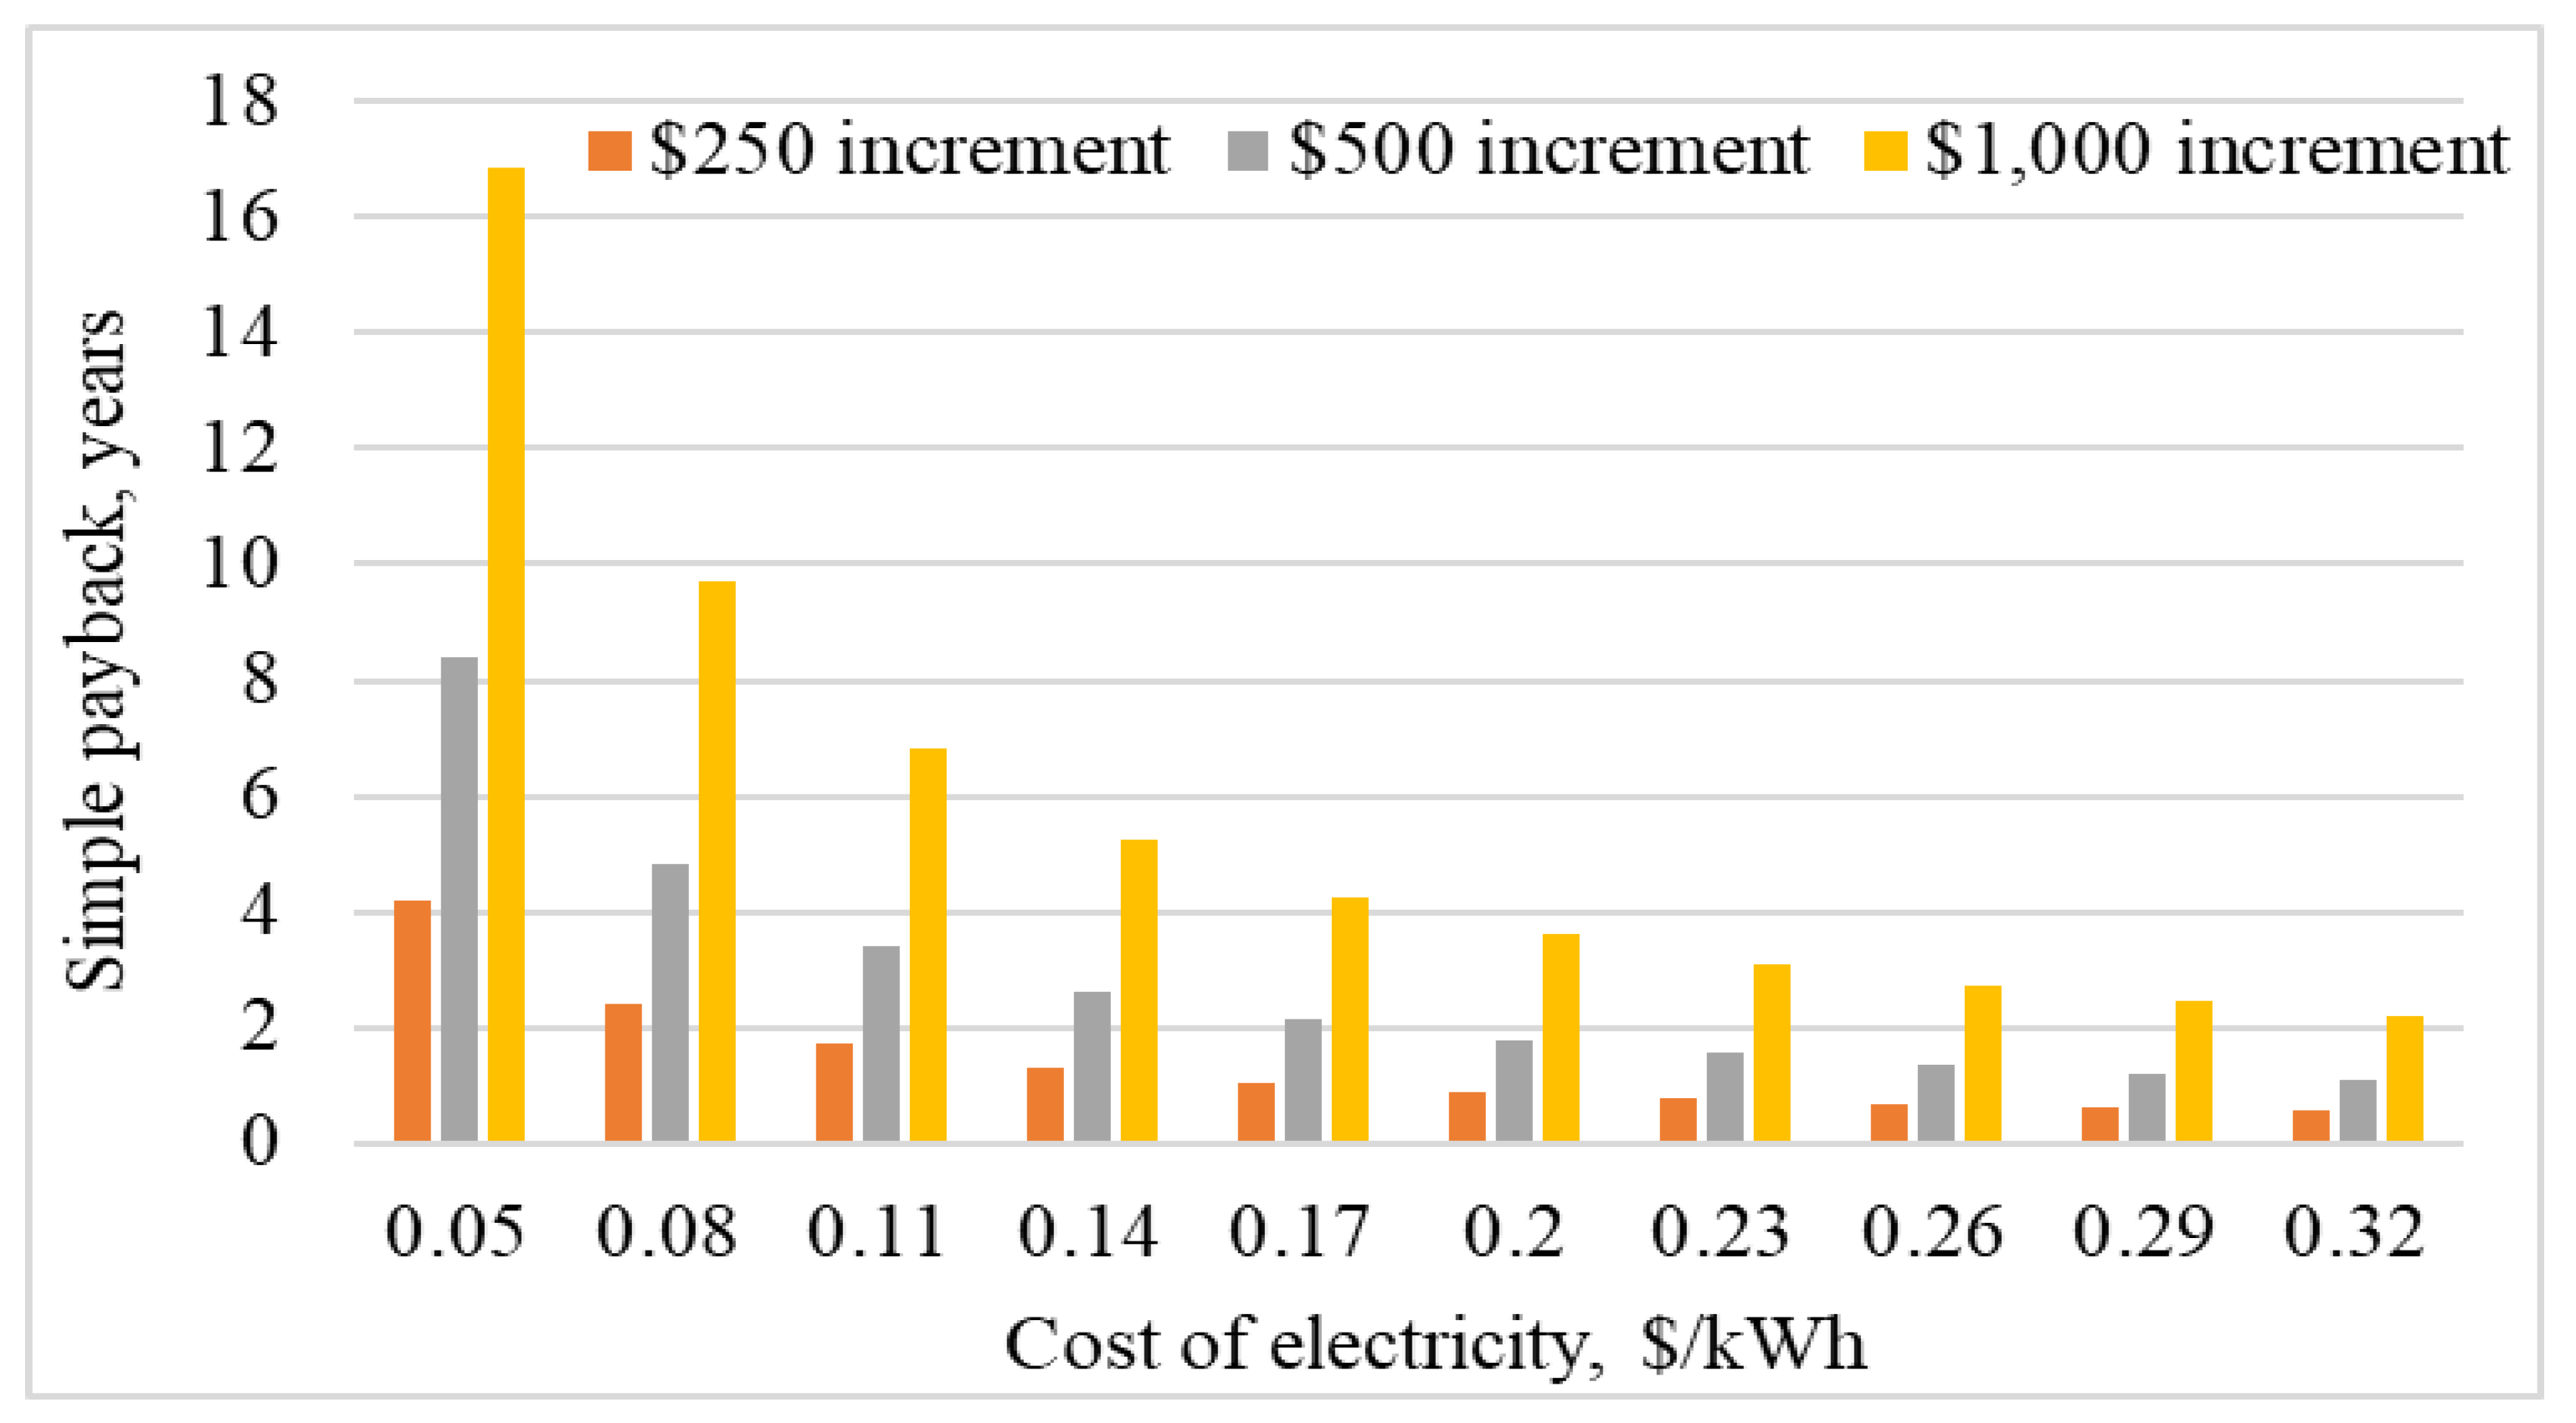
The addition of a power module to the conventional furnace will impose higher capital costs. Hence, it is important to understand the influence of these higher capital costs (difference in cost between self-powered and conventional furnace configurations, termed as incremental cost) on the payback period. The analysis was extended to calculate the simple payback period for three different incremental costs of USD 250, USD 500, and USD 1000. The payback period was calculated by dividing the incremental cost by annual energy cost savings at different costs of electricity.
Figure 11 displays the simple payback period for regions with different costs of electricity at three different incremental costs. As shown, regions with relatively higher costs of electricity benefit the most where the payback can occur in less than three years. In considering the deployability of these advanced systems, one must consider the energy and economic value proposition in addition to the ancillary advantage of resiliency.


