Review

Understanding Urban Heat Vulnerability Assessment Methods: A PRISMA Review

1
City 4.0 Lab, School of Architecture and Built Environment, Faculty of Engineering, Queensland University of Technology, 2 George Street, Brisbane, QLD 4000, Australia
2
School of Electrical Engineering and Robotics, Faculty of Engineering, Queensland University of Technology, 2 George Street, Brisbane, QLD 4000, Australia
*
Author to whom correspondence should be addressed.
Energies 2022, 15(19), 6998; https://doi.org/10.3390/en15196998
Submission received: 31 August 2022 / Revised: 20 September 2022 / Accepted: 20 September 2022 / Published: 23 September 2022
(This article belongs to the Collection Feature Papers in Energy, Environment and Well-Being)

Abstract

:
Increasingly people, especially those residing in urban areas with the urban heat island effect, are getting exposed to extreme heat due to ongoing global warming. A number of methods have been developed, so far, to assess urban heat vulnerability in different locations across the world concentrating on diverse aspects of these methods. While there is growing literature, thorough review studies that compare, contrast, and help understand the prospects and constraints of urban heat vulnerability assessment methods are scarce. This paper aims to bridge this gap in the literature. A systematic literature review with the preferred reporting items for systematic reviews and meta-analyses (PRISMA) approach is utilized as the methodological approach. PRISMA is an evidence-based minimum set of items for reporting in systematic reviews and meta-analyses. The results are analyzed in three aspects—i.e., indicators and data, modelling approaches, and validation approaches. The main findings disclose that: (a) Three types of indicators are commonly used—i.e., demographic properties and socioeconomic status, health conditions and medical resources, and natural and built environmental factors; (b) Heat vulnerability indexing models, equal weighting method, and principal component analysis are commonly used in modelling and weighting approaches; (c) Statistical regressions and correlation coefficients between heat vulnerability results and adverse health outcomes are commonly used in validation approaches, but the performance varies across studies. This study informs urban policy and generates directions for prospective research and more accurate vulnerability assessment method development.

1. Introduction

In recent years, with the rise in climate change impact, urban heat has become a major issue for many cities to tackle as a consequence [1,2,3]. Extreme heat events are becoming more frequent and intense in recent years due to climate change, which has directly caused a substantial increase in heat-related morbidity and mortality [4,5,6,7]. This indispensably puts extra burden on medical systems and national finance [8,9,10]. Meanwhile, the urban heat island (UHI) effect has been exaggerating the consequences caused by the increased extreme heat in metropolitan areas [11,12]. Hence, it is urgent for local governments to locate the harmful heat and identify the characteristics of vulnerable populations.
An increasing number of methods have been developed to assess urban heat vulnerability in different locations across the world concentrating on diverse aspects [13,14,15], with the aim of helping local urban planning departments to make scientific and effective planning and policies on mitigating the impacts of extreme heat [11,16,17]. Before 2010, there were only a few studies [18,19] modelling urban heat vulnerability in limited locations. In 2009, Reid et al. [20] disruptively proposed a heat vulnerability index (HVI), with which they located heat vulnerability at the census-tract-level and recognized potential areas where mitigation interventions were urgently needed. Since then, a substantial number of related research has been conducted, especially during the last five years or so [21].
Varying heat vulnerability models has been built by combining different types of heat-related indicators to identify vulnerable populations, areas exposed to increased extreme heat [22,23] and assess the spatiotemporal distributions to provide policy directions for policymakers [24,25]. Boumans et al. [13] developed a modelling and support platform for climate change and applied it to examine how heat stress influenced heat-related illness and death. El-Zein & Tonmoy [26] employed 22 heat-related indicators in a multicriteria outranking model to assess the vulnerability to increased extreme heat in 15 government areas of Sydney. Estoque et al. [27] used seven environmental and social-ecological indicators to assess heat health risks in 139 Philippian cities during hot, dry seasons.
Nonetheless, there were no criteria in the indicator selection in terms of types or amounts because the indicator selection relied critically on local contexts [28,29]. Local characteristics of population, infrastructure, and ecosystem play an essential role in heat vulnerability assessment. Additionally, indicators for the model development and validation were constrained by data availability and the researchers’ subjective judgment [30,31]. Modelling methods and validation methods were different in heat vulnerability assessments due to the lack of generic references. These facts are not conducive to comparative studies and the applications of heat vulnerability models [32,33]. To date, there is no widely acknowledged standardized system of heat vulnerability assessment. Therefore, a systematic review is urgently needed to identify currently available heat vulnerability assessment methods and their capabilities.
As underlined above, although there is growing literature on heat vulnerability assessment, thorough review studies which compare, contrast, and help understand the prospects and constraints of urban heat vulnerability assessment methods are scarce. Against this brief backdrop, the study at hand aims to fill this gap through a systematic review. The rest of the paper is structured as follows: Section 2 introduces the methodological approach, Section 3 presents the results, Section 4 discusses the findings, and Section 5 concludes the paper.

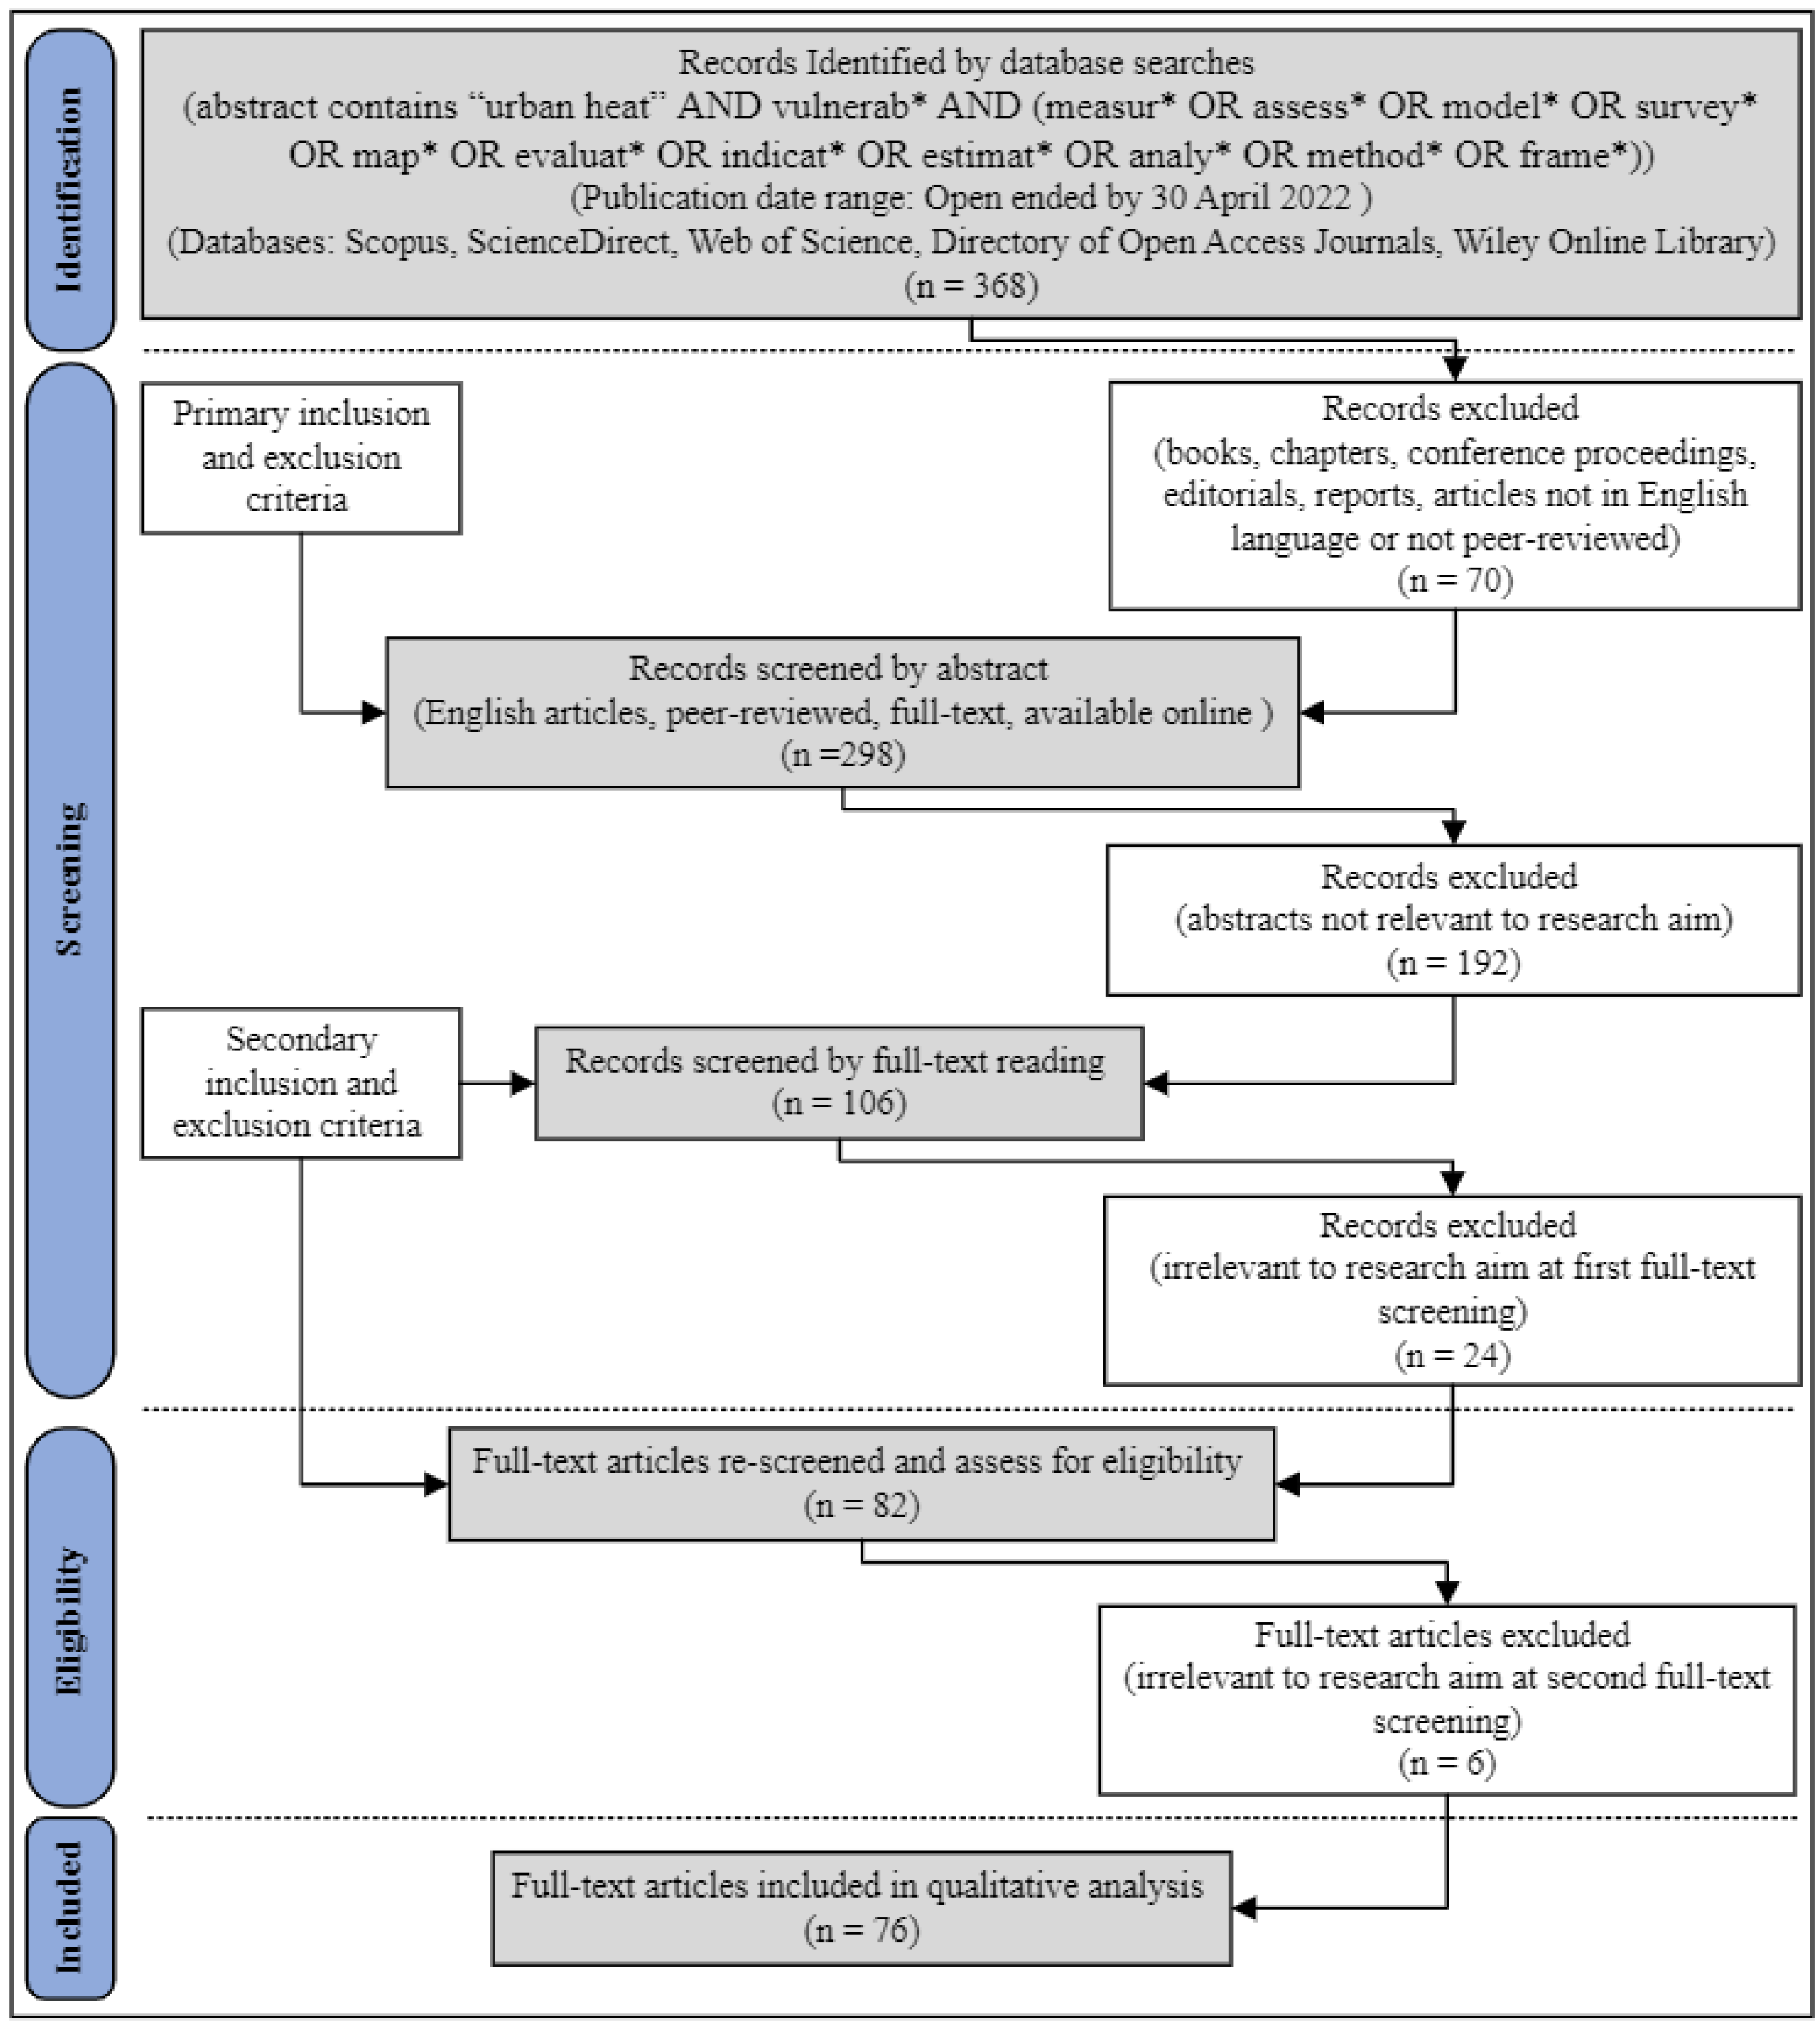
2. Materials and Methods

This study aimed to tackle the research question of ‘what are the methods to assess urban heat vulnerability’ by undertaking a systematic review of the literature with the preferred reporting items for systematic reviews and meta-analyses (PRISMA) approach. PRISMA “is an evidence-based minimum set of items for reporting in systematic reviews and meta-analyses” [34]. PRISMA is primarily used in the reporting of reviews, focusing on the evaluation of the effects of the interventions (i.e., evaluating etiology, prevalence, diagnosis, or prognosis). It is also broadly applied as a basic framework in reporting systematic reviews with objectives. Following the lead of Regona et al.’s PRISMA review study [35]—a three-phase approach including planning, review, and reporting—was selected as the methodological approach for the review.
At the planning phase, the research objective, research question, keywords, and the inclusion and exclusion criteria were developed (Table 1). The research aim was organized to produce useful findings to form a deeper understanding on the prospects and constraints of urban heat vulnerability assessment methods. The inclusion criteria included available online and peer-reviewed English journal articles which were relevant to the research aim. An academic search engine provided by the library of Queensland University of Technology was used to conduct the online search. This library search engine offered access to all major databases. The search was carried out in April 2022 and used the following query string: ((title OR abstract OR keyword) contains “urban heat” AND vulnerab* AND (measur* OR assess* OR model* OR survey* OR map* OR evaluat* OR indicat* OR estimat* OR analy* OR method* OR frame*)) to search titles, keywords, and abstracts of relevant publications—i.e., journal articles. The publication date of the search was intentionally left open to include as much literature as possible in the review. If the abstract of the article was associated with the research aim, it would be included in the full-text reading process to determine whether it could be included in the final analysis.
At the review phase, a selected articles review was undertaken. A total of 368 records were captured in the first search (Figure 1). The evaluation of these records against the inclusion and exclusion criteria brought the number down to 298 articles. These articles were carefully rechecked to ensure consistency with the keyword search. Additionally, the abstracts of the pool of articles were evaluated against the question and aim of the research. Following this, the duplicate records obtained from various databases were removed. This process brought the number of articles down to the figure of 106. At the next stage the full texts of all shortlisted articles were read and the ones that did not comply with the question and aim were removed. This left us with 82 articles. After another round of full-text screening, the number of articles were reduced to 76. Then this list was reviewed and analyzed on three aspects—i.e., indicators and data, modelling approaches, validation approaches. The categorization criteria are presented in Table 2.
The final reporting phase concerned the reporting of the identified results and findings from the systematic review of the final 76 journal articles. A list of these papers is provided in Appendix A. A discussion of the prospects and constraints of urban heat vulnerability assessment methods was outlined.

3. Results

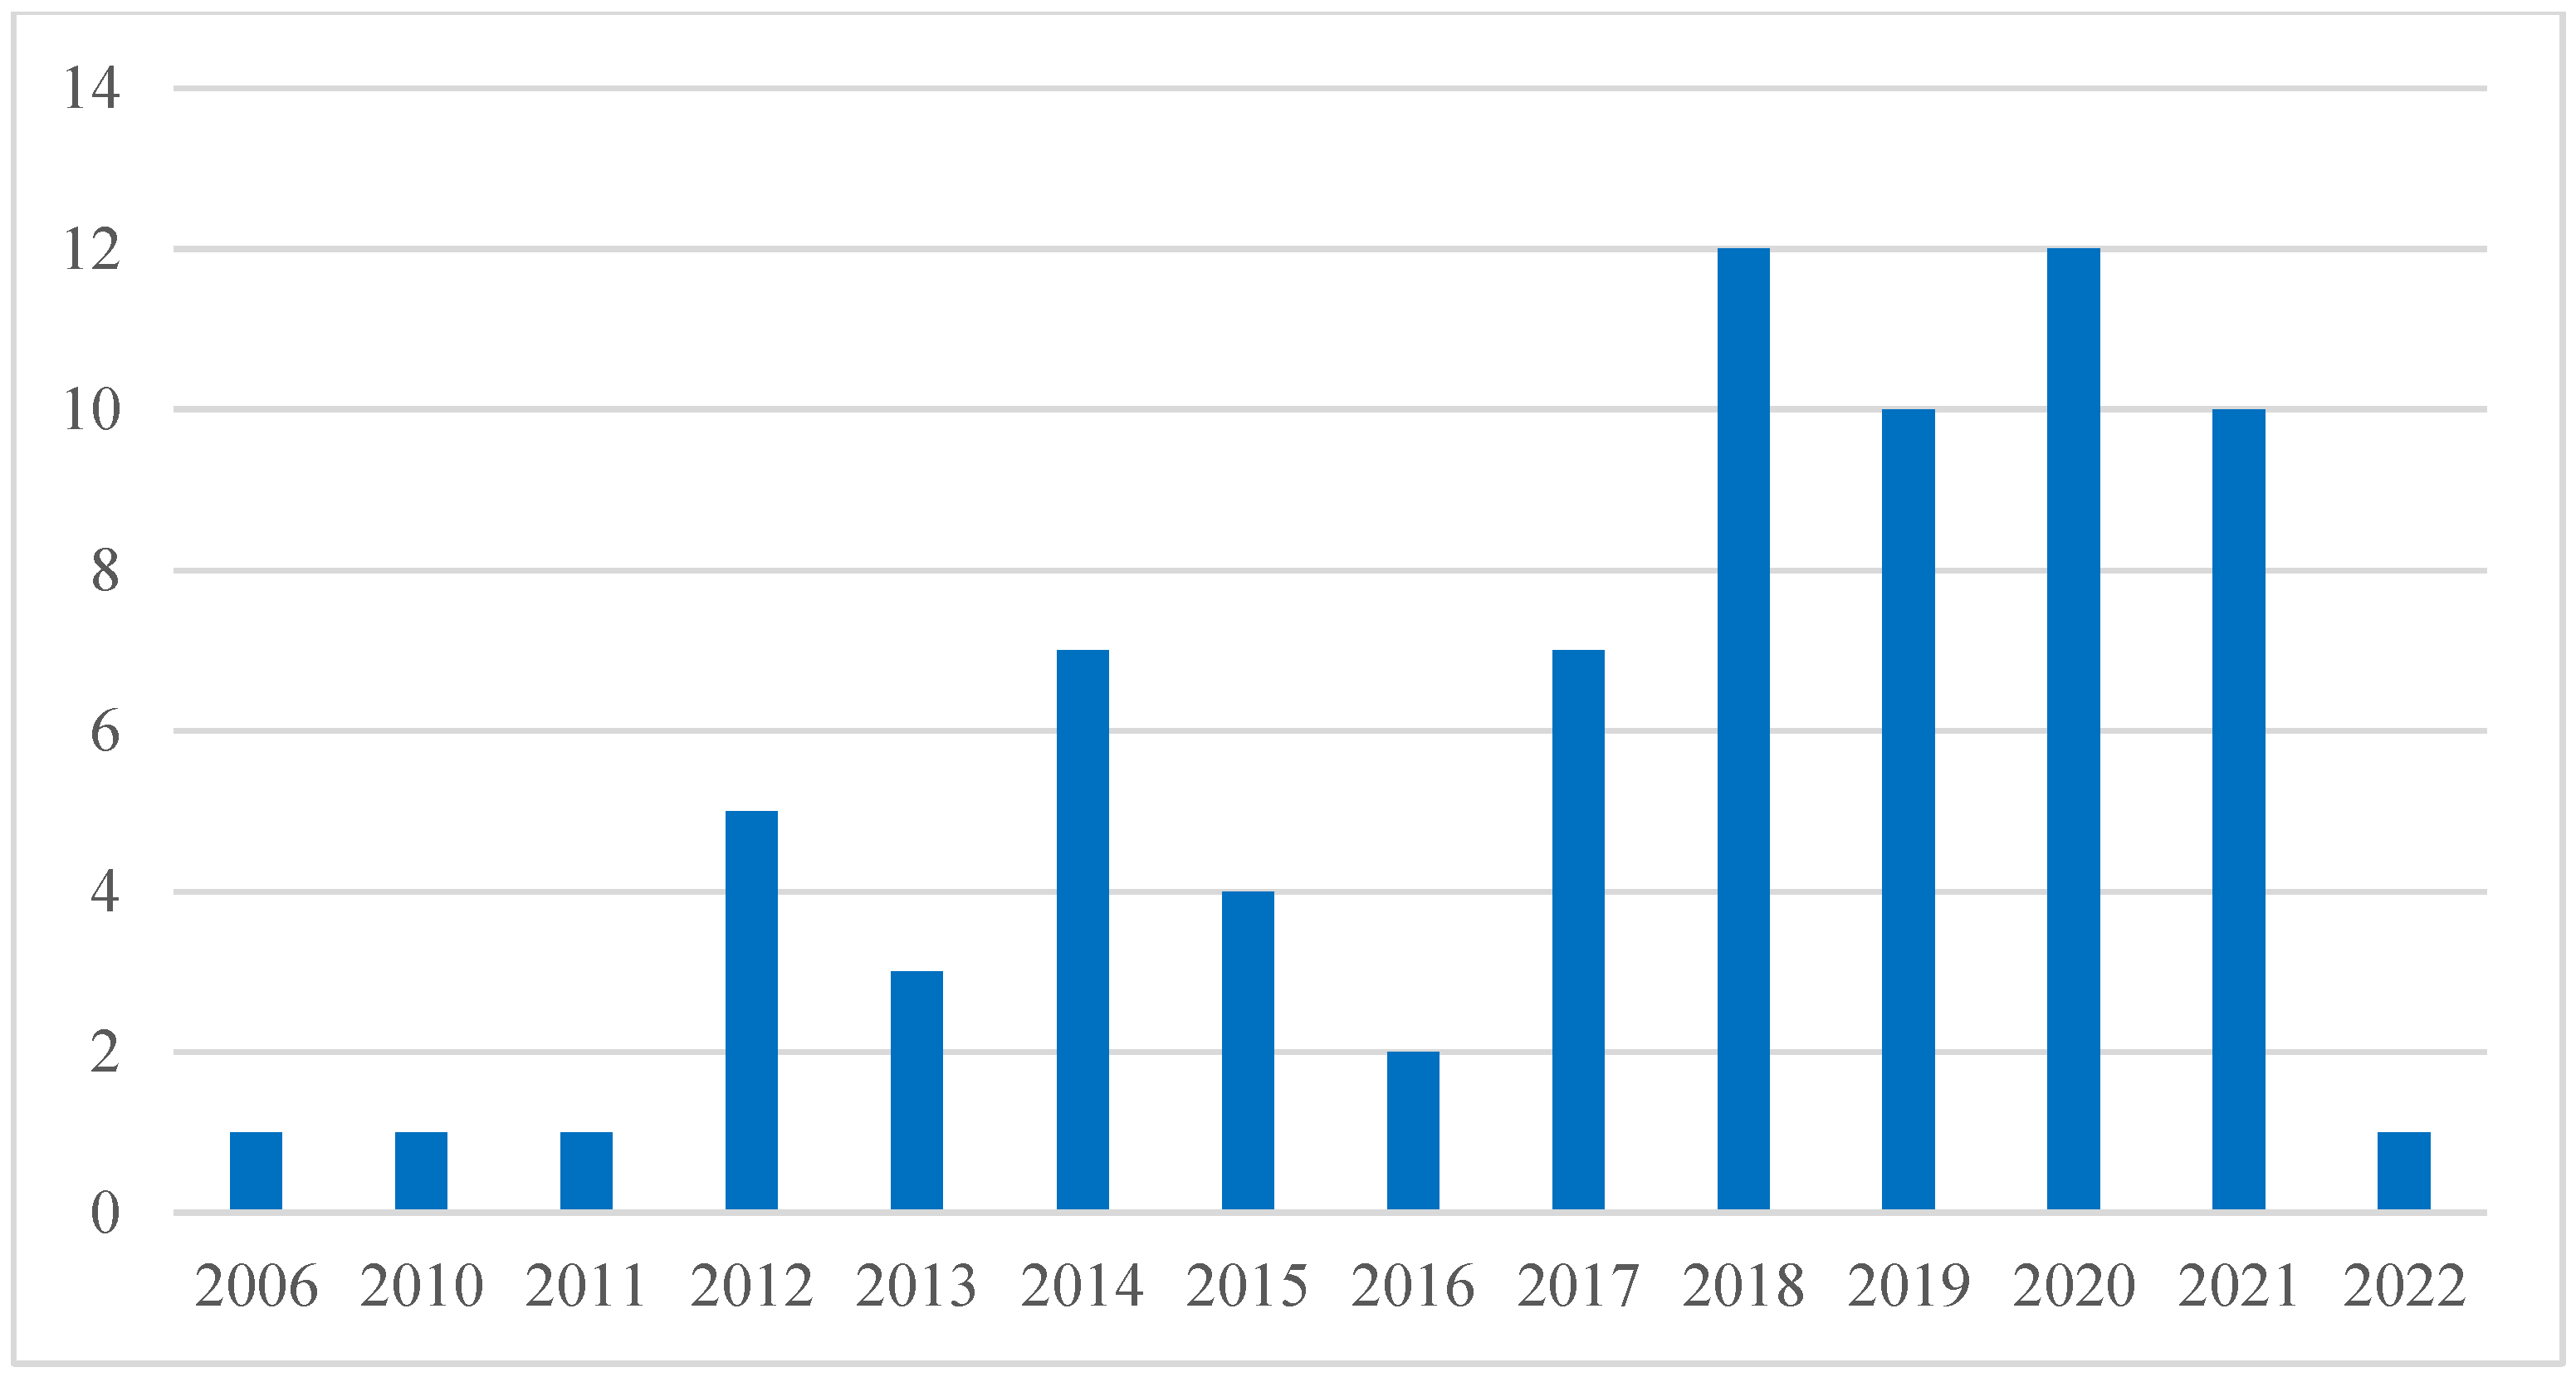
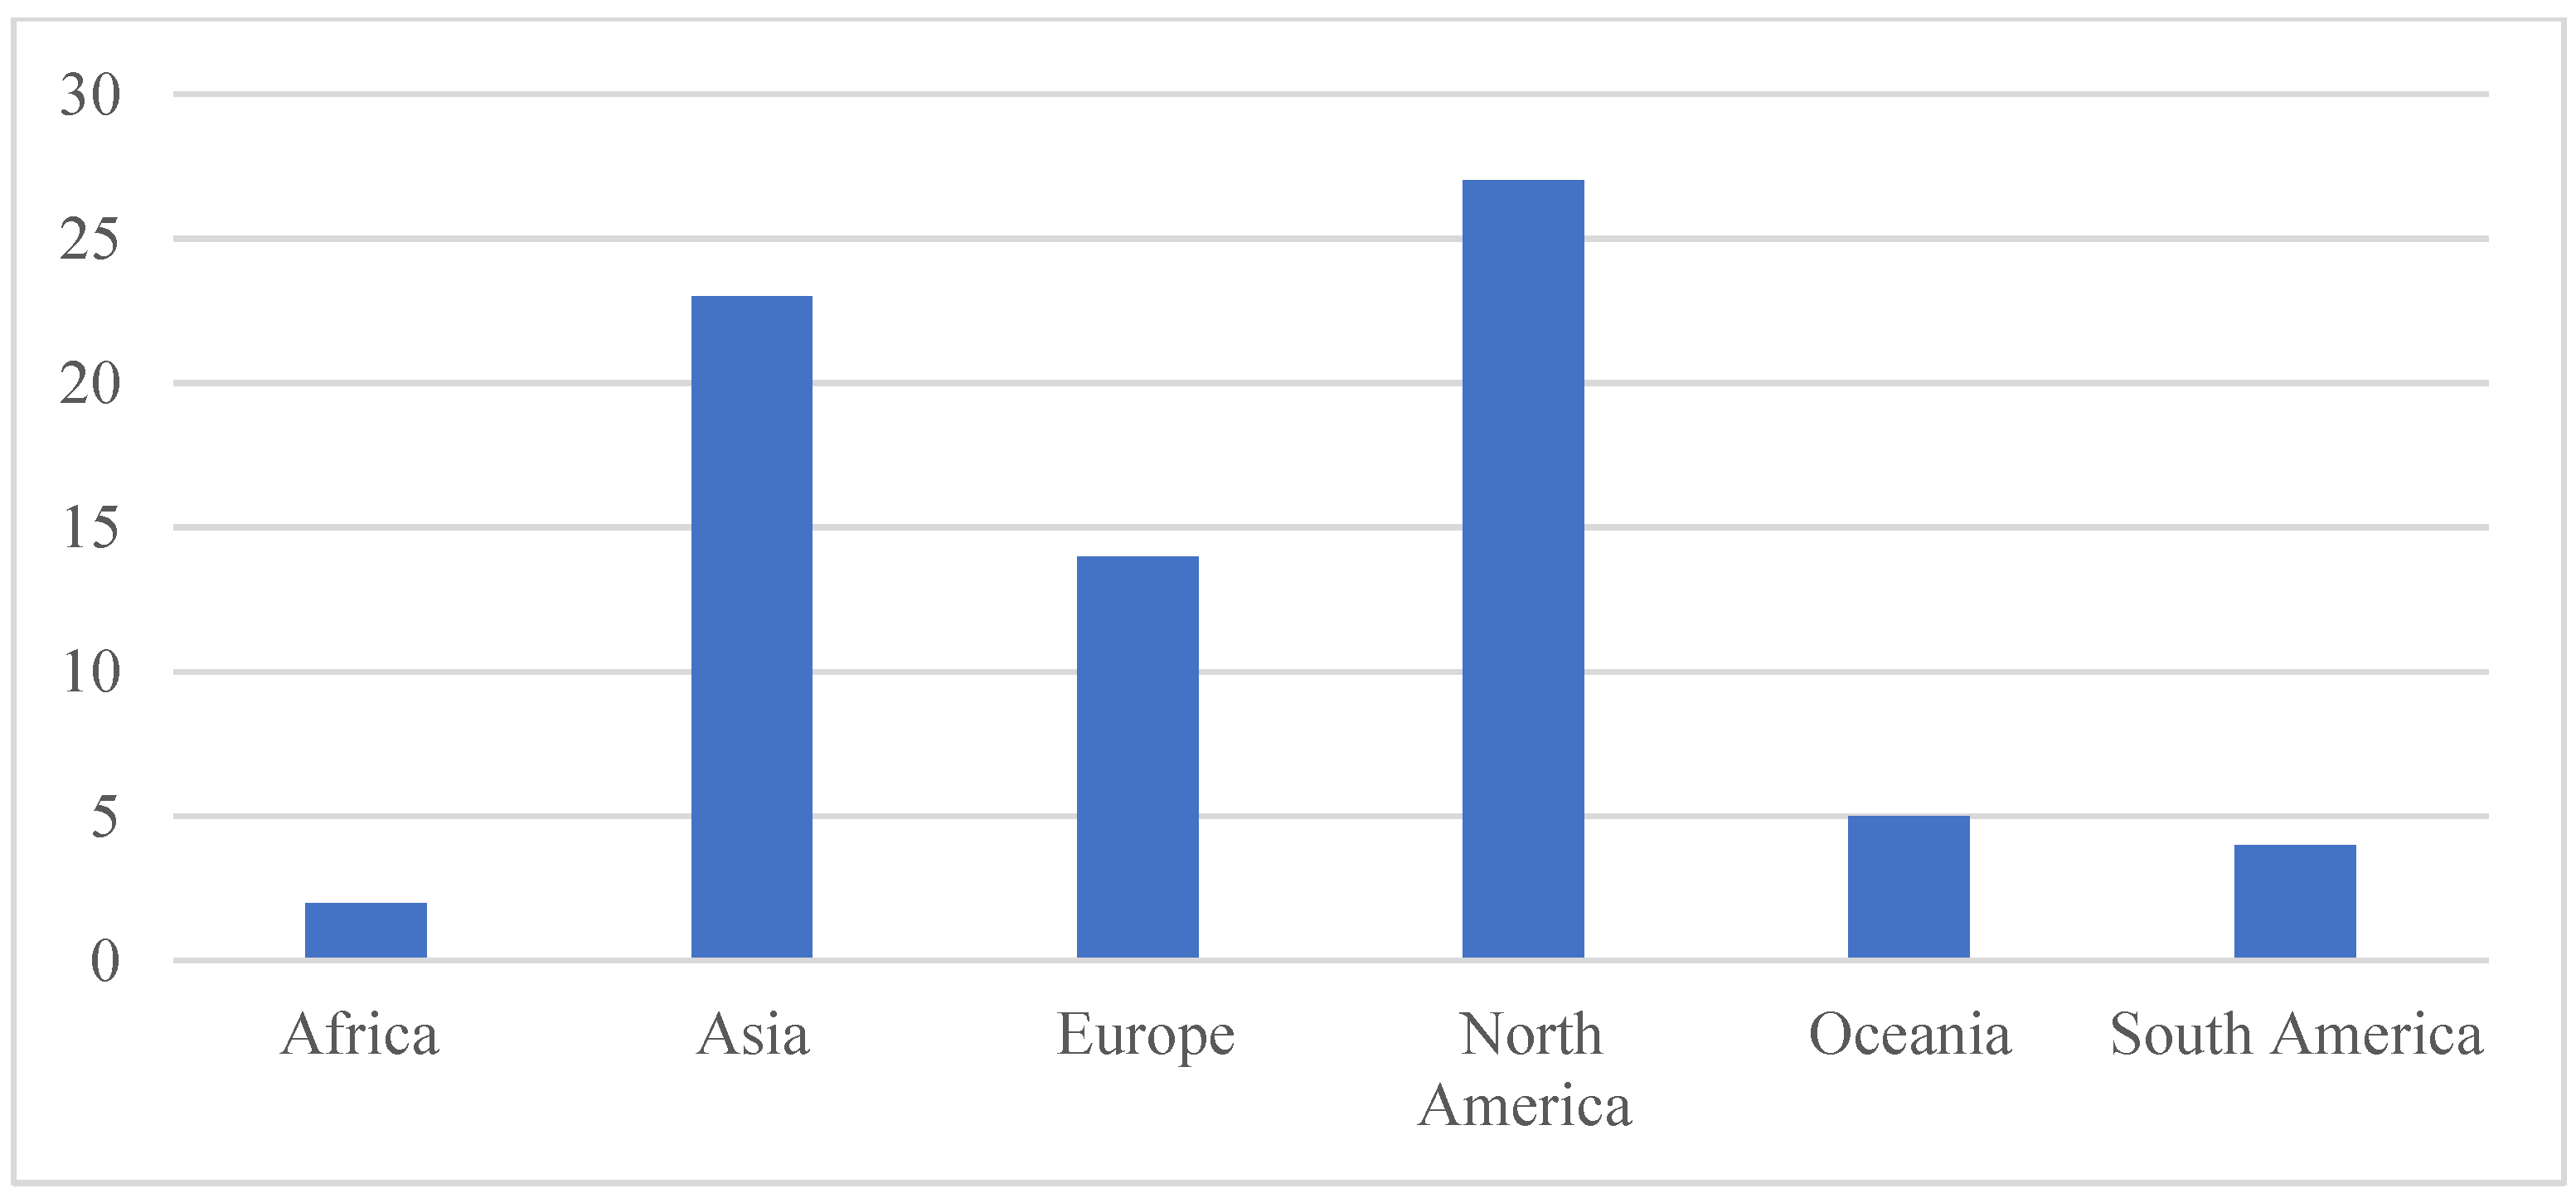
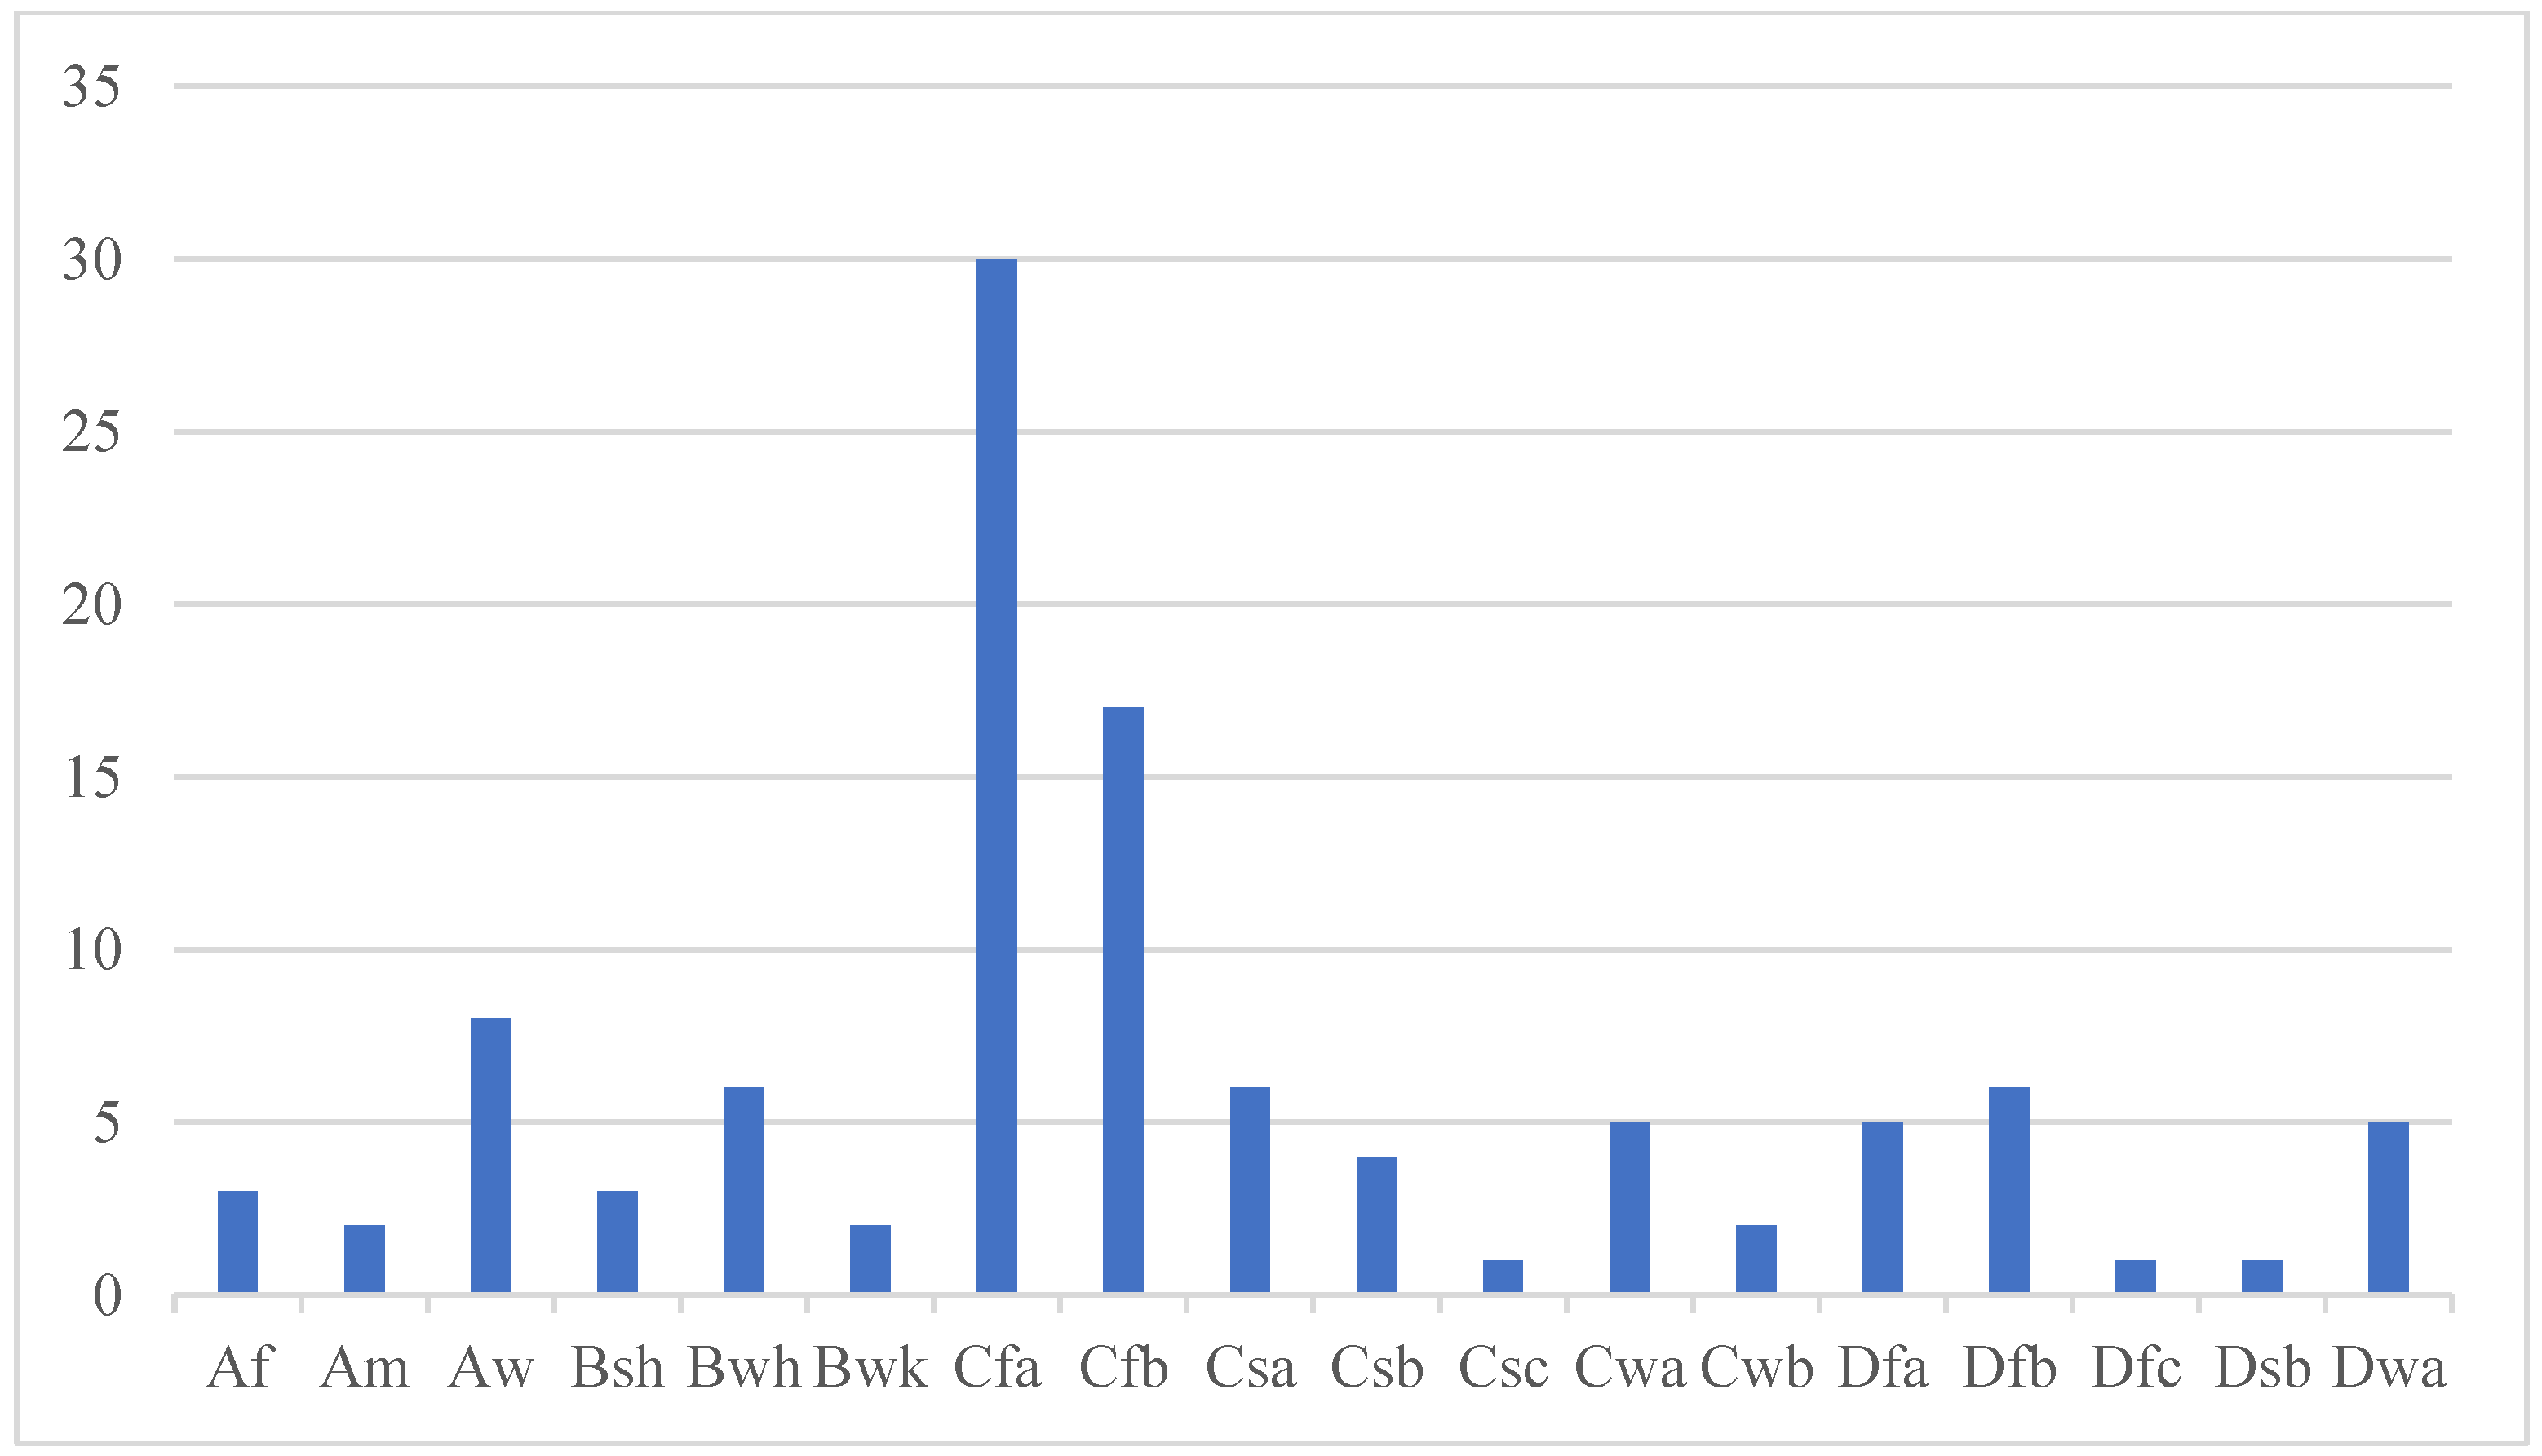
3.1. General Observations

The selected articles were categorized by publication year (Figure 2) to analyze the trend of related publications before 2022, which disclosed how interest in heat vulnerability assessment had changed during the last two decades. The earliest selected article was published in 2006, with only three research articles being published from 2006 to 2011. There was an increase to five articles in 2012, and the number of publications fluctuated between two and seven until 2017. The number almost doubled in 2018 and stayed at a stable level of 10–12 during 2018–2021.
This review also classified the selected articles by research region and climate (Figure 3 and Figure 4) because geographic locations and climate status directly influence the research results. Most studies were conducted in North America (27 articles, 36%) and Asia (23 articles, 30%), followed by Europe (14 articles, 18%). Oceania and South America were the focus of four and five research articles, respectively, while there were only two studies conducted in Africa. The top-3 countries selected as research regions were America (22 articles, 29%), China (11 articles, 14%), Canada (5 articles, 7%), and Australia (5 articles, 7%).
Publications were grouped by using the Köppen Climate Classification [36,37], which is one of the most widely used climate classifications. As shown in Figure 4, almost 60% of the reviewed articles were conducted in humid subtropical climates (Cfa, 30 articles, 39%) in temperate oceanic climates (Cfb, 17 articles, 22%). There were another 16 types of climates listed which were involved in one to eight articles each.

3.2. Indicators and Data

Heat-related indicators reflecting human and environmental characteristics are essential for the construction of heat vulnerability models. The first step of model construction is selecting influencing indicators associated with heat vulnerability and collecting corresponding available data which can quantitatively measure heat vulnerability levels to increased extreme heat. This review collected the indicators reported in the selected articles and grouped them into three categories: demographic and socioeconomic characteristics, health conditions, and environmental factors. Environmental factors were grouped into natural and built subcategories. Table 3 presents a summary of information on the common indicators and data sources.

3.2.1. Demographic and Socioeconomic Characteristics

Demographic and socioeconomic characteristics reflect the sensitivity and adaptive capacity of the population who suffered or potentially suffer heat hazards, such as healthy physiological conditions, adequate resources, and good living environments. There was a total of 17 demographic and socioeconomic indicators that were used in the heat vulnerability detecting studies (Table 3).
The top-5 most frequently used indicators in the studied reports were age, economic status, social isolation, education, and population density. Age was the most widely used demographic indicator, considered by 61 related articles, with an 80% usage rate. It was often represented by percentages of elderly or young population over 65 years old or below five years old. These people are more vulnerable to extreme heat during heat events because of their degenerated or undeveloped ability of thermoregulation [38,39]. There are higher heat-related morbidity and mortality and more hospitalization admissions for the young and elderly population during days with high temperatures [40,41]. Moreover, the chronic diseases of the elderly and the immature immune systems of children are likely to further aggravate their sensitivity to the extreme thermal environment [42].
The second most considered indicator was the economic status, with 56 related articles and a 74% usage rate. This indicator reflects the response capacity of individuals and governments to mitigate the influence of extreme heat, which contains personal economic status and local financial status. Personal economic status was usually depicted by income level, while a few studies employed the percentage of the population living with adult disability benefits and pension funds. If the income levels of people are below the poverty line, they are more likely to be associated with high levels of heat stress and heat-related disease [43] because they probably cannot afford cooling services and medical services. A total 39 studies used education (51%) as an indicator for heat vulnerability detection. It has been purported that people with a low education degree experience high heat-related mortality as these people are more likely to live with a low income and work in an environment without thermal isolation conditions [44].
Social isolation (42 articles, 55%) has been identified as one of the most significant indicators to measure heat vulnerability, often delineated by percentages of the population living alone (or combined with age and gender). People living alone, especially the elderly, are more vulnerable during extreme heat events as they may have a limited ability to deal with emergencies and may not receive timely support [42,45]. Population density (32 articles, 42%) is considered one of the typical indicators for heat exposure, which is often fused with the temperature data to measure the number of vulnerable people to heat and their spatial distribution. Race (29 articles, 38%) is selected in the development of heat vulnerability models due to racial disparities contributing to heat vulnerability. Minorities with different cultures lack resource access and are easy to be socioeconomically and politically marginalized [46,47].
Other indicators with over 10 usage times included employment, housing condition, air conditioning, and language ability. The other reported indicators included vehicle availability, internet availability, household facilities, frequency/time of outdoor activities, and water/electricity supply. In recent years, some studies have begun using composite indexes built by age, economic status, and other demographic and socioeconomic indicators to model heat risk, such as Human Development Index [48] and Human Settlement Index [49,50].
In most studies, demographic and socioeconomic data were derived from national census statistics, such as the China’s Sixth (2010) National Census Dataset [51] and the American Community Survey [29,52], and local official socioeconomic datasets or public themed datasets, such as the Beijing Statistical Yearbook [53] and WorldPop Global Population Data [54].

3.2.2. Health Conditions

Health condition indicators can be classified into two categories—i.e., personal health conditions and the availability of medical and healthcare resources. Personal physical and mental conditions can significantly influence an individuals’ sensitivity to heat during extreme heat events, which include personal health status, disability, natality, and mortality. Personal illness status was the most employed health condition indicator with 22 related articles and a 29% usage rate. The percentage of the population with a pre-existing illness is employed as the representative of this indicator as illness, especially chronic diseases (i.e., diabetes, asthma, hypertension, obesity, and cardiopathy), can increase the heat vulnerability of individuals [55,56].
People with chronic diseases often have a limited response capacity to the frequently changing thermal environment. Disable people suffer from the same situation, so disability (11 articles, 14%) is also one of the frequently used indicators, which is captured by the percentage of the population with disability. There were also five studies (7%) using birth/death rate to reflect the heat effect on human health. Specifically, one of them employed infant mortality rate [57] as a heat vulnerability indicator related to health conditions, and another one selected birth rate [58].
The availability of medical and healthcare resources can greatly affect the adaptive capacity to heat of an individual, which consists of medical infrastructure, healthcare services, and health insurance. Medical infrastructure (18 articles, 24) is the second most frequently considered health condition indicator, of which the number of medical workers/facilities/institutions are one of the typical representatives. Some studies calculated distances and time costs [23,24,58] to the nearest medical institution and considered them as the proxies of the availability of public health resources. The rest of the less frequently used indicators are healthcare services (5 articles, 7%) and health insurance (3 articles, 4%), both of which reflect external support and assurance [59,60] for people to deal with extreme heat.
Health condition data were mainly collected from datasets released by national and local health departments and medical institutions, such as datasets published by the Ministry of Health Malaysia [61] and Toronto Public Health 2009 [62]. The data on the distances to medical resources were derived from point of interest data and online map platforms [54,63].

3.2.3. Environmental Factors

Environment factors are directly associated with harmful heat and related heat outcomes [21]. Not only can they directly reveal the heat intensity such as the land surface temperature (LST); air temperature and heat duration such as days/frequency of heat events, but also reflect the ability to aggravate or reduce heat impacts, such as vegetation cover, and accessibility to cooling spaces. Environmental indicators can be summarized into two categories as natural environment and urban environment.
The top-3 indicators concerning natural environment were LST (38 articles, 50%), vegetation cover (23 articles, 30%), and air temperature and heat duration (20 articles, 26%). Landsat and MODIS satellite images with resolutions of 30 m, 60 m, and 1 km were employed to derive daytime and night-time LST during the study period. Daytime and night-time mean, maximum and minimum air temperatures were collected from meteorological observation stations [62,64]. The combined use of surface and air temperatures can fully characterize the thermal space distribution near the ground.
Vegetation cover plays an important role in assessing the population’s heat vulnerability due to the ability to adjust the temperature of the surrounding environment through photosynthesis. The abundance of vegetation determines the local ability to adjust to extreme heat to a certain extent [65,66]. MODIS satellite products were used to capture vegetation covers, such as Normalized Difference Vegetation Index (NDVI), Enhanced Vegetation Index (EVI), and Fractional Vegetation Cover (FVC) [67,68,69]. The less used natural environment indicators are humidity, heat events, thermal radiation and heat flux, air condition, and weather.
A total two studies attempted to employ the Digital Elevation Model (DEM) [49,68] as an elevation indicator in heat vulnerability measurement because topographic relief can affect the duration and intensity of heat exposure on a population. Heat-related composite indexes built by temperature, humidity, and other weather variables have been proven to have a high correlation with heat-related hospitalizations and death [70,71,72] and utilized in the development of heat vulnerability frameworks, such as Heat Index (HI), Humidex, and Wet Bulb Globe Temperature (WBGT).
The top-3 environmental factors reported concerning urban environment were accessibility to cooling spaces (20 articles, 26%), land cover/use (19 articles, 25%), and building information (14 articles, 18%). Green space, water bodies, and other cooling places can provide people with free cooling services and relieve them from the thermal environment [73,74]. Impervious area extracted from land cover data has become one of the most typical indicators of land cover/use as it is considered a contributor to exacerbating the urban heat island (UHI) effects [75].
Other contributors to UHI, building information including building density, height, and type was frequently used to demonstrate urban heat vulnerability due to the positive association with the increased temperature [76,77,78]. Other studies also took transportation, infrastructure, and urbanization into consideration [24,54,72].
Natural environmental indicators, such as LST, vegetation cover, and meteorological data, were commonly derived from Landsat and MODIS satellite images and meteorological observation datasets [56,79]. Urban environmental indicators are commonly calculated from Landsat and MODIS satellite products or collected from public databases from national and local planning departments [80,81]. Moreover, other satellite products from various sensors (e.g., Sentinel-2, DMSP/OLS, and NPP/VIIRS) were also utilized in some studies [15,31,49,82].

3.3. Modelling Approaches

In the modelling process, after deciding on the heat-related indicators and collecting corresponding data, the next step is to build an efficient model to measure extreme heat vulnerability, which plays a fundamental role in the whole study process. Table 4 displays a summary of information on the modelling and weighting methods and outputs.

3.3.1. Modelling Methods

The most frequently used modelling method was the indexing method (61 articles, 80%), which included three popular heat vulnerability models based on different conceptual frameworks. Many heat-vulnerability indexes (19 articles, 25%) and heat risk indexes (15 articles, 20%) were developed through two popular conceptual frameworks, i.e., population vulnerability framework [83] and risk triangle framework [84]. Each of the frameworks consisted of three separate components, which were represented by different types of heat-related indicators.
In the population vulnerability framework, heat vulnerability is the summation of exposure, sensitivity, and adaptive capacity. Exposure was referred to by direct or indirect impacts on populations from the thermal environment. Direct risk of heat exposure mainly comes from the natural environment, which can be represented by meteorological and climatic indicators, such as daytime and night-time air temperatures and land surface temperatures [61,85]. Indirect risk of heat exposure is mainly caused by the built environment, which includes accessibility to cooling spaces, building information, and so on [59,77].
Sensitivity represented the extent to which populations are sensitive or susceptible to increased extreme heat, which can be reflected by demographic and socioeconomic indicators, such as age, social isolation, and economic status [86,87]. Adaptive capacity to extreme heat exposure was usually depicted by the availability of facilities that reduce the risk of heat exposure, such as access to air conditions/personal vehicles/internet services/water supply/medical services [54,68].
In the risk triangle framework, heat risk is calculated by summing up components of hazard, exposure, and vulnerability. Hazard was considered as the spatiotemporal distribution of heatwaves or extreme heat events, which was often depicted by mean daily max temperatures, duration of heatwaves or heat events, and days with extremely high temperatures [81,82].
Exposure was typically represented by land cover/use and population density, especially young and elder population density [88,89]. Vulnerability incorporates sensitivity and adaptive capacity to extreme heat exposure, which is like those in population vulnerability frameworks. Indexes built by the two frameworks were often adjusted through switching mathematical operations, like multiplication and division operations [90].
Many studies (29 articles, 38%) developed heat vulnerability indexes that were not based on the above frameworks. These studies usually collected heat-related indicators, ranging from two to 24, and fused them to build a new index. Heat-related indicators were usually categorized according to the property characteristics, such as social, economic, and environmental categories [91]. Several studies (6 articles, 8%) selected GIS techniques to map and visualize the spatial distributions of heat vulnerability.
Macintyre et al. [76] utilized GIS techniques to calculate and estimate the ambient temperatures corresponding to potential heat risk indicators, such as age, housing condition, and economic status. The other methods included composite methodologies (e.g., the multicriteria outranking framework [26] and the decision support system [92]), statistical analysis models (e.g., Poisson regression models [29]), and questionnaire/survey analytics [53].

3.3.2. Weighting Methods

Once the indicators and modelling methods are established, the next step is to determine the weight assigned to each indicator or category, which is essential to determine their importance or contribution to the heat vulnerability. Weight allocation follows the principle that weights correspond to the degrees of impact on heat vulnerability. Of the collected studies, the top-2 weighting methods were the equal weighting (EW) method (37 articles, 49%) and the principal component analysis (PCA) (27 articles, 36%).
EW is widely used in many studies and developed on the assumption that each indicator or category has the same influence on the subject matter [93]. It ensures that both each category and each indicator in the same category are allocated equal weights. PCA is often employed in studies with numerous indicators to group them into fewer categories and reduce the analysis dimensions. It is worth noting that principal components statistically calculated by PCA are less readable and interpretable than original indicators.
Liu et al. [94] built HVIs via EW and PCA and compared the separate performance in Hangzhou, China. The results revealed that equal-weighted HVI performed better than HVI calculated by PCA in terms of correlation with heat-related death. Nevertheless, Tate. [30] demonstrated PCA performed better than other methods, with higher precision and sensitivity to indicators and analysis scales. This means weighting methods depend on contexts and the determination of weighting methods should be with more caution.
Another statistical method applied in weighting assignment is AHP (5 articles, 7%), which obtains weights based on the experience and judgment of a panel of experts. The other weighting methods (7 articles, 9%) consist of expert weighting methods, slope-weighted methods, and factor-weighted methods. Sometimes, multiple methods are combined to find out reasonable weights. For example, Song et al. [78] first used PCA to obtain all principal components and then allocated equal weights to them to build composite HVI in Hongkong, China.

3.3.3. Modelling Outputs

Heat vulnerability maps reflecting spatial distributions of heat exposure and hazard were the most common outputs in the selected articles. Once heat vulnerability maps were created, the indexes were normally rescaled into 3 to 10 vulnerability levels by equal intervals, typically five or seven evaluation scales (e.g., very low, low, moderate, high, very high), to reflect the degree of localized heat exposure [95,96]. Sometimes, the indexes were calculated and presented as continuous numerical values, in which case high values represented high heat vulnerability and vice versa.
The model outputs varied across studies from spatial units to temporal scales due to the spatiotemporal resolutions of proxy data. This review classified selected articles into the different categories according to spatial and temporal scales to evaluate the dimensions of the outputs. The top-3 spatial scales employed in the selected articles were census units (26 articles, 34%), administrative areas (25 articles, 33%), and grid (17 articles, 22%). Census units incorporated census blocks [82], census block groups [88], and census tracts [97]. Administrative areas ranged from states/provinces to communities/counties [21,98]. The reason for this popularity is that heat-related indicators at the scales, such as demographic, socioeconomic, and health-related, can be easily obtained from national and local demographic datasets. The application of satellite products contributed to the increased use of grid-scale, such as LST, NDVI, and land cover/use products from Landsat and MODIS datasets. The spatial resolutions of these studies were consistent with that of the satellite product used, from 100 m to 1 km. The less frequently used spatial units were postal areas and local climate zones [79,99].
Basically, there were no explicit study years in the heat vulnerability studies because they commonly used data from different years due to limited data availability. Hence, model outputs reflected the situation of heat vulnerability in a period, not in an explicit year. Model outputs concentrated in two periods 2000–2009 (32 articles, 42%) and 2010–2019 (34 articles, 45%) because of more frequent extreme heat events occurred after 2000 and data availability. Only 3 studies [50,67,87] focused on mapping long time-series heat vulnerability. Weber et al. [67] identified localized trends of increased urban extreme heat and spatiotemporal distributions of heat exposure over 1980 and 2013 with ground- and satellite-based data. Wilson et al. [87] proposed a novel methodology to locate the most vulnerable populations and analyzed the changing trends of these locations from 1990 to 2010 with an interval of 10 years. Rao et al. [50] conducted a gridded analysis based on MODIS LST images to compute heatwave indicators and explore the temporal and geographical variation of heat risk and vulnerability in Indo-Gangetic Plains in India from 2003 to 2019.
It is worth noting that only three articles focused on predicting future heat vulnerability. Oh et al. [98] built a climate change vulnerability assessment tool and applied it to assess the province-level heat vulnerability in Korea for the 2040s. Prosdocimi et al. [24] developed a spatially explicit index for measuring heat stress risk and used it to assess heat risk in Dublin, Ireland from 2020s to 2050s. Loughnan et al. [63] mapped the population vulnerability in Australia’s capital cities with an HVI to extreme heat events and projected the future population changes during 2020–2030. Both results were combined to map future changes in population vulnerability. Mapping future spatial distributions of heat vulnerability are also important because it benefits grasping the changes and preparing countermeasures in advance. More attention needs to be paid to the predictive assessment of heat vulnerability.

3.4. Validation Approaches

It is indispensable for newly developed heat vulnerability assessment models to conduct validation experiments to demonstrate their capabilities in evaluating potential heat vulnerability and risk during extreme heat events. Nevertheless, only 20 selected articles (out of 76) involved validation parts, accounting for 26%. Some research [54,98,99,100] adjusted validated heat vulnerability models and applied them to new study areas, so the validation parts were disregarded. Many studies [67,77] mentioned the limitation of lacking validation and described future validation plans. They explained the main reason was validation data dearth. If enough validation indicators were available, further validation analyses would be undertaken. Table 5 shows the summary of information on the validation indicators, methods, and study performance.

3.4.1. Validation Indicators

The most frequently used validation indicator in the studied literature was mortality with 15 related articles (about 20% of all reviewed articles). These researchers argued mortality can directly depict the impacts of heat exposure on humans and the association between population health and extreme heat with less bias. Mortality indicators can be classified into two categories—i.e., heat-related mortality [101] and all-cause mortality [102] during summer or heat events.
On the one hand, some studies used deaths caused by diseases sensitive to the extreme thermal environment as the mortality indicator. Kwon et al. [101] selected mortality data related to respiratory, ischemic heart disease, and cerebrovascular disease as thermal disease-related mortality. Hu et al. [49] and Liu et al. [94] also considered deaths caused by heat stroke, dehydration, and hyperpyrexia as heat-related mortality. Moreover, Kim et al. [103] and Song et al. [78] took the deaths caused by exposure to excessive natural or artificial heat into consideration, such as sunlight and artificial light. To evaluate the effectiveness of the extreme heat vulnerability index (EHVI) proposed, Johnson et al. [104] predicted heat-related mortality based on the total population number of each block group and the overall death rate in Chicago during the extreme heat event that happened in 1995.
On the other hand, some studies employed all-cause deaths during hot seasons as a mortality indicator. Conlon et al. [52] estimated the proportion of all-cause deaths during extremely hot days and explore the relationship with HVI developed. Considering the data availability, Estoque et al. [27] selected all-cause mortality data at the province level during hot dry seasons to validate the heat vulnerability outcomes. Krstic et al. [71] used deaths on six extremely hot days from 1984 to 2014 to conduct an index assessment and evaluate the index performance. Maier et al. [102] and Wang et al. [51] also collected daily mortality monitoring to verify whether heat vulnerability levels reflected health outcomes of extreme heat exposure. Mallen et al. [105] estimated mortality from related observed temperatures and all-cause death rates with a distributed lag non-linear model.
The second frequently used validation indicator in the collected studied was heat-related morbidity, including hospital and emergency department visits and admissions [106,107,108]. Chuang & Gober [65] calculated diabetes hospitalization by using census-tract population data and previous hospitalizations for diabetes and used this as a validation indicator. Zhang et al. [68] obtained summer hospital visit data at the county level from the local statistical department for validation. Other studies [107,108] used emergency service demand data to evaluate the model performance, such as ambulance calls, hospital and/or emergency department visits and admissions. Apart from mortality and hospital visits and admissions, Loughnan et al. [63] combined emergency ambulance callouts, emergency department presentations and corresponding triage categories, and emergency hospital admissions to measure morbidity data and used the morbidity outcomes for validation.
Multiple validation indicators were commonly used in the same study. Morbidity and mortality were often combined as validation indicators to evaluate model efficiency [106,107]. Moreover, accessibility to medical institutions was also taken into consideration. Prosdocimi et al. [24] selected the distance to the nearest hospital and clinic and health record data as instrumental variables to evaluate the HVI model performance.

3.4.2. Validation Methods

As mentioned above, many studies tested whether the models were efficient enough to predict heat vulnerability by using the correlation between heat-related health outcomes and heat vulnerability results. A high positive correlation result meant high model efficiency and the possibility of being a useful urban planning tool. A variety of mathematical and statistical models, especially regression models (14 articles, 18%), were applied to performance evaluations of the proposed heat vulnerability assessing methods. Poisson regression (5 articles, 7%) and linear regression (11 articles, 14%) were commonly used in model evaluations, and the less-used regression models included logistic regression [65].
Maier et al. [102] selected multivariate Poisson regression to explore the interaction of HVI and oppressive heat on mortality in Georgia. Reid et al. [106] tried to demonstrate how the increases in HVI and deviant days influence the hospitalizations and mortality in five American states from 2000 to 2007 by using Poisson regression analysis. Wolf et al. [107] utilized Poisson regression to predict the associated heat risk with mortality and ambulance calls as the response variables and the HVI as the predictive variable. Hu et al. [27,49,68,78,94,103,109] employed linear regression models to assess the correlation between HVI values and heat-related mortality and used scatter plots and the coefficient of determination to evaluate the extent to which a higher value of HVI can produce more related deaths. In addition, spatial distribution comparison between HVI and heat-related outcomes was often used as a qualitative analysis to assess the efficiency of proposed models [65,103].
Some studies used multiple methodologies to validate the effectiveness and efficiency of the developed models. Wang et al. [51] firstly employed quasi-Poisson regression and distributed lag nonlinear models to estimate the relationships between temperature and mortality at the county level, then calculated the heat-attributed mortality fraction, and finally used a meta regression model to explore the correlation between mortality fraction and the HVI values. Prosdocimi et al. [24] combined linear regression, zero-inflated Poisson regression, and zero-inflated negative binomial regression. Then they conducted a difference-in-difference analysis to validate the HVI against heatwave-related excess mortality.
Apart from statistical regression models, Pearson correlation and Spearman’s rank-order correlation were often calculated to reflect whether there was a significant correlation between heat vulnerability outcomes and heat-related health outcomes [49,63,68]. Critical success index (CSI), statistical significance test, case-crossover and threshold or curve analyses, and root mean square error [71,101,104,109] were also employed in the validation of the HVI models.

3.4.3. Study Performance

As mentioned in Section 3.3.3, there was a consensus among most heat vulnerability assessing studies that a higher value of HVI meant an increased heat risk. Although the selected articles claimed that the heat vulnerability models can be utilized for urban planning and decision-making, the validation performances significantly varied across the heat-related studies. Some studies (6 articles, 8%) achieved satisfactory validation outcomes, while many studies (10 articles, 13%) did not obtain ideal results that indicated a significant relationship between HVI values and heat-related outcomes.
Based on the heat risk triangle framework, Zhang et al. [68] developed an HVI for elderly people at a raster scale in Chongqing, China. The calculated result showed the Pearson correlation coefficient between the HVI values and summer hospital visits was 0.924, which indicated the heat vulnerability model performed satisfactorily. Mallen et al. [105] developed an HVI based on PCA at the census tract level in Dallas, US, and then used bivariate and multivariate regression models to compare estimated mortality and HVI results. However, the results of both regression models were unsatisfactory. Especially, the R squared value between total deaths and HVI scores was 0.03 by using the bivariate regression, potentially indicating the HVI model was not capable of locating and predicting the heat risk.
The heat vulnerability models also had varying performances at different scales, in different spatial units, and based on different methodologies. For example, Jänicke et al. [109] quantitatively assessed heat-stress impacts through heat hazard, vulnerability, and risk models at the district scale in Seoul, Korea, and conducted an evaluation of the assessment outcomes by linear correlations. The heat-related mortality showed a significant correlation with HVI values at the city level, while the result was opposite at the district scale. The supervised HVI performed better than the unsupervised HVI, with a high positive association with increased mortality during extremely hot days in Detroit, Michigan, USA. [52]. The equal-weighted HVI performed better than the HVI calculated by PCA in terms of correlation with heat-related death in Hangzhou, China [94].
To sum up, the performance of a generic HVI depends on scale, measurement, and context, which to a certain degree implies heat vulnerability models should be established with thorough caution. Furthermore, under the circumstance of only employing statistical analyses and using heat-related morbidity and mortality, it is difficult to verify the effectiveness of the validation results for the proposed heat vulnerability methodologies. More qualitative and quantitative methodologies need to be introduced as validation methods, such as questionnaire surveys on vulnerable populations and field measurements on vulnerable areas.

4. Findings and Discussion

This review attempted to address the research question of ‘what are the methods to assess urban heat vulnerability’ from three aspects, i.e., indicators and data, modelling approaches, and validation approaches, by undertaking a systematic review of the literature. The summarized highlights of the reviewed literature are presented in Appendix A. Main findings and some other critical issues are discussed further in this section.
Indicator selection is an essential part of heat vulnerability assessment research because all the results and analyses are based on the selected indicators. Introducing as many relevant indicators as possible into assessment models contributes to accurately and comprehensively grasping the urban heat vulnerability [33,110]. According to the reviewed literature, it was found that three types of indicators are commonly used—i.e., demographic properties and socioeconomic status, health conditions and medical resources, and natural and built environmental factors. These indicators directly or indirectly influence the sensitivity and adaptive capacity of urban residents to increased extreme heat and reflect the frequency, duration, intensity, and distribution of heat exposure. The top-5 most frequently used indicators in the studied reports were age, economic status, social isolation, education, and land surface temperature.
From the perspective of indicator categories, there are four demographic and socioeconomic indicators and only one environmental indicator. In terms of the impact on urban heat vulnerability, only land surface temperature belongs as a direct indicator, which can capture the intensity, magnitude, and spatiotemporal distribution of extreme heat. Two main factors contributing to the popularity of the indicators were the verified significant relationship between urban heat vulnerability [19,29,86] and the indicators and the easy availability of corresponding data [21,33]. The popularity indicates that current vulnerability studies put over-reliance on indirect socio-demographical indicators. More attention should be paid to personal health conditions, public medical services, natural environmental hazards, and urban planning and governance for a comprehensive conceptual framework.
Although using heat-related indicators to measure urban heat vulnerability has been a consensus, there were no universal criteria or specifications in the selection of input metrics in terms of quantities, varieties, theoretical fundamentals of selections, and data proxies. According to the reviewed literature, the number of indicators ranged from 2 to 30, and the categories ranged from 2 to 7. For example, Prosdocimi & Klima [24] collected 24 indicators from the Brazilian national census database based on a hypothesis that the indicators had an impact on heat vulnerability, while Yin et al. [111] selected only 2 indicators, i.e., ambient air temperature and noontime foot traffic time, to build an index to capture urban heat exposure patterns. However, both studies incorporated 2 categories. Yin et al.’s study [111] only focused on exposure and hazard, while Prosdocimi’s study [24] only concentrated on socioeconomic factors and urban form. This means the number of indicators does not always reflect the assessment dimensions, even though studies with many indicators involved cannot ensure the diversity and comprehensiveness of analysis dimensionality.
On the one hand, the research considering inadequate indicators will inevitably miss some characteristics related to heat vulnerability. Kershaw et al. [62] took apparent temperature intensity, exposure duration, and humidity into consideration, only focusing on the natural environment without any demographic and socioeconomic properties. Barron et al. [16] employed 5 commonly used indicators, i.e., age, race, economic status, education level, and social isolation, incorporating demographic characteristics and socioeconomic properties but without environment-related considerations. On the other hand, the same circumstance also occurred in the assessment studies with many indicators. For example, several studies [29,87,104] involved 16–30 indicators covering characteristics of population and environment, but without indicators capturing the impacts of public medical facilities and institutions.
In the studies, individual health conditions and available public medical resources are the easily neglected elements. Moreover, by involving numerous metrics in an assessment it is inevitable to incorporate less relevant indicators. For instance, in Harlan’s study [19], 8 out of 14 indicators were not significantly correlative with human thermal comfort index (HTCI), particularly the distance from the city center and the mean roof reflectivity, which have no statistical correlation with HTCI. Wolf et al. [107] discovered that univariate and multivariate HVI had similar performances in predicting health outcomes. It inspired researchers that parsimony might be a significant factor to consider in their study design.
The lack of generic standards also led to mismatches between indicators and categories. Taking the two most popular theoretical frameworks for example, both frames interpreted selected indicators in different ways, which led to a consequence that even the same indicators had different interpretations and meanings and reflected varied components of heat vulnerability. Specifically, LST was referred to as an exposure element in the population vulnerability framework [54,80,87], while the risk triangle framework considered it as a representative of hazard element [11,81,88]. Kwon et al. [101] classified population density as a proxy for the sensitivity element while using the population vulnerability framework, but Dong et al. [82] interpreted it as the representative of the exposure element in the risk triangle framework.
Even in the same conceptual frame, there were different interpretations and classifications for the same indicators. For instance, an individuals’ economic status and education levels were categorized into the sensitivity category by Zhang et al. [14], Wilson et al. [87], and Wu et al. [54], yet considered as adaptive capacity indicators by El-Zein & Tonmoy [26], Hulley et al. [77], and Mallen et al. [105] while all using the population vulnerability framework. Under the risk triangle framework, Lapola et al. [48] and Zhang et al. [68] categorized the elderly population as the exposure indicator, while other studies [31,49,78] commonly used it as a proxy of vulnerability component.
The great differential in numbers and categories of indicators is mainly caused by the lack of universal selection theories and criteria. Current indicator selection relies critically on local contexts [28,29]. On the one hand, local characteristics of the population, infrastructure, and ecosystem have a significant impact on urban heat vulnerability. For example, Azhar et al. [95] included scheduled castes and scheduled tribes in the study mapping heat vulnerability in India, due to the existence of social class systems. In counties with a high proportion of immigrants like America, ethnicity was commonly taken into consideration while measuring heat vulnerability, such as Latino immigrants, Hispanics, and races other than white [19,102,108].
On the other hand, local data availability also plays an essential role in heat vulnerability assessment. Current studies put an over-reliance on census datasets because of the easy availability [110]. Census datasets freely provide abundant and comprehensive sociodemographic metrics for heat-related assessments to capture the sensitivity and adaptive capacity of vulnerable people. The lack of data availability could alter indicator selection to a large extent. For instance, studies substituted the missing data in the study period with data from years when the targeted indicators could not be found [17,76,77]. If the substituted data were not available either, the amount of indicators would be reduced correspondingly.
The determination of indicators was constrained by either data availability or the researchers’ subjective judgment [30,31]. Without the guidance of universal selection criteria, most studies selected indicators grounded on conclusions of previous studies, data availability, and personal view of the theoretical relationship between potential indicators and the local context [14,21]. Researchers’ subjective discretion was bound to impair the credibility and validity of the selected indicators. In most heat vulnerability research, the representativeness and relevance have not been demonstrated through scientific quantitative and qualitative methodologies [29,69,91]. Although some studies conducted sensitivity analyses to explore the relationship between selected metrics and heat vulnerability outcomes, from the results, not all indicators had a significant statistical relationship with measured heat vulnerability [47,86]. Whether the selected indicators are explicitly relevant to heat vulnerability needs further verifications. Thus, it raised doubt about the credibility and authenticity of selected metrics and achieved results.
While ensuring enough relevant indicators are involved in the assessment, it is necessary for researchers to select data proxies that can accurately represent corresponding indicators. However, according to reviewed literature, it was common that the same indicators had different data proxies with varied resolutions [21], and accuracy verification of selected proxies was not included before developing assessment models. Taking the most frequently used environmental indicator LST for example, it has been measured by satellite products and data from meteorologic observation sites [46,61,63]. Satellite products included LST images from Landsat and MODIS sensors with spatial resolutions of 120 m and 1 km, respectively.
Higher resolutions mean more spatial characteristics of the temperature distribution, so studies [70,75,97] using Landsat images were conducted on a coarser scale and generated more detailed information. This was not absolute because the cloud cover of satellite images directly reduces the accuracy of capturing surface temperature distributions [104,110]. Therefore, satellite images with high resolution are imperative when using remote sensing to depict extreme heat events. Moreover, it is worth noting that studies often used several satellite images, each covering 8–16 days, to reflect the LST spatial distribution in a whole year. It is unclear whether the operation would reduce the accuracy of the data proxy and even have a negative impact on the credibility of final heat vulnerability results.
According to the reviewed literature, we found heat vulnerability indexing models were the most popular modelling methods. The modelling methods incorporated indexing models based on the population vulnerability framework, the risk triangle framework and other heat-related indexing models. Despite the consistent increment of HVIs, the conceptualization of the index remained incomplete and required further development. From Table 4, the number of studies using other heat-related indexing models is close to the summation of studies based on the two popular frameworks. According to the difference in focus on vulnerability characterization, the model developed two types of HVI, i.e., biophysical vulnerability index and social vulnerability index. The biophysical vulnerability index was proposed to depict precise characteristics of vulnerability to biophysical exposure, which encompassed environmental factors such as temperature distribution and urban form.
The social vulnerability index was meant to capture human health and well-being in aspects of society, economy, policy, and culture for estimating to what extent people are susceptible and whether they have adequate capacity to heat vulnerability. Incomplete indicator systems indicated that these indexes were incapable of reflecting integral characterizations of heat vulnerability due to the missing depiction of imperative features. Further, Johnson et al. [104] and Macnee & Tokai [59] argued that both socioeconomic vulnerability and biophysical exposure were complementary components of heat risk, which cannot be completely grasped in the absence of any component.
To fill the lacuna of integrative approaches, composite HVIs combined with biophysical and sociodemographic indicators have been developed and broadly applied. As mentioned above, composite HVIs developed on the two popular frames all comprised 3 components and were commonly combined with additive approaches. However, it is unclear whether there is an additive effect among different assessment dimensions and indicators under each dimension. Some studies opted to use other arithmetic means to calculate HVIs [80,82,98], i.e., subtraction, multiplication, and division, but they failed to adequately demonstrate the underlying logical relationships between constituent elements either. The logicality and adequacy of the commonly used equations have not been examined before in heat vulnerability assessments. This is urgently needed to discover theoretical constructs for supporting developments of HVIs, not just based on subjective assumptions.
The same controversy persisted in several studies [11,76,92] which applied GIS techniques, i.e., the overlay analysis approach, to obtain heat vulnerability maps because they were also grounded on the assumption of additive effects. No matter indexing models, GIS techniques, or other statistical methods applied are all quantitative approaches. Those approaches failed to accommodate qualitative analysis approaches which are complementary to quantitative methods because qualitative components are usually non-measurable. However, the integration of quantitative and qualitative perspectives is necessary for policy formulation in the mitigation of heat vulnerability. It is challenging to qualitatively capture heat vulnerability and rationally integrate qualitative and quantitative elements. Cheng et al. [21] attempted to apply questionnaire surveys to qualitatively capture people’s heat risk perception and integrate it with quantitative spatial analysis to identify and assess heat vulnerability in Beijing, China. More qualitative components and approaches to heat vulnerability should be explored and checked in the assessment to provide guidelines for scientific decision-making.
Once the sets of indicators and the theoretical framework are determined, the weight assignment between each indicator or component is the next quite important step, which needs selecting an objective and effective weighting tool. This review found EW and PCA were the most frequently used weighting methods in heat vulnerability studies. Substantial studies [16,85,99] asserted that they decided to allocate all indicators or components with equal weights by referring to literature reviews on previous heat-related research. They assumed that each element is independent and represented a separate dimension of vulnerable targets to heat exposure. Nevertheless, there are no theoretical fundamentals to support the authenticity and credibility of this assumption. In contrast, it was discovered that the effects of vulnerability indicators might be altered as geographical scales and distances to metropolitan centers change [20,108].
Therefore, it is less convincing to distribute equal weights to selected indicators without any further examinations or scientific justifications. Another doubt is whether the hierarchical scheme is reasonable and valid, which allocates equal weights to indicators under the same subcategories. Ho et al. [55] and Mushore et al. [75] assigned equal weights to the indicators under dimensions of biophysical exposure and social vulnerability. However, the indicators under different evaluation dimensions had no equal weights because of the difference in original weights assigned to dimensions and the number of indicators of each dimension. It is unclear whether the consistency without any theoretical construct can possibly affect the accuracy and precision of vulnerability assessment results. Consequently, the decision on the selection of the EW method is totally at the author’s discretion from the subjective understanding of the relationships between each element.
The controversy of equal weights also occurred while applying PCA. Although PCA allocates weights to the variables under components according to the explained variances [61]. It was quite common for the studies which applied PCA to distribute equal weights to separate components. The implication of equal weighting mechanics also lacks adequate evaluations and supporting theories. PCA was commonly applied to reduce the number of indicators and identify principal components according to the statistical relationships between screened indicators. For instance, Cutter et al. [112] reduced 42 original indicators to 11 eligible indicators by PCA. Johnson et al. [104] obtained 19 variables from 25 well-known indicators by iteratively removing 6 variables exhibiting complex structures with PCA. The final obtained components without titles are less interpretable and comprehensible. It is unknown whether each component made up of a set of indicators that have statistical relationships can explicitly reflect varied vulnerability dimensions.
For example, Johnson et al. [104] obtained 4 components by PCA, one of which is made up of indicators of the black population and land surface temperature. What vulnerability characteristics does the combination of demographical properties and natural environment metrics indicate, although it can explain approximately 7% of the variance? Nayak et al. [108] entitled each component according to the commonality of indicators included. However, the socioeconomic component contained an indicator of personal health condition, i.e., the population with a disability, and race indicators of Hispanic and Black are classified into separate components. The mismatch between components and indicators has led to clutters in the analysis logicality. Consequently, whether the components obtained based on statistical relationships have rational practical meanings remains doubtful. Moreover, the application of PCA has a strict requirement for proxy data, which must ensure data integrity without any missing data. The restriction further limits the application of available datasets. Despite the limitation mentioned, PCA is still the most acknowledged and applicable statistical weighting method in the field of heat vulnerability assessment.
The results of the review disclosed that nearly 70% of the included vulnerability studies selected census tracts and administrative areas as spatial units to map urban heat vulnerability. Those studies over-relied on easily available census datasets and statistical data from official departments. However, varying heat vulnerability indicators interact across the boundaries of geographical units, which experience consolidations, revisions, and splits in urbanization. The selection of spatial scales may not draw rational conclusions due to underestimating the influence of interactions between administrative units on heat vulnerability and the accompanying modifiable areal unit problem (MAUP). MAUP is a statistical bias caused by aggregating types of indicators with different spatial features in a specific spatial scale [113]. After all, it is difficult to adequately capture geographical features with simple mean values on a coarse spatial scale. Additionally, the coarse granularity of distractive areas cannot meet the demand of contemporary urban planning and policymaking.
For avoiding MAUP and improve the accuracy of vulnerability assessment, many studies [27,50,71] attempted to harmonize spatial characteristics of human sensitivity and environmental exposure on a grid-scale with resampling approaches, which benefited from the development of related satellite techniques and available products. The application of remote sensing in heat-related research greatly improves the spatial resolution, which makes it possible to capture the difference between communities. Nevertheless, the quality of satellite images is influenced by atmospheric conditions during the imaging period, particularly the cloud cover. If the quality was not guaranteed, the improvement of spatial scale would not bring more precise and accurate vulnerability results. As there is a broad application of heat-related satellite products, assessing urban heat vulnerability on a finer grid scale with remote sensing data is becoming a trend for urban planning. Moreover, census datasets solely incorporate static data based on households, which cannot reflect the dynamic properties of individuals. Current studies rarely provide insight into how to assess urban heat vulnerability on the premise of considering a subjects’ location dynamic changes due to daily activities [111].
From a temporal perspective, most studies focused on the measurement and analysis of historical heat vulnerability in an implicit short term. These studies attempted to investigate how and why vulnerability patterns exist and distribute in a specific time after the 1990s. However, knowledge of only the spatial distributions and drivers of increased heat vulnerability is insufficient. The cross-sectional studies failed to capture the evolution and development of urban heat vulnerability in a long-term series and lacked the projection of potential heat risk. Thus, it is necessary to involve the time dimension in the assessing system. Furthermore, the lacunae of longitudinal and predictive research may impede the development and application of a broader applicable and comprehensive theoretical framework. On the one hand, longitudinal studies can adequately reflect the heterogeneity and dynamic evolution of heat vulnerability in the spatiotemporal dimension [50,67,87].
Evolution information is essential for urban planners to design mitigation strategies and examine the validity of previous measures. On the other hand, predictive studies are beneficial to grasp the potential trend of heat vulnerability in the future and provide guidelines for policymakers to formulate effective and efficient precautionary measures [24,63,98]. Interventions and policies anchored on historical knowledge have hysteretic nature, the reason for which is that they are formulated and applied after the occurrence of extreme heat vulnerability. For the prevention of potential heat risk, the prediction of heat vulnerability characteristics and corresponding preventive strategies from divergent scientific perspectives is particularly significant. To scientifically mitigate the extreme heat vulnerability, we call for more attempts and achievements in longitudinal and predictive research.
Validation is a dispensable process for heat vulnerability measurement and assessment [106,107]. However, according to the results of validation approaches, only 20 studies validated the research achievements, accounting for under a quarter of the selected articles. The lack of validation procedures may undermine the authenticity and credibility of the results and conclusions. Some research [54,98,100] argued that the vulnerability model applied has been validated by previous studies. However, the applicability and validity were only evaluated in specific study regions, which are insufficient as the theoretical underpinnings for the adjustment and application in the context of new studies.
The validation part is still imperative to broaden the applicability and enhance the conceptual comprehensiveness of current popular theoretical frameworks [102]. Moreover, many studies [67,77] mentioned the limitation of lacking validation and described future validation plans. They explained the main reason was the lack of corresponding validation data. If enough validation indicators are available, further validation analyses will be taken. However, only a few studies [106,107] conducted performance assessments to provide a solid support for the previous conclusions. Therefore, future heat vulnerability assessments should adequately consider and check the feasibility of validation experiments while designing study constructs.
All the studies with validation selected adverse heat-related health outcomes as validation variables, which is based on the empirical understanding that there is a causal relationship between HVIs and physical health consequences. Since Reid et al. [106] used hospitalizations and mortality counts to evaluate the proposed HVI before, it has been acknowledged by following related research to assess the performance of heat vulnerability results by using heat-related morbidity and mortality. The geographical area with a high HVI value may experience the potential risk of high morbidity and mortality [106]. However, although more frequent and intense extreme heat is associated with individual health conditions and contributes to increased morbidity and mortality [114,115], the stability and efficiency of the relationship has not been stated or examined in any reviewed articles.
It is unclear whether the heat-related morbidity and mortality of subjects are eligible to be the validation indicator and to what degree it can reflect the population’s heat vulnerability. For instance, Conlon et al. [52] obtained extremely low R2 values both in census tracts and blocks when regressing calculated HVIs with mortality during heat extremes, which potentially indicates that heat-related outcomes inadequately reflect heat vulnerability. Furthermore, multiple factors may influence heat-related morbidity and mortality. Zafeiratou et al. [115] discovered that cold weather contributed more to cardiovascular mortality rather than hot temperature. Although Sun et al. [116] found that increased extreme heat exacerbated the susceptibility and incidence of respiratory patients, Zafeiratou et al. [115] argued that the effect of air conditions on respiratory outcomes could not be ignored. It is extremely significant to excise the interferences from other attributes while using morbidity and mortality as validation variables.
While using morbidity and mortality as validation variables, the validation process was often constrained by local data availability, which led to spatiotemporal mismatches between assessment results and validation data, and substitution of all-cause health outcomes for heat-related morbidity and mortality. In terms of spatiotemporal mismatches, due to the lack of appropriate data, Estoque et al. [27] substituted city-level validation datasets for 2015 with province-level mortality during hot seasons from 2009 to 2011. Evaluating and validating heat vulnerability results with data for similar years on a coarser scale inevitably fails to capture adequate detailed information and harms the accuracy of validation results. Several studies [51,52,71,102] opted to use all-cause morbidity and mortality instead of heat-related ones because of data availability. Numerous factors contribute to adverse health outcomes besides extreme heat, such as individual habits, other meteorological factors, mental health status, etc. Therefore, it raises doubt whether all-cause morbidity and mortality are adequately eligible for validation data and likely to affect the accuracy of validation results.
Another point worth noting is that extreme heat not only poses a salient risk to human physical health, but also threatens the well-being of their mental status [117,118]. However, the selected studies solely concentrated on people’s physical health conditions, so we call for more indicators of mental and perceptual reactions to increased extreme heat. Ultimately, current validation indicators are from a statistical perspective without in situ measurements. Although statistical datasets are convenient and cost-effective, they have an inherent error and hysteresis nature due to the way of measurement and statistics.
Due to this circumstance, it is recommended to collect and survey personal feelings and perceptions in increased extreme heat and vulnerability parameters of the thermal environment from targeted vulnerable people and regions located by assessment outputs. In situ measurements of personal perceptions and ambient thermal environment during extremely hot days are appropriate complements to medical recordings [119]. Heat vulnerability is not bound to cause diseases and deaths, but the knowledge of individual feelings and perceptions in extreme heat is a precise reflection of biophysical exposure and social sensitivity. Moreover, field observations of the thermal environment, especially temperatures, cooling infrastructures, and green spaces, are complementary to a human perspective. It helps evaluate and examine heat vulnerability assessment outcomes from an angle of environmental exposure and resilience.
Multinomial regression models and Poisson regression models are the most frequently used validation models. Most reviewed studies selected simple linear regression models grounded in the assumption of the existing linear relationship between HVI and adverse health outcomes [49,103,109]. They utilized the accuracy of prediction of heat-related health outcomes with HVI to assess the performances of the studies. The facticity and stability of the assumed linear relationship have a direct impact on validation results. The introduction of Poisson regression models was anchored in the fact that heat-related morbidity and mortality during extreme heat periods fit to Poisson distribution. Poisson regression models are often used to examine contributing factors of diseases in the medical field [120]. The results of Poisson regression models illustrate what extent HVI explains the variation in heat outcomes.
Moreover, Pearson’s correlation and Spearman’s correlation were introduced to validate sections by measuring the linear or monotone relationships between HVI values and health outcomes. This review found that those validation methods were limited to statistical and quantitative aspects without any field investigations or qualitative methods, which is likely to undermine the accuracy and credibility of the validation. The field observation of temperatures in the thermal environment and the adequacy of cooling resources is beneficial to evaluate and validate the risk of biophysical heat exposure. The socioeconomic vulnerability can be qualitatively analyzed and verified by questionnaires and interviews with populations in vulnerable areas characterized by heat vulnerability outputs [21]. This method helps to grasp people’s perceptions and opinions of extreme heat and corresponding behavioral and habitual reactions to mitigate heat risk. It is an effective way to qualitatively analyze and validate whether the targeted populations are vulnerable to or feel worried about increased extreme heat.
As discussed above, selections of indicators, scales, and methods in processes of modelling and validation all have an impact on the performances of heat vulnerability measurement studies. It is essential for future research to select the elements suitable to local contexts. According to validation results, only 50% of studies with validations had relative great evaluation performances. The rate indicates that it is urgent for studies without validations to evaluate and validate their results to support the credibility of their conclusions and the applicability of methods. None of the other 50% of studies obtained satisfactory results which indicating a significant and strong correlation between heat vulnerability values and adverse health outcomes. Despite the lack of solid support for validation results, some studies [27,105] asserted that the results were quite important and useful in heat risk profiling and policymaking.
Thus, it is worth doubting whether the results and conclusions are credible and meaningful without the support from a good validation performance. Moreover, the difference in correlations at the different scales indicates the limited applicability of the developed methods. The overall validation performances reveal that HVI values alone may not suffice when measuring urban heat vulnerability [27,101]. Urban planners and policymakers should integrate multiple measuring and assessing approaches in the planning, conception, and design process of mitigation and intervention strategies. It is worth noting that validation approaches also affect performance outcomes. The differences between study performances may not precisely reflect the method accuracy and heat vulnerability gap due to the incomprehensiveness of validation methods. In situ measurements and qualitative analyses are necessary to examine and verify the effectiveness and authenticity of validation results. In this way, it is possible to evaluate the heat vulnerability results objectively and accurately, and substantially promote the development of methods measuring urban heat vulnerability.

5. Conclusions

As global warming, because of anthropogenic climate change, has been intensifying due to human activities, more and more people are inevitably becoming exposed to extreme heat, and the lack of or highly limited effective ecological planning is not helping [121,122,123,124,125]. The UHI effect exacerbates the circumstance, which leads to urban residents being more vulnerable to extreme heat than people in the surrounding areas. An increasing number of methods are thus being developed to measure urban heat vulnerability in various regions worldwide, to guide urban planning and policymaking. Nevertheless, thorough review studies that compare, contrast, and help in understanding the prospects and constraints of urban heat vulnerability assessment methods are scarce. The objective of the review was to bridge this gap by using the PRISMA approach. The results were analyzed and discussed from three aspects of indicators and data, modelling approaches, and validation approaches to assess the validity and limitations of these methods.
The results disclose that demographic properties and socioeconomic status, health conditions and medical resources, and natural and built environmental factors are commonly used indicator types. However, there seems to be no universal criteria and specifications in the selection of input metrics in terms of quantities, varieties, theoretical fundamentals, and data proxies. It is essential to incorporate as many key factors as possible according to supporting theories and local contexts to avoid subjective discretions. Meanwhile, controlling number of indicators by eliminating less relevant ones and keeping the consistency between indicators and categories is also important. Ultimately, researchers should select data proxies with high quality and adequate representativeness.
Another finding is that heat vulnerability indexing models, the equal weighting method, and the principal component analysis are commonly used modelling and weighting methods. Biophysical exposure and socioeconomic vulnerability are two main aspects captured by heat-related indexes. The heat vulnerability framework and risk triangle framework integrate the aspects of heat vulnerability for the comprehensiveness of assessments. However, further explanation of the underlying logicality is lacking, which is likely to undermine the reliability of the frameworks. Moreover, more attention should be paid to qualitative methods, though assessment from a qualitative perspective is quite difficult. EW and PCA methods are frequently used to allocate weights to indicators, while they have inherent limitations. The assumption of equal weighting seems to be untenable in some situations, and the PCA methods make indicators less readable and interpretable. Model outputs are mainly concentrated in administrative scales and historical short-term cross-sectional perspectives. Although it helps to capture the spatial variance of heat vulnerability, the evolution and trend of heat risk cannot be measured. To scientifically mitigate and intervene in extreme heat vulnerability, we call for more attempts and achievements in longitudinal and predictive research at finer scales.
In aspects of validation processes, slightly more than a quarter of all studies involved model validation. The results revealed that statistical regressions and correlation coefficients between heat vulnerability results and adverse health outcomes are commonly used validation approaches. Nevertheless, the relationship between HVI values and health consequences was not stable or strong enough in some studies. Both the substitution of all-cause health outcomes for heat-related morbidity and mortality spatiotemporal mismatches between assessment results and validation data had an impact on the accuracy and reliability of validation results. Moreover, validation methods are limited to statistical and quantitative perspectives without any field investigations and qualitative methods. Thus, more indicators, such as people’s perceptions and mental health and in situ data of thermal environment, and multiple qualitative methods, such as questionnaires and interviews, should be involved in model validation. Overall validation performances imply that HVI values alone may not suffice, and urban planners and policymakers should integrate multiple measuring and assessing approaches while formulating mitigation and intervention strategies.
In conclusion, there is a lack of a comprehensive and systematic framework in the development and validation of heat vulnerability assessment methods, which is adjustable to the local context. The findings and discussions are helpful for the establishment of an acknowledged framework in the future. This study informs urban policy and generates directions for prospective research and more accurate vulnerability assessment method development.

Author Contributions

F.L.: Data collection, processing, investigation, analysis, and writing—original draft; T.Y., M.N., K.N.T. and F.D.: Supervision, conceptualization, writing—review & editing. All authors have read and agreed to the published version of the manuscript.

Funding

This research was funded by the China Scholarship Council, Grant Number 202106420006.

Data Availability Statement

The data sources are listed in Appendix A.

Acknowledgments

The authors thank the editor and anonymous referees for their invaluable comments on an earlier version of the manuscript. The authors also appreciate the financial support from the China Scholarship Council (No. 202106420006).

Conflicts of Interest

The authors declare no conflict of interest.

Appendix A

Table A1. The list of articles reviewed.
AuthorYearTitleJournalAimRelevance
Wu et al. [54]2022“Mapping Heat-Health Vulnerability Based On Remote Sensing: A Case Study In Karachi”Remote SensingTo develop an assessment framework for developing countries Provides insights into how to use remote sensing data to map Heat-Health Vulnerability
Chen et al. [53]2021“Heat Risk Of Residents In Different Types Of Communities From Urban Heat-Exposed Areas”Science Of The Total EnvironmentTo assess heat risk of residents in different types of communitiesGenerates knowledge on how to use questionnaire surveys and RS analysis to identify heat exposure areas
Ferreira et al. [69]2021“An Explicitly Spatial Approach To Identify Heat Vulnerable Urban Areas And Landscape Patterns”Urban ClimateTo develop an explicitly spatial approach to identify heat vulnerable urban areas and landscape patterns Provides insights into how to identify vulnerable urban areas by considering the land surface temperature (LST) distribution and landscape patterns
Holec et al. [15]2021“Heat Risk Assessment Based On Mobile Phone Data: Case Study Of Bratislava, Slovakia”Natural HazardsTo assess the heat risk for BratislavaGenerates insights into how to use mobile data to assess heat risk based on a risk index
Kamal et al. [61]2021“Extreme Heat Vulnerability Assessment In Tropical Region: A Case Study In Malaysia”Climate And DevelopmentTo assess the extreme heat vulnerability distribution across Peninsular MalaysiaDiscusses how to assess extreme heat vulnerability distribution by using an EHVI
Li et al. [25]2021“Investigating The Spatial Distribution Of Resident’s Outdoor Heat Exposure Across Neighborhoods Of Philadelphia, Pennsylvania Using Urban Microclimate Modeling”Sustainable Cities And SocietyTo study the spatial distribution of human outdoor heat exposure in Philadelphia, PennsylvaniaDescribes by using mean radiant temperature calculated by a SOLWEIG model how to map heat exposure
Liou et al. [17]2021“Altering Urban Greenspace Patterns And Heat Stress Risk In Hanoi City During Master Plan 2030 Implementation”Land Use PolicyTo develop a method to map local-level heat stress risk at Hanoi CityDescribes how to generate heat risk patterns by combining environmental and UGS factors
Paranunzio et al. [81]2021“Assessing Current And Future Heat Risk In Dublin City, Ireland”Urban ClimateTo propose an approach to assess heat risk for DublinDevelops an extreme heat stress risk index for Dublin city across multiple decades (2020s–2050s) and for two representative concentration pathways (RCPs)
Rao et al. [50]2021“Spatio-Temporal Analysis Of Land Surface Temperature For Identification Of Heat Wave Risk And Vulnerability Hotspots In Indo-Gangetic Plains Of India”Theoretical And Applied ClimatologyTo identify the risk and vulnerability hotspots in the western IGP of IndiaProvides insights into how to use LST on GEE platform to build HW indicators for spatiotemporal analysis of heat risk
Wang et al. [51]2021“The Relationship Between Population Heat Vulnerability And Urbanization Levels: A County-Level Modeling Study Across China”Environment InternationalTo develop an HVI for China to identify the most vulnerable Uses an HVI to map heat vulnerability of China and its relationship with urbanization
Yin et al. [111]2021“Dtex: A Dynamic Urban Thermal Exposure Index Based On Human Mobility Patterns”Environment InternationalTo develop and test a Dynamic Thermal Exposure index (DTEx)Takes human movement into consideration while developing an HVI
Alonso & Renard [58]2020“A Comparative Study Of The Physiological And Socio-Economic Vulnerabilities To Heat Waves Of The Population Of The Metropolis Of Lyon (France) In A Climate Change Context”International Journal Of Environmental Research And Public HealthTo compare physiological vulnerability and socioeconomic vulnerability in Lyon city Discusses the performance of two different indexes in heat vulnerability assessment
Conlon et al. [52]2020“Mapping Human Vulnerability To Extreme Heat: A Critical Assessment Of Heat Vulnerability Indices Created Using Principal Components Analysis”Environmental Health PerspectivesTo evaluate the effectiveness of HVIs using PCADiscusses the performance of the PCA method in assessing heat vulnerability
Dong et al. [82]2020“Heatwave-Induced Human Health Risk Assessment In Megacities Based On Heat Stress-Social Vulnerability-Human Exposure Framework”Landscape And Urban PlanningTo develop a new heatwave-induced human health risk framework for Wuhan CityUses UTCI to assess heatwave-induced health risk
Estoque et al. [27]2020“Heat Health Risk Assessment In Philippine Cities Using Remotely Sensed Data And Social-Ecological Indicators”Nature CommunicationsTo assess the current heat health risk in 139 Philippine citiesIdentifies the city-level heat risk by using a framework of IPCC
Hammer et al. [56]2020“Local Extreme Heat Planning: An Interactive Tool To Examine A Heat Vulnerability Index For Philadelphia, Pennsylvania”Journal Of Urban HealthTo develop an HVI to classify the most at-risk Philadelphia neighborhoodsUses an HVI to identify priority areas for extreme heat planning
Kwon et al. [101]2020“Is Sensible Heat Flux Useful For The Assessment Of Thermal Vulnerability In Seoul (Korea)?”International Journal Of Environmental Research And Public HealthTo identify a more reasonable method (TVI) for evaluating thermal vulnerabilityProvides insights into how to use sensible heat flux to assess thermal vulnerability
Liu et al. [94]2020“Mapping Urban Heat Vulnerability Of Extreme Heat In Hangzhou Via Comparing Two Approaches”ComplexityTo compare two approached in evaluating heat vulnerability Discusses which method can better be used to evaluate the heat vulnerability
Maragno et al. [90]2020“Mapping Heat Stress Vulnerability And Risk Assessment At The Neighborhood Scale To Drive Urban Adaptation Planning”SustainabilityTo develop a methodology for heat stress vulnerability and risk assessmentDiscusses how to support local apartments in developing adaptation strategies without high-resolution climate data
Navarro-Estupiñan et al. [97]2020“Heat Risk Mapping Through Spatial Analysis Of Remotely-Sensed Data And Socioeconomic Vulnerability In Hermosillo, México”Urban ClimateTo develop a method combining satellite data and socioeconomic data for heat vulnerability assessment Describes how to map heat risk by combining LST and census data with stability and hot spot analysis
Prosdocimi & Klima [24]2020“Health Effects Of Heat Vulnerability In Rio De Janeiro: A Validation Model For Policy Applications”SN Applied SciencesTo develop a heat vulnerability index for the city of Rio de Janeiro.Constructs and validates a heat vulnerability index given uncertainty ranges in data for the city of Rio de Janeiro
Song et al. [78]2020“Fine-Scale Mapping Of An Evidence-Based Heat Health Risk Index For High-Density Cities: Hong Kong As A Case Study”Large Tertiary Planning UnitsTo provide an evidence-based HVI to explicitly assess heat risk at the community levelExplores the spatial and temporal variations of heat risk in Hong Kong based on various indicators.
Zemtsov et al. [64]2020“Intraurban Social Risk And Mortality Patterns During Extreme Heat Events: A Case Study Of Moscow, 2010–2017”Health PlaceTo assess the social risk during a heat wave in MoscowDiscusses how to assess social risk based on the COSMOCLM and PET
Agathangelidis et al. [91]2019“Integrating Urban Form, Function, And Energy Fluxes In A Heat Exposure Indicator In View Of Intra-Urban Heat Island Assessment And Climate Change Adaptation”ClimateTo develop the Urban Heat Exposure (UHeatEx) indicatorUses the physical processes which drive the urban heat island (UHI) to build an HVI
Cai et al. [80]2019“Assessing The Heat Vulnerability Of Different Local Climate Zones In The Old Areas Of A Chinese Megacity”SustainabilityTo investigate a heat vulnerability assessment methodology for different LCZ classesProvides insights into how to assess urban heat vulnerabilities based on LCZ classification
Guo et al. [96]2019“Estimating Fine-Scale Heat Vulnerability In Beijing Through Two Approaches: Spatial Patterns, Similarities, And Divergence”Remote SensingTo compare the performance of two commonly used approaches, PCA and EWI in assessing the urban heat vulnerabilityDiscusses which method is more effective in assessing urban heat vulnerability
He et al. [23]2019“Exploring The Mechanisms Of Heat Wave Vulnerability At The Urban Scale Based On The Application Of Big Data And Artificial Societies”Environment InternationalTo analyze how urbanization influences heat vulnerability and how urban vulnerability influences heat-related mortalityProvides insights into exploring the relationship between urbanization and heat vulnerability by big data and artificial societies
Hulley et al. [77]2019“New ECOSTRESS And MODIS Land Surface Temperature Data Reveal Fine-Scale Heat Vulnerability In Cities: A Case Study For Los Angeles County, California”Remote SensingTo develop an HVI to map heat vulnerability for LA county Describes using socioeconomic and environmental variables to measure heat exposure
Jacobs et al. [72]2019“Patterns Of Outdoor Exposure To Heat In Three South Asian Cities”Science Of The Total EnvironmentTo characterize intra-urban differences in exposure to heat in three major cities in the South Asian regionIdentifies how enhanced exposure to outdoor heat in informal urban neighborhoods
Jänicke et al. [109]2019“Quantification And Evaluation Of Intra-Urban Heat-Stress Variability In Seoul, Korea”International Journal Of BiometeorologyTo assess intra-urban heat-stress variability in Seoul, KoreaDescribes ways to use an HVI and age scores to assess heat stress
Lapola et al. [48]2019“Heat Stress Vulnerability And Risk At The (Super) Local Scale In Six Brazilian Capitals”Climatic ChangeTo assess the heat stress vulnerability and risk for six Brazilian capitalsIdentifies heat vulnerability for a population by using HVIs calculated by high resolution data
Mallen et al. [105]2019“A Methodological Assessment Of Extreme Heat Mortality Modeling And Heat Vulnerability Mapping In Dallas, Texas”Urban ClimateTo assess the performance of different HVI techniques in assessing vulnerabilityIdentifies to what extent a common HVI model can reproduce exposure-response model results in the City of Dallas, Texas
Wilson & Chakraborty [87]2019“Mapping Vulnerability To Extreme Heat Events: Lessons From Metropolitan Chicago”Journal Of Environmental Planning And ManagementTo develop an approach to locate vulnerable populations and identify how the locations change Discusses how the locations of vulnerable populations change and what factors lead to it
Zhang et al. [68]2019“Mapping Heat-Related Health Risks Of Elderly Citizens In Mountainous Area: A Case Study Of Chongqing, China”Science Of The Total EnvironmentTo assess and map heat-related health risks of elderly citizens at a raster scaleExplores how to map the heat health risk of the elderly population in Chongqing by a developed method
Barron et al. [16]2018“Assessing Vulnerability To Heat: A Geospatial Analysis For The City Of Philadelphia”Urban ScienceTo map UHI health risks of Philadelphia for the planning of street trees Describes by using geospatial analysis a way to map highly vulnerable locations for resources allocations
Chen et al. [31]2018“Spatially Explicit Assessment Of Heat Health Risk By Using Multi-Sensor Remote Sensing Images And Socioeconomic Data In Yangtze River Delta, China”International Journal Of Health GeographicsTo assess heat-related health risks at a regional scale and explore the driving factors in Yangtze River Delta, ChinaDemonstrate by using a spatial heat health risk assessment framework how to assess heat vulnerability
Dongo et al. [126]2018“Mapping Urban Residents’ Vulnerability To Heat In Abidjan, Côte d’Ivoire”Climate And DevelopmentTo assess the social vulnerability of the inhabitants of Cocody to heatDiscusses the urban residents’ vulnerability to heat in the context of rapid urbanization and lack of green spaces
Ho et al. [55]2018“Spatiotemporal Analysis Of Regional Socio-Economic Vulnerability Change Associated With Heat Risks In Canada”Current Climate Change ReportsTo develop a novel design to compare spatiotemporal changes of heat vulnerability Uses a new method to identify locations that may be increasingly vulnerable to heat
Karimi et al. [22]2018“A Conceptual Framework For Environmental Risk And Social Vulnerability Assessment In Complex Urban Settings”Urban ClimateTo assess the impact of each land cover type on Urban Heat IslandProposes a conceptual framework to estimate environmental risk and social vulnerability
Kazak et al. [92]2018“The Use Of A Decision Support System For Sustainable Urbanization And Thermal Comfort In Adaptation To Climate Change Actions—The Case Of The Wrocław Larger Urban Zone (Poland)”SustainabilityTo develop a method for mapping urban heat exposure to the UHI effectProvides insights into how to apply a decision support system to measure exposure to UHI effect
Macintyre et al. [76]2018“Assessing Urban Population Vulnerability And Environmental Risks Across An Urban Area During Heatwaves: Implications For Health Protection”Science Of The Total EnvironmentTo develop a novel risk mapping methodology during heatwavesProvides insights into how to use high spatial resolution modelling of temperature, population age, and building types to identify vulnerable populations and locations
Nayak et al. [108]2018“Development Of A Heat Vulnerability Index For New York State”Public HealthTo develop a heat vulnerability index (HVI) to identify heat-vulnerable populations and regions in New York Describes how to observe geographical variability of heat vulnerability by HVI development
Verdonck et al. [99]2018“The Potential Of Local Climate Zones Maps As A Heat Stress Assessment Tool, Supported By Simulated Air Temperature Data”Landscape And Urban PlanningTo evaluate whether LCZ maps can serve as a tool for heat stress assessmentExplores how LCZ maps perform in heat stress assessment by using LCZs as an indicator
Voelkel et al. [47]2018“Assessing Vulnerability To Urban Heat: A Study Of Disproportionate Heat Exposure And Access To Refuge By Socio-Demographic Status In Portland, Oregon”International Journal Of Environmental Research And Public HealthTo determine which socio-demographic populations experience disproportionate exposure to extreme heat in Portland city Identifies hottest areas and trends of socio-demographic disparity by using spatial statistical methods
Zhang et al. [14]2018“A Raster-Based Subdividing Indicator To Map Urban Heat Vulnerability: A Case Study In Sydney, Australia”International Journal Of Environmental Research And Public HealthTo propose a raster-based subdividing indicator to map urban heat vulnerabilityDiscuss how to improve the accuracy and enhanced the comparability of urban heat vulnerability assessment
Azhar et al. [95]2017“Heat Wave Vulnerability Mapping For India”International Journal Of Environmental Research And Public HealthTo develop an integrated district level heat vulnerability index for IndiaConduct a country-wide assessment of heat vulnerability in India.
Christenson et al. [60]2017“Heat Vulnerability Index Mapping For Milwaukee And Wisconsin”Journal Of Public Health Management And PracticeTo develop two HVIs for Milwaukee and Wisconsin to cope with extreme heat events Use HVIs to identify areas of greatest risk for negative health impacts due to extreme heat
Hu et al. [49]2017“Spatially Explicit Mapping Of Heat Health Risk Utilizing Environmental And Socioeconomic Data”Environmental Science And TechnologyTo improve spatial delineation of health risk from EHEsProvides insights into how to use
ultisensory remote sensing data to assess heat exposure on a per-pixel basis
Kim et al. [103]2017“Mapping Heatwave Vulnerability In Korea”Natural Hazards
To identify the heat vulnerability factors and their correlation with mortality, evaluate the developed HVI, and to assess the impact of a heat wave at the national levelDescribes creating a spatial heatwave vulnerability map to identify the distribution of heatwave risk
Krstic et al. [71]2017“The Heat Exposure Integrated Deprivation Index (HEIDI): A Data-Driven Approach To Quantifying Neighborhood Risk During Extreme Hot Weather”Environmental International
To identify areas of high risk by using the developed data-driven approach Describes a data-driven approach to selection and weight HVI variables and creates a heat exposure integrated deprivation index (HEIDI)
Mushore et al. [75]2017“Determining Extreme Heat Vulnerability Of Harare Metropolitan City Using Multispectral Remote Sensing And Socio-Economic Data”Journal Of Spatial ScienceTo derive detailed area-specific spatial information on the distribution of heat vulnerability in Harare city, ZimbabweIdentifies potential vulnerable residents by using an HVI which integrates physical heat exposure indexes
Oh et al. [98]2017“Development Of The Korean Climate Change Vulnerability Assessment Tool (VESTAP)—Centered On Health Vulnerability To Heat Waves”SustainabilityTo develop the GIS-based VESTAP system to assess climate change vulnerabilityAssesses the heat wave vulnerability of Korea by administrative district
Aminipouri et al. [70]2016“Using Multiple Disparate Data Sources To Map Heat Vulnerability: Vancouver Case Study”The Canadian GeographerTo develop a method to map heat-vulnerable populations by using multiple disparate data Discusses the effectiveness of spatially overlaying multiple disparate data to map heat-vulnerable populations
Macnee & Tokai [59]2016“Heat Wave Vulnerability And Exposure Mapping For Osaka City, Japan”Environment Systems And DecisionsTo develop a heat wave vulnerability index for Osaka CityEstimates the heat vulnerability of Osaka City by combining an HVI and a heat exposure analysis
Chuang & Gober [65]2015“Predicting Hospitalization For Heat-Related Illness At The Census-Tract Level: Accuracy Of A Generic Heat Vulnerability Index In Phoenix, Arizona (USA)”Environmental Health PerspectivesTo test a heat vulnerability index by using data on heat-related hospitalizations in Phoenix, Arizona. Discusses the HVI’s ability to predict heat-related hospitalizations and explores the potential heat risk factors
El-Zein & Tonmoy [26]2015“Assessment Of Vulnerability To Climate Change Using A Multi-Criteria Outranking Approach With Application To Heat Stress In Sydney”Ecological IndicatorsTo develop an approach for teasing out policy-relevant information from uncertain vulnerability dataProvides insights into how to use outranking procedures for heat vulnerability assessment
Mitchell & Chakraborty [46]2015“Landscapes Of Thermal Inequity: Disproportionate Exposure To Urban Heat In The Three Largest US Cities”Environmental Research LettersTo develop an urban heat risk index (UHRI) to map thermal inequity Describes using UHRI to determine how racial and socioeconomically disadvantaged residents are distributed
Weber et al. [67]2015“Policy-Relevant Indicators For Mapping The Vulnerability Of Urban Populations To Extreme Heat Events: A Case Study Of Philadelphia”Applied GeographyTo develop indicators of urban heat vulnerability to support policy decisions Discusses how to map urban heat vulnerability by integrating satellite data and local indicators
Boumans et al. [13]2014“Developing A Model For Effects Of Climate Change On Human Health And Health–Environment Interactions: Heat Stress In Austin, Texas”Urban ClimateTo develop a broadly applicable support platform for decision-making by local government Discusses how the model maps heat health risk and evaluates the effectiveness of mitigation options
Dong et al. [127]2014“Assessing Heat Health Risk For Sustainability In Beijing’s Urban Heat Island”SustainabilityTo develop a methodology to assess heat health risk at the sub-district levelDevelops a heat health risk index integrated with the UHI effect
Dugord et al. [89]2014“Land Use Patterns, Temperature Distribution, And Potential Heat Stress Risk: The Case Study Berlin, Germany”Computers, Environment And Urban SystemsTo identify sites of potential heat stress risk in Berlin, GermanyDiscusses the drivers influencing the temperature distribution based on the LU patterns, especially green space
Heaton et al. [29]2014“Characterizing Urban Vulnerability To Heat Stress Using A Spatially Varying Coefficient Model”Spatial And Spatiotemporal EpidemiologyTo identify and characterize vulnerability to heat using non-accidental mortality data in Houston, TexasDescribes how to use a spatially varying coefficient model to characterize heat vulnerability among census block groups
Loughnan et al. [63]2014“Can A Spatial Index Of Heat-Related Vulnerability Predict Emergency Service Demand In Australian Capital Cities?”International Journal Of Emergency ServicesTo develop a heat vulnerability model to map areas with high emergency service demandExplores the performance of the index developed in Australian capital cities by using Spearman’s rank correlation
Maier et al. [102]2014“Assessing The Performance Of A Vulnerability Index During Oppressive Heat Across Georgia, United States”Weather, Climate, And SocietyTo compute heat vulnerability across the state of GeorgiaDiscusses if counties with high HVI values experience high heat risk
Wolf et al. [107]2014“Performance Assessment Of A Heat Wave Vulnerability Index For Greater London, United Kingdom”Weather, Climate, And SocietyTo assess of a multivariate HVI developed for London, UKDiscusses the HVI’s ability to predict whether mortality and ambulance callout attain above average levels during a heat wave event
Depietri et al. [86]2013“Social Vulnerability Assessment Of The Cologne Urban Area (Germany) To Heat Waves: Links To Ecosystem Services”International Journal Of Disaster Risk ReductionTo assess the vulnerability of the Cologne urban population to heat wavesIdentifies urban residents’ vulnerability based on the MOVE framework
Harlan et al. [128]2013“Neighborhood Effects On Heat Deaths: Social And Environmental Predictors Of Vulnerability In Maricopa County, Arizona”Social Science & MedicineTo estimate neighborhood human and environmental effects on heat-related deaths in Maricopa County, ArizonaIdentifies locations of vulnerability and heat-related deaths and uses binary logistic regression and spatial analysis to estimate neighborhood effects
Wolf & McGregor [100]2013“The Development Of A Heat Wave Vulnerability Index For London, United Kingdom”Weather And Climate ExtremesTo develop an HVI for Greater London Develop an HVI with a particular focus in London and test it with mortality and ambulance call out data
Buscail et al. [88]2012“Mapping Heatwave Health Risk At The Community Level For Public Health Action”International Journal Of Health GeographicsTo develop a conceptual framework adopted to a variety of urban configurationsProvides insights into how to use satellite thermal data and other digital data to map heat-health vulnerability
Johnson et al. [104]2012“Developing An Applied Extreme Heat Vulnerability Index Utilizing Socioeconomic And Environmental Data”Applied GeographyTo further understand the heat-related risk and promote the development of heat risk modelProvides insights into how to incorporate socioeconomic and environmental indicators to measure extreme heat vulnerability
Kershaw & Millward [62]2012“A Spatio-Temporal Index For Heat Vulnerability Assessment”Environmental Monitoring And AssessmentTo develop a metric for mapping exposure to heatProvides insights into how to use meteorological data to identify heat exposure
Loughnan et al. [79]2012“Mapping Heat Health Risks In Urban Areas”International Journal Of Population ResearchTo develop an index of the spatial variation of vulnerability for MelbourneProvides insights regarding how to map the health risk of hot weather
Reid et al. [106]2012“Evaluation Of A Heat Vulnerability Index On Abnormally Hot Days: An Environmental Public Health Tracking Study”Environmental Health PerspectivesTo understand the effectiveness of the HVI in assessing urban heat vulnerability Discusses whether areas with higher HVI values experienced higher rates of morbidity and mortality
Tomlinson et al. [11]2011“Including The Urban Heat Island In Spatial Heat Health Risk Assessment Strategies: A Case Study For Birmingham, UK”International Journal Of Health GeographicsTo develop a spatial risk assessment methodology to highlight potential heat health risk areasDescribes how to carry out a climate change risk assessment by integrating RS UHI data and commercial social segmentation data
Rinner et al. [85]2010“The Role Of Maps In Neighborhood-Level Heat Vulnerability Assessment For The City Of Toronto”Cartography And Geographic Information ScienceTo develop mapping tools to identify vulnerable populations and placesDiscusses the effectiveness of cartographic design decisions in creating heat vulnerability maps
Harlan et al. [19]2006“Neighborhood Microclimates And Vulnerability To Heat Stress”Social Science & MedicineTo investigate if warmer environments and lack of resources lead to adverse heat-related outcomes Presents how to examine heat-related health inequalities in a city with HTCI

References

  1. Kamruzzaman, M.; Deilami, K.; Yigitcanlar, T. Investigating the urban heat island effect of transit oriented development in Brisbane. J. Transp. Geogr. 2018, 66, 116–124. [Google Scholar] [CrossRef]
  2. Degirmenci, K.; Desouza, K.C.; Fieuw, W.; Watson, R.T.; Yigitcanlar, T. Understanding policy and technology responses in mitigating urban heat islands: A literature review and directions for future research. Sustain. Cities Soc. 2021, 70, 102873. [Google Scholar] [CrossRef]
  3. Tuczek, M.; Degirmenci, K.; Desouza, K.C.; Watson, R.T.; Yigitcanlar, T.; Breitner, M.H. Mitigating urban heat with optimal distribution of vegetation and buildings. Urban Clim. 2022, 44, 101208. [Google Scholar] [CrossRef]
  4. Perkins, S.; Alexander, L.; Nairn, J. Increasing frequency, intensity and duration of observed global heatwaves and warm spells. Geophys. Res. Lett. 2012, 39, 20714. [Google Scholar] [CrossRef]
  5. Li, Y.; Akkus, C.; Yu, X.; Joyner, A.; Kmet, J.; Sweat, D.; Jia, C. Heatwave events and mortality outcomes in Memphis, Tennessee: Testing effect modification by socioeconomic status and urbanicity. Int. J. Environ. Res. Public Health 2019, 16, 4568. [Google Scholar] [CrossRef]
  6. Kankanamge, N.; Yigitcanlar, T.; Goonetilleke, A.; Kamruzzaman, M. Determining disaster severity through social media analysis: Testing the methodology with South East Queensland Flood tweets. Int. J. Disaster Risk Reduct. 2020, 42, 101360. [Google Scholar] [CrossRef]
  7. Sheridan, S.C.; Dixon, P.G.; Kalkstein, A.J.; Allen, M.J. Recent trends in heat-related mortality in the United States: An update through 2018. Weather Clim. Soc. 2021, 13, 95–106. [Google Scholar] [CrossRef]
  8. Goonetilleke, A.; Yigitcanlar, T.; Ayoko, G.A.; Egodawatta, P. Sustainable Urban Water Environment: Climate, Pollution and Adaptation; Edward Elgar: Cheltenham, UK, 2014. [Google Scholar]
  9. Pincetl, S.; Chester, M.; Eisenman, D. Urban heat stress vulnerability in the US Southwest: The role of sociotechnical systems. Sustainability 2016, 8, 842. [Google Scholar] [CrossRef]
  10. Adélaïde, L.; Chanel, O.; Pascal, M. Health effects from heat waves in France: An economic evaluation. Eur. J. Health Econ. 2022, 23, 119–131. [Google Scholar] [CrossRef]
  11. Tomlinson, C.J.; Chapman, L.; Thornes, J.E.; Baker, C.J. Including the urban heat island in spatial heat health risk assessment strategies: A case study for Birmingham, UK. Int. J. Health Geogr. 2011, 10, 42. [Google Scholar] [CrossRef] [Green Version]
  12. Almeida, C.R.d.; Furst, L.; Gonçalves, A.; Teodoro, A.C. Remote Sensing Image-Based Analysis of the Urban Heat Island Effect in Bragança, Portugal. Environments 2022, 9, 98. [Google Scholar] [CrossRef]
  13. Boumans, R.J.; Phillips, D.L.; Victery, W.; Fontaine, T.D. Developing a model for effects of climate change on human health and health–environment interactions: Heat stress in Austin, Texas. Urban Clim. 2014, 8, 78–99. [Google Scholar] [CrossRef]
  14. Zhang, W.; McManus, P.; Duncan, E. A raster-based subdividing indicator to map urban heat vulnerability: A case study in sydney, australia. Int. J. Environ. Res. Public Health 2018, 15, 2516. [Google Scholar] [CrossRef] [PubMed]
  15. Holec, J.; Šveda, M.; Szatmári, D.; Feranec, J.; Bobáľová, H.; Kopecká, M.; Šťastný, P. Heat risk assessment based on mobile phone data: Case study of Bratislava, Slovakia. Nat. Hazards 2021, 108, 3099–3120. [Google Scholar] [CrossRef]
  16. Barron, L.; Ruggieri, D.; Branas, C. Assessing vulnerability to heat: A geospatial analysis for the City of Philadelphia. Urban Sci. 2018, 2, 38. [Google Scholar] [CrossRef]
  17. Liou, Y.-A.; Nguyen, K.-A.; Ho, L.-T. Altering urban greenspace patterns and heat stress risk in Hanoi city during Master Plan 2030 implementation. Land Use Policy 2021, 105, 105405. [Google Scholar] [CrossRef]
  18. Vescovi, L.; Rebetez, M.; Rong, F. Assessing public health risk due to extremely high temperature events: Climate and social parameters. Clim. Res. 2005, 30, 71–78. [Google Scholar] [CrossRef]
  19. Harlan, S.L.; Brazel, A.J.; Prashad, L.; Stefanov, W.L.; Larsen, L. Neighborhood microclimates and vulnerability to heat stress. Soc. Sci. Med. 2006, 63, 2847–2863. [Google Scholar] [CrossRef]
  20. Reid, C.E.; O’neill, M.S.; Gronlund, C.J.; Brines, S.J.; Brown, D.G.; Diez-Roux, A.V.; Schwartz, J. Mapping community determinants of heat vulnerability. Environ. Health Perspect. 2009, 117, 1730–1736. [Google Scholar] [CrossRef]
  21. Cheng, W.; Li, D.; Liu, Z.; Brown, R.D. Approaches for identifying heat-vulnerable populations and locations: A systematic review. Sci. Total Environ. 2021, 799, 149417. [Google Scholar] [CrossRef]
  22. Karimi, M.; Nazari, R.; Dutova, D.; Khanbilvardi, R.; Ghandehari, M. A conceptual framework for environmental risk and social vulnerability assessment in complex urban settings. Urban Clim. 2018, 26, 161–173. [Google Scholar] [CrossRef]
  23. He, C.; Ma, L.; Zhou, L.; Kan, H.; Zhang, Y.; Ma, W.; Chen, B. Exploring the mechanisms of heat wave vulnerability at the urban scale based on the application of big data and artificial societies. Environ. Int. 2019, 127, 573–583. [Google Scholar] [CrossRef] [PubMed]
  24. Prosdocimi, D.; Klima, K. Health effects of heat vulnerability in Rio de Janeiro: A validation model for policy applications. SN Appl. Sci. 2020, 2, 1948. [Google Scholar] [CrossRef]
  25. Li, X. Investigating the spatial distribution of resident’s outdoor heat exposure across neighborhoods of Philadelphia, Pennsylvania using urban microclimate modeling. Sustain. Cities Soc. 2021, 72, 103066. [Google Scholar] [CrossRef]
  26. El-Zein, A.; Tonmoy, F.N. Assessment of vulnerability to climate change using a multi-criteria outranking approach with application to heat stress in Sydney. Ecol. Indic. 2015, 48, 207–217. [Google Scholar] [CrossRef]
  27. Estoque, R.C.; Ooba, M.; Seposo, X.T.; Togawa, T.; Hijioka, Y.; Takahashi, K.; Nakamura, S. Heat health risk assessment in Philippine cities using remotely sensed data and social-ecological indicators. Nat. Commun. 2020, 11, 1581. [Google Scholar] [CrossRef]
  28. Brooks, N.; Adger, W.N.; Kelly, P.M. The determinants of vulnerability and adaptive capacity at the national level and the implications for adaptation. Glob. Environ. Chang. 2005, 15, 151–163. [Google Scholar] [CrossRef]
  29. Heaton, M.J.; Sain, S.R.; Greasby, T.A.; Uejio, C.K.; Hayden, M.H.; Monaghan, A.J.; Boehnert, J.; Sampson, K.; Banerjee, D.; Nepal, V. Characterizing urban vulnerability to heat stress using a spatially varying coefficient model. Spat. Spatiotemporal Epidemiol. 2014, 8, 23–33. [Google Scholar] [CrossRef]
  30. Tate, E. Social vulnerability indices: A comparative assessment using uncertainty and sensitivity analysis. Nat. Hazards 2012, 63, 325–347. [Google Scholar] [CrossRef]
  31. Chen, Q.; Ding, M.; Yang, X.; Hu, K.; Qi, J. Spatially explicit assessment of heat health risk by using multi-sensor Remote Sensing images and socioeconomic data in Yangtze River Delta, China. Int. J. Health Geogr. 2018, 17, 15. [Google Scholar] [CrossRef]
  32. Adger, W.N. Vulnerability. Glob. Environ. Chang. 2006, 16, 268–281. [Google Scholar] [CrossRef]
  33. Niu, Y.; Li, Z.; Gao, Y.; Liu, X.; Xu, L.; Vardoulakis, S.; Yue, Y.; Wang, J.; Liu, Q. A Systematic Review of the Development and Validation of the Heat Vulnerability Index: Major Factors, Methods, and Spatial Units. Curr. Clim. Chang. Rep. 2021, 7, 87–97. [Google Scholar] [CrossRef] [PubMed]
  34. Moher, D.; Shamseer, L.; Clarke, M.; Ghersi, D.; Liberati, A.; Petticrew, M.; Shekelle, P.; Stewart, L.A. Preferred reporting items for systematic review and meta-analysis protocols (PRISMA-P) 2015 statement. Syst. Rev. 2015, 4, 1. [Google Scholar] [CrossRef] [PubMed]
  35. Regona, M.; Yigitcanlar, T.; Xia, B.; Li, R.Y.M. Opportunities and adoption challenges of AI in the construction industry: A PRISMA review. J. Open Innov. Technol. Mark. Complex. 2022, 8, 45. [Google Scholar] [CrossRef]
  36. Kottek, M.; Grieser, J.; Beck, C.; Rudolf, B.; Rubel, F. World map of the Köppen-Geiger climate classification updated. Meteorol. Z. 2006, 15, 259–263. [Google Scholar] [CrossRef]
  37. Peel, M.C.; Finlayson, B.L.; McMahon, T.A. Updated world map of the Köppen-Geiger climate classification. Hydrol. Earth Syst. Sci. 2007, 11, 1633–1644. [Google Scholar] [CrossRef]
  38. Fouillet, A.; Rey, G.; Laurent, F.; Pavillon, G.; Bellec, S.; Guihenneuc-Jouyaux, C.; Clavel, J.; Jougla, E.; Hémon, D. Excess mortality related to the August 2003 heat wave in France. Int. Arch. Occup. Environ. Health 2006, 80, 16–24. [Google Scholar] [CrossRef]
  39. Stafoggia, M.; Forastiere, F.; Agostini, D.; Caranci, N.; De’Donato, F.; Demaria, M.; Michelozzi, P.; Miglio, R.; Rognoni, M.; Russo, A. Factors affecting in-hospital heat-related mortality: A multi-city case-crossover analysis. J. Epidemiol. Commun. Health 2008, 62, 209–215. [Google Scholar] [CrossRef]
  40. Luber, G.; McGeehin, M. Climate change and extreme heat events. Am. J. Prev. Med. 2008, 35, 429–435. [Google Scholar] [CrossRef]
  41. Cheng, W.; Brown, R.D. An energy budget model for estimating the thermal comfort of children. Int. J. Biometeorol. 2020, 64, 1355–1366. [Google Scholar] [CrossRef]
  42. Knowlton, K.; Rotkin-Ellman, M.; King, G.; Margolis, H.G.; Smith, D.; Solomon, G.; Trent, R.; English, P. The 2006 California heat wave: Impacts on hospitalizations and emergency department visits. Environ. Health Perspect. 2009, 117, 61–67. [Google Scholar] [CrossRef] [PubMed]
  43. Naughton, M.P.; Henderson, A.; Mirabelli, M.C.; Kaiser, R.; Wilhelm, J.L.; Kieszak, S.M.; Rubin, C.H.; McGeehin, M.A. Heat-related mortality during a 1999 heat wave in Chicago. Am. J. Prev. Med. 2002, 22, 221–227. [Google Scholar] [CrossRef]
  44. O’Neill, M.S.; Zanobetti, A.; Schwartz, J. Modifiers of the temperature and mortality association in seven US cities. Am. J. Epidemiol. 2003, 157, 1074–1082. [Google Scholar] [CrossRef]
  45. Klinenberg, E. Review of heat wave: Social autopsy of disaster in Chicago. N. Engl. J. Med. 2003, 348, 666–667. [Google Scholar] [CrossRef]
  46. Mitchell, B.C.; Chakraborty, J. Landscapes of thermal inequity: Disproportionate exposure to urban heat in the three largest US cities. Environ. Res. Lett. 2015, 10, 115005. [Google Scholar] [CrossRef]
  47. Voelkel, J.; Hellman, D.; Sakuma, R.; Shandas, V. Assessing vulnerability to urban heat: A study of disproportionate heat exposure and access to refuge by socio-demographic status in Portland, Oregon. Int. J. Environ. Res. Public Health 2018, 15, 640. [Google Scholar] [CrossRef] [PubMed]
  48. Lapola, D.M.; Braga, D.R.; Di Giulio, G.M.; Torres, R.R.; Vasconcellos, M.P. Heat stress vulnerability and risk at the (super) local scale in six Brazilian capitals. Clim. Chang. 2019, 154, 477–492. [Google Scholar] [CrossRef]
  49. Hu, K.; Yang, X.; Zhong, J.; Fei, F.; Qi, J. Spatially explicit mapping of heat health risk utilizing environmental and socioeconomic data. Environ. Sci. Technol. 2017, 51, 1498–1507. [Google Scholar] [CrossRef]
  50. Rao, P.; Gupta, K.; Roy, A.; Balan, R. Spatio-temporal analysis of land surface temperature for identification of heat wave risk and vulnerability hotspots in Indo-Gangetic Plains of India. Theor. Appl. Climatol. 2021, 146, 567–582. [Google Scholar] [CrossRef]
  51. Wang, Q.; Zhang, Y.; Ban, J.; Zhu, H.; Xu, H.; Li, T. The relationship between population heat vulnerability and urbanization levels: A county-level modeling study across China. Environ. Int. 2021, 156, 106742. [Google Scholar] [CrossRef]
  52. Conlon, K.C.; Mallen, E.; Gronlund, C.J.; Berrocal, V.J.; Larsen, L.; O’neill, M.S. Mapping human vulnerability to extreme heat: A critical assessment of heat vulnerability indices created using principal components analysis. Environ. Health Perspect. 2020, 128, 097001. [Google Scholar] [CrossRef] [PubMed]
  53. Chen, B.; Xie, M.; Feng, Q.; Li, Z.; Chu, L.; Liu, Q. Heat risk of residents in different types of communities from urban heat-exposed areas. Sci. Total Environ. 2021, 768, 145052. [Google Scholar] [CrossRef] [PubMed]
  54. Wu, X.; Liu, Q.; Huang, C.; Li, H. Mapping Heat-Health Vulnerability Based on Remote Sensing: A Case Study in Karachi. Remote Sens. 2022, 14, 1590. [Google Scholar] [CrossRef]
  55. Ho, H.C.; Knudby, A.; Chi, G.; Aminipouri, M.; Lai, D.Y.-F. Spatiotemporal analysis of regional socio-economic vulnerability change associated with heat risks in Canada. Appl. Geogr. 2018, 95, 61–70. [Google Scholar] [CrossRef]
  56. Hammer, J.; Ruggieri, D.G.; Thomas, C.; Caum, J. Local extreme heat planning: An interactive tool to examine a heat vulnerability index for Philadelphia, Pennsylvania. J. Urban Health 2020, 97, 519–528. [Google Scholar] [CrossRef]
  57. Zhu, Q.; Liu, T.; Lin, H.; Xiao, J.; Luo, Y.; Zeng, W.; Zeng, S.; Wei, Y.; Chu, C.; Baum, S. The spatial distribution of health vulnerability to heat waves in Guangdong Province, China. Glob. Health Action 2014, 7, 25051. [Google Scholar] [CrossRef]
  58. Alonso, L.; Renard, F. A comparative study of the physiological and socio-economic vulnerabilities to heat waves of the population of the Metropolis of Lyon (France) in a climate change context. Int. J. Environ. Res. Public Health 2020, 17, 1004. [Google Scholar] [CrossRef]
  59. Macnee, R.G.; Tokai, A. Heat wave vulnerability and exposure mapping for Osaka City, Japan. Environ. Syst. Decis. 2016, 36, 368–376. [Google Scholar] [CrossRef]
  60. Christenson, M.; Geiger, S.D.; Phillips, J.; Anderson, B.; Losurdo, G.; Anderson, H.A. Heat vulnerability index mapping for Milwaukee and Wisconsin. J. Public Health Manag. Pract. 2017, 23, 396–403. [Google Scholar] [CrossRef]
  61. Kamal, N.I.A.; Ash’aari, Z.H.; Abdullah, A.M.; Kusin, F.M.; Mohamat Yusuff, F.; Sharaai, A.H.; Muharam, F.M.; Mohd Ariffin, N.A. Extreme heat vulnerability assessment in tropical region: A case study in Malaysia. Clim. Dev. 2021, 14, 472–486. [Google Scholar] [CrossRef]
  62. Kershaw, S.E.; Millward, A.A. A spatio-temporal index for heat vulnerability assessment. Environ. Monit. Assess. 2012, 184, 7329–7342. [Google Scholar] [CrossRef] [PubMed]
  63. Loughnan, M.E.; Tapper, N.J.; Phan, T.; McInnes, J.A. Can a spatial index of heat-related vulnerability predict emergency service demand in Australian capital cities? Int. J. Emerg. Serv. 2014, 3, 6–33. [Google Scholar] [CrossRef]
  64. Zemtsov, S.; Shartova, N.; Varentsov, M.; Konstantinov, P.; Kidyaeva, V.; Shchur, A.; Timonin, S.; Grischchenko, M. Intraurban social risk and mortality patterns during extreme heat events: A case study of Moscow, 2010–2017. Health Place 2020, 66, 102429. [Google Scholar] [CrossRef]
  65. Chuang, W.-C.; Gober, P. Predicting hospitalization for heat-related illness at the census-tract level: Accuracy of a generic heat vulnerability index in Phoenix, Arizona (USA). Environ. Health Perspect. 2015, 123, 606–612. [Google Scholar] [CrossRef] [PubMed]
  66. Prudent, N.; Houghton, A.; Luber, G. Assessing climate change and health vulnerability at the local level: Travis County, Texas. Disasters 2016, 40, 740–752. [Google Scholar] [CrossRef] [PubMed]
  67. Weber, S.; Sadoff, N.; Zell, E.; de Sherbinin, A. Policy-relevant indicators for mapping the vulnerability of urban populations to extreme heat events: A case study of Philadelphia. Appl. Geogr. 2015, 63, 231–243. [Google Scholar] [CrossRef]
  68. Zhang, W.; Zheng, C.; Chen, F. Mapping heat-related health risks of elderly citizens in mountainous area: A case study of Chongqing, China. Sci. Total Environ. 2019, 663, 852–866. [Google Scholar] [CrossRef]
  69. Ferreira, F.L.e.S.; Pereira, E.B.; Gonçalves, A.R.; Costa, R.S.; Bezerra, F.G.S. An explicitly spatial approach to identify heat vulnerable urban areas and landscape patterns. Urban Clim. 2021, 40, 101021. [Google Scholar] [CrossRef]
  70. Aminipouri, M.; Knudby, A.; Ho, H.C. Using multiple disparate data sources to map heat vulnerability: Vancouver case study. Can. Geogr. 2016, 60, 356–368. [Google Scholar] [CrossRef]
  71. Krstic, N.; Yuchi, W.; Ho, H.C.; Walker, B.B.; Knudby, A.J.; Henderson, S.B. The Heat Exposure Integrated Deprivation Index (HEIDI): A data-driven approach to quantifying neighborhood risk during extreme hot weather. Environ. Int. 2017, 109, 42–52. [Google Scholar] [CrossRef]
  72. Jacobs, C.; Singh, T.; Gorti, G.; Iftikhar, U.; Saeed, S.; Syed, A.; Abbas, F.; Ahmad, B.; Bhadwal, S.; Siderius, C. Patterns of outdoor exposure to heat in three South Asian cities. Sci. Total Environ. 2019, 674, 264–278. [Google Scholar] [CrossRef] [PubMed]
  73. Hess, J.J.; McDowell, J.Z.; Luber, G. Integrating climate change adaptation into public health practice: Using adaptive management to increase adaptive capacity and build resilience. Environ. Health Perspect. 2012, 120, 171–179. [Google Scholar] [CrossRef] [PubMed]
  74. Gascon, M.; Triguero-Mas, M.; Martínez, D.; Dadvand, P.; Rojas-Rueda, D.; Plasència, A.; Nieuwenhuijsen, M.J. Residential green spaces and mortality: A systematic review. Environ. Int. 2016, 86, 60–67. [Google Scholar] [CrossRef] [PubMed]
  75. Mushore, T.D.; Mutanga, O.; Odindi, J.; Dube, T. Determining extreme heat vulnerability of Harare Metropolitan City using multispectral Remote Sensing and socio-economic data. J. Spat. Sci. 2017, 63, 173–191. [Google Scholar] [CrossRef]
  76. Macintyre, H.; Heaviside, C.; Taylor, J.; Picetti, R.; Symonds, P.; Cai, X.-M.; Vardoulakis, S. Assessing urban population vulnerability and environmental risks across an urban area during heatwaves–Implications for health protection. Sci. Total Environ. 2018, 610, 678–690. [Google Scholar] [CrossRef]
  77. Hulley, G.; Shivers, S.; Wetherley, E.; Cudd, R. New ECOSTRESS and MODIS land surface temperature data reveal fine-scale heat vulnerability in cities: A case study for Los Angeles County, California. Remote Sens. 2019, 11, 2136. [Google Scholar] [CrossRef]
  78. Song, J.; Huang, B.; Kim, J.S.; Wen, J.; Li, R. Fine-scale mapping of an evidence-based heat health risk index for high-density cities: Hong Kong as a case study. Sci. Total Environ. 2020, 718, 137226. [Google Scholar] [CrossRef]
  79. Loughnan, M.; Nicholls, N.; Tapper, N.J. Mapping heat health risks in urban areas. Int. J. Popul. Res. 2012, 2012, 518687. [Google Scholar] [CrossRef]
  80. Cai, Z.; Tang, Y.; Chen, K.; Han, G. Assessing the heat vulnerability of different local climate zones in the old areas of a Chinese megacity. Sustainability 2019, 11, 2032. [Google Scholar] [CrossRef]
  81. Paranunzio, R.; Dwyer, E.; Fitton, J.M.; Alexander, P.J.; O’Dwyer, B. Assessing current and future heat risk in Dublin city, Ireland. Urban Clim. 2021, 40, 100983. [Google Scholar] [CrossRef]
  82. Dong, J.; Peng, J.; He, X.; Corcoran, J.; Qiu, S.; Wang, X. Heatwave-induced human health risk assessment in megacities based on heat stress-social vulnerability-human exposure framework. Landsc. Urban Plan. 2020, 203, 103907. [Google Scholar] [CrossRef]
  83. The Intergovernmental Panel on Climate Change (IPCC). Climate Change 2007: Impacts, Adaptation and Vulnerability; IPCC: Geneva, Switzerland, 2001. [Google Scholar]
  84. Crichton, D. The Risk Triangle. In Natural Disaster Management; Ingleton, J., Ed.; Tudor Rose: London, UK, 1999; pp. 102–103. [Google Scholar]
  85. Rinner, C.; Patychuk, D.; Bassil, K.; Nasr, S.; Gower, S.; Campbell, M. The role of maps in neighborhood-level heat vulnerability assessment for the city of Toronto. Cartogr. Geogr. Inf. Sci. 2010, 37, 31–44. [Google Scholar] [CrossRef]
  86. Depietri, Y.; Welle, T.; Renaud, F.G. Social vulnerability assessment of the Cologne urban area (Germany) to heat waves: Links to ecosystem services. Int. J. Disaster Risk Reduct. 2013, 6, 98–117. [Google Scholar] [CrossRef]
  87. Wilson, B.; Chakraborty, A. Mapping vulnerability to extreme heat events: Lessons from metropolitan Chicago. J. Environ. Plan. Manag. 2019, 62, 1065–1088. [Google Scholar] [CrossRef]
  88. Buscail, C.; Upegui, E.; Viel, J.-F. Mapping heatwave health risk at the community level for public health action. Int. J. Health Geogr. 2012, 11, 38. [Google Scholar] [CrossRef]
  89. Dugord, P.-A.; Lauf, S.; Schuster, C.; Kleinschmit, B. Land use patterns, temperature distribution, and potential heat stress risk–the case study Berlin, Germany. Comput. Environ. Urban Syst. 2014, 48, 86–98. [Google Scholar] [CrossRef]
  90. Maragno, D.; Dalla Fontana, M.; Musco, F. Mapping heat stress vulnerability and risk assessment at the neighborhood scale to drive Urban adaptation planning. Sustainability 2020, 12, 1056. [Google Scholar] [CrossRef]
  91. Agathangelidis, I.; Cartalis, C.; Santamouris, M. Integrating urban form, function, and energy fluxes in a heat exposure indicator in view of intra-urban Heat Island assessment and climate change adaptation. Climate 2019, 7, 75. [Google Scholar] [CrossRef]
  92. Kazak, J.K. The use of a decision support system for sustainable urbanization and thermal comfort in adaptation to climate change actions—The case of the Wrocław larger urban zone (Poland). Sustainability 2018, 10, 1083. [Google Scholar] [CrossRef]
  93. Dizdaroglu, D.; Yigitcanlar, T.; Dawes, L. A micro-level indexing model for assessing urban ecosystem sustainability. Smart Sustain. Built Environ. 2012, 1, 291–315. [Google Scholar] [CrossRef] [Green Version]
  94. Liu, X.; Yue, W.; Yang, X.; Hu, K.; Zhang, W.; Huang, M. Mapping urban heat vulnerability of extreme heat in hangzhou via comparing two approaches. Complexity 2020, 2020, 9717658. [Google Scholar] [CrossRef]
  95. Azhar, G.; Saha, S.; Ganguly, P.; Mavalankar, D.; Madrigano, J. Heat wave vulnerability mapping for India. Int. J. Environ. Res. Public Health 2017, 14, 357. [Google Scholar] [CrossRef] [PubMed]
  96. Guo, X.; Huang, G.; Jia, P.; Wu, J. Estimating fine-scale heat vulnerability in Beijing through two approaches: Spatial patterns, similarities, and divergence. Remote Sens. 2019, 11, 2358. [Google Scholar] [CrossRef]
  97. Navarro-Estupiñan, J.; Robles-Morua, A.; Díaz-Caravantes, R.; Vivoni, E.R. Heat risk mapping through spatial analysis of remotely-sensed data and socioeconomic vulnerability in Hermosillo, México. Urban Clim. 2020, 31, 100576. [Google Scholar] [CrossRef]
  98. Oh, K.-Y.; Lee, M.-J.; Jeon, S.-W. Development of the Korean climate change vulnerability assessment tool (VESTAP)—Centered on health vulnerability to heat waves. Sustainability 2017, 9, 1103. [Google Scholar] [CrossRef]
  99. Verdonck, M.-L.; Demuzere, M.; Hooyberghs, H.; Beck, C.; Cyrys, J.; Schneider, A.; Dewulf, R.; Van Coillie, F. The potential of local climate zones maps as a heat stress assessment tool, supported by simulated air temperature data. Landsc. Urban Plan. 2018, 178, 183–197. [Google Scholar] [CrossRef]
  100. Wolf, T.; McGregor, G. The development of a heat wave vulnerability index for London, United Kingdom. Weather. Clim. Extrem. 2013, 1, 59–68. [Google Scholar] [CrossRef]
  101. Kwon, Y.J.; Lee, D.K.; Kwon, Y.H. Is sensible heat flux useful for the assessment of thermal vulnerability in Seoul (Korea)? Int. J. Environ. Res. Public Health 2020, 17, 963. [Google Scholar] [CrossRef]
  102. Maier, G.; Grundstein, A.; Jang, W.; Li, C.; Naeher, L.P.; Shepherd, M. Assessing the performance of a vulnerability index during oppressive heat across Georgia, United States. Weather Clim. Soc. 2014, 6, 253–263. [Google Scholar] [CrossRef]
  103. Kim, D.-W.; Deo, R.C.; Lee, J.-S.; Yeom, J.-M. Mapping heatwave vulnerability in Korea. Nat. Hazards 2017, 89, 35–55. [Google Scholar] [CrossRef]
  104. Johnson, D.P.; Stanforth, A.; Lulla, V.; Luber, G. Developing an applied extreme heat vulnerability index utilizing socioeconomic and environmental data. Appl. Geogr. 2012, 35, 23–31. [Google Scholar] [CrossRef]
  105. Mallen, E.; Stone, B.; Lanza, K. A methodological assessment of extreme heat mortality modeling and heat vulnerability mapping in Dallas, Texas. Urban Clim. 2019, 30, 100528. [Google Scholar] [CrossRef]
  106. Reid, C.E.; Mann, J.K.; Alfasso, R.; English, P.B.; King, G.C.; Lincoln, R.A.; Margolis, H.G.; Rubado, D.J.; Sabato, J.E.; West, N.L. Evaluation of a heat vulnerability index on abnormally hot days: An environmental public health tracking study. Environ. Health Perspect. 2012, 120, 715–720. [Google Scholar] [CrossRef] [PubMed]
  107. Wolf, T.; McGregor, G.; Analitis, A. Performance assessment of a heat wave vulnerability index for greater London, United Kingdom. Weather Clim. Soc. 2014, 6, 32–46. [Google Scholar] [CrossRef]
  108. Nayak, S.G.; Shrestha, S.; Kinney, P.; Ross, Z.; Sheridan, S.; Pantea, C.; Hsu, W.; Muscatiello, N.; Hwang, S.-A. Development of a heat vulnerability index for New York State. Public Health 2018, 161, 127–137. [Google Scholar] [CrossRef]
  109. Jänicke, B.; Holtmann, A.; Kim, K.R.; Kang, M.; Fehrenbach, U.; Scherer, D. Quantification and evaluation of intra-urban heat-stress variability in Seoul, Korea. Int. J. Biometeorol. 2019, 63, 1–12. [Google Scholar] [CrossRef]
  110. Karanja, J.; Kiage, L. Perspectives on spatial representation of urban heat vulnerability. Sci. Total Environ. 2021, 774, 145634. [Google Scholar] [CrossRef]
  111. Yin, Y.; Grundstein, A.; Mishra, D.R.; Ramaswamy, L.; Tonekaboni, N.H.; Dowd, J. DTEx: A dynamic urban thermal exposure index based on human mobility patterns. Environ. Int. 2021, 155, 106573. [Google Scholar] [CrossRef]
  112. Cutter, S.L.; Boruff, B.J.; Shirley, W.L. Social Vulnerability to Environmental Hazards. Soc. Sci. 2003, 84, 242–261. [Google Scholar] [CrossRef]
  113. Ho, H.C.; Knudby, A.; Huang, W. A spatial framework to map heat health risks at multiple scales. Int. J. Environ. Res. Public Health 2015, 12, 16110–16123. [Google Scholar] [CrossRef] [Green Version]
  114. Green, H.; Bailey, J.; Schwarz, L.; Vanos, J.; Ebi, K.; Benmarhnia, T. Impact of heat on mortality and morbidity in low and middle income countries: A review of the epidemiological evidence and considerations for future research. Environ. Res. 2019, 171, 80–91. [Google Scholar] [CrossRef] [PubMed]
  115. Zafeiratou, S.; Samoli, E.; Dimakopoulou, K.; Rodopoulou, S.; Analitis, A.; Gasparrini, A.; Stafoggia, M.; De’Donato, F.; Rao, S.; Monteiro, A. A systematic review on the association between total and cardiopulmonary mortality/morbidity or cardiovascular risk factors with long-term exposure to increased or decreased ambient temperature. Sci. Total Environ. 2021, 772, 145383. [Google Scholar] [CrossRef] [PubMed]
  116. Sun, S.; Cao, W.; Mason, T.G.; Ran, J.; Qiu, H.; Li, J.; Yang, Y.; Lin, H.; Tian, L. Increased susceptibility to heat for respiratory hospitalizations in Hong Kong. Sci. Total Environ. 2019, 666, 197–204. [Google Scholar] [CrossRef]
  117. Chen, N.-T.; Lin, P.-H.; Guo, Y.-L.L. Long-term exposure to high temperature associated with the incidence of major depressive disorder. Sci. Total Environ. 2019, 659, 1016–1020. [Google Scholar] [CrossRef] [PubMed]
  118. Yoo, E.-h.; Eum, Y.; Roberts, J.E.; Gao, Q.; Chen, K. Association between extreme temperatures and emergency room visits related to mental disorders: A multi-region time-series study in New York, USA. Sci. Total Environ. 2021, 792, 148246. [Google Scholar] [CrossRef] [PubMed]
  119. Ban, J.; Huang, L.; Chen, C.; Guo, Y.; He, M.Z.; Li, T. Integrating new indicators of predictors that shape the public’s perception of local extreme temperature in China. Sci. Total Environ. 2017, 579, 529–536. [Google Scholar] [CrossRef] [PubMed]
  120. Yang, J.; Yin, P.; Sun, J.; Wang, B.; Zhou, M.; Li, M.; Tong, S.; Meng, B.; Guo, Y.; Liu, Q. Heatwave and mortality in 31 major Chinese cities: Definition, vulnerability and implications. Sci. Total Environ. 2019, 649, 695–702. [Google Scholar] [CrossRef]
  121. Liu, Y.S.; Yigitcanlar, T.; Guaralda, M.; Degirmenci, K.; Liu, A.; Kane, M. Leveraging the opportunities of wind for cities through urban planning and design: A PRISMA review. Sustainability 2022, 14, 11665. [Google Scholar] [CrossRef]
  122. Vaeztavakoli, A.; Lak, A.; Yigitcanlar, T. Blue and green spaces as therapeutic landscapes: Health effects of urban water canal areas of Isfahan. Sustainability 2018, 10, 4010. [Google Scholar] [CrossRef]
  123. Teimouri, R.; Yigitcanlar, T. An approach towards effective ecological planning: Quantitative analysis of urban green space characteristics. Glob. J. Environ. Sci. Manag. 2018, 4, 195–206. [Google Scholar]
  124. Dizdaroglu, D.; Yigitcanlar, T. Integrating urban ecosystem sustainability assessment into policy-making: Insights from the Gold Coast City. J. Environ. Plan. Manag. 2016, 59, 1982–2006. [Google Scholar] [CrossRef] [Green Version]
  125. Perveen, S.; Kamruzzaman, M.; Yigitcanlar, T. Developing policy scenarios for sustainable urban growth management: A Delphi approach. Sustainability 2017, 9, 1787. [Google Scholar] [CrossRef]
  126. Dongo, K.; Kablan, A.K.M.; Kouamé, F.K. Mapping urban residents’ vulnerability to heat in Abidjan, Côte d’Ivoire. Clim. Dev. 2018, 10, 600–613. [Google Scholar] [CrossRef]
  127. Dong, W.; Liu, Z.; Zhang, L.; Tang, Q.; Liao, H.; Li, X.E. Assessing heat health risk for sustainability in Beijing’s urban heat island. Sustainability 2014, 6, 7334–7357. [Google Scholar] [CrossRef]
  128. Harlan, S.L.; Declet-Barreto, J.H.; Stefanov, W.L.; Petitti, D.B. Neighborhood effects on heat deaths: Social and environmental predictors of vulnerability in Maricopa County, Arizona. Environ. Health Perspect. 2013, 121, 197–204. [Google Scholar] [CrossRef] [Green Version]
Figure 1. Literature selection procedure.
Energies 15 06998 g001
Figure 2. Publication distribution by year.
Energies 15 06998 g002
Figure 3. Publication distribution by research region.
Energies 15 06998 g003
Figure 4. Publication distribution by climate classification. Note: “Af: Equatorial rainforest, fully humid; Am: Equatorial monsoon; Aw: Equatorial savannah with dry winter; BSh: Hot Steppe climate; BWh: Hot Desert climate; BWk: Cold Desert climate; Cfa: Warm temperate climate, fully humid, and hot summer; Cfb: Warm temperate climate, fully humid, and warm summer; Csa: Warm temperate climate with hot and dry summer; Csb: Warm temperate climate with warm and dry summer; Csc: Warm temperate climate with cool and dry summer and cold winter; Cwa: Warm temperate climate with dry winter and hot summer; Cwb: Warm temperate climate with dry winter and warm summer; Dfa: Snow climate, fully humid, and hot summer; Dfb: Snow climate, fully humid, and warm summer; Dfc: Snow climate, fully humid, cool summer and cold winter; Dsb: Snow climate with warm and dry summer; Dwa: Snow climate with dry winter and hot summer [36]”.
Energies 15 06998 g004
Table 1. Exclusion and inclusion criteria.
Primary Criteria Secondary Criteria
InclusionaryExclusionaryInclusionaryExclusionary
Academic journal articlesDuplicate recordsRelevant to urban heat vulnerability assessment methodsIrrelevant to urban heat vulnerability assessment methods
Peer-reviewedBooks and chaptersRelevant to research objectiveIrrelevant to research objective
Full-text available onlineIndustry reports
Published in EnglishGovernment reports
Table 2. Categorization criteria.
Categorization Criteria
Determine the literature associated with the research aim by the eye-balling technique
Identify the potential literature focusing on methods to assess urban heat vulnerability after full-text reading
Group the identified types, application areas and effectiveness with similarities into broad categories
Narrow down the primary categories and crosscheck their reliability against other published literature
Final review of the selected literature and update the shortlisted categories if necessary
Confirm and finalize the categories selected for the classification of literature
Group the literature selected for the review under the selected categories
Table 3. Common indicators and data sources.
CategoriesIndicatorsDescriptionsNumber of Articles
Demographic and socioeconomic characteristicsAge % of population over 65, below 5 or in a specific range 61
Economic status % of population with high/low incomes; local financial status56
Social isolation% of elderly population living alone or living in a group42
Education% of population with low education level39
Population density number of population/households per study unit32
Race% of population with a different skin color/race 29
Employment % of employed/unemployed or population with high-heat-risk occupations18
Housing condition % of population with/without house ownership or living in adverse housing environment18
Air conditioning% of household with/without air conditioning15
Language ability% of population who speak one or more languages11
Gender% of male/female population 9
Vehicle availability % of population/household with/without vehicles 7
Internet availability % of population with internet access 5
Household facilities% of household with home facilities, such as TV, fridge, washing machine, etc. 5
Heat duration frequency of being outdoors; Time spent outdoors4
Water/electricity supply% of household with/without drinking water/electricity 3
Composite indicatorsindicators built by age, economic status, education etc. such as Human Development Index and Human Settlement Index2
Health conditionsPersonal illness status % of population with pre-existing physical/mental illness22
Medical infrastructure Number of medical workers/facilities/institutions; distance to medical institutions18
Disability% of population with disability11
Natality and mortality % of births/deaths5
Healthcare services % of population with access to health care services5
Health insurance % of population with health insurance3
Environmental
factors (natural)
Land surface temperature Daytime/night-time land surface temperature 38
Vegetation cover%/area of vegetations23
Air temperature Daytime/night-time mean/maximum/minimum air temperature20
Humidity Daily humidity7
Heat eventsDays/frequency of heat events7
Thermal radiation and heat fluxMeasuring heat vulnerability by surveying thermal radiation and heat flux5
Air condition Air quality or days with high air quality4
Weather Weather conditions3
ElevationDigital elevation model2
Composite indicatorsIndicators built by temperature, humidity, wind etc. such as Heat Index, Humidex and Wet Bulb Globe Temperature1
Environmental
factors (built)
Accessibility to cooling spaceArea of or distance to green space/open space/water body/cooling facilities20
Land cover/use Area of developed urban land cover 19
Building information Building density/height/type14
Transportation convenience Accessibility to roads and public transportations6
Infrastructure Accessibility to public infrastructures/services, such as water network, sewage network, garbage service and energy service2
Urbanization Urbanization rate/level 2
Table 4. Modelling and weighting methods and outputs.
CategoriesMethods/OutputsDescriptionsNumber of Articles
Modelling methodsIndexing methodsHeat vulnerability indexes Indexes based on the population vulnerability framework consisting of exposure, sensitivity, and adaptive capacity19
Heat risk indexes Indexes based on the risk triangle framework consisting of hazard, exposure, and vulnerability15
Other heat-related indexesIndexes developed by heat-related indicators but not based on the two abovementioned frameworks, such as biophysical and social vulnerability indexes 29
GIS techniquesModels built by GIS techniques6
OthersStatistical methods, composite methods, and survey data analytics7
Weighting methodsEWEqual weighting methods37
PCAPrincipal component analysis27
AHPAnalytical hierarchical process5
OthersOther weighting methods, such as expert weighting methods, slope-weighted method, and factor-weighted method7
Model outputsHeat vulnerability mapsSpatial scalesCensus units26
Administrative areas25
Grid17
Postal areas6
Local climate zones3
Study periods1990s4
2000s32
2010s34
2020s3
Table 5. Validation indicators, methods, and study performance.
CategoriesParticularsDescriptionsNumber of Articles
Validation indicatorsMortalityAll-cause mortalityDeaths caused by all diseases except accidents8
Heat-related mortalityDeaths caused by heat-related diseases, e.g., respiratory, cardiovascular, and cerebrovascular diseases. 7
MorbidityHospital/Emergency department visits and admissions7
Accessibility to medical institutionsDistance to the nearest hospital and clinic1
Validation methodsRegression modelsLinear regressionsUnivariate or multivariate linear regression;11
Poisson regressionPoisson or adjusted Poisson regression5
othersMultinomial logistic regression model 1
Correlation coefficientsPearson/Spearman’s correlation coefficient3
spatial analysisComparison between spatial distributions of HVI and heat-related health outcomes 2
OthersCritical Success Index (CSI); Statistical significance test; Case-crossover and threshold-OR curve analyses; Root Mean Square Error 4
Study performanceSatisfactoryShowing non-significant correlations between heat vulnerability model outcomes and heat-related health outcomes, which indicated the models may not accurately reflect the levels and spatial distributions of heat vulnerability10
UnsatisfactoryShowing significant correlations between heat vulnerability model outcomes and heat-related health outcomes, which indicated the models could accurately reflect the levels and spatial distributions of heat vulnerability6
MixedVarying performances at different scales, in different spatial units, and based on different methodologies4
Publisher’s Note: MDPI stays neutral with regard to jurisdictional claims in published maps and institutional affiliations.

