Article

Smarter Together: Monitoring and Evaluation of Integrated Building Solutions for Low-Energy Districts of Lighthouse Cities Lyon, Munich, and Vienna

1
Energy Center, AIT Austrian Institute of Technology, Giefinggasse 6, 1210 Vienna, Austria
2
Research Unit of Building Physics, Institute of Material Technology, Building Physics, and Building Ecology, Faculty of Civil Engineering, TU Wien, 1040 Vienna, Austria
3
SPL Lyon Confluence, 73, rue Smith, 69002 Lyon, France
4
MGS Münchner Gesellschaft für Stadterneuerung, 81671 Munich, Germany
5
Urban Development, Department of Urban Planning, Blumenstraße 31, 80331 Munich, Germany
6
Municipal Department 25-Technical Urban Renewal, Maria-Restituta-Platz 1, 1200 Vienna, Austria
7
Photovoltaic Department, Hespul, 14 Place Jules Ferry, 69006 Lyon, France
8
Scop Enertech, 65, Les Balcons de l’Amourier, 26160 Pont-de-Barret, France
*
Author to whom correspondence should be addressed.
Energies 2022, 15(19), 6907; https://doi.org/10.3390/en15196907
Submission received: 31 July 2022 / Revised: 11 September 2022 / Accepted: 15 September 2022 / Published: 21 September 2022
(This article belongs to the Topic Smart Electric Energy in Buildings)

Abstract

:
The Smarter Together project implemented in the three lighthouse cities (LHCs) of Lyon, Munich, and Vienna a set of co-created and integrated smart solutions for a better life in urban districts. The implemented solutions have been monitored using a novel integrated monitoring methodology (IMM) following a co-creation process involving key stakeholders of the LHCs. With focus on holistic building refurbishment and the integration of onsite renewable energy supply (RES), the three LHCs refurbished around 117,497 m2 of floor area and constructed 12,446 m2 of new floor area. They implemented around 833 kWp of PV, 35 kW of solar thermal and 13,122 kW of geothermal heating systems. Altogether, the realized solutions for low-energy districts in the three LHCs will annually save around 4000 MWh/a, generate 1145 MWh/a of RES and reduce around 1496 tCO2/a of CO2 emissions, corresponding to specific values of 37.6 kWh/m2.a and 11.9 kg-CO2/m2.a for final energy saving and CO2 emission reductions, respectively. KPI-based monitoring and evaluation of the implemented solutions provides qualitative and quantitative insight, experience and lessons learned to optimize the process of implementation and deployment of integrated solutions for holistic building refurbishment, and thus contribute to advancing sustainable urban transformation at the district level for both LHCs and FCs.

Highlights

What are the main findings?
  • Realization of holistic building refurbishment towards low-energy districts within the lighthouse cities (LHCs) of Lyon, Munich and Vienna.
  • Application of a co-creation process involving key city stakeholders and supported by the P2P learning process of the LHCs.
  • Monitoring and evaluation of the implemented smart solutions using a novel integrated monitoring and evaluation methodology (IMM).
What is the implication of the main finding?
  • Refurbishment of around 117,497 m2 of floor area and adding of 12,446 m2 of newly constructed floor area as well as connecting 990 kW of onsite renewable energy supply (RES).
  • Saving around 4000 MWh/a, generating 1145 MWh/a of RES and reducing around 1496 tCO2/a of CO2 emission.

1. Introduction

The ongoing challenge of climate change (CC) requires the realization of comprehensive and targeted mitigation and adaptation measures in different areas and at different levels of our economy to enable the desired transformation towards a sustainable and low-carbon future. Energy systems—with their production and consumption sectors—are the biggest emitter, responsible for around 76% of global human-caused greenhouse gas emissions [1]. Therefore, these present the main challenge in tackling CC, and need to go through a long and deep transformation trajectory in the next three decades to hit the set GHG mitigation target. This transformation is being restrained and driven by concrete energy and climate targets at national, regional, and urban levels.
Within this context, urban energy systems dominate, as cities with their highly concentrated socio-economic activities—reflected in 55% of the world population and about 70% of most countries’ GDPs—are responsible for more than 65% of global energy consumption and about 70% of energy-related CO2 emissions [2,3,4]. This trend is expected to rise, with recent UN estimations predicting that the world population share of cities is projected to increase from 55% in 2022 to 68% by 2050 [5,6]. This underlines the crucial role of cities and urban areas in addressing energy and climate targets and achieving desired sustainable development.
On the other hand, the building sector plays a central role due to its high energy consumption and related environmental impacts. Recent evaluations show that the EU’s building sector is responsible for around 40% of final energy demand and for around 38% of GHG emissions due to the still dominant use of fossil fuels. Furthermore, building energy performance is strongly affected by CC [7], which increases the importance of integrated building retrofitting [8,9,10].
The dynamics involved in the development of urban areas are highly individual and depend on various factors such as location, landscape, and age. Local resources, demand patterns, surrounding infrastructure and possibilities for the change to building structures are unique for each city [11]. Nevertheless, urban regions are mostly faced with common challenges and constraints in terms of high population density and resource-intensive and complex lifestyles, which are the main obstacles for achieving sustainable urban development and coping with ever-increasing demands on several resources and commodities, including energy [12,13].
Considering that cities and urban systems are heavily dependent on resource import —including energy—as well as limited land within the urban realm, the conceived transformation to harness local renewables (e.g., solar) puts more pressure on urban land use, making the achievement of sustainable urban development more challenging. With the focus on urban energy systems, this calls for increased energy efficiency to reduce future energy demand and thus enable better resource management. On the other hand, cities and urban areas offer big opportunities to enhance overall system efficiency and resource use given the high density of consumption and production patterns and the fact that good existing synergies between them have not yet been exploited. Considering this potential and the challenges cities face to achieve their defined goals of climate neutrality by 2050, as set by many European cities, cities need to move from silos towards integrated approaches. This implies a shift from technologies to systems, from buildings to districts, and from looking at only single solutions—such as energy, mobility, and building—to integrated approaches that also enable the use of modern ICT possibilities. This shift will also help cities manage the complexity of ongoing urban transformation.
The desired changes to the design and implementation of integrated urban solutions require, above policies and governance, the inclusion of innovative concepts, technologies and system structures as well as a change in consumer behavior to cope with persistent challenges in an increasingly difficult demographic context.
The results of this transformation will provide smart solutions along the whole supply chain and across businesses, administrations, and civil society. Despite the challenges that cities are facing to manage low-carbon transition, the transformation also offers lucrative opportunities to foster new growth and create new jobs as a result of the innovations.
In an international comparison, European cities occupy a special position due to their long history, retainable cityscape and advanced expansion, with well-developed infrastructures and a high level of services. To realize their future leadership roles, many well-known European cities have formulated ambitious goals for long-term, inclusive, sustainable and smart cities, e.g., SCWFS of Vienna [13]. These include decarbonization strategies for climate neutrality with inclusive and sustainable energy and climate targets by 2050 that are among the greatest transformations these cities will have ever experienced, and which should be carried out over the next two to three decades [14].
For this purpose, cities prepare themselves to use numerous demonstration projects that test the feasibility of integrated smart solutions at building and district scales, and address possible challenges and opportunities for their replication and wider deployment. Great importance is being attached to a participatory process for citizen engagement and the involvement of cities’ key stakeholders. Over recent years, the concept of integrated smart-city solutions has been strongly supported by the H2020 R&I program on smart cities and communities that has enabled the demonstration of 48 demonstration projects in selected European cities, so-called lighthouse cities (LHCs) [15]. Following recent experience, the initiative has triggered very positive impacts on the ground that can be attributed to the fact that citywide initiatives are multiplying and showing quick and tangible effects in combating global warming. Today, 116 European cities benefit from EU grants to develop sustainable city solutions [16].
With a focus on holistic building refurbishment for low-energy districts—on which this work is focused—the applied solutions within the concept of LHCs mainly follow four smart solution categories covering energy-efficient building refurbishment, smart building management for building energy efficiency, and intelligent building control and end-user involvement, smart electric grids and smart thermal grids [17,18,19]. Within this scope, Smarter Together focused on developing a holistic approach for sustainable low-energy districts that combines the full refurbishment of existing blocks of buildings with different layouts and sizes, different types of ownership (public/private/joint ownership) —including building densification as appropriate—and the integration of the dicers RES portfolio. This approach has been similarly applied in other LHC projects such as GrowSmarter [20], Ruggedised [21] and ATELIER [22]. Within this scope and beyond the LHC projects, numerous other demonstration projects and case studies have been conducted addressing several key topics around integrated energy planning at city and district scales [23]. They aim to advance sustainable energy development as an essential contribution to planned sustainable urban transformation that relies on integrated sustainable and smart energy solutions, in particularly for buildings and mobility, as shown in the work of Doubleday et. al. [23], which highlights the importance of integrated distributed power systems at a district scale. Within the set ambition towards sustainable and low-carbon urban areas, new innovative energy systems at building and district scales have been introduced, such as zero and positive energy buildings [23] and the advanced concept of positive energy districts (PEDs) [24,25]. These concepts pursue advanced sustainable energy approaches with high energy-efficiency standards, high reliance on local RES, and increased digitalization to manage the employed demand-side management and the resulting flexibilization needs of the local energy system at building and district scales [26]. Other ambitious projects such as R2CITIES seek to demonstrate holistic strategies for designing, constructing and deploying large-scale district renovation projects to support the transformation towards nearly zero-energy cities [27]. The project demonstrates its concept of residential district retrofitting in three demonstration cities of different climate conditions and user habits, approaches such as Smarter Together and other LHC projects in terms of holistic building refurbishment, monitoring and evaluation, as well as energy data management and exploitation plans. R2CITIES shows a final energy saving in the demonstration districts of about 50% compared to the initial state and provide a useful set of lessons learned and best practices extracted from the demonstrated district solutions to support future project replication [28].
In this regard, the new and ambitious concept of PEDs has triggered additional momentum to drive a transformation towards carbon neutrality of urban areas. Using this concept, district demonstration sites—combining different building types and uses—strive to implement integrated and innovative solutions to achieve the highest level of energy efficiency, and best use of onsite and local renewable energy potential while ensuring flexible interaction with the surrounding energy systems. The result is a positive annual energy balance within the given district boundary [29]. Several new EU demo projects are working on demonstrating the realization of this concept, including POCITYF [30], MakingCity, +CityxChange and ATELIER [22].
The concept of lighthouse projects aims to support cities in Europe to achieve their transformations towards a sustainable and resilient future while ensuring efficient resource use and carbon neutrality. To this end, designated LHCs have already worked on formulating their future sustainable and smart development strategies with clearly specified targets supported by suitable road maps and action plans such as SECAP (e.g., some cities might focus on economic and governance, economic and environmental or economic and social aspects, depending on its defined development strategy) [31]. In a holistic view, all cities are pursuing nearly the same high-level goals of achieving inclusive sustainable development with different focus areas [32,33]. The realization of such action plans—on the way to the setting cities’ goals—is being tested by prudently defined lighthouse projects that comprise a set of integrated smart solutions (building, mobility, ICT, etc.) implemented in selected demonstration sites of the city. The feasibility of the implemented solutions is monitored via a set of KPIs that assess the impact of the solutions and provide a quantitative basis for future widescale replication. Furthermore, the resulting KPIs provide the basis for the monitoring and verification of related development targets defined in the official sustainable development strategies of LHCs as well as offer corrective actions for their future updates.
In this context, the H2020 Smarter Together project has been accomplished within the three LHCs of Lyon, Munich and Vienna, following a P2P learning process implemented at selected districts that operated as urban living labs. Over the period 2016–2021, Smarter Together has implemented five clusters of co-created, replicable, and integrated smart solutions for better life in urban districts (Figure 1). The demonstrated solutions followed a co-creation process that involved key stakeholders of the three LHCs and covered (1) holistic refurbishment for low-energy districts of public and private housing, (2) local renewable energies and district heating for low-energy districts, (3) e-mobility solutions for sustainable mobility, (4) smart data-management platforms and smart services for integrated infrastructures, and (5) living labs for citizen engagement and stakeholder involvement in the established co-creation process within the LHCs, as presented in [34,35]. Monitoring these solutions and evaluating their impacts provides qualitative and quantitative knowledge, experience and lessons learned to help optimize the process of the implementation and deployment of integrated smart solutions, thus contributing to advanced sustainable urban transformation at district scale for both LHCs and follower cities (FCs) [35,36,37,38].
The objective of this work is to present the implemented integrated building solutions for low-energy districts in the three lighthouse cities Lyon, Munich, and Vienna, showcasing the integrated monitoring and evaluation methodology applied to monitor them and assessing their resulting sustainable energy impacts in terms of KPIs that address energy-efficiency improvement, local renewable energy contribution, and the resulting CO2 emission reduction at the district scale.
Within this scope, Section 2 provides a short description of the demo sites of the three LHCs. Section 3 elaborates on the applied work methodology. Section 4 presents the realized low-energy district solutions and the established integrated monitoring and evaluation methodology for their monitoring and evaluation covering data-gathering and processing. Section 5 presents the results of the KPI-based impact assessment of the district solutions (covering energy saving, RES and CO2 emissions reduction). Section 6 discusses the key monitoring results and related recommendations and lessons learned for further replications. Section 7 elaborates on the next steps for follow-up projects in LHCs. Section 8 offers a conclusion, presenting the main findings of the project and its contribution in FCs and beyond to driving the planned transformation towards efficient and carbon-neutral cities.

2. The Demonstration Sites and the Holistic Refurbished Buildings of the Three LHCs

Following the EU approach in demonstrating the realization of integrated smart solutions within selected lighthouse cities (LHCs), the three LHCs of Smarter Together realized planned solutions in project-specific districts, so-called demonstration sites. Based on the monitoring and evaluation of the implemented solutions, follower cities (FCs) developed strategies to replicate the key findings from LHCs in their urban replication areas (Figure 2). The achieved holistic building refurbishment towards low-energy districts in the three LHCs included several measures covering thermal renovation of the building envelope, upgrading building services, electricity system upgrades, the implementation of onsite RES and storage facilities, upgrading of the heating systems, the addition of new attic flats, changing energy-related occupant behavior, etc. Table 1 summarizes the main measures regarding holistic building refurbishment at the demonstration sites of the three LHCs.

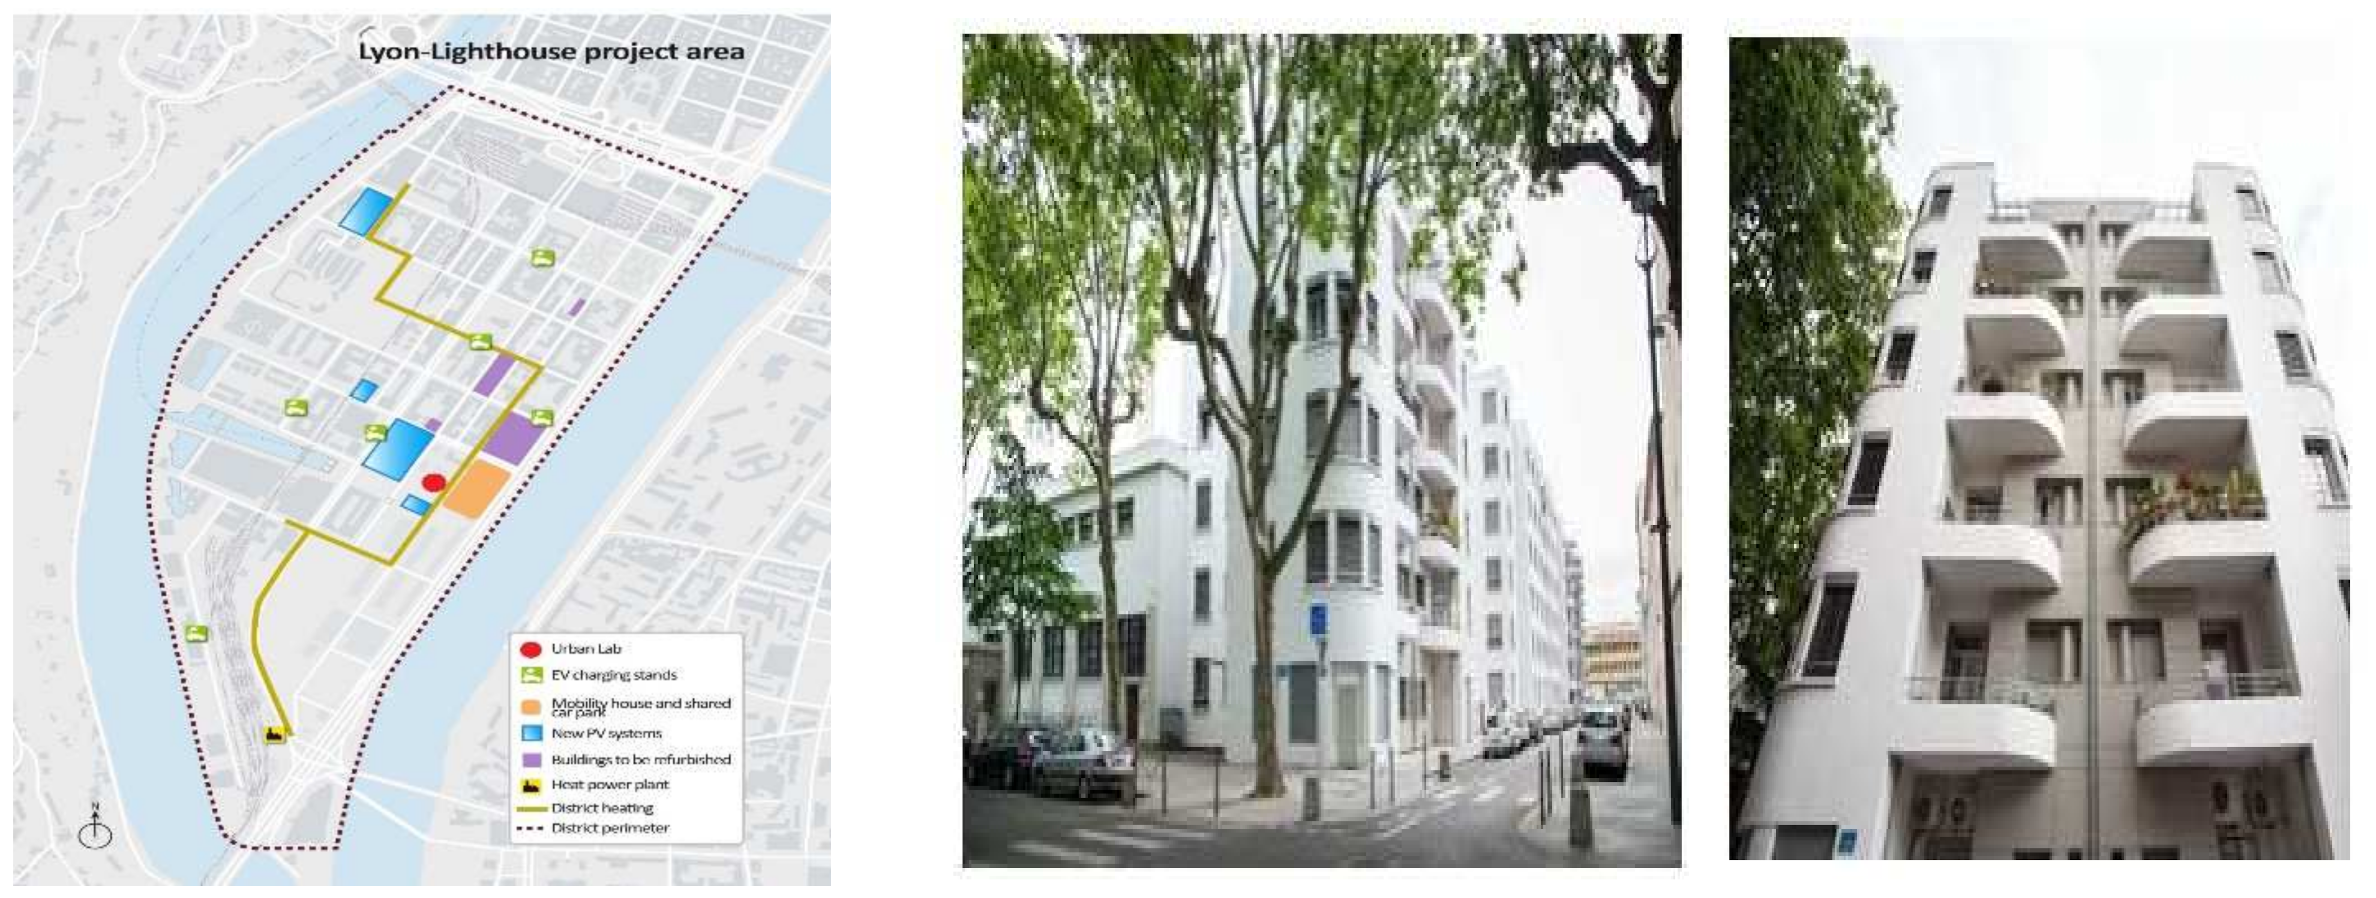
2.1. The Confluence District in Lyon

The considered integrated solutions of the LHC of Lyon have been implemented in the Confluence district located at the southern end of the city center of Lyon (Figure 3). The urban redevelopment project, Confluence Redevelopment, began in 2003 and is now one of the largest urban revitalizations in France. By the end of the 1990s, the Confluence district featured a mixture of working-class residential, industrial and commercial neighborhoods with a vast logistical platform dedicated to industrial and commercial activity. The urban redevelopment project is one of the largest in France and was started around 2000. It aimed to redevelop the Confluence and to enlarge the city center of Lyon with the creation of a durable and smart district. It consists of 150 ha land with 600,000 m2 of existing floor area and 1,000,000 m2 of new buildings. The project is also the first WWF (World Wildlife Fund)-approved urban area. Lyon has refurbished around 35,000 m2 of floor area distributed to nine buildings [34]. Several city stakeholders contributed to the realization of the integrated solutions of the Confluence low-energy district. They were led by SPL Lyon Confluence and encompassed Lyon Metropolis (GLY), HESPUL Association and Energtech.

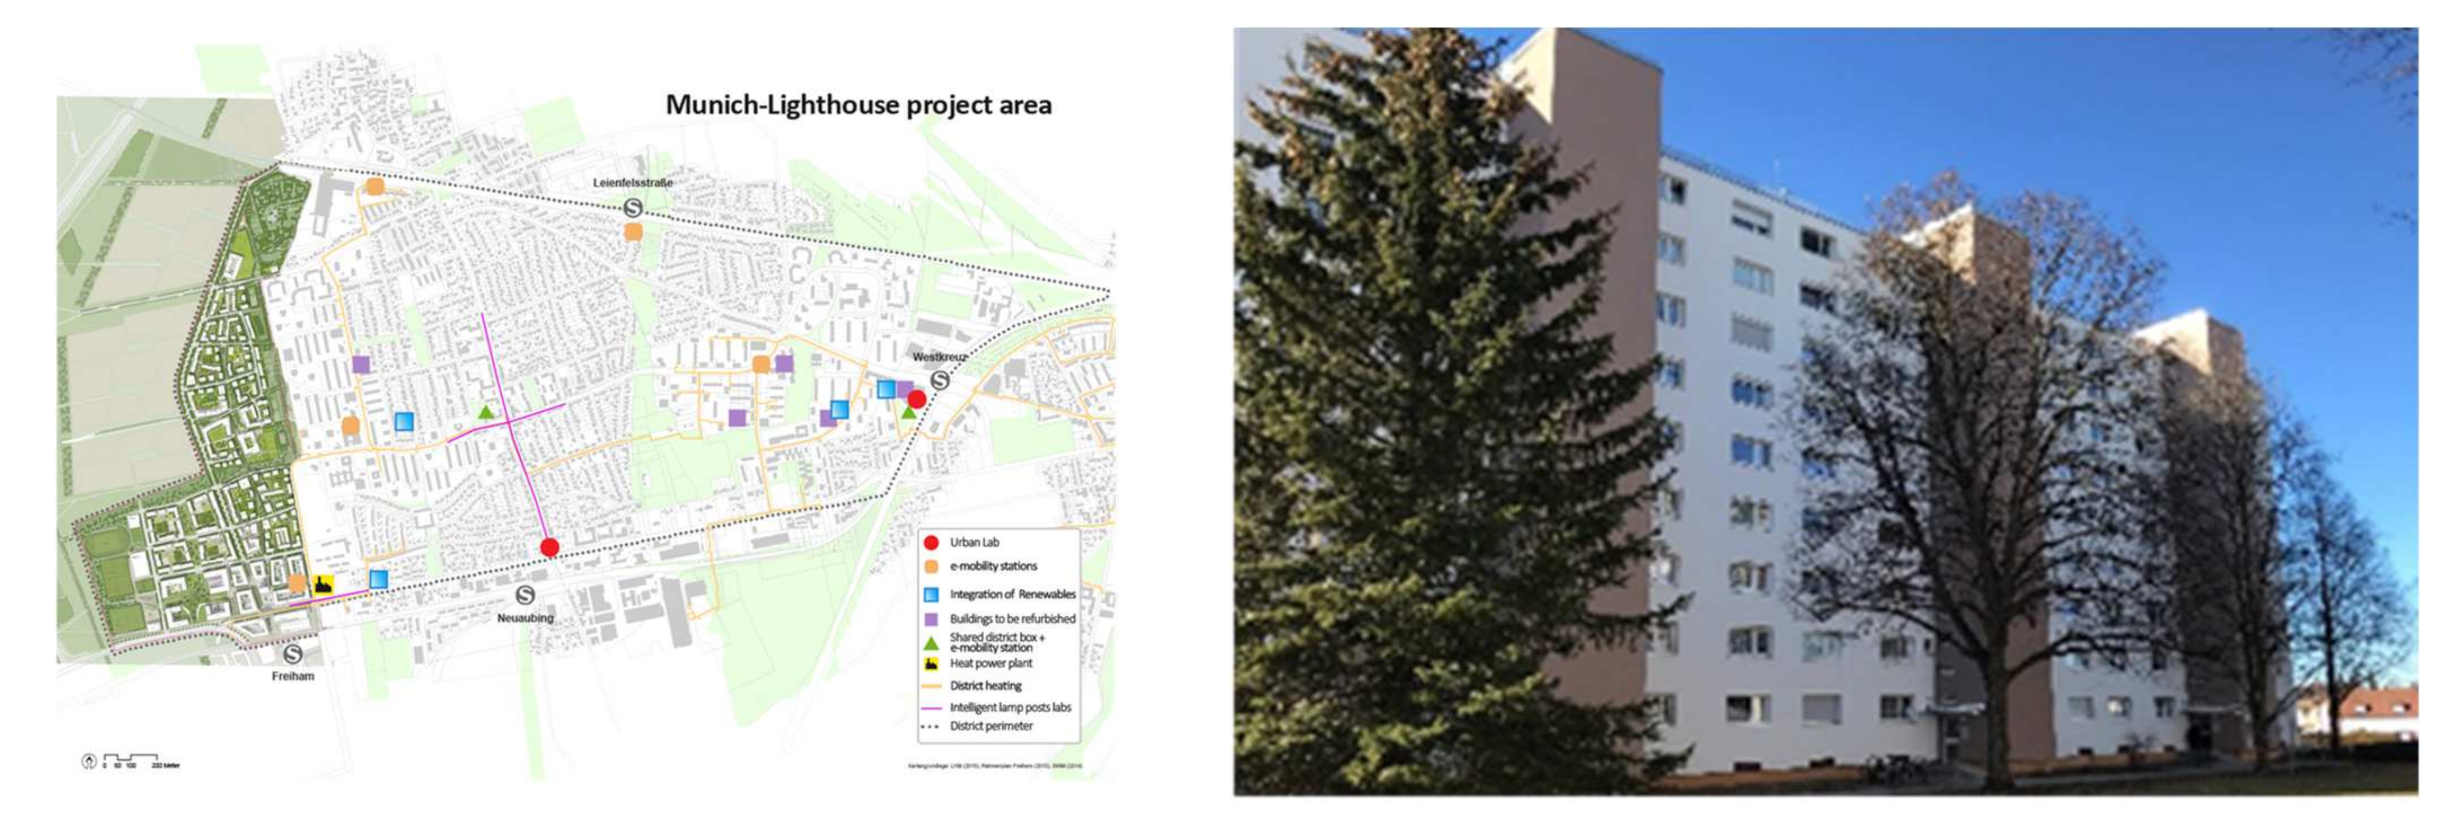
2.2. The Neuaubing–Westkreuz District in Munich

Neuaubing–Westkreuz is part of Munich’s largest and most sparsely populated district. It is home to over 23,000 residents from highly diverse socio-economic backgrounds (Figure 4). The district is dominated by buildings dating to the 1960s and 1970s. Many of the apartment blocks are in need of thorough modernization and retrofitting [39]. At the same time, Freiham, another test bed, is defined by a newly developed district comprising over 17,000 residential units and infrastructure for 28,000 inhabitants that is currently under construction [40,41]. Munich has refurbished around 13,283 m2 of floor area distributed around two building complexes of multi-Ownership residential Buildings (MOB) [38]. The solutions of the Munich demonstration sites of low-energy district Neuaubing–Westkreuz were realized following a joint effort by several city stakeholders covering the Munich municipality represented by the Department of Urban Planning and Building Regulation, Münchner Gesellschaft für Stadterneuerung (MGS), Stadtwerke München (SWM), the IT Department and Department of Public Construction.

2.3. The Simmering District in Vienna

The demonstration area of Simmering is in the 11th district, in the southwest of Vienna consisting of three smaller neighborhoods, namely Enkplatz, Geiselberg and Braunhuberviertel (Figure 5) [35]. Simmering is a working-class district with about 21,000 inhabitants of diverse cultural backgrounds. Vienna has refurbished around 69,145 m2 of floor area and constructed a new area of 12,446 m2 distributed to four residential building complexes and one public building. Residential buildings are two social housing blocks owned by the City of Vienna (Lorystraße 54–60 and Herbortgasse 43) and one cooperative (Hauffgasse 37–47) with a total floor area of 73,711.4 m2 (refurbished and new constructed attic flats) and 1300 inhabitants, in addition to a public secondary school at Enkplatz 4 with a refurbished and new constructed area of 7880 m2 [35]. Numerous key stakeholders contributed to the realization of the solutions of the low-energy district of Simmering covering several magistrates (MA) of Vienna city led by MA25 for urban renewal and supported by MA34, MA01, MA56 and MA18, the housing cooperative BWSG and Wiener Wohnen, and the energy utilities of Wien Energie, Wiener Netze and KELAG.
The three LHCs applied the concept of holistic and deep building refurbishment to achieve the set goal of low-energy districts covering:
  • Refurbishment of the building envelope covering façades, roofs, and windows.
  • Modernization of the energy and heating systems covering heating, warm-water supply, and lighting, as well as ventilation and elevators (for the case of Lorystr. in Vienna).
  • Installation of different kinds of renewable energy systems covering PV, solar thermal energy, and heat pumps as well as converting existing gas heating systems to district heating (partially in Lorystr.) or heat pumps (School in Vienna [35]).
Considering that the three LHCs show comparable levels of technical building refurbishment measures, and keeping in mind the P2P learning process applied during the implementation phase, the building refurbishment measures follow almost the same procedure as can be summarized below for the case of Hauffgasse in Vienna, which shows the largest renovated floor area of approx. 53,000 m2 with extensive renovation measures [35,37]:
  • Measures related to thermal refurbishment with heat insulation in the exterior walls, a ceiling of 20 cm rock wool, and new windows and doors (wood–aluminum, Uw = 1.00 (W/(m2 K)), g = 0.50).
  • Measures related to building retrofitting covering the loggias (floor, railing, heat insulation), installation of rolling shutters, replacement of electric facilities (main connections, breaker boxes, intercoms), lightning protection, fire protection measures, and heat insulation of heat pipes, as well as the installation of room thermostats and the refurbishment of elevators and staircases, underground parking and waste collection places. Moreover, additional measures were implemented to improve housing comfort, including the setting up of barrier-free entrances, moving bike parking from the basement to the ground floor, and the refurbishment of community facilities (gyms, meeting rooms and saunas).
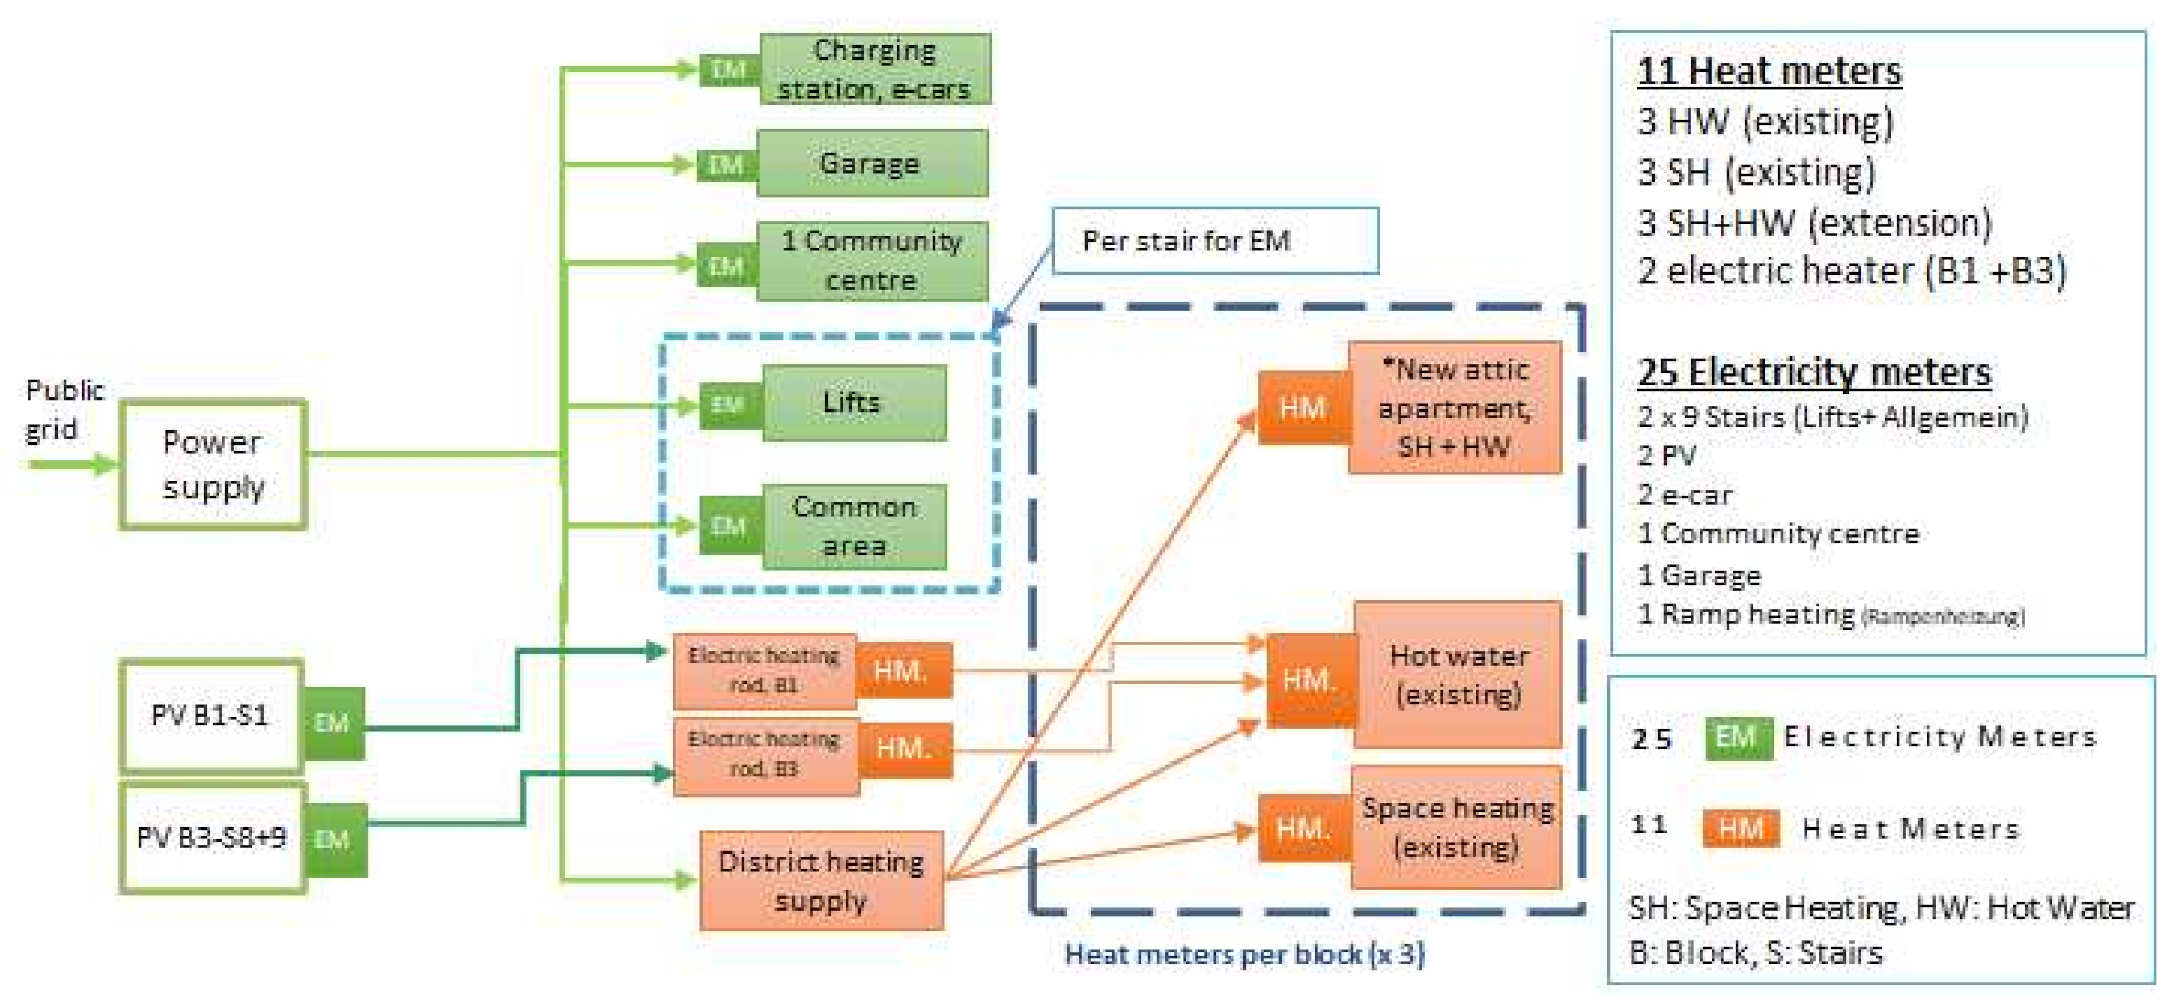
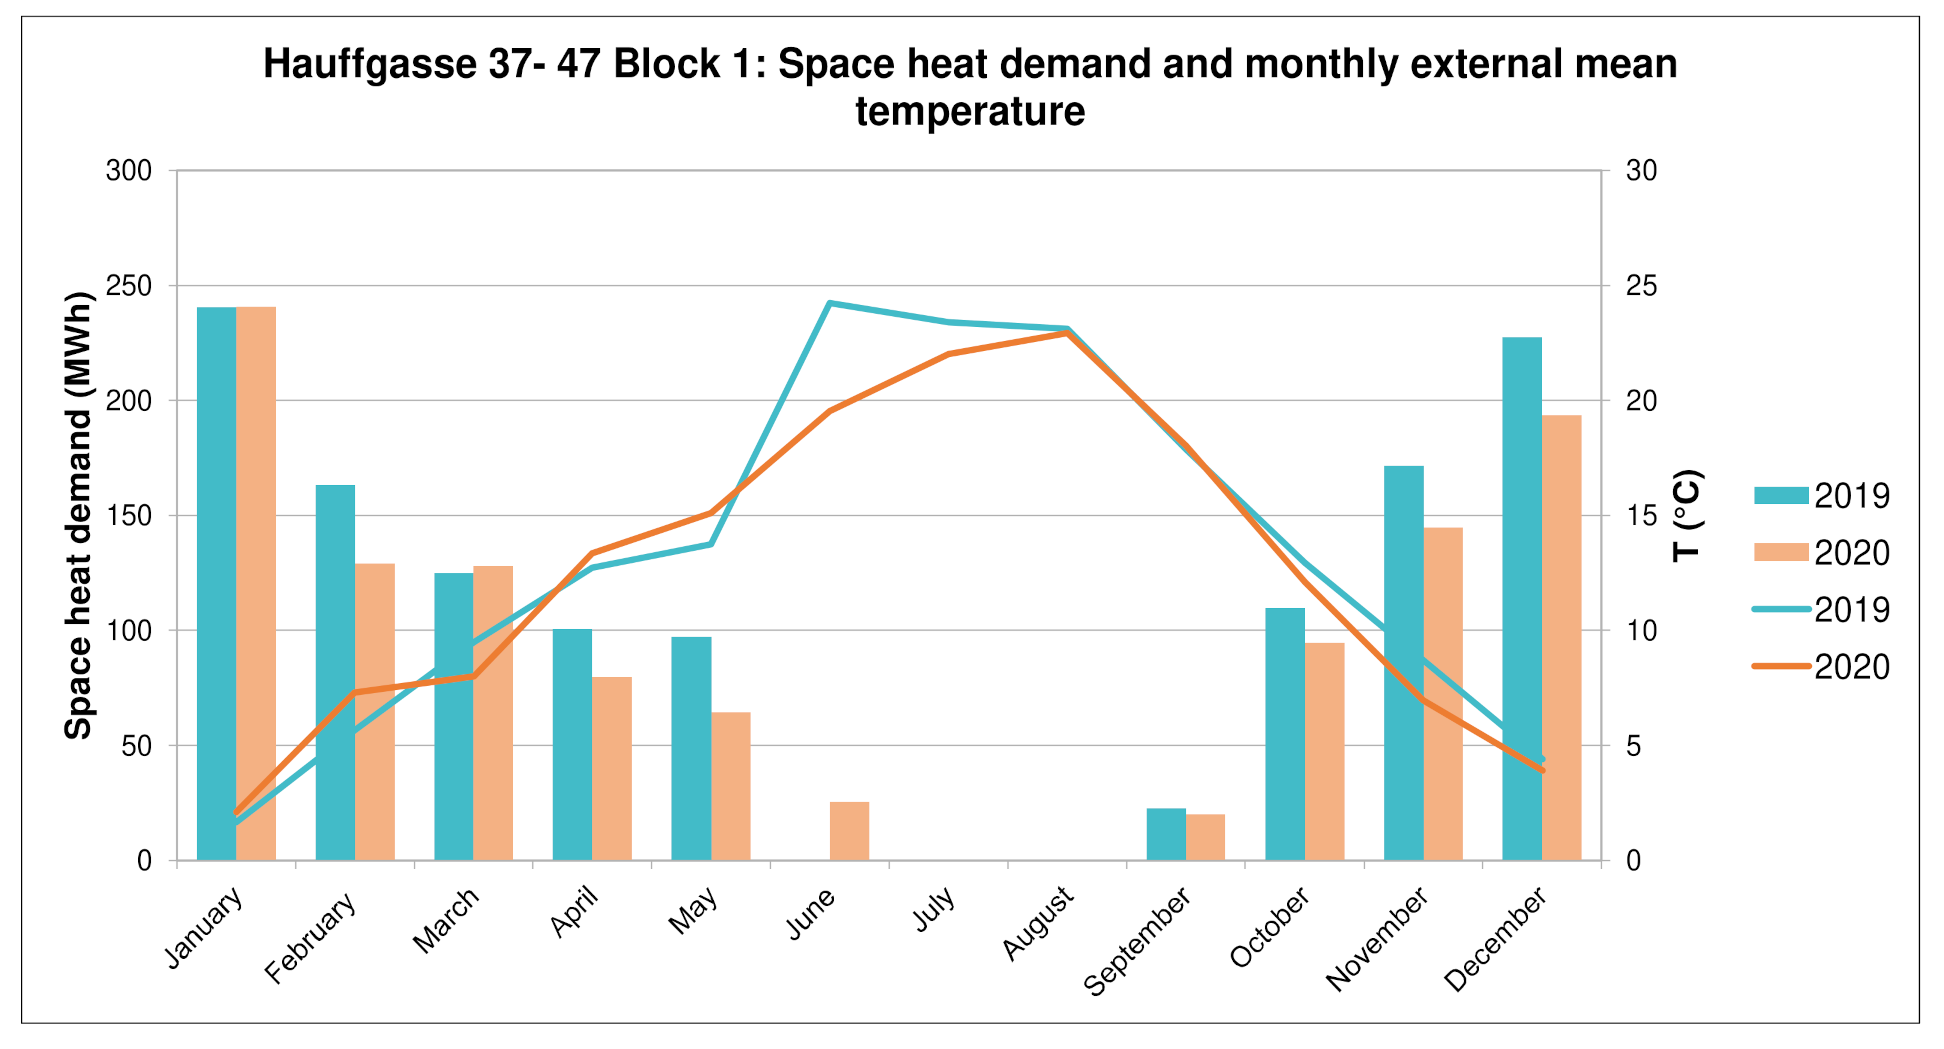
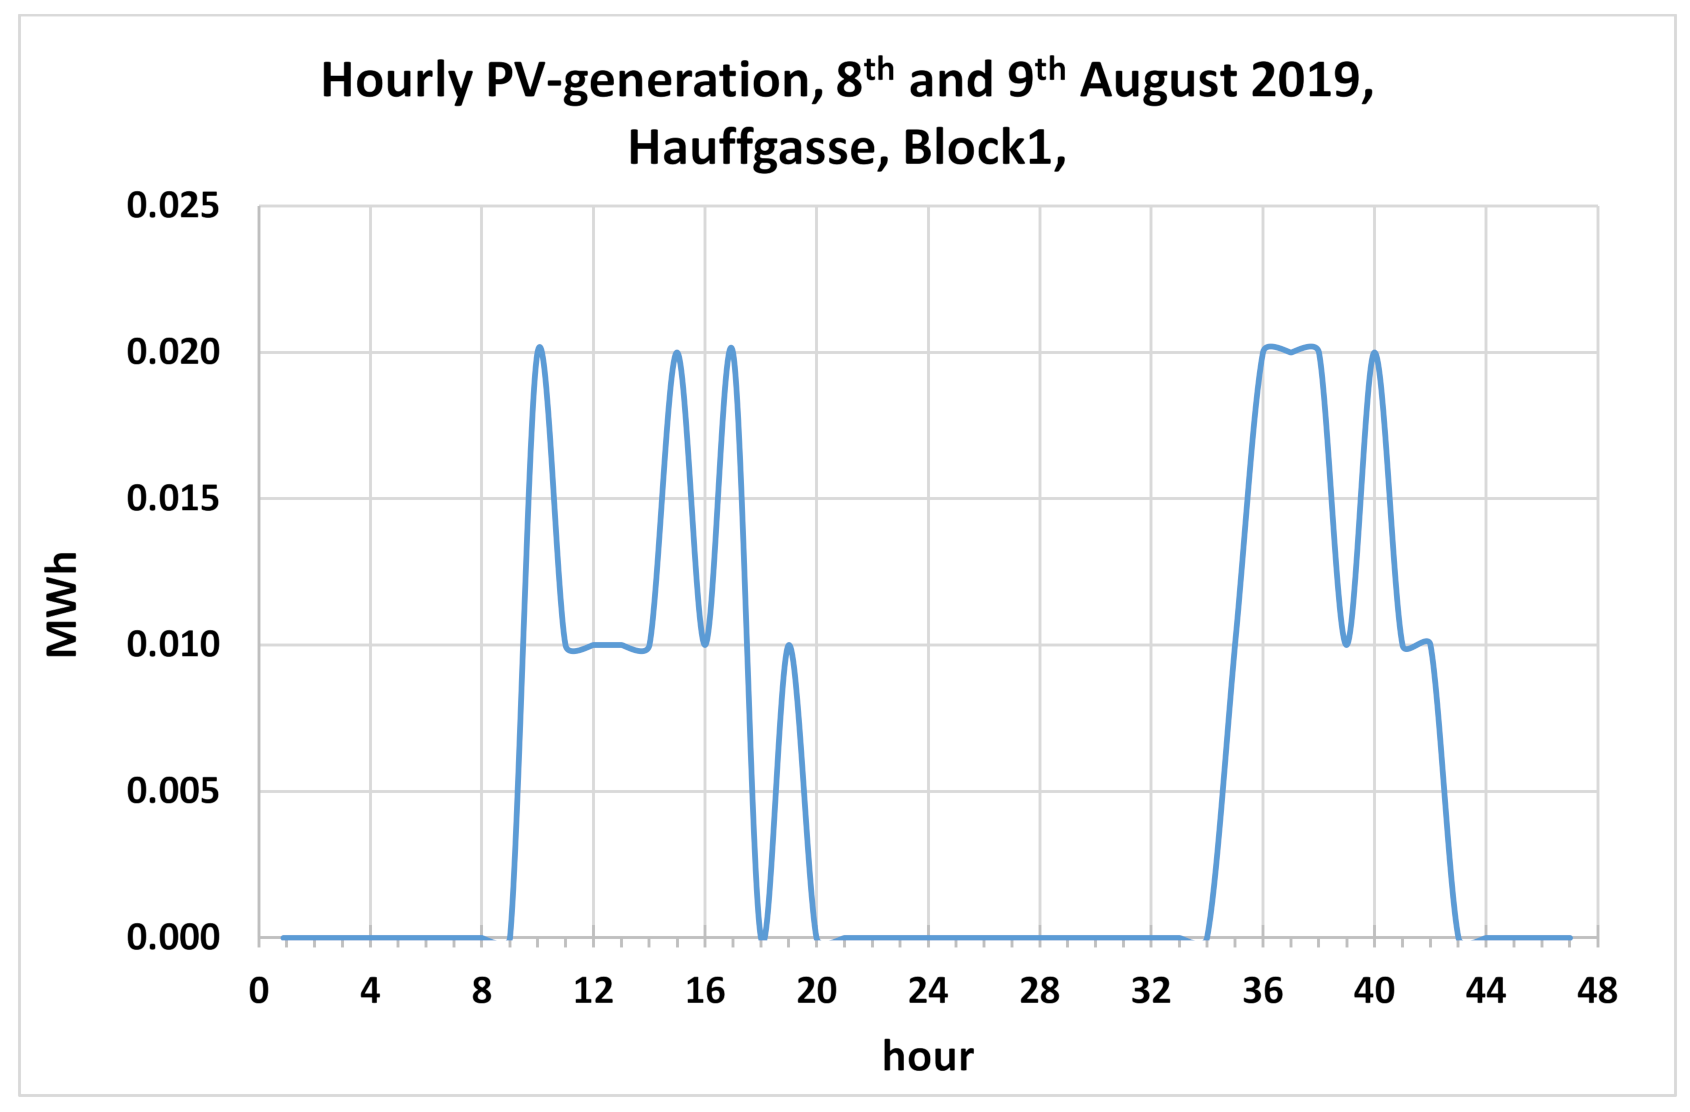
  • Modernization of the heating system and integration of renewable energy: this implied the renewal of existing district heating and warm-water stations to raise their efficiency. On the roof of Block 1 and Block 3, several PV panels of 69 kWp were installed in connection with solar-power–heat converters to sustain the warm-water station with separate electric boilers.
Following the established co-creation processes, the three LHCs demonstrated 25 integrated smart solutions for low-energy districts in the three LHCs distributed to eight holistic refurbishments and four renewable energy solutions in Lyon, two holistic refurbishments, three renewable energy solutions in Munich and four holistic refurbishments and four renewable energy solutions (PV, solar thermal, and geothermal heat pumps) in Vienna.
Around 117,500 m2 of existing buildings have been thermally refurbished and reconverted beside 12,450 m2 of new additional attic dwellings and the installation of 13,990 kW of RES capacities distributed to 833 kWp of PV, 35 kW of solar thermal, 13,122 kW of geothermal as well as 800 kW of battery storage capacity. Table 2 summarizes the technical specifications of the implemented solution.
According to the monitoring concept defined during the project proposal and further adapted during the implementation phase, the monitoring infrastructure and related measurement techniques have been setup in cooperation with key stakeholders (solutions owner, industry partner, executing companies, building service, ROs and city authorities). The implemented infrastructure has been tested, validated and monitored in operation to ensure appropriate functionality. This stage marked the successful accomplishment of the implementation phase, an indispensable requirement for a robust routine operation of the monitoring devices. Along with the monitoring process, numerous challenges of technical, structural, financial, and regulatory aspects had to be overcome before all monitoring channels were working with appropriate data quality. This implied both the setup of the monitoring infrastructure and data collection. The obstacle in establishing the monitoring infrastructure arose initially from a delay in the timely implementation of the solutions, e.g., a delay in finishing construction plans, obtaining building permits and construction work, the high cost of sensor assembly, and interconnection beyond the proposal cost estimation. However, the main challenges were of a technical nature, faced mainly during the initial phase of the monitoring process in terms of calibration and the validation of meters/sensor functionality, smooth data transfer to the data-management platforms, and the quality of gathered and stored data.
More detail about the implementation and functionality of the implemented solution can be found in the literature [34,35,36,37,38,42,43].

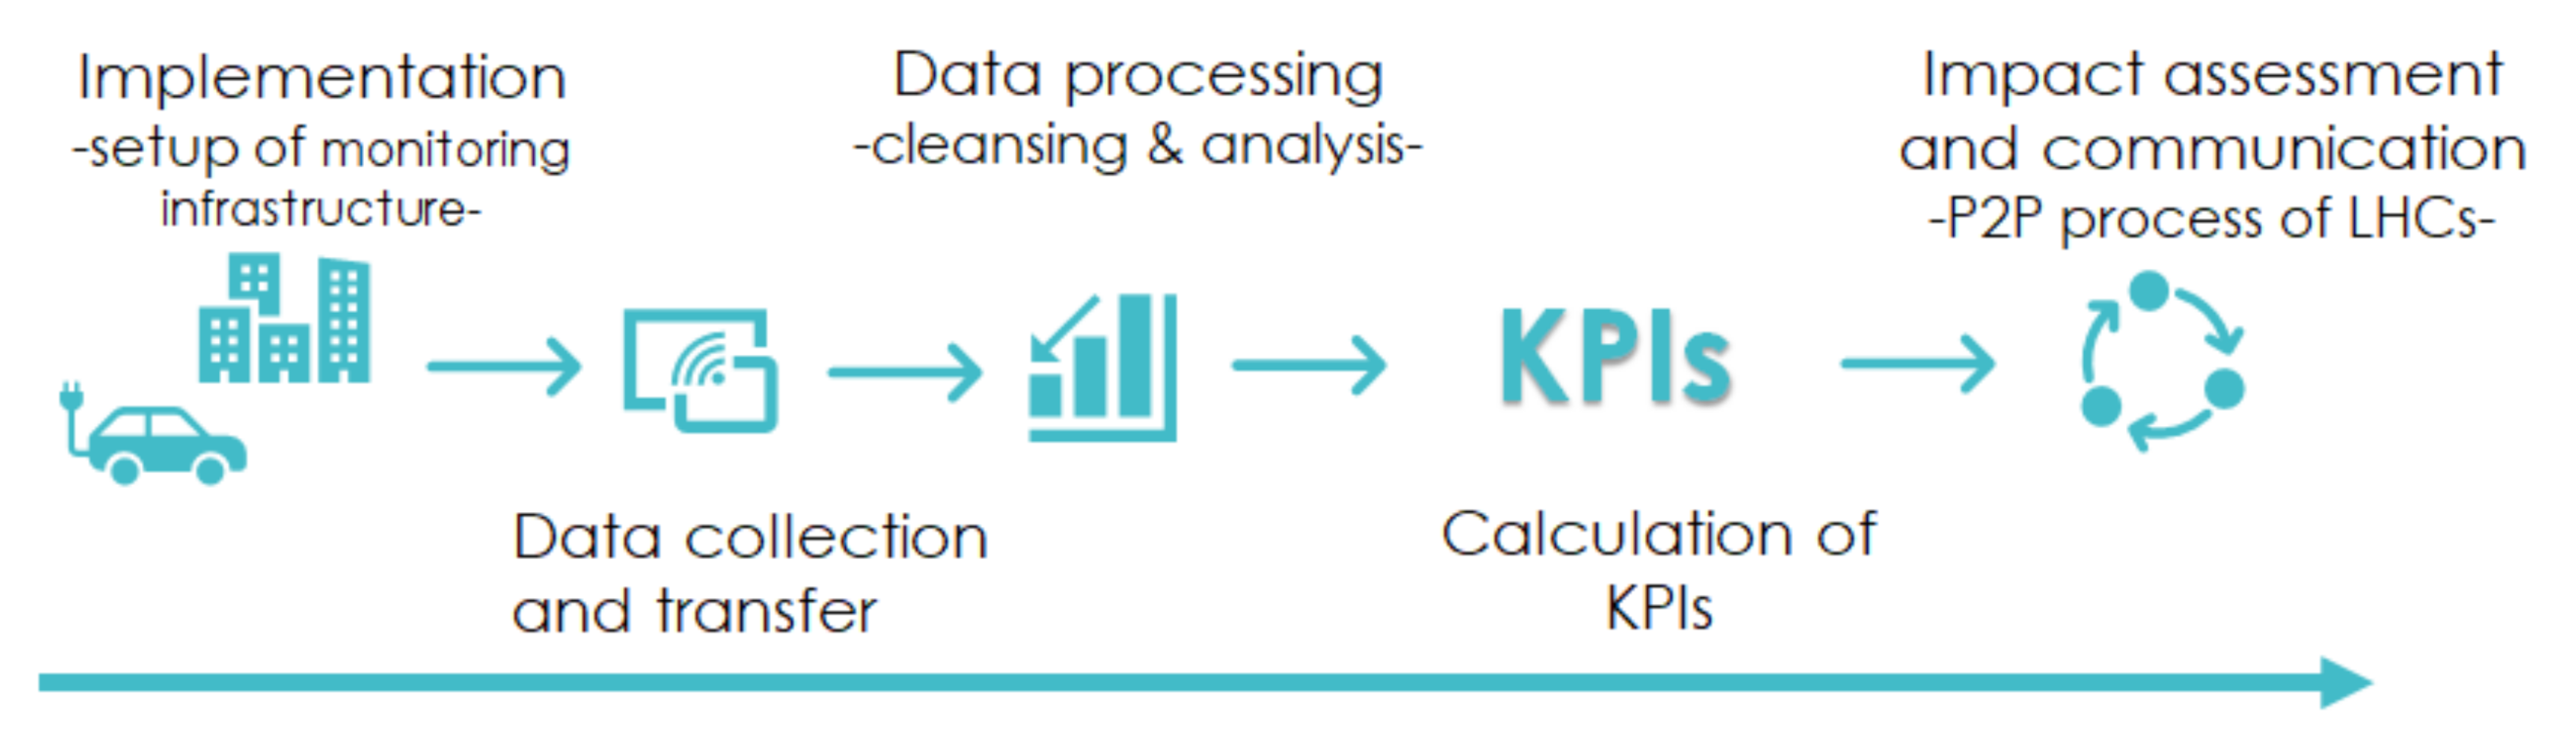
3. Methodological Approach

The project method relies upon the concept of lighthouse cities being applied and deployed by several EU projects that aim to support the process of the demonstration and replication of integrated smart energy solutions to support the EU mission to climate-neutral smart cities [44]. Within this mission-driven approach, suitable districts, the so-called “demonstration sites” within assigned lighthouse cities (LHCs), are selected to act as testbeds to demonstrate and monitor the functionality of key integrated smart solutions under real implementation conditions. The solutions are embedded within a broad range of domains related to smart, resilient and climate-neutral cities covering clean energy, building, ICT, mobility and associated regulatory frameworks and business models. The implementation of each LHC followed a co-creation process that involved key city stakeholders. The LHCs—usually 2 or 3 in each project—were carefully selected to represent diverse socio-economic, technical, and geographical conditions among EU countries. The LHCs apply a peer-to-peer (P2P) learning process, aiming to mutually learn from each other, exchange knowledge and experience, and share lessons and best practice gained from real implementation conditions at demonstration sites. All the activities during the applied participatory process of co-design, co-creation and co-learning are monitored and evaluated following an integrated KPI-based methodology that provides a valuable validated basis for further a rollout and scaling-up of the demonstrated solution within the LHCs. Another group of so-called follow cities (FCs)—there were three in Smarter Together—is engaged in learning from the role model of the LHCs and following them in replicating the already deployed solutions. With the advancement of the LHC monitoring process, the FCs prepare themselves for the replication phase supported by the generated KPIs and taking into consideration their city’s specific social, economic, regulatory and financial conditions. Thus, the KPI-based monitoring and evaluation process elaborated in this work is vital for the evaluation of the sustainable impact of the implemented district solutions while providing the basis for scaling up in the LHCs, and the subsequent replication in the FCs.
The presented scientific problem deals with the experimental assessment of the sustainable impact of the realized technical district solutions, with a focus on the improvement of energy saving and the increased contribution of renewable energy supply. The impact is evaluated based on the direct measurement of building heat demand before and after the intervention, external ambient temperature, and generated onsite renewable energy. As elaborated underneath, the setup of the large-scale experimental arrangement refers to the established integrated monitoring and evaluation methodology (IMM) covering three main steps:
  • Monitoring infrastructure: Building and calibrating the monitoring setup encompassing meters/sensors, data acquisition (M-Bus modules, signal converters, storage, etc.).
  • Data collection: gathering, cleansing and processing the measured data to calculate the annual heat demand before and after refurbishment (including climate adjustment) as well as renewable energy production.
  • Impact assessment: deriving a set of KPIs to calculate the achieved impact of the intervention in terms of energy saving by building-efficiency measures (technical measure of renovating the building envelope and heating system) and the implementation of local renewable energies and the resulting CO2 emission reduction of both measures. Table 3 lists the main KPIs applied to evaluate the impact of the monitored integrated building energy solutions for low-energy districts. KPIs associated with the impact of the deployed sustainable urban mobility are not part of this work and therefore not included.

4. Monitoring and Evaluation of the Implemented Solutions

Based on a P2P learning process among the three LHCs, Smarter Together has established an integrated monitoring and evaluation methodology (IMM) within a co-creation process encompassing cities’ key stakeholders [34,42]. The developed concept comprises the setup of monitoring infrastructure, the automated process of meters-based data collection, the transfer to and storage in the city’s data-management platform (DMP) [43], and the final step of data processing and KPI calculation.
Figure 6 presents the steps of the IMM applied in the 3 LHCs. Following the setup of the monitoring infrastructure, consisting of measurement meters/sensors (for heat, electricity, gas, etc.) and related logistics for data acquisition (M-Bus modules, signal converters, storage, and further transfer), the data are collected automatically or semi-automatically using local data logger. In the next step, the data are prepared for submission to responsible project partners for further processing, evaluation, and calculation of related KPIs. Each step of the monitoring process met the technical standards of validity, objectivity and reliability while ensuring a structured, verifiable, and replicable method of data collection, processing, and evaluation.
Figure 7 shows an exemplary monitoring setup, including meters and monitored solutions for the biggest building complex in Smarter Together (Hauffgasse, Vienna demonstration site). The monitoring meters cover space heating and hot water consumptions—of existing and newly added attic flats—supplied by the city district heating network, the power consumption due to elevators and common areas, EV charging, garages and community centers; and PV production and meters of electric heater supplied. Altogether, the building complex, with its three blocks of around 60,000 m2, was monitored using 25 electricity meters and 11 heat meters. The data were collected with a sampling frequency of 15 min and transferred to the data-management platform for further processing as elaborated underneath to feed in the final step of KPI calculation and impact assessment, as depicted in Figure 6.
The sampling frequency of data measurement depended on the underlying process of the measured parameters and varied between 15 min and one hour for most of the energy consumption and production data. To prepare the monitoring data for the final purpose of KPI calculation, the following cleansing and processing steps were pursued, as depicted in Figure 8.
The collected raw data—received from the meter measurement in CSV format—underwent a systematic plausibility and consistency check supported by visual and statistical routines to ensure whether the meters were providing continuous data. Common failures mostly occurred during data-gathering and transfer, such as formatting errors, comma errors, time gaps and missing values in a timeslot due to the interruption of meter reading. In the next step, the data were further repaired and completed by the interpolation of missing time steps. Then, the physical plausibility of the measurements was checked by building the differential of the meter curve for equal time steps. Finally, the resulting cleaned data were visualized for different time scales (hourly, daily, monthly, yearly) and further employed for KPI calculation.
Data cleaning is demonstrated for the two selected examples of monitoring space-heating and common-area electricity consumption, as well as PV production from the demonstration sites of Vienna and Lyon LHCs.
Figure 9 shows the collected heat meter data for the period (January 2019–March 2021) for Block 1 of the building complex at Hauffgasse on the Vienna demonstration site. The drop in the accumulated and cleaned meter data (left axis) in May 2020 is due to the meter exchange occurring frequently. The resulting hourly consumptions (right axis) are calculated by building the difference of the two following time steps. The curve clearly shows the expected consumption during the heating period (October–May). Figure 10 shows the results of the monthly space-heat demand supported by the real measurement of external temperature at the demonstration site for the two years of 2019 and 2020. The plotted external temperatures support the plausibility of the monitored heat demand data, as can be concluded form the course of the monthly temperature profile. Finally, Figure 11 shows the PV production on two consecutive days in August 2019 at Hauffgasse, Vienna.
Figure 12 shows the monitoring data of the electricity consumptions for elevators, lighting, substations and ventilation at 61 Delandine, Lyon for the period form 12 February 2020 to 8 July 2021.
Following the monitoring process described above, the collected and processed data are further consolidated to evaluate the achieved impact of the implemented solutions, focusing on sustainable urban development. For this purpose, comprehensive sets of KPIs are calculated covering energy savings due to building energy-efficiency measures, local renewable energy production, and CO2 emission reduction, as well as related social, economic, and governmental impacts achieved by the demonstration sites of the three LHCs.
Monitoring and evaluation were realized based on an intensive interaction with key stakeholders spanning municipalities, housing associations, tenants, energy suppliers, industry, and research institutions. The establishment of a harmonized and coordinated process among all the stakeholders proved to be crucial for the successful realization of the monitoring processes of the three LHCs.
Along with the monitoring process, numerous challenges of technical, structural, financial, and regulatory aspects had to be overcome before all monitoring channels worked with appropriate data quality. This implied both the setup of the monitoring infrastructure and the data collection. Obstacles in establishing the monitoring infrastructure arose initially from a delay in timely implementation of the solutions, e.g., a delay in finishing construction plans, obtaining building permits and construction work, and high cost of sensor assembly and interconnection beyond the proposal cost estimation. However, the main challenges were of a technical nature, faced mainly at the initial phase of the monitoring process in terms of the calibration and validation of sensor functionality, smooth data transfer to the data-management platforms, and quality of the gathered and stored data.
Some key lessons learned from the monitoring process should be emphasized at this point. This implies the recommendation of (1) establishing clear data flows with responsible entities and people for each demonstration site, which enables focused responses and the fast elimination of detected failures and faults in the collected data, (2) building refurbishment should go hand in hand with the retrofitting of onsite energy-supply infrastructure, (3) some observations from the monitoring data can only be accounted for in relation to specific user behavior, e.g., rebound effects, higher room temperature compared to the one recommended for winter months, wrong ventilation habits, tilted windows.
The collected and processed data are further consulted for KPI calculation and impact assessment, as briefly described below.

5. Results of the Monitoring and KPI-Based Impact Assessment

The impacts of the implemented solutions for low-energy districts consist of the energy saving achieved by building-efficiency measures resulting from technical measures of renovating the building envelope and heating system, the implementation of local renewable energies resulting in fossil fuel substitution, and the subsequent CO2 emission reduction of both measures. The calculated KPIs rely upon evaluating the collected and processed monitoring data, as described earlier.
The achieved impact of the suggested building refurbishment is calculated by comparing the monitoring data of the final energy demand after the refurbishment with the baseline data—historical data collected before the refurbishment. Energy saving by building-efficiency measures results mainly from the reduction of space-heating demand (SH) (due to technical measures from improving building insulation) as well as reducing heat demand for hot water (HW). This effect is enhanced when building retrofitting also considers the rehabilitation of heat supply systems, reducing the loss of heat provision (including switching to more efficient heating systems such as district heating, heat distribution, storage, and heat dissipation, as well as any auxiliary energy for operating the heating system (including circulation pumps and system controls). In some demonstration sites in Lyon and Munich, the heating systems were switched from gas boilers to district heating. All residential buildings in the Vienna demonstration had district heating after refurbishment, except for the small dwellings of Lorystr. and Herbortgasse, which used gas boilers. The secondary school was connected to the district heating before refurbishment, and geothermal HP supplies the gym space-heating supply. The calculation scheme for c the following steps:
  • Baseline data (before refurbishment): processing and cleaning the collected historical data and calculating monthly and yearly useful and final heat demands for space heating (SH) and water heating (WH).
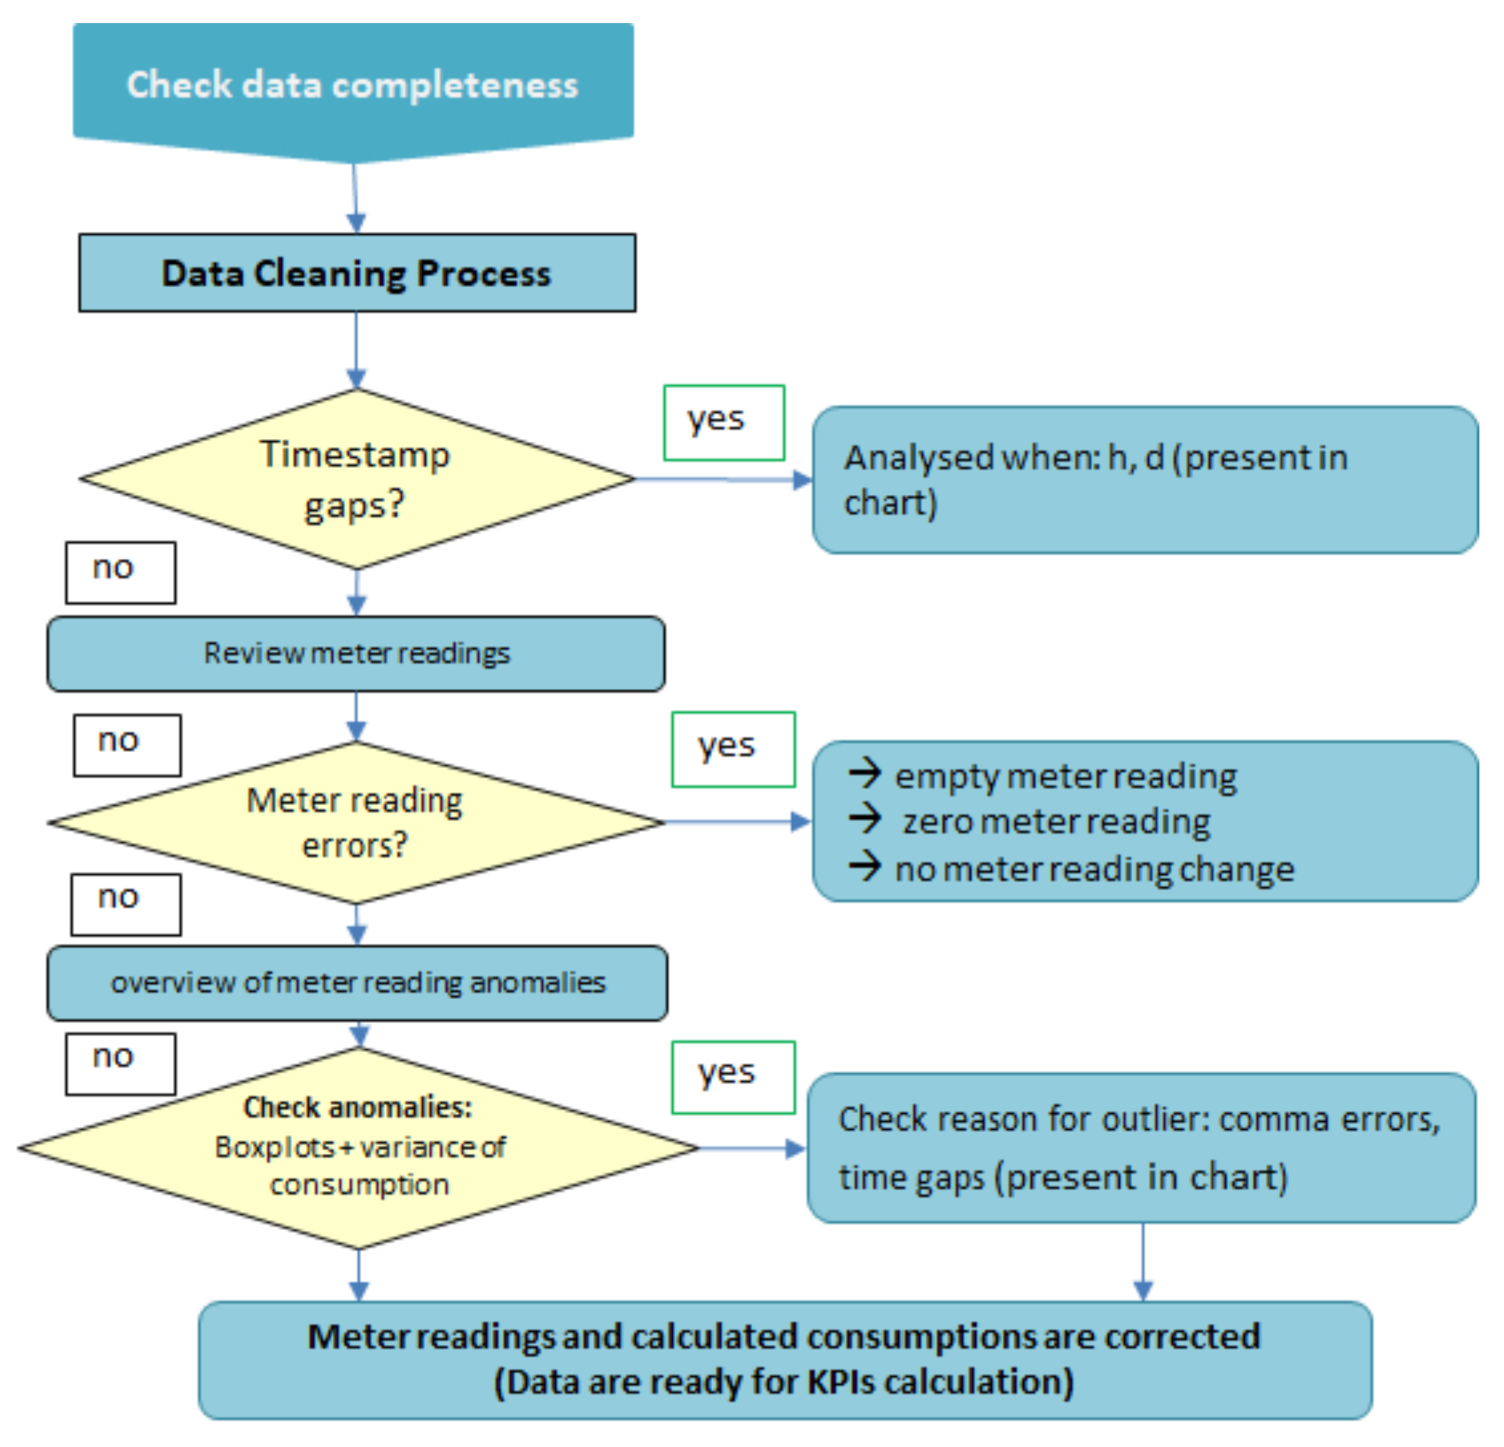
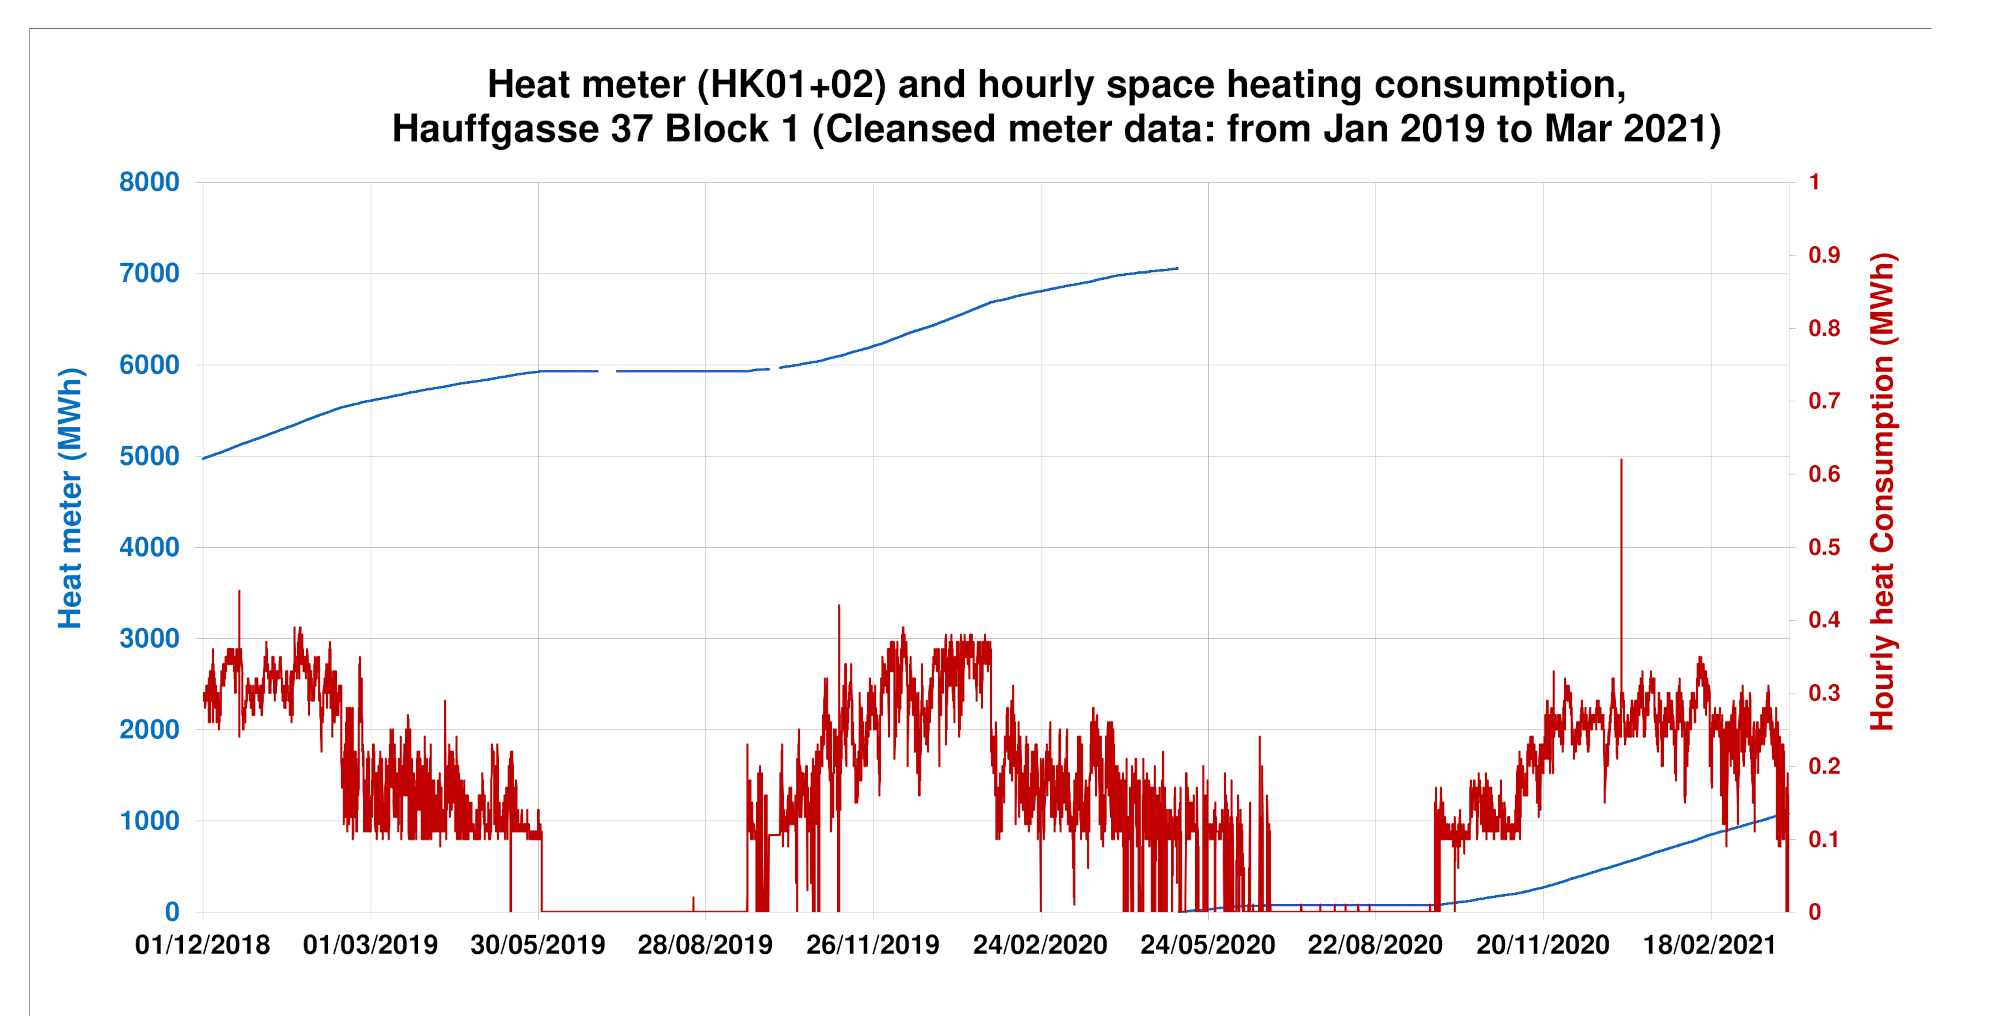
  • Data after refurbishment: processing and cleaning of collected raw monitoring data and calculating monthly and yearly useful and final heat demand of SH and HW. This step is essential for calculating the building energy performance and includes the following sub-steps:
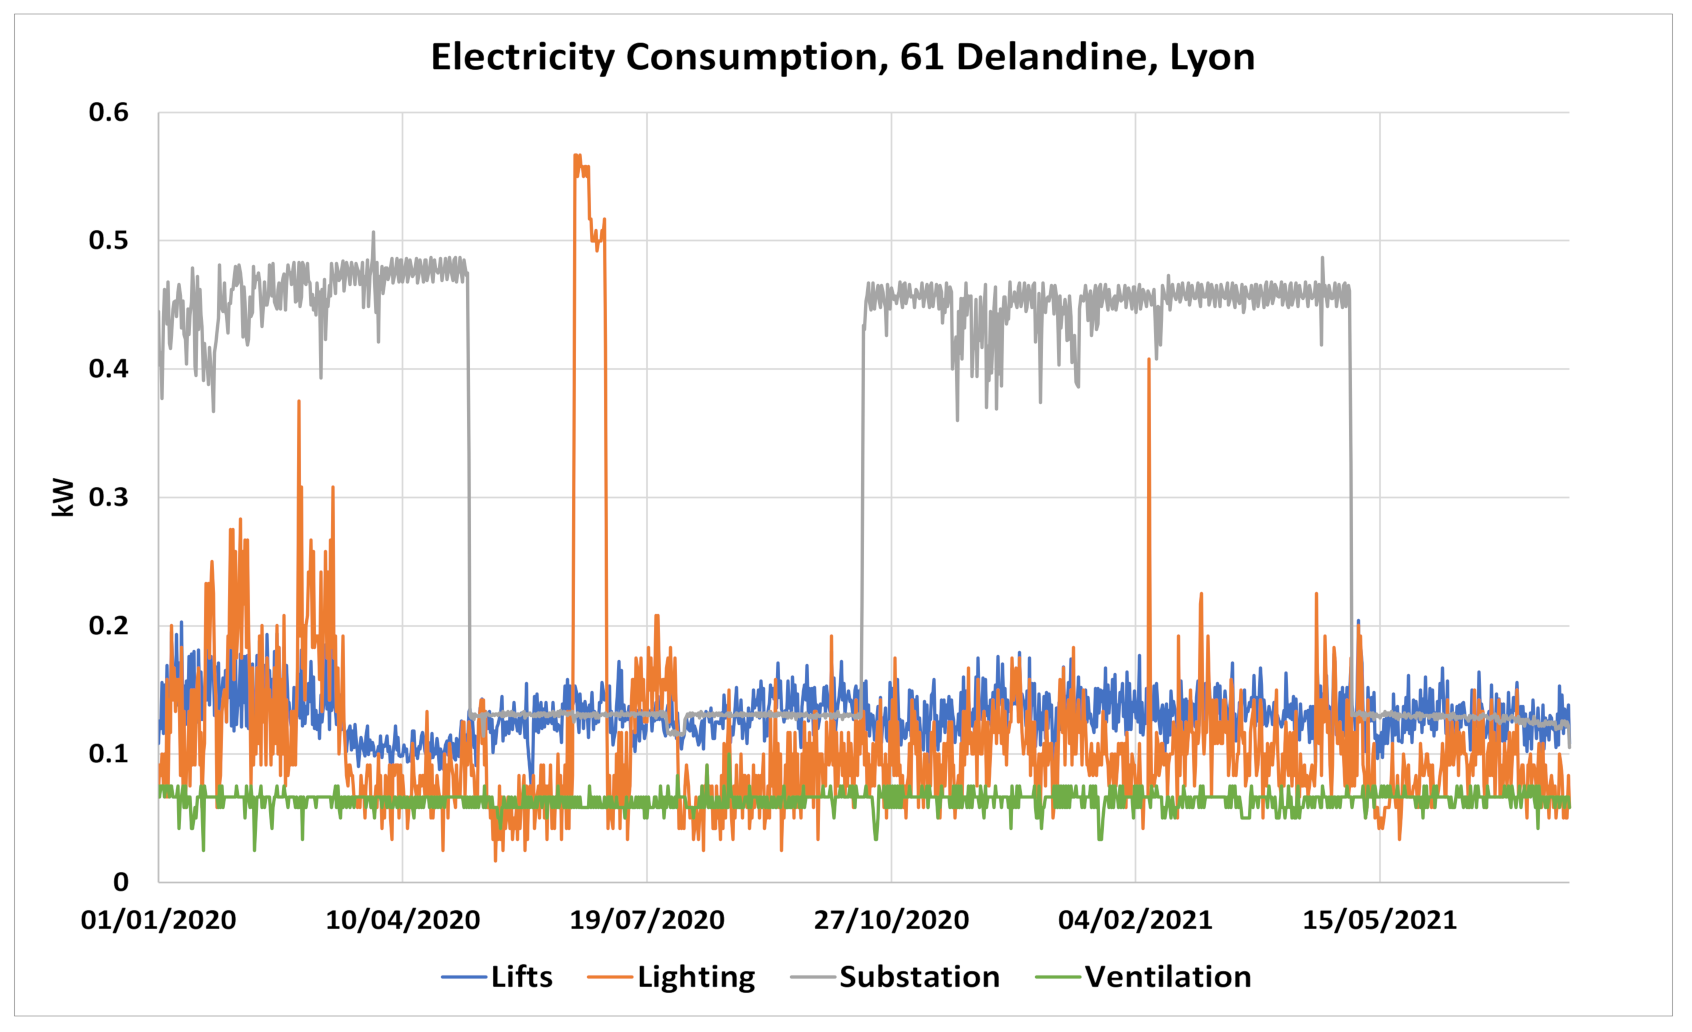
    Data cleaning: to ensure that the measured building energy demand data (of heat and power demand) ensures the adequate quality (see Figure 8).
    Calculating daily, monthly, and yearly final energy demand.
    Calculation of yearly useful space and water heating demand after subtracting the heating system’s energy losses covering conversion losses of heat boilers, piping heat losses of energy provision and distribution, auxiliary energy for operating the heating system such as circulation pumps and control electronics and heat storage losses.
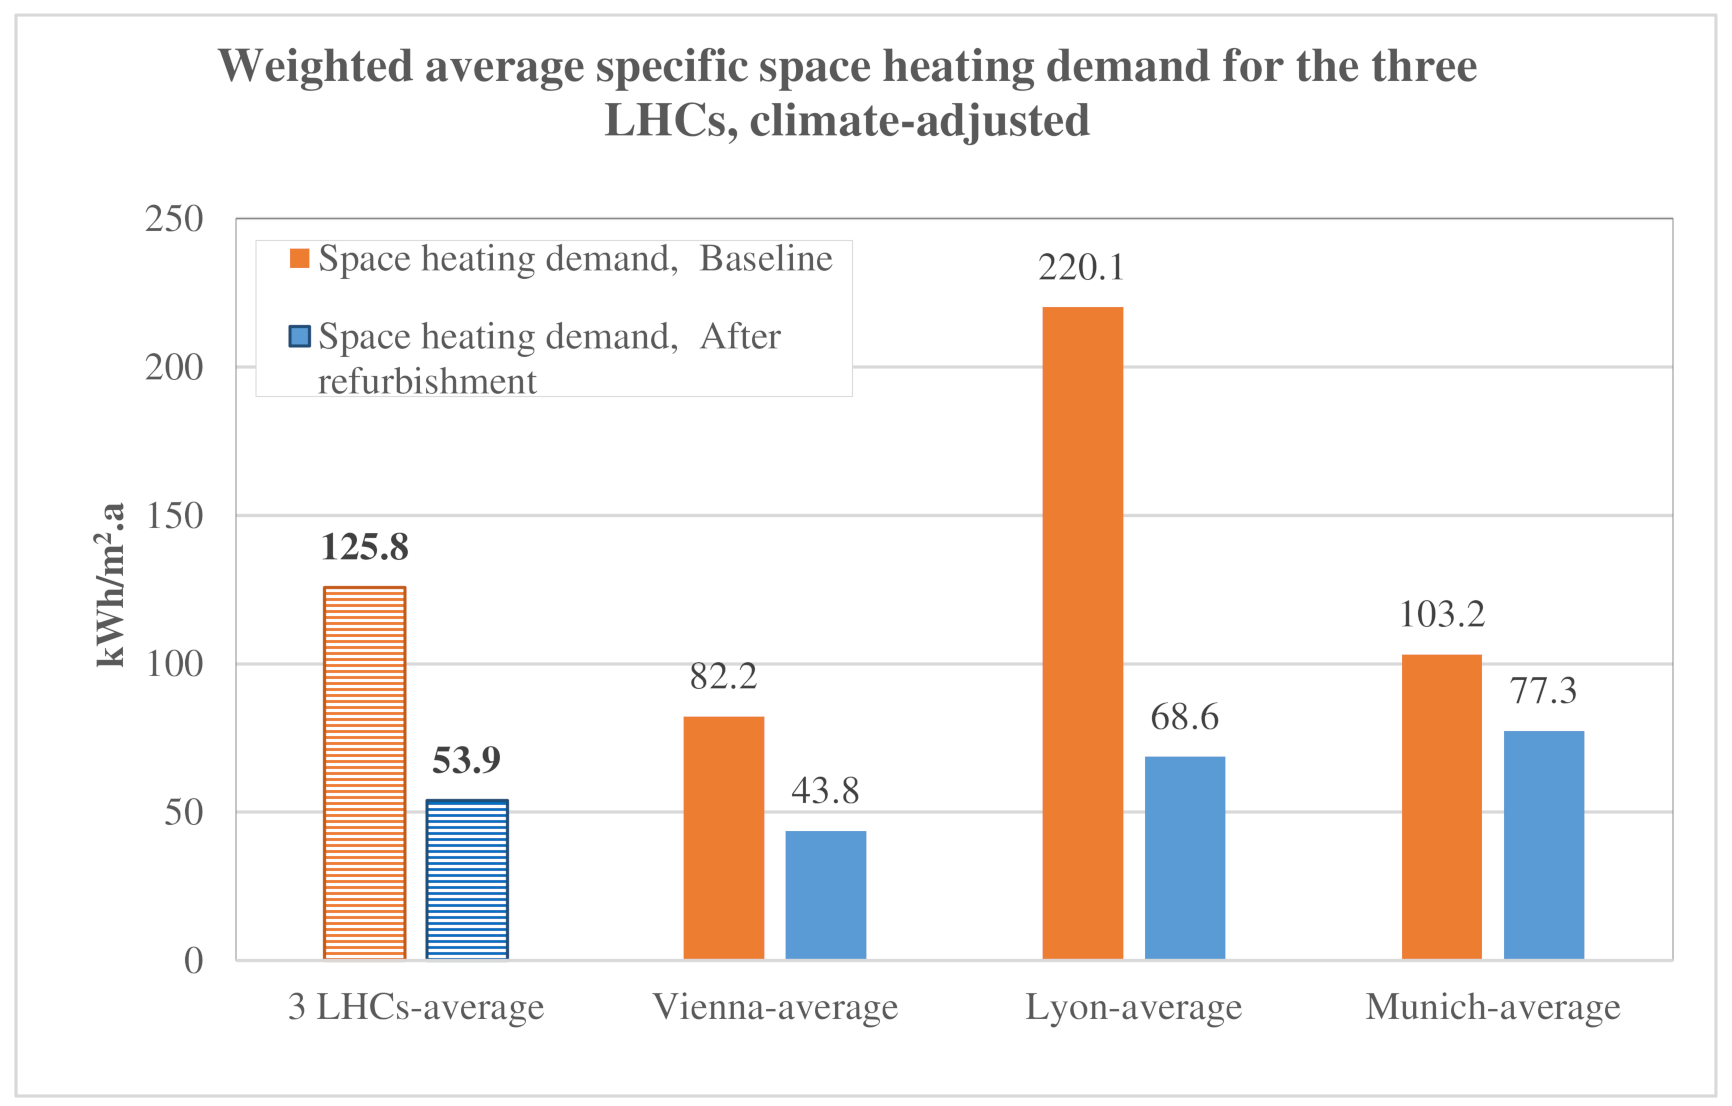
  • Climatic adjustment: of final heat demand (to the reference climate) using real heating degree days (HDDs) for considered monitoring years as well as reference climate HDD. HDDs are calculated based on real measurements of external temperature in 15 min intervals at each demonstration site.
  • Specific building energy performance: building the ratio of annual monitored useful space-heat demand to the gross floor area (kWh/m2.a) for the states before and after refurbishment. These values are compared with the calculations of the energy performance certificate of the building.
  • Energy saving: calculation of total energy saving by building-efficiency measures, describing the difference between the climatic adjusted final heat demand before and after building refurbishment.
  • CO2 reduction by building-efficiency measures: considering the final energy differences and emission factors of the heating system before and after the refurbishment.
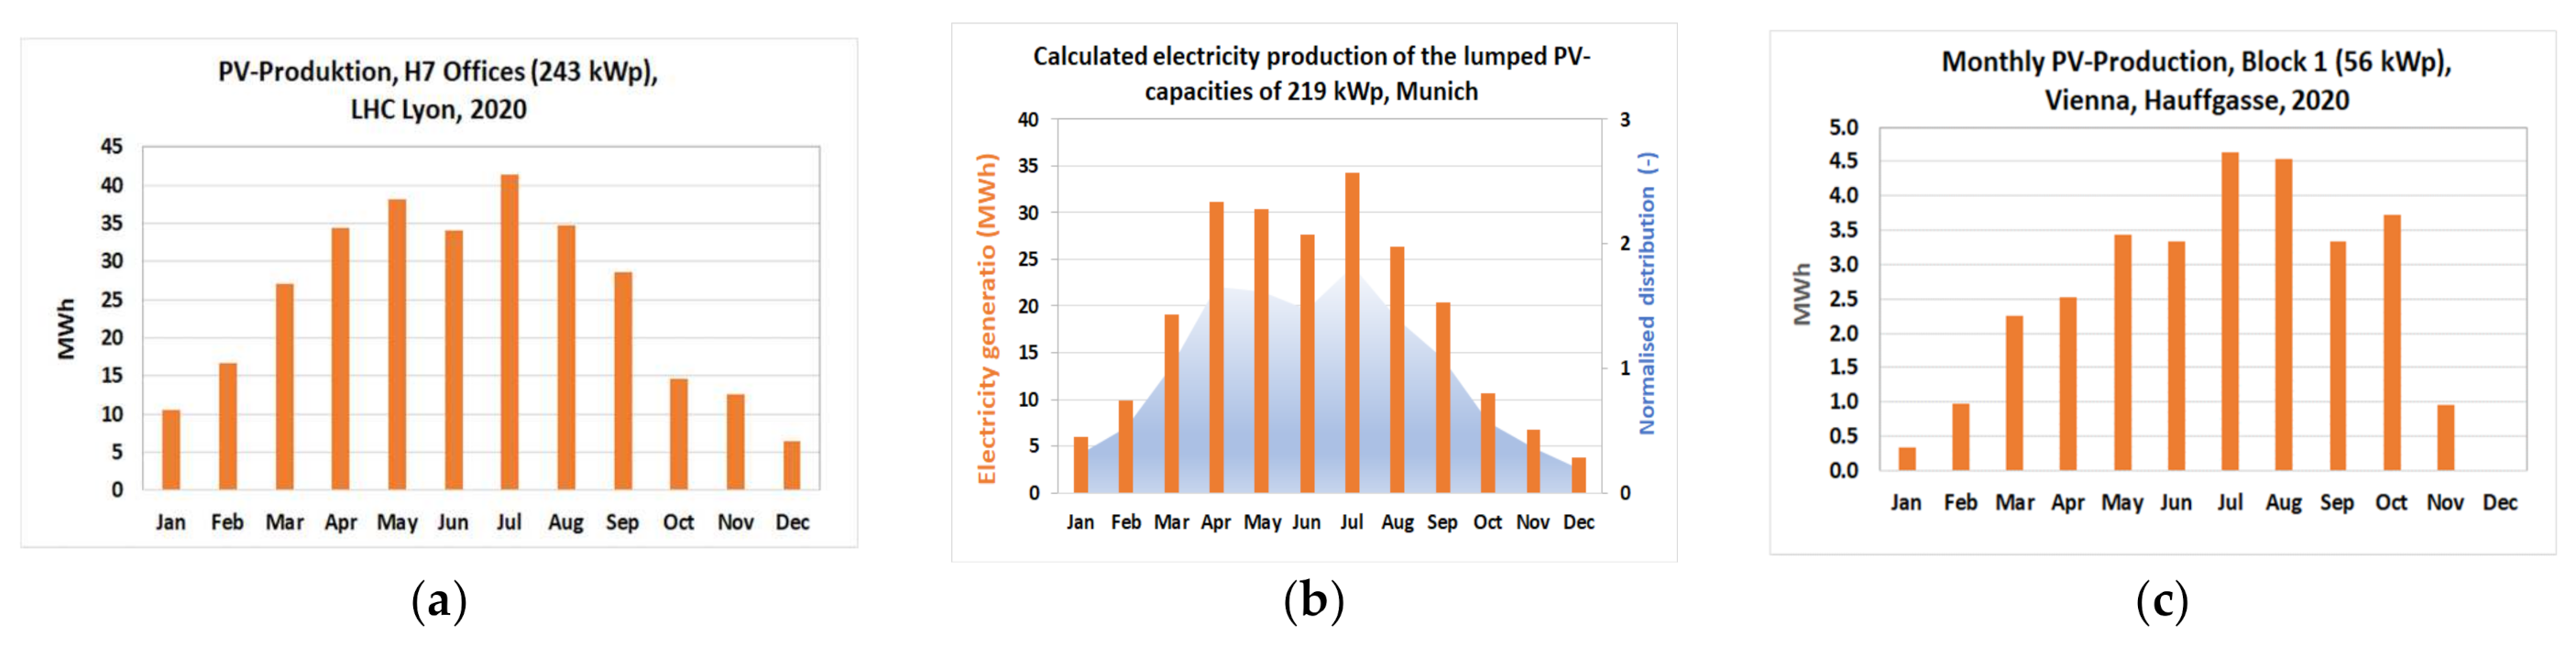
  • Local renewable energy supply (RES): calculation of monthly and annual energy production (PV electricity, heat from solar thermal and geotherm heat pump (after deducting the electricity input of the HP) based on cleaned monitoring data (measured with a sampling rate of 15 min).
  • CO2 reduction by RES measures: describing the product of generated RE with the emission factor of the national electricity supply mix (grid emission factor) for PV generation and emission factor local heating system before refurbishment for solar thermal and geotherm heat-pump production. Local renewable energy-supply measures (RES) impact is assessed assuming that generated energy fully substitutes electricity from the public grid (for PV) and district heat or gas boiler (for solar thermal and geothermal heat pumps).
Out of the resulting KPIs, the following are briefly presented and discussed:
  • Specific annual space-heating demand and energy saving by building-efficiency measures (demand-side measures)
  • Annual local renewable energy generation (energy-supply measures)
  • Annual CO2 reduction by energy demand and supply measures
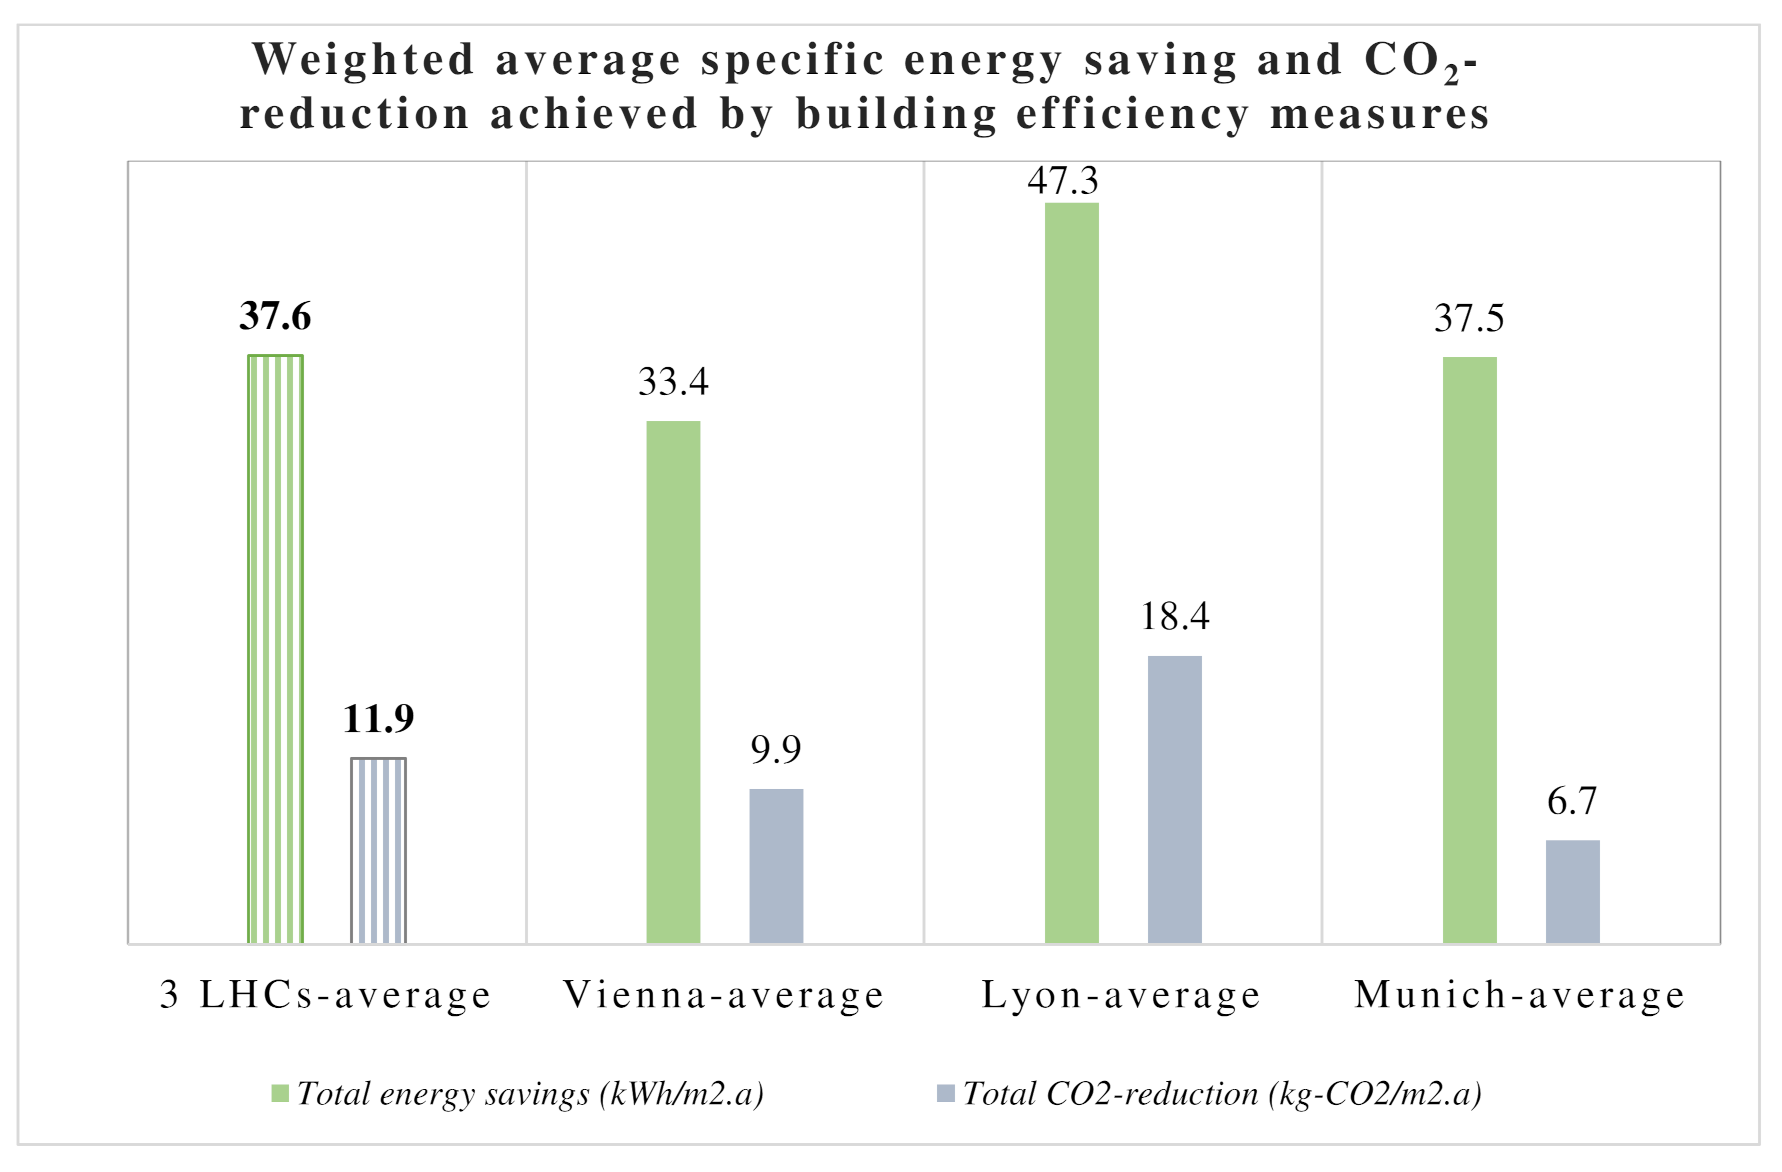
  • Annual area specific KPIs for energy saving and CO2 reduction.
Figure 13 and Figure 14 show selected KPIs related to the achieved evaluation results for the three LHCs. One important KPI is the climate-adjusted specific space-heating demand before and after refurbishment, represented in Figure 13. The results refer to the weighted average values over the whole refurbished floor area of each demonstration city. The resulting average values vary between 44 and 77 kWh/m2a. The resulting weighted average value over the whole refurbished floor area of all LHCs shows a decrease of average annual space-heating demand from 125.7 to 53.9 to kWh/m2a. This indicative KPI assesses the effectiveness of the technical intervention of building refurbishment that shows an average decrease of space-heat demand by around 57%.
The specific final energy saving and CO2 emission reduction resulting from the achieved building-efficiency measures are shown in Figure 14 as a weighted average over the whole refurbished floor area for each LHC and all LHCs.
Over the project implementation period, the three LHCs have implemented around 833 kWp of PV panels, of which 157 kW is for heating generation (solar thermal and geothermal heat pump). The resulting annual energy generation amounts to around 871 MWh/a of electricity and 274 MWh/a of heat generation. The resulting CO2 emission avoidance due to energy-supply measures amounts to around 212 tCO2/a. Figure 15 shows the measured electricity generation of the selected PV panels among the three LHCs.
In short, the monitoring and evaluation of the three LHCs with a focus on achieving a low-energy district reveals the following:
Lyon LHC achieved a refurbishment of around 35,000 m2 of floor area, and implemented around 449 kWp of PV panels resulting in annual electricity generation of around 497 MWh. The building-efficiency measures achieved a total energy saving of around 1350 MWh/a. The resulting annual CO2 reduction reached about 643 t-CO2/a.
Munich LHC achieved a refurbishment of around 132,823 m2 of floor area, and implemented around 20 kWp of PV panels. Moreover, Munich LHC managed to connect 12 buildings to the geothermal district heating network and implement in a separate action in several buildings of shared and private ownership associations (without refurbishment) around 219 kWp of PV, connecting a battery storage system of 800 kW capacity to the city’s virtual power plant. The building-efficiency measures achieved a total annual energy saving of about 407 MWh/a. The resulting annual CO2 reduction reached about 170 t-CO2/a.
Vienna LHC achieved a refurbishment of around 69,145 m2 of floor area, added 12,446 m2 of new constructed area, and implemented around 145 kWp of PV panels and 157 kW for heating supply (solar and geothermal), resulting in annual electricity and heat generation of around 400 MWh. The building-efficiency measures achieved a total annual energy saving of about 2210 MWh/a. The resulting annual CO2 reduction reached about 682 t-CO2/a.
In total, the three LHCs managed to refurbish a total floor area of around 117,497 m2 (residential and non-residential buildings) as well as a new constructed area of about 12,446 m2. Altogether, the realized holistic building refurbishments of the three LHCs will annually save around 3967 MWh/a of energy by building-efficiency measures and generate 1145 MWh/a of local renewable energy, resulting in collective annual CO2 reduction of around 1496 tCO2/a. As elaborated above, this corresponds to a specific annual energy saving of 37.6 kWh/m2a and CO2 reduction of 11.9 kg-CO2/m2a. Both KPIs are calculated as a weighted average value over the whole refurbished floor area among the three LHCs.
The demonstrated monitoring and evaluation of the implemented integrated solutions at the demonstration sites resulted in quantitative KPIs. They are essential in driving the smart-city concept and the planned sustainable urban transformation within the LHCs and FCs. This goal will be enabled based on the effective rollout and replication plans around the clustered solutions following the demonstrated co-creation process.

6. Discussion of the Results and Related Recommendations

Following the established co-creation processes, the project has successfully demonstrated the implementation of 26 integrated smart solutions for low-energy districts in the three LHCs. The implemented solutions have been monitored and evaluated following an integrated monitoring methodology (IMM) developed and applied jointly in the three LHCs to enable a P2P learning process. The IMM covers the setting up of the monitoring infrastructure, automated process of meter-based data collection, data transfer to and storage on the city’s data-management platform (DMP) and the subsequent consolidation, processing, and calculation of related key performance indicators (KPIs).
Monitoring the implemented district solutions and evaluating their impacts provided qualitative and quantitative knowledge, experience, and lessons learned to help optimize the process of implementing and deploying the integrated energy solutions. This outcome is essential for the further rollout and replication of the project results to advance sustainable urban transformation at a district scale for both LHCs and follower cities (FCs). In this regard, the project established “a process evaluation” approach, aiming to evaluate the implementation processes of the respective demonstration site projects from the planning phase to the intended future replication of the implemented solutions. It aims to give a clear view on the implementation processes and influential factors such as stakeholder involvement, the administrative context and legal issues, and focuses on gathering information and enhancing findings about factors of success and potential strategies to overcome possible problems or barriers during the implementation phase. The extracted findings from this process provided a solid practical basis for citywide scaling-up and a replication of the solutions. The resulting findings are classified as:
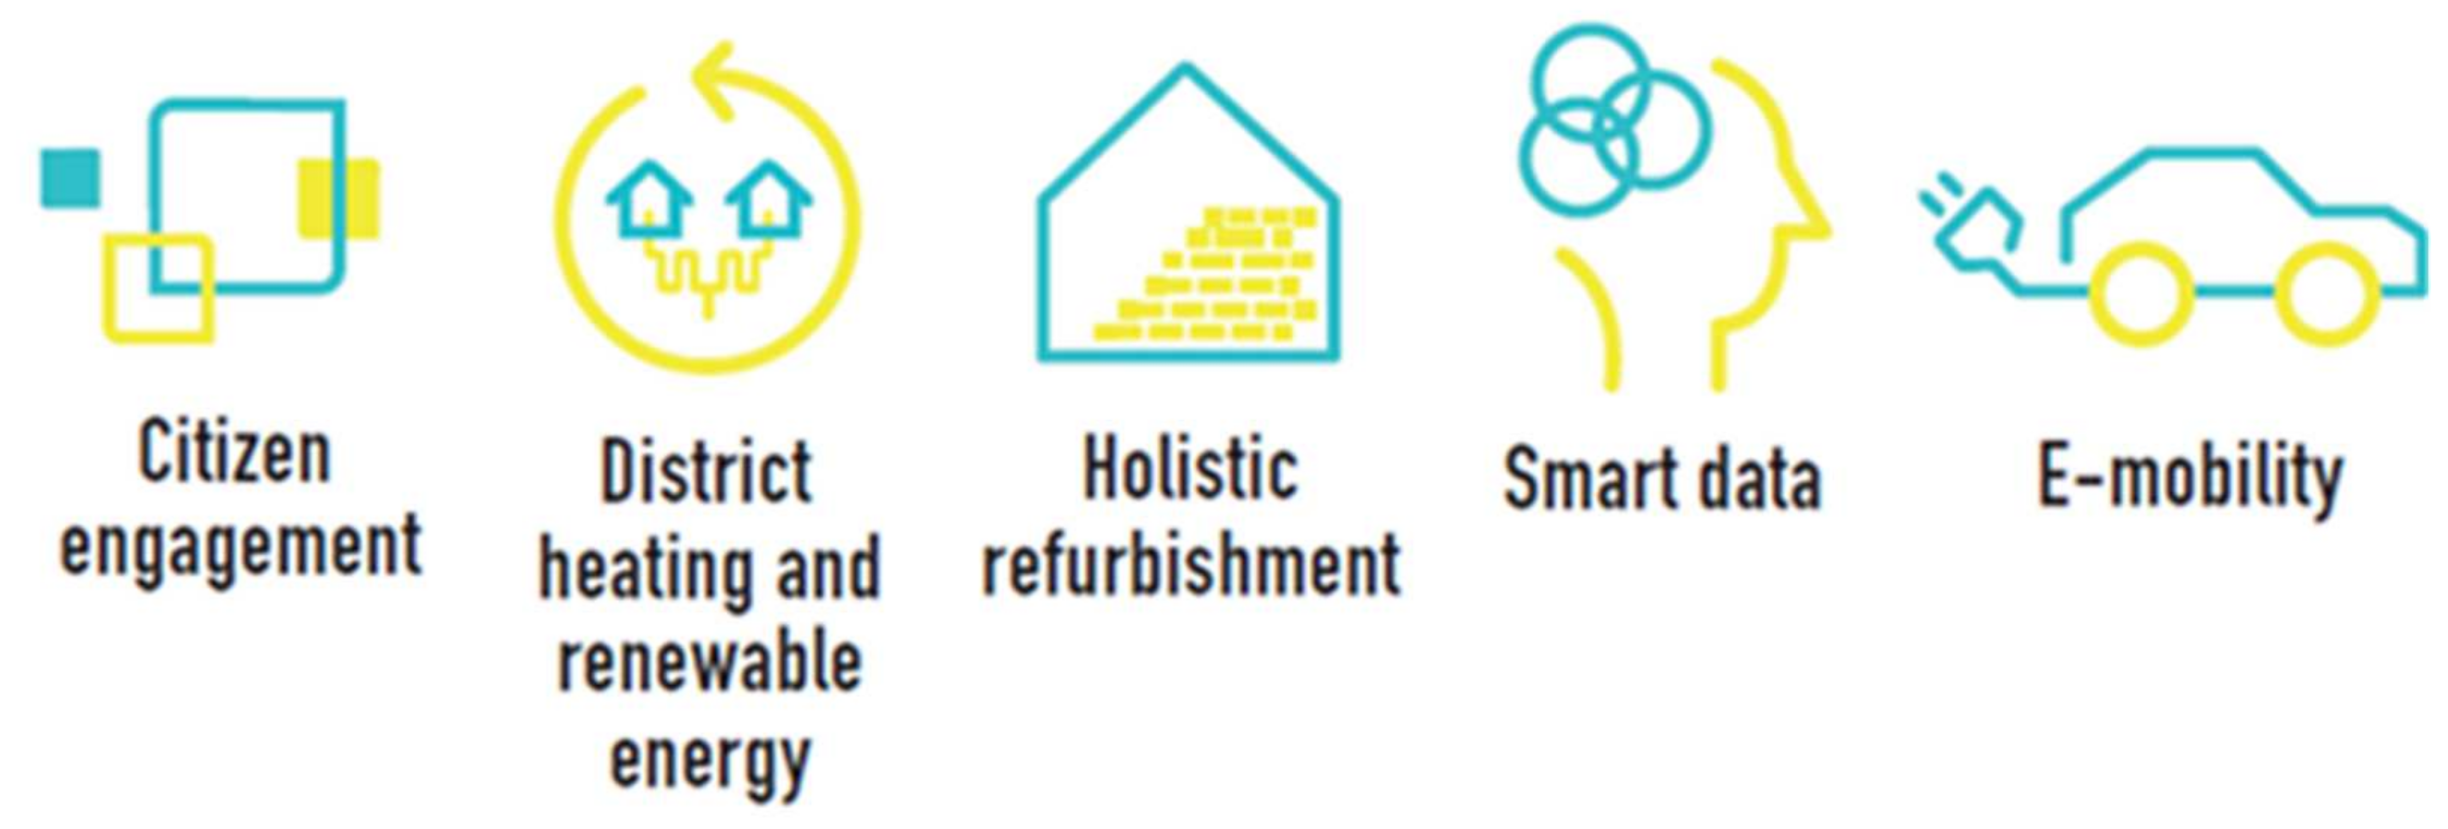
  • Qualitative indicators about the five clusters of the implemented solutions (Figure 1) including the cluster Holistic Refurbishment for low-energy districts addressed in this work.
  • Phase and cross-evaluation: covering the (1) deviation from the target indicators and reasons related to planning and organization; (2) process drivers related to the institutional and political tailwind to ensure alignment with the municipal agendas; (3) process barriers related to planning and leading to mentioned deviations. Most barriers were known about at the project’s start; further dominant barriers refer to a lack of communication; (4) corrective actions: the communication between decision-makers and a partly stronger involvement of all participants succeeded in decreasing the overall communication process barriers. This observation showed that many deviations could have been avoided by more elaborate planning at an early stage. The evaluation revealed that the most dominant barrier and corrective action is due to the missing integration of stakeholder groups. Involvement issues can be solved by providing a good communication base.
  • Methodological lessons: clusters of solutions were used to create comparable basic requirements. However, evaluation showed that there are project environments within the clusters that are still diverse, and these complicated the activities. To overcome this, clustering each city on a cross-project basis or on more precise and detailed clusters would be an option. Furthermore, the different projects cannot be compared quantitatively without extra effort (such as conducting further interviews).
As well as the tangible social, economic, and environmental impacts achieved for the LHCs, the gained experience and lessons learned are of great importance for future projects and replications. The following main reflections can be attributed for each of the LHCs:
-
Vienna: due to the favorable regulatory framework established for building refurbishment in Vienna, all four planned projects were realized comprising three social housing complexes and one secondary school. With a focus on the achieved energy saving due to building refurbishment, the impact assessment of the realized project highlights the importance of holistic refurbishment that also includes the retrofitting of local energy-supply infrastructure. The school’s zero-energy building (ZEB) is unique and shows the potential for realizing such high building standards for non-residential buildings. The monitored annual energy balance shows that local implemented RES are promising in attaining a nearly zero annual energy balance.
-
Lyon: most of the refurbished buildings in Lyon were initially in a derelict state. Thus, the impact in terms of building-efficiency improvement and CO2 reduction is tangible. Two of the buildings were rental municipality housing and three were Multi-Ownership Buildings (MOBs). Despite most of the refurbished buildings being in private ownership, no significant regulatory challenges were faced during the realization of the refurbishment process. This is a real success due to the complex decision-making process of such organizations. Most of the refurbished buildings were in a derelict state.
-
Munich: the demonstration projects have shown that the realization of the planned building refurbishment in Munich has faced big challenges due to the prevailing regulatory framework for building refurbishment in multi-ownership associations or the so-called multi-ownership residential buildings (MOBs), as the considered buildings are held in such an ownership relationship. Thus, only a part of the conceived buildings was realized. This situation is in stark contrast to Vienna and Lyon, where most of the refurbished buildings are social housings or housing cooperatives. The persisting regulatory challenge of MOBs is already recognized at EU level and currently presents the main obstacle for accelerating the building refurbishment measures and achieving a set EU target by way of sustainable urban energy development. Therefore, Munich LHC considered so-called “Non-Implementation Projects” where roadmaps were developed, and consulting advice was given to support the “Implementation Projects” at a later stage. In deploying local renewables, Munich LHC has shown that, despite the challenges faced in realizing building refurbishment in MOBs, PV systems can be adopted by such buildings and their uptake in older buildings can be significantly improved once the restrictive regulations in such areas are relaxed.
Following the achieved KPI-based project impacts, the above-described process evaluation, and the experience gained in each of the three LHCs, the following key recommendations can be extracted, with a focus on building solutions for low-energy districts:
  • There is a need for holistic refurbishment that considers building envelope, local energy-supply infrastructure, and overall building retrofitting.
  • Communication with and involvement of relevant city stakeholders is essential. The bigger the project, the more stakeholders with different roles need to be involved. For that, well-structured and harmonized coordination among all actors is crucial.
  • Establishing clear data flows with responsible entities and people for each demonstration site enables a focused response and fast elimination of detected failures and faults on the collected data and the employed meters/sensors.
  • Some of the achieved KPIs on building monitoring can only be explicated in relation to specific user behavior, e.g., rebound effects, higher room temperature, tilted windows. Therefore, for future projects, a qualitative analysis of consumer behavior is desirable to assess its impact on the monitored data as well on the resulting project impact.

7. Next Steps

Aside from sharing the results with local stakeholders and between the three LHCs to support the P2P learning process, the monitoring and evaluation results will also be shared through the self-assessment tool of the Smart City Marketplace (formerly known as SCIS, the Smart City Information System) and the European SCALE [15] initiative (i.e., the secretariat of the Smart City Lighthouse Group), and with interested cities and industries to support the upscaling and replication of the solutions.

7.1. Further Developments in Lyon Confluence

Photovoltaic systems were largely integrated into the Confluence district. The next objective is to implement two collective autonomous projects:
  • The H7 office building for start-ups is a converted factory. A virtual “photovoltaic auction” system is under development for collective electricity generation and self-consumption by different building tenants.
  • The new B2 mixed-residential complex has five buildings with 30,000 m2 GFA. A tenant initiative is leading the installation of a collective self-consumption electricity and heating project with 200 kWh battery storage.
More details can be found here: https://www.lyon-confluence.fr/fr/smarter-together-lenergie-sous-controle (accessed on 11 September 2022).
The positive feedback from the holistic refurbishments motivated further building refurbishment projects. Building refurbishments with renewable energy connections can potentially help reach the 2030 CO2 emission-reduction objectives of the Grand Lyon Metropolitan Area: 3.5% for residential buildings, and 2.5% for commercial buildings. A total of 200,000 apartments are designated to be renovated, 75% of commercial buildings greater than 2000 m2, and 25% of commercial buildings smaller than 2000 m2.

7.2. Continuing Building Stock Revitalizations in Neuaubing–Westkreuz, Munich

By implementing building refurbishments, building owners and tenants can potentially save heating and energy costs significantly. Homeowners qualify for free consulting from the MGS in the project district and subsidies if they agree to renovate to the “KfW Effizienzhaus 100” building standard. The aim is to increase the cost-effectiveness of the building refurbishment measures for private building owners while considering both social aspects and achieving climate protection targets. The experiences gained from Smarter Together are being applied to further holistic refurbishments in particularly for the Neuaubing–Westkreuz district (see Figure 4). More details can be found here: https://stadt.muenchen.de/infos/smartertogether.html (accessed on 11 September 2022).
The City of Munich has set targets to reach carbon neutrality by 2035. Deep-thermal building refurbishments with connections to renewable energy sources are one strategy for moving towards carbon neutrality. The set target is for all buildings in Munich to use solar energy by 2035. Thirty percent of municipal buildings are designated for deep-thermal renovations [39].

7.3. Vienna Follow-Up Projects

Smarter Together project innovations were integrated into the WieNeu+ follow-up project of the Smart City Vienna Framework Strategy and in the Economic Strategy Vienna 2030. Project results will be shown at the international housing exhibition, IBA_Vienna 2022, as a best-practice example.
Based on the method of energy screening in the project, the Energy Planning Department of the City of Vienna is creating the first static energy atlas for the whole city. It will be further developed to a dynamic model within the project, GEL SEP, Spatial Energy Planning for Heat Transition. Another follow-up project is the EU Deep Demonstration Programme “EIT Climate-KIC” that began on 29 January 2020. The Municipal Council adopted a funding decision for replicating the holistic urban renewal as developed within the ST project in a new pilot project, Smarter Together 2.0, which became the name WieNeu+ and started in the area of Innerfavoriten. More details, including maps (https://www.smartertogether.at/smarter-together-2-0-im-gemeinderat/ (accessed on 11 September 2022)) of the new demonstration area and the approach of 50 replication steps, can be found in [35] (page 173–182). The project budget is EUR 10 million and has a ten-year timeline. Smarter Together 2.0 particularly aims to strengthen integrated, interdisciplinary collaboration with citizens continuing with building refurbishments and improving renewable energy systems and supply. The circular economy will be a new focus of the participatory process involving different target citizen groups. The AIT (Austrian Institute of Technology) has prepared the first version of the MAED-City to support the decision-making process in preparing future sustainable energy strategies and decarbonization scenarios [13,45].

8. Conclusions and Outlook

Smarter Together has implemented five clusters of co-created and integrated smart solutions for a better life in urban districts in the three European LHCs Lyon, Munich, and Vienna. This work has focused on presenting the monitoring and evaluation results related to the realized solutions around holistic building refurbishment and the connection of local renewable energy and district heating for low-energy districts. The other solutions covering sustainable mobility, smart data management and smart labs for citizen engagement were implemented in parallel to these two main groups. They are not subject of this work.
The three LHCs refurbished a total floor area of 117,497 m2 and added 12,446 m2 of new construction, mainly as new flats in attic conversions. Compared to the baseline case, the achieved annual energy saving by building energy-efficiency measures amounts to 30%, corresponding to 3967 MWh/a. The climate-adjusted annual space-heating demand after refurbishment reveals an average value of 54 kWh/m2.a, corresponding to an average improvement of about 57% compared to the baseline (all values are calculated as a weighted average over the whole refurbished floor area). Furthermore, the three LHCs have implemented a new overall capacity of around 833 kWp of PV panels, 35 kW of solar thermal and 13,122 kW of geothermal heating systems with an estimated annual generation of around 871 MWh for electricity and 274 MWh for heat. Altogether, the realized solutions for low-energy districts in the three LHCs will annually save around 4000 MWh, generate 1145 MWh of renewable energy, and reduce the annual CO2 emissions by around 1496 tCO2/a.
For the realized solutions, the associated floor area-specific annual values are 37.6 kWh/m2 of final energy saving, 9.5 kWh/ m2 of local renewable energy generation, and 11.9 kg-CO2/m2 of CO2 emission reductions. The deployment of such realized building energy solutions should serve as a role model to guide the transformation towards efficient and carbon-neutral cities.
Finally, it is worth mentioning that, based on the successful implementation of the Smarter Together project—aimed at implementing integrated smart solutions for a better life in urban districts—a new follower Horizon lighthouse project has recently been approved by the EC for the same LHCs to start by the end of 2022 [46]. The new project has much higher ambitions, targeting the demonstration of integrated smart and livable urban solutions on the way to positive clean-energy districts (PCEDs) that promise to accelerate the transition towards climate-neutral cities [15].

Author Contributions

Conceptualization, A.H., H.-M.N., S.M. and B.R.; methodology, A.H.; validation N.M.-S. and B.M.; formal analysis, A.H., F.M., F.H., S.S., K.W., M.K.-B., S.M. and B.R.; investigation, A.H., H.-M.N., N.M.-S., B.M., S.M. and B.R.; resources, B.S., S.H. and M.V.; data curation, F.M.,F.H., S.S., K.W., M.K.-B., B.G., S.M. and B.R.; writing—original draft preparation, A.H., H.-M.N., N.M.-S. and B.M.; writing—review and editing, A.H.; visualization, A.H., B.S. and S.H.; supervision, A.H., H.-M.N., É.V. and M.V.; project administration, H.-M.N., É.V. and M.V.; funding acquisition M.V., H.-M.N. and É.V. All authors have read and agreed to the published version of the manuscript.

Funding

This research project was funded by the European Union’s Horizon 2020 Research and Innovation Program, grant number 691876. The authors wish to thank the European Commission for the funding received to deploy smart-city solutions in Lyon, Munich, and Vienna within the Horizon 2020 Smart Cities and Communities initiative.

Data Availability Statement

Individual data is not publicly available following GDPR regulations. Data from the Lyon use cases are available at https://data.grandlyon.com (accessed on 30 July 2022) and data from the Vienna use cases are available at https://smartdata.wien (accessed on 30 July 2022).

Acknowledgments

Furthermore, the authors express their gratitude to the city stakeholders for their support during the implementation and monitoring of the implemented solutions in the three LHCs.

Conflicts of Interest

The authors declare no conflict of interest. The funders had no role in the design of the study; in the collection, analyses, or interpretation of results; in the writing of the manuscript, or in the decision to publish the results.

Abbreviation

AcronymMeaning
CCclimate change
DHDistrict heating
DHWDomestic hot water
ECEuropean Commission
EPCEnergy Performance Certification
EVElectric Vehicle
EUEuropean Union
FCsFollower cities
FEFinal energy
fCO2CO2 emission factor
FHDFinal heat demand
GFAGross floor area
GHGGreenhouse gas
HDDHeating degree days
HWHot water
HPHeat pump
ICTInformation and Communication Technologies
KPIsKey Performance Indicators
LEDLow-Energy District
LHCsLighthouse cities
MOBsMulti-Ownership residential Buildings
PCEDsPositive Clean-Energy Districts
PVPhotovoltaic
RESRenewable energy sources/supply
SHSpace heating

References

  1. Ge, M.; Friedrich, J.; Vigna, L. 4 Charts Explain Greenhouse Gas Emissions by Countries and Sectors. 2020. Available online: https://www.wri.org/insights/4-charts-explain-greenhouse-gas-emissions-countries-and-sectors (accessed on 20 November 2021).
  2. IRENA. Cities. 2020. Available online: https://www.irena.org/policy/Cities (accessed on 31 July 2022).
  3. UN-Habitat. Cities: A ‘Cause of and Solution to’ Climate Change. 2019. Available online: https://news.un.org/en/story/2019/09/1046662 (accessed on 31 July 2022).
  4. Nerini, F.F.; Slob, A.; Engström, R.E.; Trutnevyte, E. A Research and Innovation Agenda for Zero-Emission European Cities. Sustainability 2019, 11, 1692. [Google Scholar] [CrossRef]
  5. Naboni, E.; Natanian, J.; Brizzi, G.; Florio, P.; Chokhachian, A.; Galanos, T.; Rastogi, P. A digital workflow to quantify regenerative urban design in the context of a changing climate. Renew. Sustain. Energy Rev. 2019, 113, 109255. [Google Scholar] [CrossRef]
  6. UNDESA. World Urbanization Prospects, the 2018 Revision. 2019. Available online: https://population.un.org/wup/Publications/Files/WUP2018-Report.pdf (accessed on 31 July 2022).
  7. Loeffler, R.; Österreicher, D.; Stoeglehner, G. The energy implications of urban morphology from an urban planning perspective—A case study for a new urban development area in the city of Vienna. Energy Build. 2021, 252, 111453. [Google Scholar] [CrossRef]
  8. IEA. Policy Pathways: Energy Performance Certification of Buildings—A Policy Tool to Improve Energy Efficiency. 2017. Available online: https://www.iea.org/reports/policy-pathways-brief-building-energy-performance-certification (accessed on 24 April 2021).
  9. Franco, M.A.J.Q.; Pawar, P.; Wu, X. Green building policies in cities: A comparative assessment and analysis. Energy Build. 2020, 231, 110561. [Google Scholar] [CrossRef]
  10. Cho, K.; Yang, J.; Kim, T.; Jang, W. Influence of building characteristics and renovation techniques on the energy-saving performances of EU smart city projects. Energy Build. 2021, 252, 111477. [Google Scholar] [CrossRef]
  11. Andrić, I.; Koc, M.; Al-Ghamdi, S.G. A review of climate change implications for built environment: Impacts, mitigation measures and associated challenges in developed and developing countries. J. Clean. Prod. 2018, 211, 83–102. [Google Scholar] [CrossRef]
  12. Heard, B.R.; A Miller, S.; Liang, S.; Xu, M. Emerging challenges and opportunities for the food–energy–water nexus in urban systems. Curr. Opin. Chem. Eng. 2017, 17, 48–53. [Google Scholar] [CrossRef]
  13. Horak, D.; Hainoun, A.; Neumann, H.-M. Techno-economic optimisation of long-term energy supply strategy of Vienna city. Energy Policy 2021, 158, 112554. [Google Scholar] [CrossRef]
  14. Huang, B.; Xing, K.; Ness, D.; Liao, L.; Huang, K.; Xie, P.; Huang, J. Rethinking carbon–neutral built environment: Urban dynamics and scenario analysis. Energy Build. 2021, 255, 111672. [Google Scholar] [CrossRef]
  15. SCALE. European Smart and Lighthouse Cities Amplified, Energy Cities: The European Association of Cities in Energy Transition. 2021. Available online: https://energy-cities.eu/project/scale/ (accessed on 31 July 2022).
  16. SCIS. Smart Cities and Communities Lighthouse Projects, 23 October 2020. 2020. Available online: https://smartcities-infosystem.eu/scc-lighthouse-projects (accessed on 18 September 2021).
  17. Bisello, A. Assessing Multiple Benefits of Housing Regeneration and Smart City Development: The European Project SINFONIA. Sustainability 2020, 12, 8038. [Google Scholar] [CrossRef]
  18. Arriazu-Ramos, A.; Monge-Barrio, A.; Bellod, J.S.M.; Martínez, P.G.; Gutiérrez, A.S.-O. Difficulties in the energy renovation processes of district heating buildings. Two case studies in a temperate climate. Sustain. Cities Soc. 2021, 75, 103246. [Google Scholar] [CrossRef]
  19. Huovila, A.; Airaksinen, M.; Pinto-Seppä, I.; Piira, K.; Bosch, P.; Penttinen, T.; Neumann, H.-M.; Kontinakis, N. CITYkeys smart city performance measurement system. Int. J. Hous. Sci. Its Appl. 2017, 41, 113–125. [Google Scholar]
  20. GrowSmarter. Implementing Solutions for Low Energy Districts in European Cities—Experiences from GrowSmarter. 2019. Available online: https://grow-smarter.eu/fileadmin/editor-upload/Reports/D2.3_Implementation_Report__Low_Energy_Districts.pdf (accessed on 30 July 2022).
  21. Ruggedised. Prototype Smart Energy District Planner, Deliverable 5.1. 2020. Available online: https://ruggedised.eu/fileadmin/repository/Publications/D1.5_-_Prototype_Smart_Energy_District_planner.pdf (accessed on 30 July 2022).
  22. Van Wees, M.T. Atelier Monitoring and Evaluation Framework Deliverable 9.1: Repository of Definitions of Terms, Key Characteristics Archetypes, and a Set of KPIs Dissemination Level: PU 1. 2020. Available online: https://smartcity-atelier.eu/app/uploads/ATELIER_D9.1-Repository-of-definitions-of-terms._DRAFT.pdf (accessed on 8 July 2022).
  23. Doubleday, K.; Hafiz, F.; Parker, A.; Elgindy, T.; Florita, A.; Henze, G.; Salvalai, G.; Pless, S.; Hodge, B. Integrated distribution system and urban district planning with high renewable penetrations. WIREs Energy Environ. 2019, 8. [Google Scholar] [CrossRef]
  24. Alpagut, B.; Romo, A.L.; Hernández, P.; Tabanoğlu, O.; Martinez, N.H. A GIS-Based Multicriteria Assessment for Identification of Positive Energy Districts Boundary in Cities. Energies 2021, 14, 7517. [Google Scholar] [CrossRef]
  25. Bossi, S.; Gollner, C.; Theierling, S. Towards 100 Positive Energy Districts in Europe: Preliminary Data Analysis of 61 European Cases. Energies 2020, 13, 6083. [Google Scholar] [CrossRef]
  26. Neumann, H.-M.; Hainoun, A.; Stollnberger, R.; Etminan, G.; Schaffler, V. Analysis and Evaluation of the Feasibility of Positive Energy Districts in Selected Urban Typologies in Vienna Using a Bottom-Up District Energy Modelling Approach. Energies 2021, 14, 4449. [Google Scholar] [CrossRef]
  27. R2CITIES. Residential Renovation towards Nearly Zero Energy CITIES. 2020. Available online: http://r2cities.eu/project/the_project.kl (accessed on 30 July 2022).
  28. R2CITIES—Best-Prectices. Best Practices Book. 2019. Available online: http://r2cities.eu/kdocs/1908157/r2cities_best_practices_book.pdf (accessed on 30 July 2022).
  29. JPI-UE. “SET-Plan ACTION n°3.2 Implementation Plan Europe to Become a Global Role Model in Integrated, Innovative Solutions for the Planning, Deployment, and Replication of Positive Energy Districts”. 2018. Available online: https://jpi-urbaneurope.eu/wp-content/uploads/2021/10/setplan_smartcities_implementationplan-2.pdf (accessed on 27 June 2022).
  30. Maas, N.; Georgiadou, V.; Roelofs, S.; Lopes, R.; Pronto, A.; Martins, J. Implementation Framework for Energy Flexibility Technologies in Alkmaar and Évora. Energies 2020, 13, 5811. [Google Scholar] [CrossRef]
  31. Andreanidou, K.; Bertoldi, P.; Dallemand, J.; Follador, M.; Glancy, R.; Hernandez Gonzalez, Y.; Iancu, A.; Kilkis, S.; Kona, A.; Labanca, N.; et al. Guidebook ’How to Develop a Sustainable Energy and Climate Action Plan (SECAP)—Part 1—The SECAP Process, Step-by-Step towards Low Carbon and Climate Resilient Cities by 2030; Publications Office of the European Union: Brussels, Belgium, 2018. [Google Scholar]
  32. Moir, E.; Moonen, T.; Clark, G. What Are Future Cities? Origins, Meanings and Uses. Bus. Cities Foresight Future. Cities Proj. Future. Cities Catapult. 2014; p. 98. Available online: https://assets.publishing.service.gov.uk/government/uploads/system/uploads/attachment_data/file/337549/14-820-what-are-future-cities.pdf (accessed on 30 July 2022).
  33. Foresight. Future of Cities: The Science of Cities and Future Research Priorities, Office for Science, A Report by the Project’s Lead Expert Group. Government, Office for Science. 2016. Available online: https://www.gov.uk/government/uploads/system/uploads/attachment_data/file/516407/gs-16-6-future-cities-science-of-cities.pdf (accessed on 30 July 2022).
  34. Smarter Together. Smart and Inclusive Solutions for a Better Life in Urban Districts. 2018. Available online: https://www.smarter-together.eu/ (accessed on 25 February 2021).
  35. Smarter Together—Vienna. Urban Renewal with a Vision & Method, Vienna’s Final Report on Its Share in the EU-Funded H2020/SCC1 Project. Stadt Wien, Technische Stadterneuerung 1200 Wien, Maria-Restituta-Platz 1. Vienna. 2021. Available online: https://www.smartertogether.at/final-report-with-a-vision-and-method/ (accessed on 27 June 2022).
  36. Neuman, H.; Hainoun, A.; Ponweiser, W.; Ruess, P. Assessment of the Lighthouse Project Smarter Togerth, D6.5.1; AIT Austrian Institute of Technology: Vienna, Austria, 2021. [Google Scholar]
  37. Neuman, H.; Hainoun, A.; Ponweiser, W.; Heiss, G. Monitroing Documentation, Samrter Together, D6.3.1; AIT Austrian Institute of Technology: Vienna, Austria, 2021. [Google Scholar]
  38. Smarter Together—Munich. Smarter Together, Munich. Activities and Achievements 2016–2021 of the EU-Smart-City-Project ‘Smarter Together’ in Munich. City of Munich. 2021. Available online: https://www.wirtschaft-muenchen.de/produkt/smarter-together-muenchen/ (accessed on 21 October 2021).
  39. München, Landeshauptstadt. Teilmaßnahme Neuaubing-Westkreuz. Landeshauptstadt München, Referat für Stadtplanung und Bauordnung, Stadtsanierung und Wohnungsbau. 2020. Available online: https://www.muenchen.de/rathaus/Stadtverwaltung/Referat-fuer-Stadtplanung-und-Bauordnung/Stadtsanierung/Neuaubing-Westkreuz.html (accessed on 21 October 2021).
  40. BMUB. Climate Action Plan 2050: Principles and Goals of the German Government’s Climate Policy. N. C. Federal Ministry for the Environment, Building and Nuclear Safety. 2016. Available online: https://www.bmu.de/fileadmin/Daten_BMU/Pools/Broschueren/klimaschutzplan_2050_en_bf.pdf (accessed on 21 October 2021).
  41. Stoppel, V.; Klassen, B. EU-Project Smarter Together Munich Documentation of Activities and Achievements: February 2016–January 2019. Munich. 2019. Available online: http://www.wirtschaft-muenchen.de/publikationen/pdfs/Smarter-Together-Muenchen-Documentation19-en.pdf (accessed on 21 October 2021).
  42. Hainoun, A.; Neumann, H.-M.; Schneeberger, N. Establishing an Integrated Monitoring Concept for the Vienna Lighthouse Project Smarter Together in REAL CORP 2019 Proceedings/Tagungsband. 2019, pp. 311–318. Available online: http://repository.corp.at/id/eprint/595 (accessed on 21 October 2021).
  43. Morishita-Steffen, N.; Alberola, R.; Mougeot, B.; Vignali, É.; Wikström, C.; Montag, U.; Gastaud, E.; Lutz, B.; Hartmann, G.; Pfaffenbichler, F.; et al. Smarter Together: Progressing Smart Data Platforms in Lyon, Munich, and Vienna. Energies 2021, 14, 1075. [Google Scholar] [CrossRef]
  44. EC. EU Mission: Climate-Neutral and Smart Cities. 2022. Available online: https://ec.europa.eu/info/research-and-innovation/funding/funding-opportunities/funding-programmes-and-open-calls/horizon-europe/eu-missions-horizon-europe/climate-neutral-and-smart-cities_en (accessed on 30 July 2022).
  45. Hainoun, A.; Etminan, G. Towards energy optimized cities. TECHNE J. Technol. Archit. Environ. 2018, 1, 68–72. [Google Scholar] [CrossRef]
  46. EC. Positive Clean Energy Districts, Research and Innovation Actions to Support the Implementation of the Climate-Neutral and Smart Cities Mission (HORIZON-MISS-2021-CIT-02). 2021. Available online: https://ec.europa.eu/info/funding-tenders/opportunities/portal/screen/opportunities/topic-details/horizon-miss-2021-cit-02-04 (accessed on 10 April 2021).
Figure 1. Clusters of co-created, smart, and integrated solutions implemented within the Smarter Together project [34].
Energies 15 06907 g001
Figure 2. Lighthouse cities (LHCs) and follower cities (FCs) of the Smarter Together project as well as the LHCs of other EU projects that started in 2014.
Energies 15 06907 g002
Figure 3. The Confluence district in Lyon (left) and Cité Perrache building after refurbishment (right). © SPL Lyon Confluence [36].
Energies 15 06907 g003
Figure 4. Neuaubing–Westkreuz in Munich (left) and Radolfzeller Str. 40–46 building after refurbishment (right) (Stoppel & Klassen, 2019) [41]. The project area is outlined with a dotted gray line.
Energies 15 06907 g004
Figure 5. Simmering district in Vienna (left) and Hauffgasse 37–47 after refurbishment (right) [35].
Energies 15 06907 g005
Figure 6. Flow diagram of the integrated monitoring process for the demonstration sites of the LHCs.
Energies 15 06907 g006
Figure 7. Schematic monitoring setup of the building complex of Hauffgasse, Vienna demonstration site.
Energies 15 06907 g007
Figure 8. Main steps of the cleaning process for the measured raw data.
Energies 15 06907 g008
Figure 9. Monitoring data from the space-heating consumption meter for the accumulated meter data and the hourly heat consumption, Hauffgasse, Vienna.
Energies 15 06907 g009
Figure 10. Monthly space-heat demand for 2019 and 2020, Hauffgasse, Vienna.
Energies 15 06907 g010
Figure 11. Monitored data of PV production on 8th and 9th August, Hauffgasse, Vienna. 8th and 9th August 2019.
Energies 15 06907 g011
Figure 12. Monitoring data of electricity consumption of elevators, lighting, substations and ventilation, 61 Delandine, Lyon.
Energies 15 06907 g012
Figure 13. Climate-adjusted annual space-heating demand determined as weighted average value over the whole refurbished floor area (for each LHC as well as all LHCs).
Energies 15 06907 g013
Figure 14. Specific final energy saving, and CO2 emission reduction determined as weighted average value over the whole refurbished floor area (for each LHC as well as all LHCs).
Energies 15 06907 g014
Figure 15. Monthly electricity production of the implemented roof-top PV panels selected among the three LHCs (a) in Lyon, (b) in Munich and (c) in Vienna.
Energies 15 06907 g015
Table 1. Key specifications of the demonstration sites of the three LHCs.
ThemeClassificationLyonMunichViennaall LHCs
Demo siteCity District (demonstration site)La Confluence, Neuaubing–Westkreuz, Simmering -
Project Area [ha]150 ha350 ha15 ha515 ha
Type of ownershipsocial housing and MOBsMOBsSocial housings and cooperatives-
Age of the Building Stoc1950s–1970s1960s-early 1980s1880–1918, and after WW2
Holistic refurbishmentRefurbished floor area [m2]35,06913,28369,145117,497
New added floor areas [m2]n/an/a12,44612,446
Eco-refurbishment (residential building)Total floor area [m2]28,64013,28373,711.4115,634
Number of flats [units]4931487111352
Eco-refurbishment (non-residential/ public buildings)Total floor area [m2]6428.6n/a788014,308
Energy-supply measures Installed PV capacity [kWp]449 1239145833
Installed solar thermal and geothermal [kW]n/a13,00015713,157
Battery storage capacity [kW]n/a800n/a800
1 An additional 174 kWp was installed on an independent new constructed private building that is not part of holistic refurbishment.
Table 2. Technical specifications of the implemented and monitored building and RES solutions of the three LHCs.
Implemented SolutionsUnitAll LHCs LyonMunichVienna
Refurbished floor aream2117,497.0835,069.113,283.069,145.0
New constructed aream212,446.380.00.012,446.4
Installed PV capacitykWp833.00449.0239.0145.0
Installed solar thermal capacitykW350.00.035
Installed geothermal capacitykW13,122.000.013,000.00122
Total installed RES capacity, thermalkW13,157.000.013,000.00157.0
Total installed RES capacity, (thermal and electric)kW13,990.00449.013,239.0302.0
Battery storage capacity kW800.000.0800.00.0
Table 3. List of the extracted KPIs to evaluate the impact of building energy solutions for low-energy districts in the Smarter Together project.
KPIsUnitDescription
Refurbished floor aream2Gross floor area of the refurbished building
New constructed aream2gross floor area of new aditional attic dwellings constructed on the roof-top of the refurbished buildings
Energy savings by building-efficiency measuresMWh/aenergy saving achieved through thermal building refurbishment (building envelop)
specific space-heat demand kWh/ m2.aUseful annual space-heat demand per gross floor area (before and after the refurbishment)
relative improvement of building performance%relative reduction of specific annual space-heat demand (ratio of after refurbishment to the baseline value)
CO2 reduction achieved by building-efficiency measurestCO2/aannual CO2 emission reduced due to reduced fossil fuel consumption for building heat demand (only building demand-side measures)
Installed RES capacity, Electricity (PV)kWpinstalled renewable energy capacity for power generation (PV panels)
Installed RES capacity, Heating kWinstalled renewable energy capacity for heat production (total and disaggregated for solar thermal. Heat pump and geothermal)
Total Installation of RESkWinstalled renewable energy capacity for power and heat production
Electricity generated by PVMWh/aannual electricity generation by PV
Thermal energy generated by RES MWh/aannual heat generation by renewable options (total and disaggregated for solar thermal, heat pump and geothermal)
Total production of RESMWh/atotal annual energy generation by all RES options
Battery storage capacity kWcapacity of installed battery for electricity storage
Electricity saving of common space area MWh/aannual electricity saved due to the replacement of lamp in exterior building area and staircases and elevators retrofitting
CO2 reduction achieved by energy-supply measurestCO2/aannual CO2 emission reduced due to the substitution of fossil fuel consumption through renewable heat and power production
Total CO2 reduction by energy measurestCO2/aTotal annual CO2 emission reduction by all demand and supply measures
Total specific energy saving kWh/m2.atotal energy saving by building energy-efficiency measures relative to building floor area
Total specific CO2 reductionkg-CO2/m2.aTotal annual CO2 emission reduction by all demand and supply measures relative to building floor area
Publisher’s Note: MDPI stays neutral with regard to jurisdictional claims in published maps and institutional affiliations.

