

Assessment of the Impact of Renewable Energy Expansion on the Technological Competitiveness of the Cogeneration Model
Department of Mechanical System Engineering, Sookmyung Women’s University, 100 Cheongpa-ro 47-gil, Yongsan-gu, Seoul 04310, Korea
Energies 2022, 15(18), 6844; https://doi.org/10.3390/en15186844
Submission received: 12 August 2022
/
Revised: 15 September 2022
/
Accepted: 16 September 2022
/
Published: 19 September 2022
(This article belongs to the Topic Energy Saving and Energy Efficiency Technologies)
Abstract
:The rapid transition from an efficiency-oriented to a renewable energy-based green environment raises questions about the sustainability of cogeneration models in the coming era of climate change. For securing the technological competitiveness of a cogeneration model in terms of sustainability, it is essential to come up with alternatives that can flexibly respond to changes in the market conditions. From the surveyed field operation data of the cogeneration model applied to an apartment complex, it was found that the actual operation performance may differ significantly from the theoretical expectation. Through diagnostic simulation analysis, the main cause of the disappointing performance in the case of the current cogeneration model after installation has been assessed, and the importance of a consistent operation strategy was demonstrated by the event-based correlation analysis based on field operation data. The impact of the rapid expansion and dissemination of the renewable energy market on the relative primary energy savings benefit evaluation of the cogeneration model was analyzed for various operating conditions.
1. Introduction
The cogeneration model has been sufficiently proven as an effective means to achieve primary energy savings due to its high efficiency. However, it is interesting to note that the level of market dissemination of cogeneration models varies by country and does not necessarily coincide with the technical competitiveness in the market [1]. Since most of the support measures and technology dissemination policies currently being applied in the market can be said to be sustainable only when technical superiority is secured, whether it is able to maintain its technical edge in terms of relative primary energy savings (RPES) or greenhouse gas reduction will be a key factor in the further dissemination of cogeneration models. The literature dealing with the technical competitiveness of cogeneration or tri-generation models over separate heat and power (SHP) can be referred to without many difficulties [2,3,4,5,6,7]. J. Keristead et al. [3] has shown that the most cost-effective and energy-efficient scenarios require a mix of technology scales, including combined heat and power (CHP) plants of appropriate size for the total urban demand. H. Chen et al. [7] has proposed an innovative heat supply cogeneration system with a low-pressure feed water for the heat generation system, and it has been verified through an exergy analysis that a remarkably improved techno-economic performance can be attained with the newly proposed system configuration. However, several additional challenges to maintaining the sustainable role of the cogeneration model in the upcoming era of climate change exist. During conventional approaches to the assessment of the technical superiority of the cogeneration model, mainly focused on theoretical analysis, unlike the evaluation in actual field operation, the technological superiority of the cogeneration model tends to be somewhat exaggerated. In the actual field operation of a cogeneration system, various operating factors have a significant impact on the overall operating performance, such as energy load fluctuations, system failures, and operating strategies determined by the operator. Unfortunately, these factors are difficult to reflect in the existing theoretical approaches or have not been implemented properly. Practical performances that do not meet these expectations have had a negative impact on the market penetration of the cogeneration model. Therefore, rather than relying on a simplistic but too idealistic theoretical approach, it is becoming increasingly important to accurately recognize the market conditions in relation to operational performance in actual operating conditions. Although it has been verified that properly designed prime mover’s capacity is the prerequisite for securing economic benefits from the cogeneration model regardless of the field of application, and for any types of prime movers, etc. [8,9], the impact of operational strategies and detailed action plans on the annual total operational performance of cogeneration systems has not yet been fully demonstrated. Unlike the CHP-based district heating model that commonly applies the optimal management solution [10,11,12,13], in case of a small-scale cogeneration model being applied in a unit building, the same levels of operational management are rarely applied in the field due to the economics of scale. However, it should be noted that the operational performance in actual operations in the field varies greatly depending on whether a systematic operation strategy and planning is applied or not. From the perspective of the facility operator, it is the operational economic benefits that are of primary interest to operators, rather than the technical achievements such as RPES. Therefore, establishing an optimal operating strategy and planning under fixed operating conditions during the installation phase is an important step for maximizing profits during the operation phase.
Besides the importance of the operation strategy and planning to securing techno-economic benefits over SHP, the rapidly expanding renewable power supply environment is emerging as a big issue in the energy market related to the cogeneration model [14,15,16,17]. I. Pakere et al. [15] has presented a power-to-heat concept to determine how to integrate solar PV into DH systems in order to achieve an economically feasible, flexible energy production solution. J. Salpakari et al. [16] has presented models for optimal control of the power-to-heat conversion of heating systems and loads shift mechanisms in cities to incorporate large variable renewable power schemes. This is because the effect of nuclear and renewable power generation has been generally excluded when estimating the overall power conversion efficiency of SHP in the existing RPES evaluation process. K. Ericsson et al. [17] has estimated the technical potential of the power-to-heat model according to different power scenarios using renewable energy resources, and the power-to-heat model in the domestic market was estimated to be 8.6 TWh in maximum for a scenario with high proportion of wind and solar power production in Sweden. Since various support mechanisms or policies for the promotion of cogeneration models into the market are being executed under the assumption of its technical superiority and improved operational efficiency over SHP [18,19], the inclusion of the effects of rapidly increasing renewable power in the market can be postulated to bring about considerable changes in the competing business environment between the cogeneration model and SHP. However, an objective and reliable analysis for practically evaluating the ripple effect of renewable energy into the cogeneration market has not been sufficiently reviewed.
The main objective of this study was to evaluate the technological competitiveness of the cogeneration model in order to respond to changes in the market environment caused by climate change and to seek appropriate countermeasures. The optimal design of the prime mover capacity and the optimal energy management aspects of the cogeneration system were analyzed based on field operation data from installation cases at nine apartment complexes. To this end, a diagnostic simulation analysis was performed to check the adequacy of currently installed prime movers’ capacities using a simulation tool that was developed in-house. In addition, the importance of applying a systematic operation strategy and planning on securing techno-economic operational benefits from the cogeneration model were validated by event-based correlation analysis on the basis of field operation data. Finally, the impact of the rapid expansion and dissemination of the renewable energy market on the RPES benefit of the cogeneration system was evaluated for various operating conditions.
2. Operational Status of Cogeneration Model
2.1. Methodology for Evaluation of RPES
The RPES is defined as the ratio of the difference in primary energy consumption between two comparative energy generation methods. The amount of primary energy savings provided by cogeneration production shall be calculated on the basis of the following formula [20]:
where is the thermal efficiency of the cogeneration production defined as the annual useful heat output divided by the useful input used to produce the sum of the useful heat output and electricity, and denotes the thermal efficiency reference value for SHP, respectively. The and are the electrical efficiency of the cogeneration and separate electricity production, respectively. In general, in most literature, the RPES is theoretically evaluated through parametric calculations. However, the main disadvantage of this simple but theoretical approach is that it is difficult to obtain detailed information about the dynamic behavior of the system under time-based operational control. Nevertheless, RPES has been widely used to evaluate the technical performance of CGS compared to SHP. In particular, it is a suitable means to verify the operational efficiency between two comparative energy supply systems over a period of time.
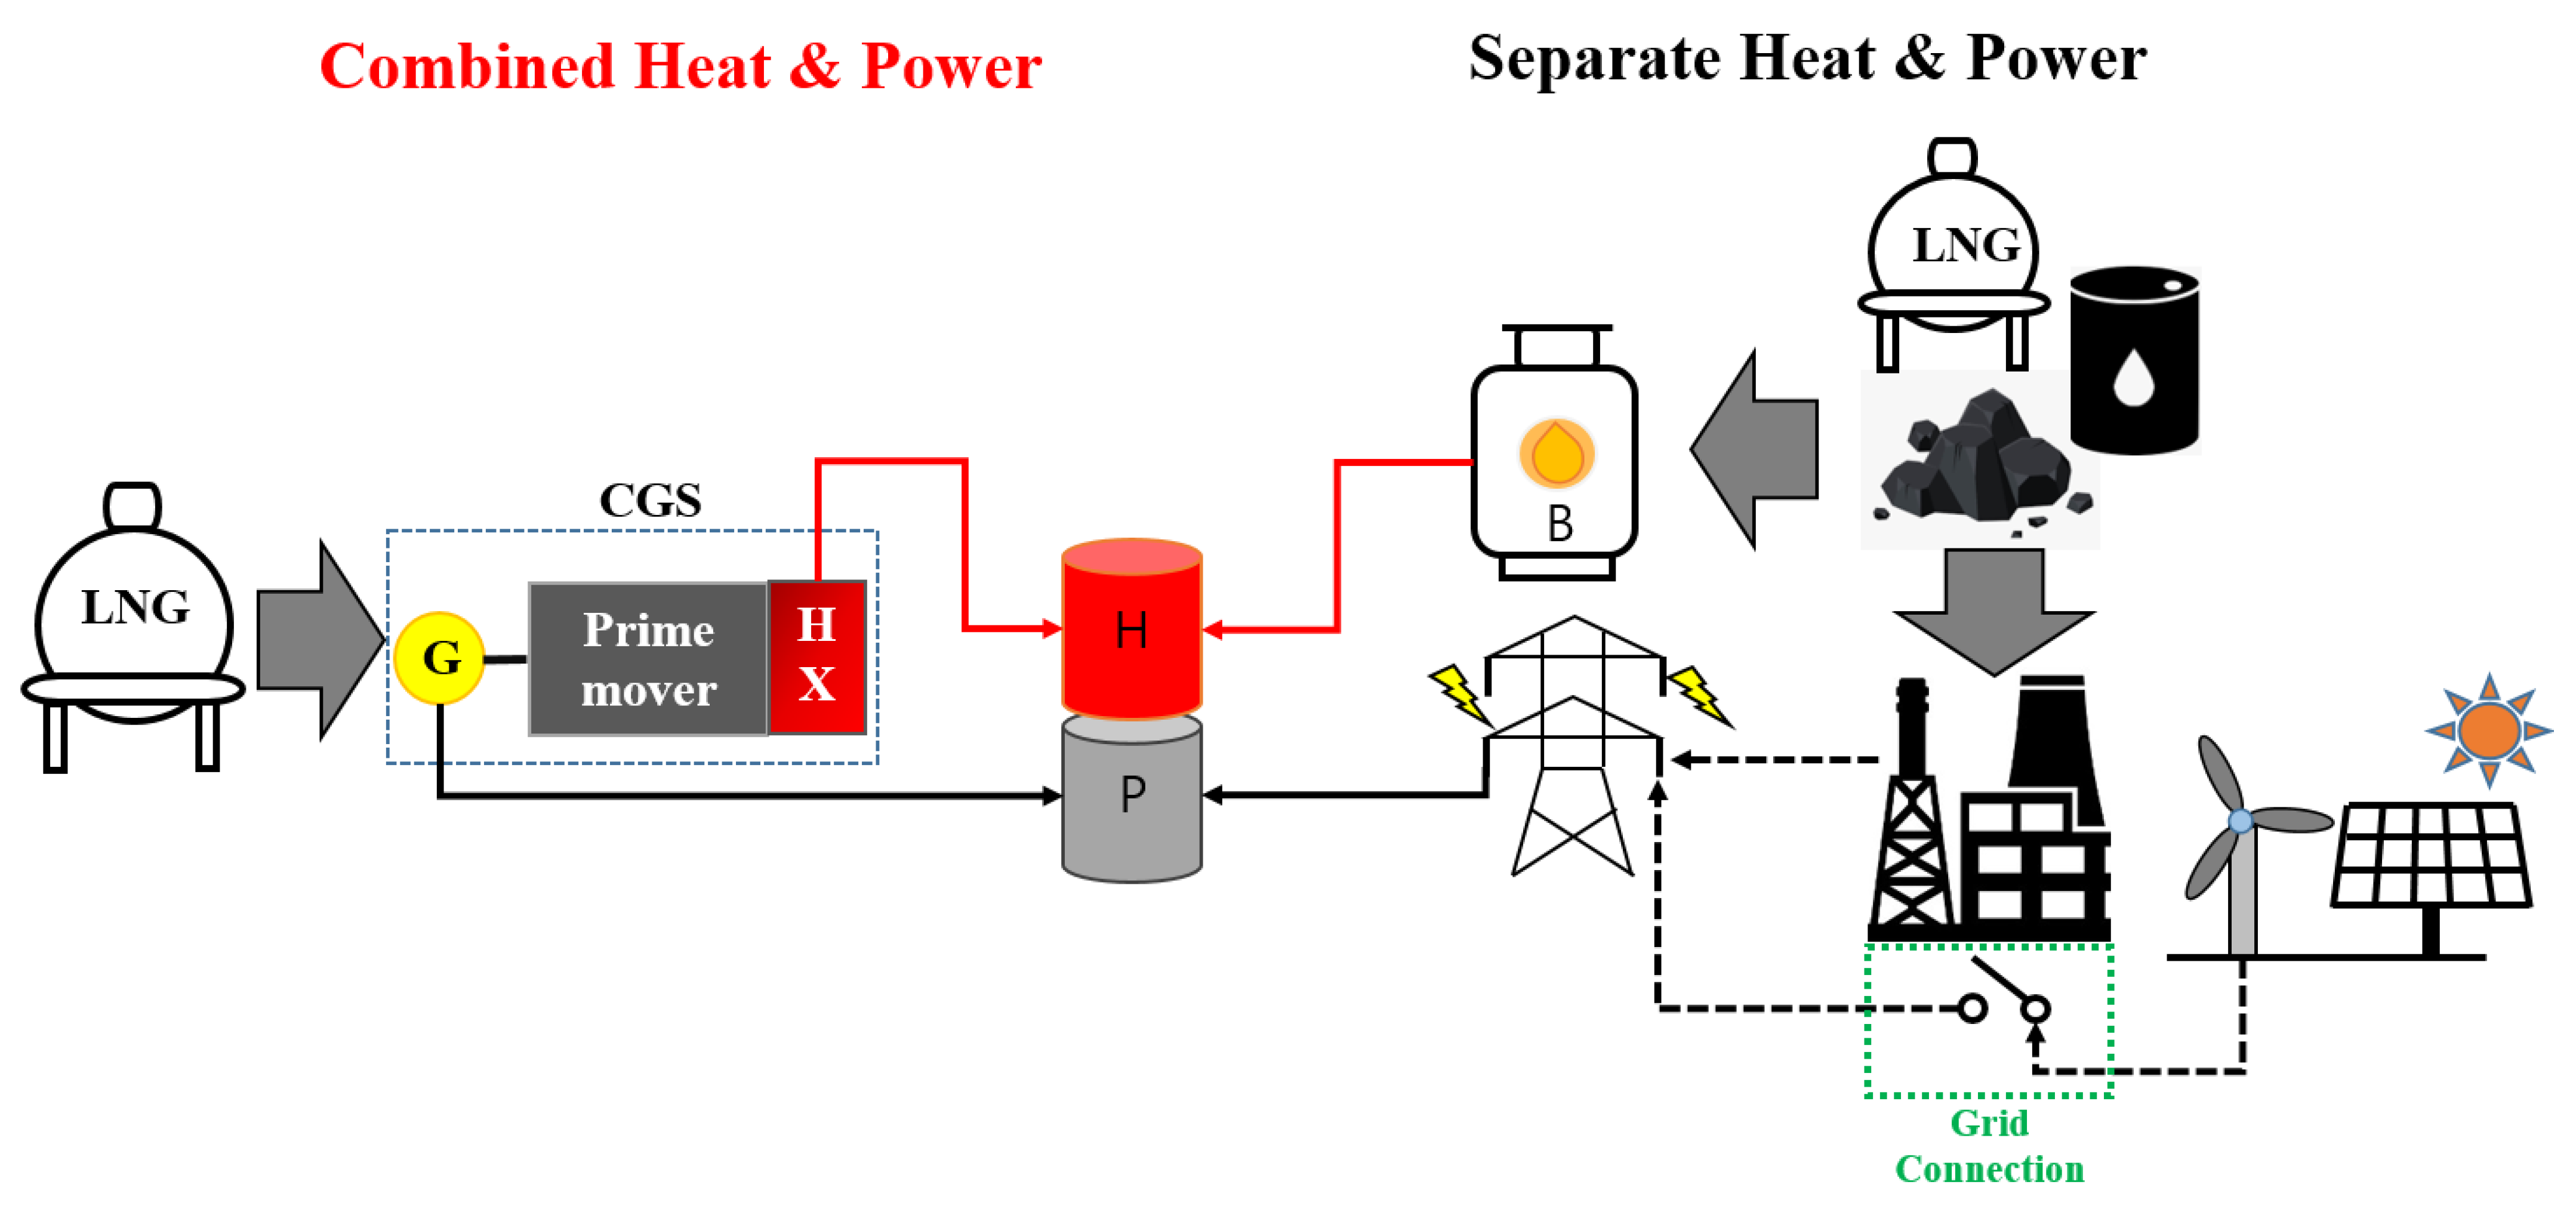
Figure 1 shows the illustrative diagram of the procedure used to calculate RPES of a cogeneration system. In the evaluation of RPES, it should be noted that the reference amount produced by the two comparative energy generation methods, CGS and SHP, should be consumption, not production. In other words, unutilized recovered heat from the operation of a CHP’s prime movers should not be included in the reference amount of heat produced for RPES calculation. This is because RPES can be regarded as the index for measuring the operational efficiency rather than the system efficiency. Due to the vague guidelines for handling the recovered heat from the operation of the CHP’s prime movers, it often misleads one to include the quantity in the evaluation of RPES, resulting in non-objective results. Great care must also be taken in selecting the input values for energy loss parameters such as transmission loss in the power grid or the transportation loss in a thermal grid, etc.
RPES values evaluated using actual field operation data, such as those in this study, can remove a lot of uncertainty from the analysis stage so that reliable analysis results can be obtained. In order to evaluate the technical and economic competitiveness of the cogeneration model in the market, the actual operating conditions after the installation of a cogeneration system were investigated in this study.
Table 1 shows information on the design and actual operating conditions for the investigated apartment complexes. From the survey of real operating conditions, detailed daily operation data such as fuel consumption, electricity and heat production, and the daily operating hours for each facility were obtained and utilized for assessment of the operational performance. From Table 1, it can be seen that various cogeneration system configurations consisting of single or multiple prime movers are being designed and installed in order to meet various energy demands of apartment complexes. In Table 1, the normalized operational cost-benefit is calculated by dividing the investigated annual total operating profit by the total capacity of the installed prime mover, which is one of the main indicators of economic feasibility for each application case. The annual total RPES, a representative technical indicator of operational efficiency, is also shown in Table 1, and large deviations are observed between the cases.
Figure 2 shows the relationship between the key operational performance indicators, the RPES, and the operational cost–benefit for the cases from the survey. At first glance, it may seem that technical excellence can bring economic benefits, but the figure shows that, in actual operating conditions in the market, this may not be the case. More than half of the cases studied were determined to be achieving RPES values of less than 10%, indicating that the energy-saving performance was below theoretical expectations. This also shows that high energy-saving performance does not necessarily lead to good economic benefits. Even given that economic profits are prioritized over technical operational benefits in actual operations management, the inconsistent relationship between the two key operating variables is sufficient to encourage the performance of diagnostic analysis simulations in order to elucidate the underlying reasons, as follows.
2.2. Diagnostic Analysis Simulation
In order to properly evaluate whether the installed capacity of the prime mover is adequately designed, an annual hourly dynamic operation simulation tool that can grasp the system operating characteristics was utilized in this study. For the optimal design of a standalone cogeneration system or a CHP-based district heating system, a dynamic operation simulation tool consisting of three separate modules was developed [21,22,23].
In Figure 3, a simplified flowchart for the diagnostic simulation procedure can be seen. First, the building load estimator predicts the required demand patterns for electricity, heating, hot water, and cooling based on the characteristics of the selected buildings. The load estimator produces two main results that are exported to the subsequent processes, i.e., the operation simulation and economic assessment.
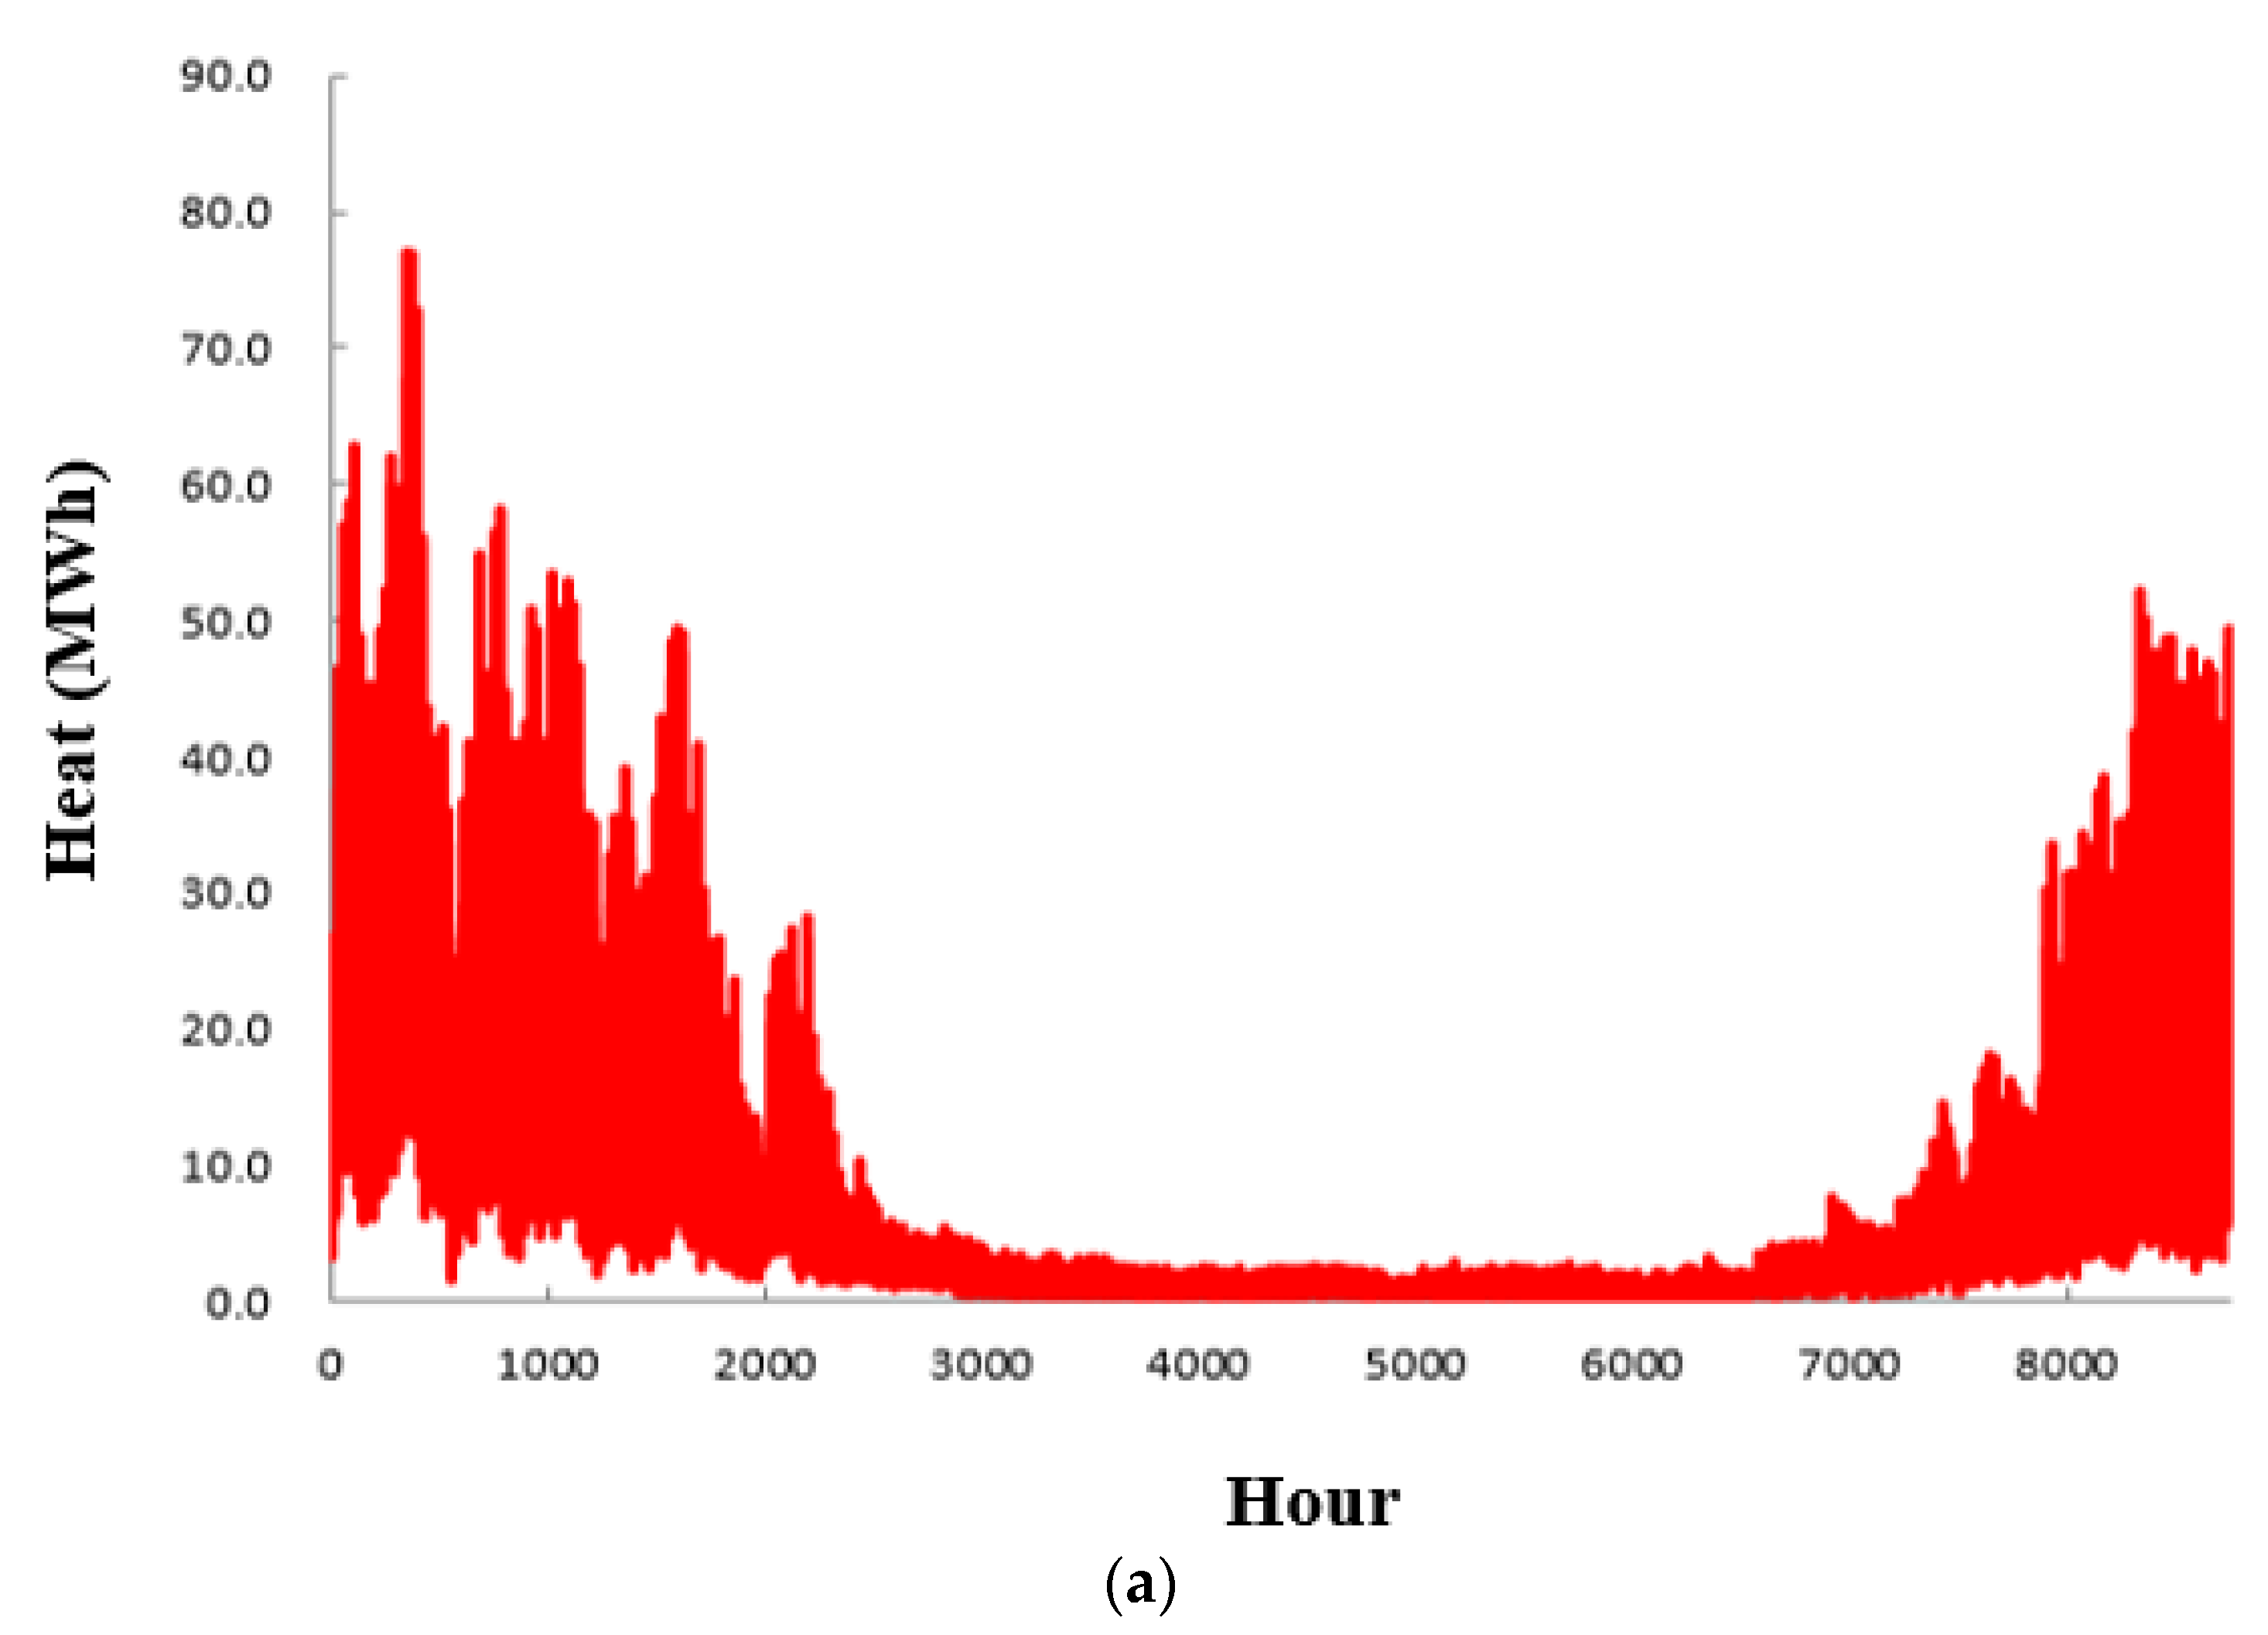
The first result consists of the annual maximum values (or the peak loads), which are important for the device selection process. Device capacities are optimally selected for each scenario by balancing the purchase cost or operation efficiency. The total capacity of prime movers, or type of chillers, is selected based on the peak load, and the number of devices is optimized to around six to nine scenarios. As a result, the load balancing pattern is similar throughout all the scenarios. The second important result that the load estimator generates is the load profile in the form of a time series. Figure 4 shows an example of 8760 hourly data for a year for each of the electricity, heating, hot water, and cooling loads. For more detailed information on load prediction, please refer to the relevant literature [21]. This hourly time step can be considered to be sufficiently fine for the physical size of the problem in order to capture the detailed system behavior of a CHP-based energy supplying system. If we use too big a time step in the simulation, then the effects of the hourly pattern of energy demand are not properly reflected in the operational simulation. The device selection process is technical in content, and detailed information can be found in the literature. The simulation tool contains a database for devices such as engines and refrigerators. Each record contains detailed technical information, such as the thermal efficiency and recovery efficiency, as functions of the part–load fraction. Based on the hourly energy balance evaluation between the demand and supply, annual hourly profiles for the various operating variables in the physical domain can be calculated, and the operating characteristics of the proposed system can be systematically summarized by the scenario in order to determine the best scenario or can examine the effects of the design parameters on the system performance.
3. Operational Simulation of Cogeneration System
3.1. Diagnostic Simulation for a Case of Good Performance
Among the investigated installation cases, Case A is estimated to have achieved the best technical performance in terms of RPES. However, the economic performance did not reach the level corresponding to the best performance in primary energy saving. Table 2 shows the design information and the cogeneration system configuration for Case A. It consists of a single 385 kW gas engine prime mover, a 7.5 Gcal auxiliary boiler, and 62 tons of heat storage tanks for hot tap water supply, not for heating. It should be noted that the hot tap water tank is not related to the supply of heating demand.
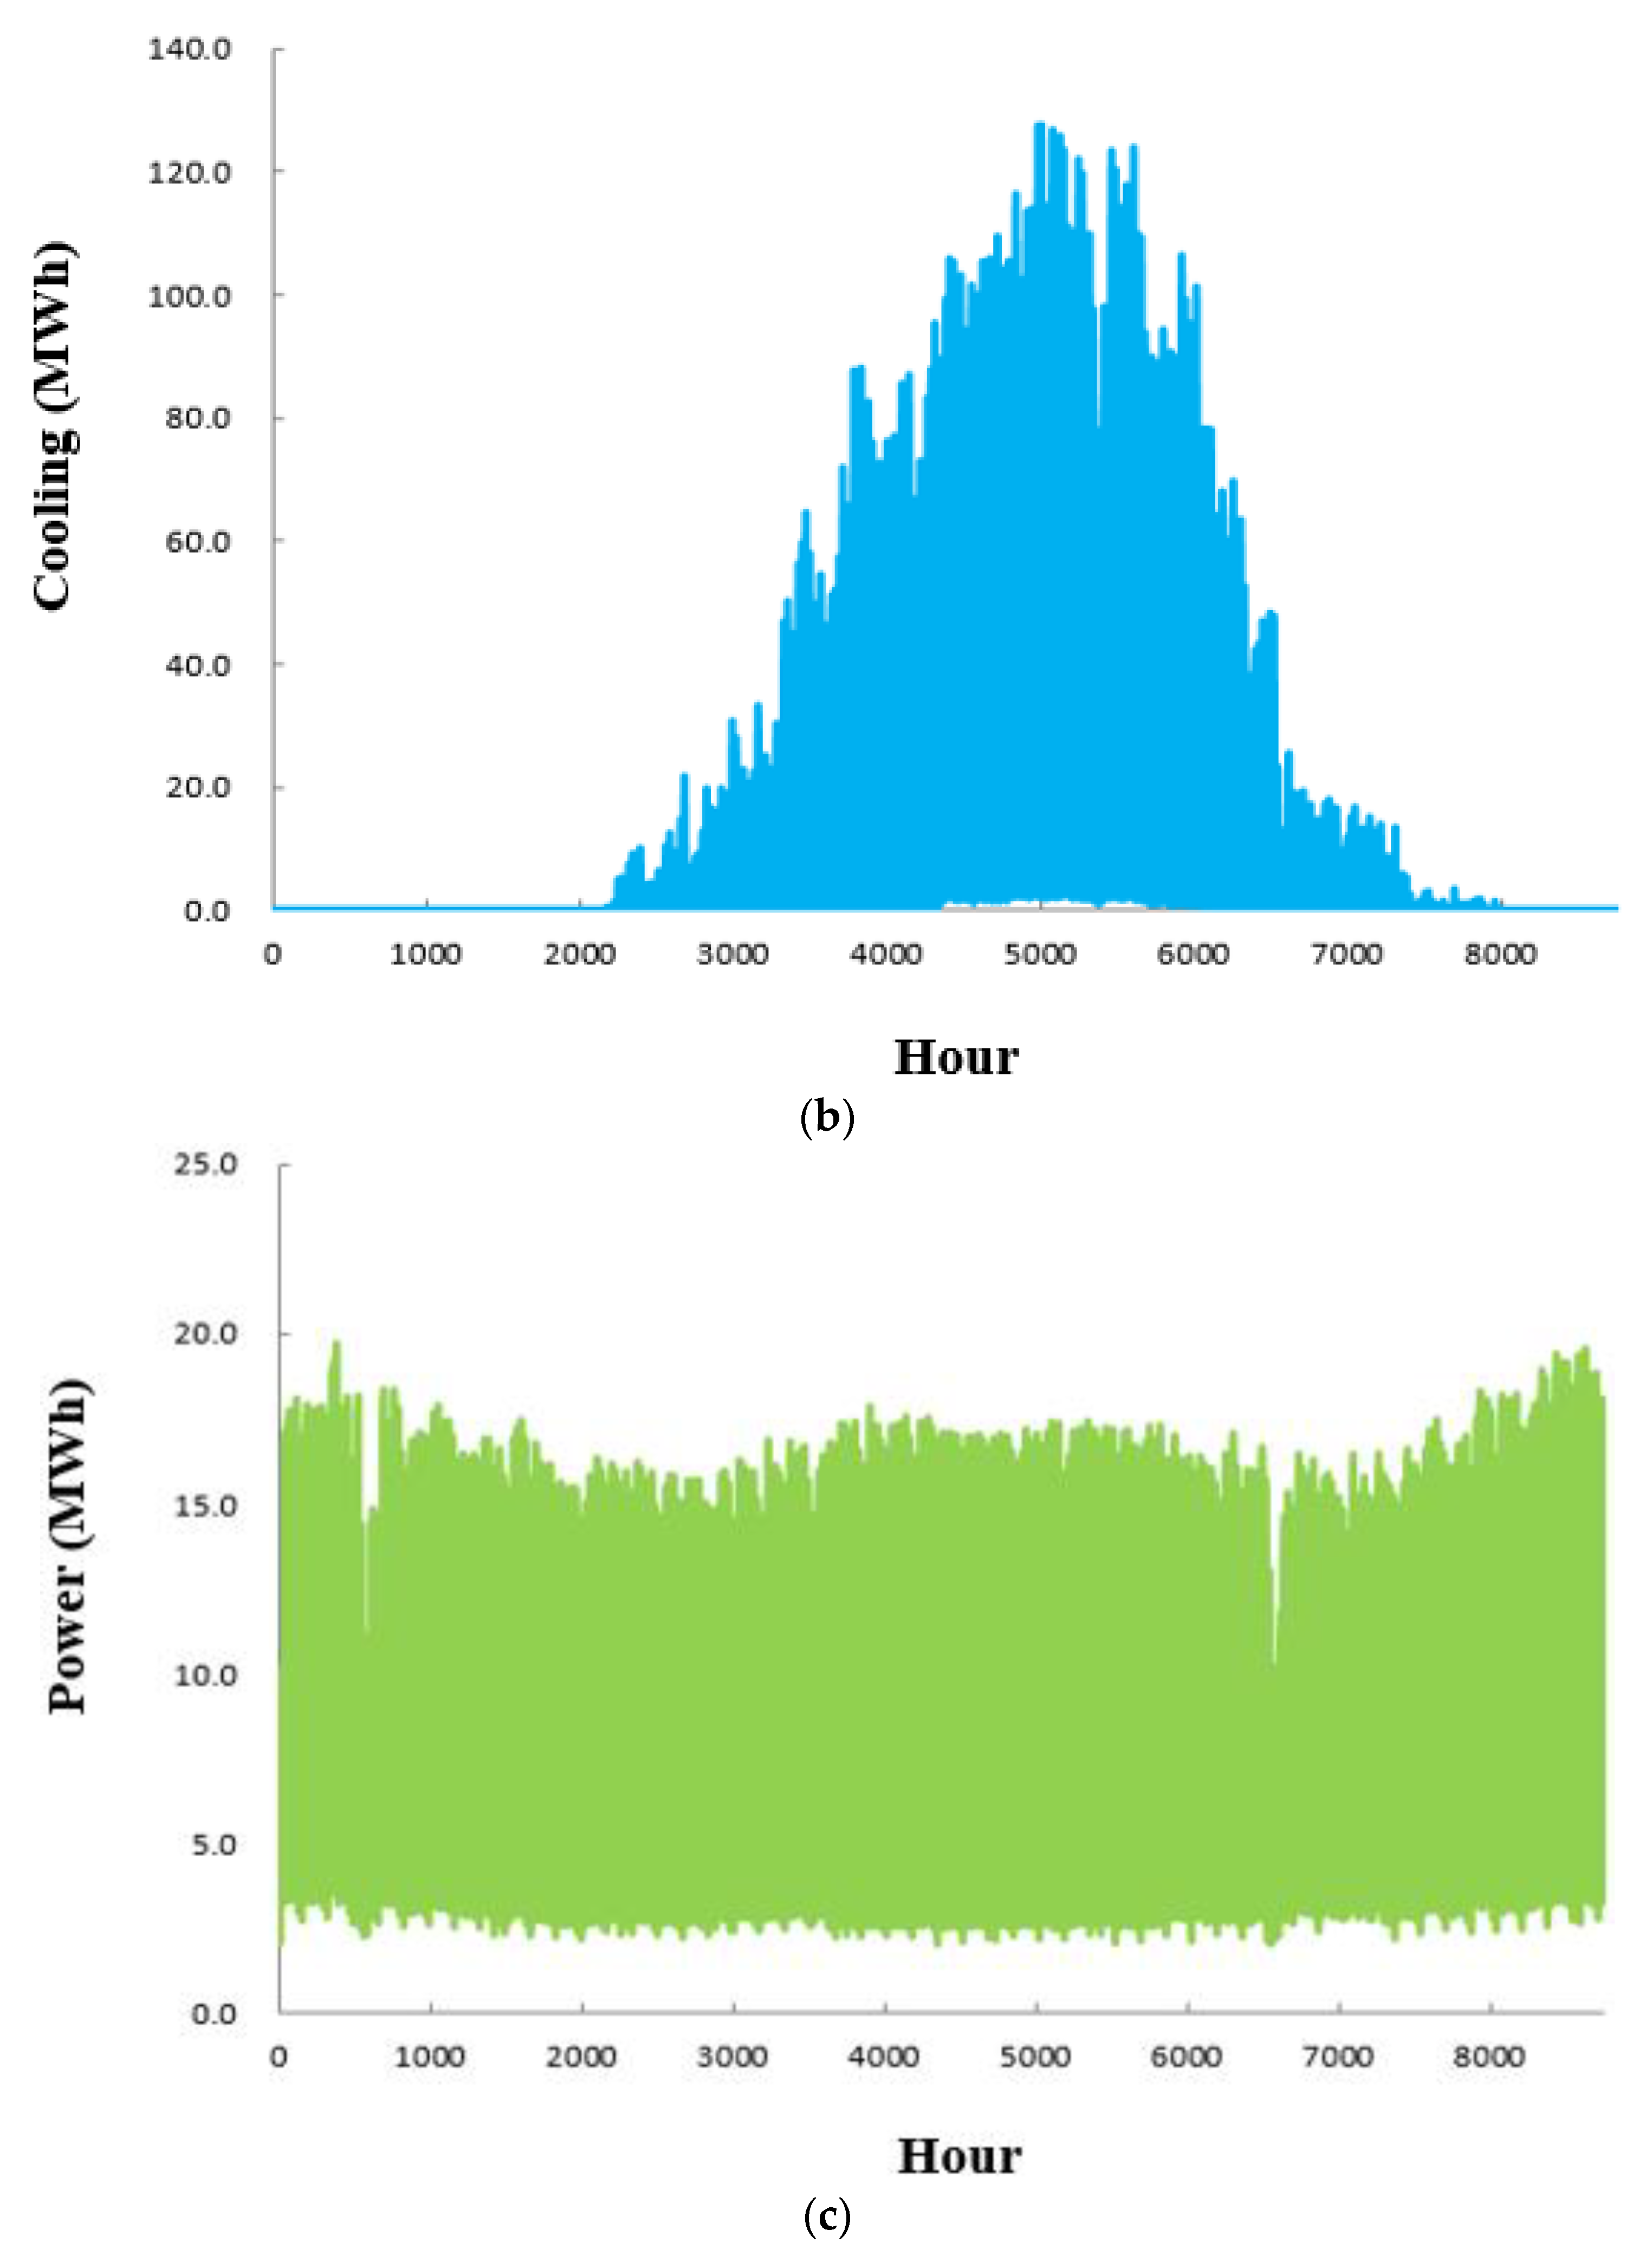
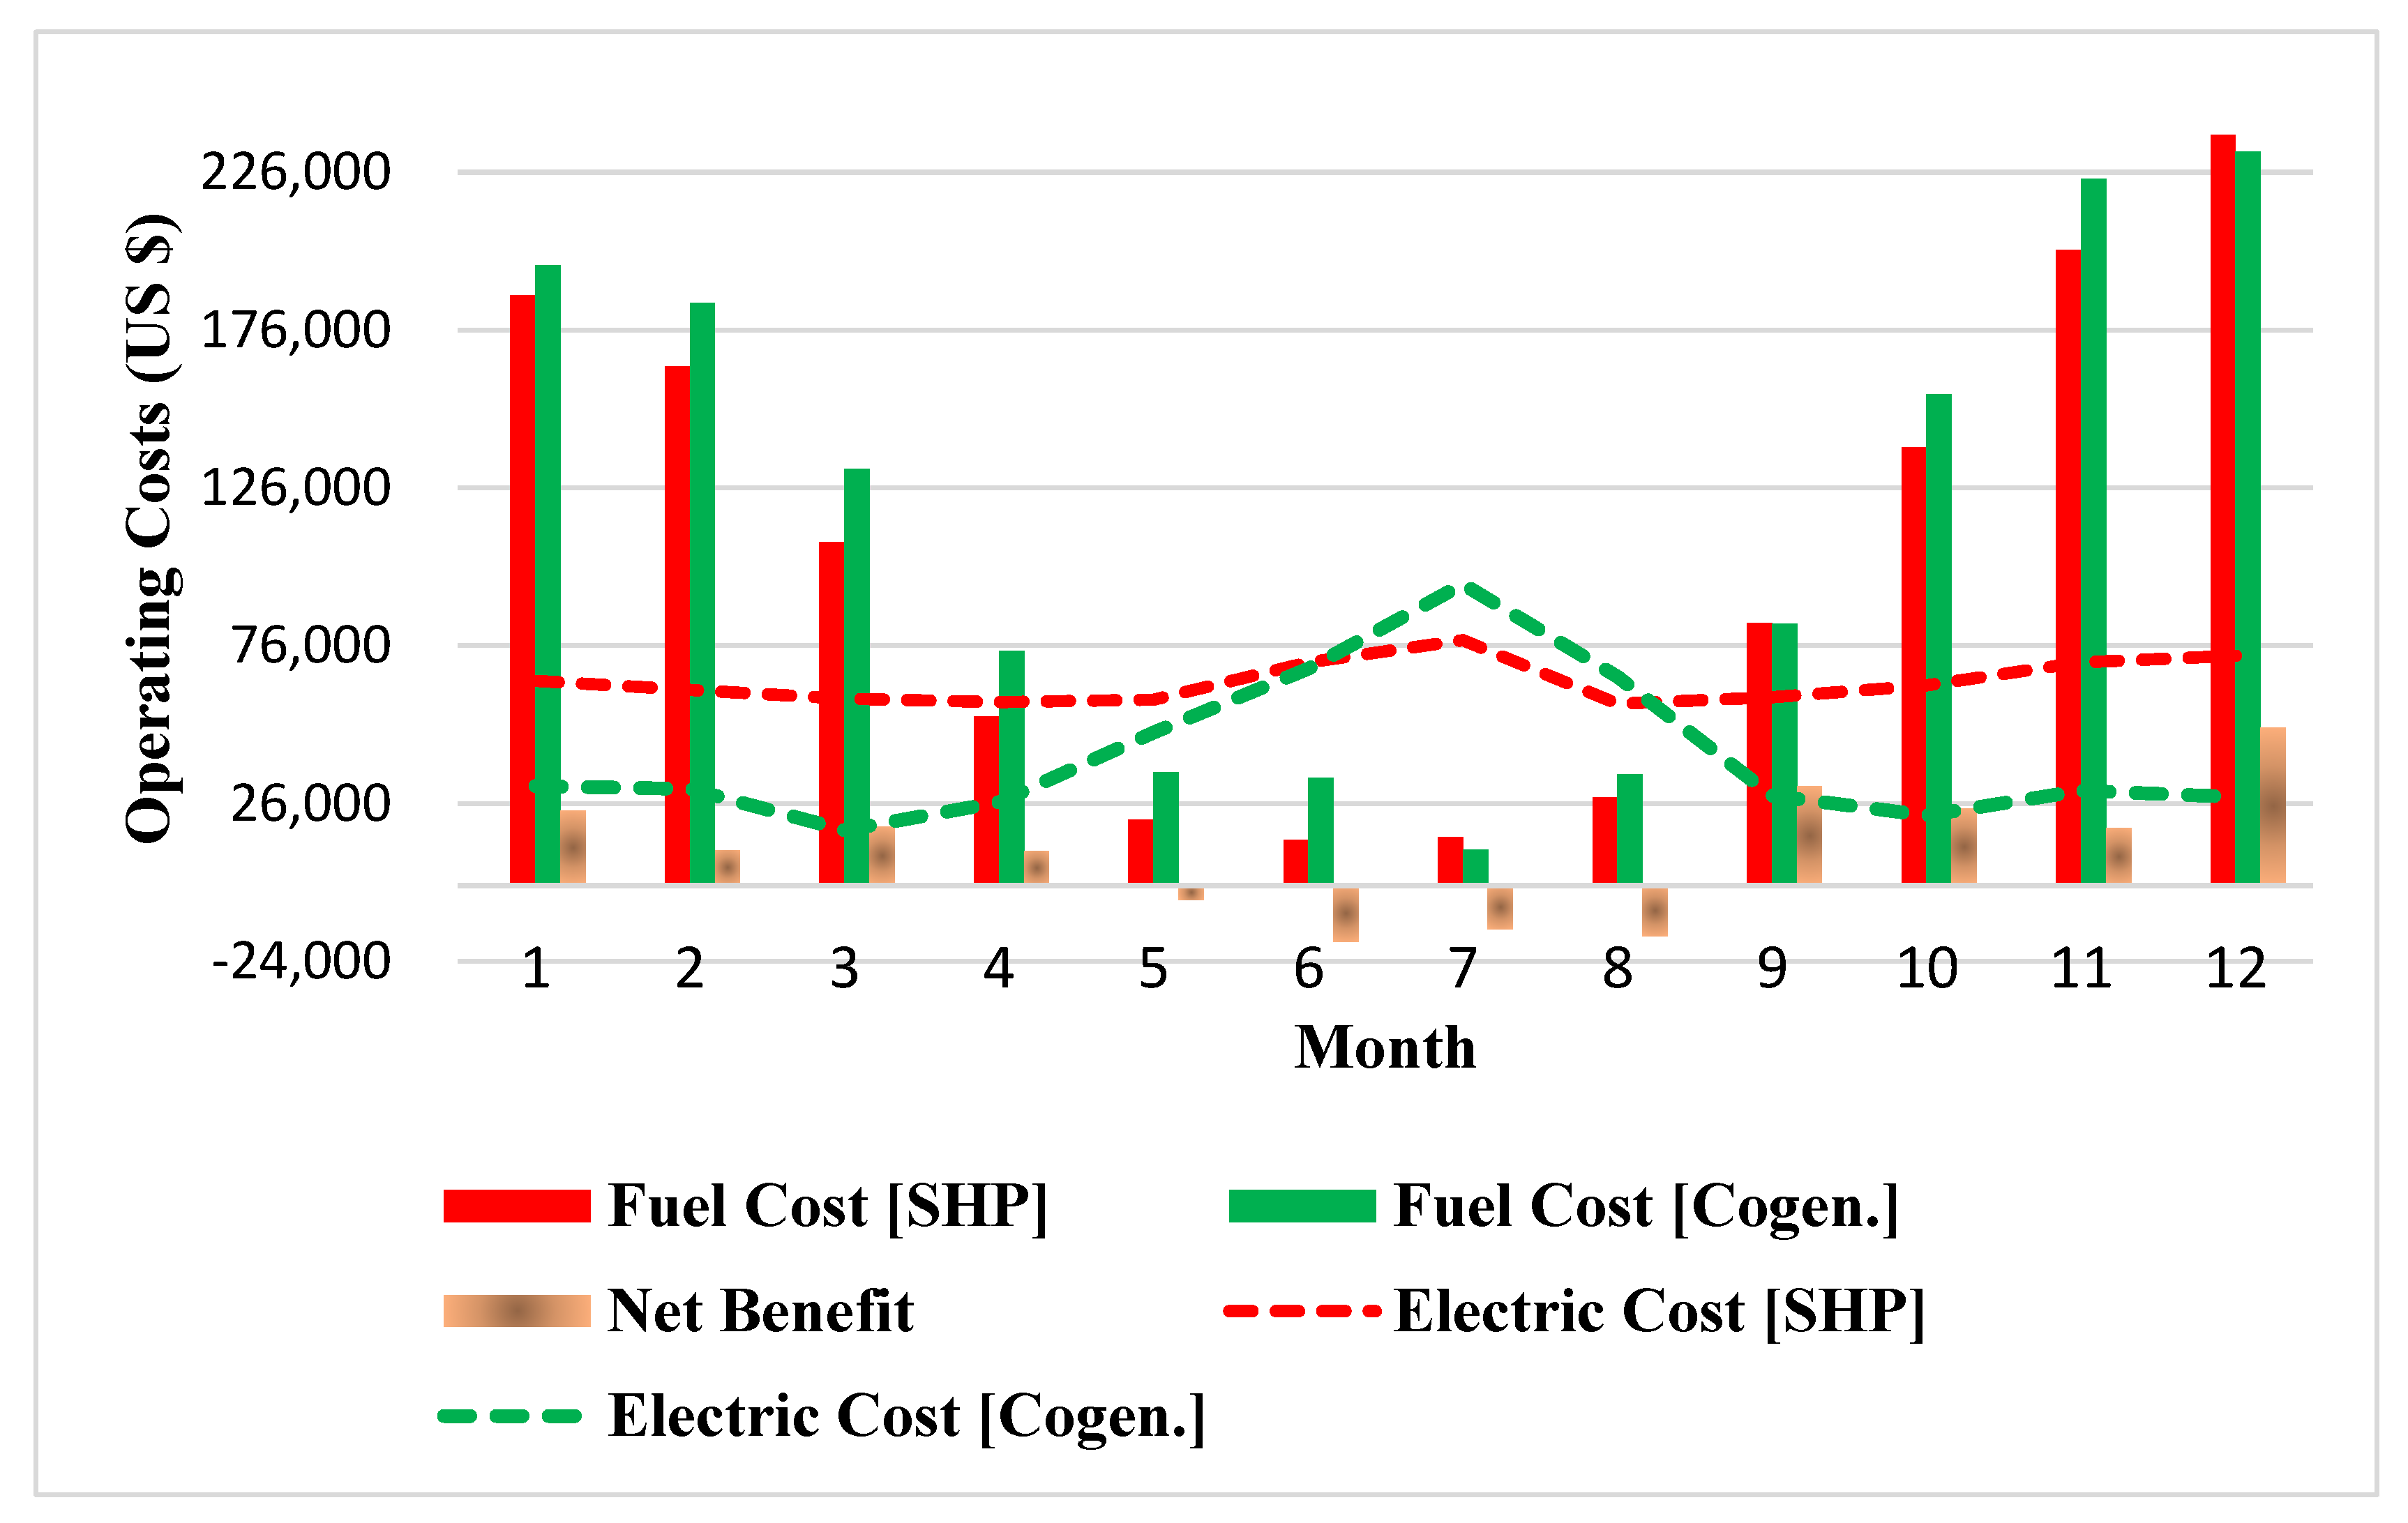
Figure 5 shows a comparison of the monthly operating cost and the net benefits before and after the installation of the cogeneration system. It can be seen that the electricity bill was greatly reduced due to the effect of peak-cut of the grid’s power consumption by the cogeneration system. It is also shown that the overall operating cost reduction tends to decrease as the heating load decreases, such as in summer. This is because much of the excess heat recovered from the prime mover is wasted due to the lack of a heating load or heat-driven cooling load. As shown in Figure 5, it can be seen that the total operating cost benefit is mainly determined by the difference between the fuel cost increase due to the operation of the cogeneration system and the electricity cost savings due to the peak-cut effect on the self-power supply of cogeneration system. It should be noted that the same unit price for fuel, i.e., LNG, was applied to individual boilers for SHP and CGS.
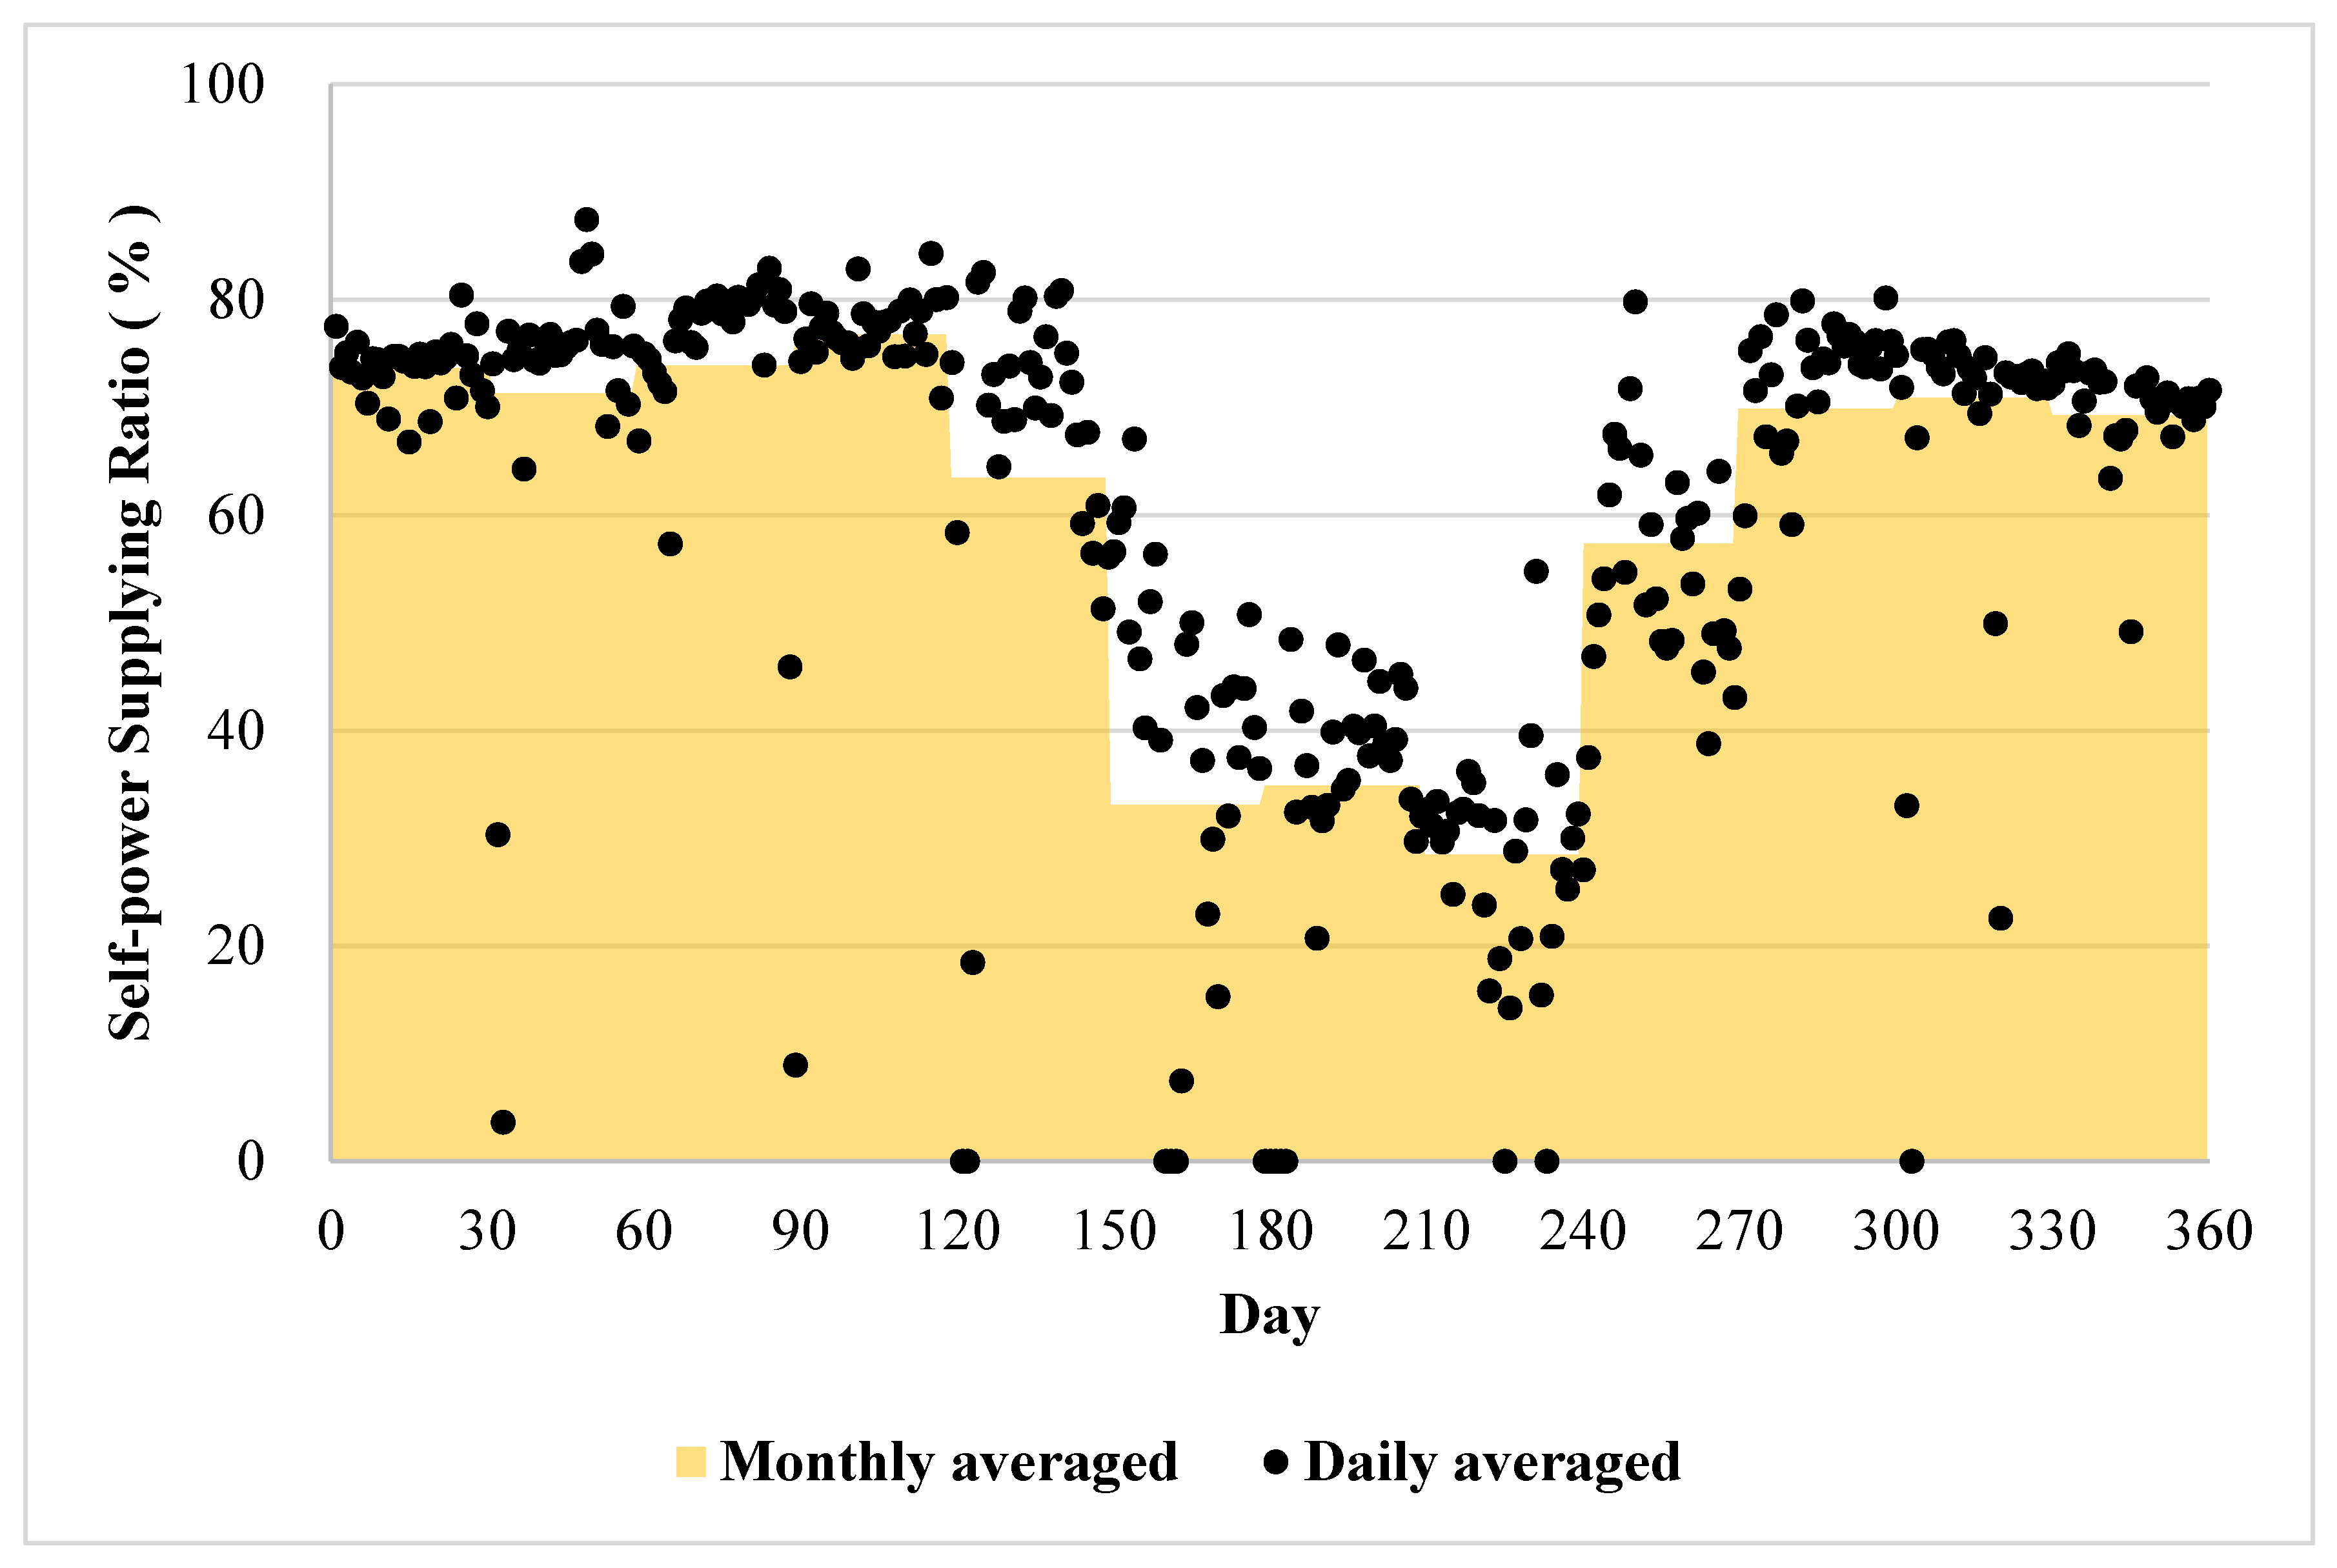
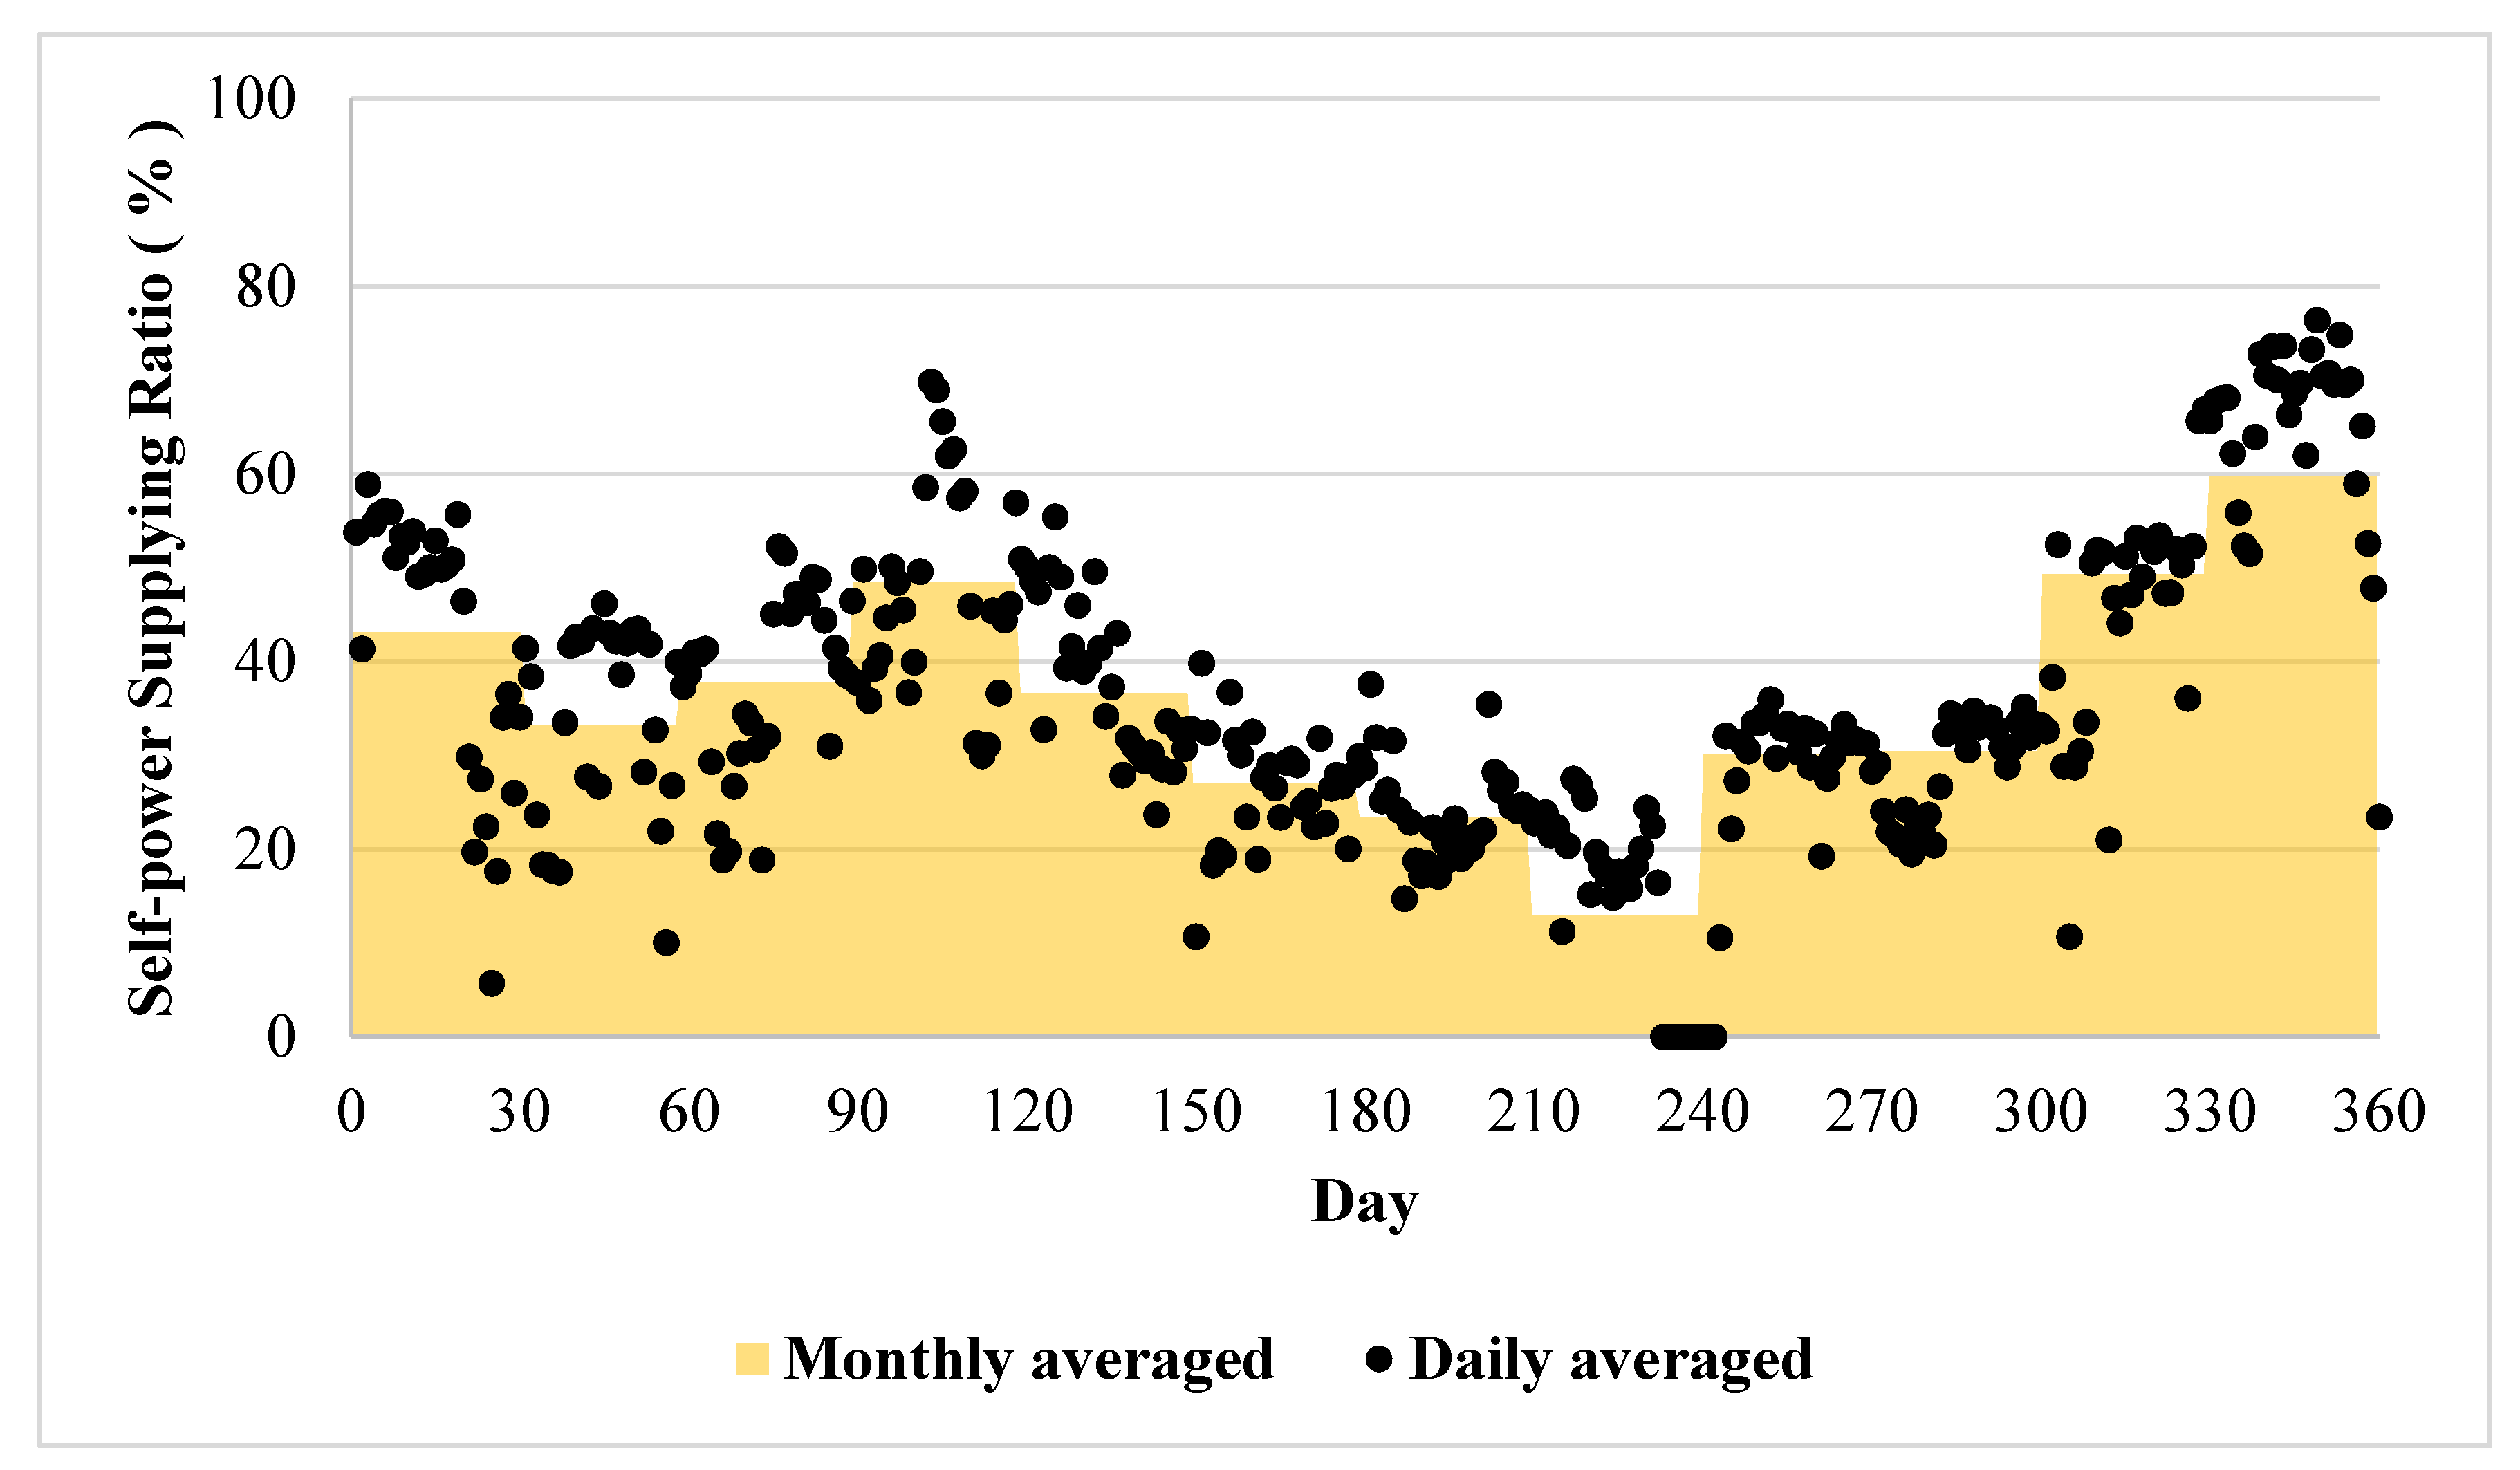
Figure 6 shows the annual, daily, and monthly averaged self-power supplying ratio produced by the cogeneration system in Case A. The self-power supplying ratio in winter was shown to be about 70% on average, which is about twice that of the 35% shown in summer. In order to reduce the summer electricity bill from the viewpoint of operating costs and benefits, it is necessary to further increase the self-power supply ratio of the cogeneration system, but it can be seen that this was not realized in actual field operations. Case A’s relatively low self-power supply ratio in summer seems to stem from the belief that minimizing the amount of waste heat would be advantageous in terms of operating costs. Since it is very difficult to clearly assess the influence of the operating strategy or the overdesigned capacity of the prime movers from the investigated annual daily operating data, it is necessary to establish a systematic analysis method that can properly evaluate the impact of the optimal operating strategy by distinguishing it from other factors.
In the diagnostic simulation analysis, two different operating schemes of the electricity- or heat-load following mode can be considered, and this can be used to systematically evaluate the optimal capacity of the cogeneration system as well as the effect of the operating schemes on the technical or economic performances. Table 3 shows the system and operating conditions for the scenarios adopted for the diagnostic simulation analysis of Case A.
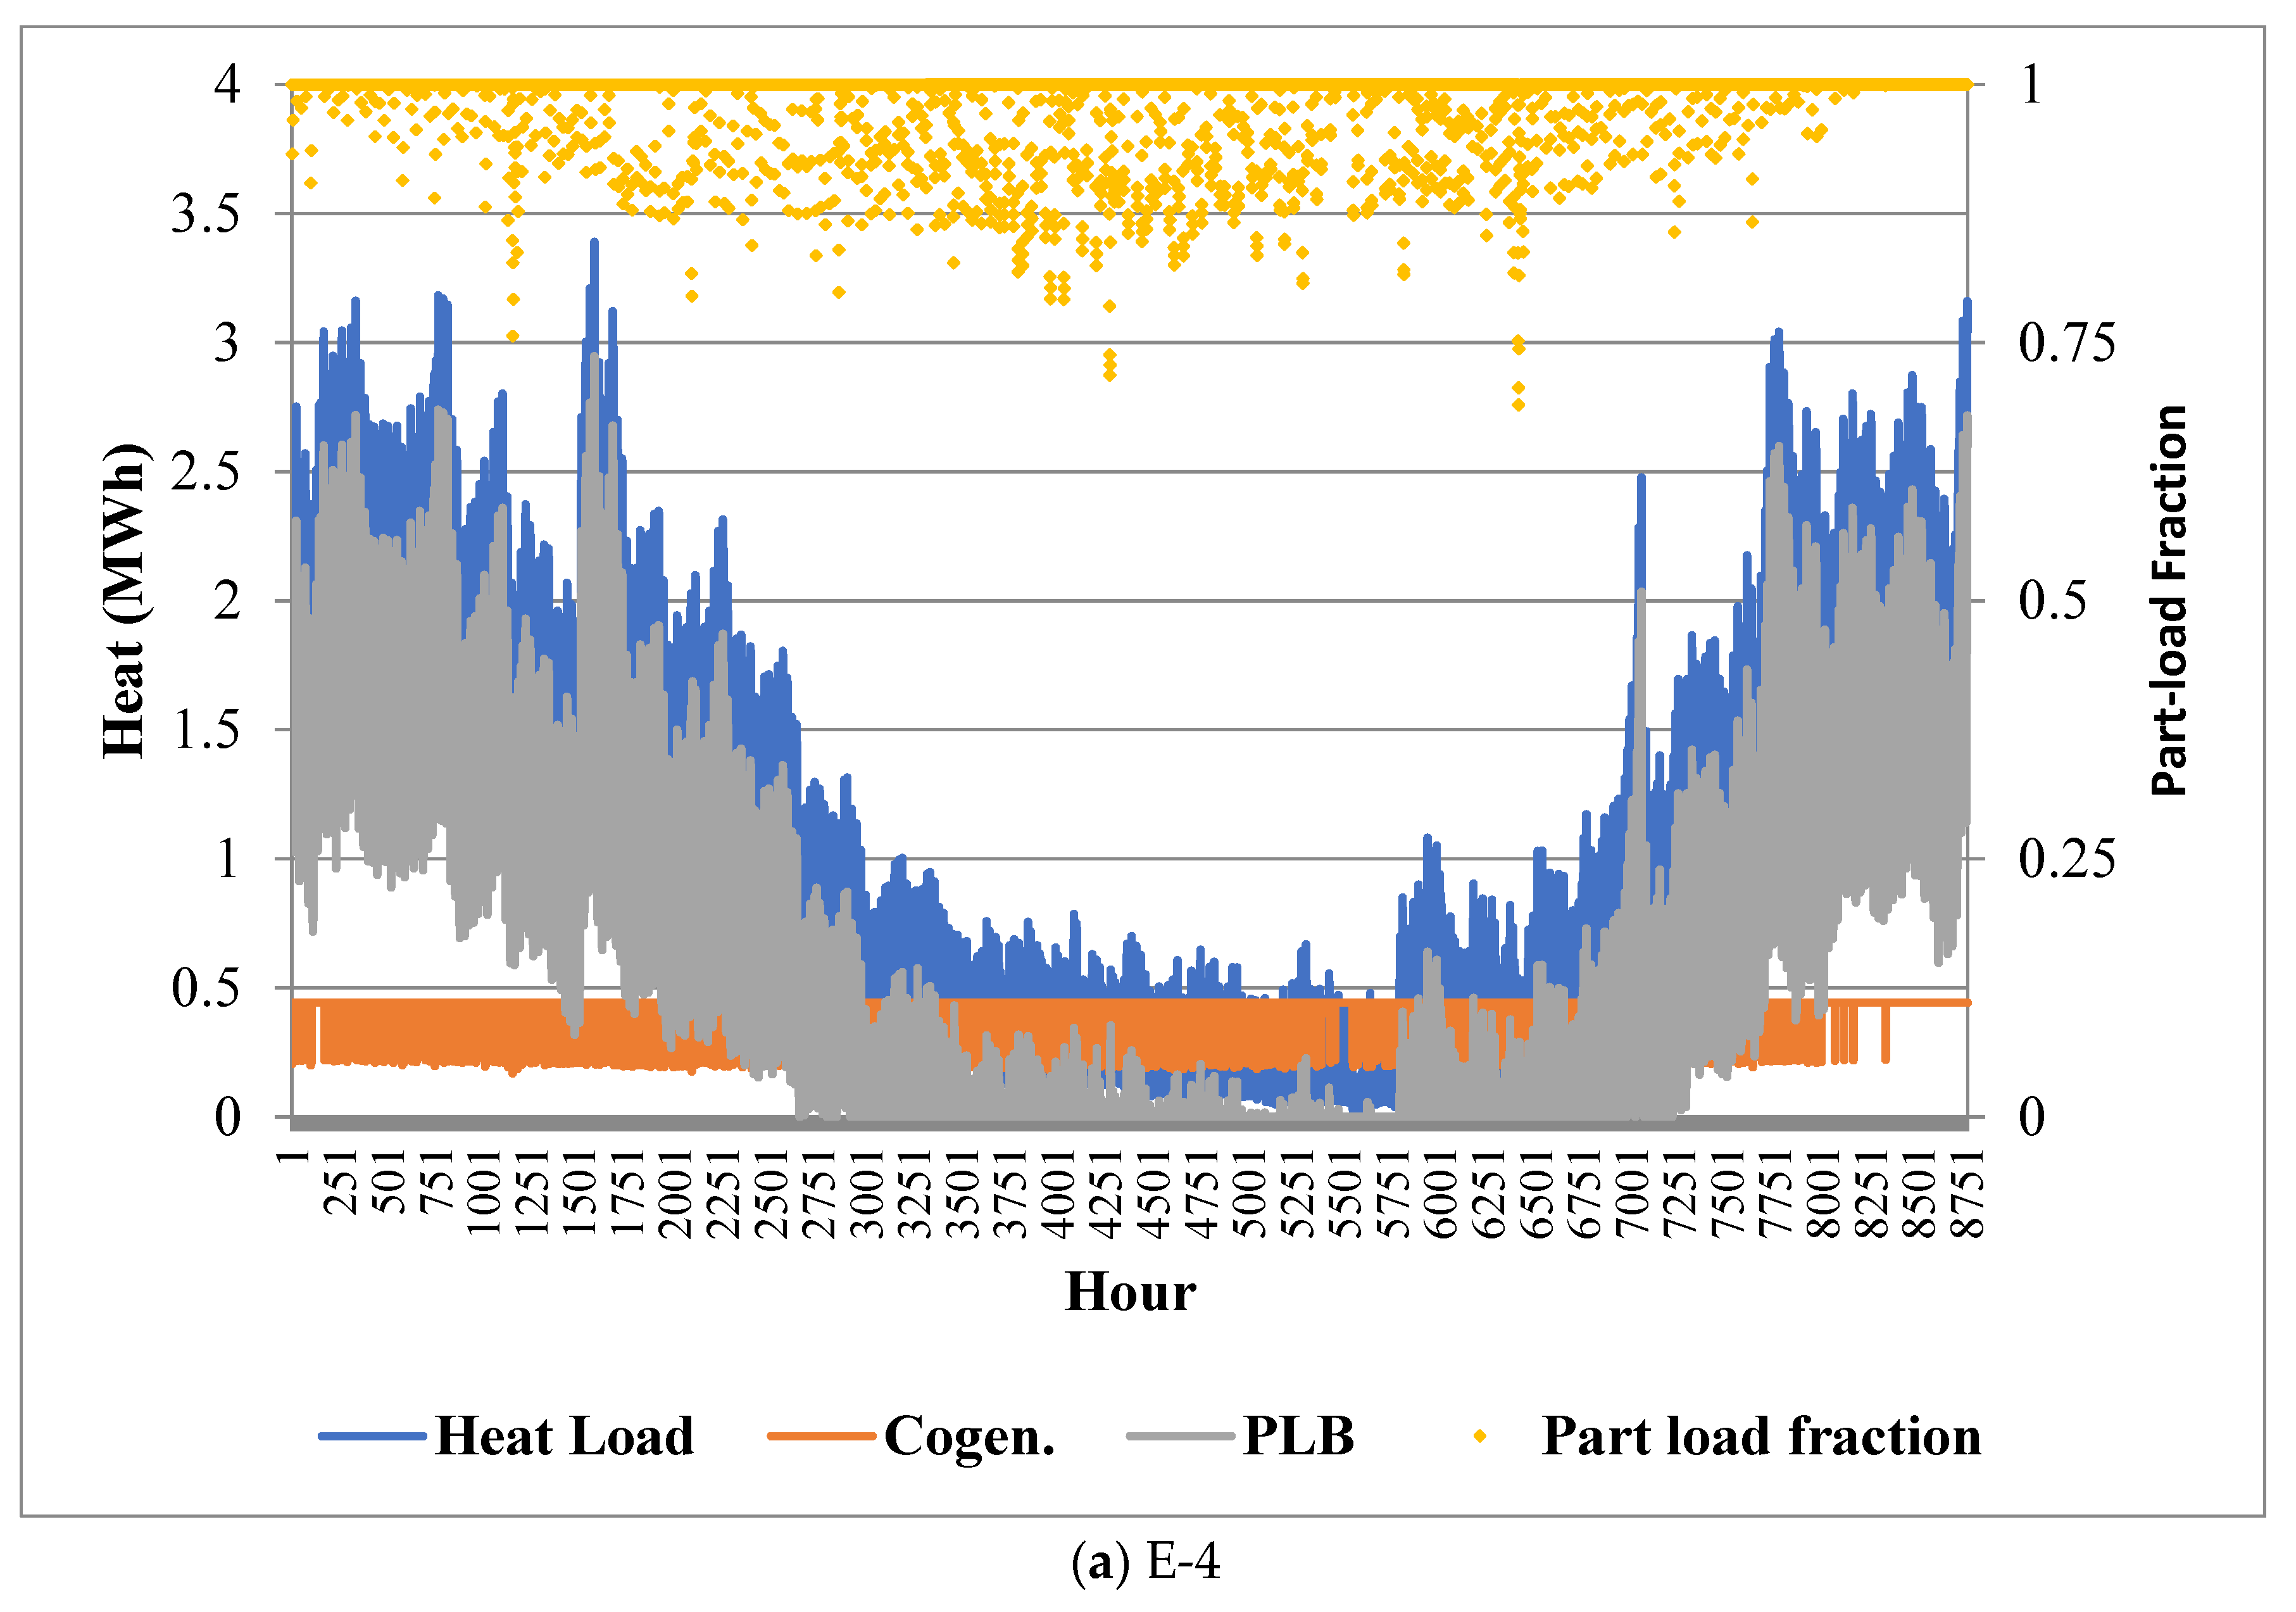
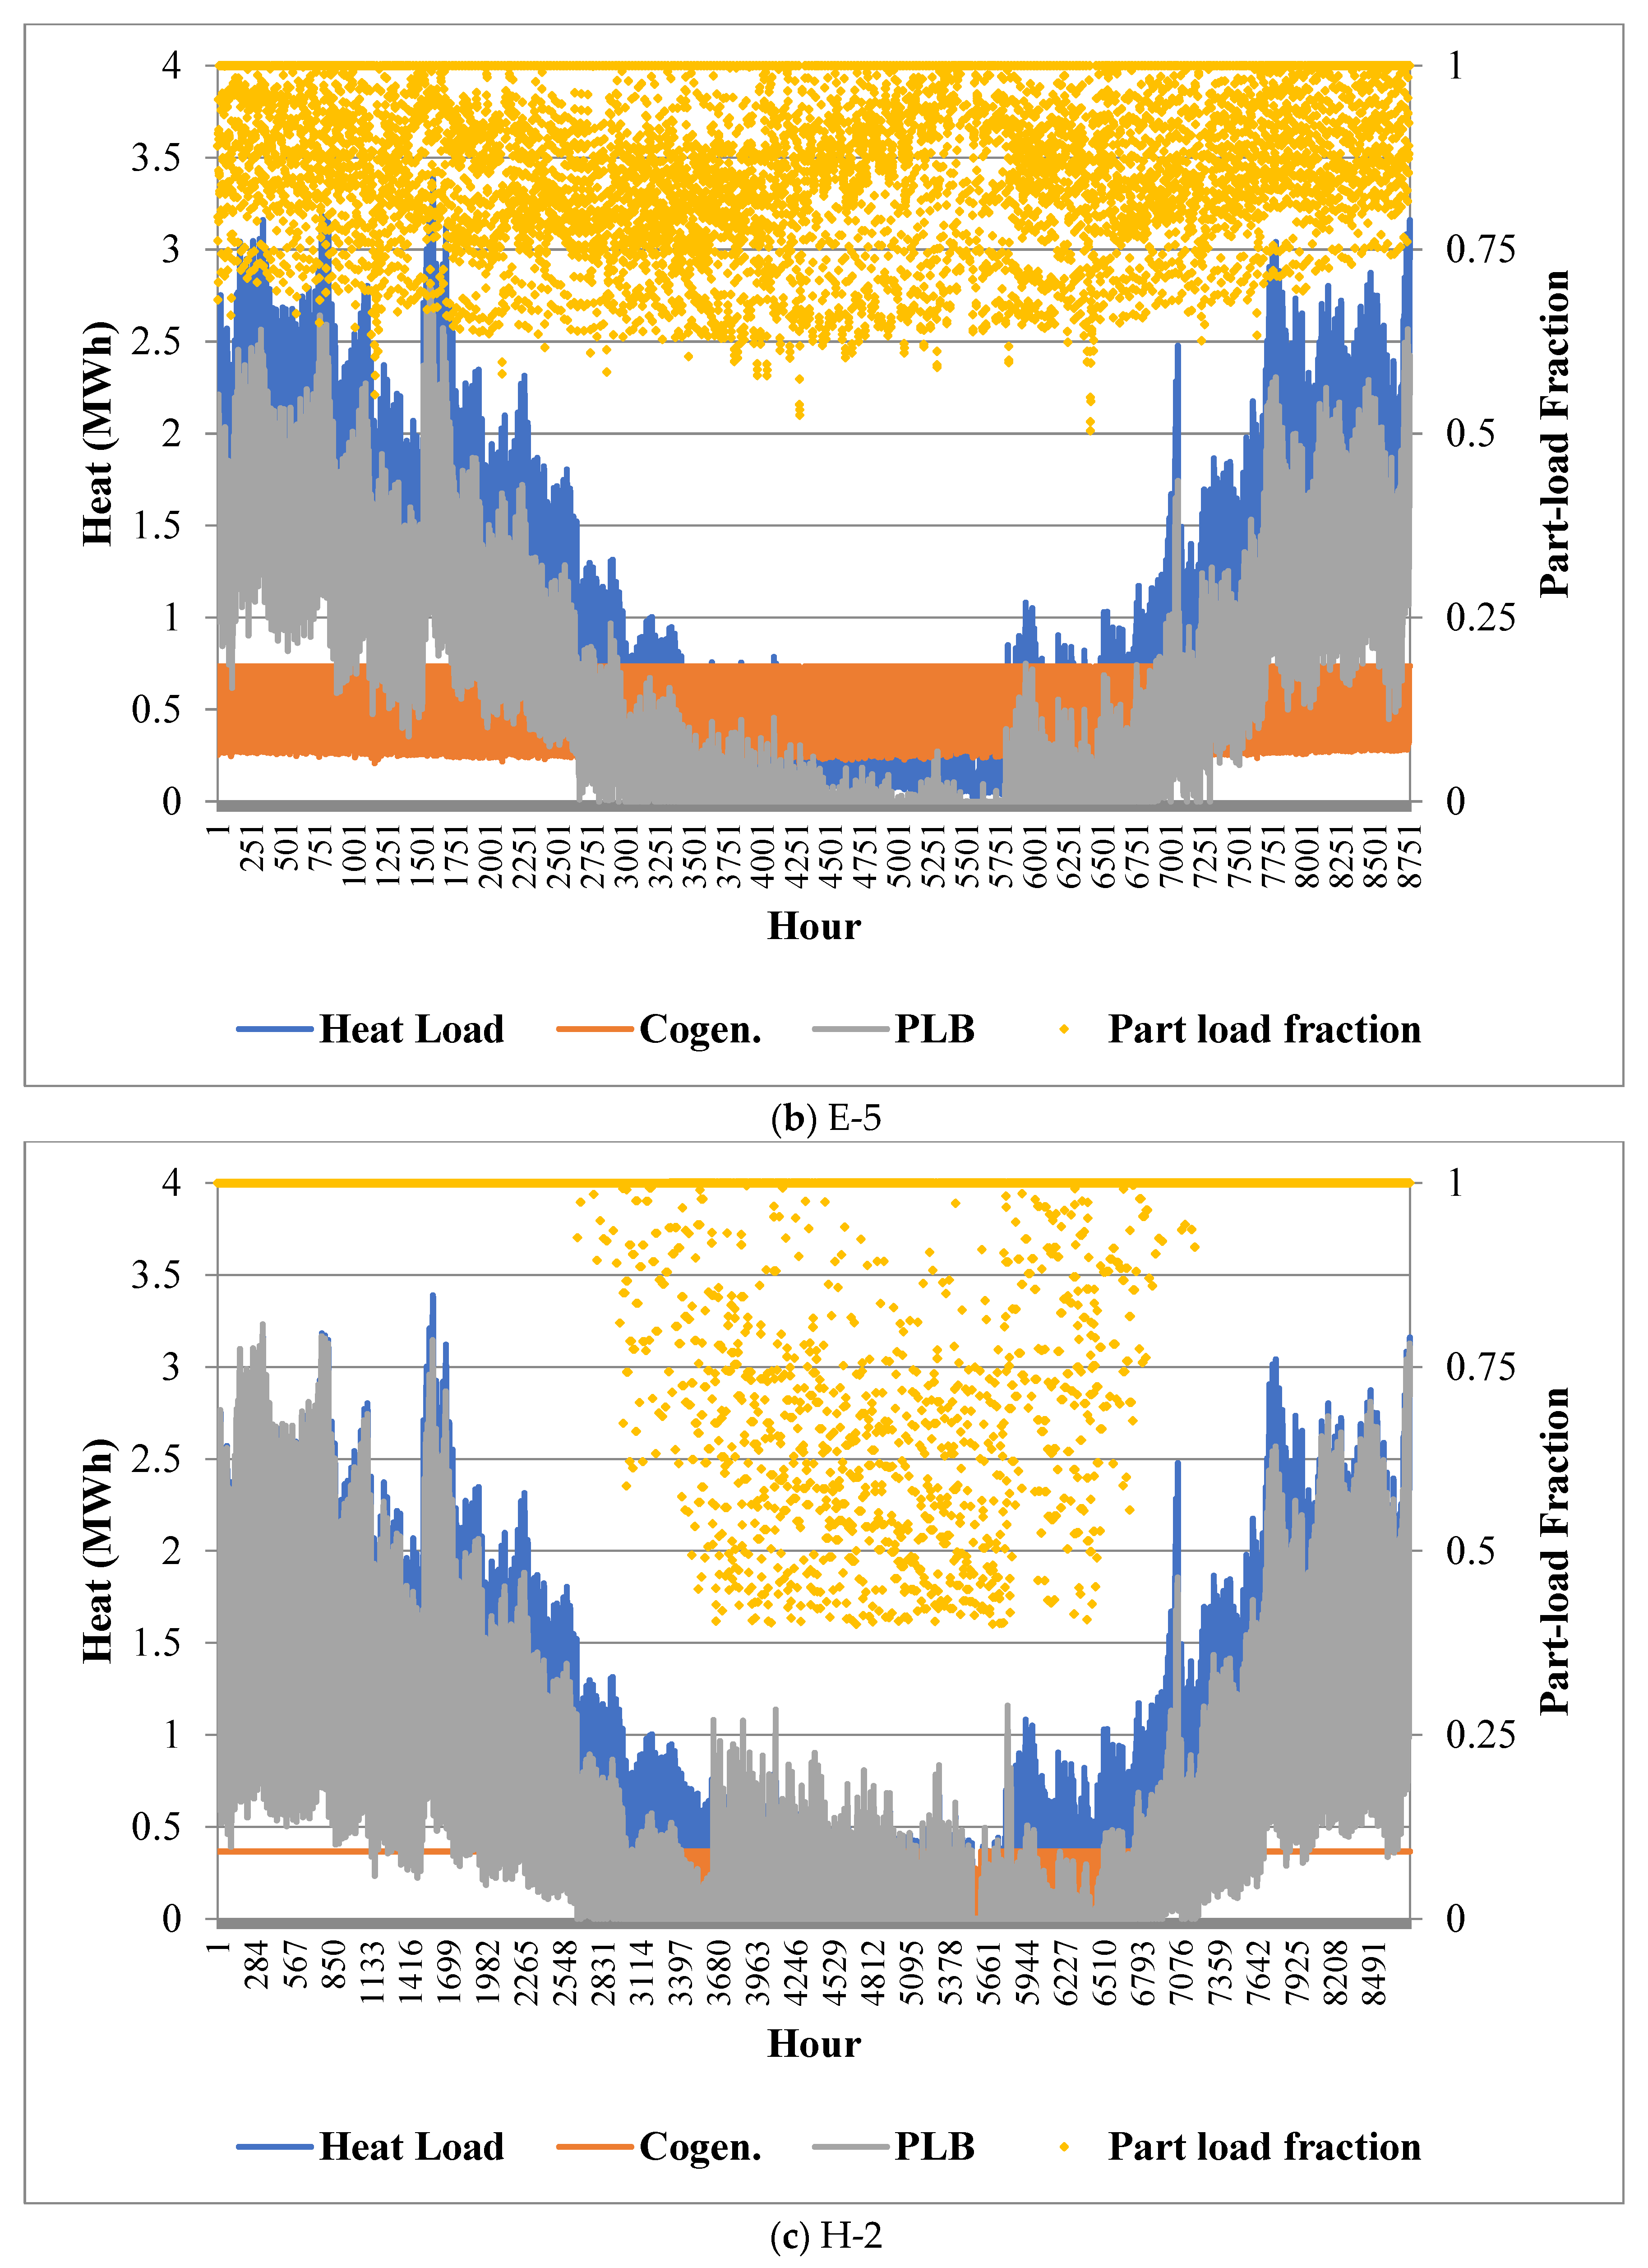
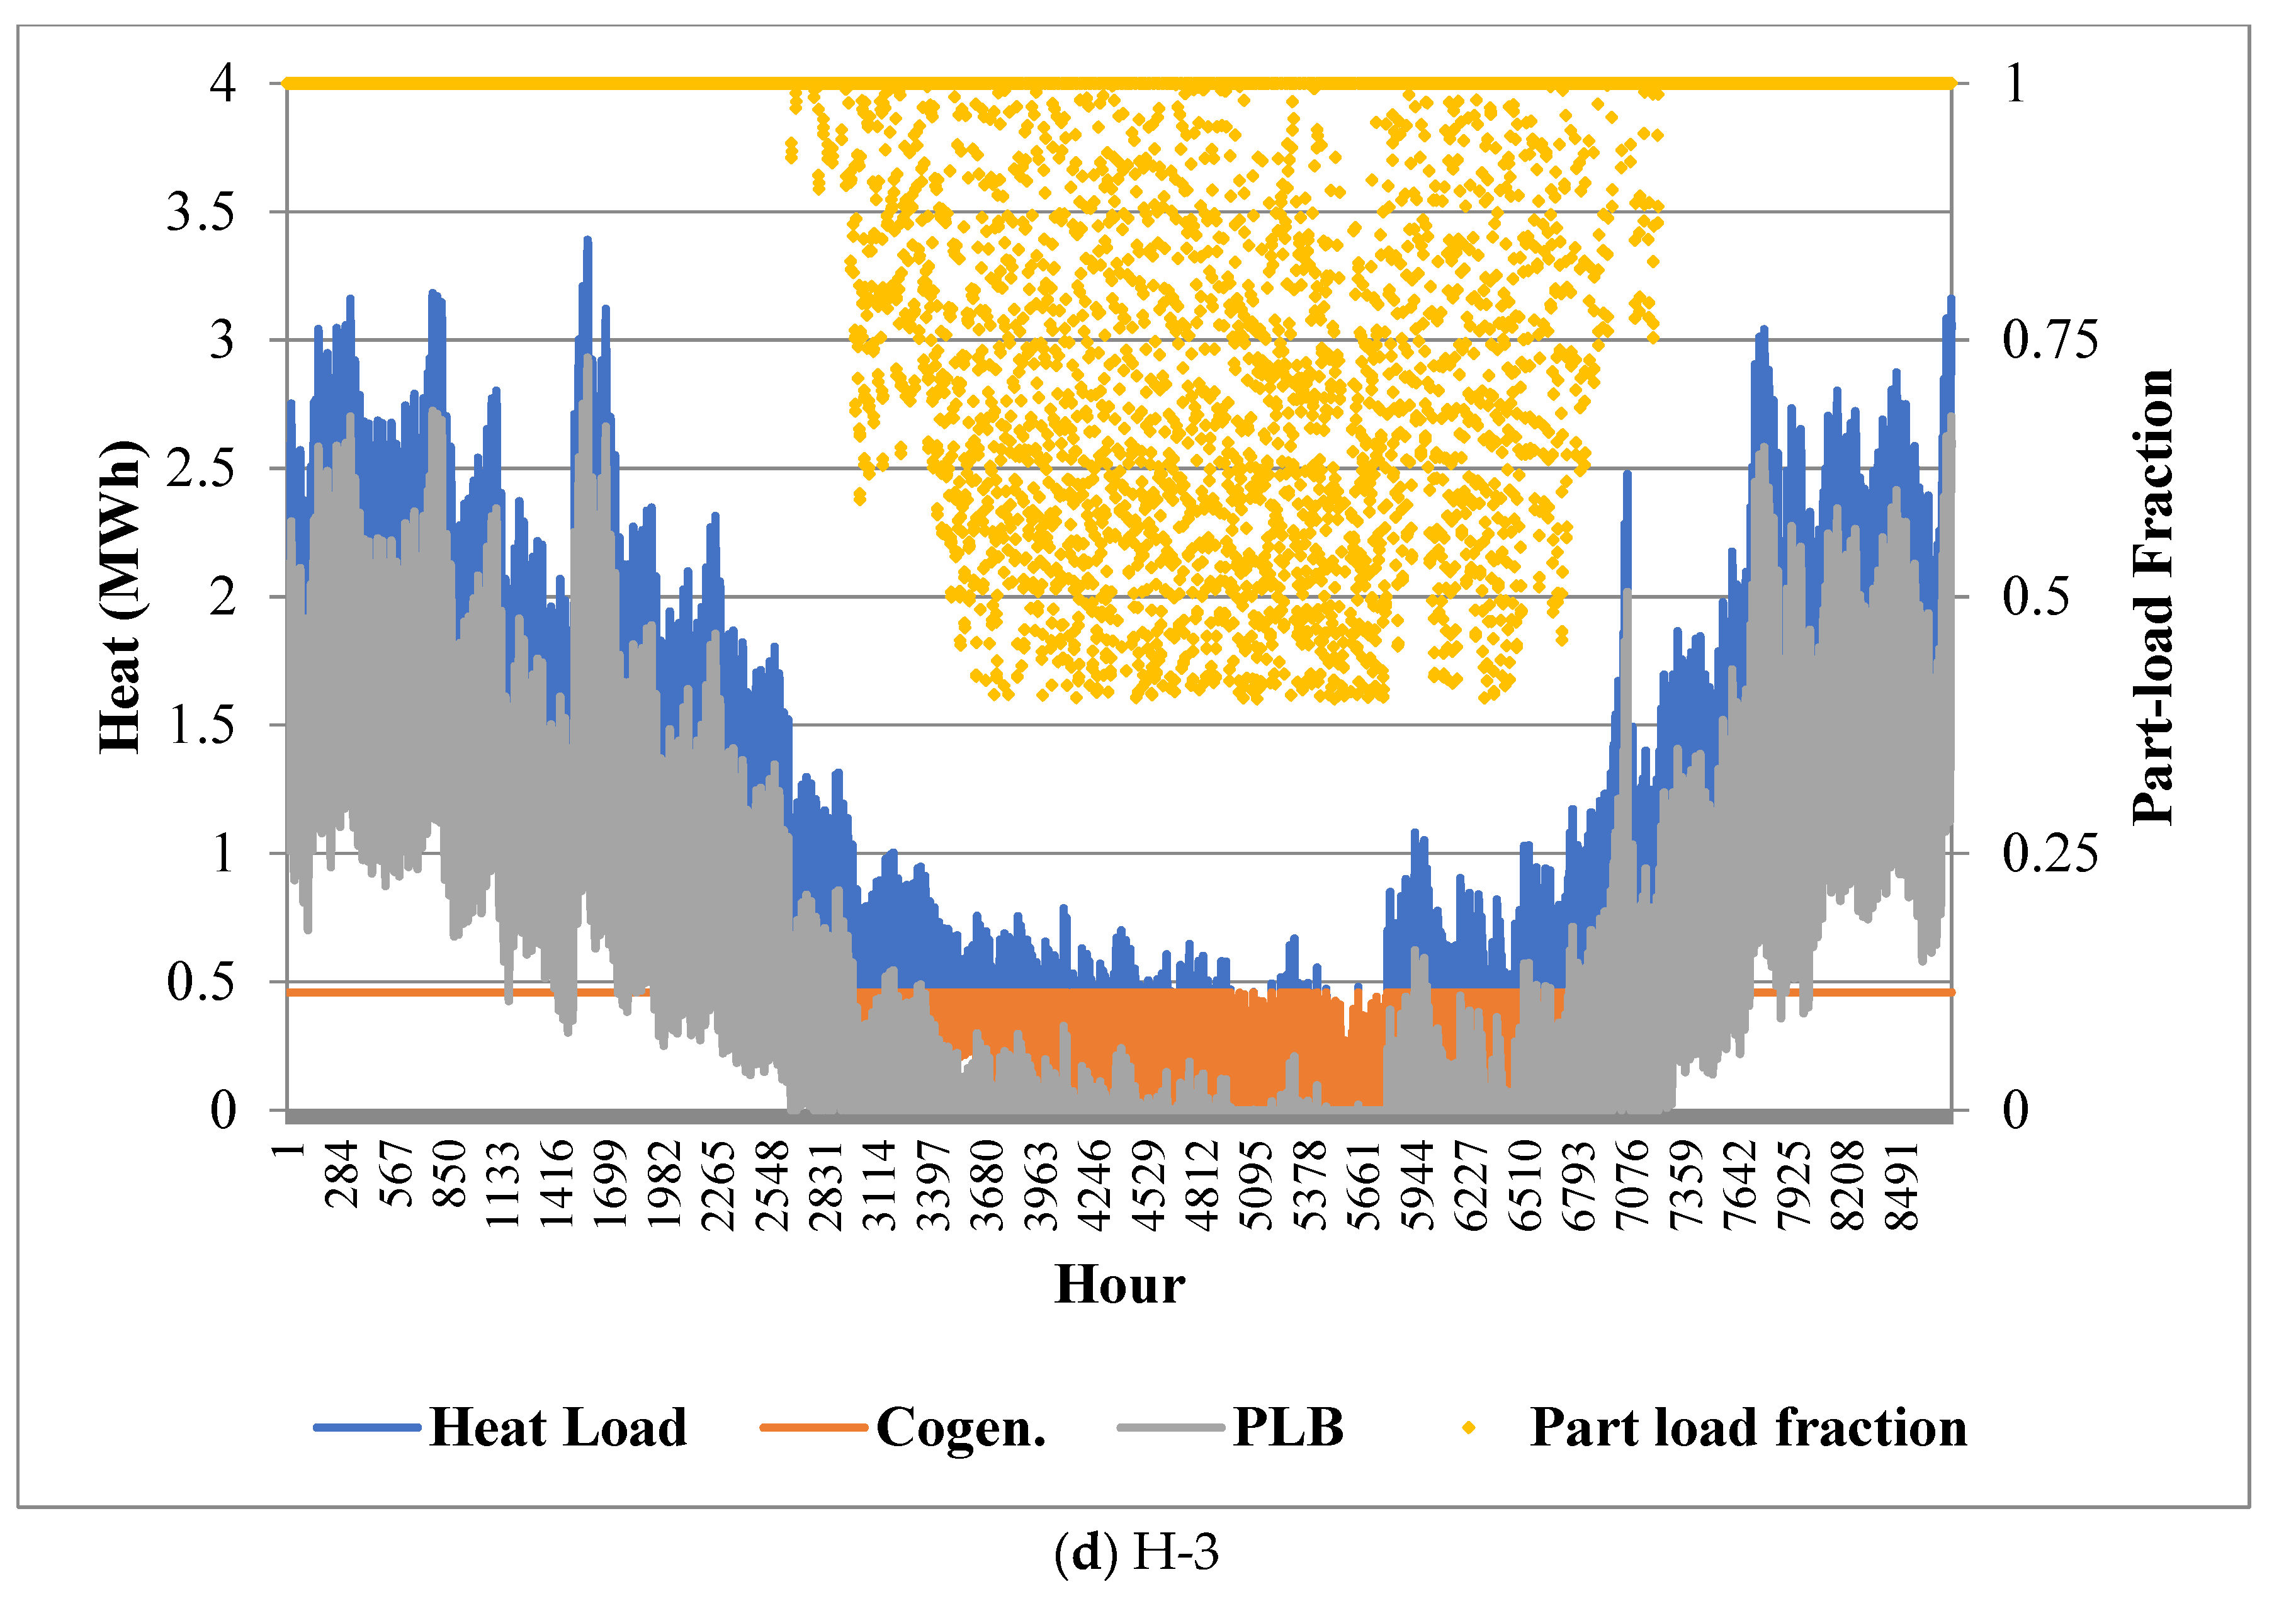
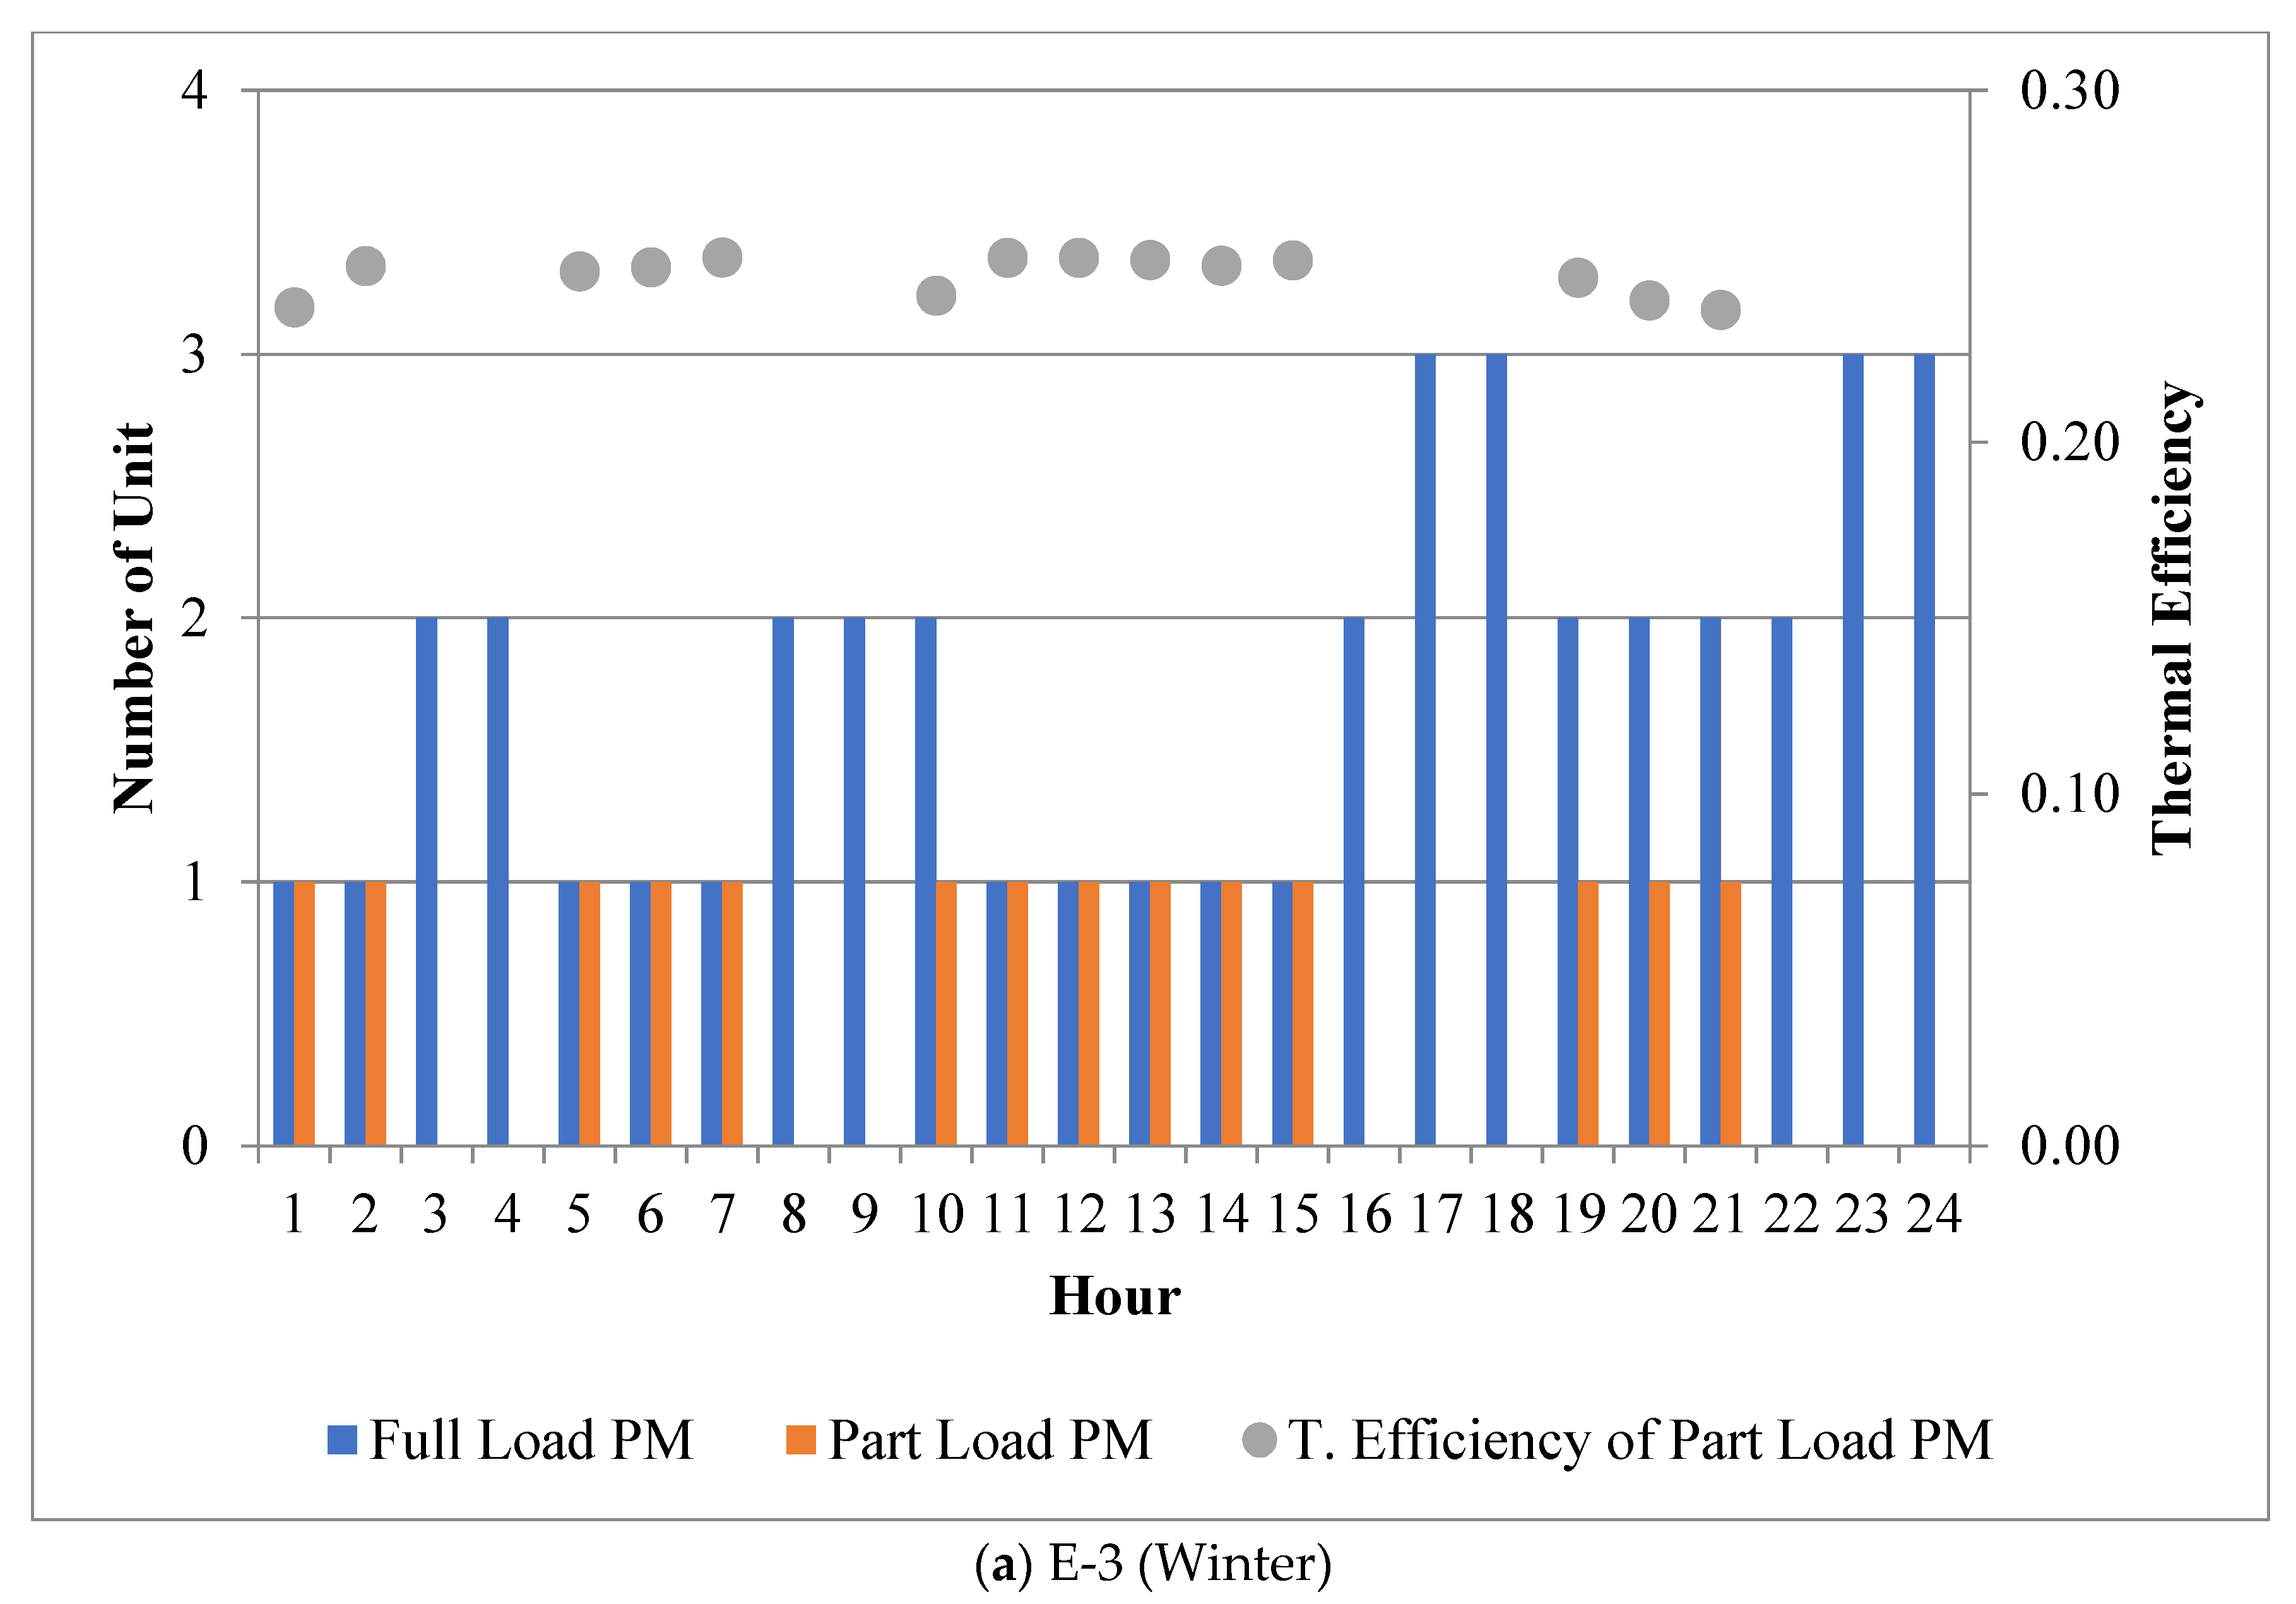
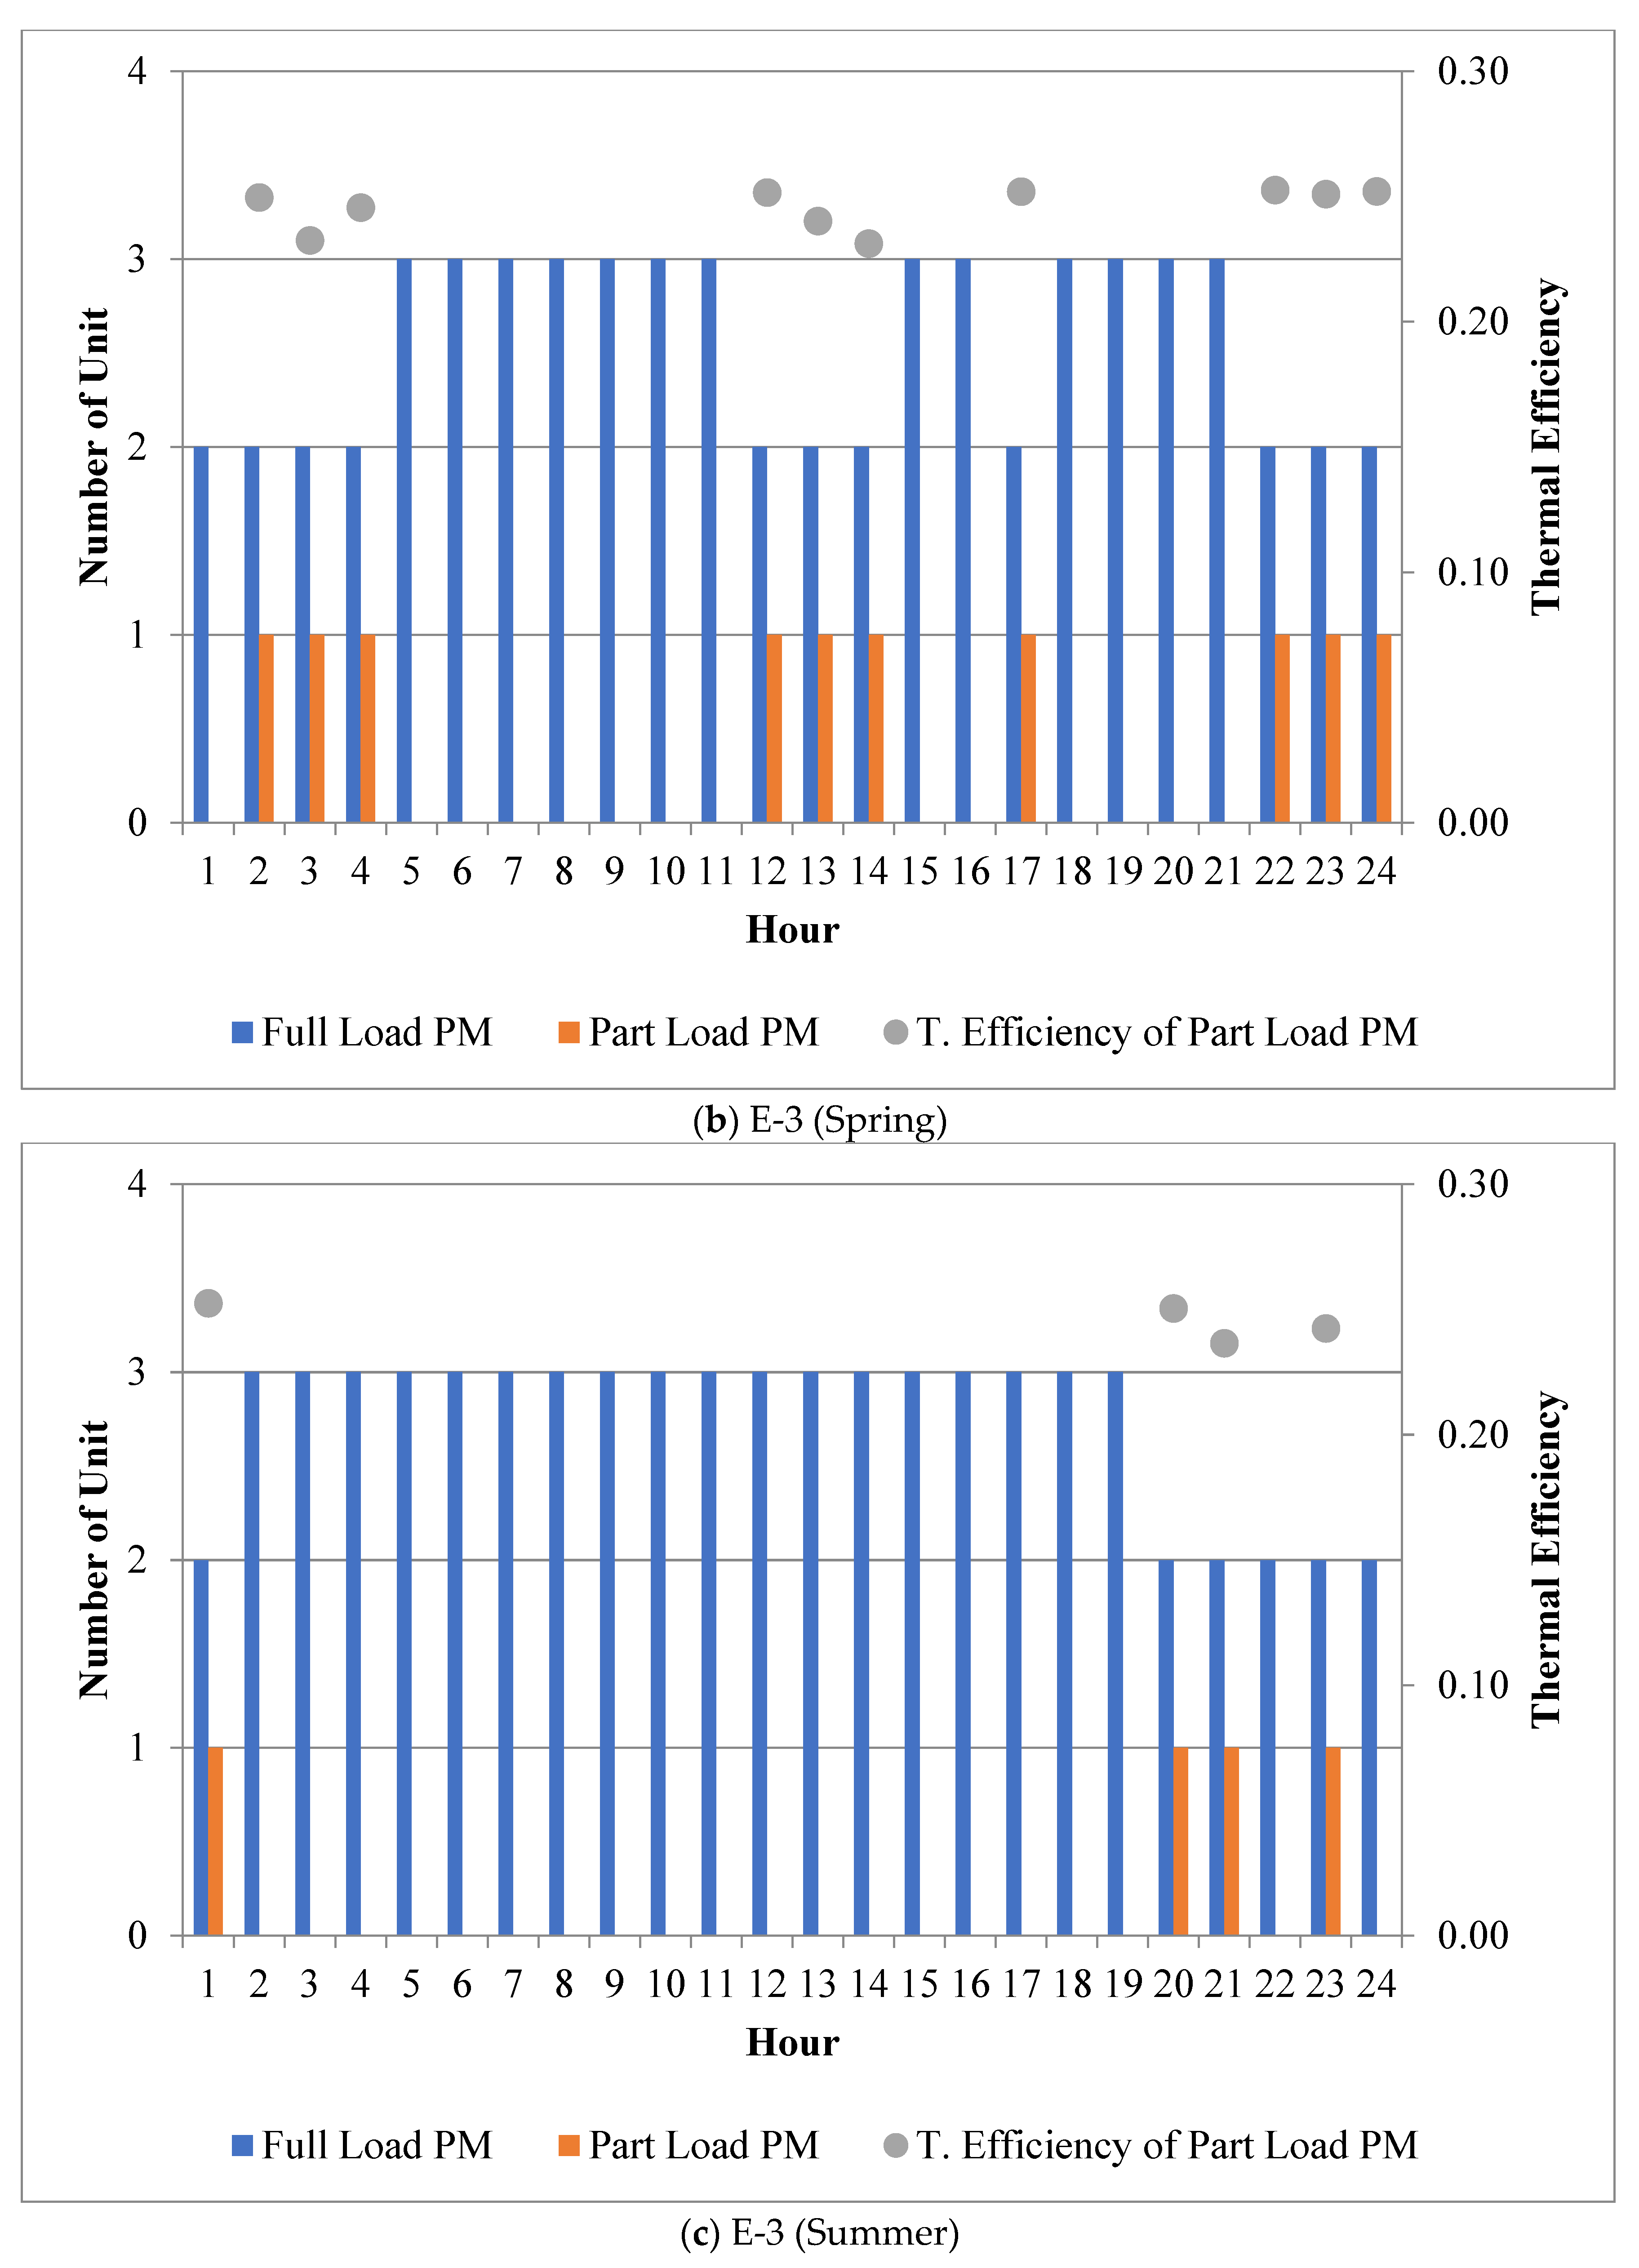
The annual hourly heat demand and the heat supply profiles by facility for Case A are shown in Figure 7 along with the hourly part-load operation ratio of the prime movers for some selected scenarios. It is apparent that the larger the installed capacity of the prime mover, the higher the part-load operation ratio. This technical aspect seems to be represented properly in the modelling of the simulation tool, in that the proportion of the part-load operation increases significantly as the prime mover’s capacity increases, from 320 kW to 540 kW, as can be seen in Figure 7a,b. It can be seen that, in scenario E-5, the occurrence frequency of the part-load operation increases rapidly, and the part-load fraction goes down to the operating lower limit condition. As a result, the RPES of E-4 is expected to be better than that of E-5. For the heat load-following model (HLFM), it can be seen that similar operating characteristics as described above occur in the summer, as shown in Figure 7c,d. That is due to the higher designed prime mover’s capacity; in the case of H-3, the degree of the part-load operation mode became relatively significant even though the heat production by the peak load boiler (PLB) was instead decreasing. It would be interesting to evaluate, in terms of the RPES, the impact of the trade-off between inefficiency from part-load operation and increased efficiency with lower PLB utilization. It is also interesting to note that the change in the heat output of the prime mover is proportional to the frequency of occurrence of part-load operation. For example, in winter, there are large variations in the heat output from the prime mover in the case of the electricity load-following mode (ELFM), as can be seen in Figure 7a,b. On the other hand, in the case of HLFM, the heat output from the prime mover is not sufficient to meet the huge heating demands in winter, so the prime mover is directed to operate at full load.
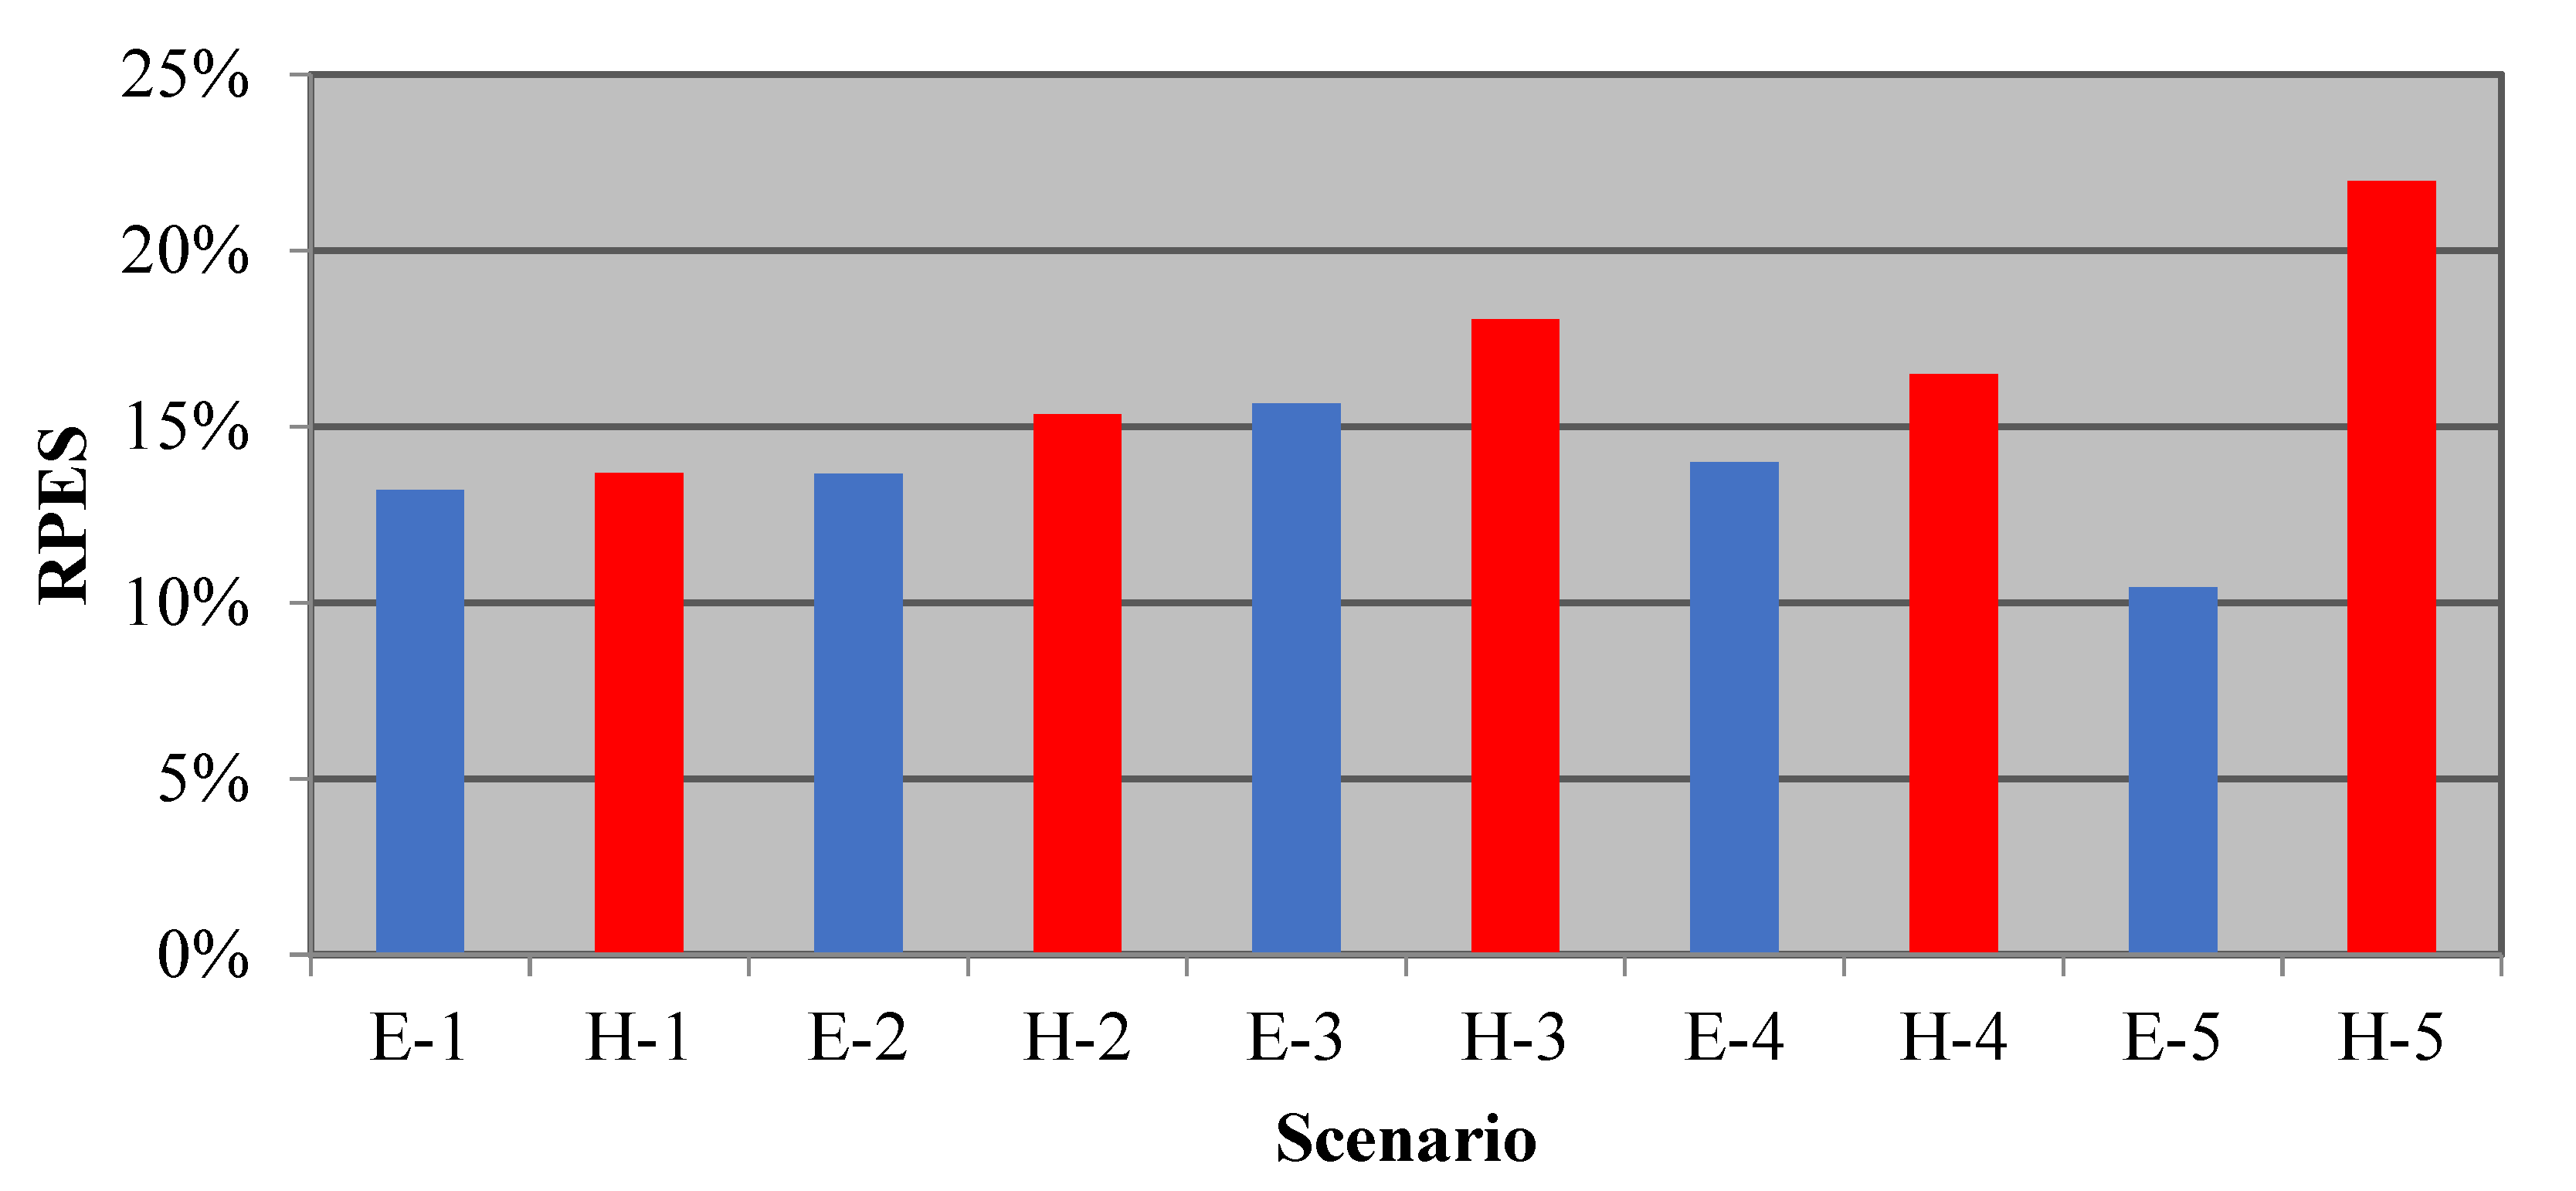
Figure 8 shows the annual total RPES, evaluated based on the diagnostic simulation results for the scenarios. In the case of ELFM, E-3 attains the best RPES, and it can be deduced that the technical performance is determined by the trade-off between the wasted heat loss and the gain caused by the highly efficient cogeneration operation mode. In the cases of E-4 and E-5, for which the prime mover’s capacity was over 350 kW, somewhat larger than the actual installed capacity, the effect of the wasted heat loss in the summer surpasses the gain from the cogeneration mode in other periods. In the case of HLFM, as the RPES of H-3 is predicted to be higher than that of H-2, it can be seen that the fuel-saving effect produced by the reduction of the PLB utilization rate may be greater than the effect from the inefficiency of part-load operation. In addition, it was predicted that HLFM would be more advantageous in terms of RPES compared to the ELFM mode, mainly because the operation of the prime mover in HLFM is regulated in order to minimize waste heat.
Figure 9 and Figure 10 show the comparative simulation results for the scenarios in terms of operational cost benefits and cogeneration system installation cost, respectively.
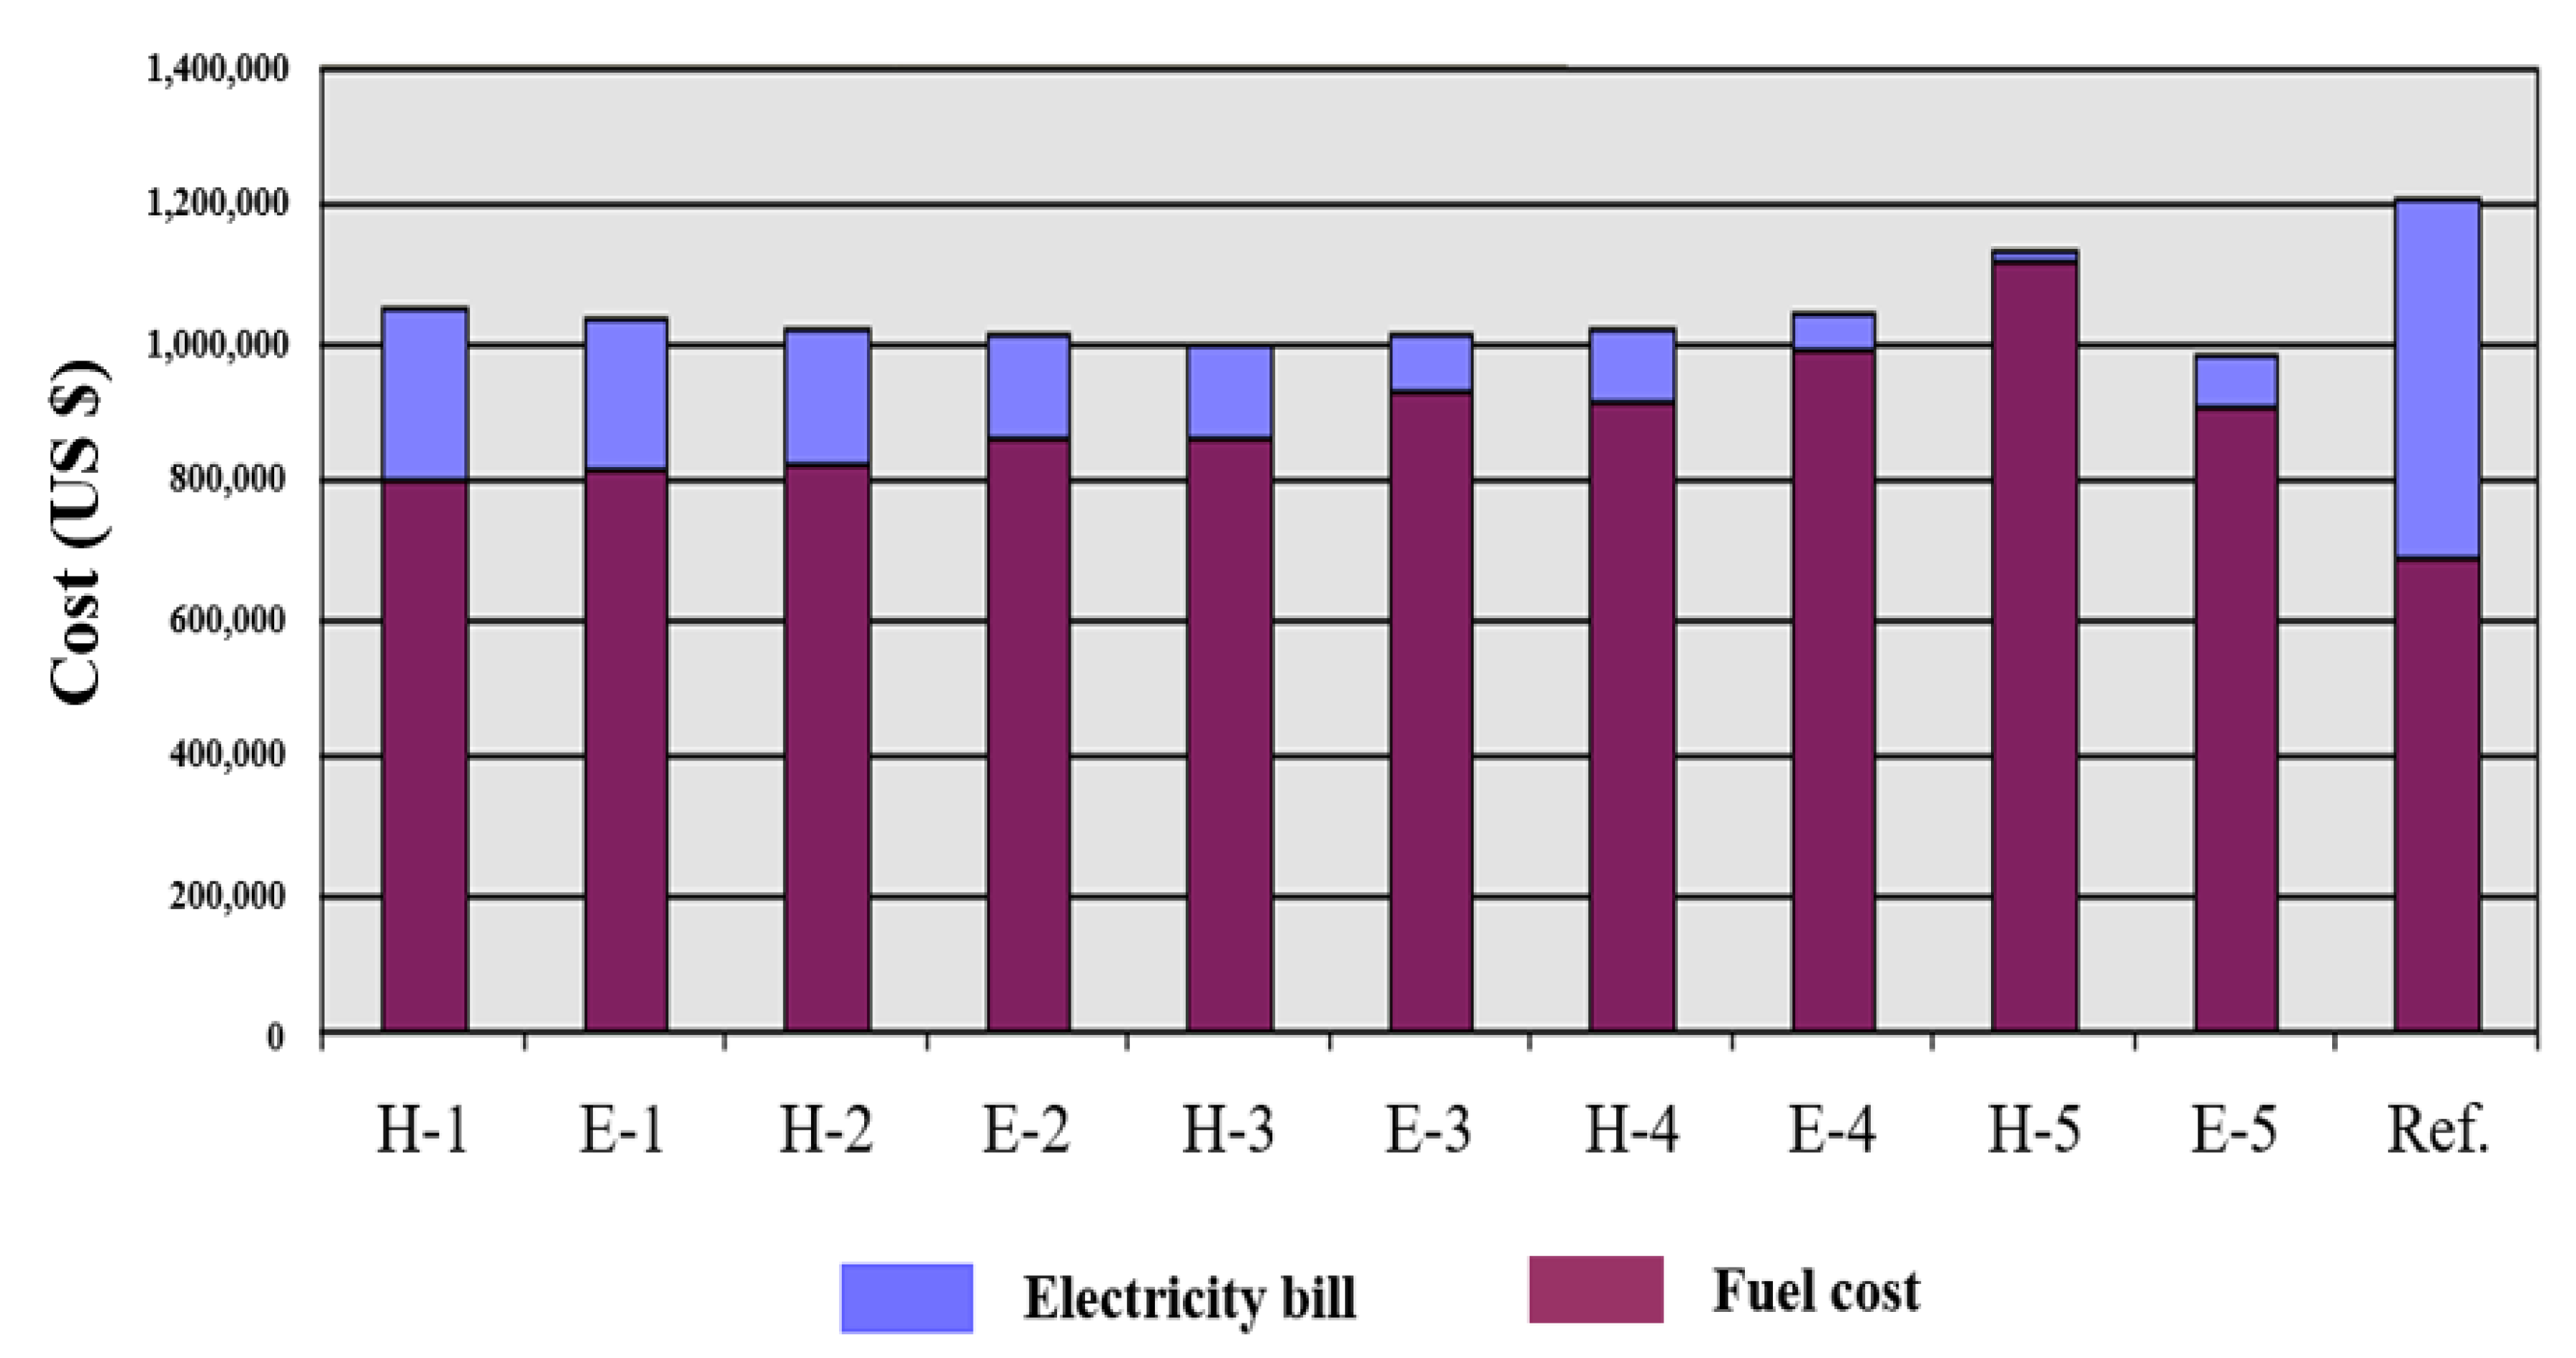
In Figure 9, it is shown that all of the proposed scenarios attain operating cost advantages over SHP. This means that the peak-cut effect of the cogeneration system on electric cost reduction is very large, according to the application of the progressive electricity rate system, which has long been applied in the building sector of the domestic market. Figure 10 compares the operational benefits of each scenario, including the investment cost required to install the cogeneration system. As for the reference case, SHP, it requires the lowest equipment cost but has the largest annual operating cost. On the other hand, with the adoption of the cogeneration system, the investment cost rises in proportion to the installed capacity of the prime movers, but it can be seen that the annual operating cost is being reduced by alleviating the progressive electricity rate system effect which can bring about an exponential increase in electricity bill.
To learn more about the effects of operational strategies on the operational performances of cogeneration systems, utilizing an event-based analysis framework instead of the conventional time-series analysis framework can be helpful, and this study proposes the key operational variables for the event-based analysis as follows:
where, denotes the amount of power generated by the prime movers, and is defined by the total heat produced by the boiler and the cogeneration system. and also denote the normalized values divided by the annual maximum values of and , respectively.
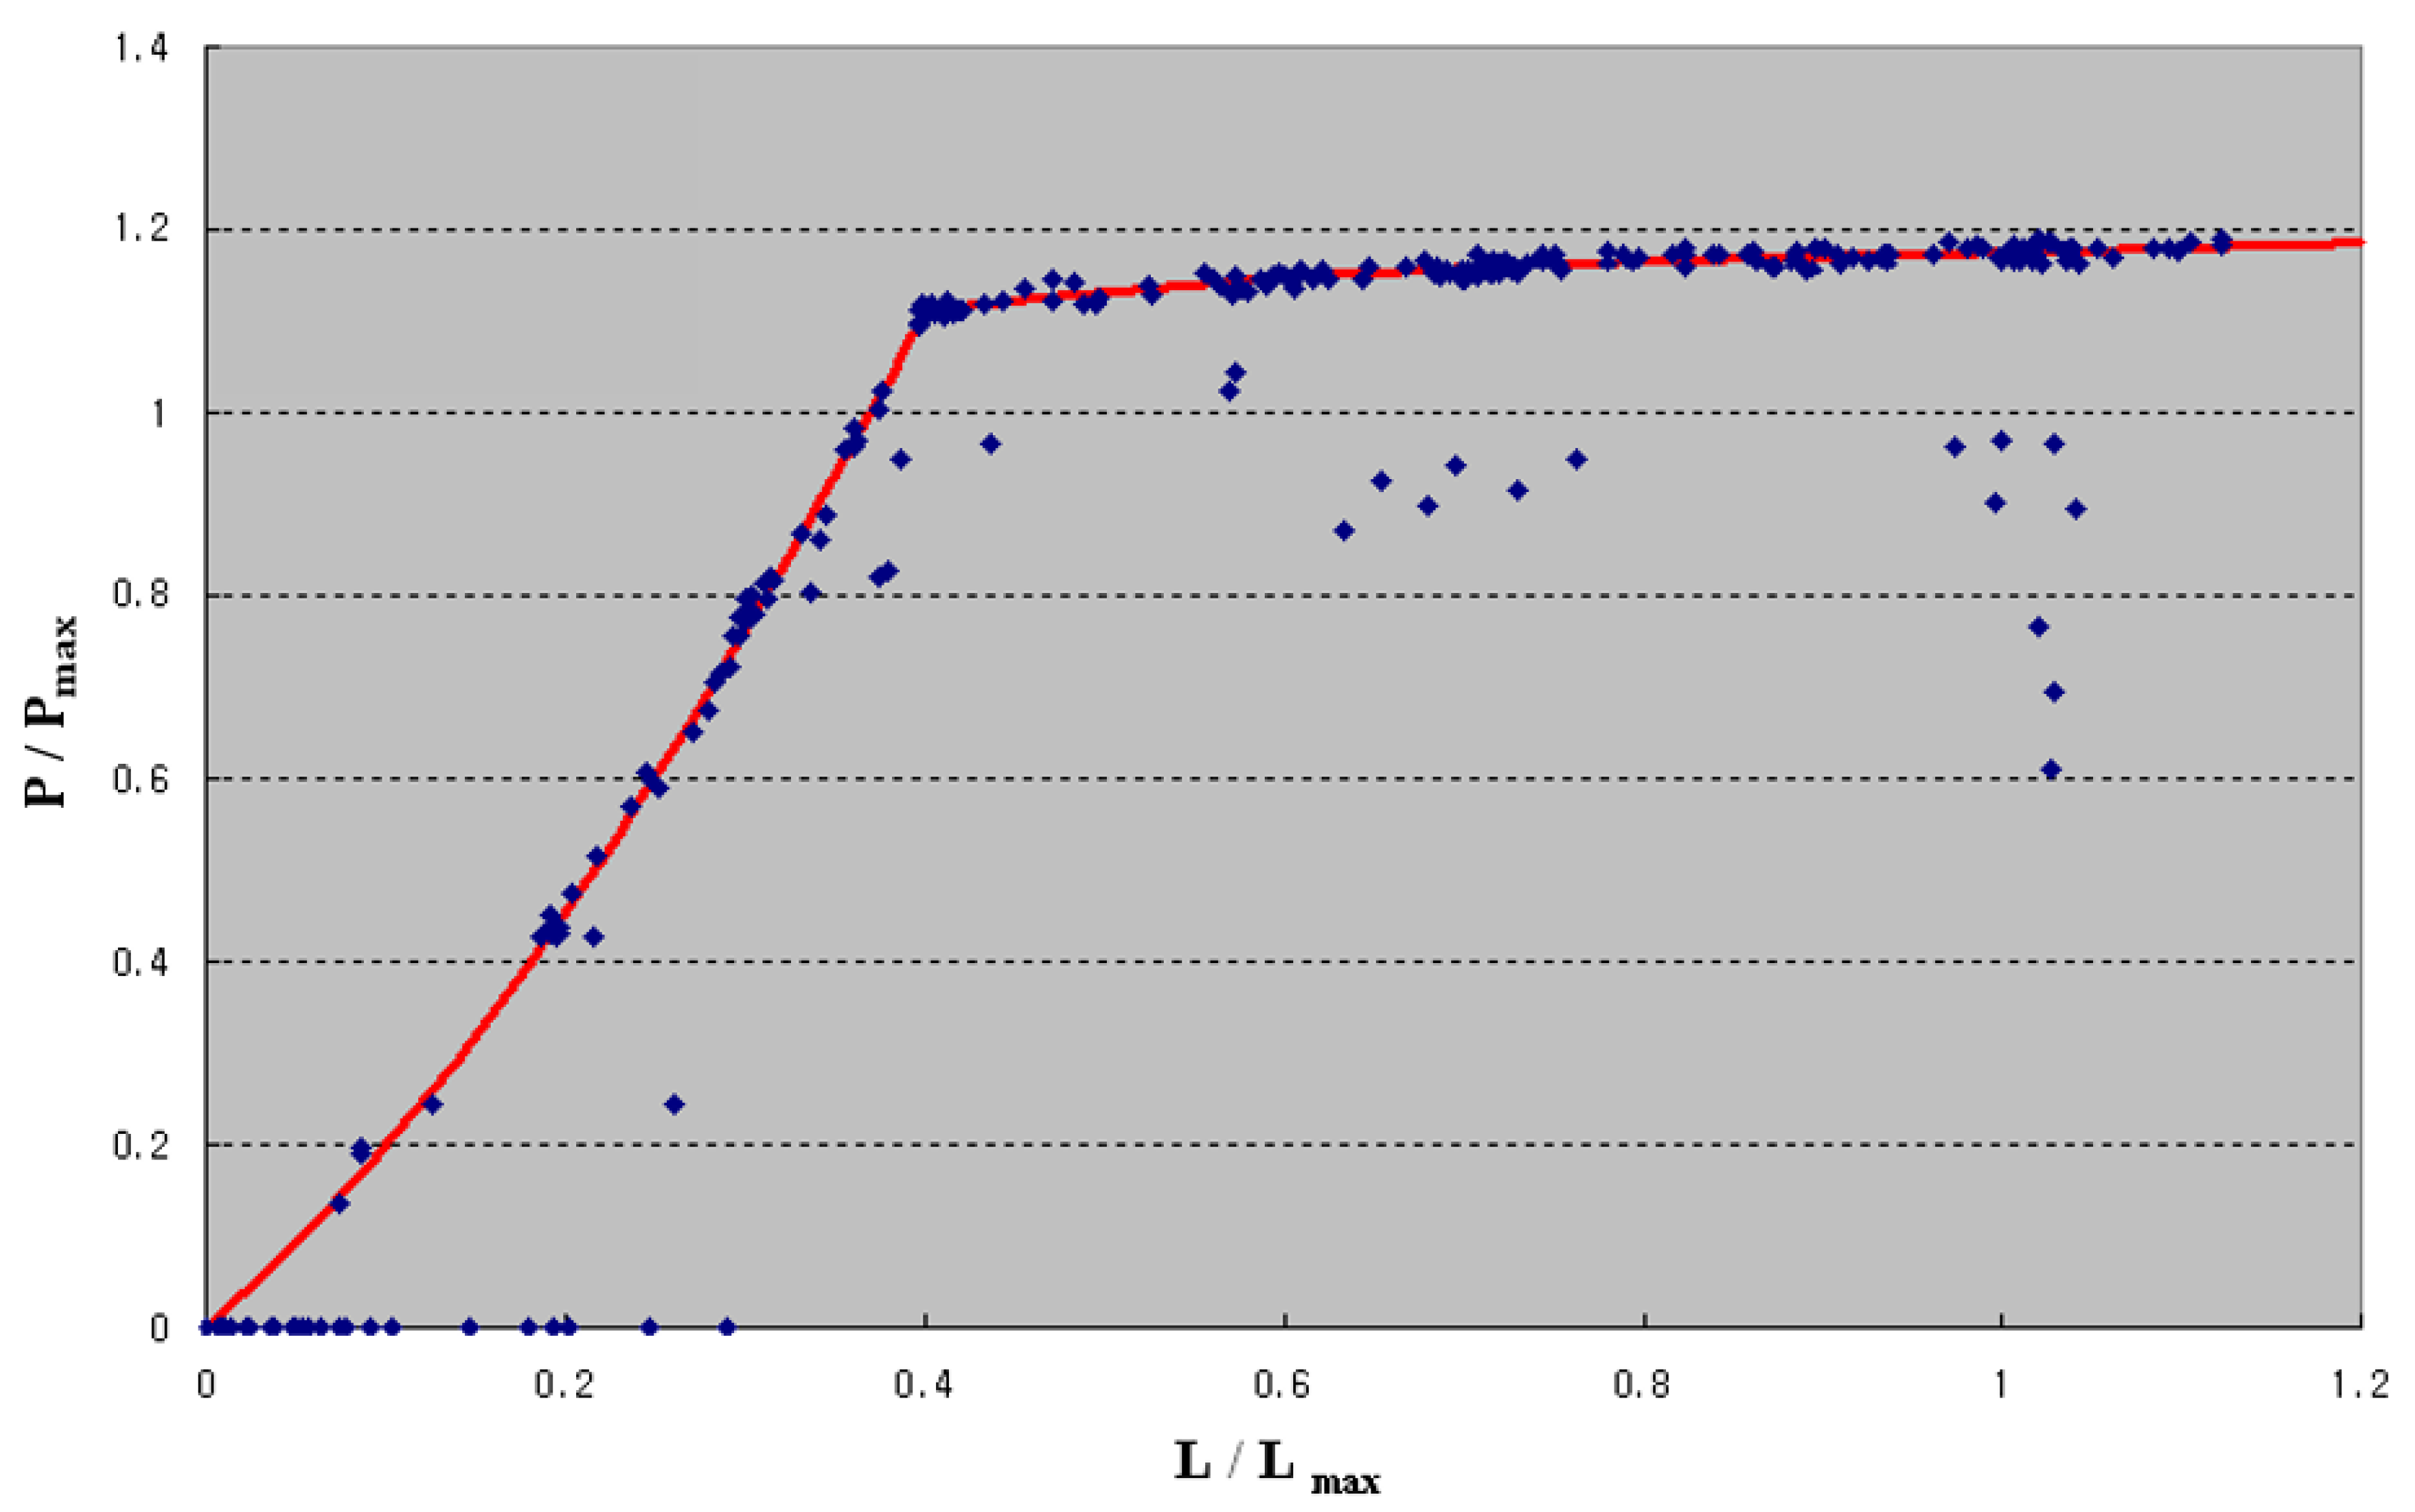
Figure 11 shows the relationship between the key operational parameters for the annual operation events in Case A, and a relatively consistent relationship is observed between the key operating variables. Operational events conducted in the summer are shown distributed in locations with steeper slopes closer to the origin, as shown in Figure 11, and a unique behavior characterized by a linear relationship between and is observed. It can be inferred that during this period, adequate system controls have been implemented in order to minimize heat loss. The operating characteristics in the other region indicate operational events in seasons other than summer, showing that a fairly regular operation strategy and planning, e.g., the heat, or electricity load-following mode and CGS operation, or shutdown, etc., was applied without significant changes. Aspects of the operational characteristics based on the operational strategies and plan in the event-based analysis framework are discussed in detail later in comparison with another case.
3.2. Diagnostic Simulation for a Case of Poor Performance
In contrast to Case A, Case D, which consists of multiple prime movers as shown in Table 4, has the advantage of being able to consider more flexible operational management. However, from the survey, it was found that Case D attained the lowest levels of RPES. The poor economic and technical performances in Case D could be attributed to the overdesigned capacity of the prime mover or to the poorly established operating strategy, or both. The average monthly electricity consumption per household was assessed to be about 360 kWh, which is about 15% higher than that of Case A. It is shown that, under the progressive electricity rate system applied in the domestic market, the higher stage rate of 26 ¢/kWh can be applied for more than half of a year. As a result, considering the progressive electricity rate system, it can be expected that the economic benefit potential of Case D is much greater than that of Case A. However, this was not the case under actual operating conditions, and this phenomenon needs to be analyzed with a diagnostic simulation.
The operating cost characteristics of Case D under actual use are significantly different from those of Case A, as shown in Figure 12. Considering that the average monthly electricity consumption of the residents is higher than in Case A, it is expected that the operation of the cogeneration system will significantly reduce electricity bills. However, from the operation status survey it was found that the electricity bill impacts did not live up to expectations and, on the contrary, the bill increased more in the summer.
As shown in Figure 13, in Case D, somewhat abnormal operating conditions are observed in that the monthly average or daily self-power supply ratio was maintained at too low of values compared to Case A. In particular, in August, the self-power supply ratio slightly exceeded 10%, which is less than half of that in Case A. If the general operating strategy was applied as in Case A, then the prime mover in Case D should have operated at the 20–30% level to cope with Case D’s higher peak power consumption from the grid. Therefore, it would be reasonable to postulate that the sluggish operating performance of Case D is caused by the adopted operation strategy rather than the prime mover capacity. Interestingly, in Figure 12, it can be seen that electricity cost in the summer significantly increased despite the operation of the cogeneration facility, and it can be presumed that the expectation of a reduction in electricity rates led to an increase in users’ electricity consumption, too. However, actual operation was played out in the opposite direction, resulting in excessive electricity rates.
The prime movers’ capacity, prime mover load factor, and the number of prime movers in each scenario configured for the diagnostic analysis of Case D are listed in Table 5. In Case D, since multiple prime movers are currently installed, the optimal system configuration was evaluated in terms of economic and technical operational performance by considering more diverse facility configurations, including single prime mover scenarios as well.
Figure 14 shows the dynamic operating behavior of the prime movers in terms of the number of units in operation, and the part-load ratio by season in the case of ELFM is adopted for Case D. It can be seen that the proportion of part-load operation increases, and the operation of the prime mover is limited to some extent except for the summer when power demand is high. From the simulation results it can be inferred that the CGS prime mover’s capacity was overdesigned to attain optimal performance with the ELFM. It should not be overlooked that the actual field operation results in the form of daily data may not be enough to gain insight into the operational strategies actually implemented, so hourly dynamic operation simulation tools can be usefully applied to compensate for this.
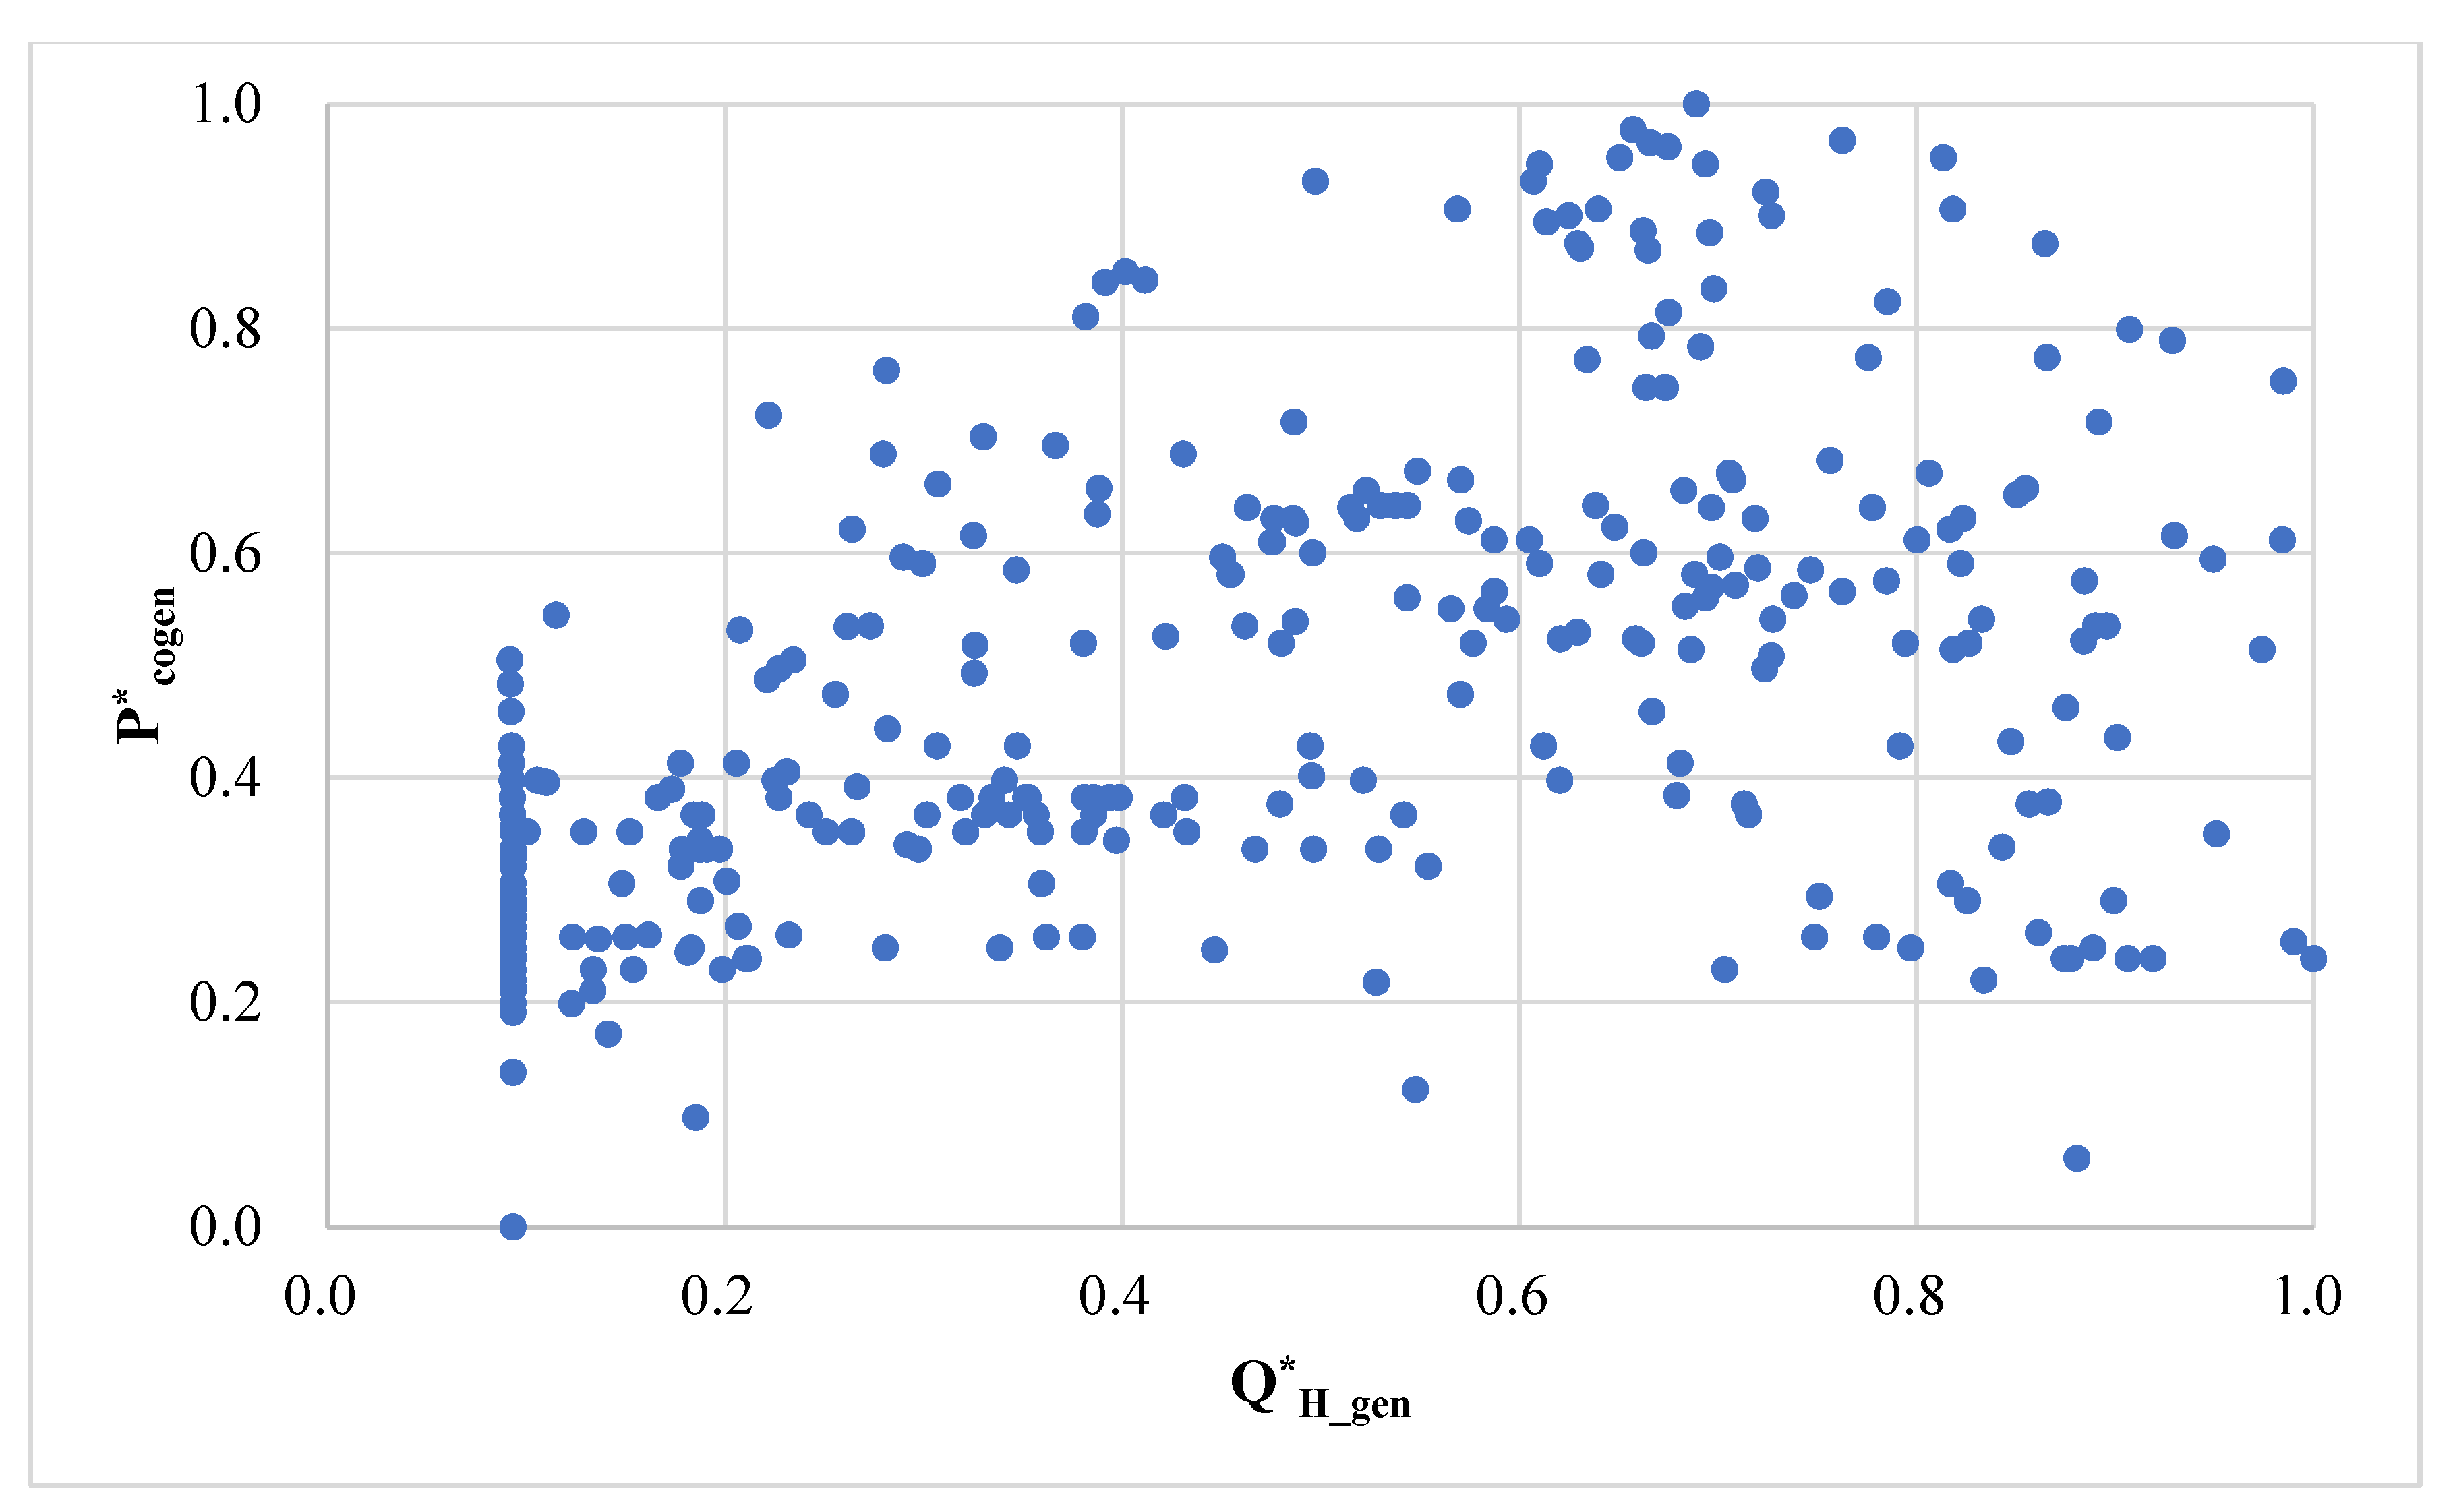
Figure 15 shows the relationship between the key operational parameters for annual operation events in actual field operations for Case D. Unlike in Case A, it is noted that no consistent relationship between the key operating variables is observed. As described previously, it is very difficult to grasp the actual operation strategy adopted in practice from the daily operating data alone. However, from the simulation results for various scenarios as well as different operational modes, it can be postulated that both the overdesigned capacity of CGS’s prime movers and the lack of a systematic operation strategy may be the main cause of the poor operational performance in Case D, which falls far short of general expectations.
3.3. Event-Based Correlation Analysis
In this study, an event-based correlation analysis approach was applied in order to better understand the impact of the operating strategies on securing operating profits from economic or technological aspects. The event-based correlation analysis approach was characterized by a simple but effective measure that allows for qualitative analysis of the causes of differences in outcomes, although it is not possible to easily infer a specific reason for them. As far as possible, the resolution of the obtainable data on key operating variables, such as fuel consumption and energy production, should be high enough to ensure the reliability of the analysis. That is, in order to perform both quantitative and qualitative analysis, it is desirable to secure a minimum of hourly operational data for the key operating variables.
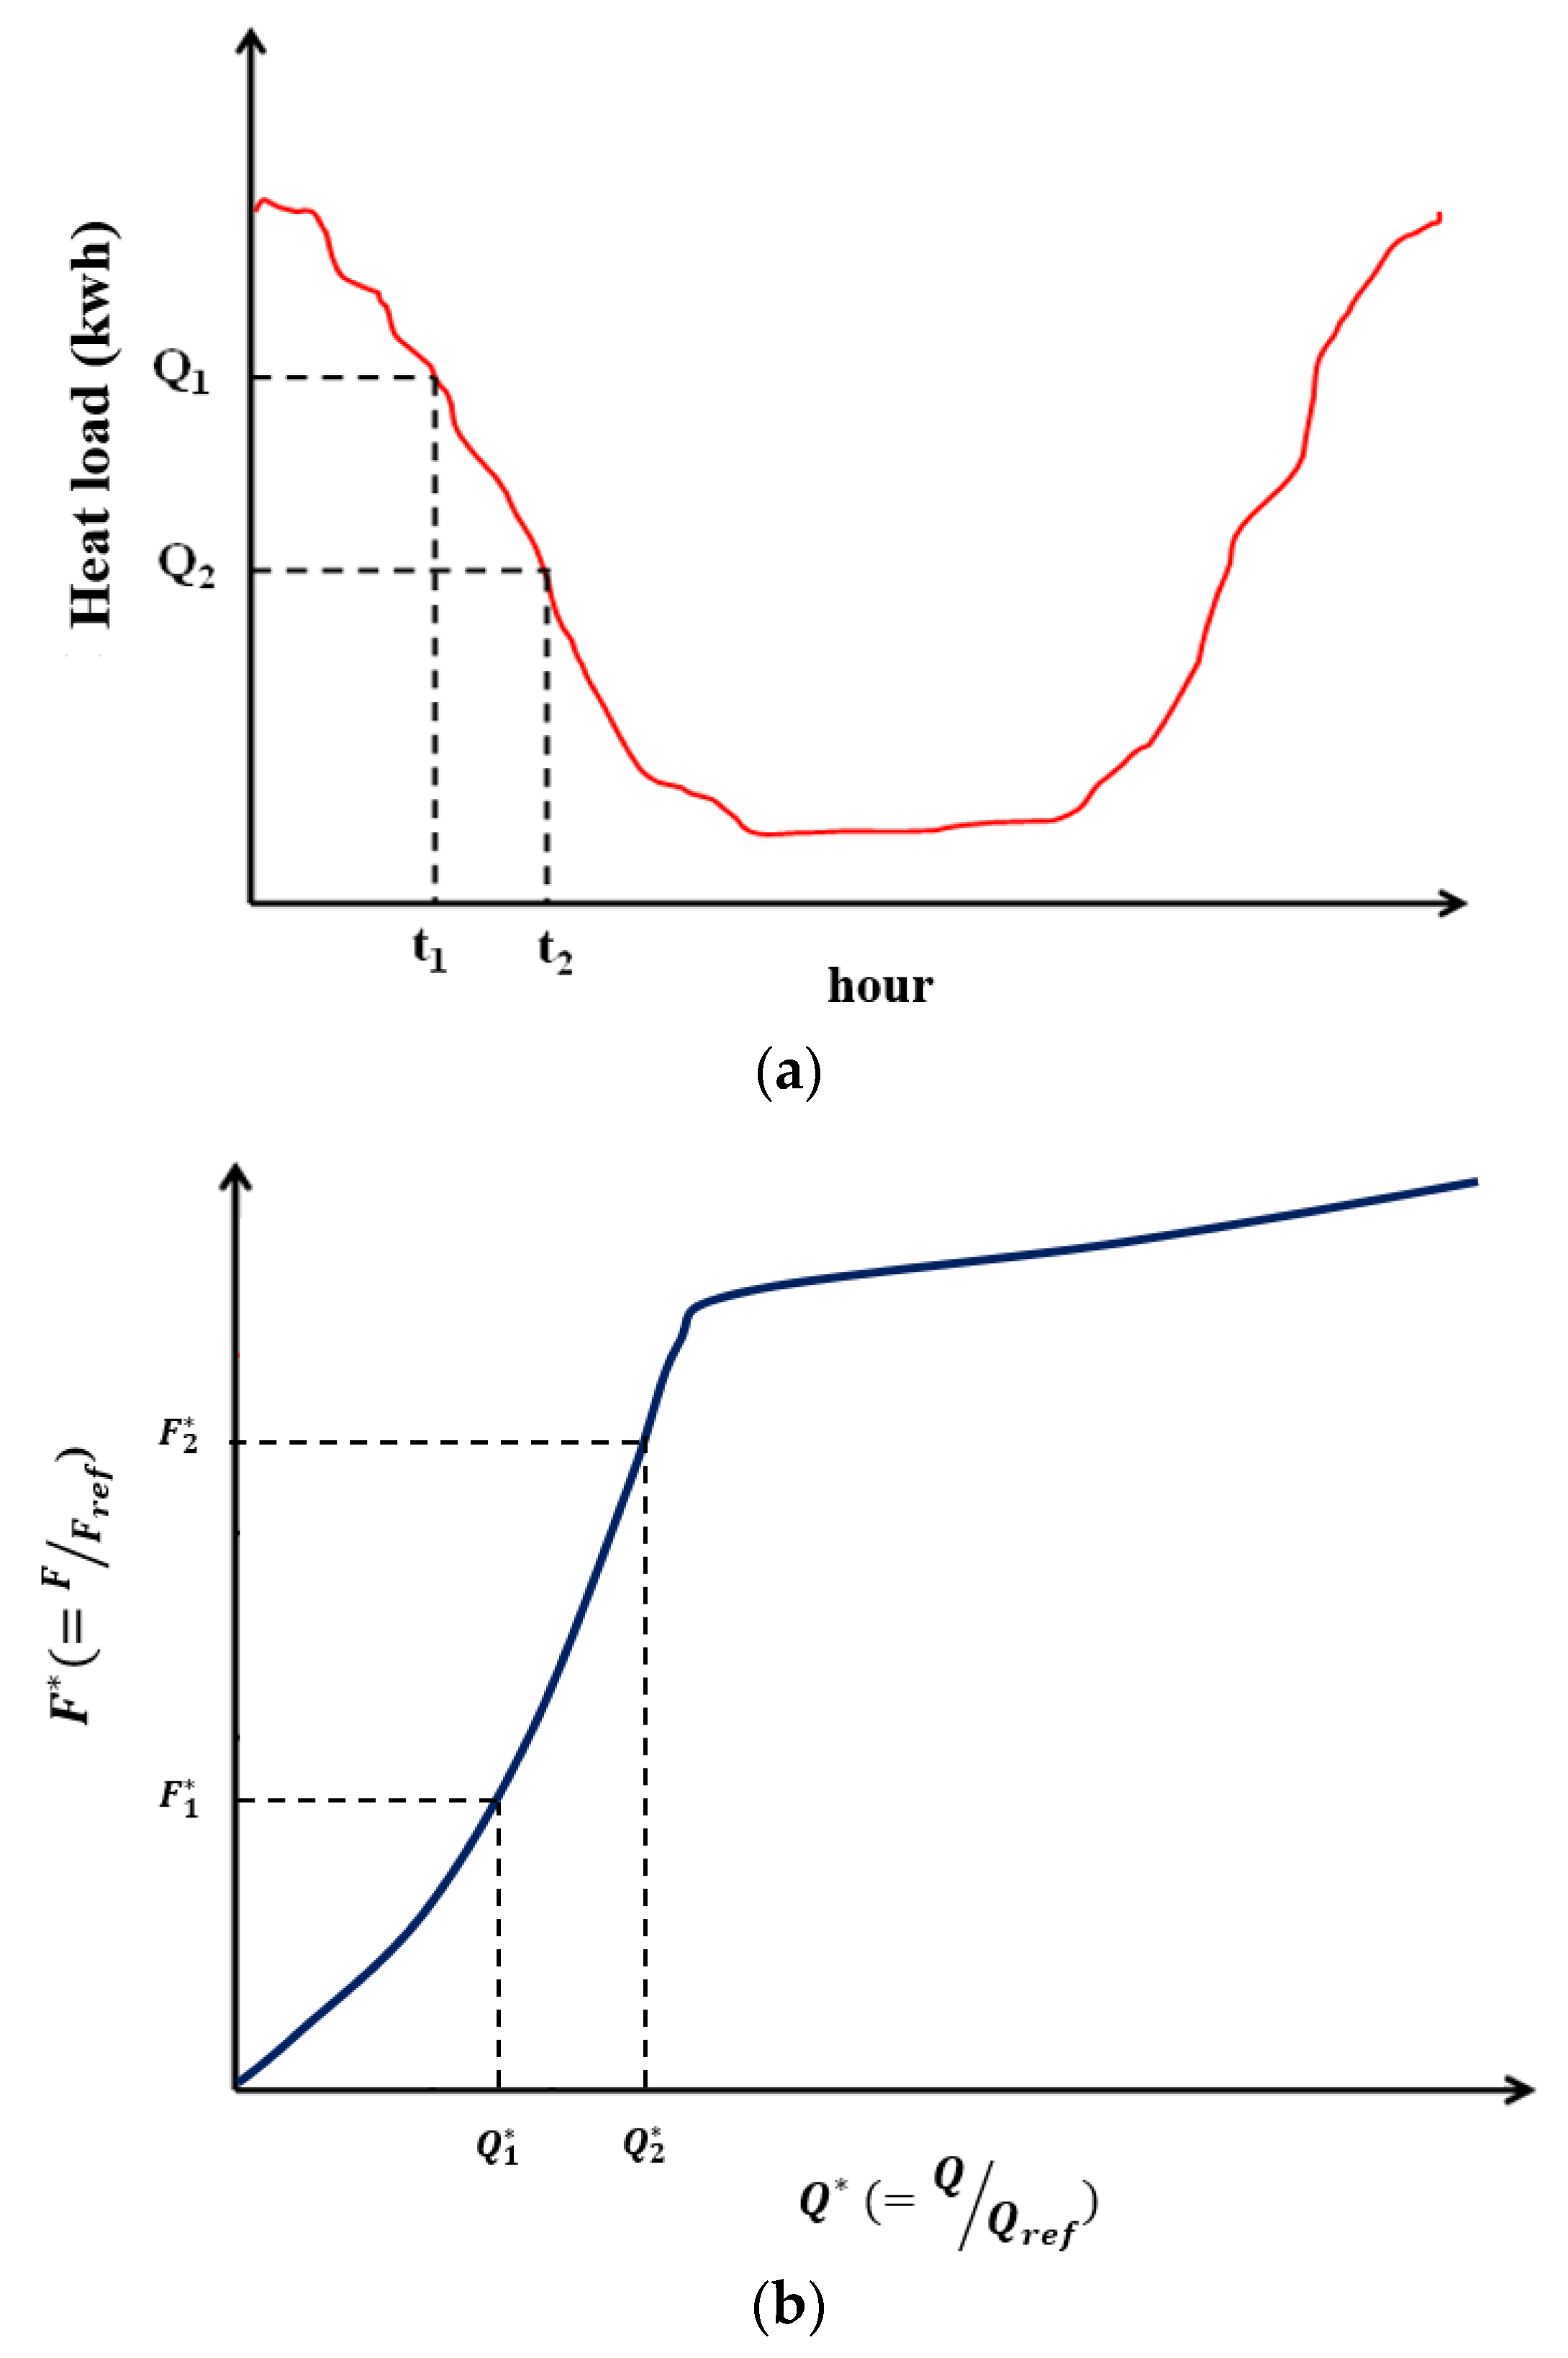
The annual hourly or daily operating data on heat and power production, fuel consumption and energy generation by the facilities can be utilized in order to establish the correlation equations, as was illustrated in Figure 16. Time series-based correlations between key operating variables are a very familiar framework for understanding functional relationships and provide a very simple yet powerful means for intuitively recognizing macroscopic directions or patterns. However, it is hardly possible to grasp detailed and useful information at the level of system control from the time-based functional relationship. Assuming that real operational data reflecting all aspects of a system’s operation strategy can be obtained, it can be assumed that event-based analysis frameworks are more powerful in terms of understanding and exploiting detailed control characteristics, and the functional form of the empirical correlation equation used for the analysis of the CGS system, in this study, can be given as follows,
where
- F: Fuel consumption
- H: Heating production
- P: Power Production
Figure 16.
Illustrative diagram of the correlation between the operating variables in different analysis frameworks. (a) Time series based correlation analysis between operating variables. (b) Event-based correlation analysis between operation variables.
Figure 16.
Illustrative diagram of the correlation between the operating variables in different analysis frameworks. (a) Time series based correlation analysis between operating variables. (b) Event-based correlation analysis between operation variables.

Figure 17 shows an example of event-based correlation diagrams established based on the actual hourly operational data for the DHN. It can be seen that operation modes with very different characteristics are clearly distinguished between the fuel consumption and power generation of CHP. Although some deviations were observed, in general, it can be confirmed that most operating conditions do not deviate significantly from the range of the modelled correlation formula, and, even taking into account differences due to the scale of economies, it should be borne in mind that, unlike in the CGS sector, a highly structured operating strategy has long been applied in the DHN sector.
Even given that the actual operational strategies adopted in the field generally focus on economics rather than technical performance, in the era of climate change, it is evident that a primary energy saving effect lower than the theoretical expectations of the cogeneration model will be negatively affected in competition with new and renewable energy technologies. In addition, it was confirmed that a systematic operation strategy and planning can be a decisive factor in securing practical operational benefits beside adequate capacity design of prime movers. As shown in the diagnostic analysis results for Case D, it was verified that the operation performance of the cogeneration model can vary greatly depending on the operational strategy, even if the prime mover capacity is properly designed.
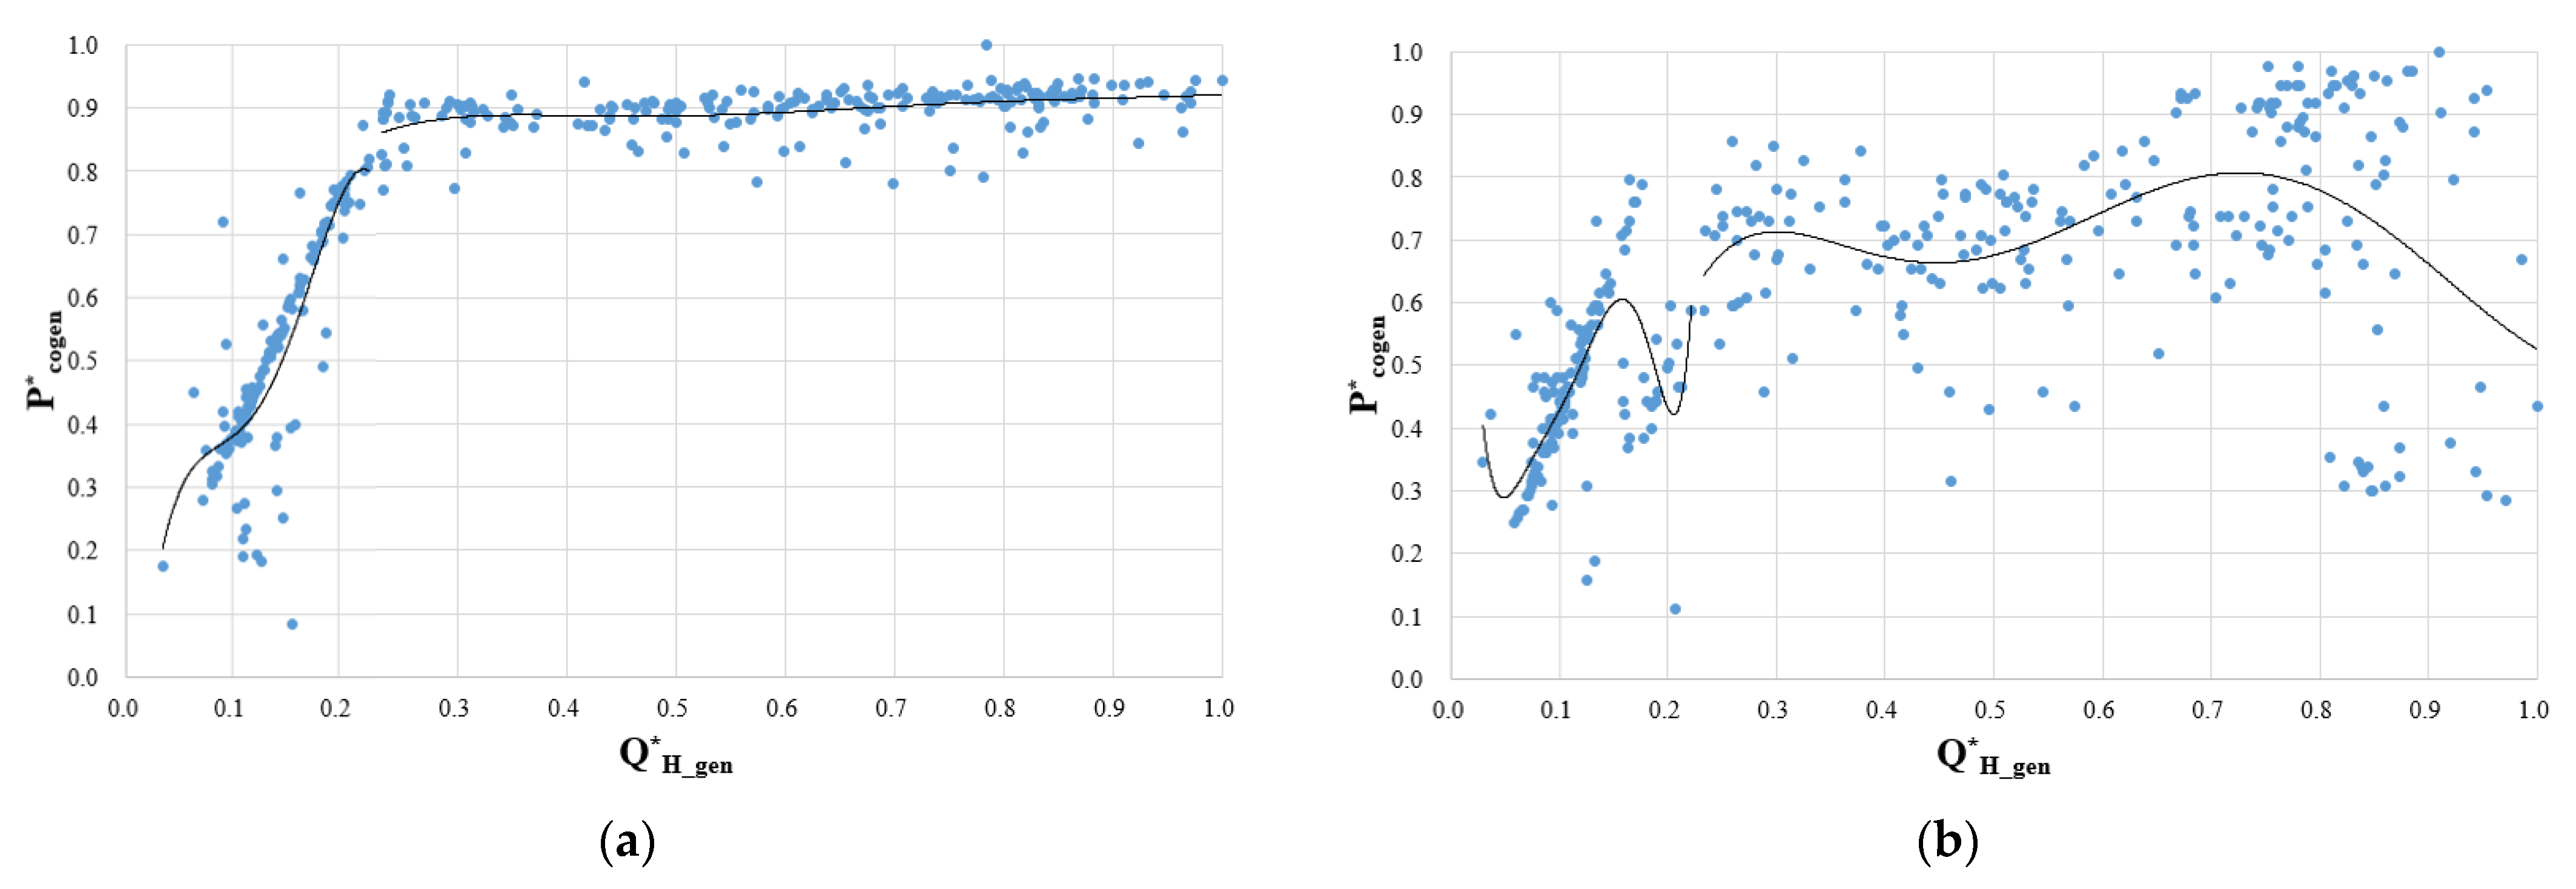
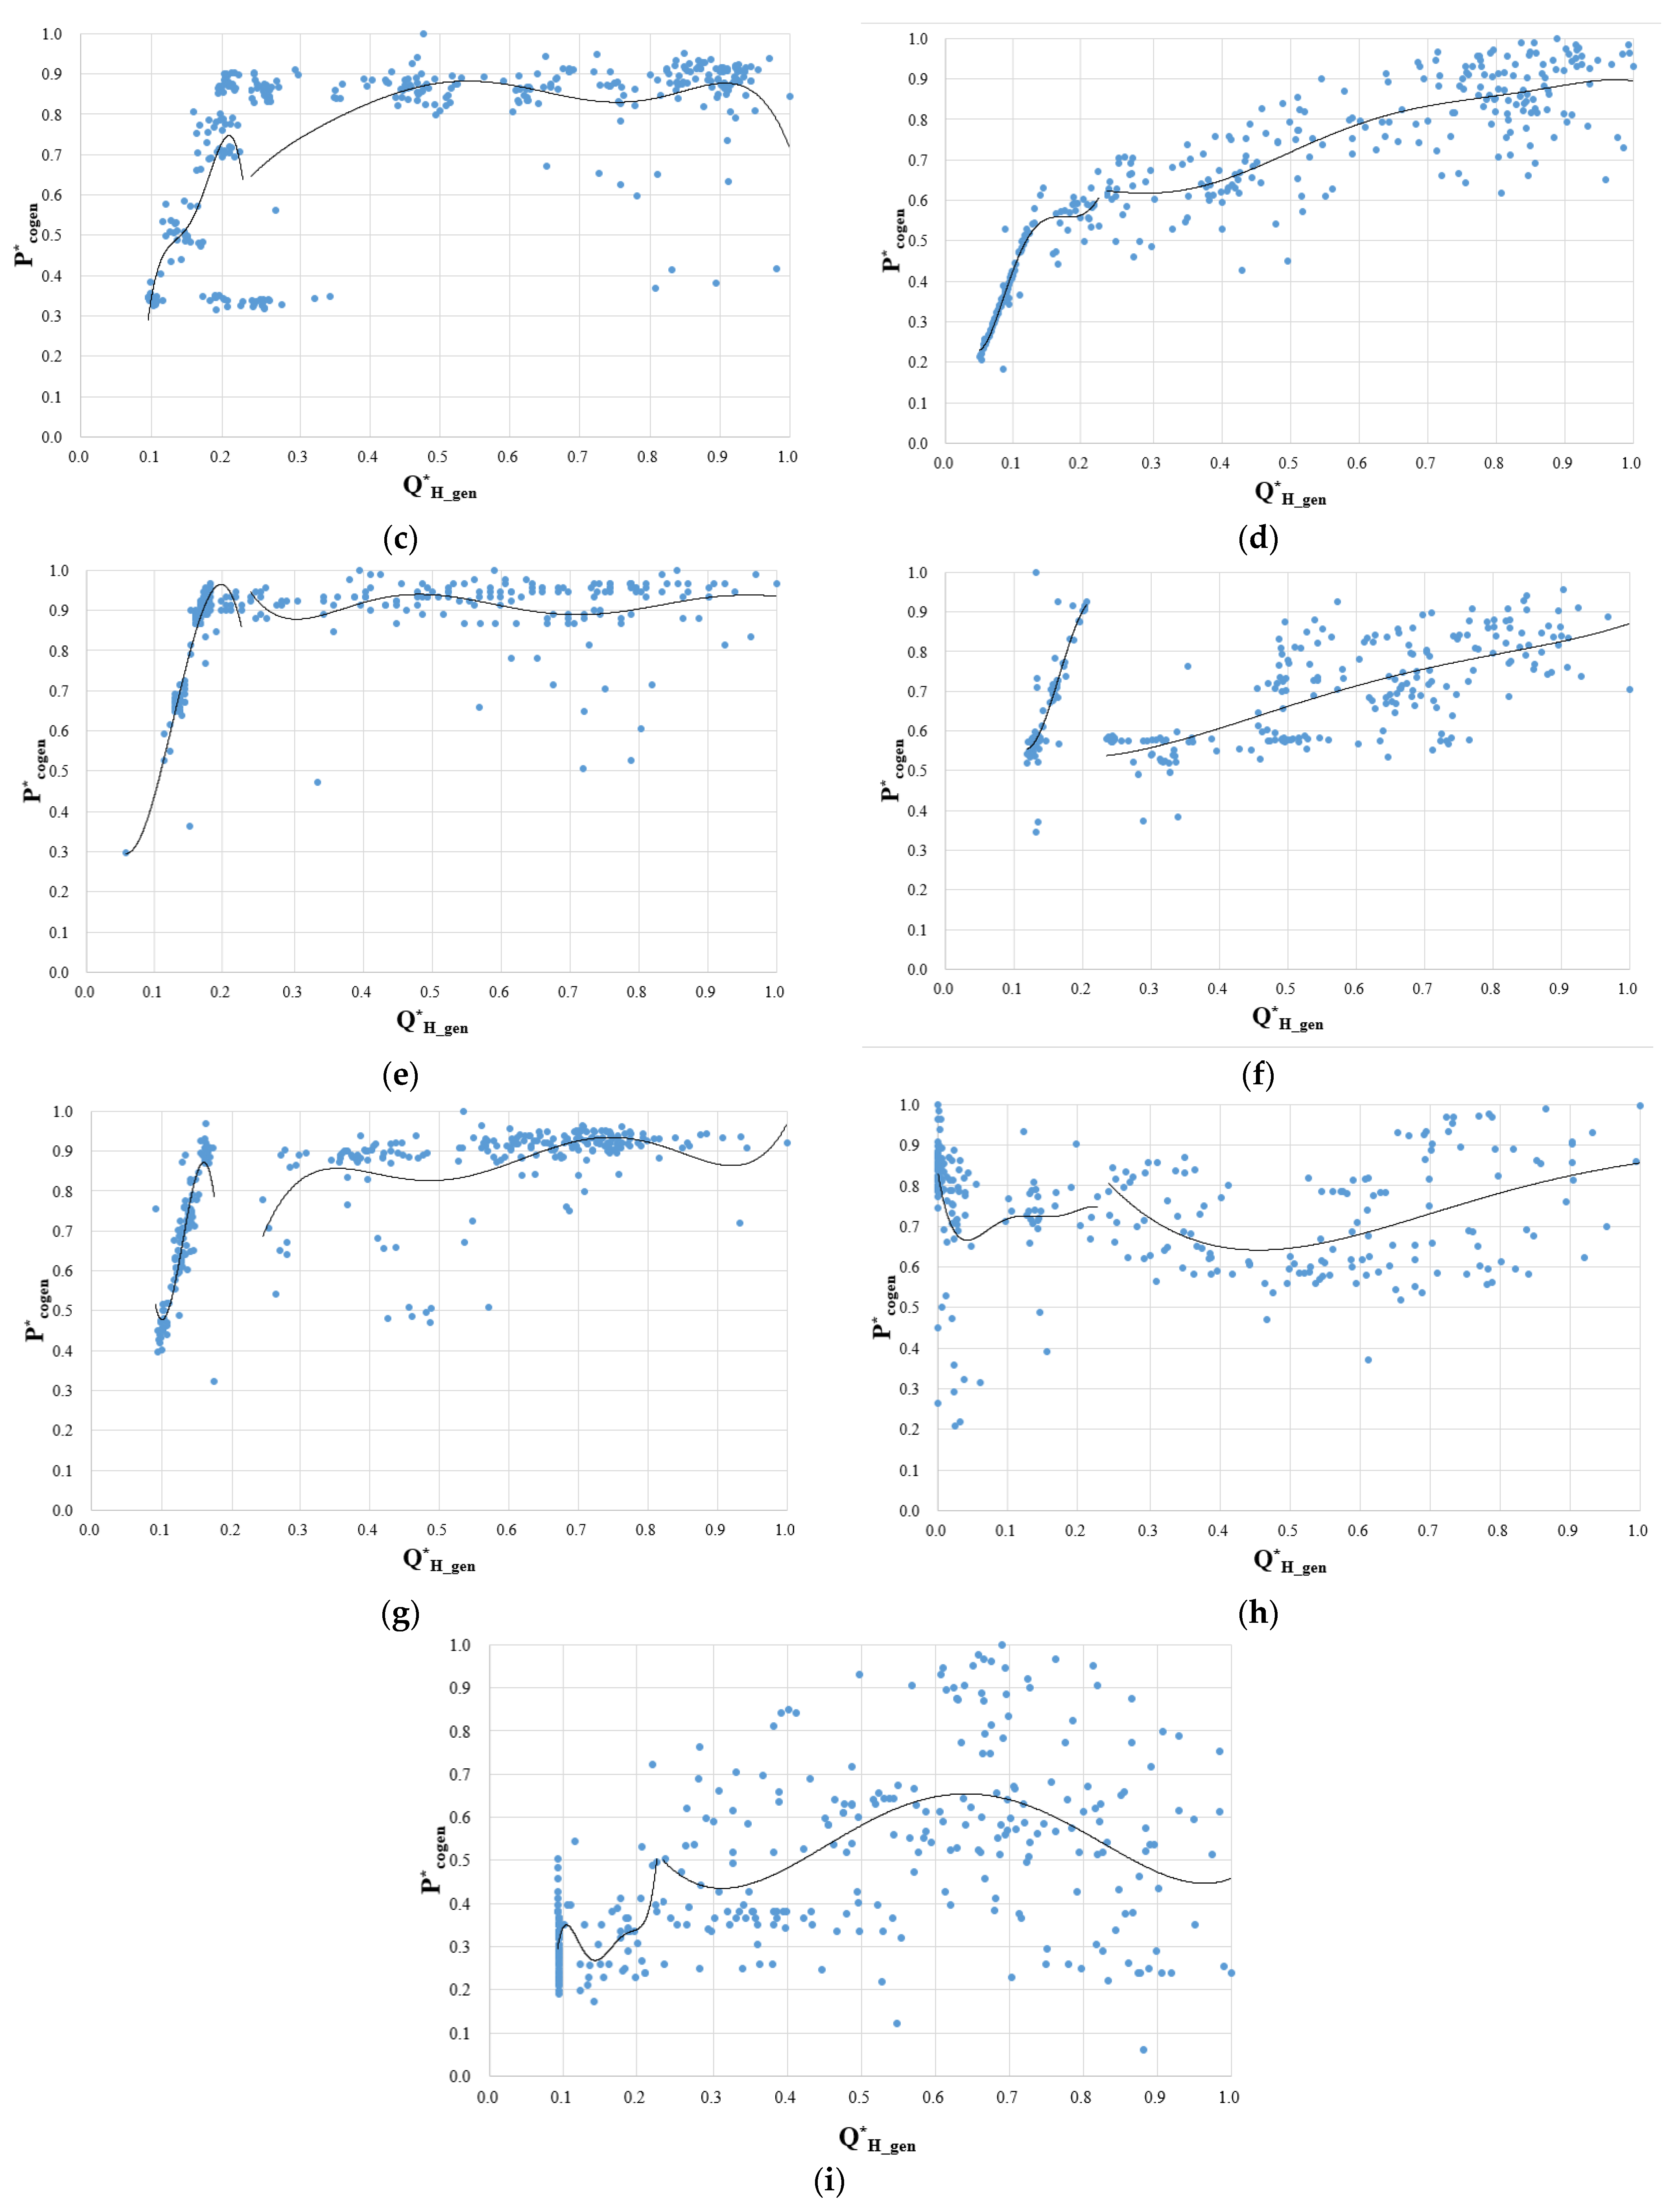
As a result of the investigation into the cogeneration model applied to the apartment complex, it was found that there is a significant deviation in the operational performance depending on the operating conditions of the operation strategy as well as the installed prime mover capacity. Figure 18 shows the status of the relationship between the main operating variables, proposed in this study for the assessment of operational characteristics, for all of the investigated cases. The numbers in parentheses indicate the RPES values as shown in Table 1, and the values of the and of the regression lines represent the operating characteristics during the period when the heating load is high or low, respectively. While it cannot be concluded that the degree of coherence between the operating variables is the decisive factor in determining the overall operational performance, in principle, it can be inferred that the higher the consistency of the relationship between the heat production and power production parameters, the greater the primary energy savings. It can also be concluded that a systematic operation strategy can have great influence in securing the technical advantage of the cogeneration model over SHP. More detailed analysis in quantitative terms is beyond the scope of this study and will be dealt with in further research.
4. Discussions
As briefly described previously, a rapidly expanding supply of renewable energy in the market environment poses a great threat to maintaining the superior position of the cogeneration model in the existing market. Although this study confirmed that there is room for more efficient operation of cogeneration systems through the application of optimal strategies, the effect is largely offset if the impact of the expansion of the renewable energy supply is taken into account. From the perspective of the sustainable technological competitiveness of the cogeneration model, the issue of including the effect of renewable power dissemination in the market on the RPES evaluation of the cogeneration model can become increasingly controversial, and it should be noted that the RPES values presented above have been evaluated reflecting the current status of renewable power generation in the domestic market [24]. Therefore, it will be interesting to evaluate the impact of renewable energy distribution on the RPES according to the extent of market expansion in the coming era of climate change.
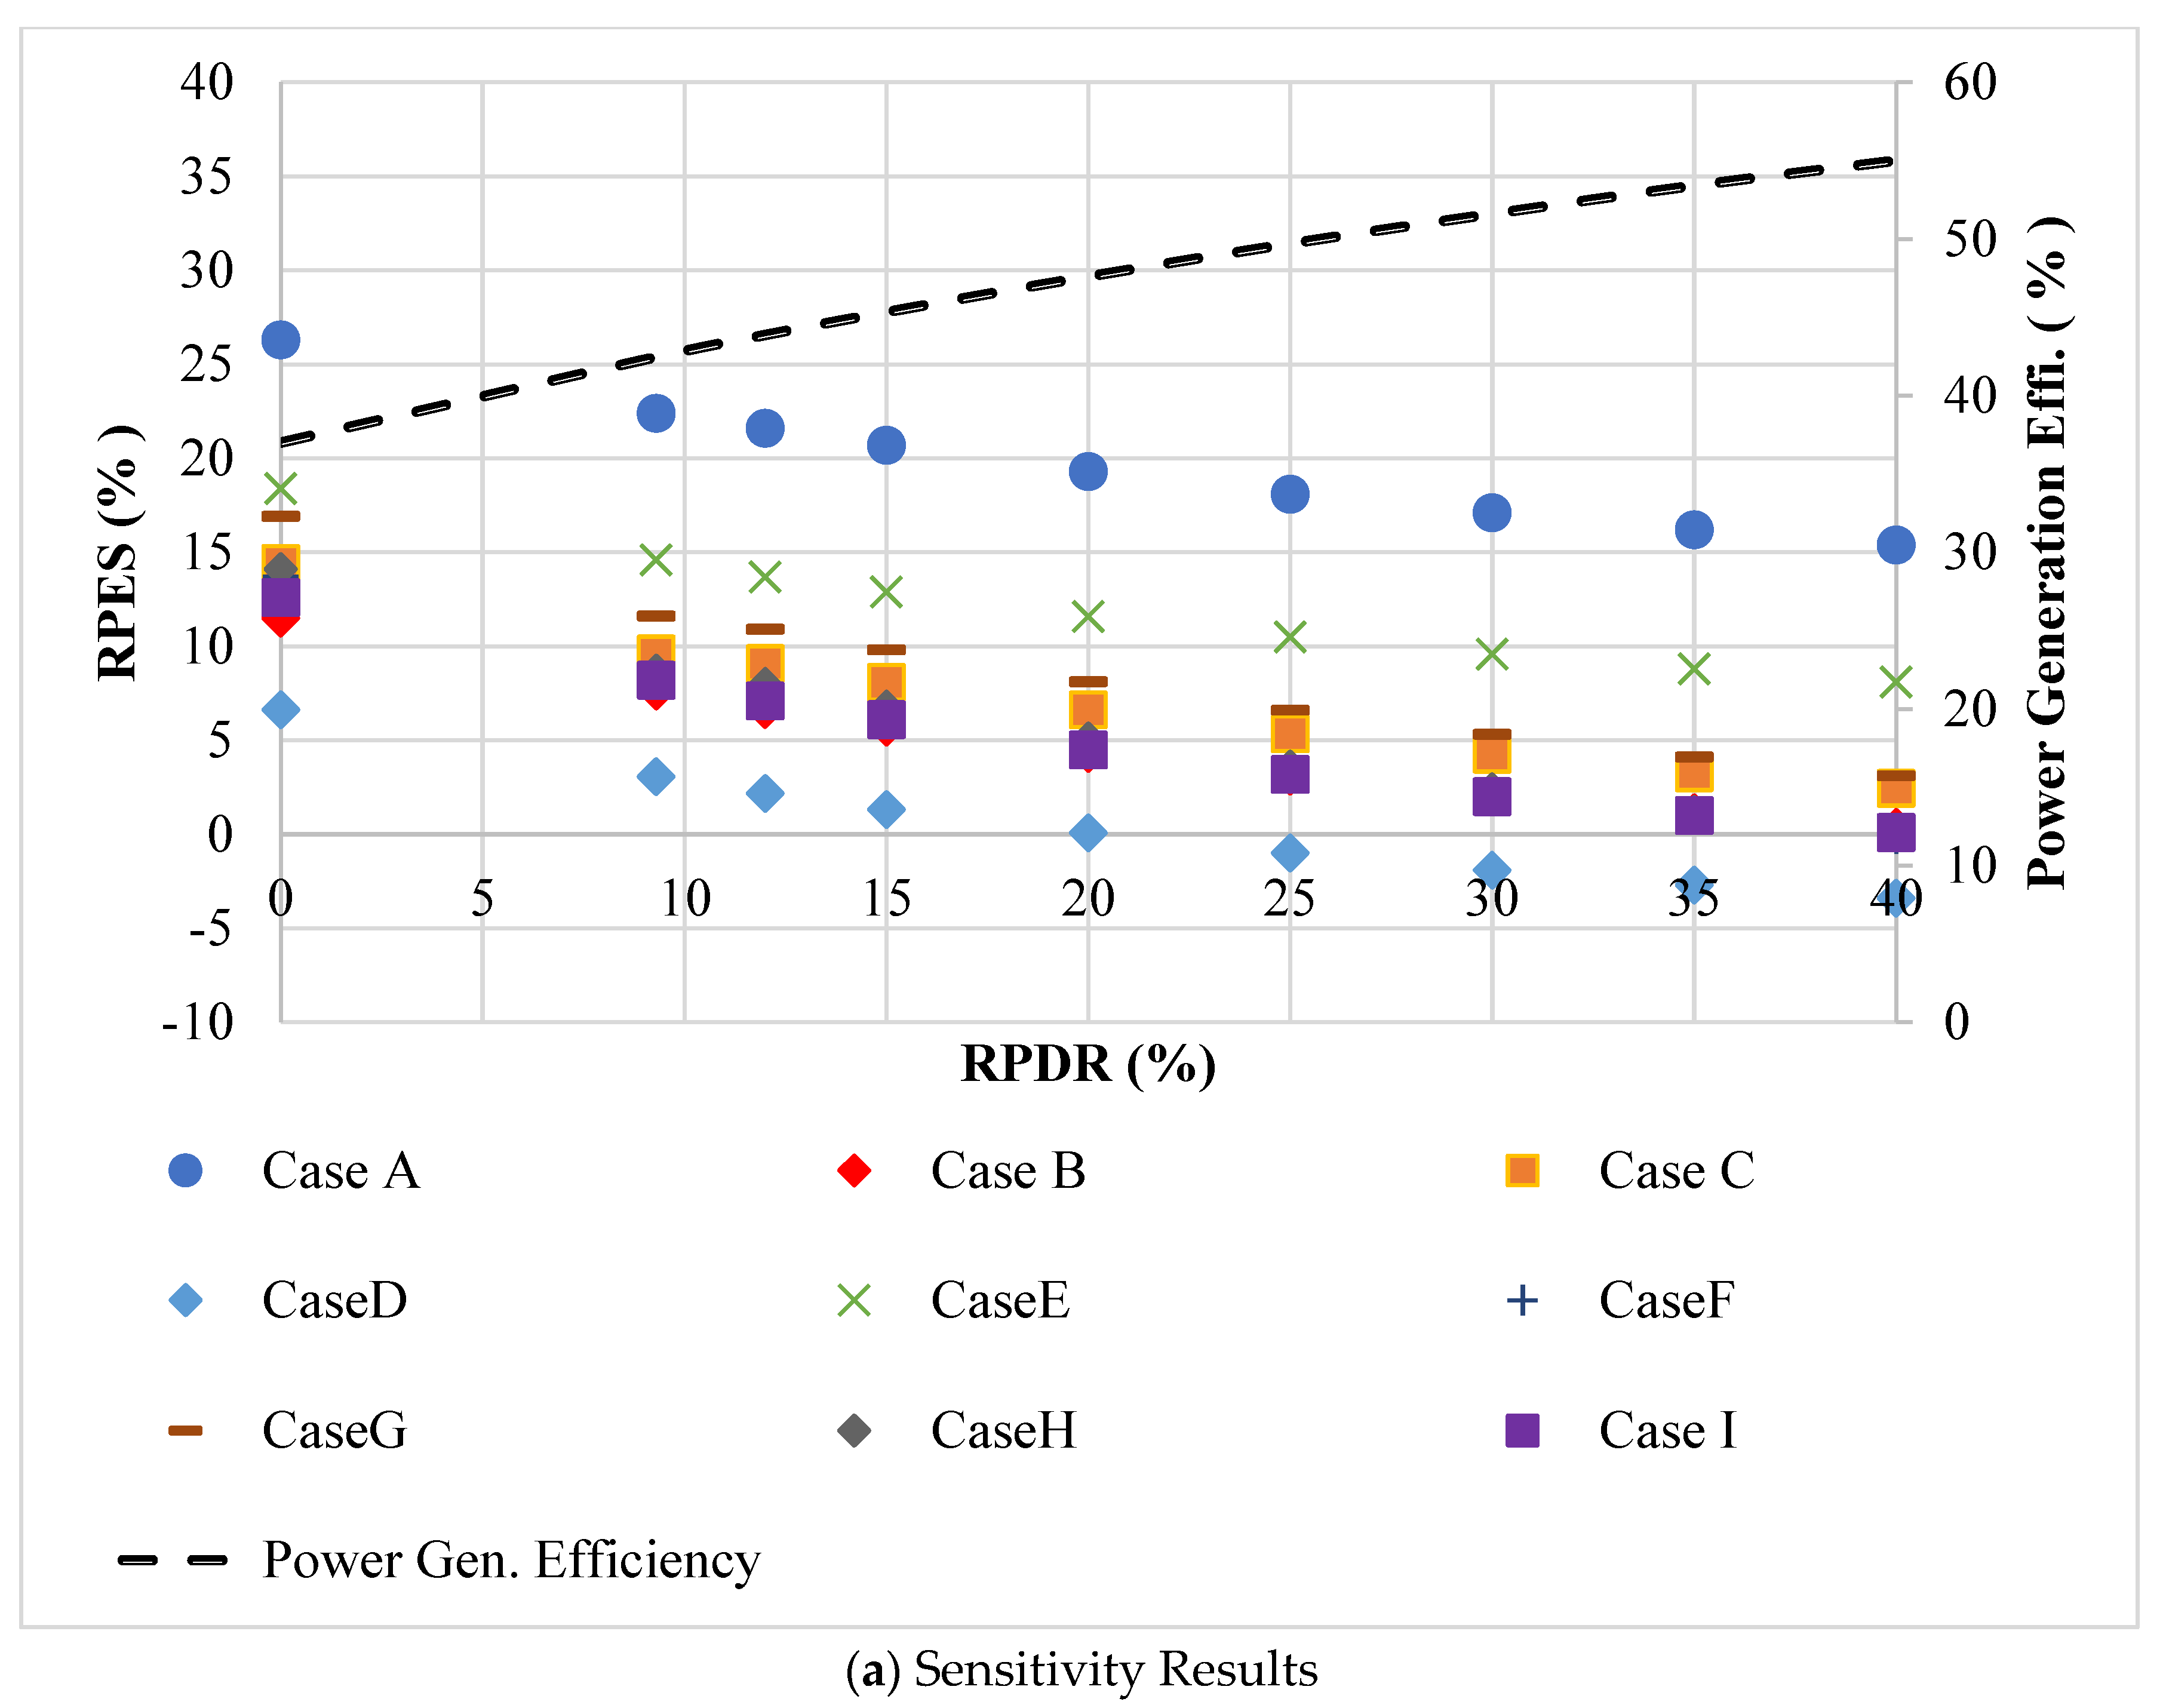
Table 6 summarizes the reference values of the operating parameters adopted in this study for RPES evaluation considering the actual conditions of the Korean domestic market. The change in the RPES value for the investigated cases according to the change to the renewable power distribution rate (RPDR) is shown in Figure 19 along with the change in the overall power conversion efficiency of the SHP. If RPDR is not taken into account when estimating the total power conversion efficiency in SHP, it is estimated to be about 37.5% based on the actual power production statistics of the domestic market. When the RPDR becomes 40%, it is estimated to be about 56%.
It can be seen that the rate of change of the RPES for each case is somewhat different depending on energy demand conditions such as the amount of electricity and heat load. However, as RPDR increases, it tends to decrease rapidly and monotonously. As for Cases A and D, which rank the highest and lowest in terms of overall RPES among the investigated cases, Case A is analyzed to be able to maintain a strong technological edge even if the RPDR approaches 40%. However, in Case D, when the RPDR reaches around 20%, it can be seen that the cogeneration model is no longer as efficient as the SHP. It can be concluded that the advantage of the cogeneration model disappears in most cases, except for two cases when the RPDR reaches around 30%. For example, Case G, in which the current RPES is around 17%, achieves a primary energy savings of 5% when the RPDR reaches 30%. According to Korea’s carbon-neutral target for 2050, which aims to achieve 30% of the RPDR by 2020, it can be seen that the time when the technological superiority of the cogeneration model disappears is imminent, i.e., considering the recent rapid increase in RPDR worldwide, it is to be recognized that the positions of the cogeneration model and SHP could be reversed within a few years in terms of the technological superiority in primary energy saving. As other factors that can have a significant impact on RPES are limited save for applying an optimal operation management solution, the risk of the loss of technological competitiveness for the cogeneration model is unavoidable if appropriate countermeasures are not prepared and applied in a timely manner.
New technological alternatives with regard to sector coupling, such as power to heat, or power to gas, etc., or the 5th generation district heating model, that can compensate for the deterioration of CGS’ technological competitiveness due to the rapid expansion of new and renewable energy discussed above are rapidly appearing in the market. However, for the sake of simplicity and convenience, a hybrid concept of the cogeneration model integrated with a heat pump is proposed in this study to check for new opportunities to maintain techno-economic competitiveness in the market in a rather simplistic manner. A detailed theoretical analysis and performance evaluation of the various technical alternatives will be performed in future studies.
In the application for apartment complexes, it is the PLB that covers the main heat demand, not the prime mover of the cogeneration system. It can be estimated that more than 70% of the heating load throughout the year is to be covered by the PLB, since optimal prime mover capacity is not recommended to be designed to cover the maximum hot tap water load in summer due to the lack of a heat-driven cooling load. However, even in the unfavorable circumstances of a lack of a heat-driven cooling load in terms of utilizing waste heat from prime movers, the hybrid cogeneration system with an integrated heat pump can successfully replace the role of PLB with a heat pump and is expected to show superior performance over the currently applied model.
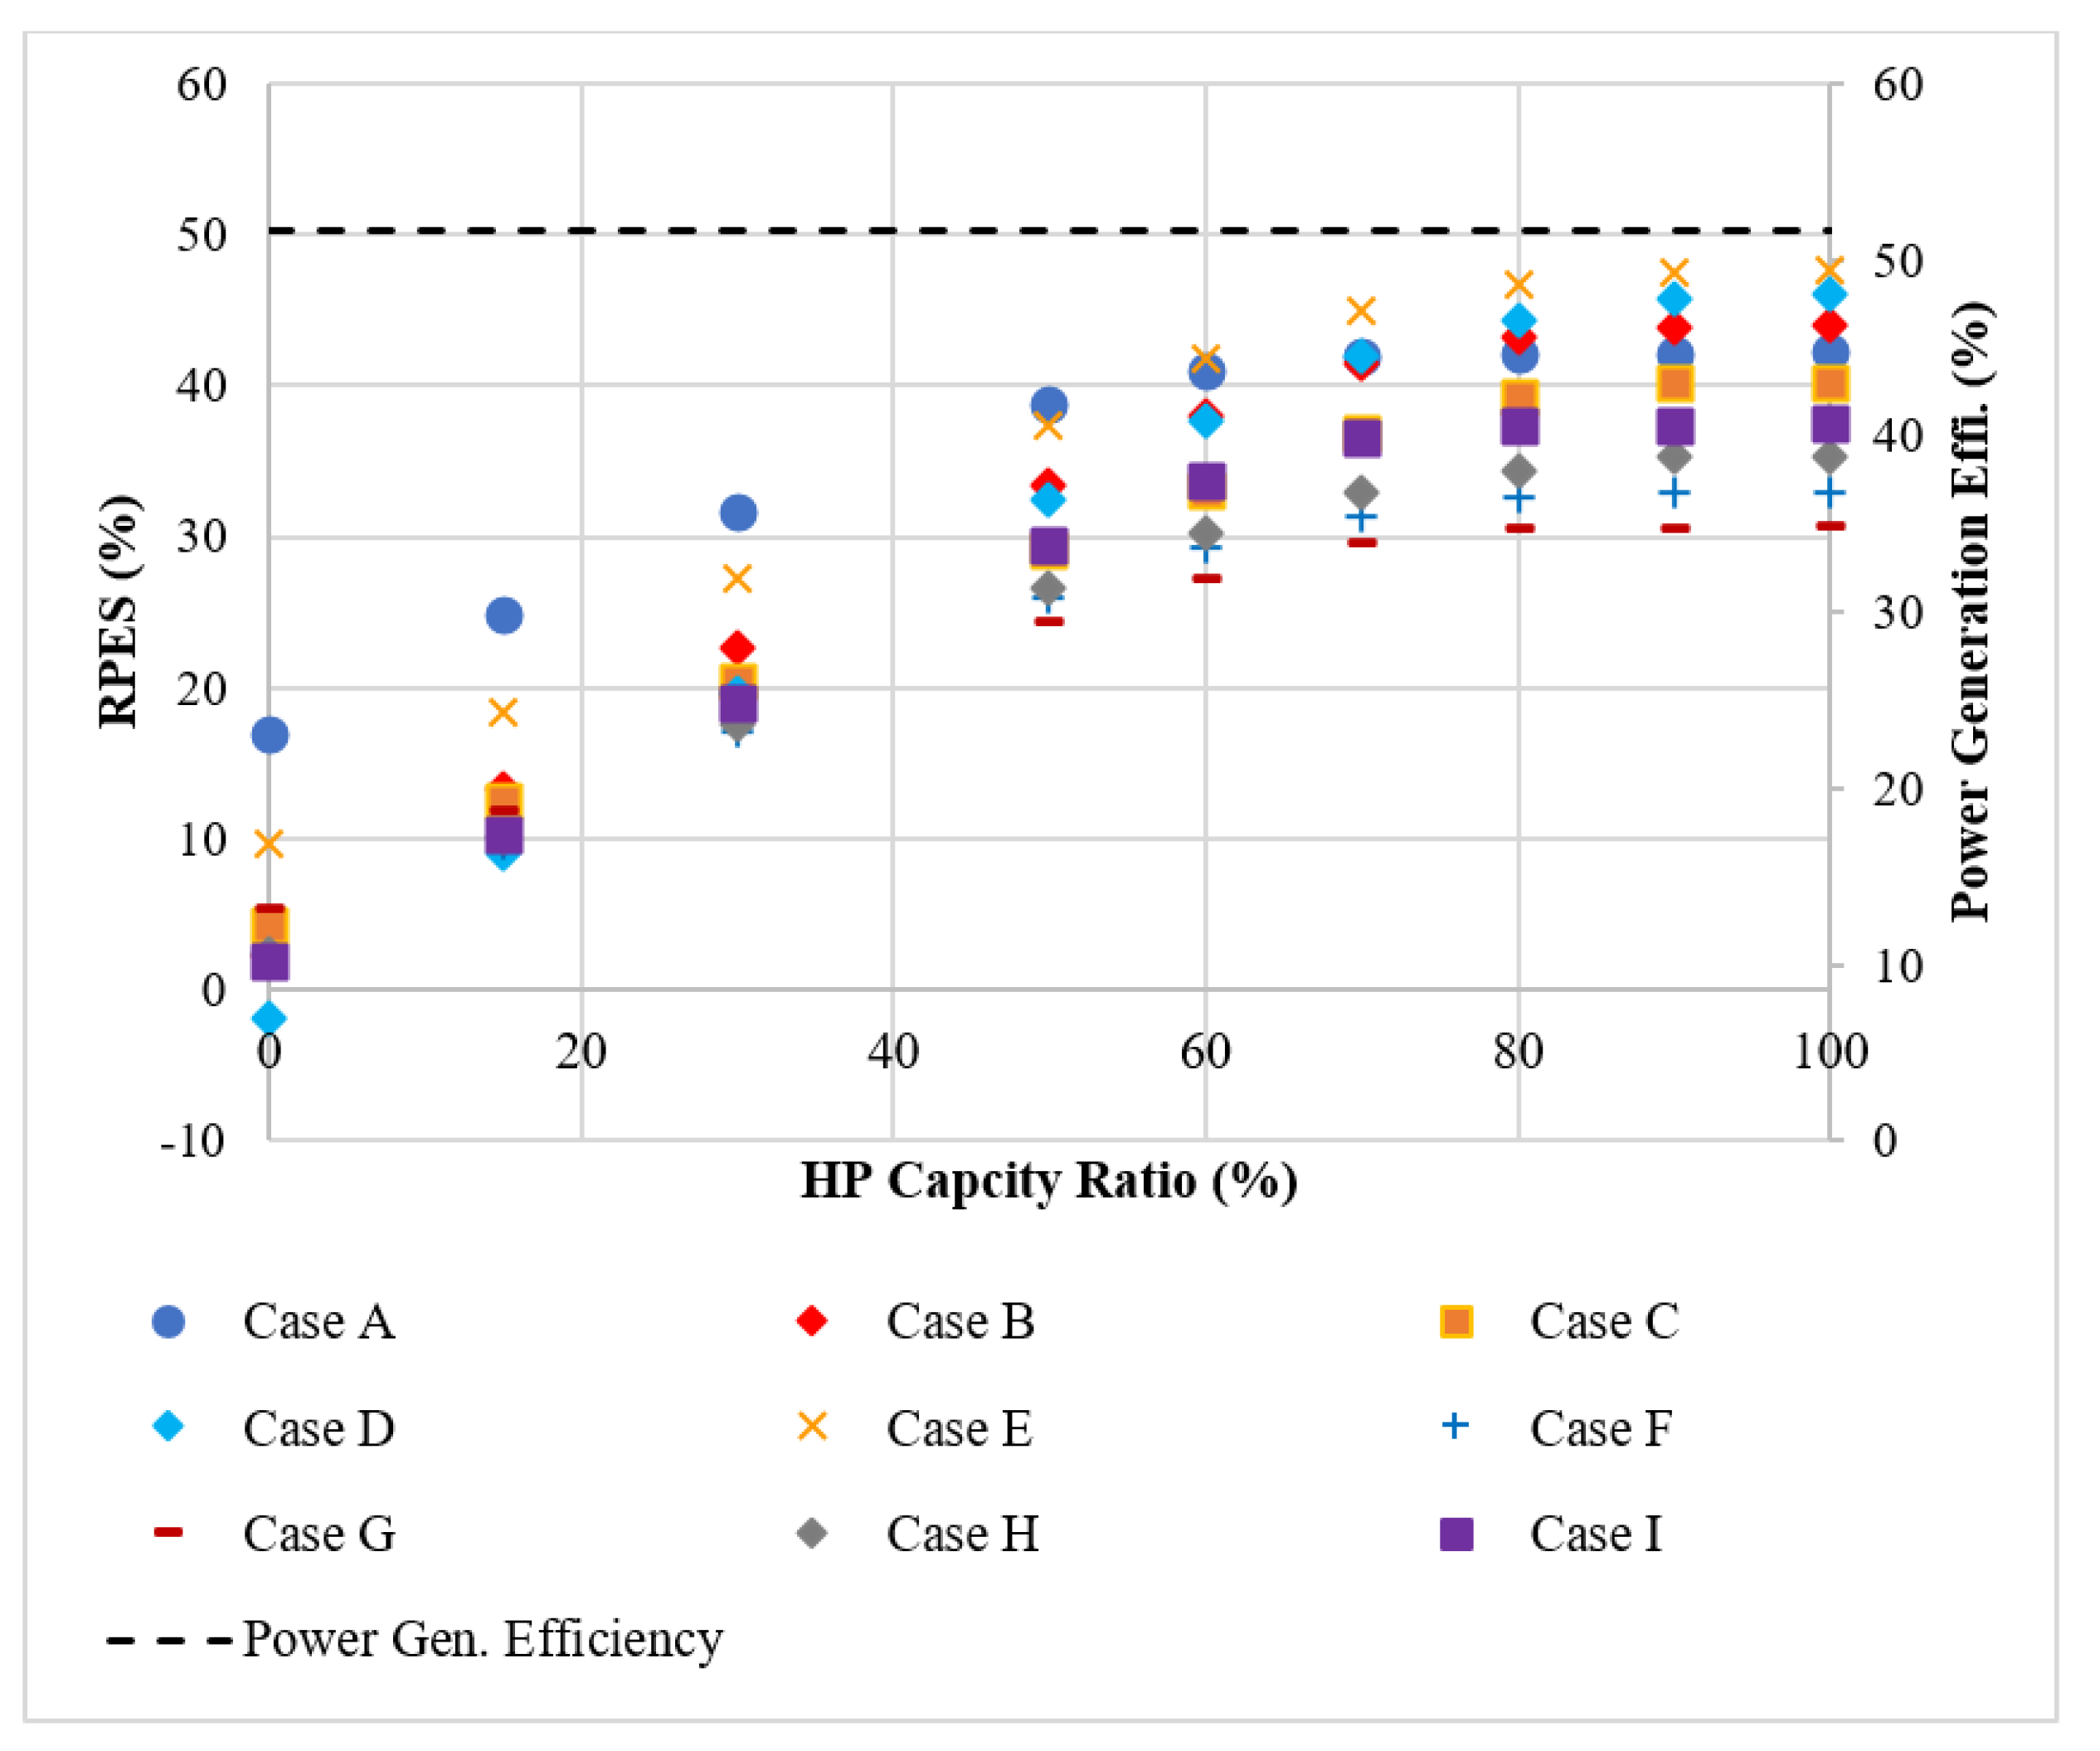
Figure 20 shows the change in the RPES according to the share of heat supplied by the heat pump for the various cases. The analysis results are evaluated from the investigated daily operating data for the cases presented in the survey. In this analysis it is assumed that the COP of the heat pump is fixed at 3.8 and that the operation of the heat pump is not related to the operation of the prime mover, that is, it was only involved in the heat generation process to replace the heat supplied by the PLB. The annual total RPES tends to increase continuously with the heat production by the heat pump, which, substituting the heat supply by the PLB, increases as shown in Figure 20. It can be seen that the rate of change of the RPES according to the heat pump capacity is not constant, and the slope gradually decreases as the ratio of the heat pump capacity increases. From the above sensitivity analysis results, it is analyzed that, under the conditions of 40% renewable power distribution, more-or-less 30% of heat demand replacement with the heat pump instead of PLB could secure more-or-less 20% of the RPES over SHP. It can also be confirmed that simply replacing a part of the heat demand to be supplied by the PLB with a heat pump can be an effective measure to secure the technological and economic competitiveness of the cogeneration model.
5. Conclusions
In this study, the technological competitiveness of the cogeneration model in response to changes in the market environment due to climate change was evaluated by performing diagnostic operation simulation analysis based on the annual field operation data for nine installation cases in apartment complexes. From the diagnostic simulation results using an in-house-developed dynamic operation simulation tool and event-based correlation analysis using actual operations data, the conclusion of this study can be summarized as follows.
- -
- From the survey of actual operating conditions, the range of achievement of RPES showed a large deviation from the bottom 3% to the top 22%, and it can be inferred that various factors that were not considered from a theoretical point of view are acting in securing the technological performance of the cogeneration model in field operations.
- -
- There is considerable room to improve the technological excellence of the cogeneration model, such as by applying an optimal operating strategy. However, it is necessary to consider the negative impact of the recent rapid expansion of new and renewable energy on the technological superiority of the cogeneration model.
- -
- From the assessment of change in the RPES value for the investigated cases according to the change to the RPDR, it was confirmed that the technological superiority of the cogeneration model over the SHP method significantly decreased when the RPDR reached the level of 30%.
- -
- It was ascertained that, under the condition of 40% renewable power distribution, more-or-less 30% of the heat demand replacement with a heat pump instead of PLB can secure more-or-less 20% of the RPES over SHP.
- -
- Among the variety of technical alternatives to compensate for the CGS model’s deteriorating technological competitiveness, a simple model of heat pump integration by simply substituting PLB operation has been verified to have a significant RPES enhancement.
In order to achieve the development of a sustainable cogeneration model in response to the rapid expansion of renewable energy in the power sector, a hybrid concept of a cogeneration model integrated with a heat pump can provide new opportunities to maintain current technological competitiveness even in the era of climate change.
Funding
This research was funded by the Korea Institute of Planning and Evaluation for Technology in Food, Agriculture and Forestry [IPET] and the Korea Smart Farm R&D Foundation [KosFarm] through the Smart Farm Innovation Technology Development Program, funded by the Ministry of Agriculture, Food and Rural Affairs [MAFRA] and the Ministry of Science and ICT [MSIT] (Project No. 421039-03), and Rural Development Administration [RDA] through the support of “Cooperative Research Program (Project No. PJ0162122022)”.
Data Availability Statement
Not applicable.
Conflicts of Interest
The authors declare no conflict of interest.
Nomenclature
| CHP | Combined Heat and Power |
| ELFM | Electricity Load Following Mode |
| HLFM | Heat Load Following Mode |
| PLB | Pear Load Boiler |
| RPDR | Renewable Power Distribution Rate |
| SHP | Separate Heat and Power |
| RPES | Relative Primary Energy Savings |
| Greek symbols | |
| Boiler Efficiency | |
| . | Power Conversion Efficiency of Non-CHP Thermal Power Plants in SHP |
| . | Power Distribuon Loss |
| Thermal Efficincy of the Cogeneration System | |
| . | Thermal Efficiency Reference Value for SHP |
| The Power Generated from Cogeneration System | |
| Total Heat Produced by the Boiler and the Cogeneration system |
References
- Eurostat. 2019–2019 COGEN Europe National Snapshot Survey. European Commission. 2019. Available online: https://www.cogeneurope.eu/images/COGEN-Europe_National-Cogeneration-Snapshot-Survey_Executive-Summary_2018-2019.pdf (accessed on 15 September 2022).
- Rosato, A.; Sibilio, S.; Scorpio, M. Dynamic performance assessment of a residential building-integrated cogeneration system under different boundary conditions. Part II: Environmental and economic analyses. Energy Convers. Manag. 2014, 79, 749–770. [Google Scholar] [CrossRef]
- Keirstead, J.; Samsatli, N.; Shah, N.; Weber, C. The impact of CHP planning restrictions on the efficiency of urban energy systems. Energy 2012, 41, 93–103. [Google Scholar] [CrossRef]
- Napoli, R.; Gandiglio, M.; Lanzini, A.; Santarelli, M. Techno-economic analysis of PEMFC and SOFC micro-CHP fuel cell systems for the residential sector. Energy Build. 2015, 103, 131–146. [Google Scholar] [CrossRef]
- Armanasco, F.; Colombo, L.P.M.; Lucchini, A.; Rossetti, A. Techno-economic evaluation of commercial cogeneration plants for small and medium size companies in the Italian industrial and service sector. Appl. Therm. Eng. 2012, 48, 402–413. [Google Scholar] [CrossRef]
- Atănăsoae, P. Technical and Economic Assessment of Micro-Cogeneration Systems for Residential Applications. Sustainability 2020, 12, 1074. [Google Scholar] [CrossRef]
- Chen, H.; Wu, Y.; Xu, S.; Xu, G.; Yang, Y.; Liu, W. Thermodynamic and economic evaluation of a novel heat supply design using low-pressure feed water in a cogeneration plant. Appl. Therm. Eng. 2020, 166, 114672. [Google Scholar] [CrossRef]
- Mohammadi, K.; Powell, K. Thermodynamic and economic analysis of different cogeneration and tri-generation systems based on carbon dioxide vapor compression refrigeration systems. Appl. Therm. Eng. 2020, 164, 114503. [Google Scholar] [CrossRef]
- Liu, J.; Kim, S.-C.; Shin, K.-Y. Feasibility Study and Economic Analysis of a Fuel-Cell-Based CHP System for a Comprehensive Sports Center with an Indoor Swimming Pool. Energies 2021, 14, 6625. [Google Scholar] [CrossRef]
- Quaggiotto, D.; Vivian, J.; Zarrella, A. Management of a district heating network using model predictive control with and without thermal storage. Optim. Eng. 2021, 22, 1897–1919. [Google Scholar] [CrossRef]
- Gu, W.; Wang, J.; Lu, S.; Luo, Z.; Wu, C. Optimal operation for integrated energy system considering thermal inertia of district heating network and buildings. Appl. Energy 2017, 199, 234–246. [Google Scholar] [CrossRef]
- Guelpa, E.; Barbero, G.; Sciacovelli, A.; Verda, V. Peak-saving in district heating systems through optimal management of the thermal request of buildings. Energy 2017, 137, 706–714. [Google Scholar] [CrossRef]
- Pirkandi, J.; Jokar, M.A.; Sameti, M.; Kasaeian, A.; Kasaeian, F. Simulation and multi-objective optimization of a combined heat and power (CHP) system integrated with low-energy buildings. J. Build. Eng. 2016, 5, 13–23. [Google Scholar] [CrossRef]
- Zhao, S.; Ge, Z.; Sun, J.; Ding, Y.; Yang, Y. Comparative study of flexibility enhancement technologies for the coal-fired combined heat and power plant. Energy Convers. Manag. 2019, 184, 15–23. [Google Scholar] [CrossRef]
- Gravelsins, A.; Pakere, I.; Tukulis, A.; Blumberga, D. Solar power in district heating. P2H flexibility concept. Energy 2019, 181, 1023–1035. [Google Scholar] [CrossRef]
- Salpakari, J.; Mikkola, J.; Lund, P.D. Improved flexibility with large-scale variable renewable power in cities through optimal demand side management and power-to-heat conversion. Energy Convers. Manag. 2016, 126, 649–661. [Google Scholar] [CrossRef]
- Schweiger, G.; Rantzer, J.; Ericsson, K.; Lauenburg, P. The potential of power-to-heat in Swedish district heating systems. Energy 2017, 137, 661–669. [Google Scholar] [CrossRef]
- Zamasz, K.; Kapłan, R.; Kaszyński, P.; Saługa, P. An Analysis of Support Mechanisms for New CHPs: The Case of Poland. Energies 2020, 13, 5635. [Google Scholar] [CrossRef]
- Jung, S.H.; Feng, T. Government subsidies for green technology development under uncertainty. Eur. J. Oper. Res. 2020, 286, 726–739. [Google Scholar] [CrossRef]
- Eurostat. Combined Heat and Power (CHP) Generation; Directive 2021/27/EU; European Council: Brussels, Belgium, 2021. [Google Scholar]
- Chung, M.; Lee, S.G.; Park, C.; Park, H.-C.; Im, Y.-H. Development of a Combined Energy-Demands Calculator for Urban Building Communities in Korea. Environ. Plan. B Plan. Des. 2013, 40, 289–310. [Google Scholar] [CrossRef]
- Chung, M.; Park, H.-C. Development of a software package for community energy system assessment–Part I: Building a load estimator. Energy 2010, 35, 2767–2776. [Google Scholar] [CrossRef]
- Chung, M.; Park, H.-C. Building energy demand patterns for department stores in Korea. Appl. Energy 2012, 90, 241–249. [Google Scholar] [CrossRef]
- Korean Electric Power Statistics 2020. KEPCO. Available online: https://home.kepco.co.kr/kepco/KO/ntcob/ntcobView.do?pageIndex=1&boardSeq=21047466&boardCd=BRD_000099&menuCd=FN05030103&parnScrpSeq=0&categoryCdGroup=®DateGroup2= (accessed on 16 September 2022).
Figure 1.
Illustrative diagram of the procedure to calculate RPES of CGS.

Figure 2.
Relationship between RPES and operational cost–benefits for the investigated cases.

Figure 3.
Simplified flowchart for the simulation procedure.

Figure 4.
Example of annual hourly load profile from the load estimator. (a) Overall annual hourly heating load of the building. (b) Overall annual hourly cooling load of the building. (c) Overall annual hourly power load for the building.
Figure 4.
Example of annual hourly load profile from the load estimator. (a) Overall annual hourly heating load of the building. (b) Overall annual hourly cooling load of the building. (c) Overall annual hourly power load for the building.


Figure 5.
Comparison of the monthly operating cost and net benefits before and after the installation of the cogeneration system.
Figure 5.
Comparison of the monthly operating cost and net benefits before and after the installation of the cogeneration system.

Figure 6.
Annual daily and monthly averaged self-power supplying ratio according to the cogeneration system operation.
Figure 6.
Annual daily and monthly averaged self-power supplying ratio according to the cogeneration system operation.

Figure 7.
Annual hourly heating demand and supply profiles by facility for Case A.


Figure 8.
Annual total RPES calculated based on the simulation results for the scenarios.

Figure 9.
Comparison of the simulated operational cost–benefit in Case A.

Figure 10.
Comparison of the simulated operational cost–benefit for each scenario with the installation costs of the cogeneration system in Case A.
Figure 10.
Comparison of the simulated operational cost–benefit for each scenario with the installation costs of the cogeneration system in Case A.

Figure 11.
Relationship between the key operational parameters for annual operation events in Case A.
Figure 11.
Relationship between the key operational parameters for annual operation events in Case A.

Figure 12.
Comparison of the operational costs and net benefit by month before and after the installation of the cogeneration system.
Figure 12.
Comparison of the operational costs and net benefit by month before and after the installation of the cogeneration system.

Figure 13.
Annual self-power supplying ratio by cogeneration operation.

Figure 14.
Hourly operating information for a specific day in different seasons in Case D.


Figure 15.
Relationship between the key operational parameters for annual operation events in Case D.
Figure 15.
Relationship between the key operational parameters for annual operation events in Case D.

Figure 17.
Relationship between electricity production and fuel consumption for a DHN.

Figure 18.
Status of the relationship between the main operating variables for the cases. (a) Case A (RPES: 22%, 0.72, : 0.17). (b) Case E (RPES: 14.3%, 0.43, : 0.12). (c) Case G (RPES: 11.6%, 0.51, : 0.22). (d) Case C (RPES: 9.7%, 0.92, : 0.59). (e) Case H (RPES: 8.6%, 0.85, : 0.04). (f) Case F (RPES: 8.4%, 0.75, : 0.49). (g) Case I (RPES: 7.8%, 0.77, : 0.23). (h) Case B (RPES:7.4%, 0.15, : 0.19). (i) Case D (RPES: 3.0%, 0.18, 0.15).


Figure 19.
Change of the RPES by case according to the change of RPDR.


Figure 20.
Change in the RPES according to the share of heat supplied by the heat pump.


Table 1.
Information on the design and operating conditions of the investigated apartment complexes.
Table 1.
Information on the design and operating conditions of the investigated apartment complexes.
| Design Condition | Operating Condition | ||||
|---|---|---|---|---|---|
| ID | Number of Households | Unit Power Consumption by a Household per Month [kWh/month] | Installed Cogen. Unit Capacity [kW] | RPES [%] | Normalized Cost Benefit * [$/kW] |
| A | 1100 | 311 | 385 kW(GE) | 22% | 512 |
| B | 1260 | 470 | 970 kW(GE) | 7.4% | 856 |
| C | 2652 | 455 | (GE) | 9.6% | 578 |
| D | 2220 | 360 | (GE) (GE) | 3.1% | 150 |
| E | 1743 | 294 | (GE) | 14.2% | 798 |
| F | 1080 | 414 | (GE) | 8.4% | 188 |
| G | 1114 | 375 | 327 kW(GE) | 11.6% | −322 |
| H | 1038 | 374 | 390 kW(GE) | 8.6% | 270 |
| I | 1011 | 397 | 360 kW(GE) | 7.9% | 274 |
* The normalized cost–benefit was estimated as the actual cost–benefit divided by the installed cogeneration unit’s capacity.
Table 2.
Design information for the apartment complex and the cogeneration system configuration for Case A.
Table 2.
Design information for the apartment complex and the cogeneration system configuration for Case A.
| Apartment | Gross Floor Area [m2] | 92,817 | Number of HOUSEHOLDS | 1100 |
|---|---|---|---|---|
| Facility | Capacity | |||
| Cogeneration prime mover | 385 kW × 1 (Gas Engine) | |||
| Boiler | 3.8 Gcal × 2 | |||
| Hot tap water tank | 62 ton | |||
Table 3.
System and operating conditions for the scenarios of the diagnostic analysis.
| Type of Operation | Identification | Prime Mover’s Capacity [kWh] | Prime Mover Load Factor [%] (=Prime Mover’s Capacity/Peak Electricity Load) | Number of Prime Mover |
|---|---|---|---|---|
| E-1 | 200 | 20 | 1 | |
| E-2 | 260 | 30 | 1 | |
| Electricity load following | E-3 | 350 | 40 | 1 |
| E-4 | 380 | 45 | 1 | |
| E-5 | 520 | 55 | 1 | |
| H-1 | 200 | 20 | 1 | |
| H-2 | 260 | 30 | 1 | |
| Heat load following | H-3 | 350 | 40 | 1 |
| H-4 | 380 | 45 | 1 | |
| H-5 | 520 | 55 | 1 |
Table 4.
Design information for the apartment complex and the cogeneration system configuration in Case D.
Table 4.
Design information for the apartment complex and the cogeneration system configuration in Case D.
| Apartment Info. | Gross Floor Area [m2] | 190,017 | Number of Households | 2200 |
|---|---|---|---|---|
| Facility | Capacity | |||
| Cogeneration prime mover | 340 kW × 2 (Gas engine) 230 kW × 1 (Gas engine) | |||
| PLB | 5.5 Gcal × 3 | |||
| Hot tap water tank | 111 ton | |||
Table 5.
System and operating conditions for the scenarios.
| Type of Operation | Identification | Device Capacity [kWh] | Device Load Factor [%] (=Device Capacity/Peak Electricity Load) | Number of Cogeneration Unit |
|---|---|---|---|---|
| E-1 | 600 | 20 | 1 | |
| E-2 | 1000 | 30 | 1 | |
| Electricity load following | E-3 | 350 × 3 | 35 | 3 |
| E-4 | 600 × 2 | 40 | 2 | |
| E-5 | 700 × 2 | 45 | 2 | |
| H-1 | 600 | 20 | 1 | |
| H-2 | 1000 | 30 | 1 | |
| Heat load following | H-3 | 350 × 3 | 35 | 3 |
| H-4 | 600 × 2 | 40 | 2 | |
| H-5 | 700 × 2 | 45 | 2 |
Publisher’s Note: MDPI stays neutral with regard to jurisdictional claims in published maps and institutional affiliations. |
© 2022 by the author. Licensee MDPI, Basel, Switzerland. This article is an open access article distributed under the terms and conditions of the Creative Commons Attribution (CC BY) license (https://creativecommons.org/licenses/by/4.0/).
Share and Cite
MDPI and ACS Style
Im, Y. Assessment of the Impact of Renewable Energy Expansion on the Technological Competitiveness of the Cogeneration Model. Energies 2022, 15, 6844. https://doi.org/10.3390/en15186844
AMA Style
Im Y. Assessment of the Impact of Renewable Energy Expansion on the Technological Competitiveness of the Cogeneration Model. Energies. 2022; 15(18):6844. https://doi.org/10.3390/en15186844
Chicago/Turabian StyleIm, Yonghoon. 2022. "Assessment of the Impact of Renewable Energy Expansion on the Technological Competitiveness of the Cogeneration Model" Energies 15, no. 18: 6844. https://doi.org/10.3390/en15186844
Note that from the first issue of 2016, this journal uses article numbers instead of page numbers. See further details here.