
Optimal Strategy for Low-Carbon Development of Power Industry in Northeast China Considering the ‘Dual Carbon’ Goal

1
Key Laboratory of Ocean Energy Utilization and Energy Conservation of Ministry of Education, Dalian University of Technology, Dalian 116024, China
2
School of Economics and Management, Dalian University of Technology, Dalian 116024, China
3
Institute of Carbon Peak and Neutrality, Dalian University of Technology, Dalian 116024, China
4
School of Geography, Liaoning Normal University, Dalian 116029, China
*
Author to whom correspondence should be addressed.
Energies 2022, 15(17), 6455; https://doi.org/10.3390/en15176455
Submission received: 27 July 2022
/
Revised: 29 August 2022
/
Accepted: 31 August 2022
/
Published: 4 September 2022
(This article belongs to the Special Issue Challenges, Trends and Forecasting of Sustainable and Renewable Energy Systems)
Abstract
:With China’s carbon peak and target proposed and the power system as an important source of carbon emissions, its carbon reduction issues are of great concern. However, the mismatch between power demand, resources, and generation facilities in different regions of China creates enormous carbon reduction pressures, especially in the region covered by China’s Northeast Power Grid (NE Grid). Therefore, in this study, a two-stage power optimization model considering Carbon Capture, Utilization, and Storage (CCUS) was established to optimize the national power generation and transmission in China from 2020 to 2060 first and then to optimize the regional road map of energy structure adjustment for China’s NE grid and its CO2 storage strategy. The first stage optimization results show that the national power interaction in China can make full use of the energy resource advantages of the NE grid, especially Jilin and Mengdong, delivering clean electricity to the North China grid as it reaches its “dual carbon” goal. Additionally, the second-stage optimization results show that the NE grid can make good use of CCUS for its thermal power transition. Annual CO2 storage will peak at 204 Mt in 2050 as thermal power withdraws in the NE grid region, which provides a reference for other regions to realize carbon neutrality of their power system by using CCUS.
1. Introduction
China has set clear guidelines for future carbon emissions, with the goal of peaking carbon emissions by 2030 and becoming carbon neutral by 2060. Peak carbon and carbon neutrality targets have a big impact on the energy sector, which means China needs to accelerate its transition to low-carbon. The nation must speed up the adjustment of the energy mix, reduce fossil energy consumption, and increase energy efficiency. The power sector is an important carbon emitter, with emissions of about 4 Gt [1,2]. Therefore, on the one hand, we must reduce the proportion of thermal power generation and increase the generation of new energy and on the other hand [3], we need to seek ways to reduce the carbon emissions from electricity generation.
Coal is still China’s main energy source, and the short-term improvement in energy efficiency is limited; thus, the large-scale deployment of renewable energy in the near future and the use of carbon capture utilization and storage (CCUS) technology is a necessary choice for achieving carbon neutrality in electricity [4]. China currently has about 40 CCUS demonstration projects in operation or under construction, with a capture capacity of 3 million tons/year. CCUS can not only solve the problem of large-scale CO2 emissions but also solve the problem of pollutant emissions through dust removal, desulfurization, denitrification, and other processes before CO2 capture [5]. Therefore, CCUS is a key technology for low-carbon development and clean coal utilization in the power industry in the future and will play an important role in ensuring net zero emissions in the power system. During the “15th Five-Year Plan” period, the CCUS transformation of coal and electricity entered the early stage of demonstration application and industrialization cultivation. In 2025 and 2030, the cumulative transformation scale was 2 × 10⁶ and 1 × 10⁷ kW, and the carbon capture scale was 8 × 10⁶ and 3.7 × 10⁷ t/year [1].
China’s carbon emission reduction has some difficulties. Considering China’s vast territory and uneven distribution of power resources and demand, it is necessary to connect power-rich areas with power-hungry areas to complete the interactive transmission of power [6]. In 2005, China’s six regional power grids (Northeast Power Grid, Northwest Power Grid, North China Power Grid, Central China Power Grid, East China Power Grid, and Southern Power Grid) were interconnected [7]. Interconnection between the power grids is usually performed by means of electricity transmission, as the power generation capacity and power demand are not identical in a grid; such as in the Northeast China power grid and Northwest Power Grid, the electricity demand is low, but the production potential is very high. The demand in the North China Power Grid and East China Power Grid is very high, but the capacity is limited, and regional power generation cost and carbon emissions constraints exist. Thus, regional power interaction will be an important way to ensure carbon neutralization of the power system [8]. Through the power transmission results of the major power grids, the power generation and transmission conditions of the major power grids can be obtained; this provides external constraints for optimization of the internal power generation structure of a certain power grid. Wind and solar power will be the key forms of power generation for achieving carbon neutrality in the future [9]. In addition, the carbon emission charge will also play a certain role in the realization of carbon emission reduction in the electric power emission system [10,11].
Therefore, for China, multi-regional and multi-year large-scale power grid optimization can analyze the change trend of China’s overall power structure and transmission situation in the future, and the regional power transmission optimization model can be used to meet the balance of power supply and demand in each region and can better highlight the importance of utilizing natural resources [6]. In optimization, we need to consider carbon emission reduction in power systems. There are many ways to achieve a reduction in carbon emissions from power systems. Considering the carbon neutrality of the power system, the multi-regional optimization model requires not only the replacement of thermal power with renewable energy but also the consideration of the increasingly perfect CCUS technology. CCUS technology can play a very important role in the process of achieving the carbon neutrality goal of electricity. However, there are not many analyses on the CCUS power model.
Most scholars have focused on the single region optimization within the power grid, considering the change in power generation structure and trend inside the power grid, and less on the power interaction and change between external and other power grids. However, considering the increase in regional demand for electricity and the expansion of transmission lines, the variation and growth in transmission capacity between power grids cannot be ignored. Therefore, the focus of this study is to examine the power interaction of the whole national region, perform multi-regional optimization of the overall power interaction of the whole national region, and understand the power generation and transmission situation of the major grids regions. Then, a more detailed internal optimization is performed for Northeast China according to the power transmission between power grids, considering the deployment and storage of CCUS, so as to obtain the power carbon-neutral path under the application of CCUS technology for the Northeast China power grid region.
The primary contributions of this paper are as follows:
- (1)
- A two-stage power optimization model considering Carbon Capture, Utilization, and Storage (CCUS) for China was established to optimize the national power generation and transmission from 2020 to 2060 first and then to optimize the regional road map of energy structure adjustment for the NE grid and its CO2 storage.
- (2)
- In this research, the overall national power structure and cross-regional power transmission are optimized first and then the results are used to optimize provincial power production and transportation within the region considering CCUS, which can more accurately analyze the transition mode of regional power carbon neutrality from a macro perspective.
- (3)
- Based on the two-stage optimization results, detailed suggestions are provided for the national power grid in China and the regional power grid in the northeast of China.
2. Literature Reviews
Low-carbon development of power systems is a worldwide concern. At present, scholars mainly use optimization methods for research, including single-objective [12,13,14,15,16], multi-objective [13,17,18,19,20,21,22], single-region [23,24,25,26], and multi-region optimizations [6,14,17,27,28,29,30,31]. Table 1 summarizes the power system model studies in the world from 2013 to 2022.
In order to deal with the problem of carbon peak and carbon-neutral power systems, many scholars around the world are seeking a better development path. Most foreign scholars have provided path planning and policy suggestions for achieving peak carbon neutrality in each region through calculation and analysis. Ali [32] compares the impacts of renewable energy development on Iran’s power carbon dioxide emissions under five different policy scenarios. Nour [33] believes in the low-carbon development of Lebanon’s electricity system by 2030 with the support of policies. Hugo [34] considers that the role of citizen energy communities (CECs) can be important toward a carbon-neutral society. Sannamari [35] investigates low and zero-carbon pathways based on clean electricity and sector coupling in Finland. Albert [36] applies the open-source energy modeling system, develops optimal generation pathways, and dispatches the scheduling of selected generating technologies for power generation in Ghana. Luca [37] models the 2030 electricity mix in the NEM in Australia. Nikolaos [27] presents a generic mixed-integer linear programming (MILP) model that integrates the unit commitment problem (UCP); that is, daily energy planning with the long-term generation expansion planning (GEP) framework to determine the optimal capacity additions, electricity market clearing prices, and daily operational planning of the studied power system.
However, China’s carbon neutrality goal is different from that of other countries, and its power generation structure and development potential are also different from those of foreign countries. Many scholars in China have set up model studies on China’s power generation structure. Zhang [38] built a planning model considering the external cost of carbon emissions. Zou [39] analyzed the path of electricity carbon neutrality under three power scenarios and put forward seven implementation suggestions to build a new energy structure. However, these predictions of renewable energy development and growth are vague as the potential of regional renewable energy deployment is not taken into account. Guo [40] verifies that the Chinese optimal operation mode of the gas-thermal power virtual power plant is effective for achieving carbon neutrality through the thermal power operation model. This model can verify the trend of thermal power change in the future; however, it is not accurate per region because the utilization of thermal power in each region is different; so the universality of the model needs to be verified. Liu [41] performed its calculations by modeling electricity generation from a variety of renewable sources.
From the Chinese and foreign research, it is found that for most of the carbon-neutral paths, research of the power system usually adopts the method of establishing a model for optimization and analysis. However, it mainly analyzes the two changes in wind and photoelectric power for new energy generation without considering the development of all new energy sources in the region simultaneously. Shu [1] built an optimization model of path planning to determine the path of China’s low-carbon power transition under different scenarios, including power structure, carbon emissions, and supply cost. On the whole, the model explored the carbon-neutral path of the application of CCUS in the whole country and compared the transitional development situation of the application of CCUS technology in different situations. However, it failed to detail the CCUS layout and power generation structure in each region; so it could not give detailed policy suggestions according to the region.
The optimization calculation of the power system is divided into single-region and multi-region optimizations. Single-region optimization is usually suitable for situations with sufficient regional data and little external influence. According to the existing power generation structure and potential of Jilin, Jiang [24] has constructed the thermal and power carbon emission model for Jilin and provided a reference for the calculation of power carbon neutrality in Jilin in the future. Luo [23] put forward the steps and suggestions for the future decarbonization of China’s electric power sector. Zeng [42] took Sichuan province as an example to establish the renewable energy transformation path of the energy system, including the electric power and transportation industries. This single-region optimization model can be used to study the power development situation within the region in detail; however, it cannot fully represent the development situation of the power interaction between the region and other regions and does not consider the constraints related to power transport.
Multi-region optimization is more suitable for the situation where the interaction between regions is obvious, and macro analysis is needed to analyze the overall development trend and results of all regions. In addition, due to the uneven distribution of renewable power potential, a multi-region power transmission mode is also an inevitable method to achieve carbon neutrality in the future. Several scholars have constructed multi-region power transmission models. Fan [43] divided China’s provinces into three regions and adopted Moran’s I Index to analyze the spatial characteristics of carbon emission and carbon emission intensity of the power industry. Zhang [44] and Zhang [13] established a multi-region model for long-term power generation and transmission structure optimization of China’s power system. Chen [14] proposed a multi-region power generation expansion planning model. Regional power generation expansion planning incorporating regional environmental carrying capacity constraints presents a solution to this problem of unbalanced regional emission reduction. Kia [12] addresses optimal day-ahead scheduling of combined heat and power units of an active distribution network with electric storage systems. Guo [6] proposed a multi-region model that reflects the actual grid infrastructure, with the objective function of maximizing the cumulative total profits of the power generation industry from 2013 to 2050. Kathleen [45] derived minimum cost solutions for achieving progressive emission reductions up to 2050 using the North American TIMES Energy Model (NATEM). Chen [14] proposed a multi-zone power generation expansion planning model, which integrates air pollutant emission constraints. However, these multi-region optimization models carry out power optimization analysis of multiple regions from the overall level, and the description of carbon dioxide treatment of power within the region is not detailed enough without considering the upper limit of carbon dioxide emission and the capacity of carbon dioxide treatment within the region.
The application of CCUS technology is the final guarantee to achieving carbon neutrality in China, and some scholars have added relevant CCUS analysis to power system research. Wang [5] obtained the optimal source-sink matching scheme by modeling and optimizing the source-sink matching cost of CCUS in North China in the next 30 years. Zhang [15] proposed a mixed-integer linear programming (MILP) model to optimize the strategic CCUS deployment in Northeast China. Mohammad [46] proposed a multi-period low-carbon generation expansion planning (LC-GEP) model. Zhang [17] developed an optimization-based framework for the deployment of the CCUS supply chain with economic and environmental concerns.
There are many multi-region optimization models of power systems; however, there are few studies that first conduct multi-region optimization and then study the power interaction among provinces within a single region according to the development trend for China’s future power structure. There are fewer papers for reference: Pratama [18] divided Indonesia into six regions and developed a multi-objective area optimization model; due to large power structure differences between the regions, regional electric power was optimized separately in many regions.
The previous studies show the following deficiencies: (1) Most scholars only consider the alternative part of renewable energy in the power system to complete carbon neutralization of the power system or analyze the application potential and development trend of regional CCUS only from the matching of CCUS regions. There has been little joint analysis of how power systems use the development of CCUS to balance CO2 emissions with alternative renewable energy sources. (2) Power transport in various regions of China mainly occurs in major power grid areas, and CCUS should also sequester this part of carbon dioxide generated in the region, which lacks a carbon-neutral power development model based on the framework of major power grids. (3) There are few studies on the carbon dioxide treatment of electric power by province within the power grid area, and there is a lack of similar power CCUS model.
Previous studies have analyzed most of the future energy generation structure of China from the whole through multi-region optimization or the power generation situation of a certain region locally through single-region optimization. The interaction between regions of the power system is close, and with the restriction of the carbon emission target, the power generation structure of each power system changes greatly, which requires collaborative optimization among multiple regions. However, the generation potential and CCUS utilization potential of different power generation modes vary greatly among regions; so it is necessary to further refine and optimize the generation and CCUS utilization situation within the region so as to give an accurate conclusion and analysis of a region. Therefore, this research will analyze the multi-region optimization of the advanced power grid and then conduct a detailed single-region power optimization analysis using CCUS for the single power grids. The advantage of the two-stage model is that it can better grasp the overall inter-regional electricity production and trade and optimize and analyze the inter-provincial electricity production and transportation structure and CCUS deployment within the region more accurately.
This research adopted a two-stage model analysis method. The advantage of the two-stage model is that it can better grasp the overall inter-regional electricity production and trade and optimize and analyze the inter-provincial electricity production and transportation structure and CCUS deployment within the region more accurately.
3. Methodology
In order to explore the future carbon dioxide emission and development direction of regional power systems in different stages, this study adopts the two-stage optimization model that first optimizes the national power generation and then optimizes the provincial power production and trading in the large grid area. First, the multi-year power interaction between large power grids is evaluated through the first stage of the national power optimization model. The transaction of electricity between the power grids is taken as the constraint; considering the regional application of CCUS, the development path of the regional power system combined with CCUS under the dual carbon target is obtained. The two-stage optimization model is established as follows.
3.1. Two-Stage Power Optimization Model Considering CCUS
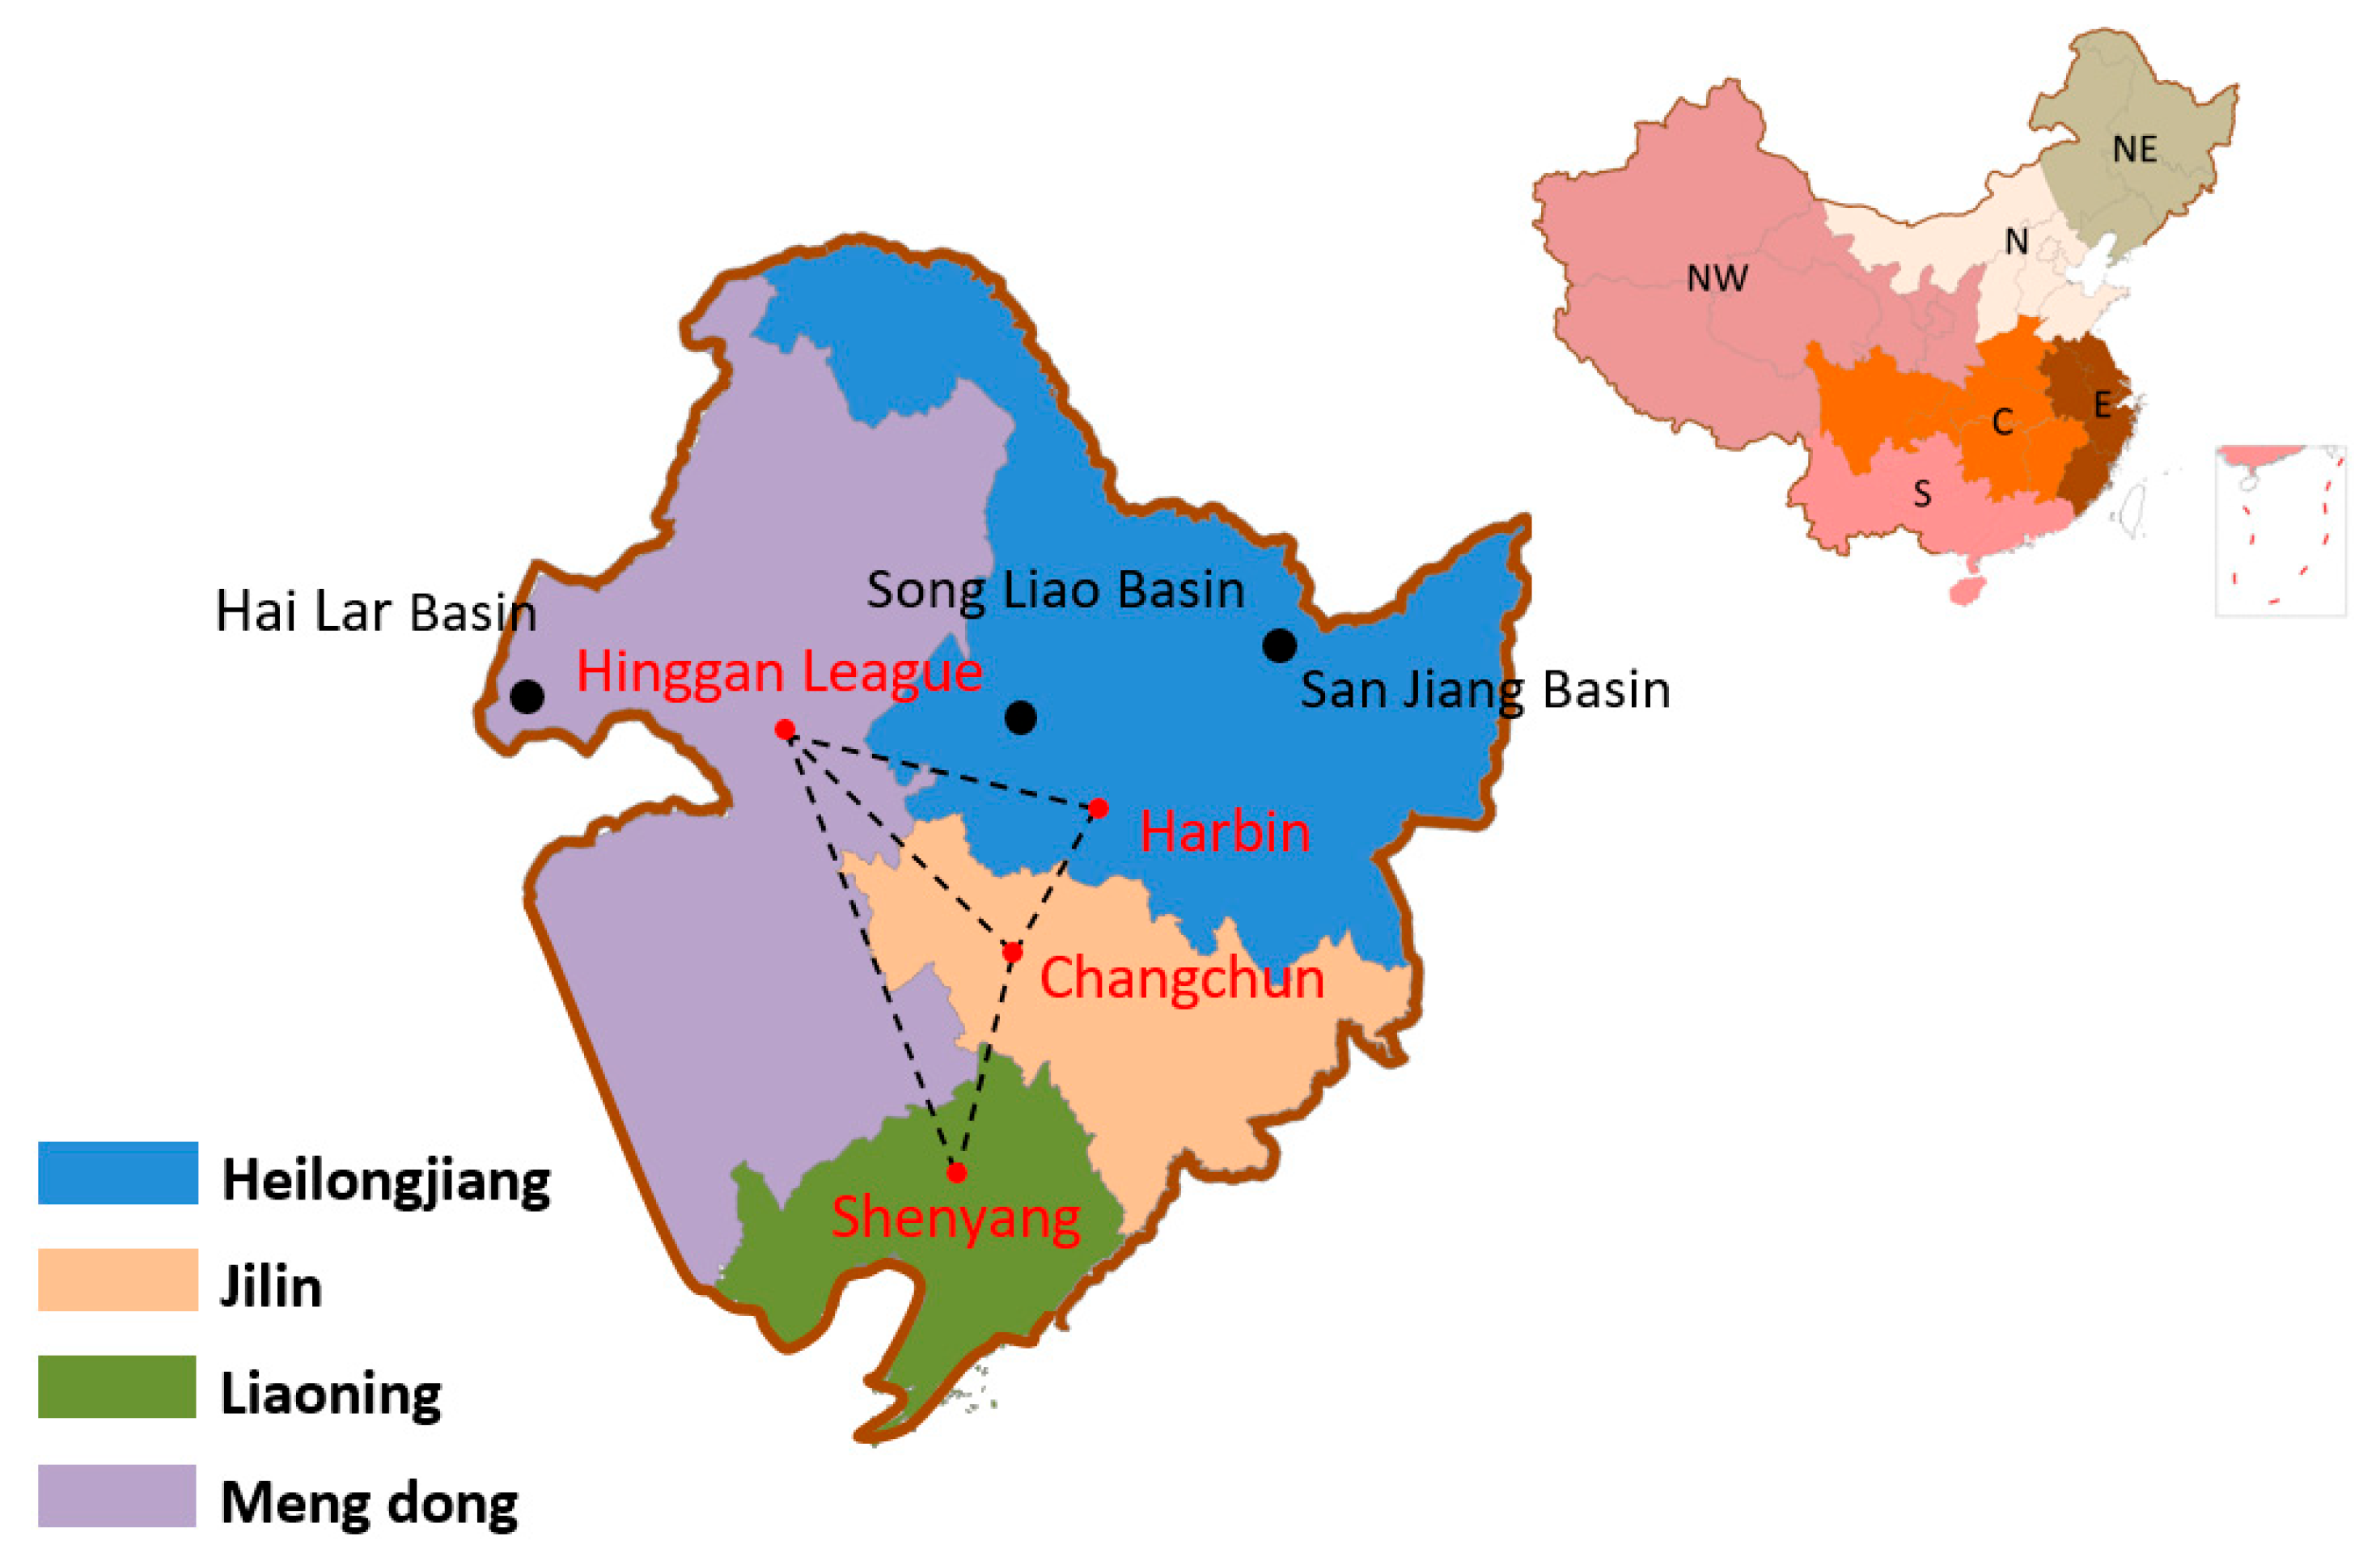
The two-stage power optimization model first optimizes the national overall power production and transportation, uses this as a constraint to optimize the provincial-level (Northeast Power Grid region, Figure 1) power production in the region, and analyzes the application prospect of regional CCUS technology.
3.1.1. The First Stage of the National Power Optimization Model
First Stage Objective Function
The calculated national grid power consumption area is divided into six power grids: Northeast Power Grid, East China Power Grid, Central China Power Grid, Northwest Power Grid, North China Power Grid, and South China Power Grid, represented by subscript I, ; same meaning as i, k represents different regions, . The applied power generation modes are: coal power (PC), wind power (WD), photovoltaic (PV), nuclear power (NU), hydropower (HD), and gas power (NG), represented by subscript j, . We take five years as a node to calculate the change in power structure from 2020 to 2060. The first year of the five years will be used as the calculation data, and the following four years will be calculated based on the simulation of the generation status of the first year. The objective function is expressed as follows:
In the formula refers to the annual power generation of generation mode j in region i, refers to the annual generation time of generation mode j in region i, and refers to the unit generation cost of generation mode j in region i, which also includes the power and time. refers to the annual transmission cost from region i to k, which is equal to the product of annual transmission electricity and unit transmission cost . refers to the cost of carbon dioxide emission in region i, and its value is the product of the amount of carbon dioxide emissions and the cost per unit of carbon dioxide emission. refers to the cost of newly installed power generation units of power generation mode j in region i, which is equal to the product of newly installed capacity and unit cost . The total cost is the sum of the electricity generation, electricity transmission, and generation emissions costs. Furthermore, in this study, nir reflects the time value of money, which is set at 10%. The objective function is that the total cost of China’s major power grids in 2020–2060 is the minimum under the condition that all constraints are satisfied.
First Stage Operation Constraints
(1) Power demand constraint
Needi is the total power demand of region i in the current year. The local power generation capacity of the region in the current year plus the net electric quantity flowing into the region should meet the power demand of the region. refers to production and transport losses. TL refers to transmission line losses across regions.
(2) Carbon peak 2030 policy requirements
According to the requirement of carbon peak, of total power carbon dioxide emission in region i in year y should be less than that in 2030 .
(3) Constraints on installed capacity upper limit
The generation power Eij of power generation mode j in region i should be less than the upper limit of its installed capacity, and higher than the lower limit of the power generation capacity .
(4) Rated generation time
The annual power generation time Tij of power generation mode j in region i should be less than , the upper limit of annual power generation time of this power generation mode, and above the minimum utilization hours .
(5) Carbon dioxide emission cap
Since each region has a different carbon emission quota, in theory, of power carbon dioxide emitted by each region should be smaller than of power carbon dioxide emission quota of this region.
(6) Transmission capacity constraints
The inter-regional transmission capacity is limited, and the power interaction will transmit power through existing transmission lines. The inter-regional transmission power eTransik should be smaller than the inter-regional transmission line capacity upper limit , and higher than the transmission capacity lower limit . Constraint (12) indicates that in the same time period of the year, the transmission of power is unidirectional.
3.1.2. The Second Stage of Regional Power Optimization Model Considering CCUS
Second Stage Objective Function
Similar to the national electricity production and interaction model in the first stage, the regional electricity carbon emission reduction optimization considering CCUS also considers the cost of electricity and related constraints. However, it increases the application cost and related constraints that CCUS needs to consider in practice.
The calculated power consumption area is divided into four provinces: Heilongjiang (HLJ), Jilin (JL), Liaoning (LN), and the eastern area of inner Mongolia (MD) represented by subscript i, ; same meaning as i, k represents different regions, . The applied power generation modes also are: PC, WD, PV, NU, HD, and NG, represented by subscript j,. y represents the optimization time range from 2020 to 2060. Take five years as nodes to calculate the change in power structure from 2020 to 2060. The first year of the five years will be used as the calculation data, and the following four years will be calculated based on the simulation of the generation status of the first year. The objective function is expressed as follows:
represents the cost of using CCUS in region i, including the capture, carbon transportation, and carbon dioxide sequestration cost in CCUS. represents the installed capacity cost of power construction and CCUS capture device construction in region i. m is the three sealing points located in the Northeast Power Grid region, . refers to the unit capture cost, refers to the unit transmission cost, is the transmission distance, and refers to the unit storage cost.
Second Stage Operation Constraints
(1) Composite constraint
Constraints in this part use Constraints (6)–(12) in the national power optimization model. refers to the transmission of electricity from the Northeast grid region province i to the external grid. Equation (29) refers to the upper and lower limits of transmission capacity to other grid areas. It is set that any province i in the Northeast Power Grid region can be directly transmitted to the external power grid region through the transmission line.
(2) External power constraints of the Northeast Power Grid
The annual outbound power transmission of the Northeast Power Grid is constrained by the overall power transmission volume of the grid, and the annual outbound power transmission volume should conform to the optimization results of overall national optimization.
(3) Carbon dioxide regional capture and sequestration capacity constraints
Carbon dioxide capture will be affected by the regional CCUS construction capacity and related economic factors. Each region will have an upper limit of capture capacity, and the actual capture capacity of carbon dioxide in a region should be less than the CCUS capture capacity of the region. Similarly, due to geological factors, carbon dioxide sequestration is also restricted by the regional sequestration ceiling, which cannot consume the captured carbon dioxide indefinitely; the maximum area storage capacity is . In the optimized time frame (2020 to 2060), the total sequestration of carbon dioxide will not exceed the regional cap. The carbon dioxide transmission pipe network of CCUS will transport the carbon dioxide generated by the nearby power system and captured by the CCUS capture device to the nearest sequestrable area, a new pipe network transmission capacity according to transmission demand.
3.2. Scenarios and Data Sources
3.2.1. Scenarios
Different power demands will determine the different difficulties in the treatment of thermal power carbon dioxide emissions, resulting in large differences in carbon peaking and carbon neutrality paths in different scenarios, and the dependence and development of CCUS will also increase with the increase in power demand. According to the possible future power demand in China, assuming that each region grows according to the power demand growth rate, three kinds of power demand forecast scenarios of high power demand (HPD scenario), middle power demand (BAU scenario), and low power demand (LPD scenario) are given. From 2020 to 2030, the average annual growth rates will be 3.2, 2.5, and 2.2 percent, respectively. From 2030 to 2060, the annual growth rate will be 1.4, 1.3, and 1.2 percent, respectively, as seen in Table 2. We use these three scenarios to explore how the development prospects of CCUS will change in different regions under different power demands.
3.2.2. Data Source
In this paper, parameters such as generation parameters, transmission parameters and carbon dioxide are applied. Their meanings, units and data sources are shown in Table 3 below.
4. Results and Discussion
The middle power demand scenario is set as the BAU scenario; that is, the electricity growth in 2020–2030 and 2030–2060 is 2.5 percent and 1.3 percent, respectively. We perform an analysis of the change trend of the power structure of the nation and the Northeast Power Grid region from 2020 to 2060 under this power demand.
4.1. National Electricity Optimization Results
4.1.1. Power Generation Proportion Development Trend
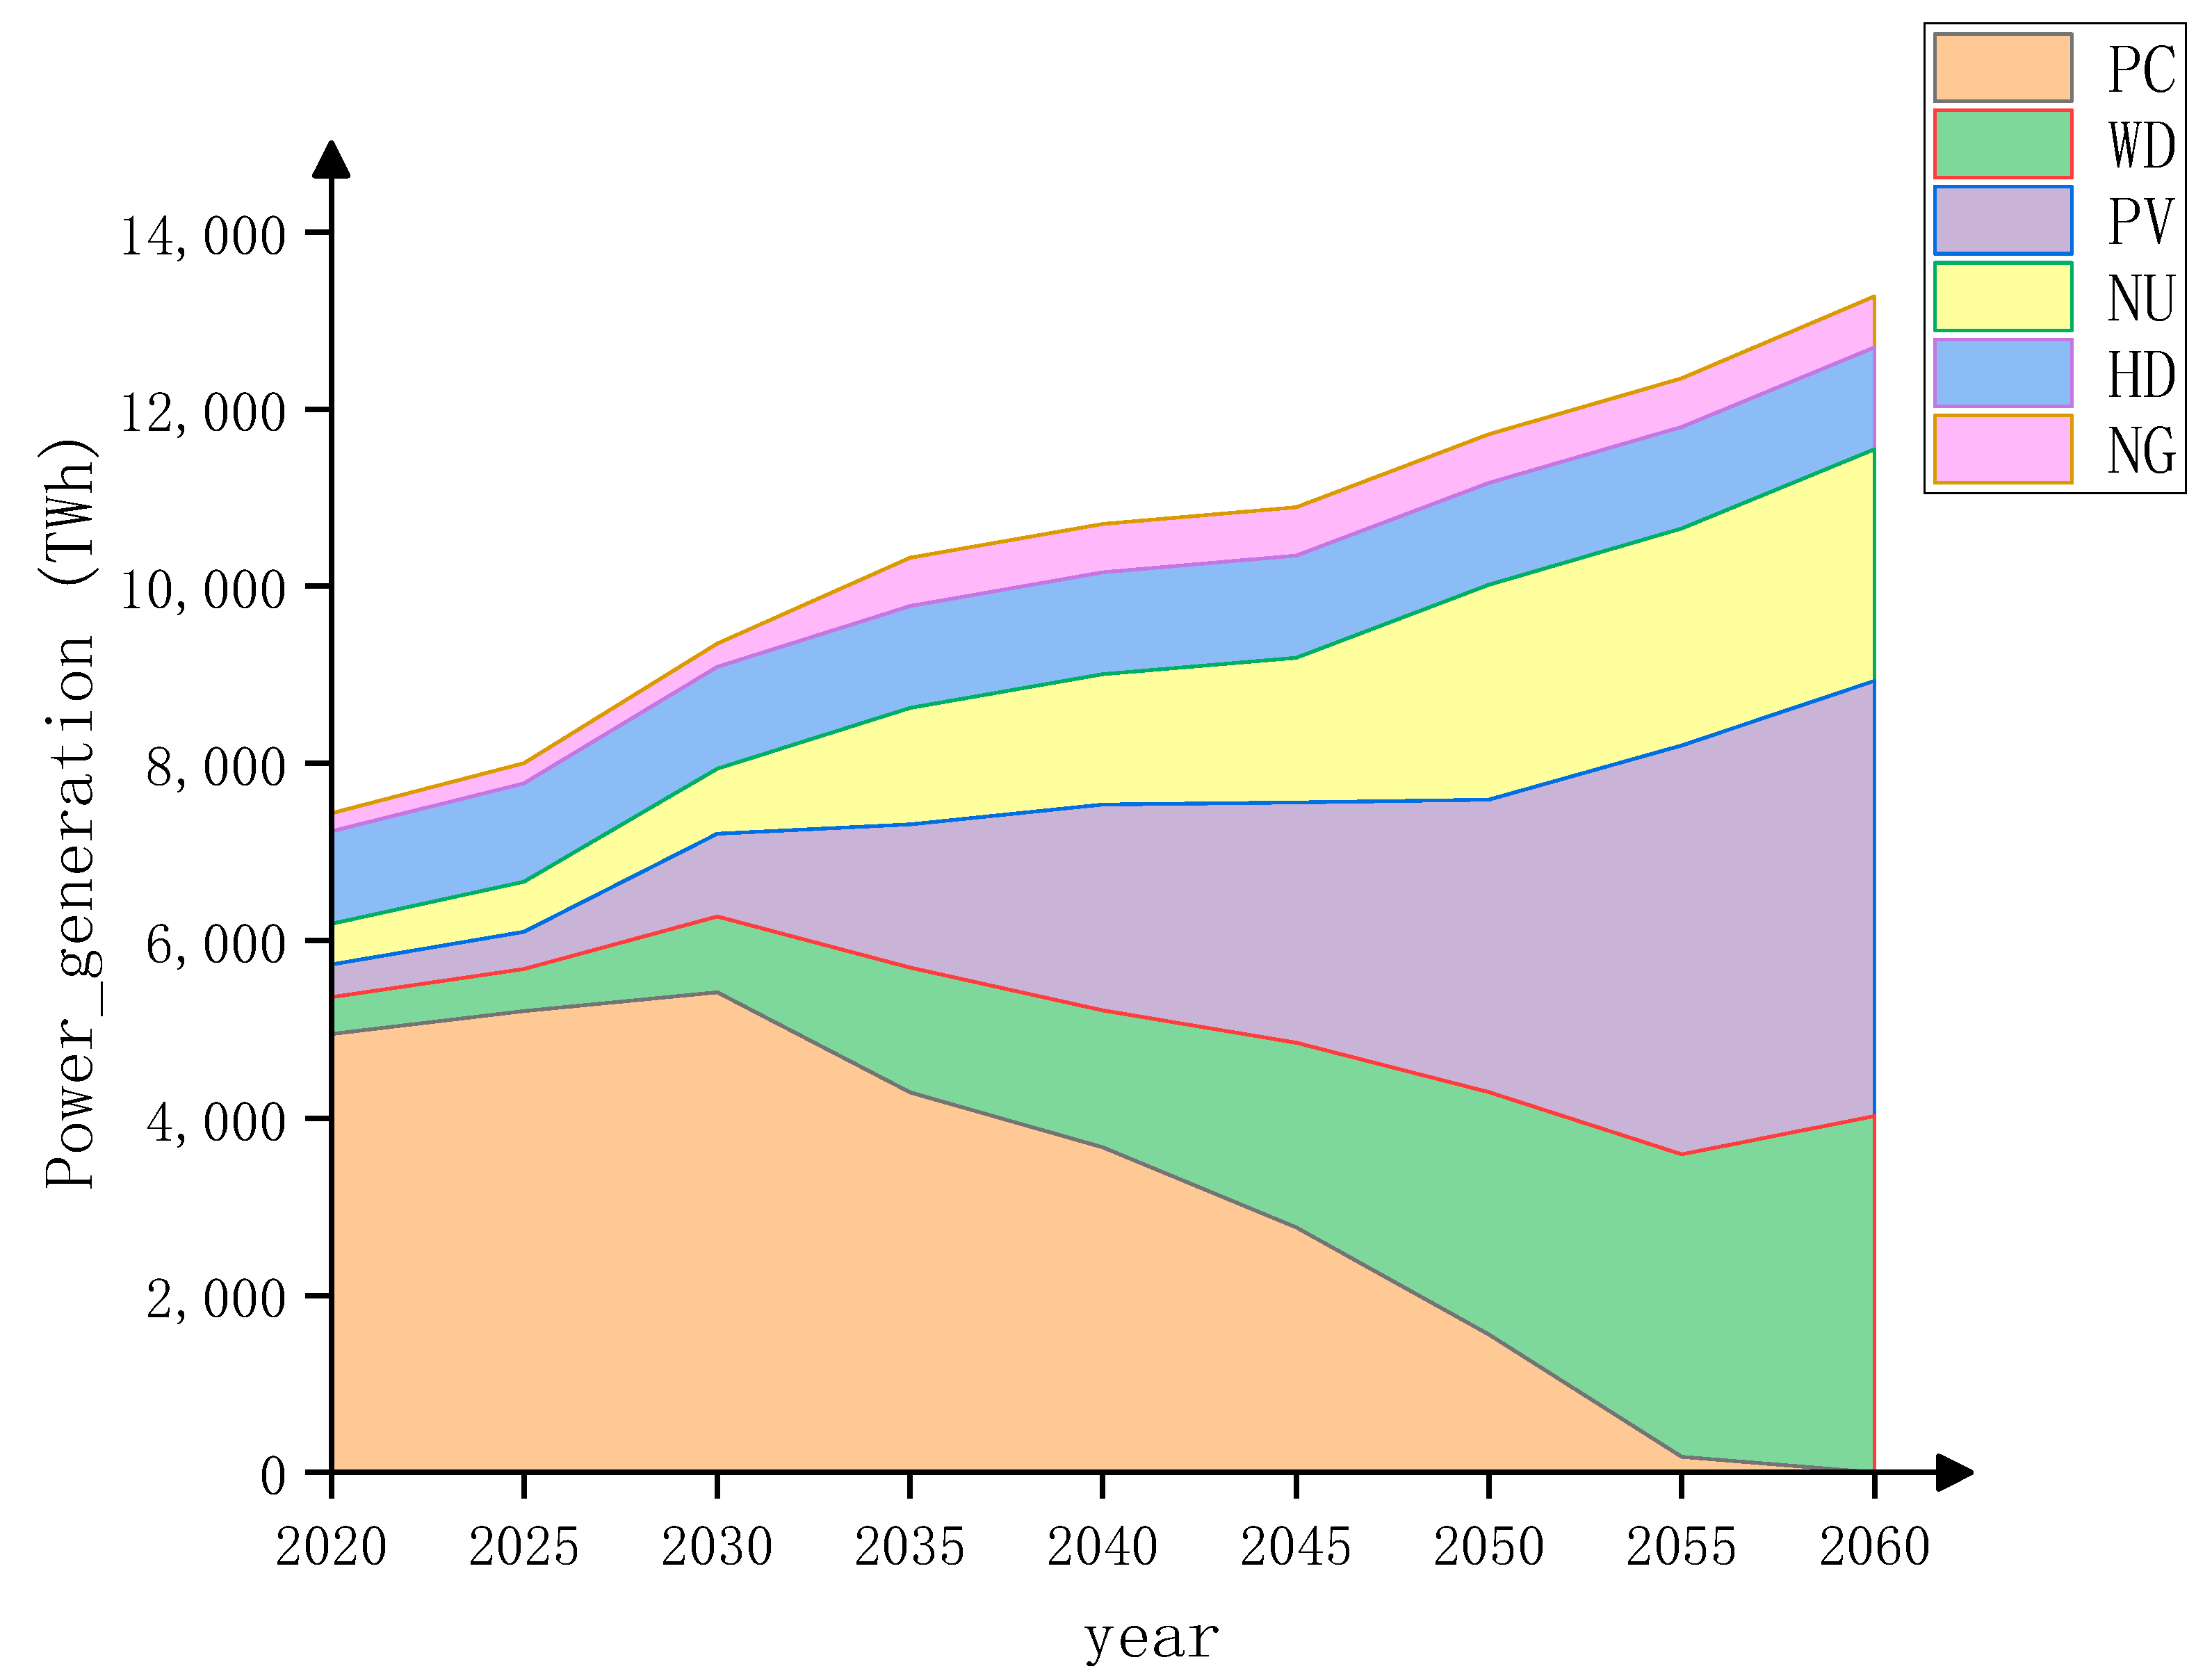
The Figure 2 shows the changes in the power generation of various power generation methods in the Chinese Power Grid from 2020 to 2060. Due to the carbon emission policy and active construction of new energy, coal power, which emits a lot of carbon dioxide in production, has been reduced in the past 30 years, and it will be completely replaced by other new energy sources in 2050; photovoltaic and wind power generation will be the main power generation methods. Considering the development and progress of nuclear energy technology in the future, nuclear power generation is expected to be second only to wind and light power generation in terms of future power generation. Other power generation methods, such as material power generation, will also occupy a certain proportion of power generation.
4.1.2. Transmission of Power between Grids
As the region with the most abundant renewable energy power generation potential, Northwest China has delivered a large amount of clean energy power generation to East and North China. Similarly, surplus power in the northeast will be channeled to the North China Grid, where the demand is growing. Multi-regional power interaction can jointly achieve carbon peak and carbon neutrality; however, China’s Southern Power Grid has a large power generation potential from renewable resources and has few connections with existing power transmission lines in other regions, so there is little power interaction.
4.1.3. The Result Comparison
Compared with Tang [4], it is found that the proportion of electricity generation is similar to that in this study. In 2050, for the whole national power grid, photoelectric will be the power generation mode with the highest proportion. Chen considers that by 2050, photovoltaic power will account for 49.7%, while mine will account for 48.4%. Fan [43] believed that the proportion of wind power and nuclear power in 2050 would be 31.1% and 5%, respectively, while the proportion of wind power and nuclear power was calculated to be 21.42% and 17.56% in this paper, respectively. The reason for this result is that Chen considers the power generation capacity of existing or under construction nuclear power plants, while this paper considers the nuclear power generation potential of each region, which may expand by a certain amount of nuclear power plants in the future. As for coal power generation, this paper has basically abandoned conventional thermal power generation in 50 years, while Fan still considers part of coal power generation in his article. The reason may be that Fan considers relatively strong CCUS capture and transmission capacity, while this paper considers the cost and technology. CCUS may not have the situation of large-scale construction and long-distance transportation storage in the whole region.
4.2. Northeast Power Grid Region Power CCUS Optimization Results
Power Generation Proportion Development Trend
Heilongjiang and Jilin provinces have rich potential for wind power generation. Under the requirement of the carbon peaking policy, after the elimination of most thermal power plants after 2030, the proportion of wind and photoelectric power with relatively low cost and great potential will be greatly increased, which can deliver considerable power for the Liaoning region.
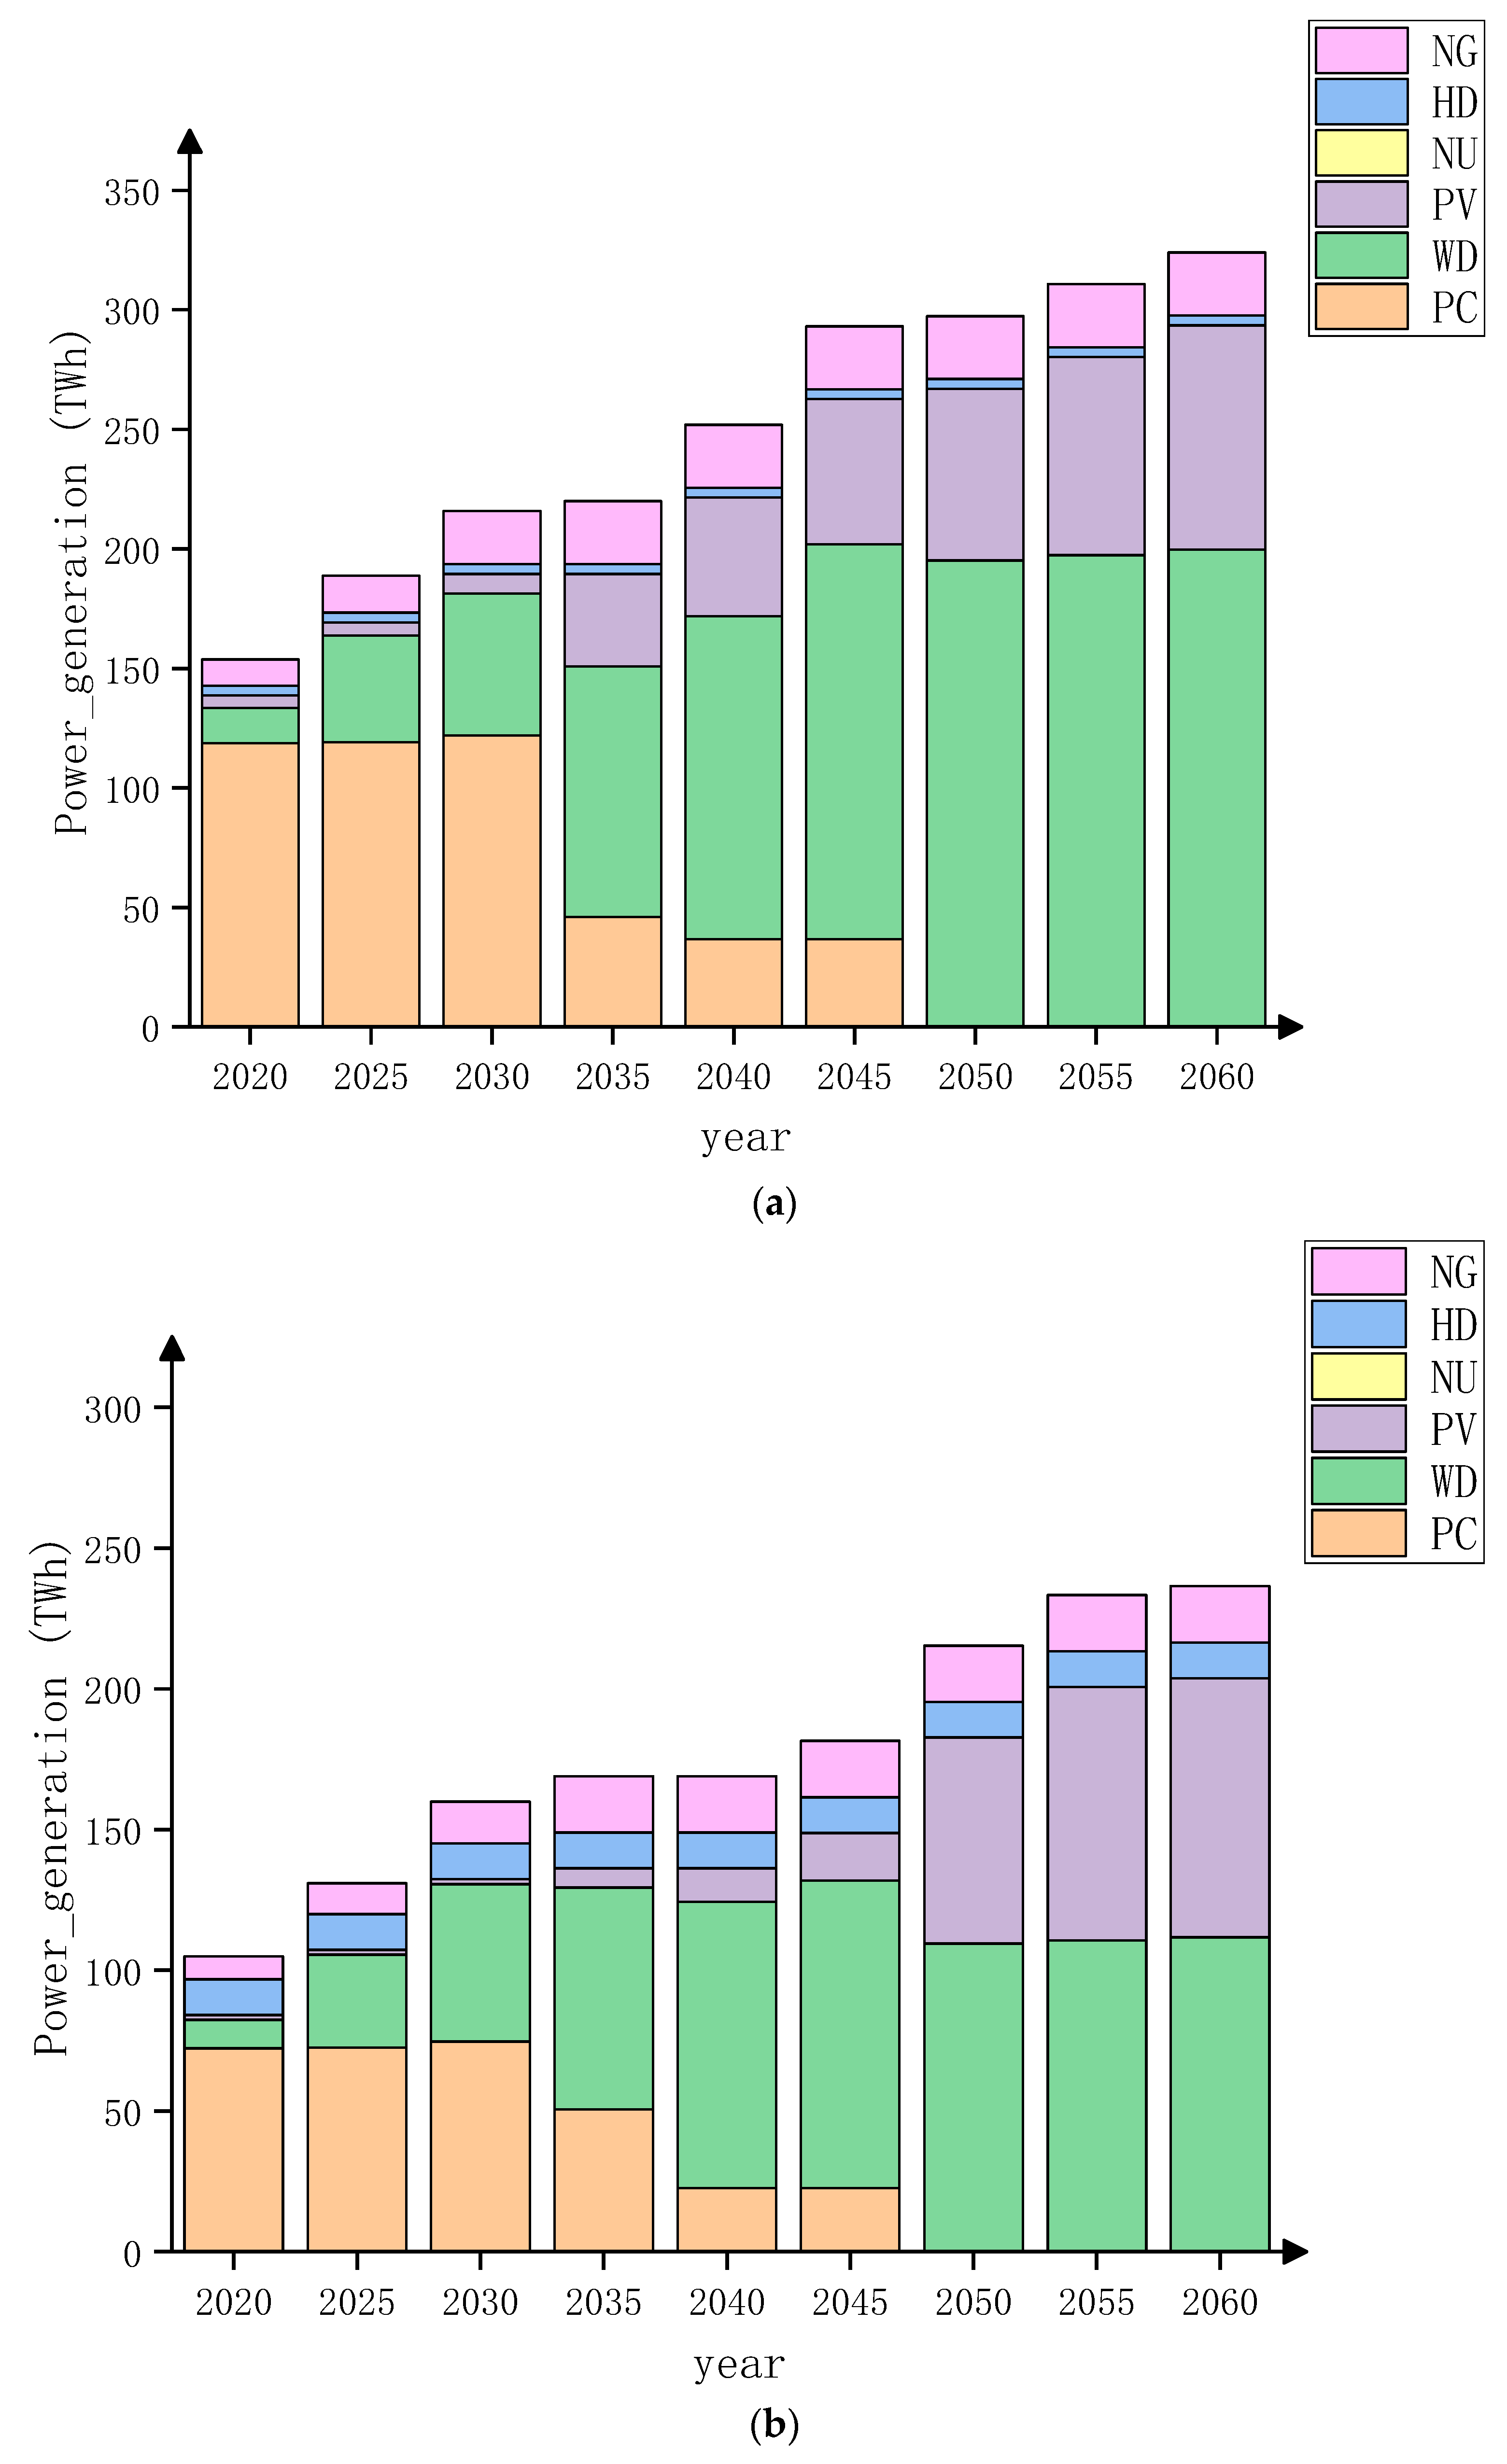
As can be seen from Figure 3a, wind and photovoltaic power have great potential in Heilongjiang province, and the area that can be used for wind and photovoltaic power installation is large. Therefore, wind and photovoltaic power will be the two most important power generation methods in Heilongjiang province in the future, which will meet 93.1% of the electricity demand of Heilongjiang province by 2060. Due to the emergence of the carbon peak target, the annual average conventional thermal power generation in Heilongjiang will suddenly drop from 100 TWh in 2030 to about 40 TWh in 2035 and then maintain the power generation until 2045 and completely abandon the conventional thermal power in 2050. Wind power will be given priority in the initial development in 2020–2030. With rapid growth between 2030 and 2050, wind power has become the main alternative power to achieve the carbon-neutral goal of thermal power exit, growing to near saturation by 2050, with an annual generating capacity of about 182.3 TWh.
As can be seen from Figure 3b, the multi-year power generation situation in Jilin is similar to that in Heilongjiang. Due to cost problems in the process of realizing the carbon peak in the early stage (2020–2030), the arrangement of a large number of CCUS will not be carried out first but will be completed by replacing thermal power generation with renewable energy. Due to the constraints of the carbon emission cap and the relatively low cost and carbon emission of thermal power at this time, the annual conventional thermal power generation of Jilin province will remain at about 80 TWh from 2020 to 2030 and will not increase. During this period, the annual power generation will also increase from 10 TWh to 60 TWh, which will be met by wind power at a relatively low cost. From 2030 to 2050, conventional thermal power generation will gradually decrease to zero due to the increase in carbon dioxide emission cost, while the annual power generation of wind power will gradually increase to the upper limit of 125.2 TWh, becoming the most important power generation source to complete the carbon neutrality of electricity in Jilin province. Due to the impact of cost, photovoltaic power generation will develop relatively slowly compared with wind power during 2030–2045. However, with the progress of technology, the cost of CCUS will gradually decrease, and the carbon dioxide transmission and storage network will be increasingly perfect. As a more suitable way for CCUS to absorb carbon dioxide, gas power will be maintained at the level of 30 TWh of annual power.
Liaoning province is the most critical junction connecting the Northeast Power Grid and North China Power Grid and is an important line node for interaction between the Northeast Power Grid and North China Power Grid. Because of the carbon peak, thermal power since 2030 in Liaoning province will gradually reduce to zero; with the passage of time, photovoltaic, wind, and new renewable energy will gradually increase; however, nuclear power is different from the other three provinces of Liaoning province, efficient nuclear generation will increase with the passage of time. Hydroelectric, wind, and gas power do not change.
It can be seen from Figure 3c that more than half of coal-fired power will be eliminated by 2035 because of the carbon peak requirement. Traditional coal-fired power will provide only about 50 TWh of electricity per year, while wind power will become the main alternative to traditional coal-fired power generation, increasing from 19 TWh per year in 2030 to 80 TWh per year in 2035. Liaoning has great potential for nuclear power construction. Among them, Hongyanhe Nuclear Power Plant has been put into use, and Xudabao Nuclear Power Plant is also under construction. Therefore, from 2030 to 2050, the number of nuclear power plants will increase rapidly, and the annual power generation will increase from 50 TWh in 2030 to 150 TWh in 2050. Meanwhile, nuclear power will also become the largest power generation mode in Liaoning province in the future. Compared with other power generation methods, the annual power generation will increase from 10 TWh in 2020 to 40 TWh in 2060. As the supporting power generation mode of CCUS, the annual power generation of gas and electricity will be maintained at 25 TWh from 2025 to 2060.
The power structure of Mengdong, Heilongjiang, and Jilin are similar, but because of their lower cost and less demand for electricity, thermal power generation will continue to be used for a period of time. Wind power potential is high enough, and the cost is low in Mengdong; so wind power will be the main mode of generating electricity in the future in the Mengdong region. In the process of carbon neutralization, the Mengdong Power Grid area will continue to deliver clean electricity to other areas.
As shown in Figure 3d, the cost of conventional thermal power generation in Mengdong is relatively low. Therefore, under the premise of meeting CO2 emission requirements in 2020–2040, the annual thermal power generation will basically remain at about 100 TWh and decline rapidly in 2040–2045. The annual thermal power generation will decrease from 92.4 TWh in 2040 to 30 TWh in 2045. It will be basically reduced to zero in 2045–2050, and the regional electricity carbon neutrality will be completed. The potential of wind power generation in Mengdong is huge, the operating cost is low, and wind farms can be deployed in a wide range of areas. Therefore, the annual power generation will grow rapidly at an annual rate of about 10 TWh from 2020 to 2040, and the annual power generation will reach 211.4 TWh by 2060, accounting for 65.8% of the total power generation in that year.
The basic principle of internal power transmission in the Northeast Power Grid is to deliver cleaner and cheaper power to other regions on the premise of meeting local power demand. Meanwhile, the upper limit of transmission line capacity should be considered in power transmission. It is considered that the capacity of transmission lines between provinces increases by 5% every year, and the transmission power is two-way. According to the current grid interaction, the Northeast Power Grid only considers a large amount of power transmission and acceptance with the North China Power Grid. Jilin and Mengdong are important power output regions, which will deliver a large amount of clean electricity to Liaoning and Heilongjiang with annual growth and play a key role in realizing the carbon neutrality of the Northeast Power Grid region. Various electric power interactions within the Northeast Power Grid region are shown in Figure 4. The results show that due to excess power generation capacity and relatively cheap power generation cost, Mengdong will supply a certain amount of power to the other three provinces, while Liaoning, as the node of power interaction between the Northeast Power Grid region and North China Power Grid region, will have a large power demand. Therefore, other provinces will send power to Liaoning to meet the needs of the Northeast Grid region and North China Grid region.
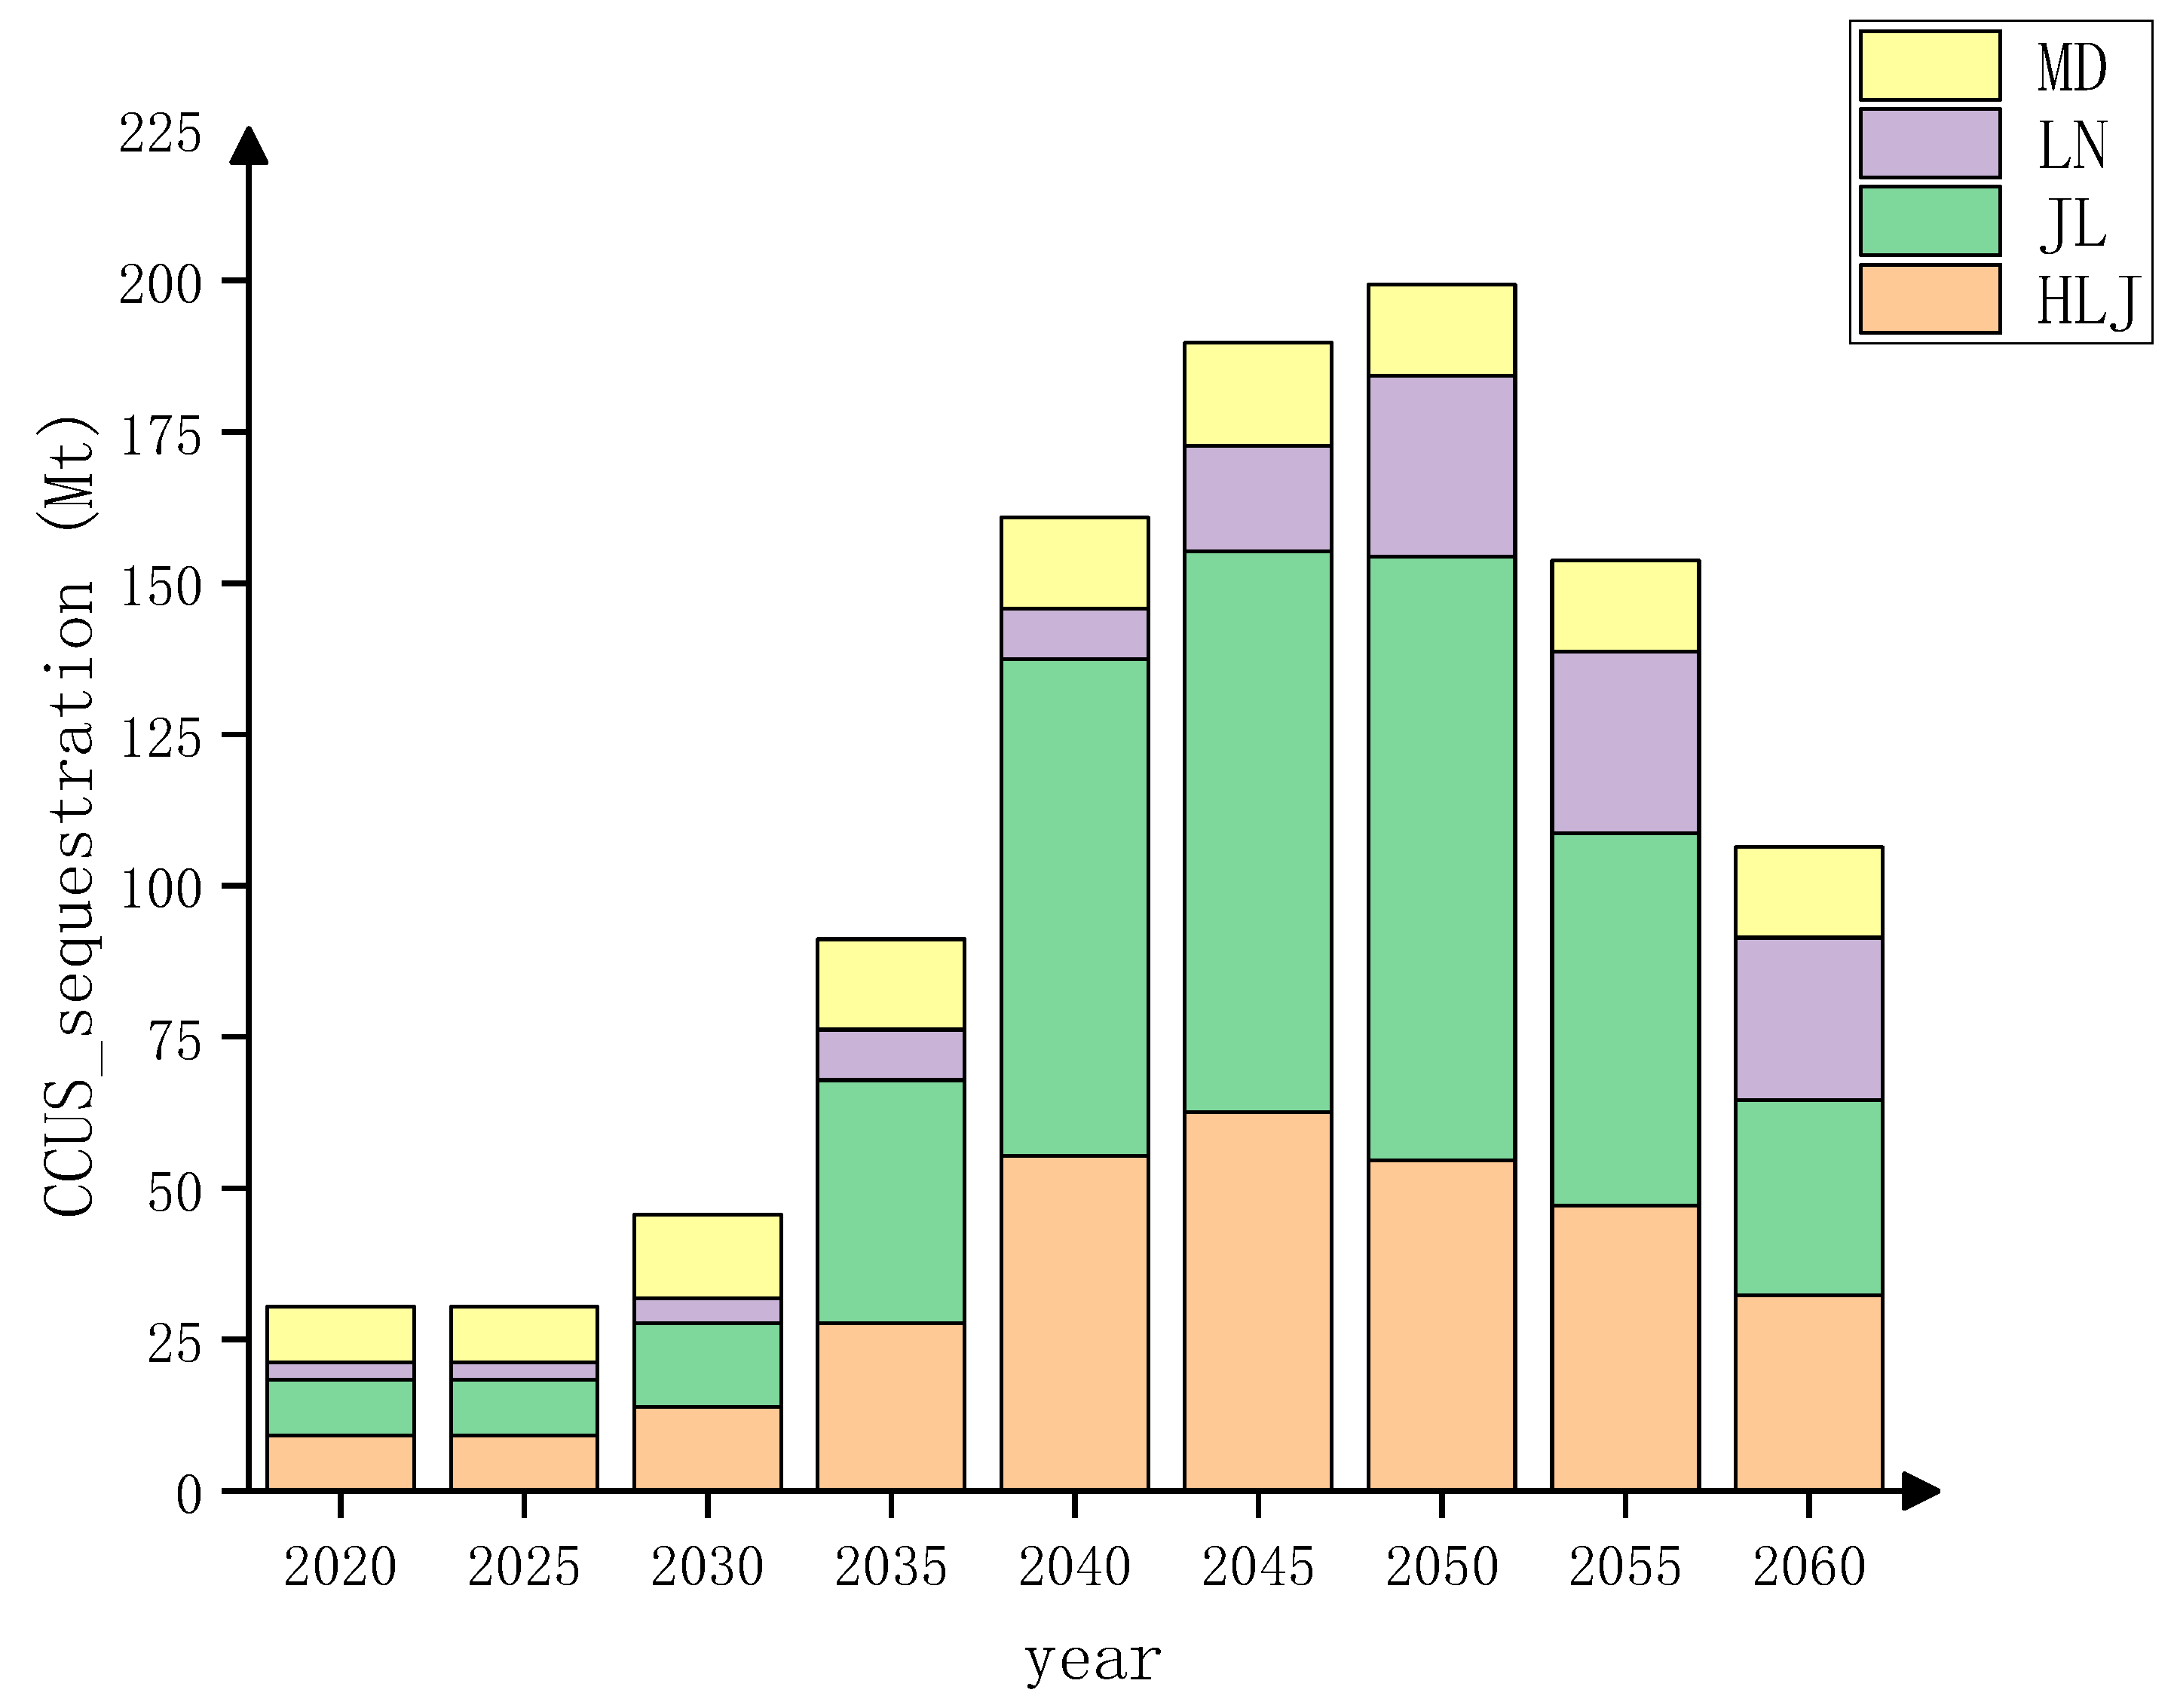
For the storage of carbon dioxide, the geological structures that can be used are generally onshore oilfields, deep saline aquifers, and coal seams; while there is enough storage space in the Northeast Power Grid Domain, Songliao Basin, Sanjiang Basin, and Hailaer Basin are the three largest deep saline aquifers for storage [49]. During storage, different products will be produced due to different geological structures, and the northeast region has rich geological oil storage potential, so it will also generate a part of considerable oil extraction income with storage. The principle of transportation and storage adopts the principle of proximity. The thermal-power carbon dioxide generated in the Heilongjiang region is preferentially transported to and stored in the Sanjiang Basin, the thermal-power carbon dioxide generated in Jilin and Liaoning regions is preferentially transported to and stored in the Songliao Basin, and the thermal-power carbon dioxide generated in the Mengdong region is preferentially transported to and stored in the Hailaer Basin, until the amount of stored meets the geological storage limit. Jilin and Heilongjiang are two provinces with good prospects for using CCUS, and CCUS sealing stock will increase rapidly from 2030 to 2045, and the combination of the two provinces accounts for more than 80% of CCUS sealing stock in Northeast China. In Liaoning, the use of CCUS decreased from 2035 to 2045 due to the rapid withdrawal of thermal power. The carbon neutrality target requires all carbon dioxide from thermal power to be absorbed through CCUS, so CCUS use will increase by 2050.
Due to the limited transport distance of the CCUS pipeline, considering that most of the carbon dioxide captured in power is stored in the address space of the province, the thermal power emission in Liaoning is large, and the sealing stock in the province is small, the use of CCUS pipeline in the process of carbon neutralization of power will transport part of the captured carbon dioxide to the Songliao Basin for storage. From 2030 to 2045, due to the limitation of the upper limit of carbon emission of power in Liaoning province, the thermal power CCUS system in Liaoning province will capture the annual increase in carbon dioxide, which cannot be absorbed directly in Liaoning province. The transmission needs to be carried out through the Liaoning–Songliao Basin Carbon pipe network, which will reach a peak of 29.3 Mt/year in 2050. After that, due to the reduction in thermal power, the carbon dioxide transport volume withdrawing from CCUS will naturally decrease.
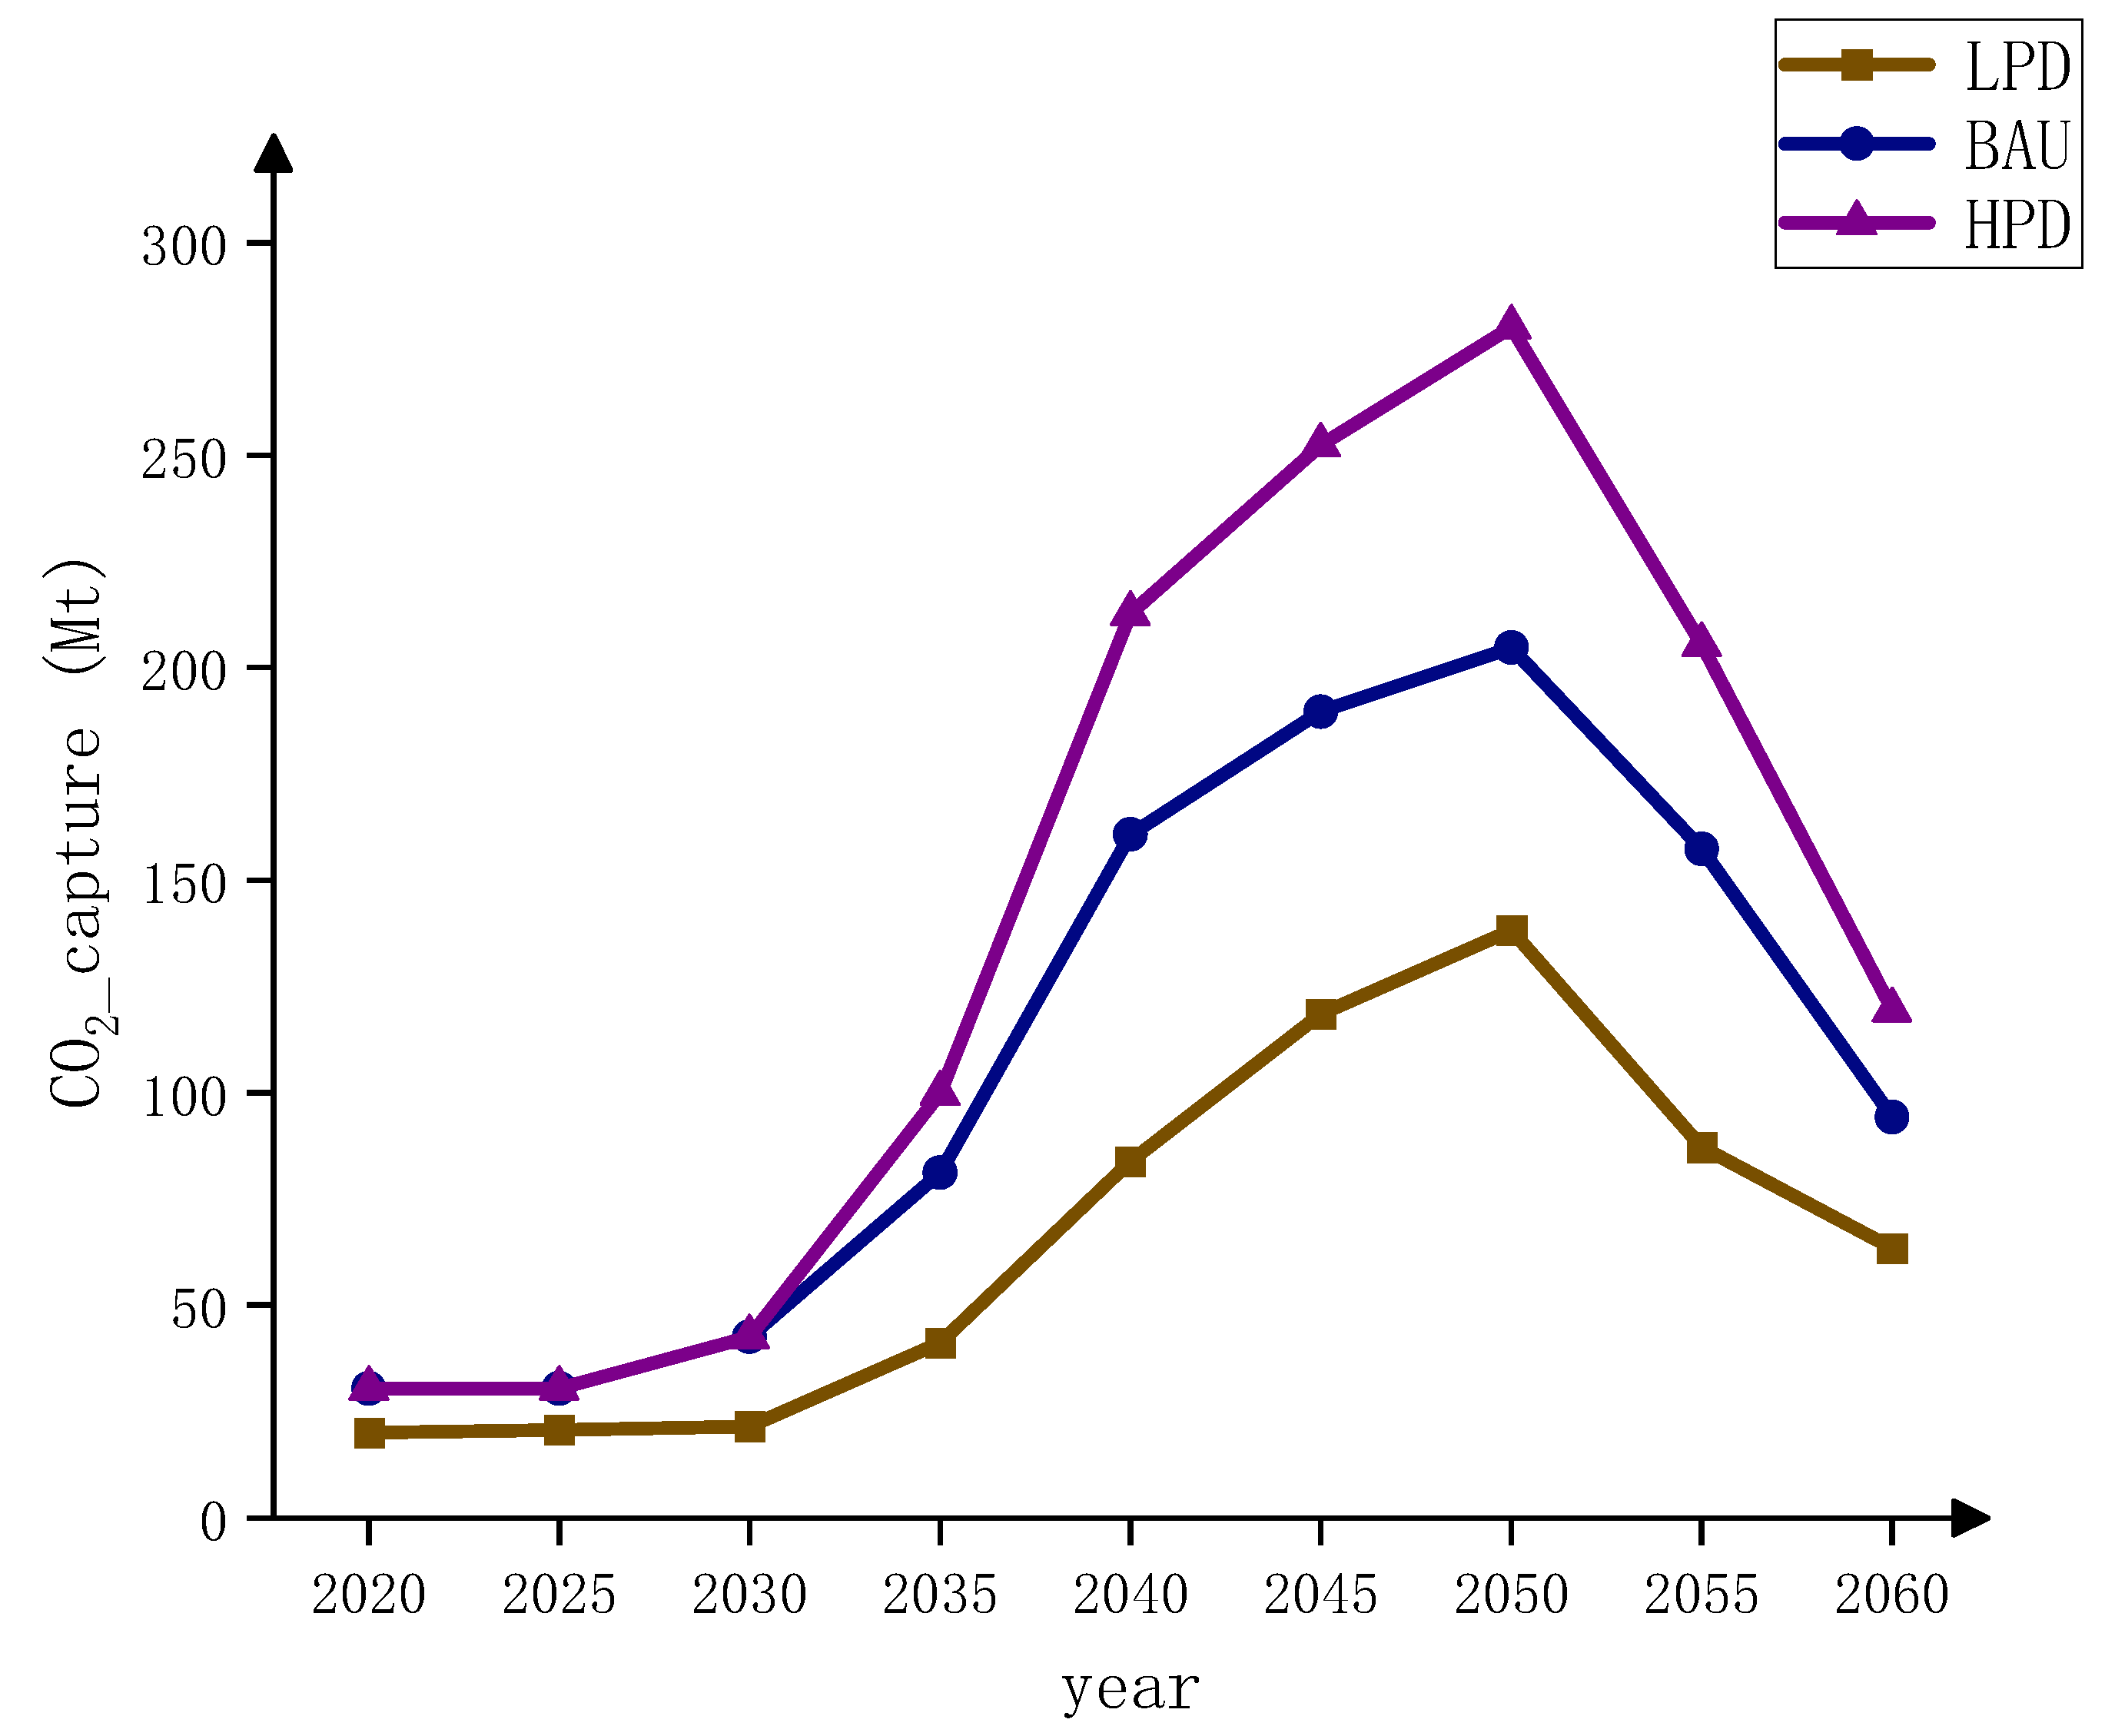
Figure 5 shows the overall CCUS capture of the Northeast Power Grid under the three power demand scenarios (HPD, BAU, LPD). It can be found that the main trend of CCUS use under different power demand scenarios is consistent, with the usage greatly increasing during 2020–2050 and declining during 2050–2060. The main reason for this trend is that in the process of realizing the goal of carbon neutrality in the power system, CCUS becomes a better choice for realizing carbon neutrality in the power system due to the reduction in CCUS cost and the increase in carbon dioxide emission price. However, after conventional coal power is eliminated in 2045, there will be no need to use too much CCUS to complete the purification of thermal power. At present, renewable power generation has become a cost-effective choice. Therefore, with the reduction in thermal power, CCUS will also decrease from 2050 to 2060. The period from 2030 to 2040 has a relatively fast growth rate. The reason is that carbon dioxide emissions need to decrease rapidly after reaching the carbon peak goal in 2030. In order to cope with the increasing power demand and cost constraints, thermal power cannot be withdrawn on a large scale, resulting in the situation that Northeast Power Grid still needs to retain part of thermal power. Therefore, the use of CCUS thermal power generation has become an inevitable choice.
Compared with the research results of Shu [1], it can be found that different power demand scenarios affect the elimination speed of traditional thermal power and determine the input and usage of CCUS. When the Northeast Power Grid area achieves carbon neutrality around 2060, about 80 Mt of carbon dioxide will be captured every year.
5. Suggestions and Policies
As a power grid region with a large power output, the Northeast Power Grid region must first achieve carbon peak and carbon neutrality and deliver relatively clean electricity to the North China Power Grid region with a large demand for electricity so as to achieve the goal of carbon peak and carbon neutrality in the national power field. Different regions have different potentials in applying CCUS to complete carbon neutralization of the power system, so there are great differences in application.
A large-scale CCUS pilot can be carried out in the Northeast China region so as to better complete the transition of the power system from conventional thermal power to new energy. Provincial policy recommendations are as follows:
(1) Jilin and Heilongjiang:
Jilin and Heilongjiang can apply CCUS for carbon neutralization to a large extent. The initial construction and operation cost of wind power is relatively cheap compared with that of optoelectronics. Therefore, a large number of wind power stations should be established before the carbon peak is reached in 2030 to sufficiently prepare for the large-scale elimination of thermal power generation after 2030. With the progress of technology, the cost and difficulty of photovoltaic construction are gradually reduced, and a large number of photovoltaic constructions can be carried out around 2035 so as to make up for factors such as wind power generation ceiling and instability in the later period. Therefore, CCUS transportation and storage centers in the Northeast Power Grid are located in Heilongjiang and Jilin provinces. To realize the development of power system CCUS, it is necessary to increase the capacity and length of carbon dioxide transmission by CCUS and further expand the total and scope of carbon dioxide capture and storage.
(2) Mengdong:
Mengdong also has great potential for wind and photoelectric power. Different from the Northeast China Power Grid, thermal power generation in Mengdong is cheaper and has a large ratio of thermal power generation capacity to power demand. Considering the cost before 2030, it is not suitable to directly eliminate a large number of thermal power generation units. In the early stage, thermal power generation can be retained without growth, and it is economically feasible to adopt a large number of wind power constructions to meet the growing power demand and output demand; also there is no need to build a large-scale CCUS outward pipeline, and carbon dioxide can be captured and absorbed in the nearby area, such as in the Hailaer Basin.
(3) Liaoning:
Liaoning is the province with the largest power demand in the Northeast Power Grid region, and it is the only province in the region that has the potential to use nuclear power on a large scale. Therefore, after 2035, nuclear power generation may become the largest power generation mode in Liaoning, which will keep increasing. Therefore, under the background of increasing power demand and interaction, it is necessary to expand the capacity of transmission lines between Liaoning province and other regions. First, there can be a lot of expansion in the Mengdong region of the transmission line, as it has a large, redundant renewable energy power generation capacity, which can be performed through the expansion of the transmission line of electricity in Mengdong and Liaoning and through the Liaoning electric power hub station by transmitting the power to the higher demand in the North China region, contributing to the country’s carbon neutrality in the domain. However, Liaoning does not have as much geological storage potential for CCUS as the other three provinces. Therefore, considering the transportation distance and cost of the carbon dioxide pipe network in the short term, Liaoning is not suitable for the deployment of a large number of CCUS capture devices. This may change with the progress of technology and the reduction in CCUS technology cost.
6. Conclusions
By using the two-stage power optimization model and aiming at the lowest total cost, multi-regional power optimization was carried out for each major power grid region in China to obtain the power generation situation and mutual power transmission situation at first. Then, the second stage of the regional power optimization model, considering CCUS is established to optimize regional power in Northeast China. The situation of power generation and transmission in the Northeast Power Grid and CCUS usage can be obtained.
First of all, the Northeast Power Grid region and the Northwest Power Grid region have huge potential for wind power and photovoltaic power. Making full use of the redundant power generation capacity of these two power grids and transmitting part of the power to the North China Power Grid and the East China Power Grid, which have high power demand and small renewable energy power generation potential, will assist the North China Power Grid region and the Northeast Power Grid region in reducing the use of conventional thermal power, increasing the use of clean energy, gradually reducing the total carbon emissions of regional power, and solving the problems of excessive dependence on thermal power and excessive carbon emissions in the two power grids region.
In the Northeast Power Grid region, through regional optimization analysis, the carbon-neutral transition mode of the Northeast Power Grid using CCUS technology in the power industry can be obtained. The abundant renewable energy generation potential and CCUS storage potential of the Northeast Power Grid can be fully utilized in the process of realizing the carbon neutrality of power. Cheaper and abundant wind power and photovoltaics will be the main source of power generation for each province in the future, and Liaoning’s unique nuclear power will also occupy a certain proportion of power generation in the future. The gradual arrangement of CCUS can ensure that thermal power in Northeast China is used for a period of time to give some buffer time for the expansion of renewable energy installations and also to generate considerable benefits. Due to the limitation of the distance between the CCUS storage area and the pipeline, the arrangement of CCUS in Heilongjiang, Jilin, and Mengdong is more economical and convenient, so it is a better choice for electricity carbon-neutral transition.
However, some problems are not taken into account in this research. The transmission cost of each region only considers the distance factor but does not specifically consider the transmission power difference and loss difference of each region. The model can be refined to optimize the power generation situation each year from 2020 to 2060. However, due to the amount of calculation, the two-stage power optimization model does not consider the power generation situation each year but only makes the optimization analysis every five years. The research direction that can be expanded in this paper is that the annual power generation situation of the region can be further analyzed in detail, and the direct or impact of changes in each input factor on the results can be analyzed by DEA theory.
Author Contributions
Conceptualization, H.M.; Methodology, H.M., H.W., N.L. and Y.D.; Project administration, Z.P.; Supervision, H.M., H.W., N.L. and Y.D.; Writing—original draft, Z.P.; Writing—review and editing, Z.P. and H.W. All authors have read and agreed to the published version of the manuscript.
Funding
We gratefully acknowledge the financial support from the National Natural Science Foundation of China (No. 51976020, 71603039). The study is also supported by the Fundamental Research Funds for the Central Universities, China (DUT21RC (3) 004).
Data Availability Statement
The data used in the current study are available in the Power Statistical Yearbook of China and other public resources.
Conflicts of Interest
The authors declare no conflict of interest.
Nomenclature
| Symbol and Definitions | |
| Annual power generation of generation mode j in region i | |
| Annual generation time of generation mode j in region i | |
| The unit generation cost of generation mode j in region i | |
| The annual power transmission from region i to k | |
| The annual transmission cost from region i to k | |
| The cost of carbon dioxide emission in region i | |
| The cost of newly installed power generation units of power generation mode j in region i | |
| The time value of money | |
| The newly installed capacity of generation mode j in region i in year y | |
| The total power demand of region i in the current year | |
| Electricity emissions in region i | |
| Inter-regional transmission line capacity upper limit from i to k | |
| Inter-regional transmission line capacity lower limit from i to k | |
| Upper limit of transmission line capacity between Northeast grid province i and external grid areas | |
| Lower limit of transmission line capacity between Northeast grid province i and external grid areas | |
| CCUS power capture in region i | |
| CCUS power seal in region m | |
| The annual transmission from region i to m | |
| Power production and transport losses | |
| Cross-regional transmission line loss ratio | |
| Installed capacity of j power generation mode in region i | |
| Lower generation capacity limit of j power generation mode in region i | |
| The annual generation time limit for generation mode j | |
| The upper limit of annual generating hours for generation mode j | |
| The lower limit of annual generating hours for generation mode j | |
| Power carbon dioxide emission quota of i region | |
| Quantity of electricity transferred from Northeast grid province I to the external grid area | |
| Actual power interaction between Northeast Power Grid area and external power grid area (second stage) | |
| The newly installed capacity of j power generation mode in region i | |
| CCUS unit carbon dioxide capture cost | |
| CCUS unit carbon dioxide transmission cost | |
| CCUS unit carbon dioxide seal cost | |
| The annual Electricity transmission from the NortheastPower Grid region to the outside |
References
- Shu, Y.; Zhang, L.; Zhang, Y.; Wang, Y.; Lu, G.; Yuan, B.; Peng, X. Carbon Peak and Carbon Neutrality Path for China’s Power Industry. Eng. Sci. 2021, 23, 1–14. [Google Scholar]
- Wei, T.; Peng, W.; Yu, Z.; Xiaodong, C. Analysis on the Current Situation and Development Trend of China’s Electrification Level and Electric Energy Substitution under the Background of Carbon Neutral. IOP Conf. Ser. Earth Environ. Sci. 2021, 661, 012019. [Google Scholar]
- Wu, Z.; Fan, X.; Zhu, B.; Xia, J.; Zhang, L.; Wang, P. Do government subsidies improve innovation investment for new energy firms: A quasi-natural experiment of China’s listed companies. Technol. Forecast. Soc. Chang. 2022, 175, 121418. [Google Scholar]
- Tang, H.; Zhang, S.; Chen, W. Assessing Representative CCUS Layouts for China’s Power Sector toward Carbon Neutrality. Environ. Sci. Technol. 2021, 55, 11225–11235. [Google Scholar]
- Wang, F.; Wang, P.; Wang, Q.; Dong, L. Optimization of CCUS Source-Sink Matching for Large Coal-Fired Units: A Case of North China. IOP Conf. Ser. Earth Environ. Sci. 2018, 170, 042045. [Google Scholar]
- Guo, Z.; Ma, L.; Liu, P.; Jones, I.; Li, Z. A multi-regional modelling and optimization approach to China’s power generation and transmission planning. Energy 2016, 116, 1348–1359. [Google Scholar]
- Wang, H.; Su, B.; Mu, H.; Li, N.; Jiang, B.; Kong, X. Optimization of electricity generation and interprovincial trading strategies in Southern China. Energy 2019, 174, 696–707. [Google Scholar]
- Ying, Z.; Xin-Gang, Z. The impact of Renewable Portfolio Standards on carbon emission trading under the background of China’s electricity marketization reform. Energy 2021, 226, 120322. [Google Scholar]
- Elshkaki, A. Material-energy-water-carbon nexus in China’s electricity generation system up to 2050. Energy 2019, 189, 116355. [Google Scholar]
- Zhu, B.; Xu, C.; Wang, P.; Zhang, L. How does internal carbon pricing affect corporate environmental performance? J. Bus. Res. 2022, 145, 65–77. [Google Scholar]
- Zhu, B.; Ye, S.; Wang, P.; Chevallier, J.; Wei, Y.-M. Forecasting carbon price using a multi-objective least squares support vector machine with mixture kernels. J. Forecast. 2022, 41, 100–117. [Google Scholar]
- Kia, M.; Nazar, M.S.; Sepasian, M.S.; Heidari, A.; Sharaf, A.M. Coordination of heat and power scheduling in micro-grid considering inter-zonal power exchanges. Energy 2017, 141, 519–536. [Google Scholar]
- Zhang, D.; Liu, P.; Ma, L.; Li, Z. A multi-period optimization model for optimal planning of China’s power sector with consideration of carbon mitigation-The optimal pathway under uncertain parametric conditions. Comput. Chem. Eng. 2013, 50, 196–206. [Google Scholar]
- Chen, S.; Liu, P.; Li, Z. Multi-regional power generation expansion planning with air pollutants emission constraints. Renew. Sustain. Energy Rev. 2019, 112, 382–394. [Google Scholar]
- Zhang, S.; Liu, L.; Zhang, L.; Zhuang, Y.; Du, J. An optimization model for carbon capture utilization and storage supply chain: A case study in Northeastern China. Appl. Energy 2018, 231, 194–206. [Google Scholar]
- Rego, E.E.; Costa, O.L.V.; Ribeiro, C.d.O.; Lima Filho, R.I.d.R.; Takada, H.; Stern, J. The trade-off between demand growth and renewables: A multiperiod electricity planning model under CO2 emission constraints. Energy 2020, 213, 118832. [Google Scholar]
- Zhang, S.; Zhuang, Y.; Tao, R.; Liu, L.; Zhang, L.; Du, J. Multi-objective optimization for the deployment of carbon capture utilization and storage supply chain considering economic and environmental performance. J. Clean. Prod. 2020, 270, 122481. [Google Scholar]
- Pratama, Y.W.; Purwanto, W.W.; Tezuka, T.; McLellan, B.C.; Hartono, D.; Hidayatno, A.; Daud, Y. Multi-objective optimization of a multiregional electricity system in an archipelagic state: The role of renewable energy in energy system sustainability. Renew. Sustain. Energy Rev. 2017, 77, 423–439. [Google Scholar]
- Mondal, M.A.H.; Ringler, C. Long-term optimization of regional power sector development: Potential for cooperation in the Eastern Nile region? Energy 2020, 201, 117703. [Google Scholar]
- Ordonez, J.A.; Fritz, M.; Eckstein, J. Coal vs. renewables: Least-cost optimization of the Indonesian power sector. Energy Sustain. Dev. 2022, 68, 350–363. [Google Scholar]
- Yi, B.-W.; Xu, J.-H.; Fan, Y. Inter-regional power grid planning up to 2030 in China considering renewable energy development and regional pollutant control: A multi-region bottom-up optimization model. Appl. Energy 2016, 184, 641–658. [Google Scholar]
- Zou, J.; Yang, X.; Liu, Z.; Liu, J.; Zhang, L.; Zheng, J. Multiobjective bilevel optimization algorithm based on preference selection to solve energy hub system planning problems. Energy 2021, 232, 120995. [Google Scholar]
- Shihua, L.; Weihao, H.; Zhenyuan, Z.; Yuefang, D.; Wen, L.; Zhe, C. Exploring the Pathways toward a Carbon-Neutral Sichuan Power Sector in 2060. In Proceedings of the 2021 IEEE/IAS Industrial and Commercial Power System Asia (I&CPS Asia), Chengdu, China, 18–21 July 2021. [Google Scholar]
- Jiang, W.; Song, Z.; Wang, Z.; Guo, G. Research on the construction of carbon emission model of power generation industry in Jilin province. MATEC Web Conf. 2022, 355, 02032. [Google Scholar]
- Wang, S.; Xie, Y.L.; Huang, G.H.; Yao, Y.; Wang, S.Y.; Li, Y.F. A Structural Adjustment optimization model for electric-power system management under multiple Uncertainties—A case study of Urumqi city, China. Energy Policy 2021, 149, 112056. [Google Scholar]
- Wu, C.; Guan, P.; Zhong, L.; Lv, J.; Hu, X.; Huang, G.; Li, C. An optimized low-carbon production planning model for power industry in coal-dependent regions—A case study of Shandong, China. Energy 2020, 192, 116636. [Google Scholar]
- Koltsaklis, N.E.; Georgiadis, M.C. A multi-period, multi-regional generation expansion planning model incorporating unit commitment constraints. Appl. Energy 2015, 158, 310–331. [Google Scholar]
- Abdollahi, E.; Wang, H.; Lahdelma, R. An optimization method for multi-area combined heat and power production with power transmission network. Appl. Energy 2016, 168, 248–256. [Google Scholar]
- Chen, C.; Li, Y.; Huang, G. An inexact robust optimization method for supporting carbon dioxide emissions management in regional electric-power systems. Energy Econ. 2013, 40, 441–456. [Google Scholar]
- Ding, Y.; Wei, X. Bi-level optimization model for regional energy system planning under demand response scenarios. J. Clean. Prod. 2021, 323, 129009. [Google Scholar]
- Li, X.; Wang, W.; Wang, H. A novel bi-level robust game model to optimize a regionally integrated energy system with large-scale centralized renewable-energy sources in Western China. Energy 2021, 228, 120513. [Google Scholar]
- Mostafaeipour, A.; Bidokhti, A.; Fakhrzad, M.-B.; Sadegheih, A.; Mehrjerdi, Y.Z. A new model for the use of renewable electricity to reduce carbon dioxide emissions. Energy 2022, 238, 121602. [Google Scholar]
- Wehbe, N. Optimization of Lebanon’s power generation scenarios to meet the electricity demand by 2030. Electr. J. 2020, 33, 106764. [Google Scholar]
- Algarvio, H. The Role of Local Citizen Energy Communities in the Road to Carbon-Neutral Power Systems: Outcomes from a Case Study in Portugal. Smart Cities 2021, 4, 840–863. [Google Scholar]
- Pilpola, S.; Arabzadeh, V.; Mikkola, J.; Lund, P.D. Analyzing National and Local Pathways to Carbon-Neutrality from Technology, Emissions, and Resilience PerspectivesCase of Finland. Energies 2019, 12, 949. [Google Scholar]
- Awopone, A.K.; Zobaa, A.; Banuenumah, W. Assessment of optimal pathways for power generation system in Ghana. Cogent Eng. 2017, 4, 1314065. [Google Scholar]
- De Rosa, L.; Castro, R. Forecasting and assessment of the 2030 australian electricity mix paths towards energy transition. Energy 2020, 205, 118020. [Google Scholar]
- Zhang, Y.; Zhang, N.; Dai, H.; Zhang, S.; Wu, X.; Xue, M. Model Construction and Pathways of Low-Carbon Transition of China’s Power System. Electr. Power 2021, 54, 1–11. [Google Scholar]
- Zou, C.; Xiong, B.; Xue, H.; Zheng, D.; Ge, Z.; Wang, Y.; Jiang, L.; Pan, S.; Wu, S. The role of new energy in carbon neutral. Pet. Explor. Dev. 2021, 48, 480–491. [Google Scholar]
- Guo, W.; Mao, Y.; Zhang, X.; Yin, H. Internal benefit optimization model of gas-thermal power virtual power plant under China’s carbon neutral target. Energy Sci. Eng. 2022, 10, 1227–1239. [Google Scholar]
- Liu, L.; Wang, Y.; Wang, Z.; Li, S.; Li, J.; He, G.; Li, Y.; Liu, Y.; Piao, S.; Gao, Z.; et al. Potential contributions of wind and solar power to China’s carbon neutrality. Resour. Conserv. Recycl. 2022, 180, 106155. [Google Scholar]
- Zeng, X.; Chen, G.; Luo, S.; Teng, Y.; Zhang, Z.; Zhu, T. Renewable transition in the power and transport sectors under the goal of carbon-neutral in Sichuan, China. Energy Rep. 2022, 8, 738–748. [Google Scholar]
- Fan, F.; Wang, Y.; Liu, Q. China’s carbon emissions from the electricity sector: Spatial characteristics and interregional transfer. Integr. Environ. Assess. Manag. 2022, 18, 258–273. [Google Scholar] [PubMed]
- Zhang, Y.; Ma, T.; Guo, F. A multi-regional energy transport and structure model for China’s electricity system. Energy 2018, 161, 907–919. [Google Scholar]
- Vaillancourt, K.; Alcocer, Y.; Bahn, O.; Fertel, C.; Frenette, E.; Garbouj, H.; Kanudia, A.; Labriet, M.; Loulou, R.; Marcy, M.; et al. A Canadian 2050 energy outlook: Analysis with the multi-regional model TIMES-Canada. Appl. Energy 2014, 132, 56–65. [Google Scholar]
- Pourmoosavi, M.-A.; Amraee, T. Low carbon generation expansion planning with carbon capture technology and coal phase-out under renewable integration. Int. J. Elec. Power 2021, 128, 106715. [Google Scholar]
- Wang, H.; Su, B.; Mu, H.; Li, N.; Gui, S.; Duan, Y.; Jiang, B.; Kong, X. Optimal way to achieve renewable portfolio standard policy goals from the electricity generation, transmission, and trading perspectives in southern China. Energy Policy 2020, 139, 111319. [Google Scholar]
- Wang, H. Land use requirements for the power sector considering renewable energy development and water consumption in China. Environ. Sci. Pollut. Res. 2022. [Google Scholar] [CrossRef]
- Fan, J.-L.; Xu, M.; Wei, S.; Shen, S.; Diao, Y.; Zhang, X. Carbon reduction potential of China’s coal-fired power plants based on a CCUS source-sink matching model. Resour. Conserv. Recycl. 2021, 168, 105320. [Google Scholar]
Figure 1.
The Northeast Power Grid region and main storage location schematic diagram.

Figure 2.
National power structure in the BAU scenario between 2020 and 2060. (NG—gas power generation, HD—hydroelectric, NU—nuclear power, PV—photovoltaic power, WD—wind power, PC—coal power).
Figure 2.
National power structure in the BAU scenario between 2020 and 2060. (NG—gas power generation, HD—hydroelectric, NU—nuclear power, PV—photovoltaic power, WD—wind power, PC—coal power).

Figure 3.
(a) Heilongjiang power generation in the BAU scenario between 2020 and 2060. (b) Jilin power generation in the BAU scenario between 2020 and 2060. (c) Liaoning power generation in the BAU scenario between 2020 and 2060. (d) Mengdong power generation in the BAU scenario between 2020 and 2060.


Figure 4.
CCUS sequestration of Northeast Power Grid region in the BAU scenario between 2020 and 2060.
Figure 4.
CCUS sequestration of Northeast Power Grid region in the BAU scenario between 2020 and 2060.

Figure 5.
The CCUS capture under different scenarios in the Northeast grid region between 2020 and 2060.
Figure 5.
The CCUS capture under different scenarios in the Northeast grid region between 2020 and 2060.


Table 1.
Review of power system model studies in recent years.
| Study | Scope | Objective | Region | ||
|---|---|---|---|---|---|
| Single | Multi | Single | Multi | ||
| Ali et al. (2022) [32] | Iran | √ | √ | ||
| Nour et al. (2020) [33] | Lebanon | √ | √ | ||
| Sannamari et al. (2019) [35] | Finland | √ | √ | ||
| Albert et al. (2017) [36] | Ghana | √ | √ | ||
| Luca et al. (2020) [37] | Australia | √ | √ | ||
| Zhang et al. (2021) [38] | China | √ | √ | ||
| Zou et al. (2021) [39] | China | √ | √ | ||
| Gou et al. (2022) [40] | China | √ | √ | ||
| Liu et al. (2022) [41] | China | √ | √ | ||
| Shu et al. (2021) [1] | China | √ | √ | ||
| Wang et al. (2020) [47] | China/Southern China | √ | √ | ||
| Wang et al. (2022) [48] | China/Southern China | √ | √ | ||
| Luo et al. (2021) [23] | China | √ | √ | ||
| Jiang et al. (2022) [24] | Jilin | √ | √ | ||
| Zeng et al. (2022) [42] | Sichuan | √ | √ | ||
| Fan et al. (2022) [43] | China | √ | √ | ||
| Zhang et al. (2018) [44] | China | √ | √ | ||
| Zhang et al. (2013) [13] | China | √ | √ | ||
| Chen et al. (2019) [14] | China | √ | √ | ||
| Guo et al. (2016) [6] | China | √ | √ | ||
| Wang et al. (2021) [25] | Urumqi | √ | √ | ||
| This study | China/Northeast China | √ | two-stage model | ||
Table 2.
Three scenarios for electricity demand growth (%).
| Scenarios | 2020–2030 | 2030–2060 |
|---|---|---|
| High power demand (HPD) | 3.2 | 1.4 |
| Middle power demand (BAU) | 2.5 | 1.3 |
| Low power demand (LPD) | 2.2 | 1.2 |
Table 3.
Data source.
| Data | Meaning | Unit | Source |
|---|---|---|---|
| Multiple power generation Capacity | Limit the power generated | MW | China Electric Power Yearbook 2020 |
| Power generation Operating hours | Annual generation duration | Hour | China Electric Power Yearbook 2020 |
| District load | Electricity demand | MWh | China Electric Power Yearbook 2020 |
| Transmission constraint | Capacity and power | MWh | China Electric Power Yearbook 2020 |
| Transmission and distribution loss ratio | The power loss | None | China Electric Power Yearbook 2020 |
| Generation cost factor | Cost per unit of electricity generation | Yuan/MWh | 2018 National Electric Power Price Supervision Notice |
| Emission factor | Carbon emissions per unit of electricity generation | t/MWh | China Power Industry Annual Development Report 2019 |
| Carbon dioxide emissions | Yuan/t | China Annual Report on Carbon Dioxide Capture, Utilization and Storage (CCUS) (2021) | |
| Carbon dioxide capture | Yuan/t | China Annual Report on Carbon Dioxide Capture, Utilization and Storage (CCUS) (2021) | |
| Carbon dioxide transport | Yuan/(t.100 km) | China Annual Report on Carbon Dioxide Capture, Utilization and Storage (CCUS) (2021) | |
| Carbon dioxide sequestration | Yuan/t | China Annual Report on Carbon Dioxide Capture, Utilization and Storage (CCUS) (2021) | |
| Hydroelectric generation potential | Upper limit of hydropower construction | MW | Renewable Energy review in China 2003 |
| Other power generation potential | Upper limit of other power generation construction | MW | China Renewable Energy Outlook 2017 |
| Annual installation cap | Annual new power generation installation | MW | Research in A multi-region optimization planning model for China’s power sector |
Publisher’s Note: MDPI stays neutral with regard to jurisdictional claims in published maps and institutional affiliations. |
© 2022 by the authors. Licensee MDPI, Basel, Switzerland. This article is an open access article distributed under the terms and conditions of the Creative Commons Attribution (CC BY) license (https://creativecommons.org/licenses/by/4.0/).
Share and Cite
MDPI and ACS Style
Mu, H.; Pei, Z.; Wang, H.; Li, N.; Duan, Y. Optimal Strategy for Low-Carbon Development of Power Industry in Northeast China Considering the ‘Dual Carbon’ Goal. Energies 2022, 15, 6455. https://doi.org/10.3390/en15176455
AMA Style
Mu H, Pei Z, Wang H, Li N, Duan Y. Optimal Strategy for Low-Carbon Development of Power Industry in Northeast China Considering the ‘Dual Carbon’ Goal. Energies. 2022; 15(17):6455. https://doi.org/10.3390/en15176455
Chicago/Turabian StyleMu, Hailin, Zhewen Pei, Hongye Wang, Nan Li, and Ye Duan. 2022. "Optimal Strategy for Low-Carbon Development of Power Industry in Northeast China Considering the ‘Dual Carbon’ Goal" Energies 15, no. 17: 6455. https://doi.org/10.3390/en15176455
Note that from the first issue of 2016, this journal uses article numbers instead of page numbers. See further details here.