Article

Optimal Sizing and Techno-Economic Analysis of Grid-Independent Hybrid Energy System for Sustained Rural Electrification in Developing Countries: A Case Study in Bangladesh

by
Md. Rashedul Islam
*,
Homeyra Akter
,
Harun Or Rashid Howlader
* and
Tomonobu Senjyu
*
Faculty of Engineering, University of the Ryukyus, 1 Senbaru, Nakagami, Nishihara-cho 903-0213, Japan
*
Authors to whom correspondence should be addressed.
Energies 2022, 15(17), 6381; https://doi.org/10.3390/en15176381
Submission received: 29 July 2022 / Revised: 27 August 2022 / Accepted: 29 August 2022 / Published: 1 September 2022

Abstract

:
The absence of electricity is among the gravest problems preventing a nation’s development. Hybrid renewable energy systems (HRES) play a vital role to reducing this issue. The major goal of this study is to use the non-dominated sorting genetic algorithm (NSGA)-II and hybrid optimization of multiple energy resources (HOMER) Pro Software to reduce the net present cost (NPC), cost of energy (COE), and CO2 emissions of proposed power system. Five cases have been considered to understand the optimal HRES system for Kutubdia Island in Bangladesh and analyzed the technical viability and economic potential of this system. To demonstrate the efficacy of the suggested strategy, the best case outcomes from the two approaches are compared. The study’s optimal solution is also subjected to a sensitivity analysis to take into account fluctuations in the annual wind speed, solar radiation, and fuel costs. According to the data, the optimized PV/Wind/Battery/DG system (USD 711,943) has a lower NPC than the other cases. The NPC obtained by the NSGA-II technique is 2.69% lower than that of the HOMER-based system.

1. Introduction

Energy is regarded as a driving force behind a country’s economic growth, particularly in emerging countries [1]. Bangladesh’s energy demand has risen dramatically during the past decade as the country’s population and economic development have accelerated. Now, electricity demand in Bangladesh is nearly 20,000 megawatts (MW). Natural gas is the main fuel used to generate electricity in Bangladesh. As a result, natural gas demand is steadily increasing [2].
Kutubdia is a remote island of the Chittagong division located approximately 90 km southwest of Cox’s Bazar [3]. Its location is 21.8167 S latitude and 91.8583 E longitude. It covers 215.8 km2 and has a population of nearly 133,888 people. The literacy rate is 32.4% [4]. The main occupations of Kutubdia’s population are agriculture, fishing, and salt farming. Since it is a remote island, the main island cannot provide electricity to it. The power generation system of the island is a windmill, and the total rated output power is 1 MW [5]. Due to the large generation of power from fossil fuels such as oil, coal, and gas, greenhouse gas emissions are growing from day to day, wreaking havoc on the environment. Greenhouse gas emissions in Bangladesh were 74,476,230 tons, 71,265,882 tons and 65,735,285 tons CO 2 , respectively, in FY 2016, FY 2015 and FY 2014. 41.7% of CO2 emissions are caused by power industries [6]. The greatest way to lower CO2 emissions is through renewable energy. In response to energy conservation and security concerns, renewable energy sources such as wind and photovoltaic (PV) were incorporated into a country’s energy mix [7]. The load curve in a power system is converted into a duck curve via renewable energy operational scheduling. This idea of a duck curve is often used to represent the temporal mismatch among peak load and PV output [8,9]. The battery energy storage system (BESS) is often regarded as a viable tool for addressing these issues since it can store excess energy and supply electricity at reduced power levels. Batteries have become popular as storage devices due to their minimal emissions and high efficiency. On the other hand, the development of BESS is constrained by significant capital expenses. A BESS installation that is haphazard or inefficient can result in higher installation costs, system damage, and lower BESS capacity. An adequate size approach for installed equipment in a future hybrid implementation might assist in achieving maximum power reliability while lowering system costs [10,11]. Optimizing the electric grid with diesel generator (DG) backup may be both economic and ecologically favorable in terms of enhancing human health, reducing air pollution, and attenuating noise when renewable energy sources are employed in remote regional power systems [5]. To reduce the usage of conventional energy sources and pollutants, it is crucial to discover sustainable energy sources. One feasible answer is to encourage renewable and optimal energy sources to meet the growing load demand in Bangladesh and the rest of the world [12]. Yet currently, the renewable energy system is not so popular in Bangladesh. In Bangladesh, Solar accounts for 0.62% of total energy, while gas and heavy fuel oil (HFO) account for 53.02% and 25.51%, respectively, [13]. Due to their unpredictability and severe dependency on environmental conditions, current renewable energy supplies by themselves in off-grid regions are unable to offer a consistent electrical supply. Hybrid renewable energy systems have become the subject of research recently. It has already been mentioned that integrating combustion-based engines or sizable banks of batteries, for instance, with solar PV-based renewable energy systems, is financially advantageous [14].
The major goal of this paper is to optimize the sizing of a hybrid renewable energy system to supply continuous energy to the considered area of Kutubdia Island in Bangladesh through technical and economic analysis. The following actions were taken to accomplish this goal:
  • The power system is played through in all possible configurations, taking into account renewable energy sources and determining the best possible optimal system.
  • Five feasible cases are discussed to determine which is the most cost-effective and environmentally friendly.
  • The hybrid optimization of multiple energy resources (HOMER) software tool and the NSGA (Non-dominated Sorting Genetic Algorithm)-optimization method are used to conduct a comparative study of the proposed PV/Wind/Battery/DG based system.
  • The proposed optimal system is compared with the current energy situation in selected area. For the optimal system, sensitivity analysis and payback are also considered. In sensitivity analysis, the effectiveness of wind speed and diesel price variation is discussed.
The remainder of the article is structured as follows: Section 2 describes the literature review. Section 3 discusses the proposed power system methodology and its description. The objective function and constraints are explained in Section 4. The outcomes of five separate situations and the viability of the suggested approach are discussed in Section 5. Finally, Section 6 discusses the conclusions.

2. Literature Review

Researchers across the world have conducted many notable initiatives on the hybrid power system, in which some recent studies are discussed in this section for a better understanding. In [15], PLEXOS software was used to integrate a significant amount of renewable energy onto an island, which is even less expensive (2.5%) and satisfied 78.1% of the total energy requirements. However, no hazard or sensitivity assessments were made, which are necessary to ensure the applicability of the proposed power system. Ref. [16] explains how, for both financial and environmental considerations, a smart energy system was built together with the combined storage (battery and hydrogen) technology. Nevertheless, they failed to specify how their suggested method would be technically possible. In [17], they looked into a CHP-PV-based microgrid’s overall economic viability as well as the microturbine productivity of the CHP unit. It ignored the significance of other delicate factors, such as solar irradiation. Only focused on the effects of changes in load and fuel prices.
In [18], the PV/Wind/Battery/Diesel hybrid model is optimized to fulfill the electrical energy requirements and reduce CO2 emissions. Their proposed system shows no evidence of sensitivity or risk analysis. The aim of [19] was to determine the size of a hybrid energy storage system comprising a hydrogen fuel cell and a super-capacitor for a commercial load generated from solar panels. Under the meteorological conditions of Cape Town, HOMER Pro is used to conduct a sensitivity analysis on the predicted prices of hydrogen storage to determine the impact of hydrogen costs on system and cost of energy (COE). Even if it is anticipated that the price of such a hybrid backup system would decrease in the long run, it will still be too expensive to deploy for a commercial load. In [20], a multi-objective optimization technique is used on Aguni Island, Japan to minimize the cost and carbon pollution of a hybrid energy system made up of PV, WG, BESS, and DG. The given issue is fixed in the appearance of ADLC using the e-constraint technique and MILP. The proposed solution does not account for real-time load demand variability.
In [21], an upgraded multi-objective grey wolf optimization technique has been used to estimate the ideal size of a hybrid microgrid for an island that includes solar panels, wind turbines, tidal current, batteries, and diesel in order to maintain the system’s annual cost as low as feasible and avoid the danger of a power distribution deficit. Only the startup and operating costs of installed equipment are evaluated in this study, which cannot accurately reflect the appropriate COE. In order to meet the electrical needs of a small hamlet in northern Nigeria at the lowest cost and even with the least environmental impact, a hybrid system made of solar, wind, batteries, and diesel is optimized using a Genetic Algorithm (GA) in [22]. In [23], a GA and HOMER Pro Software are used to reduce the total system net present cost (NPC), COE, unmet load, and CO2 emissions of an off-grid HRES. In [24], a Firefly algorithm is used to determine the appropriate size of a hybrid energy system based on solar, wind, and battery storage for supplying electricity to far-flung communities in India at the lowest feasible cost. In order to simulate the complete year, this method employs only one day of summer and winter data, which is insufficient.
In [25], HOMER Pro software is utilized to minimize the overall system’s NPC, COE, and CO2 emissions of an off-grid HRES that provides electricity to the Kutupalong camp in Ukhia, Cox’s Bazar, Bangladesh. There is no evidence of sensitivity analysis in their suggested system. According to [26], the suggested system will help to increase energy efficiency and promote the expansion of renewable energy in the Ukrainian energy sector. No combination is illustrated to verify which is more cost-effective and environmentally friendly in this system. Ref. [27], in southern Cameroon, to developed hybrid PV/diesel/small hydro/battery systems for remote electrification. The results show that the suggested technique is more effective than the present one in terms of NPC and lowers energy costs and CO2 emissions. There is no sign of sensitivity analysis in their suggested system. Ref. [28] provides instructions to guarantee that the government’s approach is effective by presenting the current situation, prospects, and current data on renewable and sustainable energy sources in Bangladesh.
In [29], it was examined if hybrid renewable energy systems (PV-wind-generator) could cover the energy requirements of autonomous desalination systems (ADS) capable of producing up to 50 m3 of water per day in an area with reasonably high wind and solar radiation profiles. These renewable energy methods are not cost-effective in compared to conventional fossil fuels. As addressed in [30], finding the most cost-effective and technologically feasible construction strategy is crucial for building MW-scale renewable energy-based hybrid power plants. The planned system is grid-connected, but no payback period is specified. Ref. [31] combines a demand-supply management (DSM) approach with a particle swarm optimization (PSO)-based method to regulate both the sellers and buyers, reducing building energy consumption and meeting load demand at the lowest feasible cost. The renewable fraction is increased from 15% (without DSM) to 63% (with DSM). Ref. [32] concentrated on HRESs that contain diesel as a backup, despite the high cost and vast distances required to transport fuel, making it less cheap and sustainable in rural areas. The goal of [33] is to create and visualize a perfect micro solar-diesel hybrid electricity generating plant in a remote location of Bangladesh in order to reliably satisfy electrical energy requirements. Sensitivity analysis is not discussed in the proposed system. The suggested system makes no mention of sensitivity analysis. In [34], PV/micro-hydro/wind turbine/biomass generators compare the cost of HRES with a independent diesel generator. Sensitivity analysis is not mentioned in the proposed system. Ref. [35] asserts that HRES is now possible due to the recent substantial decline in the price of wind turbines and solar panels. The intensity of renewable resources, the thermal-to-electrical demand ratio, and the price of diesel fuel are the three main contributing aspects that determine the optimal system. This system makes no mention of environmental impact or sensitivity assessments.
The HRES sizing procedure is more difficult due to the unpredictable supply of renewable resources. Therefore, a fair trade-off between economic and dependability considerations should be taken into account. As a result, several models (algorithms) and software tools have been used to optimize HRES designs, and more are still being created [36,37,38]. The significance of the criteria to be applied in order to produce the optimum hybrid power systems was determined using an analytical hierarchy process (AHP) [39].

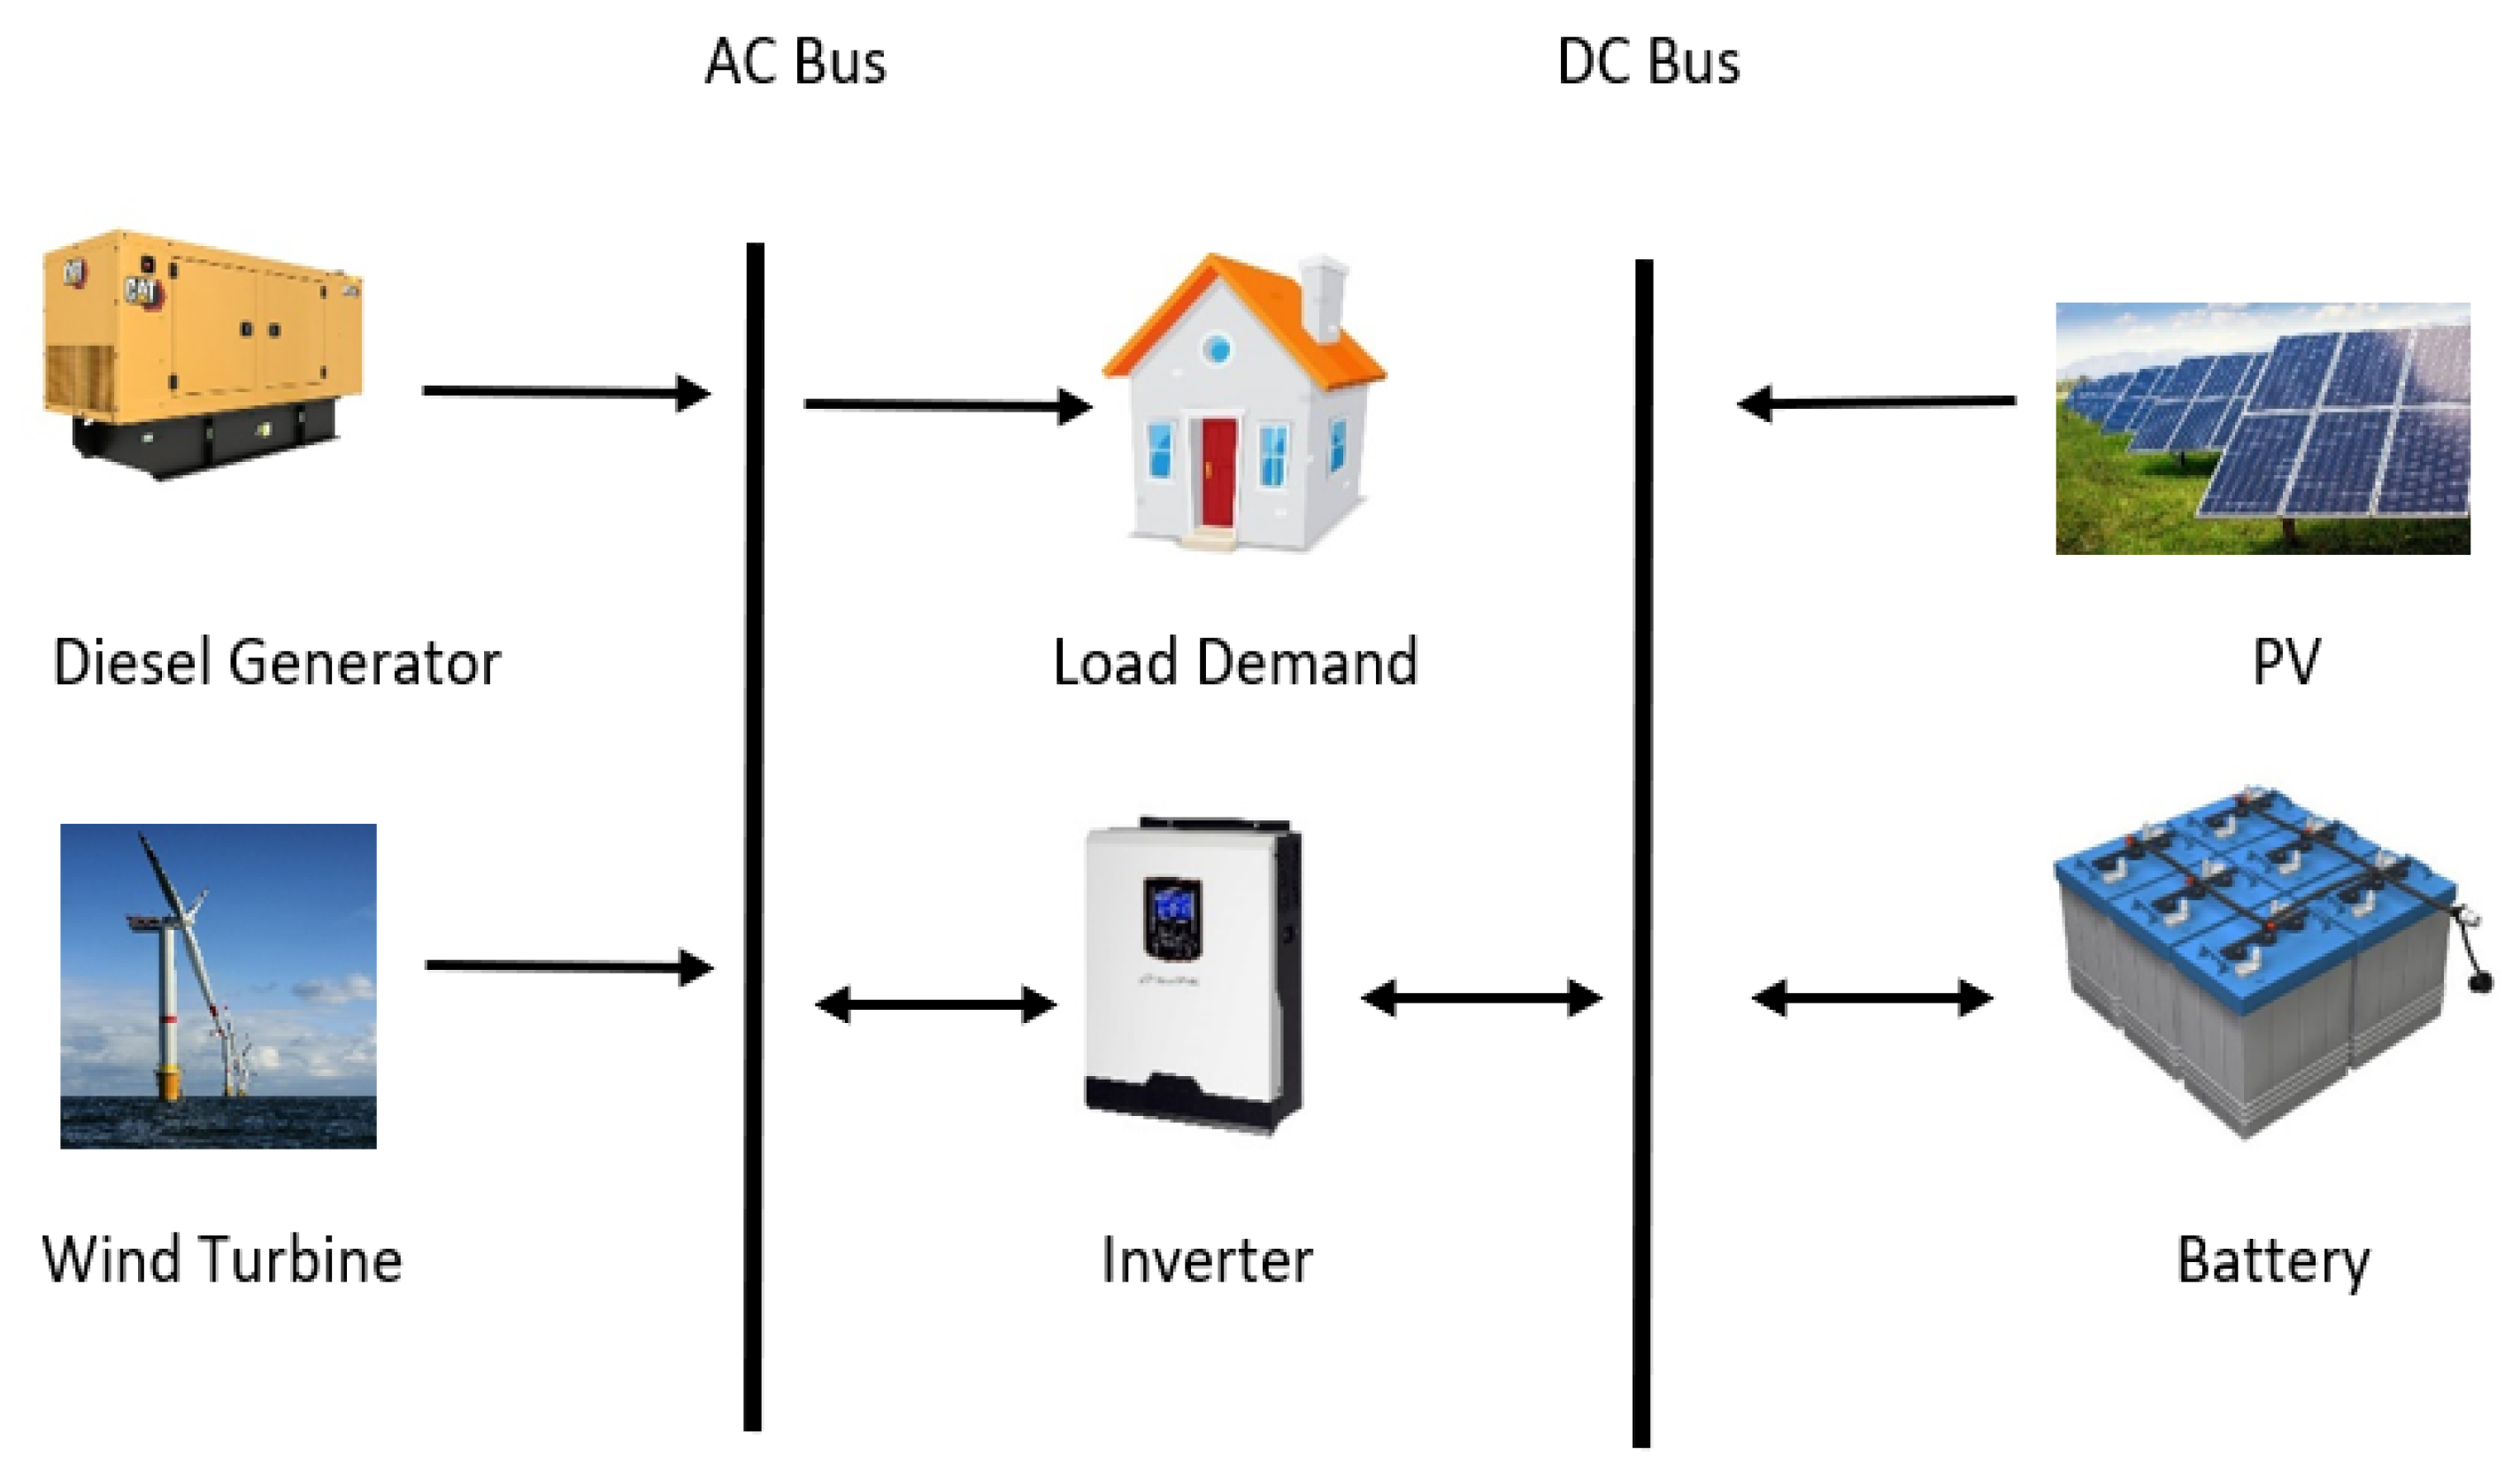
3. Proposed Power System Description
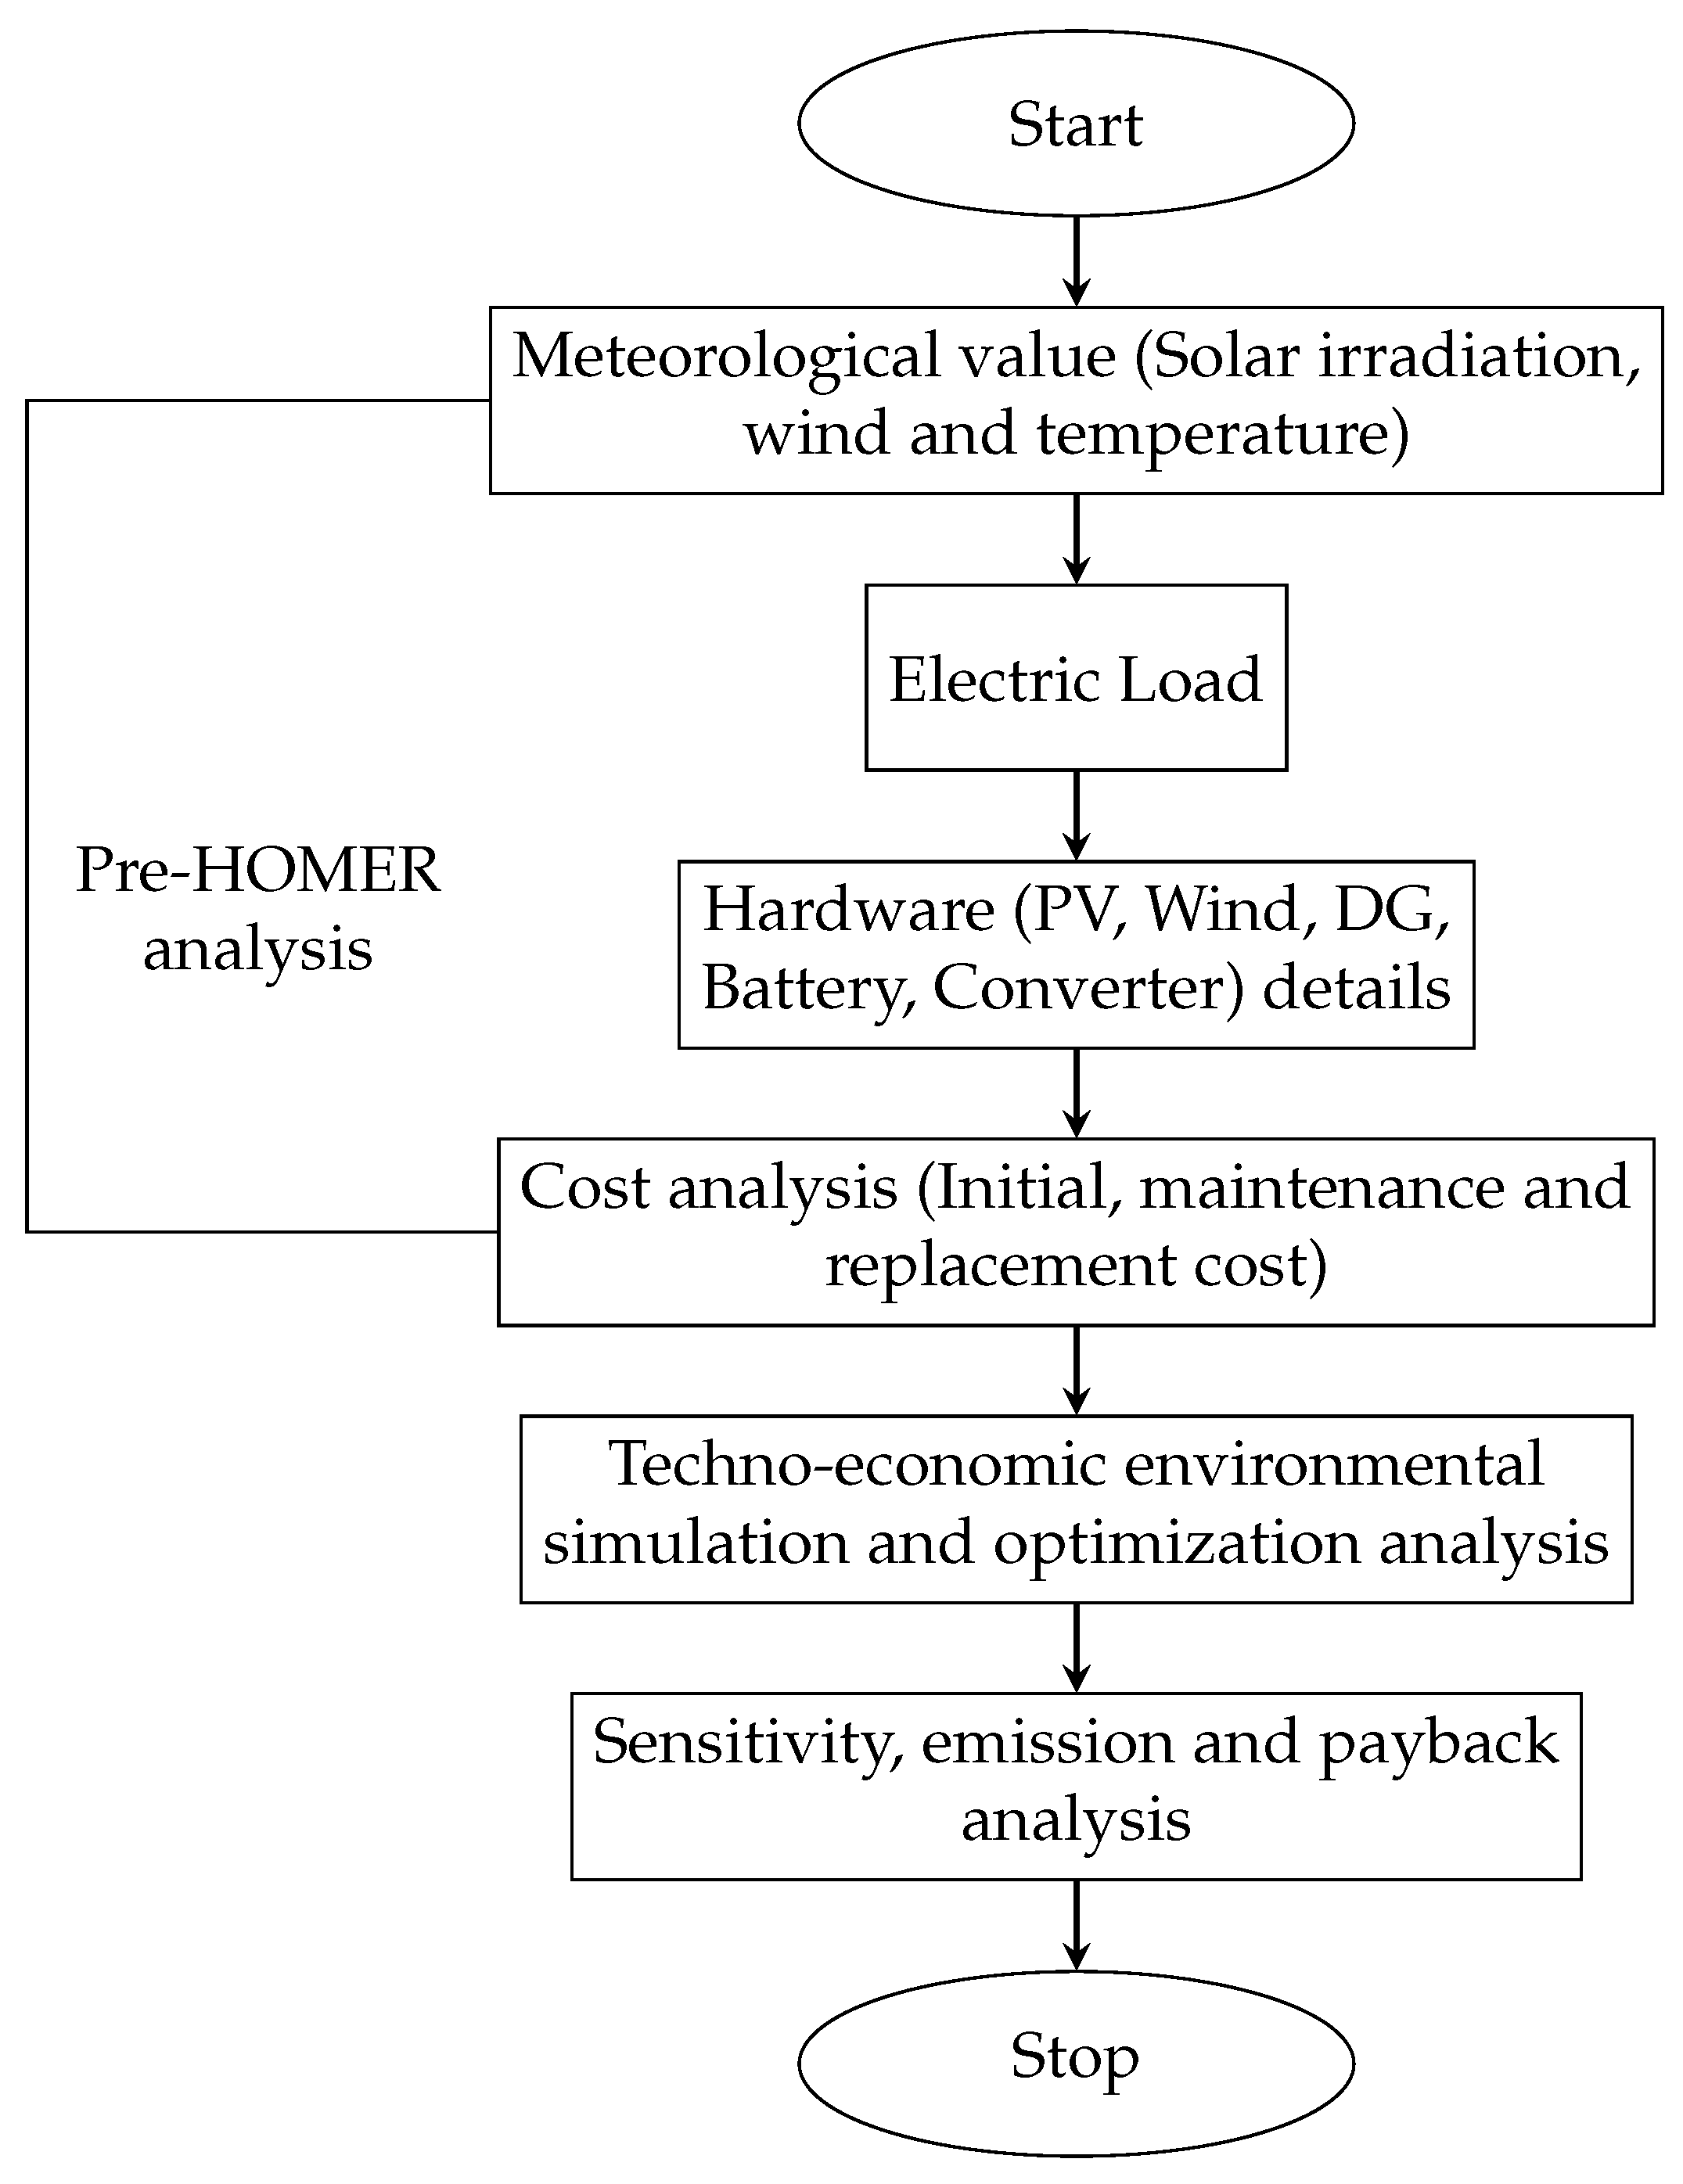
In order to satisfy the load needs of a particular off-grid community, this study provides the best hybrid energy system architecture. The proposed power system model is illustrated in Figure 1. Costs were computed utilizing the balance of hybrid energy systems and their related components with the current limitations, meteorological data, and load profile in the simulation using HOMER Pro software. This software was used to calculate the NPC and COE. The comparative analysis of the optimal system was determined based on this cost calculation. The HOMER Pro software’s optimization and sensitivity analysis allow for the examination of the economic and technological viability of hybrid energy system configurations, particularly for off-grid applications.

3.1. HOMER

Figure 2 depicts the HOMER’s operational process. There are three primary phases in hybrid renewable energy architecture: pre-HOMER analysis, optimization using HOMER, and post-HOMER analysis.
  • Pre-HOMER analysis: The pre-HOMER evaluation ensures the infrastructure’s long-term capability by performing an early examination of the design configuration and framework. Without meticulous documentation of the specified family, community, and energy requirements, it is difficult to design and implement a successful hybrid system to handle the necessary load requirements. As a result, the first stage is to assess the socioeconomic factors, energy resources, and load needs of the specified off-grid region. This procedure will aid in determining the precise load demand for that location and the available energy sources that may be used to satisfy that demand. The cost of a hardware system, such as the initial price, installation and maintenance costs, and replacement costs, is evaluated in the pre-HOMER section.
  • Optimization Using HOMER: The techno-economic analysis is carried out in this part using load demand and weather data. This analysis is based on the renewable energy sources accessible in the area, the components necessary for hybrid energy systems, and a complete analysis of the HOMER simulation. Other tools may be used for the optimum and sizing analysis of the hybrid configuration of systems for renewable energy. Still, HOMER has grown in popularity due to its capacity to construct grid systems with trustworthy renewable energy systems.
  • Post-HOMER analysis: The sensitivity study of the intended off-grid region is necessary for this part to corroborate the substance’s findings. A sensitivity analysis was conducted on the PV, battery, fuel, and other variables. These characteristics can give you a decent idea of how energy systems for the off-grid community are determined. The outcome of the simulation is replicated and adjusted using the necessary sensitivity variables for sensitivity analysis. This section also considers the impact on the environment. Investors will be able to determine how long they will be able to benefit from the initiatives.

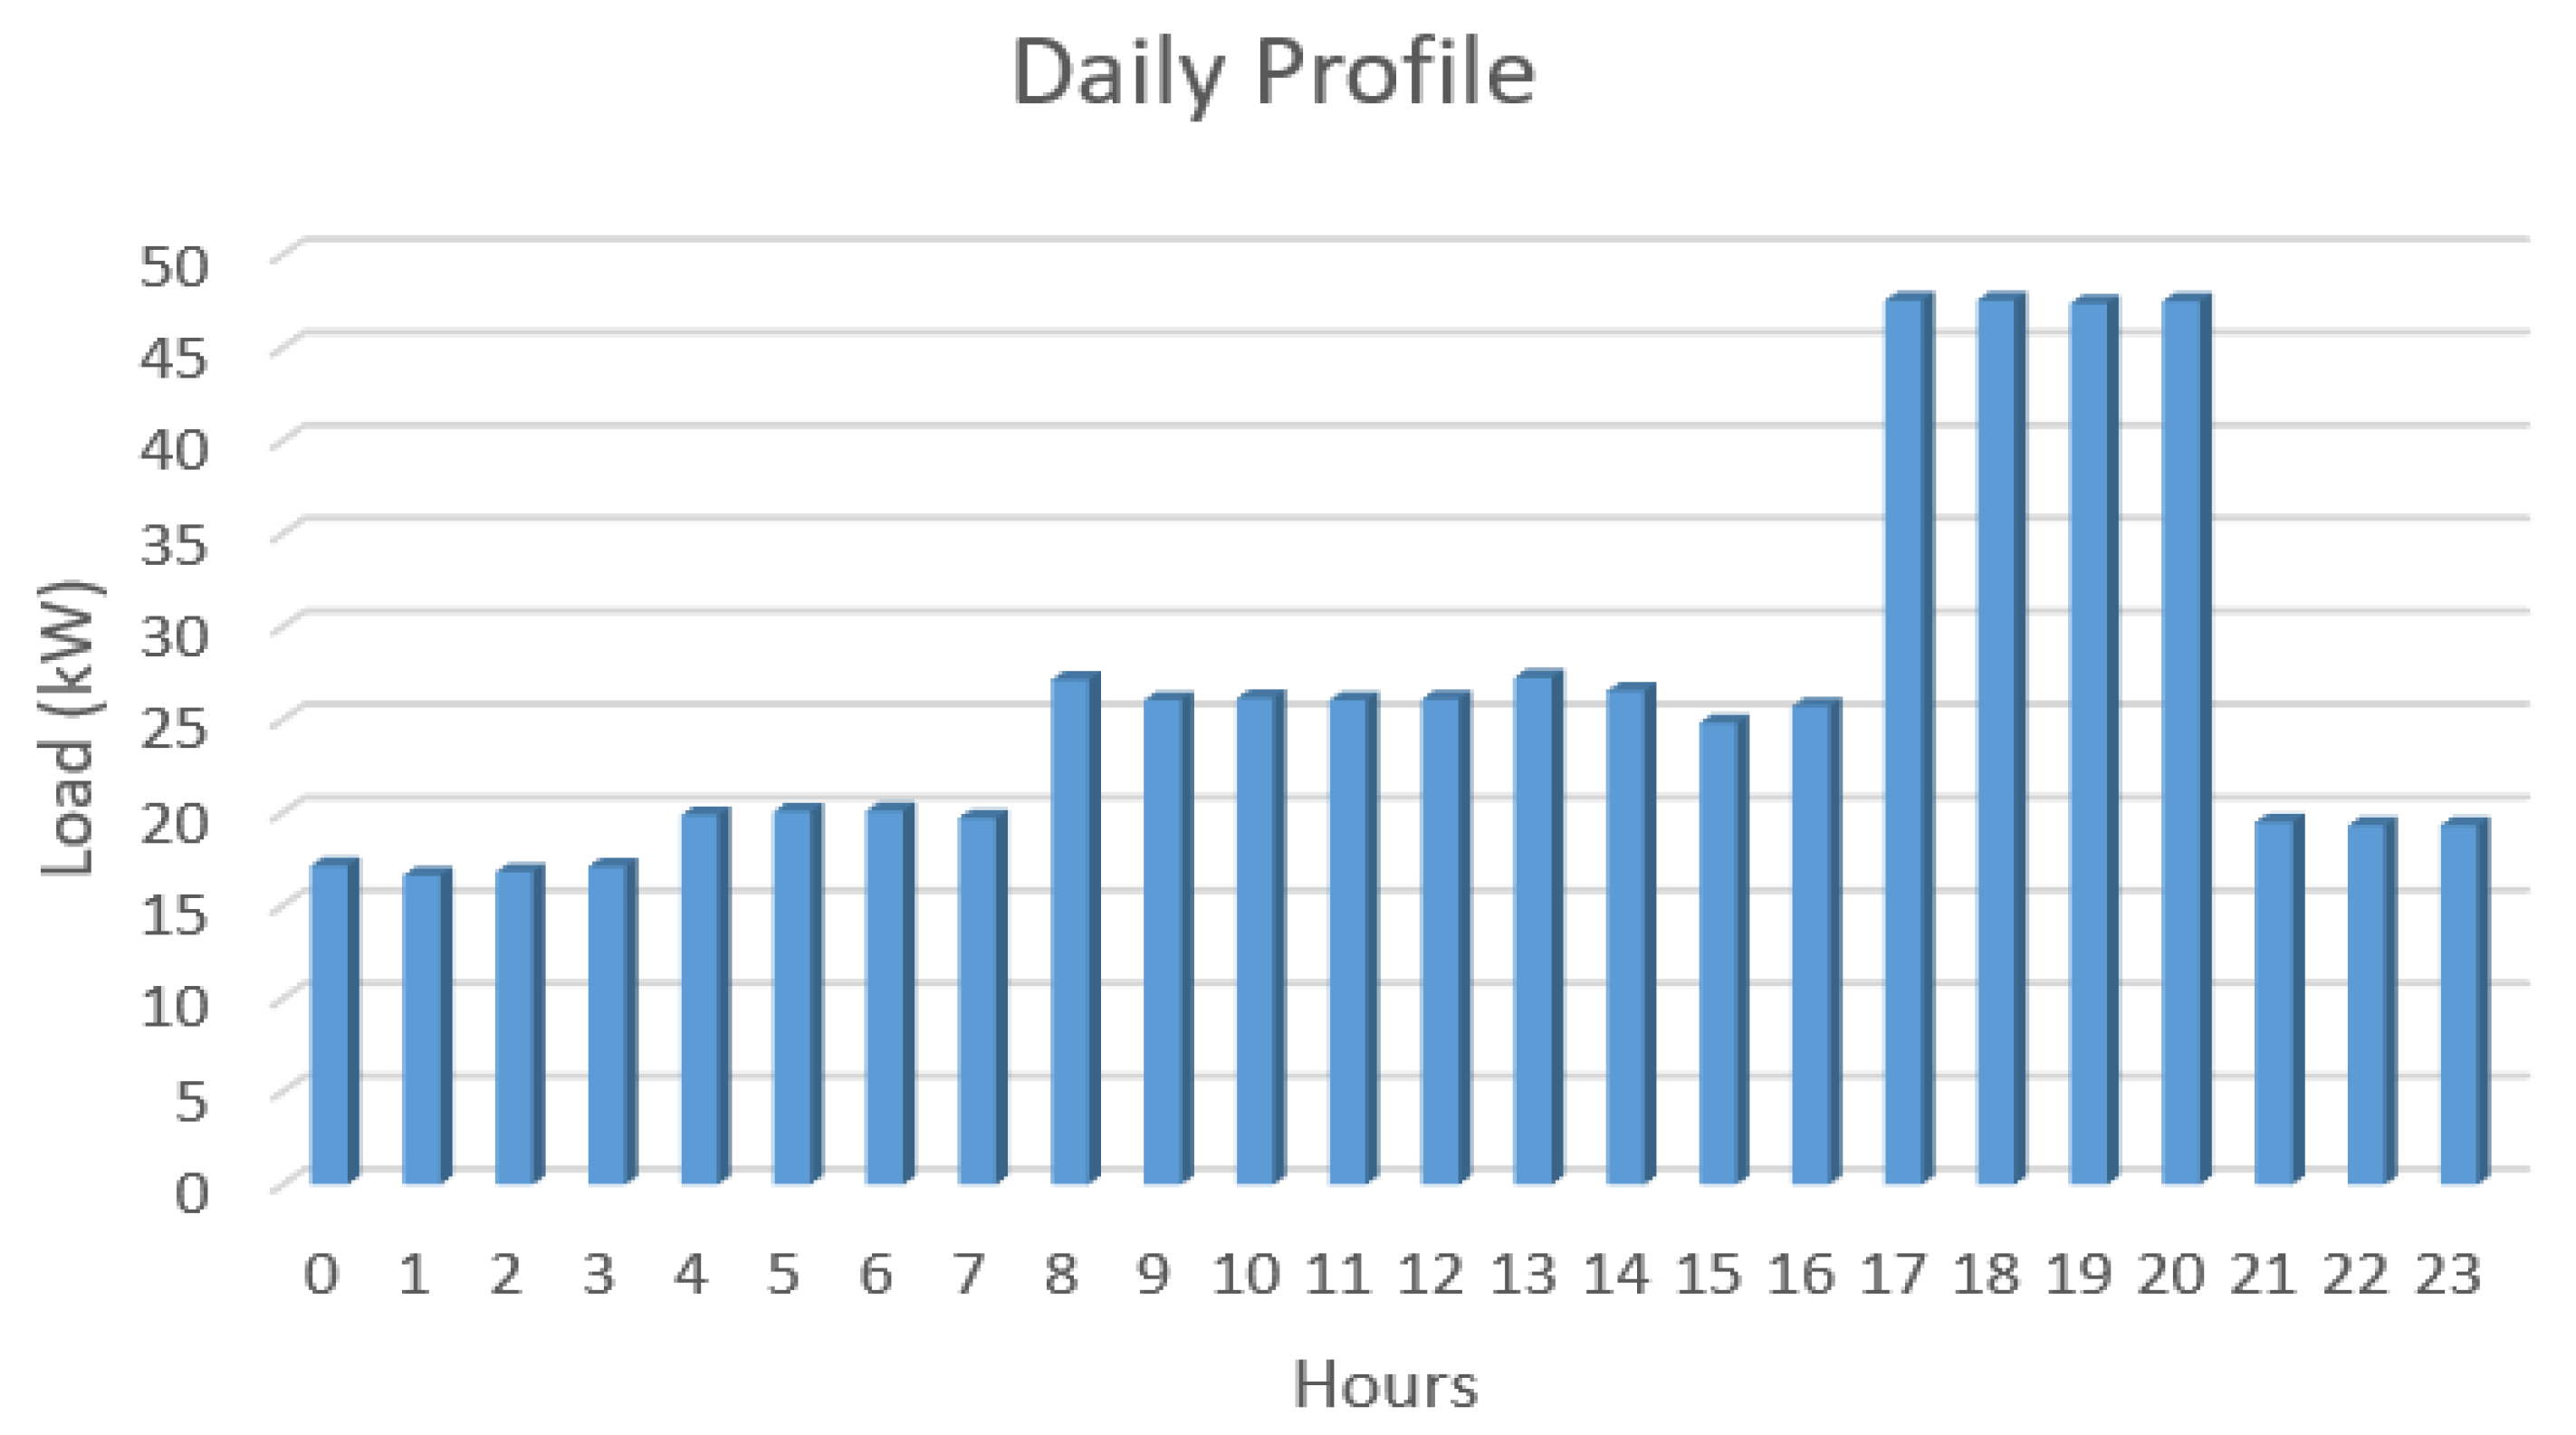
3.2. Load Assumption

This research took into account a municipality with 100 households, 20 different types of shops, eight restaurants and three hotels. The expected load needs for the summer and winter seasons are shown in Table 1.
The principal load was estimated to be 752.75 kWh/day, whereas the annual peak demand was 53.82 kW. The load demand is provided in Figure 3.

3.3. Hardware Components for Power Generation and Storage

3.3.1. PV Modeling

Geographical coordinates information is used in the clearness index to display monthly average global radiation statistics from the National Renewable Energy Laboratory (NREL). Solar radiation is at its highest from February to May, as seen in Figure 4. The yearly clearness index on average is 0.5312, while the daily radiation on average is 4.81 kWh/m 2 /day.
The weather has a considerable impact on PV power generation. Generic manufactures the module that will be used in the PV panel. The rated capacity is 1 kilowatt (kW). It has been determined that by increasing the temperature coefficient by 0.1% each degree Celsius. The yearly output generated from the PV panel may be enhanced. Equation (1) may be used to compute the photovoltaic system’s hourly base output in this case [25].
P P V = Y P V f P V I T I S [ 1 + α P ( T C T S ) ]
where Y P V denotes the rated capacity of PV array, f P V is known as derating factor (80%), I T is incident solar irradiation in kW/m 2 , I S is standard solar irradiation in kW/m 2 , α P is coefficient of the solar power, T C is the temperature of the PV cell in °C, and T S is the standard PV cell temperature. The temperature of the PV cell can be obtained using Equation (2) [25].
T c = T a + I T T c , N O C T T a , N O C T I T , N O C T 1 η P V 0.9
where T a is defined as temperature (°C), η P V is the efficiency of the PV cell, and N O C T is the nominal operating cell temperature.

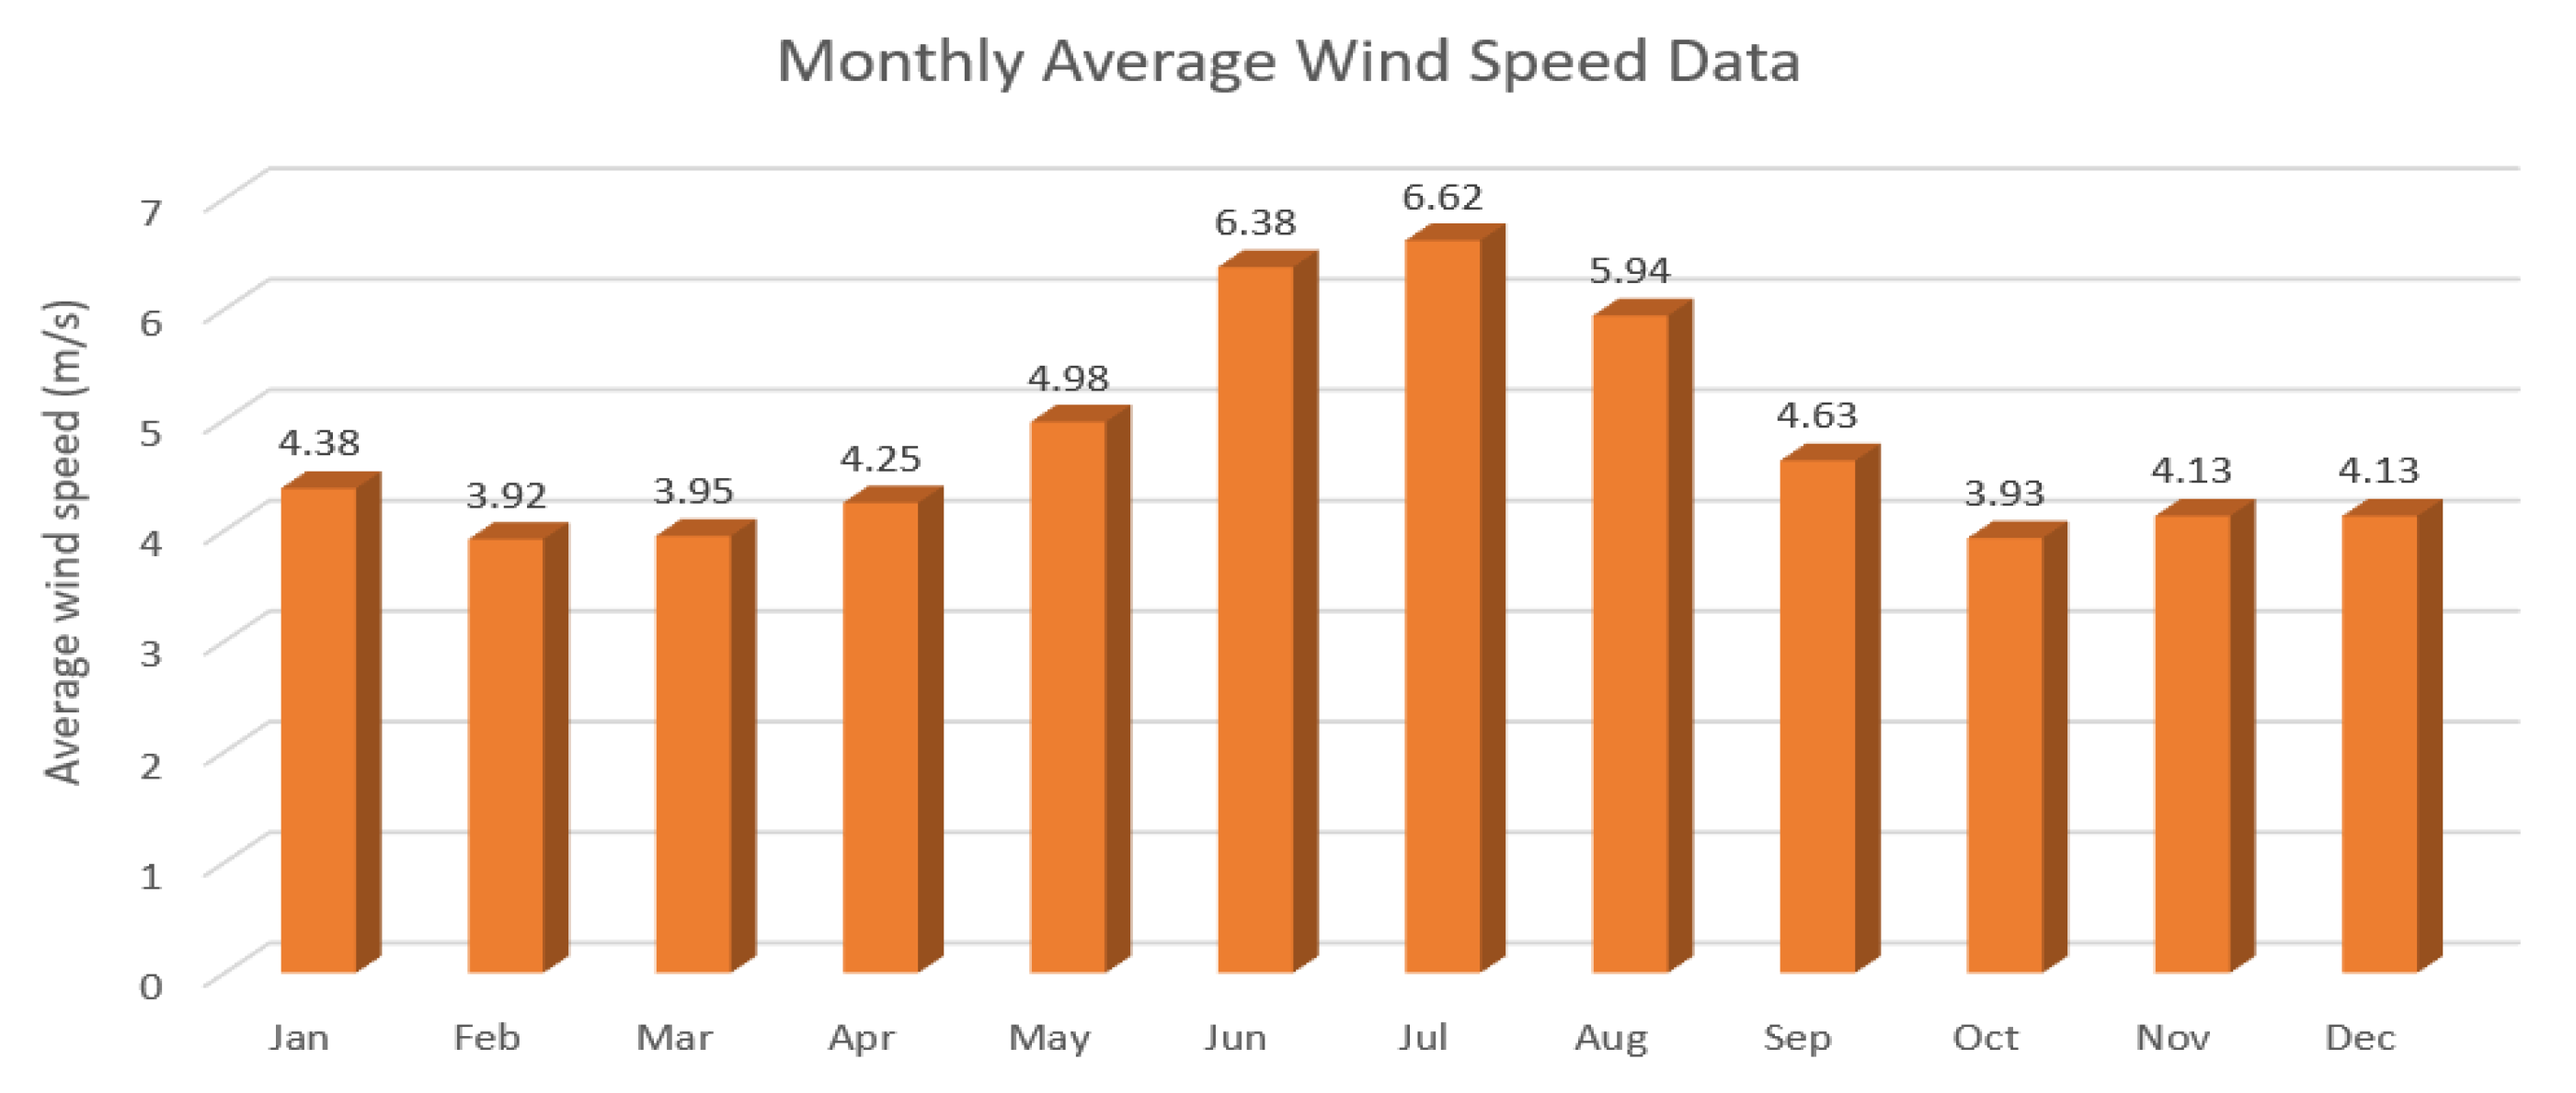
3.3.2. Wind Turbine Modeling

The NREL provided the wind data for this investigation, as shown in Figure 5. Eocycle is the manufacturer of the module being evaluated for the wind turbine (Model: EO10). With a hub height of 24 m, the turbine’s expected lifespan is 20 years. The option to utilize the external impact of the environment was not available.
Wind energy is converted into electrical energy by turbines. The hub height, cut-in wind speed, service time, and component cost all play a part in wind turbine selection. As a result, the power output available from different wind generators varies greatly, and it is a function of the wind velocity at hub height. The power law equation (Equation (3)) may be used to determine the wind speed necessary for energy production at a specific location for a given hub height. The value varies according to the type of land [25]. The hub height of the turbine is 24 m.
U = U r e f H H r e f γ
where U is wind speed (m/s) at the hub height, U r e f is wind speed (m/s) at the reference height, H is hub height, H r e f is reference height.
a = P r U r 3 U 1 3
b = U 1 3 U r 3 U 1 3
where a and b is constant, P r is rated power, U r is rated speed (m/s), U 1 is cut is speed (m/s).
P W T = P W T A W T η W T
P W T ( U ) = 0 , f o r   U < U 1 a U 3 , f o r   U 1 < U < U r P r , f o r   U r < U < U 2 0 , f o r   U > U 2
where P W T is defined as actual electric power of wind turbine, A W T is defined as wind turbine as swept area ( m 2 ), η W T is wind turbine efficiency, U 2 is defined as cutout speed (m/s) and P W T ( U ) is defined as wind turbine power output.

3.3.3. Modeling of DG

In order to propose or model any power system, diesel (cost) is required. According to Bangladesh Petroleum Corporation (BPC), Bangladesh’s diesel price is now at USD 1/L and is not fixed [40].
This pricing has varied a lot throughout the years. Any diesel-based microgrid project might be expedited, postponed, or even cancelled due to the erratic behaviour of diesel fuel prices since it is directly tied to NPC and COE for the production of power per unit [1].
The diesel fuel consumption can be calculated using Equation (8).
F C = F 1 R D + F 2 P D
where F 1 is defined as the coefficient of intercept, F 2 is defined as fuel curve slope, R D is the rated DG capacity, and P D is the outcome of the diesel-operated generator at that time.

3.3.4. Battery Modeling

The storage component of a hybrid energy system is major equipment that is utilized to maintain a consistent voltage during periods of lower power generation. In most cases, a Li-ion battery is used for power storage [1]. The following Equation (9) can be used to calculate the battery’s maximum discharging power:
B D m a x = c r N l + c N I c Δ h + N O c r 1 p c Δ h / 1 p c Δ h + r c Δ h 1 + p c Δ h
Equation (10) is also used to calculate the quantity of maximum charging power.
B C m a x = c N I c Δ h + N O c r 1 p c Δ h / 1 p c Δ h + r c Δ h 1 + p c Δ h
where N l is the battery’s maximum capability in kWh, N I is the storage system’s initial available energy, r is the selected battery’s capacity ratio, Δ h is the time duration in hours, N O is the battery bank’s overall capacity for energy and c is the battery rate constant.

3.3.5. Bi-Directional Converter

A bi-directional converter adds both AC and DC buses. Equation (11) can be used to calculate the converter’s energy output, where E i n represents the power input to the specified inverter and η i n v indicates the inverter’s efficiency. The capacity of the inverter is determined by the transfer of energy from DC to AC using the HOMER Pro software (3.14) [1].
E i n = E o u t η i n v
Table 2 lists the many inputs taken into account while modelling a PV, Wind Turbine, DG, Battery, and Bi-directional Converter.
Table 2. Cost of Installed Components [1].
ComponentsDescriptionCapital CostReplacement CostOperation & Maintenance CostLifetime
PV1 kW1100 USD/kW750 USD/kW50 USD/kW/y25 y
DG40/80 kW370 USD/kW290 USD/kW0.05 USD/h15,000 h
Wind turbine10 kW3200 USD/kW2000 USD/kW20 USD/kW/y20 y
Li-ion Battery1 kWh550 USD550 USD10 USD15 y
Bi-directional converter1 kW300 USD300 USD015 y

4. Problem Formulation

Objective functions and constraints are components of problem formulation.

4.1. Objective Function

4.1.1. NPC

In HOMER, NPC is used to depict the system’s life cycle cost. Initial capital costs, replacement costs, O&M costs, salvage values, fuel costs, and grid-purchased power costs are all included in the TNPC. Other expenses associated with greenhouse gas emissions are also included [41]. In HOMER, TNPC is calculated using Equation (12) where C O Y is the overall yearly cost (USD/year) and C R F is the capital recovery factor.
T N P C = C O Y C R F
CRF is calculated using the following Equation (13), where p is the yearly profit rate (%) and n is the entire project lifespan (years).
C R F = p ( 1 + p ) n p ( 1 + p ) n 1
Equation (14) can be used to get the yearly real profit rate p where p is the nominal profit rate, and a f is the annual inflation rate. In this analysis, an 8% discount rate and a 2% annual inflation rate were employed.
p = p a f 1 + a f

4.1.2. COE

The C O E is calculated as the yearly cost of system components divided by total energy production.
C O E = C Y E T
C Y = C Y , C a p + C Y , R e p + C Y , O & M
Whereas E T stands for “total energy supplied”, C Y stands for “total yearly expense”. This comprises the expense of yearly capital ( C Y , C a p ), annual replacement ( C Y , R e p ), and annual operations and maintenance ( C Y , O & M ).

4.1.3. Life Cycle Emission

This study utilized life cycle emission ( L C E ) to estimate the volume of equivalent CO 2 emissions from the energy required to transport, produce, and reuse the components used to simulate the system [25]. To compute life cycle emissions, use the following mathematical expression.
L C E = i = 1 x B i E l
In this case, x indicates how many components were employed to model the system, E l (kWh) outlines how much energy was produced and stored in each unit or component, and B i (kg CO 2 -eq/kWh) represents the system’s life-period corresponding CO 2 emissions.

4.2. Constraints

The optimized objective function is written as follows using the constraints:

4.2.1. Bounds Constraint

Lower and higher boundaries for solar, wind, and battery systems are described as constraints
N W T = I n t e g e r , 0 N W T N W T m a x
N P V = I n t e g e r , 0 N P V N P V m a x
N B a t t = I n t e g e r , 0 N B a t t N B a t t m a x
N D G = I n t e g e r , 0 N D G N D G m a x
where N W T m a x is defined as the maximum number of wind turbines, N P V m a x presented as the highest number of PV modules, N B a t t m a x is the highest number of batteries and N D G m a x is the highest number of diesel generators.

4.2.2. Battery Storage Constraint

A battery bank’s capacity at any given hour ‘t’ is somewhere between its lowest and highest capacity. The limitation is then represented by the Equation (22).
E B a t t , m i n E B a t t ( t ) E B a t t , m a x

4.2.3. Maximum Output Power of Battery

The maximum output power of the battery is calculated by Equations (23) and (24)
B C N B a t t B C m a x
B D N B a t t B D m a x
where B C and B D are the charging and discharging power of battery.

4.2.4. Power Balance Limit

The power balance limit is calculated by Equation (25)
N P V P P V ( t ) + N W T P W T ( t ) + N B a t t ( B D ( t ) B C ( t ) ) + N D G P D ( t ) P s r ( t ) = P L ( t )
where P P V ( t ) , P W T ( t ) , P D ( t ) are the generated power os installed equipment at time t. P s r ( t ) is the surplus power at time t and P L ( t ) is the load demand at time t.

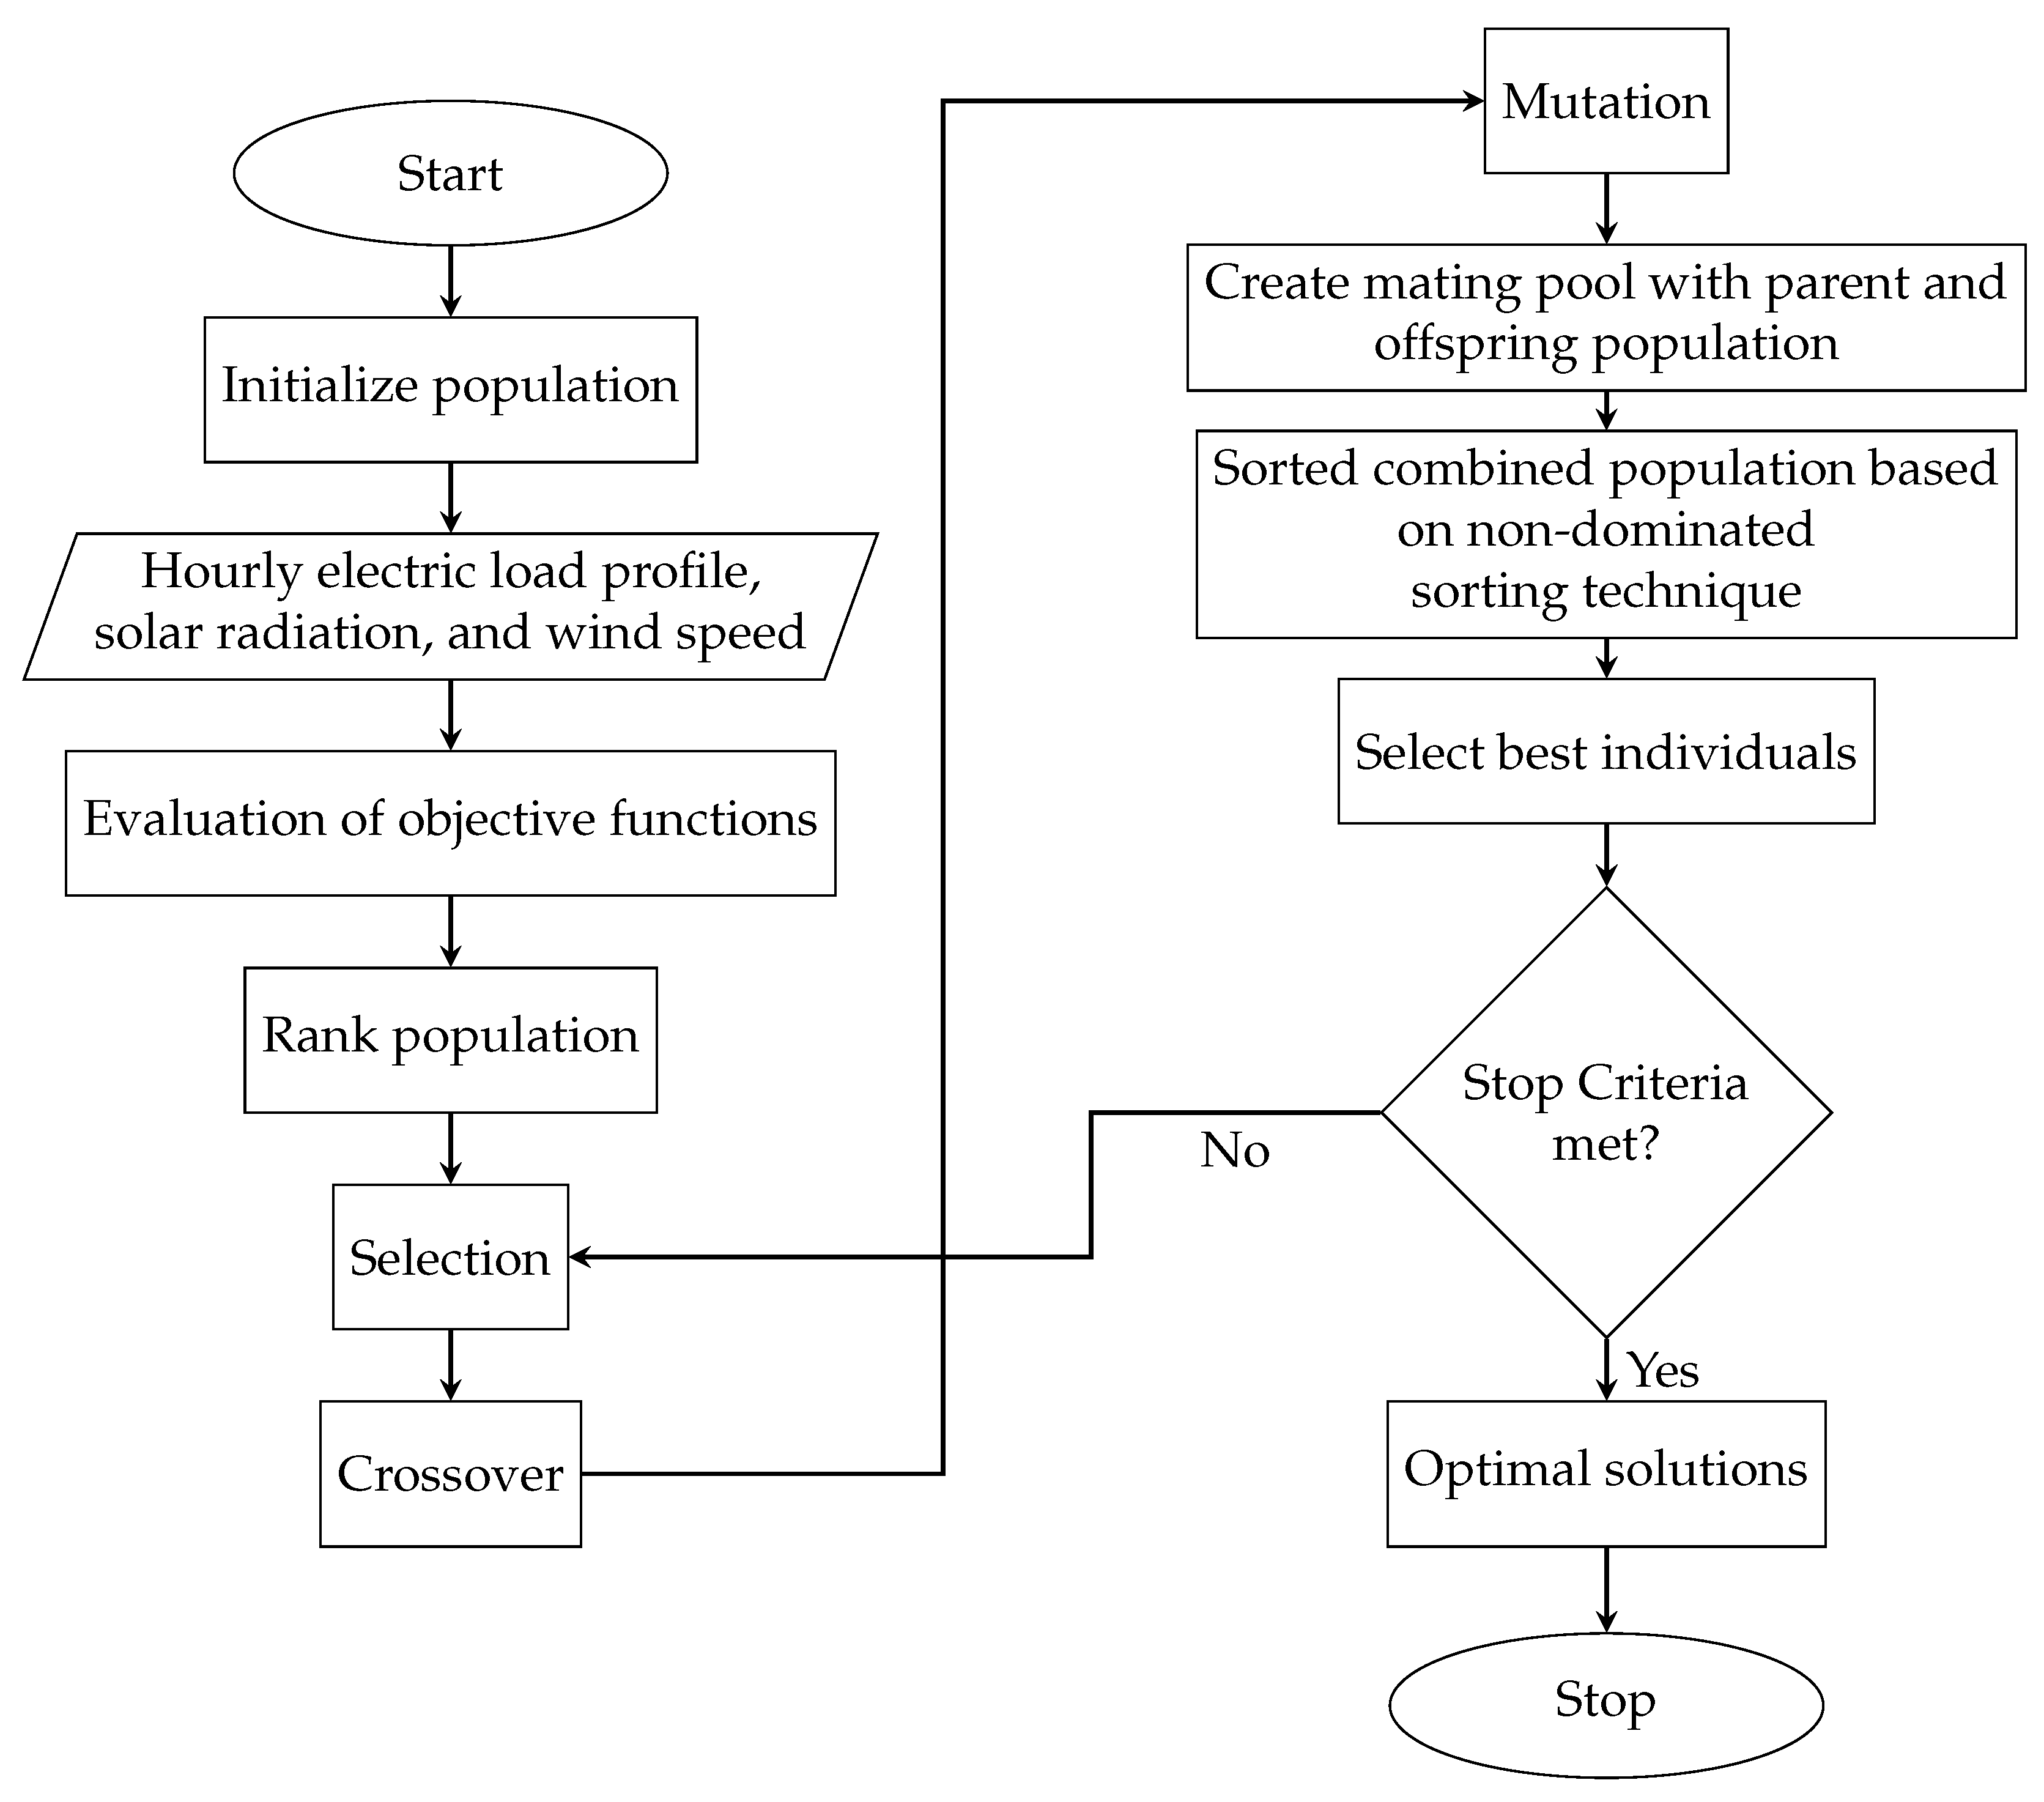
4.3. Non-Dominated Sorting Genetic Algorithm (NSGA)-II

In contrast to the single response that is typically produced by aggregated or weighted-sum procedures, a series of non-dominated replies is obtained using the well-known multi-objective iterative strategy NSGA-II [42]. The NSGA-II optimization technique’s operational process is depicted in Figure 6. In general, NSGA-II can be broken down into the following processes [43]:
  • Create the population using the problem range and constraints as a starting point.
  • Sorting based on the population’s non-dominance requirements.
  • The crowding distance value is assigned front-wise when the sorting is completed. Each population is chosen depending on their rank and the distance between them and the center of the population.
  • Individuals are chosen utilizing a boolean tournament methodology with a crowded-comparison operator.
  • Using simulated binary crossover and polynomial mutation, a real-coded GA was developed.
  • Individuals from the future generation are chosen from the offspring population and the modern generation population. Each front fills a new generation until the overall population exceeds the present population number.

5. Results and Analysis

HOMER Pro is used to model various hybrid energy systems. For techno-economic analyses and feasibility studies, NPC and COE are utilized in this study to determine several optimal configurations.

5.1. Description of Individual Combination Types of Equipment

The simulation results of the considered cases are shown in the Table 3.

5.1.1. Case 1: Only DG-Based

This is the base case. In this case, NPC and COE are higher than in other cases that are considered in this system. In Table 3 shows that, The annual operating cost is USD 95,930, and the NPC is USD 1,269,732 for the only DG-based system. The COE is USD 0.358/kilowatt-h (kWh). Table 4 shows the details of the augmented electrical result. Figure 7 shows the production of electricity throughout the year in this system.

5.1.2. Case 2: PV/Wind/Battery

This is the worst case. The NPC and COE are the highest of all the combinations. From Table 3 we see that NPC of this combination is USD 1,374,082 operating cost is USD 33,685 and the COE is USD 0.387/kWh, which is higher than case 1. The simple payback of this system is 12 years. Table 5 shows the details of the augmented electrical result. According to this table, the wind turbine generates 60.8% of the electricity for this specific system. In this system, the excess electricity, unmet electric load, and capacity shortage are 393,722, 164, and 272 kWh/y, respectively. Figure 8 shows the production of electricity throughout the year in this system. In the months of May to September, wind speeds are higher than in any other month of the year.

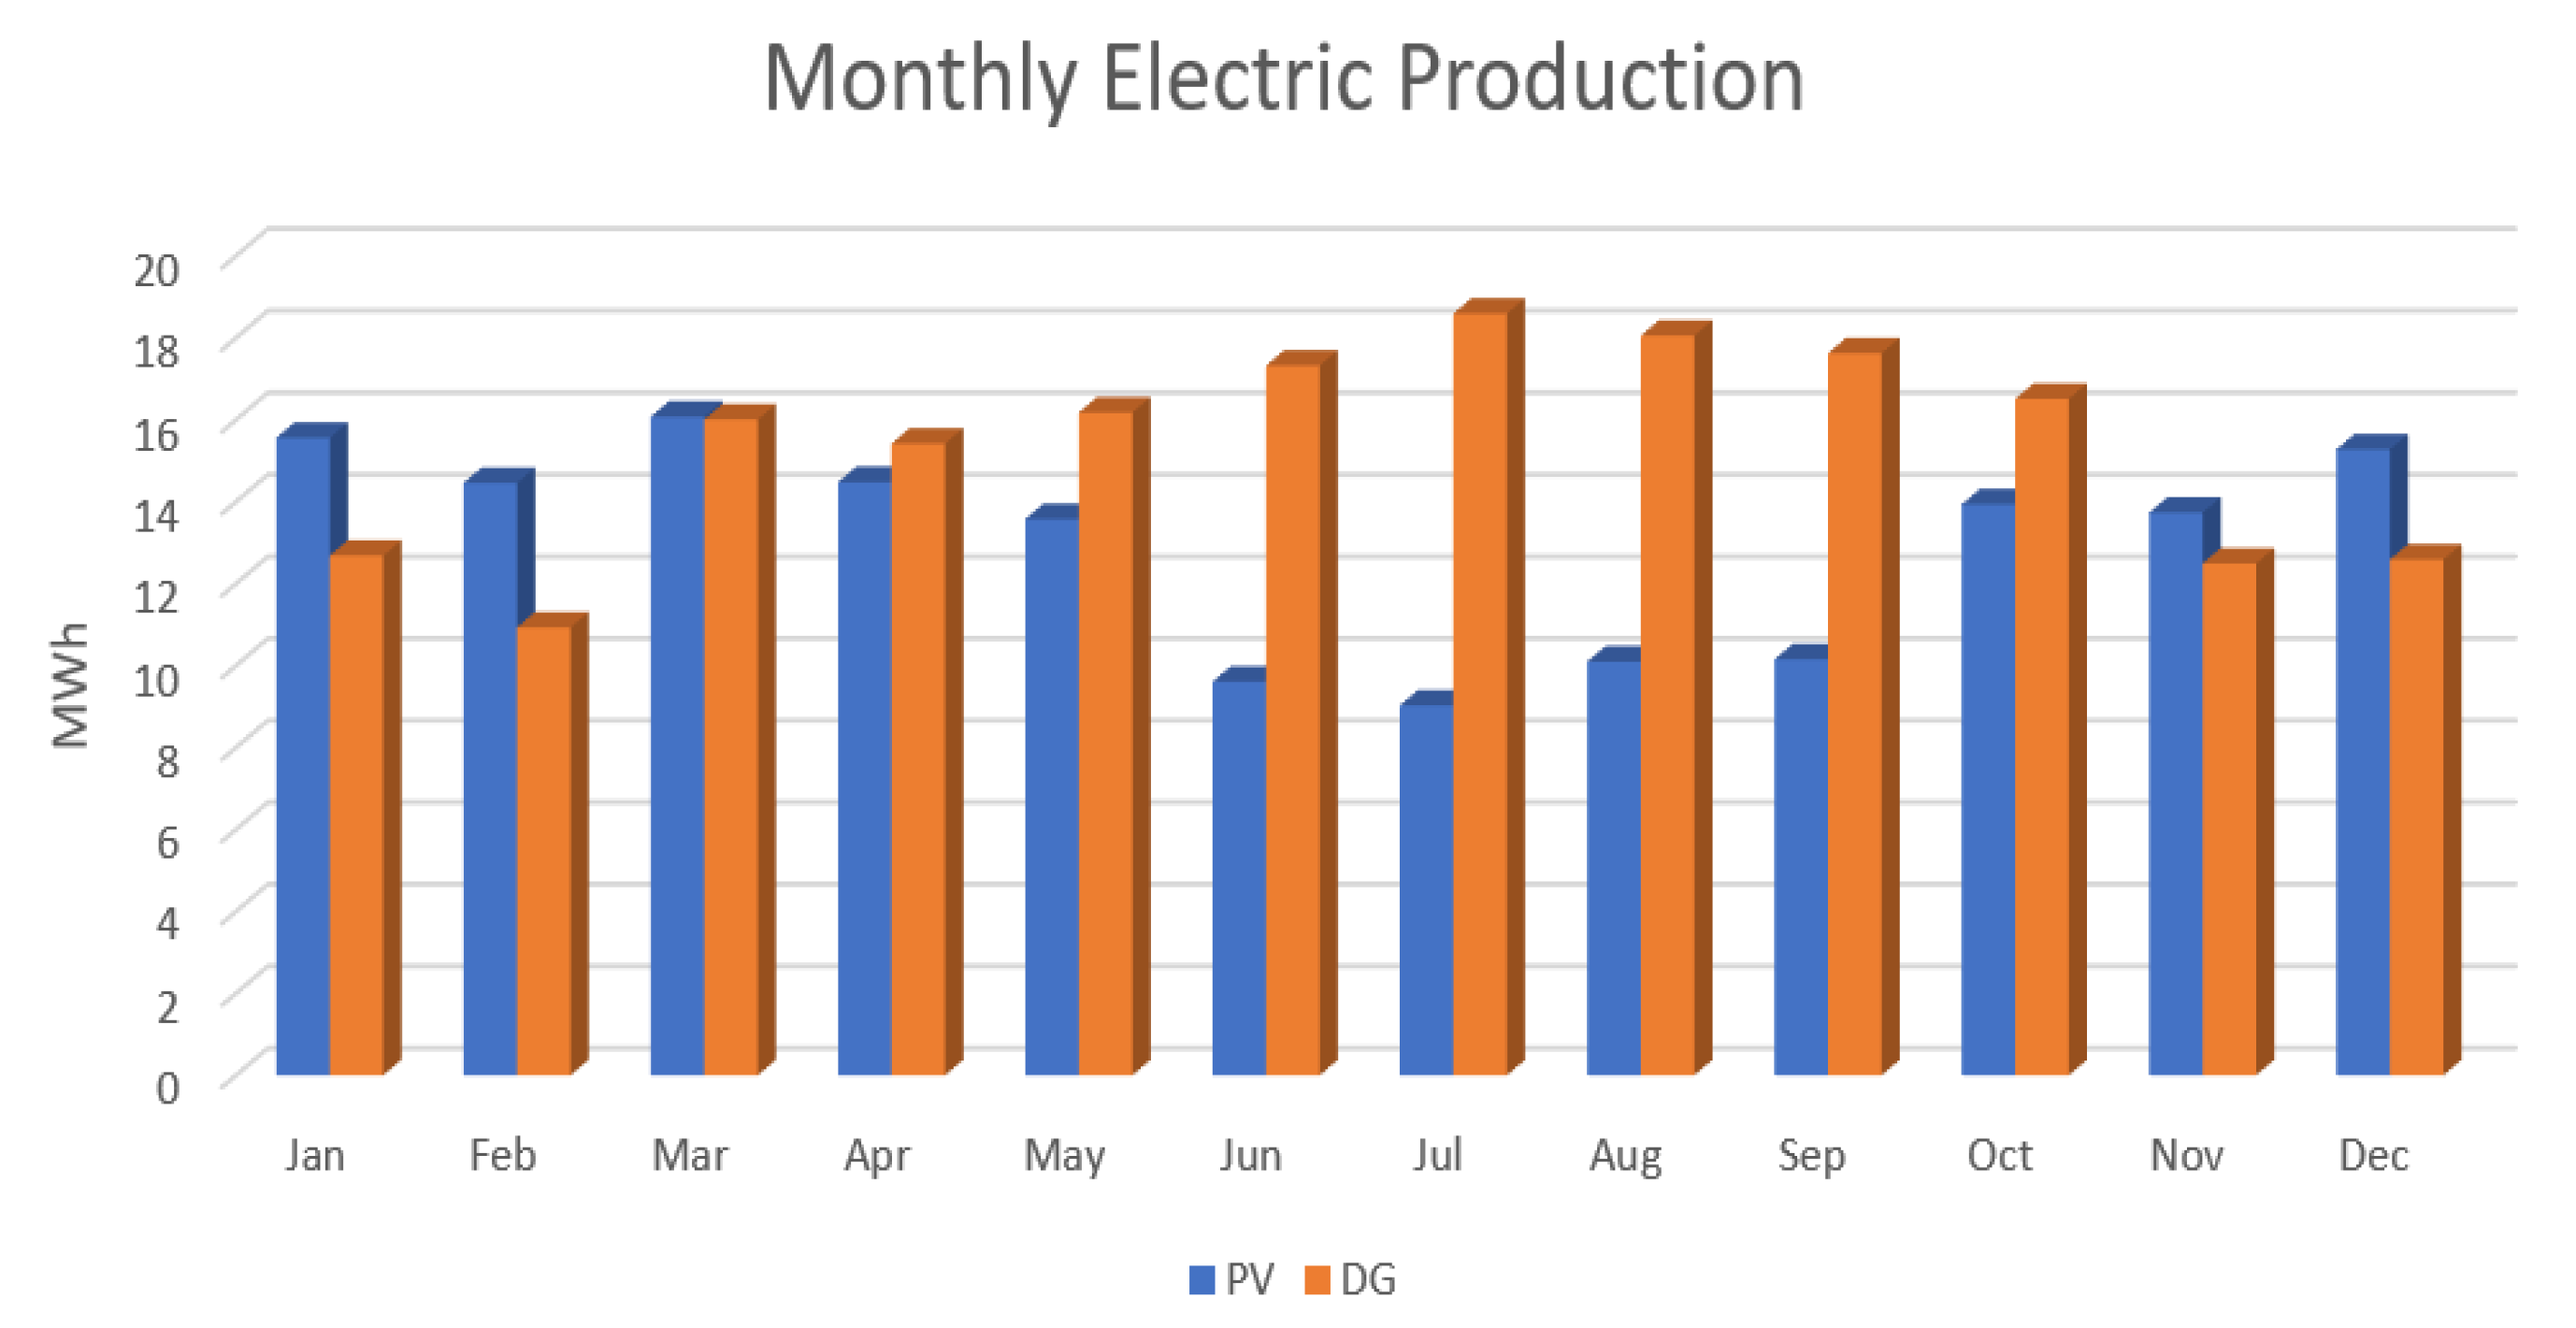
5.1.3. Case 3: PV/Battery/DG

In Table 3 we see that, NPC and operating cost of PV/Battery/DG based system is USD 922,633 and USD 59,733, respectively. The COE is USD 0.309/kWh, which is lower than in cases 1 and 2. We also see that the excess electricity generated by this system is 57,741 kWh/y, which is 17% of the total produced electricity. The simple payback is 6 years of this combination. The DG provides 54.2% of the power for this particular system, according to Table 6. Figure 9 shows the production of electricity throughout the year in this system. PV electricity generation is quite low from March to October. DG’s contribution in this particular system is less than in case 1; that’s why CO 2 emissions decrease to 34.32% which is less than in case 1.

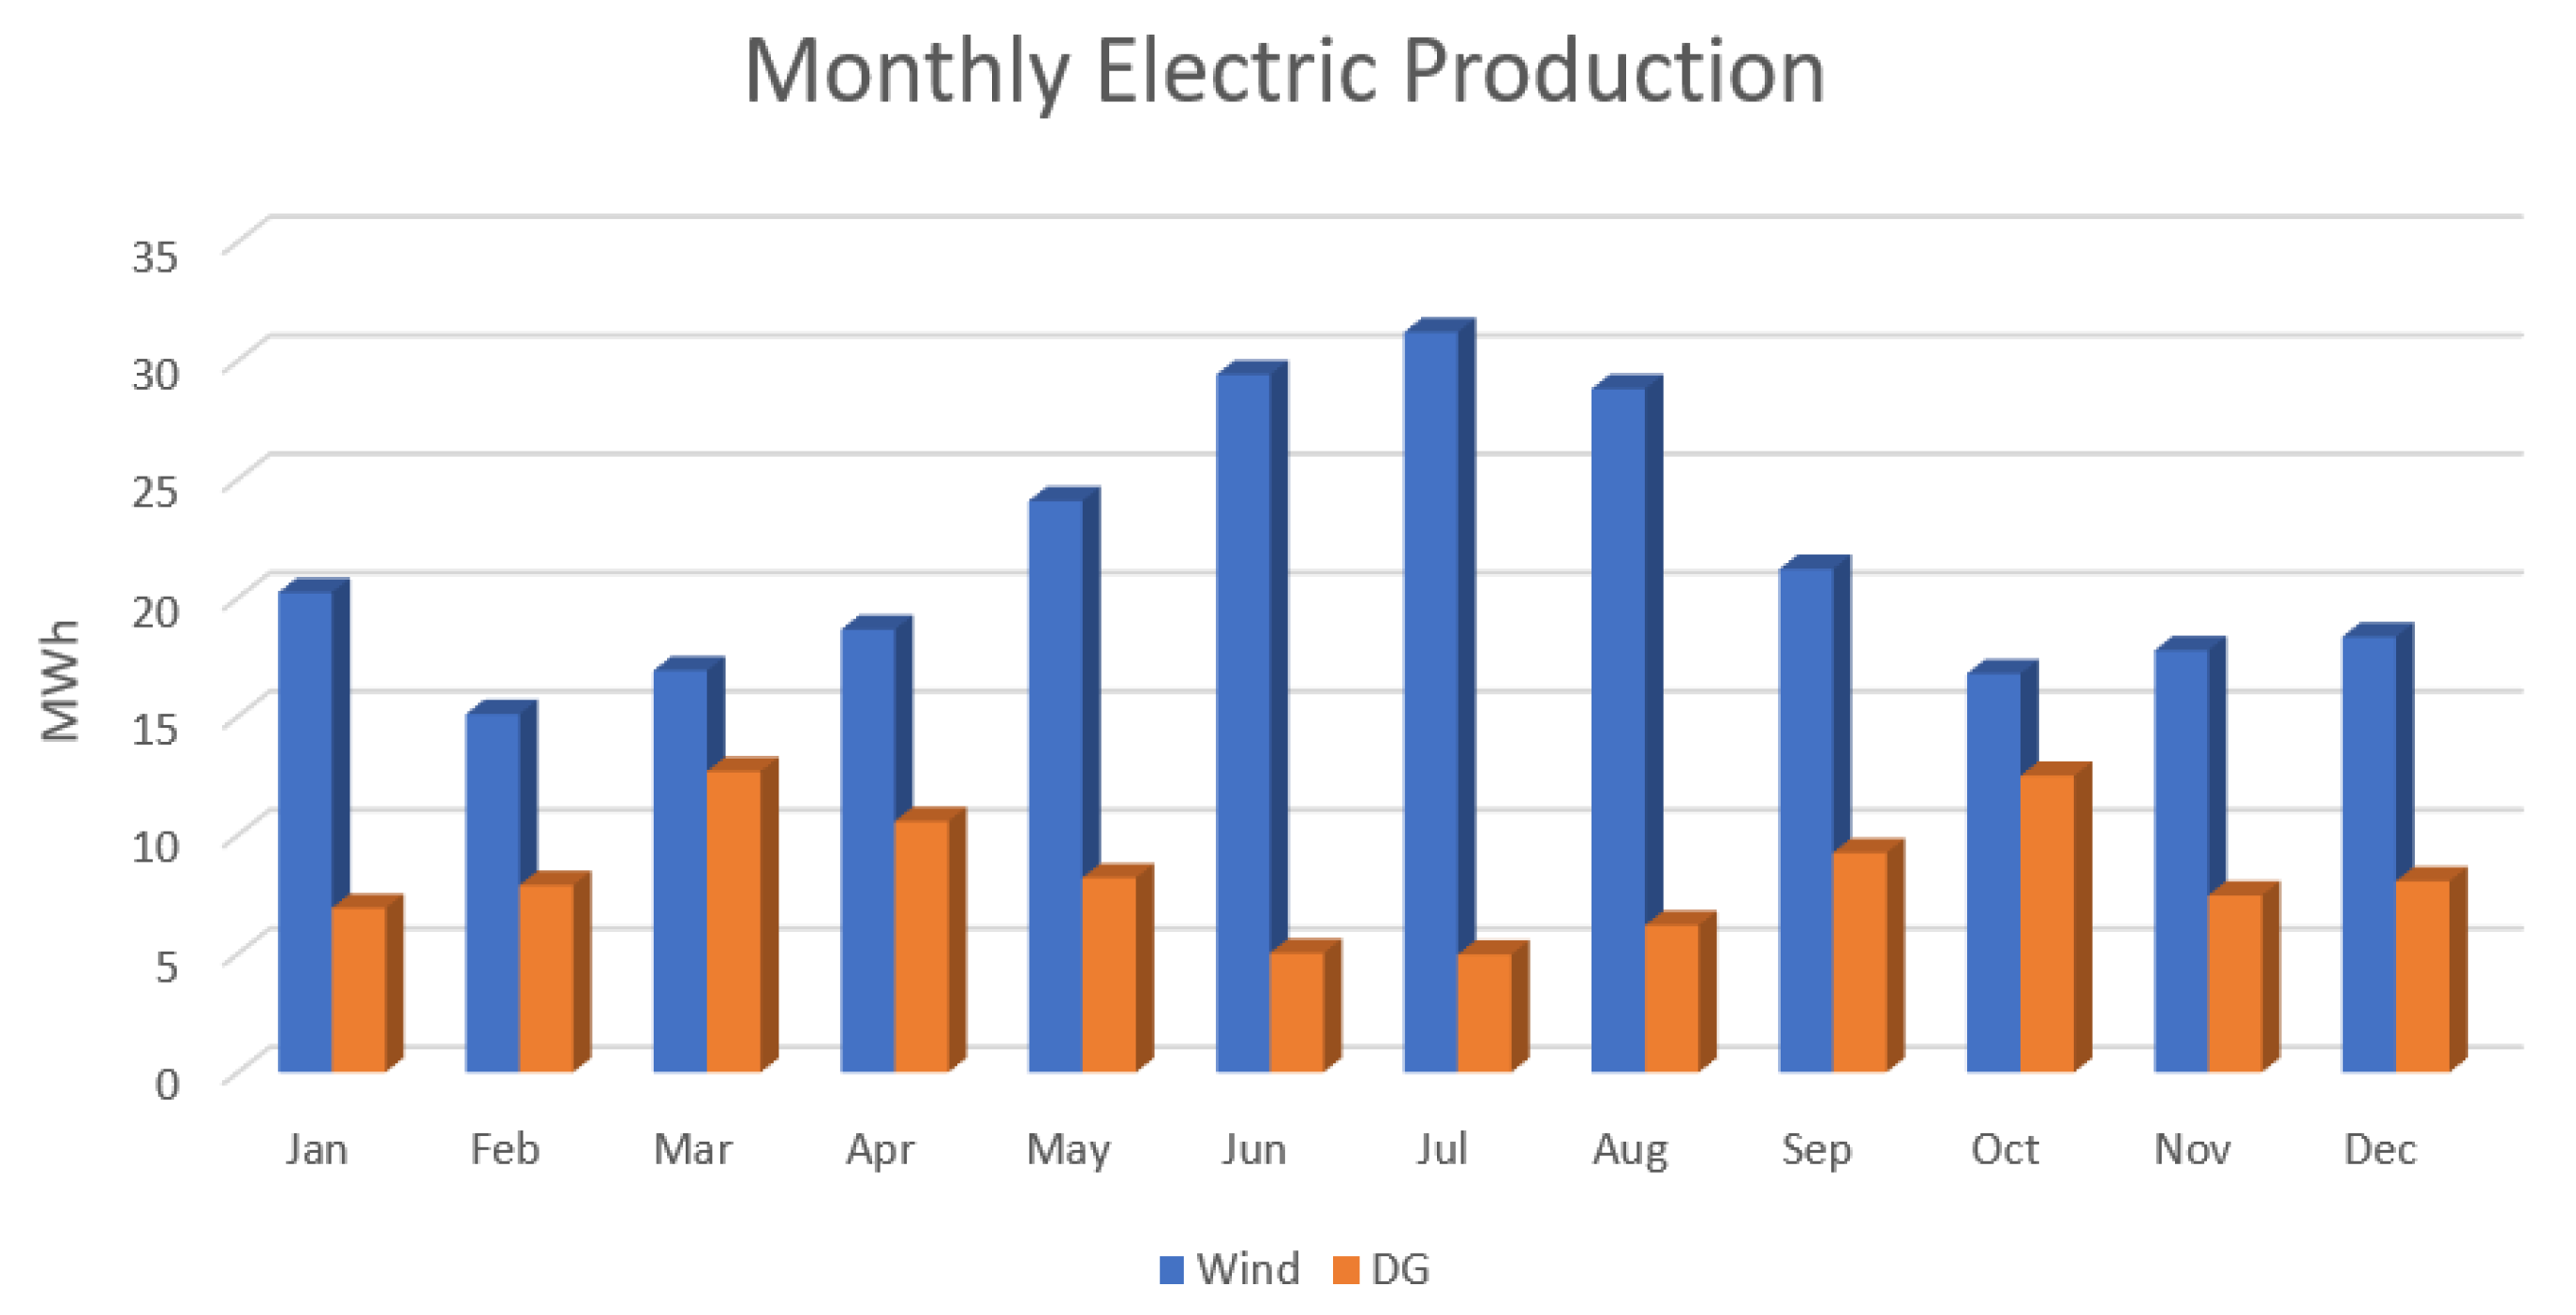
5.1.4. Case 4: Wind/Battery/DG

According to Table 3, the NPC, yearly operating cost and initial capital for this specific system are USD 730,435, USD 38,531, and USD 232,321, respectively. The COE is USD 0.206/kWh, which is less than in cases 1, 2 and 3. The simple payback of this hybrid system is 3.3 years. Although simple payback is lower than other cases, it’s not the best case. Because in HOMER optimization, results depend on the NPC and COE. Most of the electricity, 258,583 kWh/y, is produced by wind turbines, which is 72.2% of total electricity, according to Table 7. The production of excess electricity is 22.1% of total production. There is no unmet electric load and capacity shortage. In Figure 10, we observe wind turbines producing maximum electricity throughout the year. DG’s participation is quite low.

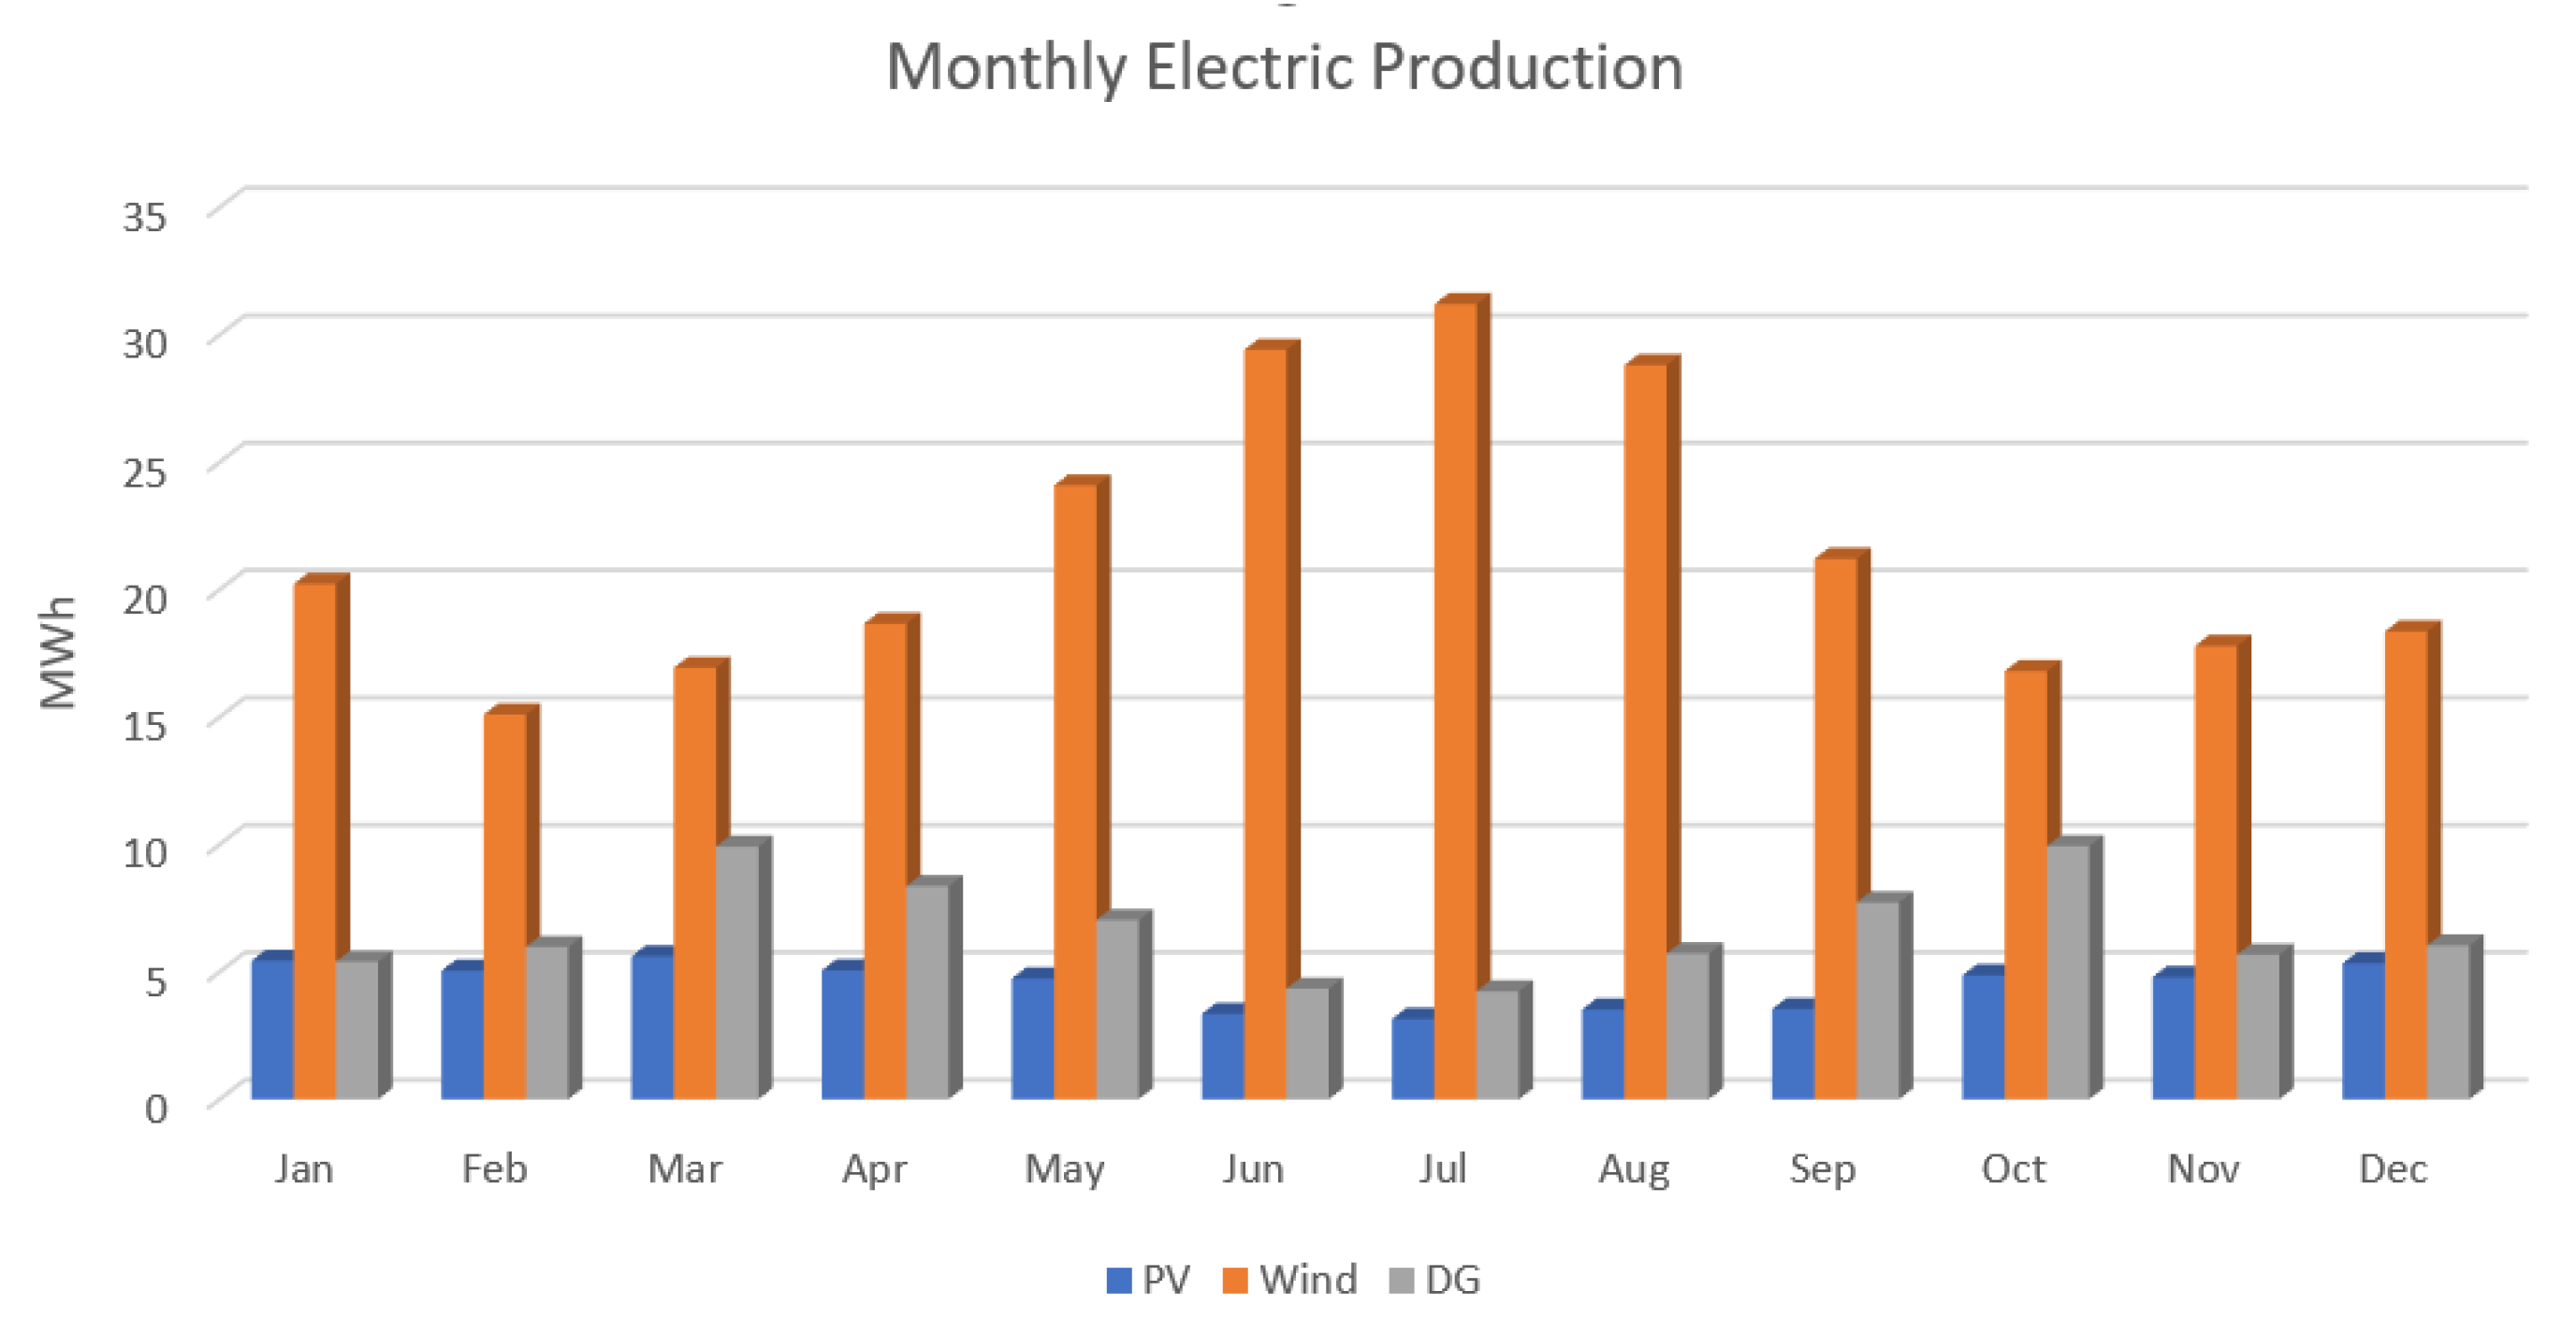
5.1.5. Case 5: PV/Wind/Battery/DG

The best approach to handling the ongoing electrical challenges in Bangladesh’s Kutubdia Island was discovered to be a hybrid microgrid system based on PV, wind, battery and DG. Two renewable energy resources (solar and wind) were examined in this scenario, together with a battery bank, to lessen the strain from diesel generators and so lower the power price to a tolerable level. The NPC, annual operating cost and initial capital cost for this hybrid system are USD 711,943, USD 33,620 and USD 277,317, respectively, according to Table 3. The COE is USD 0.200/kWh, which is lower than in all other cases. The simple payback of this hybrid system is 3.7 years, which is longer than in case 4, but the NPC and COE are lower. According to Table 8, PV, wind turbine, and DG produced electricity of 54,456, 258,583, and 80,345 kWh/y, respectively, with the wind turbine producing 65.733% of total electricity. Excess electricity is 113,169 kWh/y which is 28.8% of total electricity. In Figure 11 we see that the contribution of DG is reduced in these cases. From June to September, PV’s production is very low. The power generation from wind turbine is so high.

5.2. Emission Analysis

A hybrid renewable energy-based electrical system would undoubtedly be a significant accomplishment that would help to alleviate global warming. Based on fuel usage and fuel quality, yearly emissions are calculated from polluting materials and gas. Table 9 displays annual gas emission of different cases. According to this table, DG-based systems emit 218,666 kg/y carbon dioxide (CO 2 ) and 542 kg/y sulfur dioxide (SO 2 ); PV/Battery/DG emits 143,732 kg/y CO 2 and 356 kg/y SO 2 ; Wind/Battery/DG emits 77,803 kg/y CO 2 and 193 kg/y SO 2 ; and PV/Wind/Battery/DG emits 62,075 kg/y CO 2 and 154 kg/y SO 2 . The optimized PV/Wind/Battery/DG system emitted fewer CO 2 and SO 2 than all other combinations except PV/Wind/Battery. The PV/Wind/Battery/DG system emitted 71.61% less CO 2 and 71.59% less SO 2 than the base case DG system.

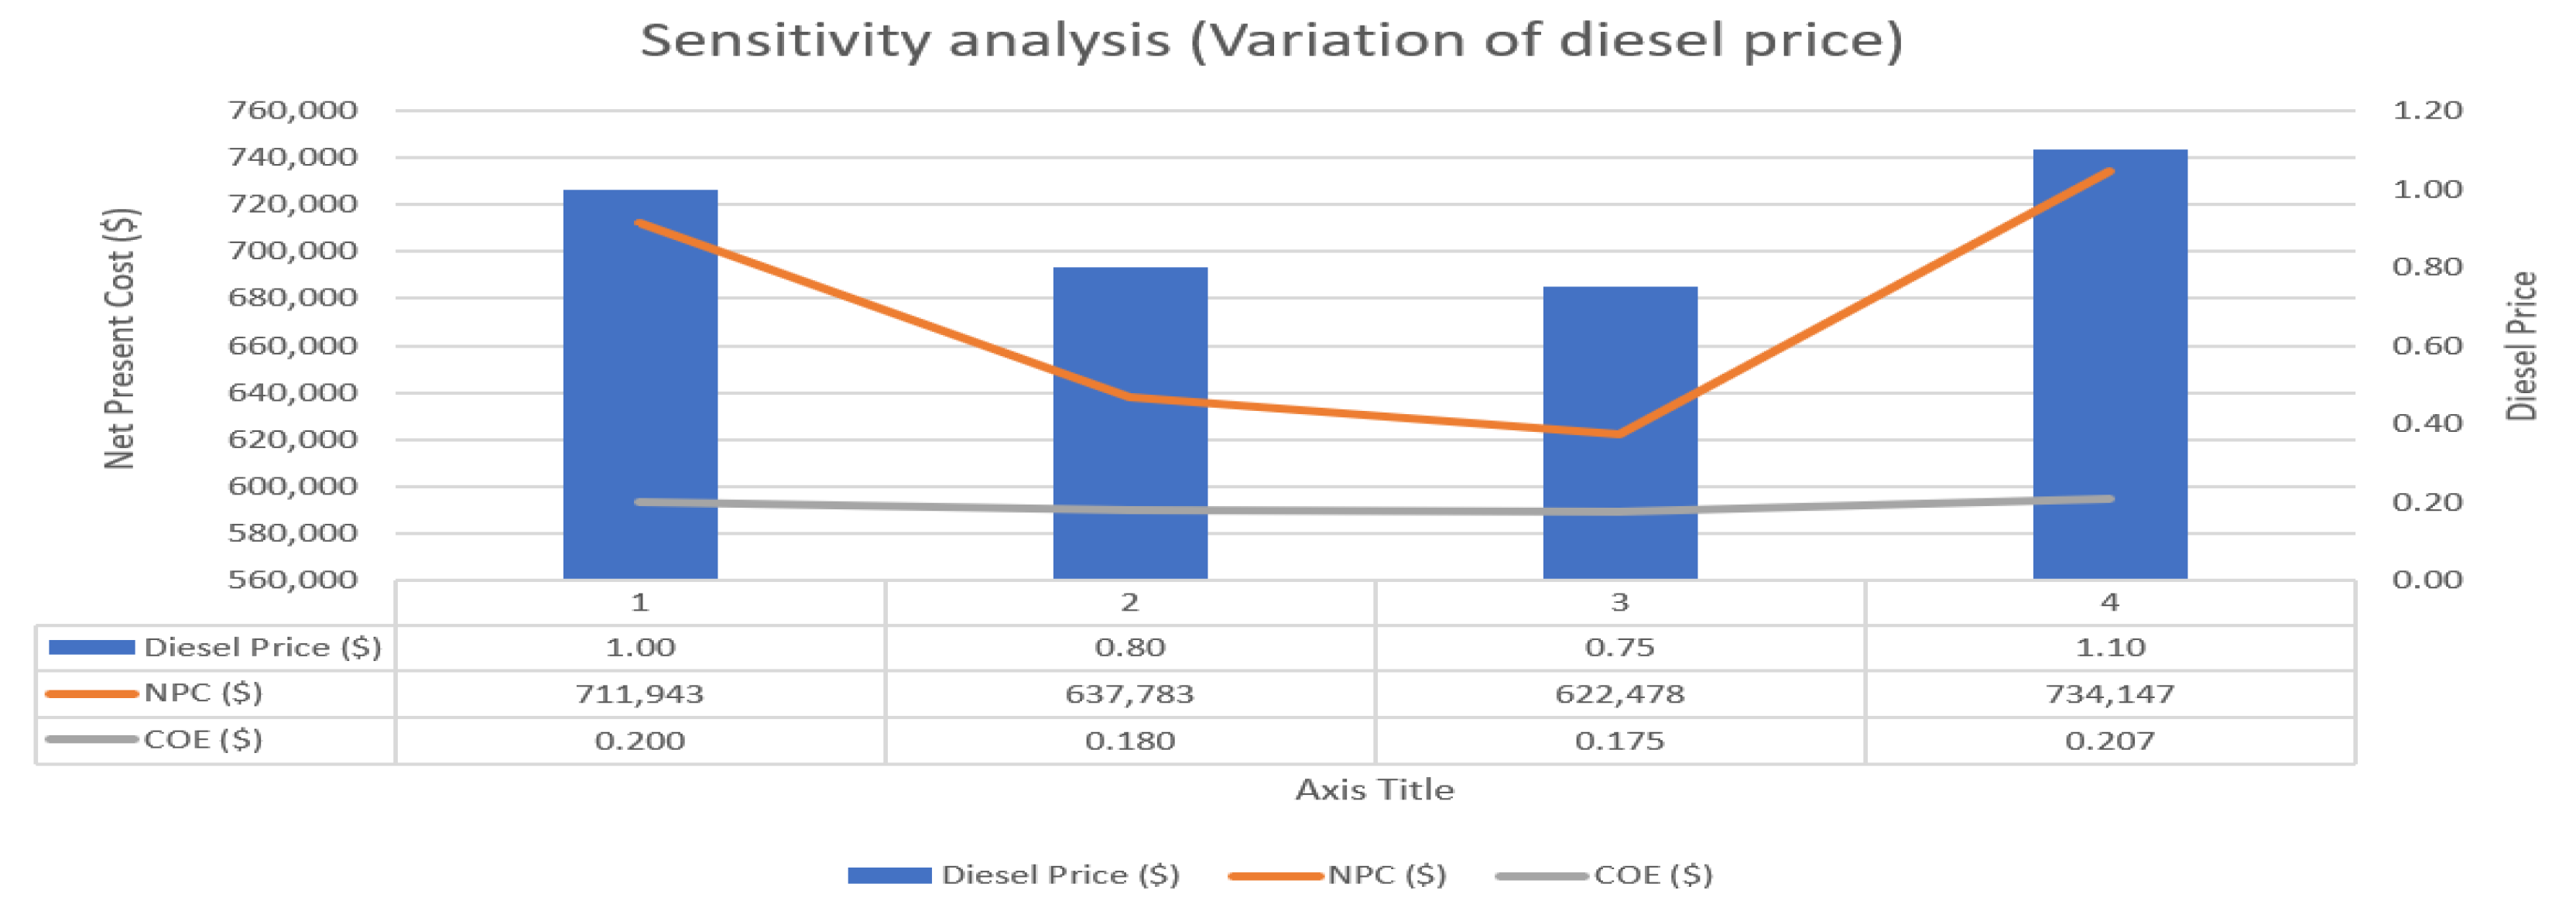
5.3. Sensitivity Analysis

Running a sensitivity study on the influence of many factors on the overall cost and viability of a renewable energy-based microgrid system is highly suggested. The sensitivity analysis is primarily carried out by looking at the impact of the following parameters on the previously optimized results: daily load demand, wind speed, solar energy (radiation), and diesel price; several costs (capital, operating, replacement and operation & maintenance) inputs and cost multiplier; grid extension cost; annual interest rate; and maximum capacity shortage. To investigate the correlation between NPC and COE, we picked three main factors: fuel price, wind speed and solar radiation.

5.3.1. The Effects of a Rising Diesel Price

Diesel prices are not the same throughout the year. It depends on the international market. Variation in diesel prices effects the project’s cost. Figure 12 shows the effect of the diesel price. In Figure 11 shows that the NPC and COE are 711,943 and 0.200 when diesel price, average solar radiation and average wind speed are USD 1.00, 4.81 kWh/m2/day and 4.77 m/s, respectively. When diesel costs drop to USD 0.75 and USD 0.80, the NPC falls to USD 622,478 and USD 637,783, respectively, and COE falls to USD 0.175 and USD 0.80. Contrarily, the NPC increases from USD 711,943 to USD 734,147 and the COE from USD 0.200 to USD 0.207 when the price of fuel rises from USD 1.00 to USD 1.10.

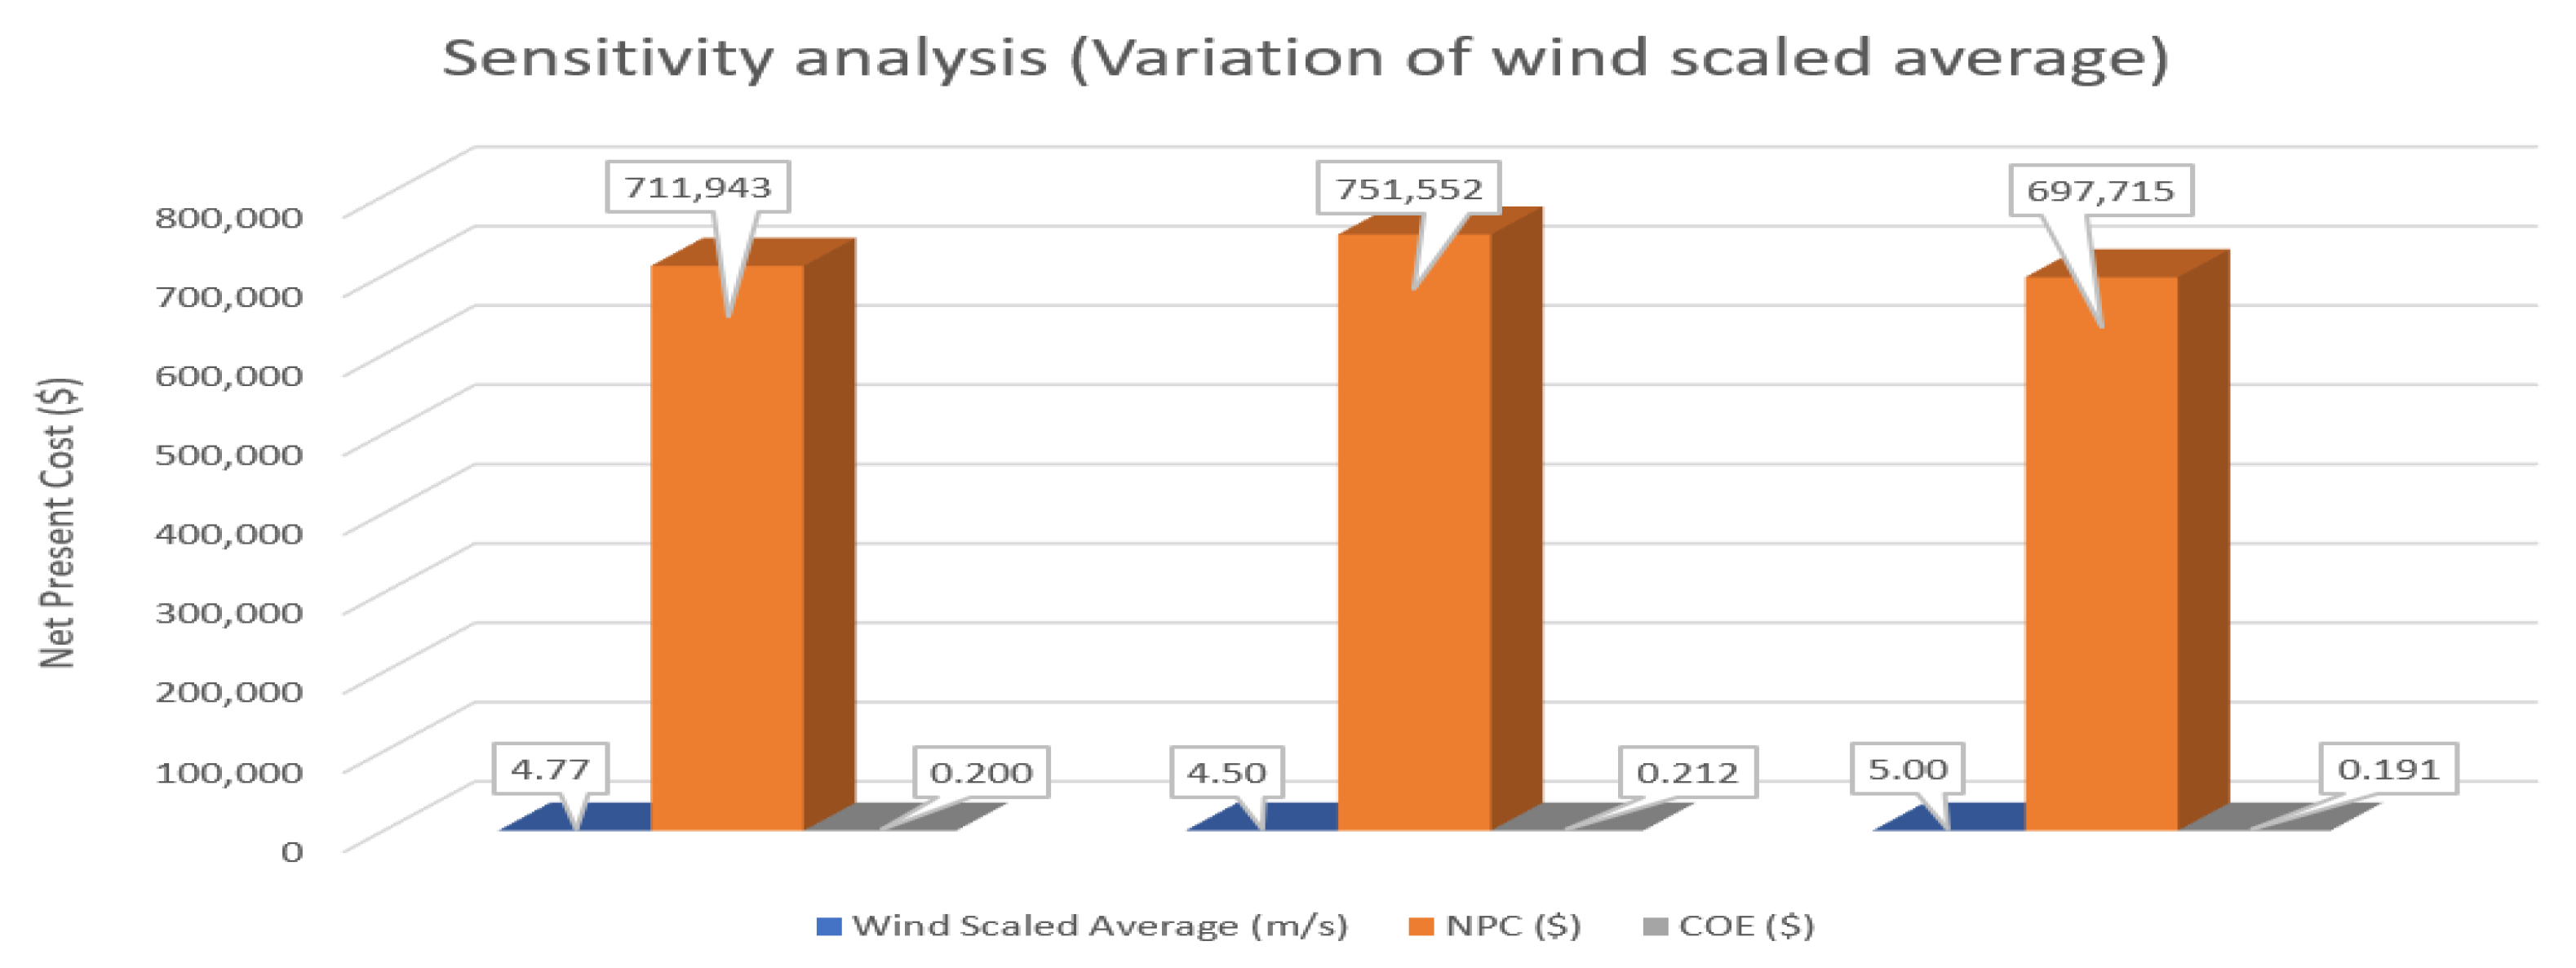
5.3.2. The Effects of Wind Speed

The NPC and COE are also heavily influenced by wind speed. Figure 13 show that increasing the wind speed from 4.77 m/s to 5.00 m/s decreases the NPC and COE. The NPC and COE were USD 711,943 and USD 0.200 while the wind speed was 4.77 m/s, and they decreased to USD 697,715 and USD 0.191 when the wind speed increased to 5.00 m/s. On the other hand, the NPC and COE are USD 751,552 and USD 0.212, respectively, when the wind speed drops from 4.77 m/s to 4.50 m/s. NPC and COE decrease as wind speed increases, and NPC and COE increase as wind speed decreases.

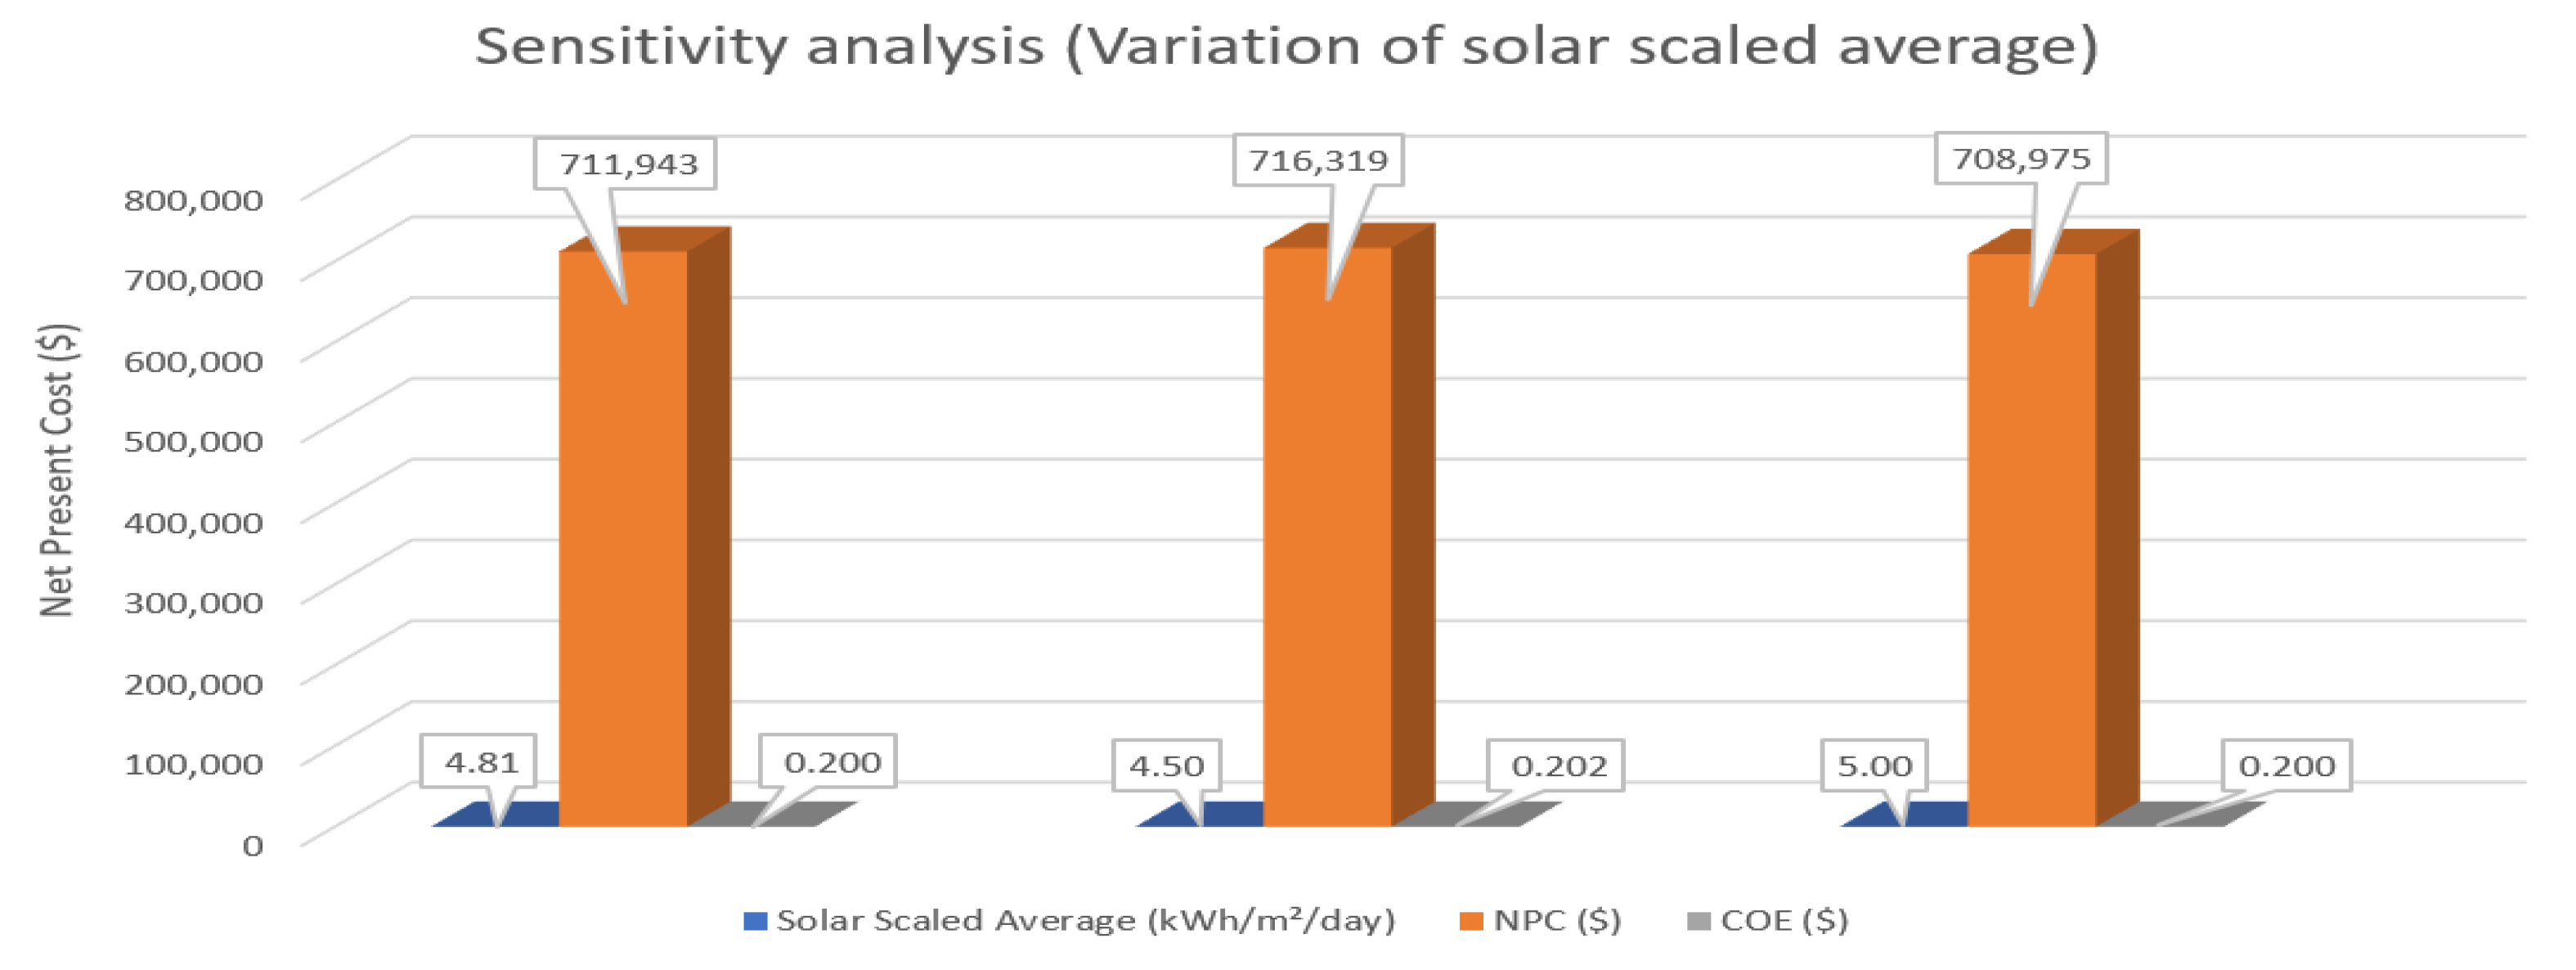
5.3.3. The Effects of Solar Radiation

The hybrid alternative using PV, wind, battery, and direct-drive generators is graphically illustrated in Figure 14 by changing the solar irradiation. It is obvious that the NPC and COE are influenced by changes in solar radiation. For instance, the NPC and COE are USD 711,943 and USD 0.200 at 4.81 kWh/m 2 /day solar radiation, but they rise to USD 716,391 and USD 0.202 at 4.50 kWh/m 2 /day solar radiation. However, the NPC and COE are USD 708,975 and USD 0.200, respectively, when the solar radiation reaches 5.00 kWh/m 2 /day. NPC is lower, even if COE is the same as when solar radiation is 4.81 kWh/m 2 /day.

5.4. Comparison between HOMER and NSGA-II Optimization Technique

The suggested PV/Wind/Battery/DG results optimized by HOMER software are contrasted with those optimized by NSGA-II in Table 10. The NPC (USD 692,775) determined by NSGA-II is less than the NPC (USD 701,943) generated by the HOMER. The primary factor behind this discrepancy is that HOMER employs an 80 kW diesel generator whereas the NSGA-II alternative only uses a 50 kW unit. The renewable fraction (88%) is higher in the NSGA-II technique due to the usage of the highest number of PV, wind turbines, and less contribution of diesel than in the HOMER (RF = 70.8%). In NSGA-II, total renewable generation (392,441 kWh/year) is higher than HOMER (313,039 kWh/year). The renewable fraction is also the reason for the less total NPC. Therefore, as compared to HOMER, NSGA-II offers the most economical alternative.

5.5. Proposed Optimized System vs. Present Energy System

The study subsequently investigated the optimal hybrid system with the present energy system in addition to comparing the various scenarios, which are characterized by the HOMER software tool based on COE and NPC. Policymakers might choose a hybrid-based energy system with the aid of this comparative study. In comparison to the price of current energy system, the COE of the ideal configuration that was chosen is USD 0.200/kWh dollars per kWh. Mostly, diesel generators are used to produce electricity in the considered area. However, only diesel-based systems are the most costly, which is mentioned in Table 3. Nowadays, they are also using solar home systems. The cost of SHSs is approximately USD 0.72/kWh [44]. Therefore, compared to solar and diesel-powered systems, the suggested system’s COE is more affordable.

6. Conclusions

The feasibility of a hybrid system for prospective energy generation in Bangladesh’s Kutubdia Island is studied in this study. Five scenarios are evaluated, and a possible configuration based on lower NPC and emissions is offered. PV/Wind/Battery/DG is the case at issue.According to HOMER a 35.8 kW PV panel, a 50 kW wind turbine, an 80 kW DG and 67 Li-ion batteries make up this system. The NPC is USD 711,943, and the renewable percentage is 70.8%. The renewable percentage is higher than the PV/wind/battery system. In the proposed system, wind turbines produce 65.7%, PV panels produce 13.8%, and DG produces 20.4% of the electricity. The emission of carbon dioxide is 62,075 kg/y, which is less than in all other cases except PV/Wind/Battery. The payback period is 3.7 years in the proposed system. In sensitivity analysis, it shows how the NPC and COE vary depending on diesel price and wind speed.
For verifying the best case selected by HOMER, NSGA-II-based optimization is carried out for the PV/Wind/Battery/DG combination, which uses a 54 kW PV panel, a 60 kW wind turbine, a 50 kW DG, and 86 kW Li-ion batteries. The NPC for the NSGA-II-based optimization approach is USD 692,775, which is less than HOMER-based system. The renewable percentage (88%) and overall energy production (448,132 kWh/y) in NSGA-II are higher than the renewable fraction (70.80%) and overall energy production (393,385 kWh/y) based on HOMER. It is obvious that NSGA-II offers the most economical answer in the aforementioned situation.
This study discusses the design and selection of the optimal system configuration for achieving high efficiency and techno-economic feasibility utilizing locally accessible renewable energy resources. The research takes into account a tiny community, thus more research is necessary to determine the size of HRES in light of widespread energy consumption. The outcomes displayed in the research region might not apply to all of Bangladesh. In future research, we should analyze the embodied carbon emissions of wind turbines.

Author Contributions

Conceptualization, M.R.I.; methodology, M.R.I.; validation, M.R.I., H.A., H.O.R.H. and T.S.; formal analysis and investigation, M.R.I. and T.S.; data curation, M.R.I. and T.S.; writing—original draft preparation, M.R.I.; writing—review and editing, M.R.I., H.A., H.O.R.H. and T.S.; resources and supervision, T.S. All authors have read and agreed to the published version of the manuscript.

Funding

This research received no external funding.

Institutional Review Board Statement

Not applicable.

Informed Consent Statement

Not applicable.

Data Availability Statement

Not applicable.

Conflicts of Interest

The authors declare no conflict of interest.

References

  1. Rashid, F.; Hoque, M.; Aziz, M.; Sakib, T.N.; Islam, M.; Robin, R.M. Investigation of Optimal Hybrid Energy Systems Using Available Energy Sources in a Rural Area of Bangladesh. Energies 2021, 14, 5794. [Google Scholar] [CrossRef]
  2. Ministry of Power, Energy and Mineral Resources. Available online: http://mpemr.gov.bd (accessed on 18 December 2021).
  3. Kutubdia Upazila. Available online: http://kutubdia.coxsbazar.gov.bd (accessed on 21 December 2021).
  4. Kutubdia Upazila, Wikipedia. Available online: https://en.wikipedia.org/wiki/Kutubdia_Upazila (accessed on 22 December 2021).
  5. Salehin, S.; Ferdaous, M.T.; Chowdhury, R.M.; Shithi, S.S.; Rofi, M.B.; Mohammed, M.A. Assessment of systems combining techno-economic optimization with energy scenario analysis. Energy 2016, 112, 729–741. [Google Scholar] [CrossRef]
  6. Fossil Carbon Dioxide (CO2) Emissions of Bangladesh. Available online: https://www.worldometers.info/co2-emissions/bangladesh-co2-emissions/ (accessed on 21 December 2021).
  7. Adewuyi, O.B.; Kiptoo, M.K.; Afolayan, A.F.; Amara, T.; Alawode, O.I.; Senjyu, T. Challenges and prospects of Nigeria’s sustainable energy transition with lessons from other countries’ experiences. Energy Rep. 2020, 6, 993–1009. [Google Scholar] [CrossRef]
  8. Fallahi, F.; Maghouli, P. An efficient solution method for integrated unit commitment and natural gas network operational scheduling under “Duck Curve”. Int. Trans. Electr. Energy Syst. 2020, 30, e12662. [Google Scholar] [CrossRef]
  9. Hou, Q.; Zhang, N.; Du, E.; Miao, M.; Peng, F.; Kang, C. Probabilistic duck curve in high PV penetration power system: Concept, modeling, and empirical analysis in China. Appl. Energy 2019, 242, 205–215. [Google Scholar] [CrossRef]
  10. Liao, J.T.; Chuang, Y.S.; Yang, H.T.; Tsai, M.S. BESS-sizing optimization for solar PV system integration in distribution grid. IFAC-PapersOnLine 2018, 51, 85–90. [Google Scholar] [CrossRef]
  11. Kerdphol, T.; Fuji, K.; Mitani, Y.; Watanabe, M.; Qudaih, Y. Optimization of a battery energy storage system using particle swarm optimization for stand-alone microgrids. Int. J. Electr. Power Energy Syst. 2016, 81, 32–39. [Google Scholar] [CrossRef]
  12. Ishraque, M.F.; Shezan, S.A.; Nur, J.N.; Islam, M.S. Optimal Sizing and Assessment of an Islanded Photovoltaic-Battery-Diesel Generator Microgrid Applicable to a Remote School of Bangladesh. Eng. Rep. 2021, 3, e12281. [Google Scholar] [CrossRef]
  13. Bangladesh Power Development Board (BPDB). Available online: https://www.bpdb.gov.bd (accessed on 26 December 2021).
  14. Das, B.K.; Hasan, M.; Rashid, F. Optimal sizing of a grid-independent PV/diesel/pump-hydro hybrid system: A case study in Bangladesh. Sustain. Energy Technol. Assess. 2021, 44, 100997. [Google Scholar] [CrossRef]
  15. Dominković, D.F.; Stark, G.; Hodge, B.M.; Pedersen, A.S. Integrated energy planning with a high share of variable renewable energy sources for a Caribbean Island. Energies 2018, 11, 2193. [Google Scholar] [CrossRef] [Green Version]
  16. Groppi, D.; Garcia, D.A.; Basso, G.L.; Cumo, F.; De Santoli, L. Analysing economic and environmental sustainability related to the use of battery and hydrogen energy storages for increasing the energy independence of small islands. Energy Convers. Manag. 2018, 177, 64–76. [Google Scholar] [CrossRef]
  17. Masrur, H.; Khan, K.R.; Abumelha, W.; Senjyu, T. Efficient energy delivery system of the CHP-PV based microgrids with the economic feasibility study. Int. J. Emerg. Electr. Power Syst. 2020, 21. [Google Scholar] [CrossRef]
  18. Baseer, M.A.; Alqahtani, A.; Rehman, S. Techno-economic design and evaluation of hybrid energy systems for residential communities: Case study of Jubail industrial city. J. Clean. Prod. 2019, 237, 117806. [Google Scholar] [CrossRef]
  19. Luta, D.N.; Raji, A.K. Optimal sizing of hybrid fuel cell-supercapacitor storage system for off-grid renewable applications. Energy 2019, 166, 530–540. [Google Scholar] [CrossRef]
  20. Akter, H.; Howlader, H.O.R.; Saber, A.Y.; Mandal, P.; Takahashi, H.; Senjyu, T. Optimal Sizing of Hybrid Microgrid in a Remote Island Considering Advanced Direct Load Control for Demand Response and Low Carbon Emission. Energies 2021, 14, 7599. [Google Scholar] [CrossRef]
  21. Zhu, W.; Guo, J.; Zhao, G.; Zeng, B. Optimal sizing of an island hybrid microgrid based on improved multi-objective grey wolf optimizer. Processes 2020, 8, 1581. [Google Scholar] [CrossRef]
  22. Yimen, N.; Tchotang, T.; Kanmogne, A.; Abdelkhalikh Idriss, I.; Musa, B.; Aliyu, A.; Dagbasi, M. Optimal sizing and techno-economic analysis of hybrid renewable energy systems—A case study of a photovoltaic/wind/battery/diesel system in Fanisau, Northern Nigeria. Processes 2020, 8, 1381. [Google Scholar] [CrossRef]
  23. Suresh, V.; Muralidhar, M.; Kiranmayi, R. Modelling and optimization of an off-grid hybrid renewable energy system for electrification in a rural areas. Energy Rep. 2020, 6, 594–604. [Google Scholar] [CrossRef]
  24. Sanajaoba, S. Optimal sizing of off-grid hybrid energy system based on minimum cost of energy and reliability criteria using firefly algorithm. Sol. Energy 2019, 188, 655–666. [Google Scholar] [CrossRef]
  25. Chowdhury, T.; Chowdhury, H.; Miskat, M.I.; Chowdhury, P.; Sait, S.M.; Thirugnanasambandam, M.; Saidur, R. Developing and evaluating a stand-alone hybrid energy system for Rohingya refugee community in Bangladesh. Energy 2020, 191, 116568. [Google Scholar] [CrossRef]
  26. Sabishchenko, O.; Rębilas, R.; Sczygiol, N.; Urbański, M. Ukraine energy sector management using hybrid renewable energy systems. Energies 2020, 13, 1776. [Google Scholar] [CrossRef]
  27. Muh, E.; Tabet, F. Comparative analysis of hybrid renewable energy systems for off-grid applications in Southern Cameroons. Renew. Energy 2019, 135, 41–54. [Google Scholar] [CrossRef]
  28. Bhuiyan, M.R.A.; Mamur, H.; Begum, J. A brief review on renewable and sustainable energy resources in Bangladesh. Clean. Eng. Technol. 2021, 4, 100208. [Google Scholar] [CrossRef]
  29. Padrón, I.; Avila, D.; Marichal, G.N.; Rodríguez, J.A. Assessment of Hybrid Renewable Energy Systems to supplied energy to Autonomous Desalination Systems in two islands of the Canary Archipelago. Renew. Sustain. Energy Rev. 2019, 101, 221–230. [Google Scholar] [CrossRef]
  30. Nurunnabi, M.; Roy, N.K.; Pota, H.R. Optimal sizing of grid-tied hybrid renewable energy systems considering inverter to PV ratio—A case study. J. Renew. Sustain. Energy 2019, 11, 013505. [Google Scholar] [CrossRef]
  31. Mokhtara, C.; Negrou, B.; Bouferrouk, A.; Yao, Y.; Settou, N.; Ramadan, M. Integrated supply-demand energy management for optimal design of off-grid hybrid renewable energy systems for residential electrification in arid climates. Energy Convers. Manag. 2020, 221, 113192. [Google Scholar] [CrossRef]
  32. Zebra, E.I.C.; van der Windt, H.J.; Nhumaio, G.; Faaij, A.P. A review of hybrid renewable energy systems in mini-grids for off-grid electrification in developing countries. Renew. Sustain. Energy Rev. 2021, 144, 111036. [Google Scholar] [CrossRef]
  33. Yusuf, S.S.; Mustafi, N.N. Design and Simulation of an Optimal Mini-Grid Solar-Diesel Hybrid Power Generation System in a Remote Bangladesh. Int. J. Smart Grids ijSmartGrid 2018, 2, 27–33. [Google Scholar]
  34. Arief, Y.Z.; Halim, N.A.A.A.; Saad, M.H.I. Optimization of hybrid renewable energy in Sarawak remote rural area using HOMER software. In Proceedings of the 2019 International UNIMAS STEM 12th Engineering Conference (EnCon), Kuching, Malaysia, 28–29 August 2019; IEEE: Piscataway, NJ, USA, 2019; pp. 1–5. [Google Scholar]
  35. Kahwash, F.; Maheri, A.; Mahkamov, K. Integration and optimisation of high-penetration Hybrid Renewable Energy Systems for fulfilling electrical and thermal demand for off-grid communities. Energy Convers. Manag. 2021, 236, 114035. [Google Scholar] [CrossRef]
  36. Konneh, D.A.; Howlader, H.O.R.; Shigenobu, R.; Senjyu, T.; Chakraborty, S.; Krishna, N. A multi-criteria decision maker for grid-connected hybrid renewable energy systems selection using multi-objective particle swarm optimization. Sustainability 2019, 11, 1188. [Google Scholar] [CrossRef]
  37. Akter, H.; Howlader, H.O.R.; Nakadomari, A.; Islam, M.R.; Saber, A.Y.; Senjyu, T. A Short Assessment of Renewable Energy for Optimal Sizing of 100% Renewable Energy Based Microgrids in Remote Islands of Developing Countries: A Case Study in Bangladesh. Energies 2022, 15, 1084. [Google Scholar] [CrossRef]
  38. Gamil, M.M.; Sugimura, M.; Nakadomari, A.; Senjyu, T.; Howlader, H.O.R.; Takahashi, H.; Hemeida, A.M. Optimal sizing of a real remote Japanese microgrid with sea water electrolysis plant under time-based demand response programs. Energies 2020, 13, 3666. [Google Scholar]
  39. Nsafon, B.E.K.; Butu, H.M.; Owolabi, A.B.; Roh, J.W.; Suh, D.; Huh, J.S. Integrating multi-criteria analysis with PDCA cycle for sustainable energy planning in Africa: Application to hybrid mini-grid system in Cameroon. Sustain. Energy Technol. Assess. 2020, 37, 100628. [Google Scholar] [CrossRef]
  40. Bangladesh Petroleum Corporation (BPC). Available online: http://www.bpc.gov.bd (accessed on 21 January 2022).
  41. Ali, T.; Ma, H.; Nahian, A.J. Techno-economic analysis of a hybrid mini-grid in rural areas: A case study of Bangladesh. J. Energy Res. Rev. 2020, 10–29. [Google Scholar] [CrossRef]
  42. Das, B.K.; Hassan, R.; Tushar, M.S.H.; Zaman, F.; Hasan, M.; Das, P. Techno-economic and environmental assessment of a hybrid renewable energy system using multi-objective genetic algorithm: A case study for remote Island in Bangladesh. Energy Convers. Manag. 2021, 230, 113823. [Google Scholar] [CrossRef]
  43. Yusoff, Y.; Ngadiman, M.S.; Zain, A.M. Overview of NSGA-II for optimizing machining process parameters. Procedia Eng. 2011, 15, 3978–3983. [Google Scholar] [CrossRef]
  44. Mandal, S.; Das, B.K.; Hoque, N. Optimum sizing of a stand-alone hybrid energy system for rural electrification in Bangladesh. J. Clean. Prod. 2018, 200, 12–27. [Google Scholar] [CrossRef]
Figure 1. Proposed power system model.
Energies 15 06381 g001
Figure 2. Research methodology of the proposed hybrid renewable energy system.
Energies 15 06381 g002
Figure 3. Hourly load demand.
Energies 15 06381 g003
Figure 4. Solar radiation data in a year.
Energies 15 06381 g004
Figure 5. Monthly average wind speed data.
Energies 15 06381 g005
Figure 6. Flow chart of NSGA-II optimization technique.
Energies 15 06381 g006
Figure 7. DG-based electricity production throughout the year.
Energies 15 06381 g007
Figure 8. PV/Wind/Battery-based electricity production throughout the year.
Energies 15 06381 g008
Figure 9. PV/Battery/DG-based electricity production throughout the year.
Energies 15 06381 g009
Figure 10. Wind/Battery/DG-based electricity production throughout the year.
Energies 15 06381 g010
Figure 11. PV/Wind/Battery/DG-based electricity production throughout the year.
Energies 15 06381 g011
Figure 12. Variation of diesel fuel price.
Energies 15 06381 g012
Figure 13. Variation of Wind Speed.
Energies 15 06381 g013
Figure 14. Variation of Solar Radiation.
Energies 15 06381 g014
Table 1. Estimated electricity demand for Kutubdia Island.
Type of LoadDescriptionNo. in USAPower (W)SummerWinter
Hours/DayWatt-Hours/DayHours/DayWatt-Hours/Day
HouseCFL21561808240
Fan18014112000
TV112089607840
Fridge1250246000246000
Total (For one house) 465 8260 7080
Total (Houses)10046,500 826,000 708,000
ShopCFL21551507210
Fan180756000
Total (For one shop) 95 710 210
Total (Shops)201900 14,200 4200
RestaurantCFL18158216092430
Fan98010720000
TV112089607840
Fridge1250246000246000
Total (For one restaurant) 465 16,320 9270
Total (Restaurants)83720 130,560 74,160
HotelCFL60157630087200
Fan30801024,00000
TV22120513,200615,840
Fridge22502412,0002412,000
Water Pump115002300023000
Total (For one hotel) 1965 58,500 38,400
Total (Hotels)35895 175,500 114,120
Total Load 58,015 1,146,260 900,480
Table 3. Simulation results.
ParametersCase 1Case 2Case 3Case 4Case 5
NPC (USD)1,269,7321,374,0821,097,312730,435711,943
Initial Capital (USD)29,600938,618188,983232,321277,317
Operating Cost (USD/y)95,93033,68570,26338,53133,620
COE (USD)0.3580.3870.3090.2060.200
Simple Payback (y)01263.33.7
PV Capacity (kW)-175102-35.8
WT Capacity (kW)-8-55
No. of battery-855515867
Inverter capacity (kW)-65.462.336.138.5
DG capacity (kW)80-808080
Fuel costs (USD)82,664-54,32329,40623,461
Fuel consumption (L/year)82,664-54,32329,40623,461
Diesel engine operating hour8760-532529132189
Table 4. Augmented Electrical Result for DG.
ElectricalElementskWh/y%
ProductionDG (80kW)276,999100
Total276,999
ConsumptionAC load274,752100
Total274,752
Excess Electricity22470.811
QuantityUnmet Electric load00
Capacity Shortage00
Table 5. Augmented Electrical Result for PV/Wind/Battery.
ElectricalElementskWh/y%
ProductionPV266,91039.2
Wind Trubine413,73360.8
Total680,643100
ConsumptionAC load274,588100
Total274,588
Excess Electricity393,72257.8
QuantityUnmet Electric load1640.0597
Capacity Shortage2720.0990
Table 6. Augmented Electrical Result for PV/Battery/DG.
ElectricalElementskWh/y%
ProductionPV155,98645.8
DG184,40854.2
Total340,394100
ConsumptionAC load274,752100
Total274,752
Excess Electricity57,74117
QuantityUnmet Electric load00
Capacity Shortage00
Table 7. Augmented Electrical Result for Wind/Battery/DG.
ElectricalElementskWh/y%
ProductionWind Trubine258,58372.2
DG99,73027.8
Total358,313100
ConsumptionAC load274,752100
Total274,752
Excess Electricity79,23022.1
QuantityUnmet Electric load00
Capacity Shortage00
Table 8. Augmented Electrical Result for PV/Wind/Battery/DG.
ElectricalElementskWh/y%
PV54,45613.843
ProductionWind Turbine258,58365.733
DG80,34520.424
Total393,385100
ConsumptionAC load274,752100
Total274,752
Excess Electricity113,16928.8
QuantityUnmet Electric load00
Capacity Shortage00
Table 9. Comparison of emission analysis.
Emitting Gas (kg/y)DGPV/Battery/DGWind/Battery/DGPV/Wind/Battery/DG
CO 2 218,666143,73277,80362,075
SO 2 542356193154
Table 10. Comparison between HOMER and NSGA-II for the proposed PV/Wind/Batterry/DG based option.
ParametersHOMERNSGA-II
NPC (USD)711,943692,775
PV (kW)35.854
DG (kW)8050
Battery (kWh)6786
Wind Turbine (kW)5 × 106 × 10
Total renewable generation (kWh/year)313,039392,441
Total diesel generation (kWh/year)80,34555,691
Excess energy (kWh/year)113,169189,921
Renewable fraction (%)70.8088.00
Total energy (kWh/year)393,385448,132
Publisher’s Note: MDPI stays neutral with regard to jurisdictional claims in published maps and institutional affiliations.

