Article

Experimental Study on the Sweep Law of CO2 Miscible Flooding in Heterogeneous Reservoir in Jilin

1
College of Engineering Science, University of Chinese Academy of Sciences, Beijing 100049, China
2
Institute of Porous Flow and Fluid Mechanics, Chinese Academy of Sciences, Langfang 065007, China
3
Research Institute of Petroleum Exploration & Development, Beijing 100083, China
4
State Key Laboratory of Enhanced Oil Recovery, PetroChina Research Institute of Petroleum Exploration and Development, Beijing 100083, China
5
PetroChina Jilin Oilfield Company, Songyuan 138099, China
*
Author to whom correspondence should be addressed.
Energies 2022, 15(15), 5755; https://doi.org/10.3390/en15155755
Submission received: 23 June 2022 / Revised: 4 August 2022 / Accepted: 5 August 2022 / Published: 8 August 2022

Abstract

:
It is very important to effectively describe the sweep characteristics of CO2 miscible flooding based on physical models for actual reservoir development. In this study, based on the geological characteristics of the Jilin ultra-low permeability reservoir, which has significant vertical heterogeneity, a two-dimensional double-layer heterogeneous visualization model with a permeability contrast of 10 and thickness contrast of 2 was designed to perform experimental research on the sweep law of CO2 miscible flooding with an injection-production mode of “united injection and single production”. With the goal of determining the obvious differences in the gas absorption capacity and displacement power of the two layers, the CO2 dynamic miscible flooding characteristics were comprehensively analyzed, and the sweep law of CO2 miscible flooding, including the oil and gas flow trend, migration direction of the oil–gas interface, and distribution characteristics of the miscible zone, was further studied in combination with the oil displacement effect. In this experiment, the gas absorption capacity was the key factor affecting the sweep efficiency of the CO2 miscible flooding. Under the combined influence of the internal and external control factors of the reservoir thickness, permeability, and injection-production mode, the gas absorption capacity of the high-permeability layer was much greater than that of the low-permeability layer, resulting in the retention of a large amount of remaining oil in the low-permeability layer, which effectively displaced and swept the oil in the high-permeability layer. The gas absorption capacity of the reservoir, gravitational differentiation, and miscible mass transfer were key factors affecting the migration of the oil–gas interface and distribution of the miscible zone. The entire displacement process could be divided into three stages: ① The gas-free rapid oil production stage, which was dominated by the displacement; ② the low gas–oil ratio stable oil production stage, which was jointly affected by the displacement and miscible mass transfer; and ③ the high gas–oil ratio slow oil production stage, which was dominated by the effect of CO2 carrying.

Graphical Abstract

1. Introduction

By the end of 2019, the confirmed reserves of the Jilin ultra-low permeability reservoir reached 460 million tons, accounting for 36% of the total verified reserves. It is extremely important to adopt effective methods for the stable and long-term development of the Jilin oilfield [1]. This reservoir has poor physical properties and significant vertical heterogeneity, and it is difficult to form an effective displacement environment through waterflood development [2,3]. In 2006, an investigation began at the Jilin oilfield on the use of CO2 flooding technology. This is a type of miscible flooding in which the injection pressure is higher than the minimum miscible pressure [4]. Field practice and laboratory research have shown that CO2 miscible flooding can significantly improve the development effect for the ultra-low permeability reservoir in Jilin [5,6]; however, the reservoir heterogeneity considerably affects the sweep area of CO2 miscible flooding. Moreover, it is difficult to predict and describe the sweep characteristics of CO2 miscible flooding during dynamic displacement. Therefore, it is extremely important to study the sweep law of CO2 miscible flooding in relation to the heterogeneous effects of the Jilin reservoir.
At present, most physical simulation experiments on CO2 miscible flooding performed by researchers use one-dimensional long cores or short cores. For example, to study the influence of water content on the CO2 flooding effect in ultra-low permeability reservoirs, Yu et al. [7] conducted two sets of physical simulation experiments on long-core flooding in the low-water-cut and high-water-cut stages, analyzed the displacement law at the different water cut stages, and evaluated the oil displacement effect using two main parameters: the gas–oil ratio and oil recovery factor. Liu et al. [8] conducted two sets of comparative long-core CO2 flooding experiments. In these experiments, the oil displacement effects of the CO2 miscible and non-miscible floodings of ultra-low permeability reservoirs were evaluated using parameters such as the oil recovery factor and gas–oil ratio. Qian et al. and Wang et al. [9,10] conducted short-core CO2 physical simulation experiments based on nuclear magnetic resonance technology to explore the microscopic flooding mechanism of CO2 miscible flooding under different injection methods. They clarified the relationship between the pore-size structure and movable-oil distribution, comprehensively evaluated the CO2 flooding effect under different injection methods, and optimized the injection methods. It was observed that this type of experiment could only evaluate the effect of CO2 miscible flooding using parameters such as the oil recovery factor, gas–oil ratio, and oil saturation, but could not describe the sweep characteristics of CO2 miscible flooding owing to the limitation of the one-dimensional physical model. With the development of experimental technology, two-dimensional (2D) models with relatively large sizes and visual characteristics have been widely used in indoor experiments. For example, Wang et al. [11] conducted a 2D visual physical simulation experiment on a bottom-water reservoir exploited with a horizontal well and analyzed the variation characteristics and mechanism of water coning with horizontal sections with different lengths. Qian et al. [12] simulated the water cresting process and changes in crest configurations using a 2D visual model to predict the dynamic change trend of water cresting. Huang et al. [13] established a horizontal 2D visual physical model to study the development process for the water cresting of horizontal wells and analyzed the water breakthrough characteristics of bottom-water reservoirs. Li et al. [14] designed a 2D visual model, studied the dynamic process of foam flooding in bottom-water reservoir development based on this model, and analyzed the migration characteristics of the foam fluid in the anti-water coning process. To solve the problem of ineffective development caused by injected water migrating along the high-permeability zones in thick reservoirs with a positive rhythm, based on a 2D visual heterogeneous sand-packing model, Liu et al. [15] designed a physical simulation water-flooding experiment by injecting glue into horizontal wells to form a “gel dam”, which could change the direction of water flooding and expand the production range. On the basis of previous studies, to further solve the problem of the uneven sweep area caused by injected water tending to migrate in the dominant channel in heterogeneous reservoirs, Xu et al. [16] proposed the “gel dam profile” technology, and verified the effectiveness of this technology using a 2D visual plane sand filling model. It can be observed that most scholars focus on the use of 2D visible models for experimental research on the use of horizontal wells for bottom-water reservoirs and mainly solve the problem of crude oil plane exploitation. In terms of gas flooding experiments, most scholars mainly use 2D microscopic visual models to deeply study the mechanism of miscible mass transfer between oil and gas in different pore throat distributions and displacement stages. However, due to the limitation of model size, it is impossible to deeply study the sweep characteristics of macroscopic miscible gas flooding. For example, Qing et al. [17] designed a plane glass etching model and carried out a high temperature-pressure CO2 miscible flooding experiment, and observed the miscible mass transfer characteristics of crude oil and CO2 in the local microscopic pore size distribution. Guo [18] carried out CO2 miscible flooding experiments by using microscopic 2D visual experimental simulation system to restore the actual temperature and pressure conditions of the reservoir, and studied the miscible microscopic migration characteristics between oil and gas in different pore size distributions. Wang et al. [6] designed two microscopic visual models of pore-throat scales, and carried out CO2 flooding experiments under different injection modes, among which the miscible mechanism at the corner was deeply studied. In 2021, Yu et al. [19] designed a variety of 2D visual models with the size of 150 × 170 × 20 mm based on the characteristics of sandstone reservoirs with developed interlayers and fractures. They carried out miscible hydrocarbon gas gravity drainage experiments in both the homogeneous model and the model with interlayers, and for the first time observed the distribution of the large-area miscible zone in the experiments, and its sweep characteristics were described and analyzed. This lays a foundation for further development of miscible gas flooding sweep experiments. However, at present, there is still a lack of systematic research on CO2 flooding sweep experiment based on large-scale 2D visual sand-filling model. Few scholars have conducted in-depth gas flooding experiments based on such models or have effectively used visual research methods to accurately describe the characteristics of CO2 miscible flooding in different displacement stages to further study the sweep law of CO2 miscible flooding.
Based on the characteristics of the Jilin ultra-low permeability reservoir, which has significant vertical heterogeneity, this study designed a 2D double-layer heterogeneous visualization model and performed a sweep law experiment on CO2 miscible flooding to study its dynamic sweep characteristics, including the oil and gas flow trend, migration direction of the oil–gas interface, and distribution characteristics of the miscible zone.

2. Experimental Equipment and Methods
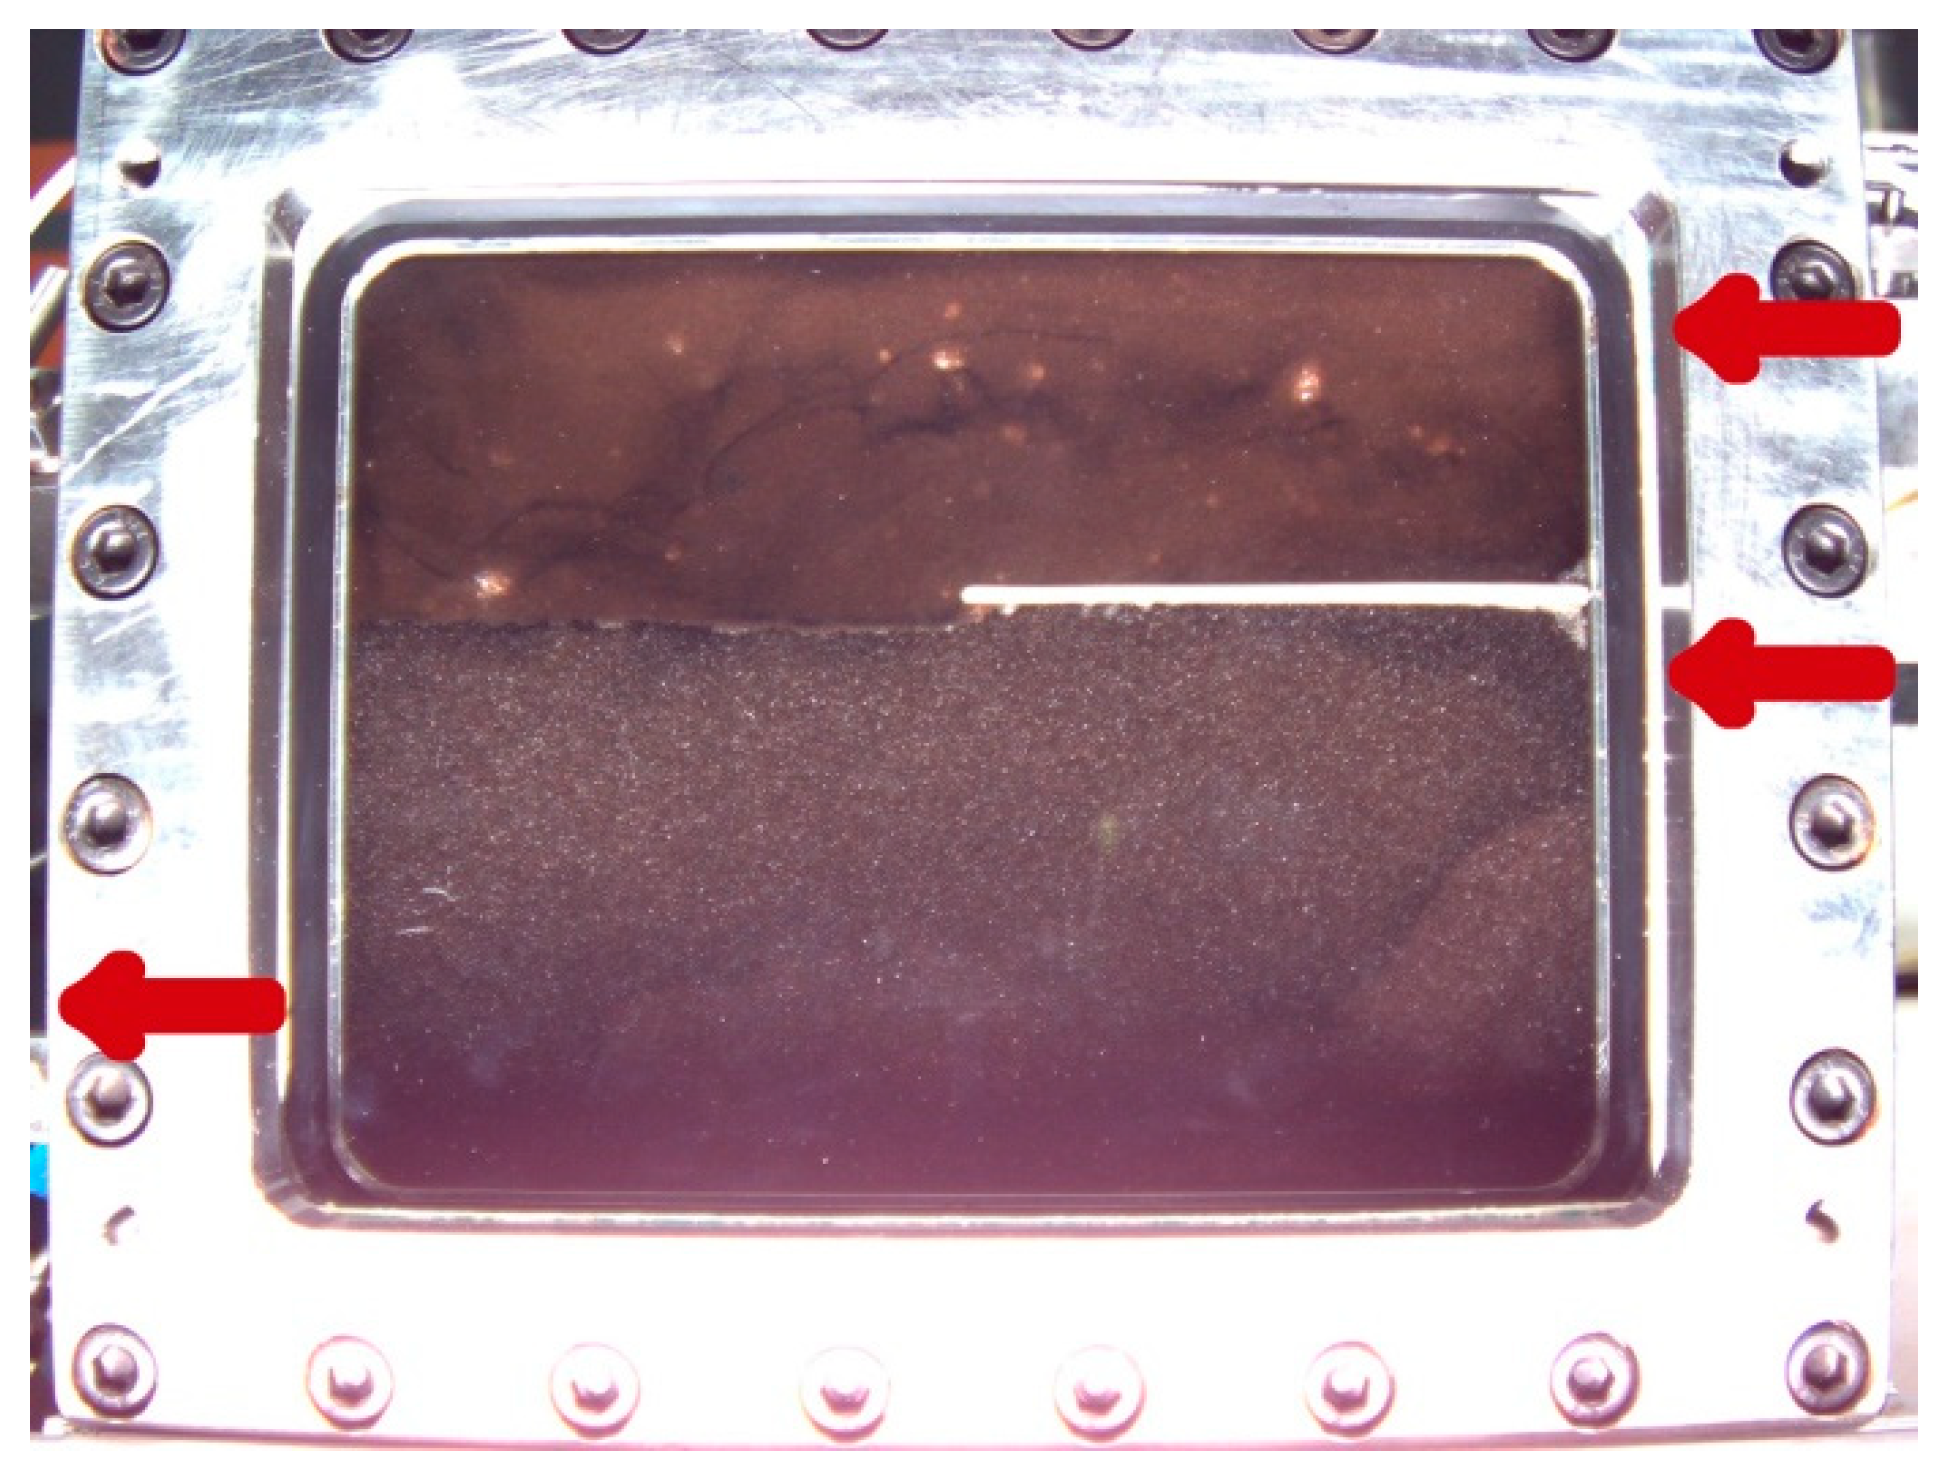
2.1. Model Design

In order to deeply study the sweep law of CO2 miscible flooding under the heterogeneous reservoir in Jilin, this paper takes a certain block of Jilin ultra-low permeability reservoir as the research background. The top structure of the block is a fault nose structure blocked by reverse normal fault, and the type of reservoir is a lithologic structure. The average effective thickness of oil layer in this block is 9.5 m, the average porosity is 13.0%, and the average permeability is 4.5 × 10⁻³ μm2.The block is mainly rich in two thin layers: No. 11 and No. 12, the No. 11 thin layer has a single effective thickness of 2 m, an average porosity of 10.6%, and an average permeability of 1.7 × 10⁻³ μm2; the No. 12 has a thickness of 4 m, an average porosity of 15.1%, and an average permeability of 8.0 × 10⁻³ μm2. In addition, the fractures in this block are relatively developed. The fractures are mainly in the east-west direction, and there is no filler on the fracture surface. They are closed underground and are mainly located between two thin layers.
According to the geological characteristics of the above-mentioned target block, based on the similarity principle, a 2D double-layer heterogeneous visualization model is designed, as shown in Figure 1. The model consists of a set of stainless steel frames, an organic glass plate and a sand-filled core. The outer frame is pressurized sealed with screws, the upper limit of the working pressure is 22 MPa, and the upper limit of the working temperature is 110 °C. The model size is 20 cm × 15 cm × 2 cm, the average porosity is 13.2%. The core is mainly made of 120–500 mesh quartz sand and glass beads, mixed and poured with epoxy resin, and an impermeable resin plate located at 2/3 of the model height is built to simulate the interlayer. The length of the interlayer is 10 cm and the thickness is 4 mm. With the interlayer as the boundary, the upper part simulates a low-permeability layer with relatively low permeability, with a thickness of 5 cm and a permeability of 1 mD; the lower part simulates a high-permeability layer with relatively high permeability, with a thickness of 10 cm and a permeability of 10 mD. It satisfies the condition of reservoir permeability contrast and reflects the vertical heterogeneity of the reservoir.
In addition, the inlet and outlet valves can be set around the model. Through system regulation, valve control and pipeline connection, various combinations of injection-production modes can be formed, and experimental studies under different injection-production modes can be carried out.

2.2. Experimental System

The experimental system mainly includes four parts: displacement system, 2D model, image monitoring capture system, and produced fluid measurement system, as shown in Figure 2. Among them, the displacement system uses two sets of Quizix qx5210 high-pressure precision displacement pumps and two piston intermediate containers to work together for core saturation and displacement. The 2D model has the characteristics of visualization, which can further study the displacement and sweep law. The image monitoring capture system is composed of a high-speed camera and a computer operating terminal, which is used to monitor, capture, and record the complete dynamic miscible flooding process. The produced liquid measurement system is composed of an output liquid metering device, a separation bottle and a real-time gas flow meter, which is used for precise measurement of the produced liquid. In addition to the water bath, the intermediate containers and pipelines are wrapped with heating sleeves to ensure the experimental temperature.

2.3. Experimental Scheme

According to the combination of various injection-production modes selected for the actual production and development of the target block, the injection-production mode in this experiment is designed as “united injection and single production”, that is, it is injected uniformly at the top of the double layers of the right side of the reservoir, and produced at the bottom of the high-permeability layer at the left side, as shown in Figure 3. Uniform injection from the top position, both high and low permeability layers can effectively utilize the gravitational differentiation caused by the difference in oil and gas densities. Single production from the bottom of the high-permeability layer, the layer contradiction caused by the heterogeneity of the ultra-low permeability reservoir can be highlighted, and the obvious difference in the gas absorption capacity and displacement power of the high and low permeability layers can be exposed. Therefore, by adopting the injection-production mode of “united injection and single production”, an in-depth study can be carried out on the control effects of gas absorption capacity of reservoir, gravitational differentiation, miscible mass transfer on the oil and gas flow trend, the migration direction of oil–gas interface and the distribution characteristics of miscible zone, and the dynamic sweep law of CO2 miscible flooding is obtained.

2.4. Experimental Materials and Procedures

The experimental temperature is 50 °C, the back pressure is 8.5 MPa, and the displacement pressure is 9.5 MPa. The experimental gas is CO2 with a purity of 99.99%. The experimental oil sample is prepared from aviation kerosene, a certain content of C2–C5 components and ground gas-free crude oil of the target block, and the density is 0.78 g/cm3. Under the experimental conditions, the simulated oil can be miscible with CO2 (Figure 4), with a viscosity of 2.08 mPa·s, which is equivalent to the viscosity of the formation oil in the target block under miscible conditions (temperature of 96.7 °C and pressure of 23.9 MPa).
The experimental procedures are as follows:
(1)
The model was vacuumized for more than 6 h.
(2)
The simulated oil was injected from the bottom of the model. The oil was saturated at a constant speed and then at a constant pressure, and the saturation time was more than 24 h.
(3)
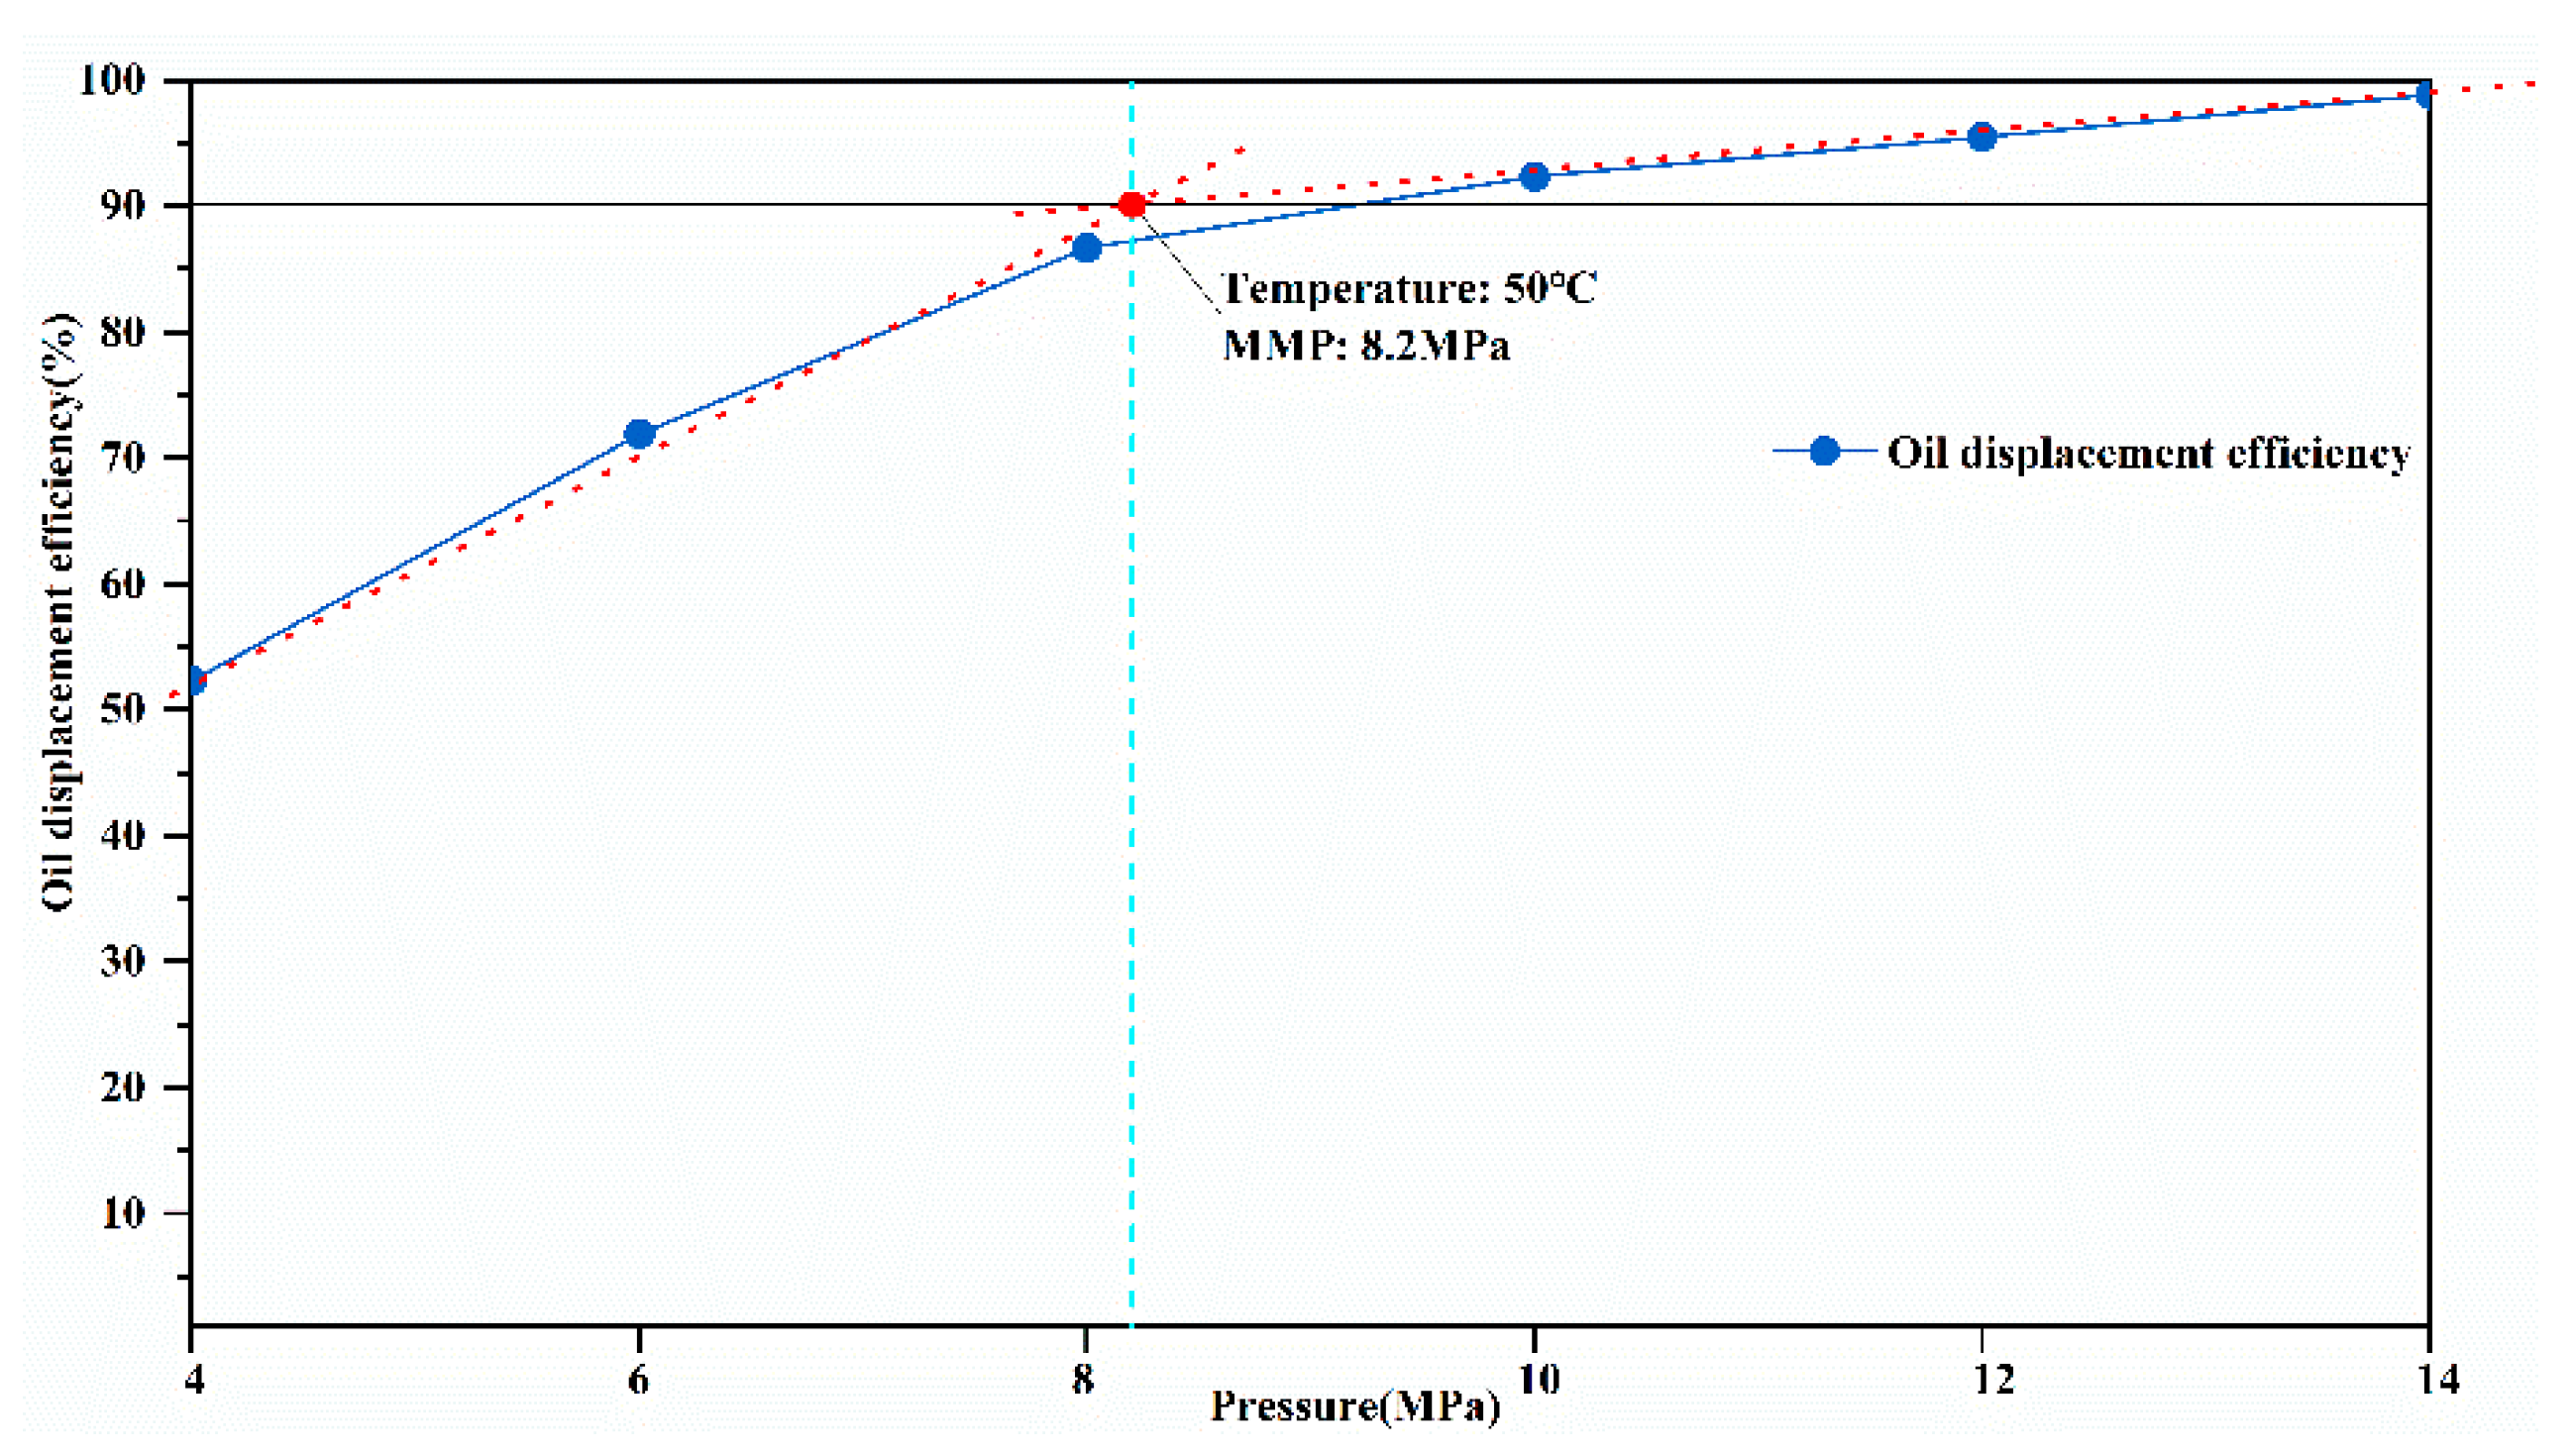
Control the back pressure to 8.5 MPa, inject CO2 at a constant pressure of 9.5 MPa from the injection side of the model, control the pressure difference to be about 1 MPa, and carry out oil at the production side.
(4)
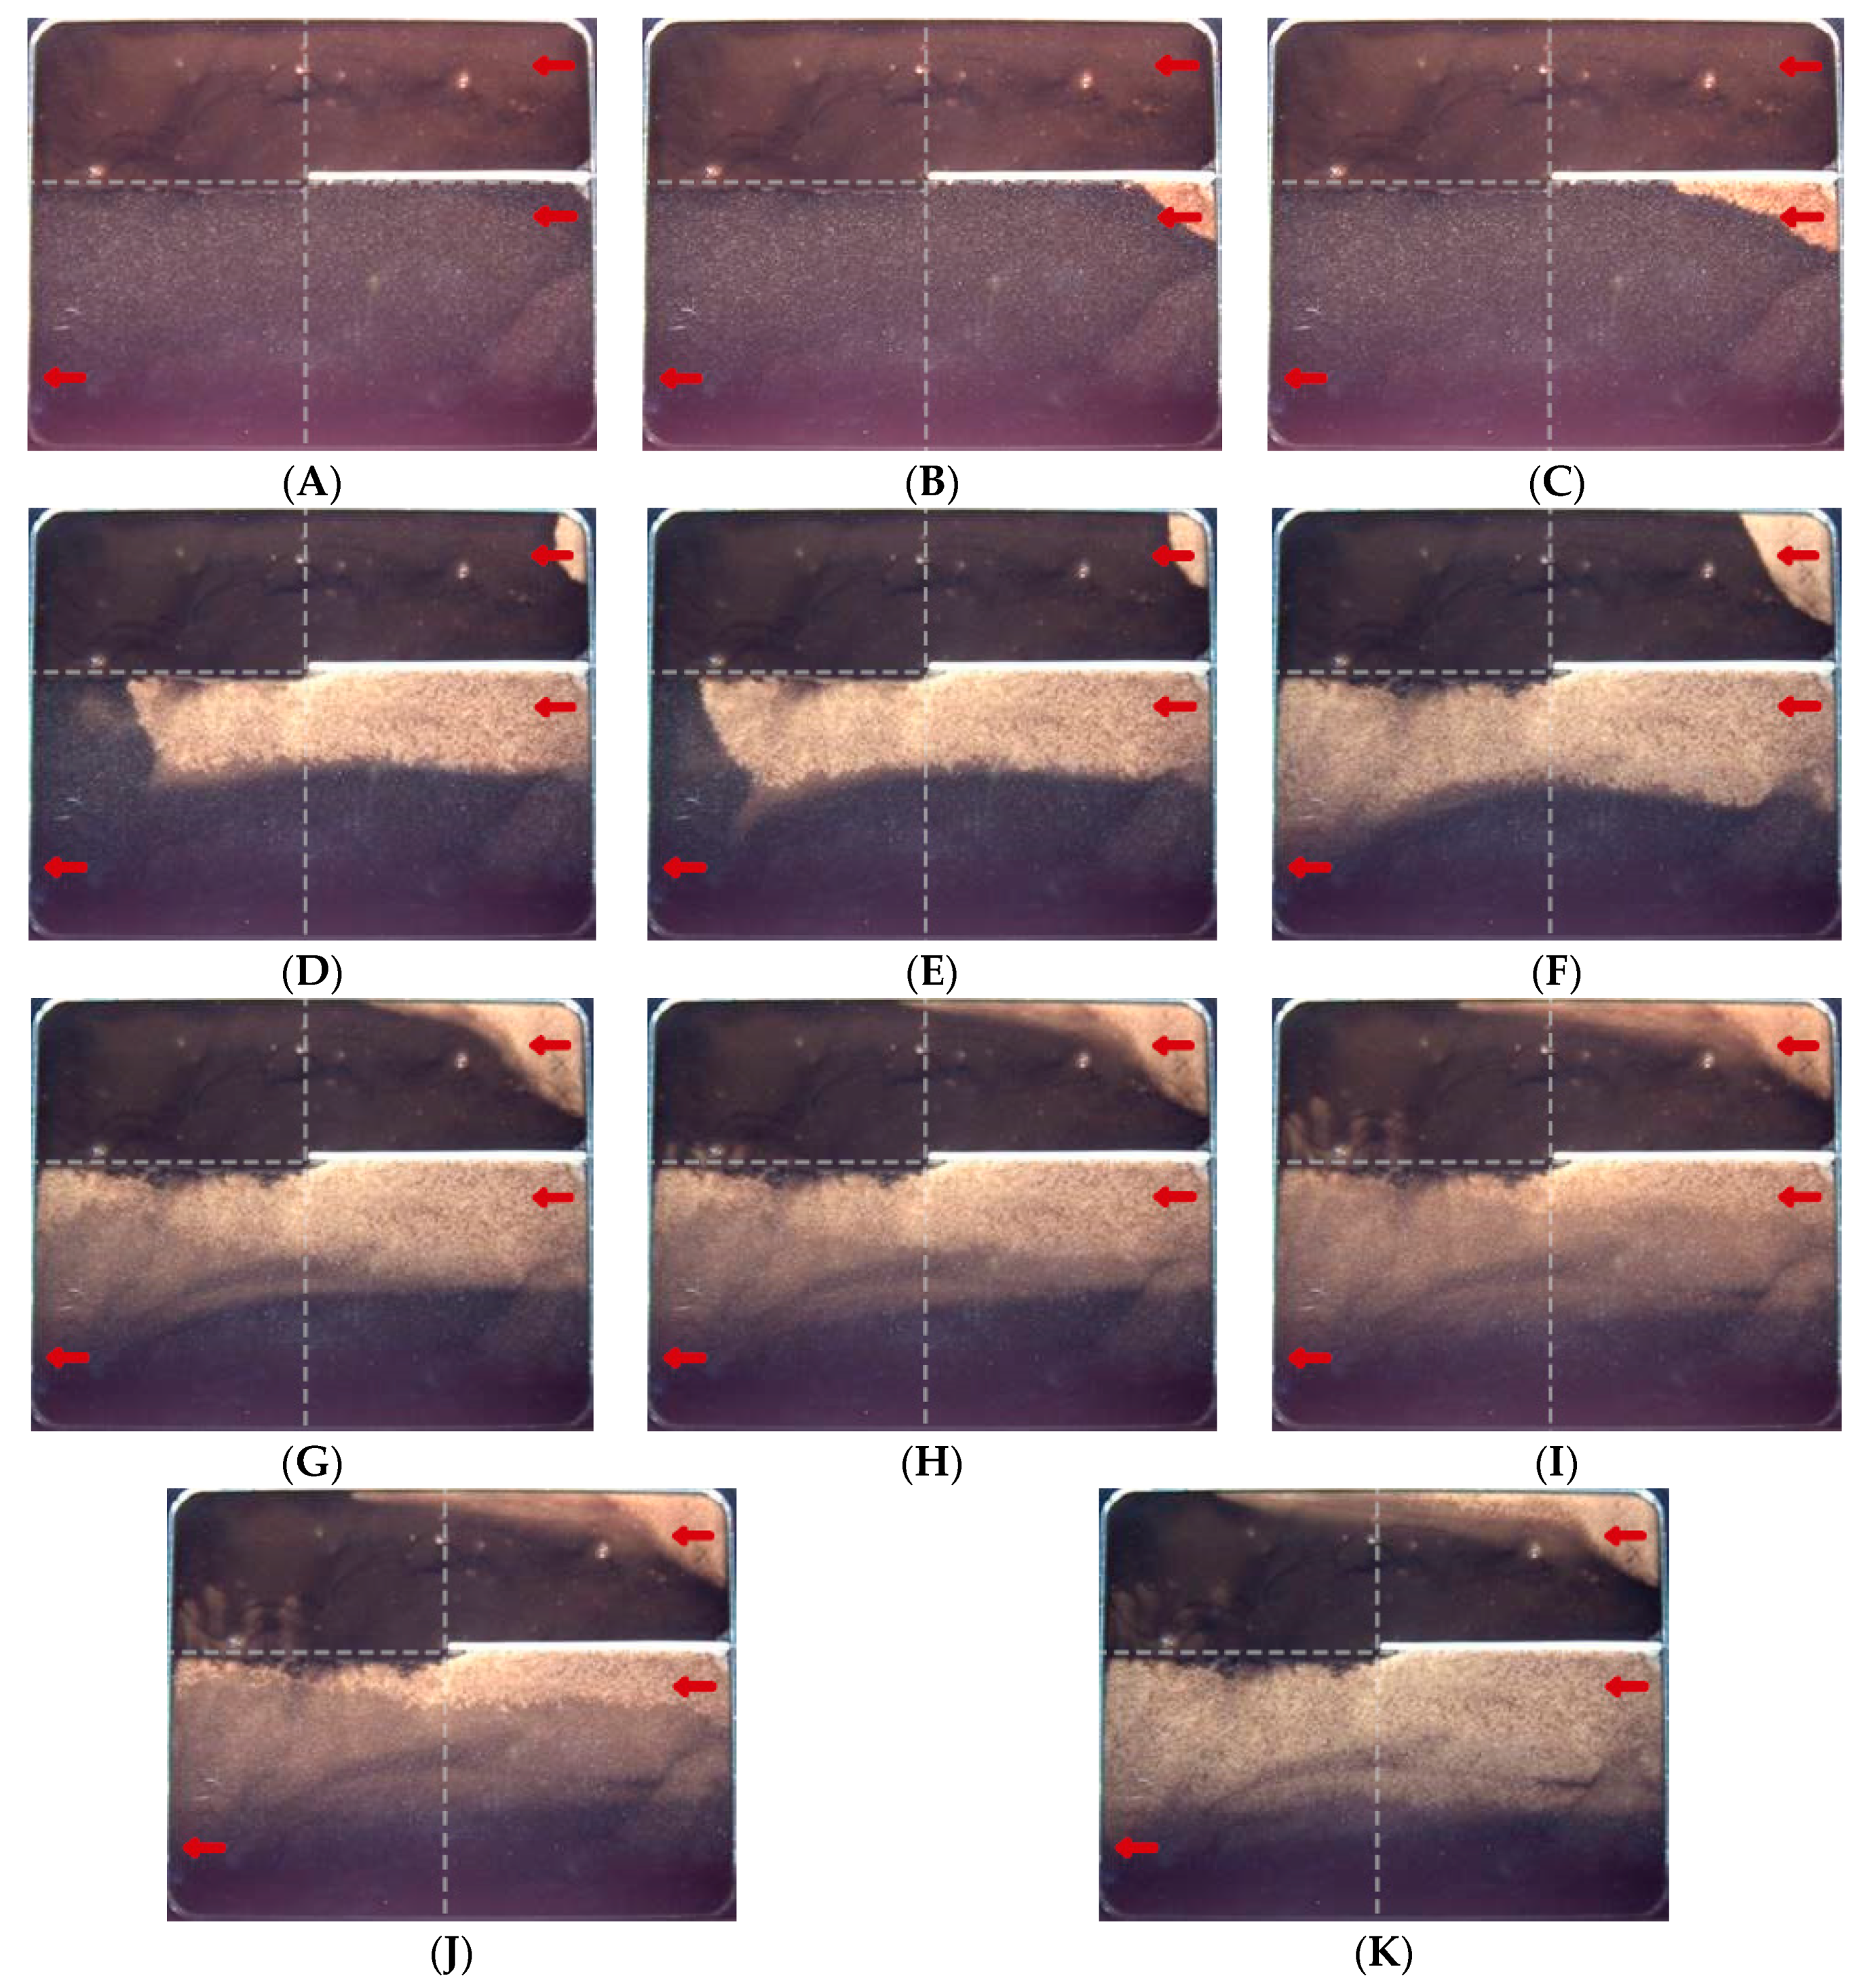
During the entire displacement process, the displacement process was photographed and recorded at a non-uniform time interval of every 5–120 s. Measure the produced volume of simulated oil and CO2 at certain time intervals.
(5)
By visualizing the dynamic displacement process and the degree of oil and gas recovery, it was judged that when the gas–oil ratio was maintained at a high level or no more oil was produced, the experiment was terminated.

3. Experimental Results and Analysis

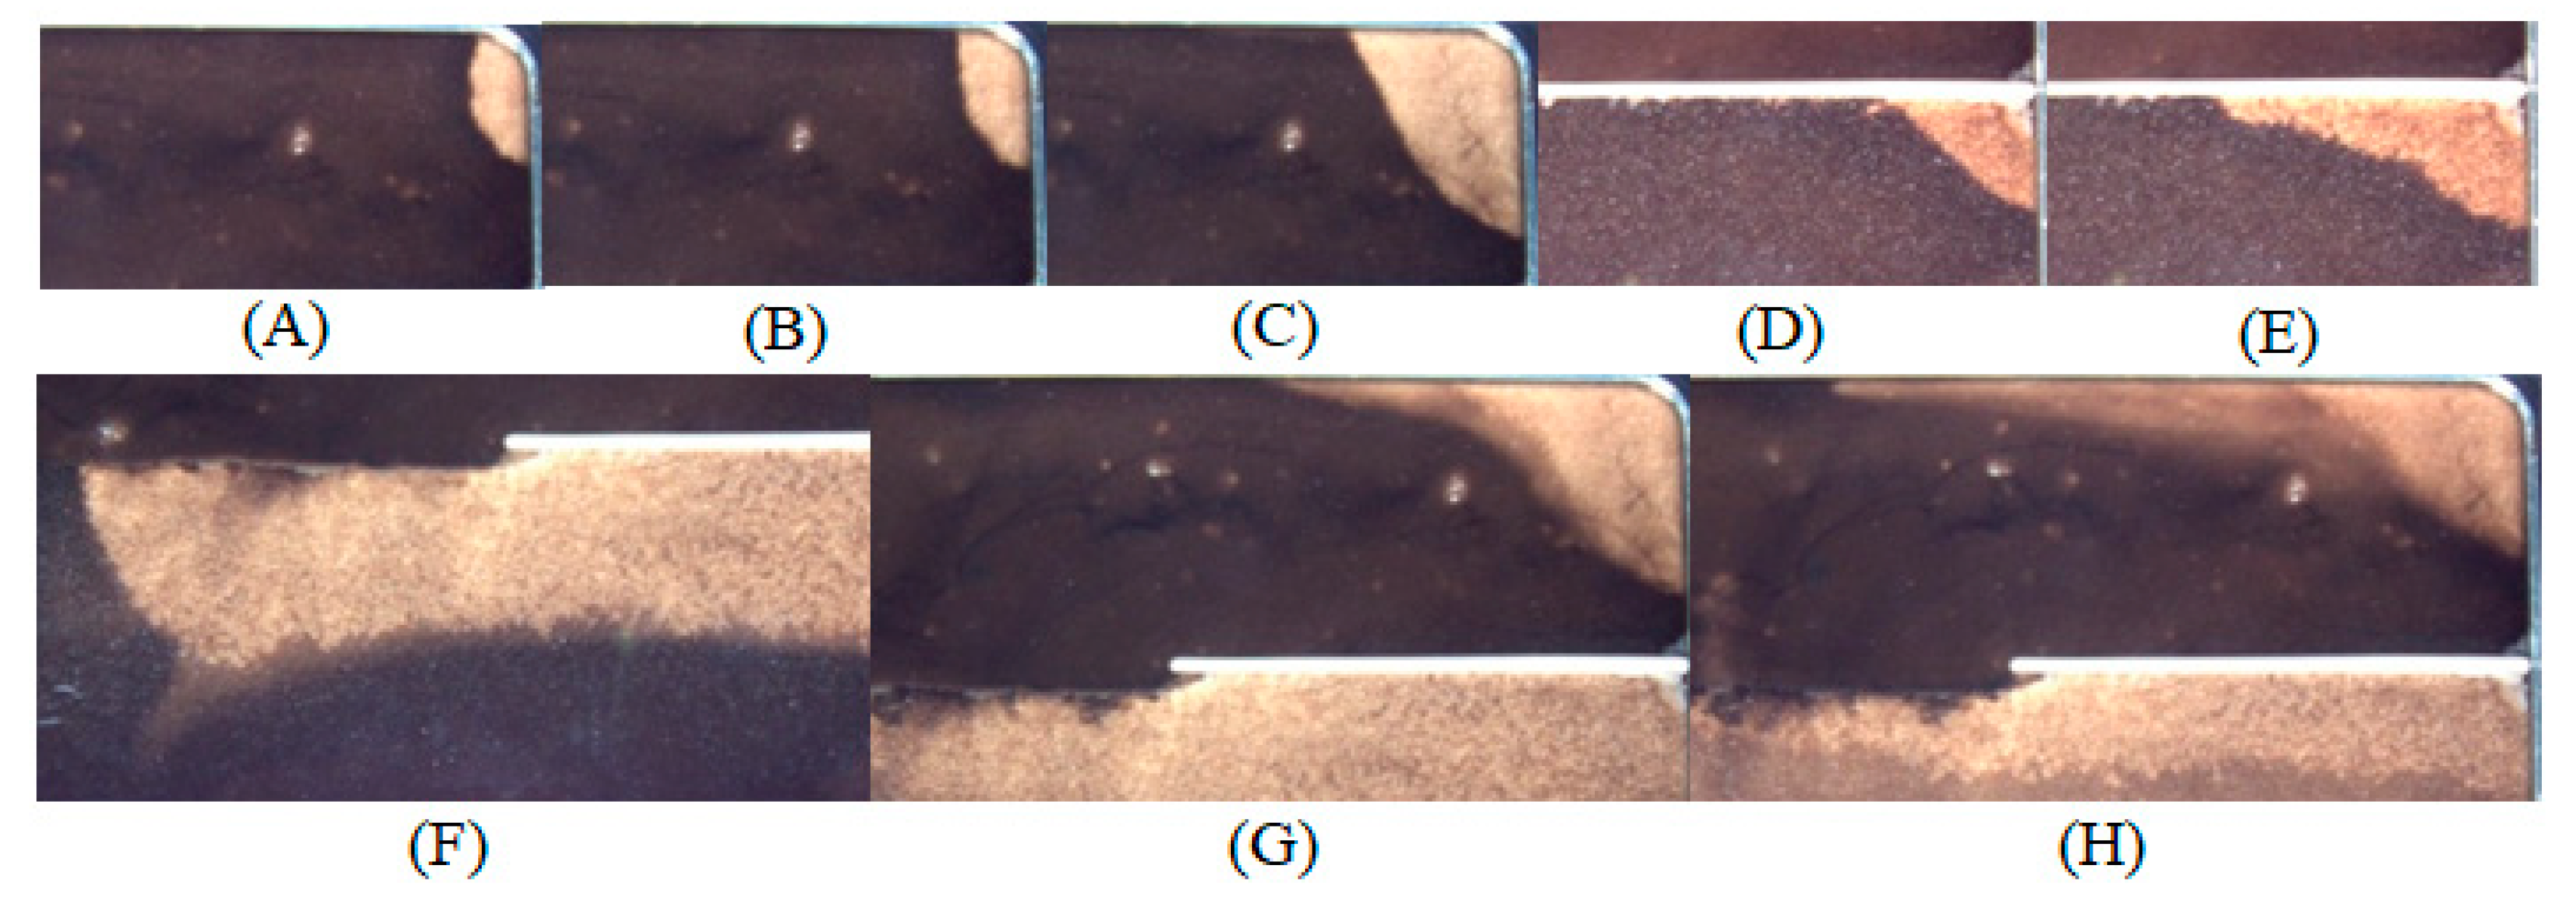
3.1. CO2 Dynamic Miscible Flooding

The darker area shown in Figure 5 indicates the oil-layer area, and the relatively lighter area denotes the sweep area of the CO2 miscible flooding. It is established that the thickness and permeability of a reservoir are the intrinsic control factors affecting its gas absorption capacity [20]. In this experiment, both layers were ultra-low permeability reservoirs with a permeability contrast of 10 and thickness contrast of 2. Thus, they were positive-rhythm reservoirs with significant vertical heterogeneity. In addition, the injection-production mode of “united injection and single production” directly led to an obvious difference in the displacement power of the high- and low-permeability layers. Therefore, under the combined influence of internal and external control factors that included the reservoir thickness, permeability, and injection-production mode, the gas absorption capacity of the high-permeability layer was much greater than that of the low-permeability layer.
In the early stage of displacement, as shown in Figure 5A–D, because of the difference in the gas absorption capacities of the layers, CO2 was first injected into the high-permeability layer. Simultaneously, under the gravitational differentiation and shielding effect of the interlayer on the vertical oil and gas migration, the oil–gas interface in the high-permeability layer changed rapidly, the gravity override phenomenon was obvious, and the crude-oil utilization degree was good. In contrast, the low-permeability layer exhibited a smaller gas absorption capacity, resulting in a weak displacement power, slow oil and gas migration speeds, and slow interface changes.
As shown in Figure 5D–F, the gravity override of the high-permeability layer was continuously enhanced, and gas breakthrough was rapidly achieved. After the gas breakthrough, the displacement power of the overall reservoir was enhanced, the gravity override continued to expand the sweep area, and the oil and gas migration speeds improved. However, because of the fundamental influence of the gas absorption capacity, when the gas preferential pathway was formed, more than half of the oil layer in the high-permeability layer was effectively completely displaced, and there was only a certain area where the remaining oil was distributed in the non-displacement area at the bottom (Figure 6). In comparison, a large amount of the remaining oil was retained in the low-permeability layer. But, under the advantage of miscible flooding, the bottom oil layer on the left side of the low-permeability layer that was not shielded by the interlayer could come into contact with the CO2 in the high-permeability layer, which led to mutual dissolution and mass transfer, allowing it to migrate to the high-permeability layer and be carried and produced by the CO2 (Figure 7).
As shown in Figure 5F–I, after the formation of the gas preferential pathway, a large amount of CO2 occupied the pores of the reservoir, resulting in the weakening of the overall displacement power, and the displacement mode was dominated by miscible mass transfer. The remaining oil in the high- and low-permeability layers was fully in contact with the CO2, which led to mutual dissolution and mass transfer, forming a miscible zone with obvious miscible characteristics and a gradually expanding distribution range (Figure 8). In addition, owing to the large difference in oil and gas densities, a fingering phenomenon could easily form inside the reservoir during the miscible mass transfer (Figure 9).
In the late stage of miscible flooding, as shown in Figure 5J,K, in order to observe the overall migration trend after the formation of the large-area miscible zone, the outlet valve was adjusted by increasing the oil production rate. The miscible zone in the high-permeability layer was rapidly carried and produced by the CO2, the migration of the oil–gas interface in the low-permeability layer changed, and the fingering phenomenon at the bottom was interrupted. Finally, there was a small amount of remaining oil distributed at the bottom of the high-permeability layer, whereas almost all of the oil in the low-permeability layer was not effectively displaced. In addition, a comparison of Figure 5F,K clearly shows that under the action of the miscible mass transfer, the sweep efficiency of the remaining oil in the high-permeability layer was significantly improved. Therefore, for the high-permeability layer, miscible mass transfer could be used to mobilize the remaining oil in the bottom layer to form a large-area miscible zone and expand the sweep area. For the low-permeability layer, owing to its smaller gas absorption capacity and insufficient displacement power, the remaining oil was difficult to displace and produce. It could only come into full contact with the CO2 in the high-permeability layer for mass transfer and slowly migrate to the high-permeability layer to be carried and produced by the CO2; however, this process requires a long production time. Therefore, it was difficult to achieve efficient production of the remaining oil in the low-permeability layer under the injection-production mode of “united injection and single recovery”.
In addition, by estimating the size of the lighter-colored sweep area in Figure 5, the proportions of the gas absorption ranges for the high- and low-permeability layers in the total reservoir space could be roughly determined, as listed in Table 1. In the different displacement stages, there was a large difference in the inspiratory volume proportions of the two layers.

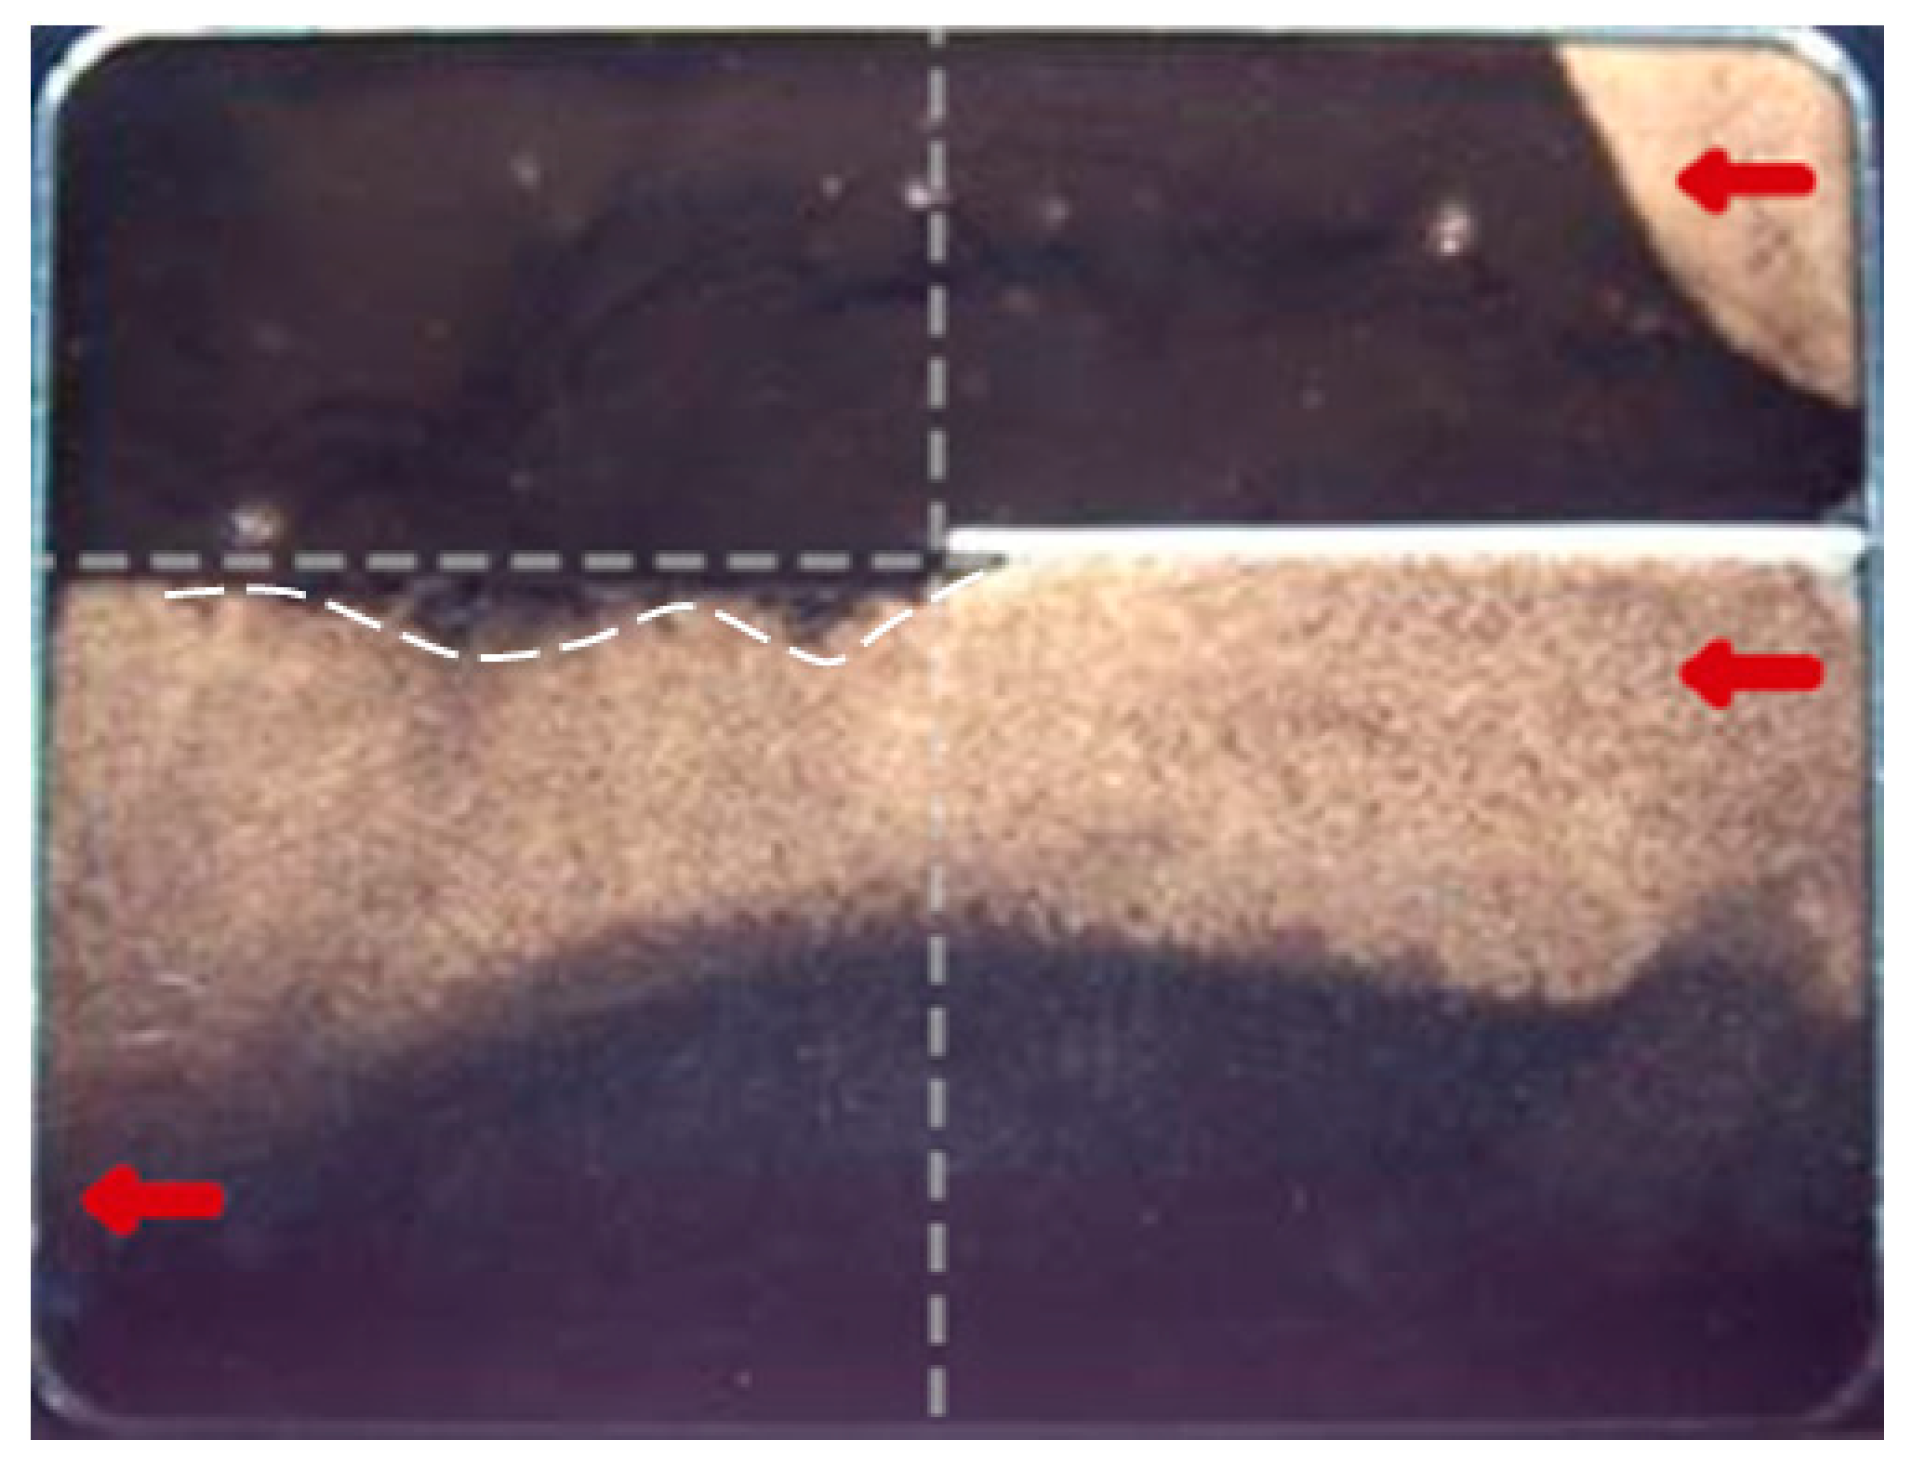
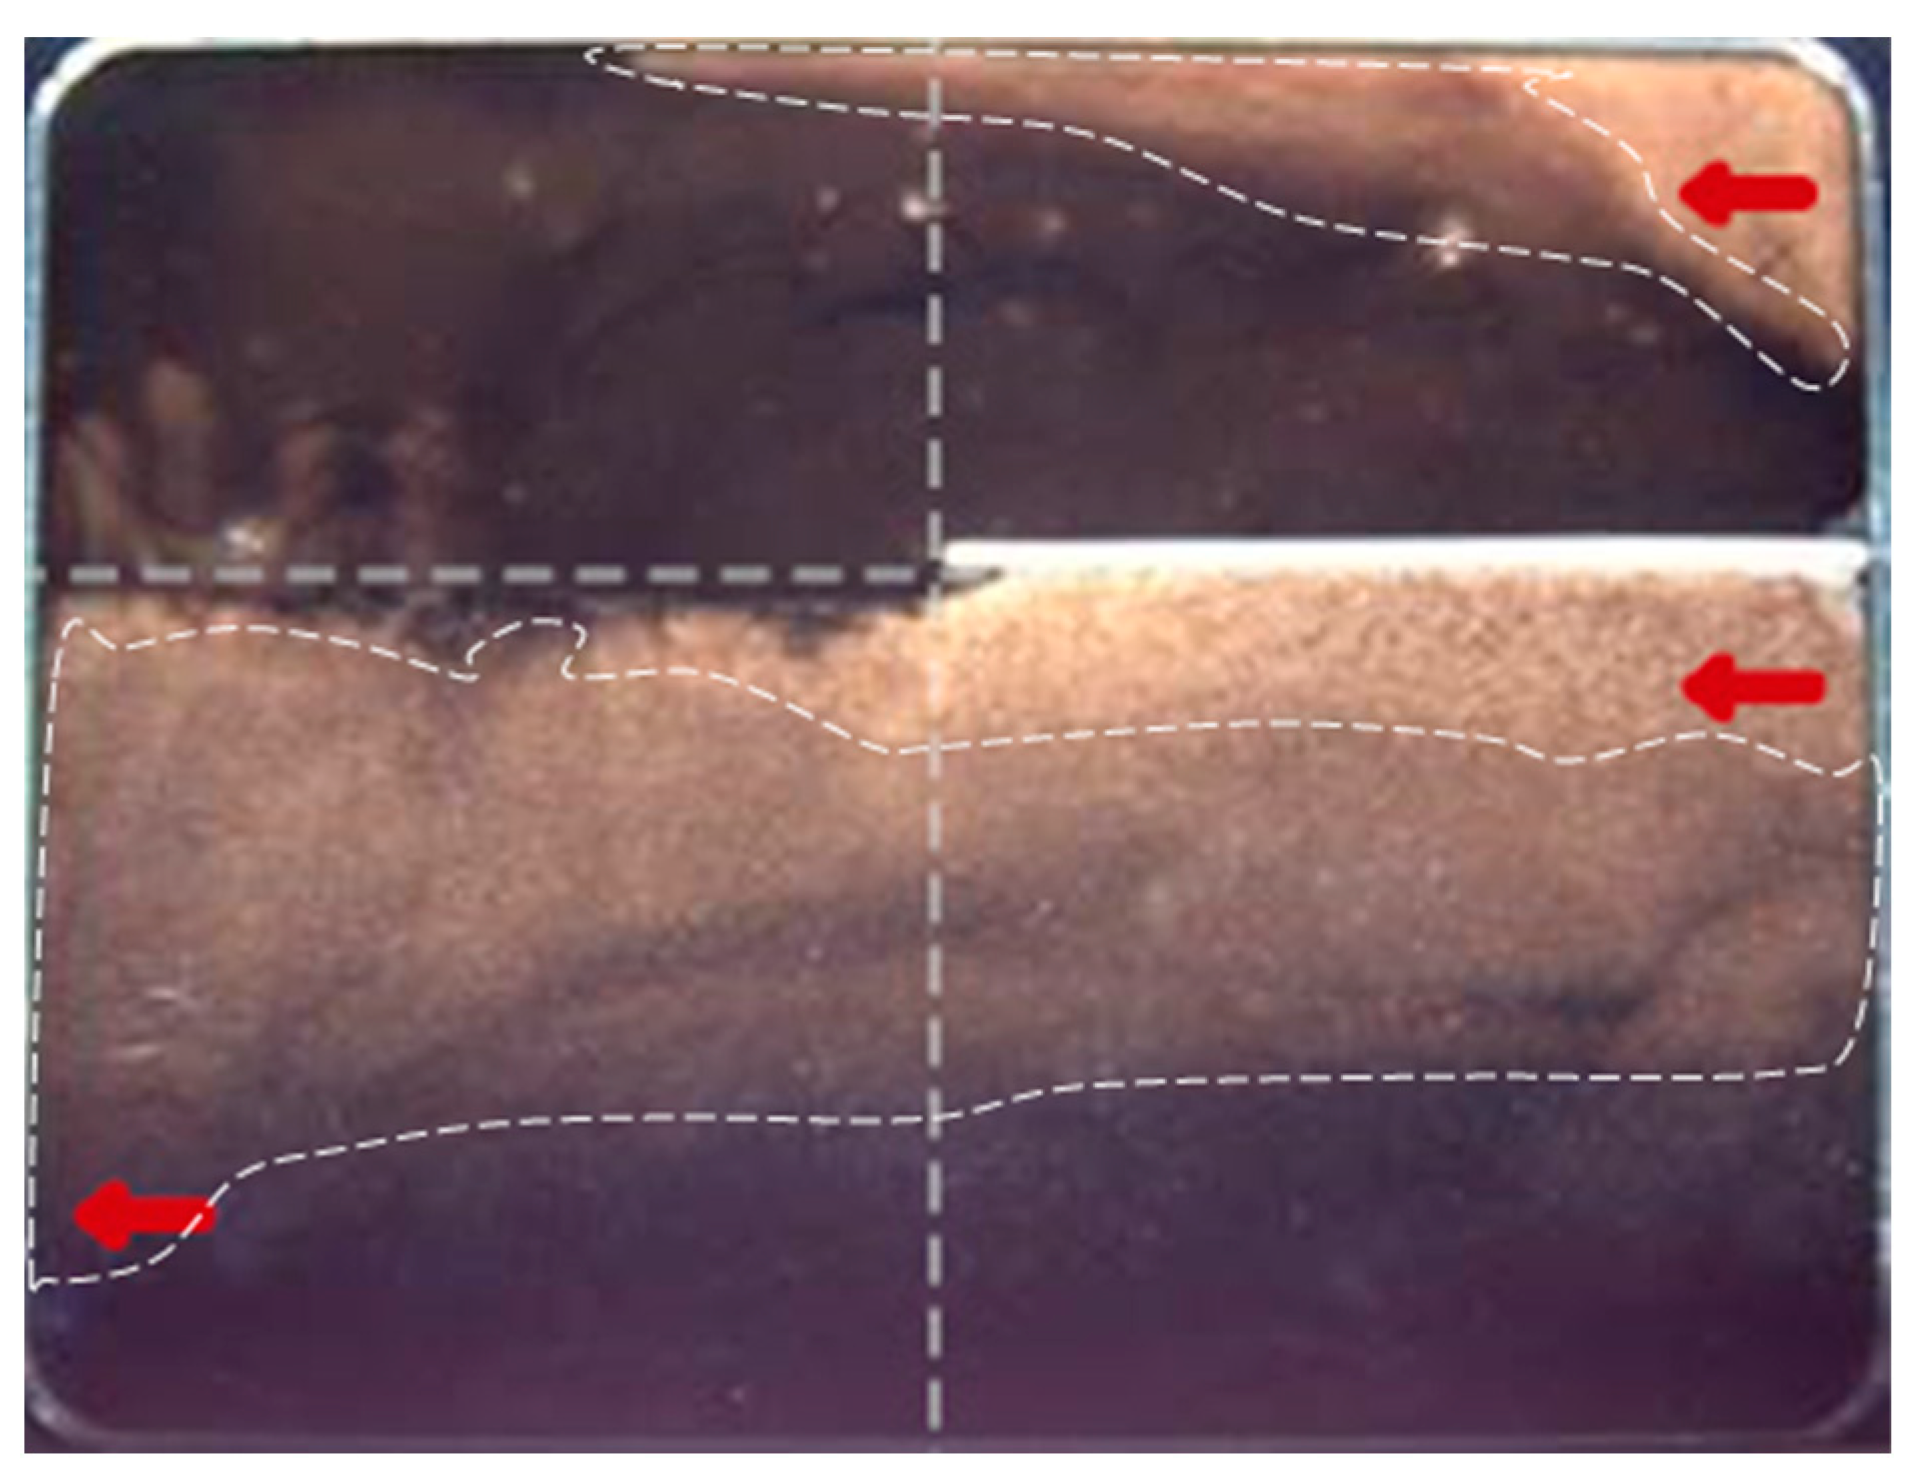
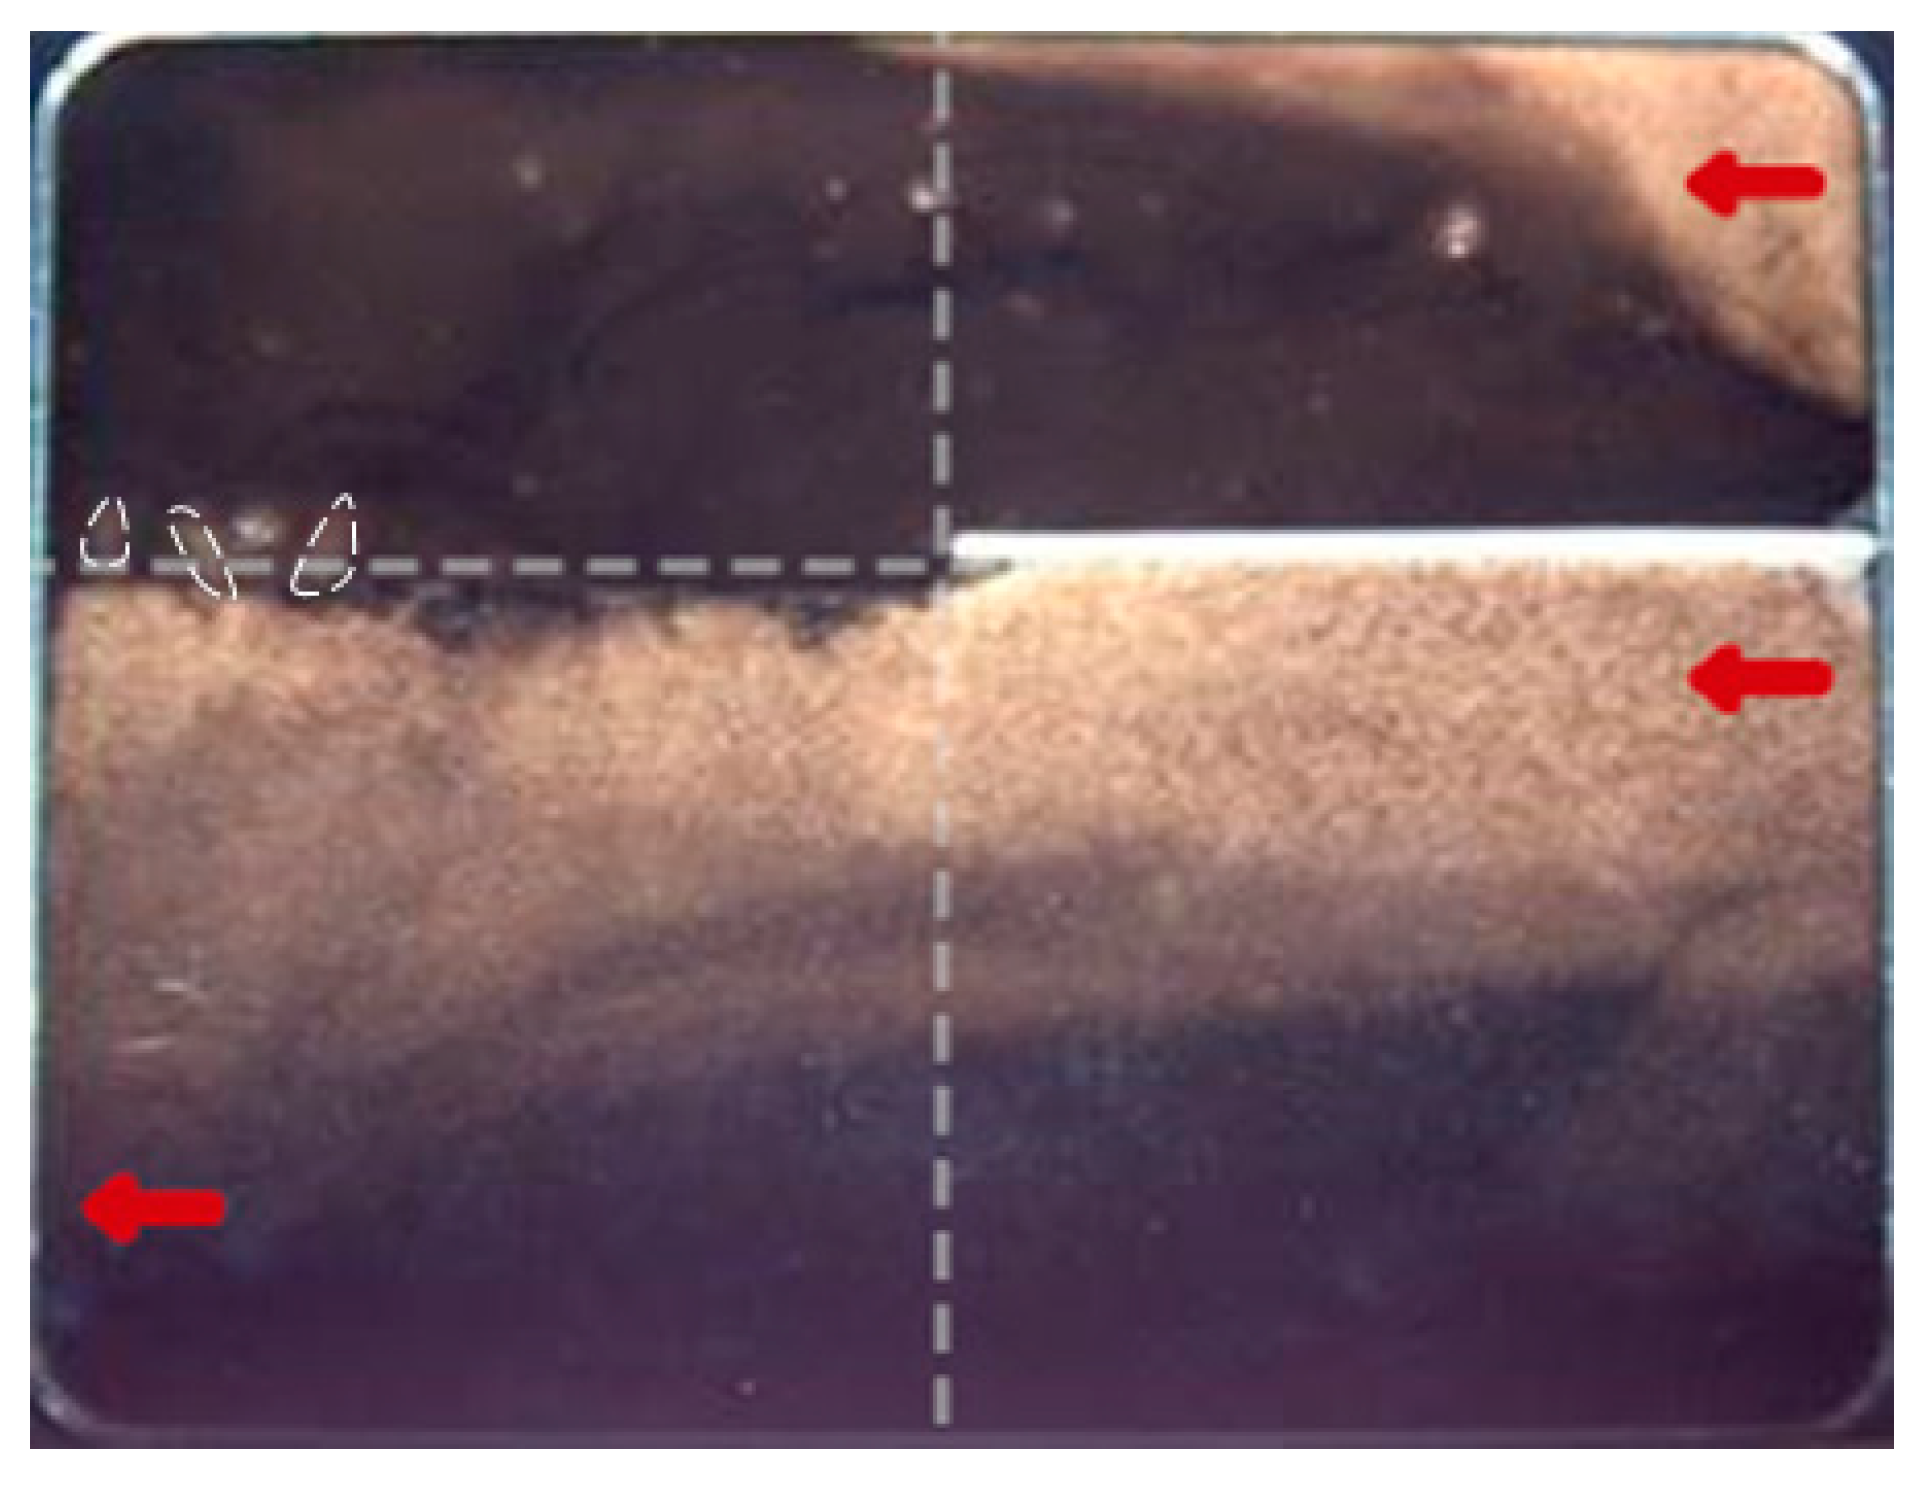
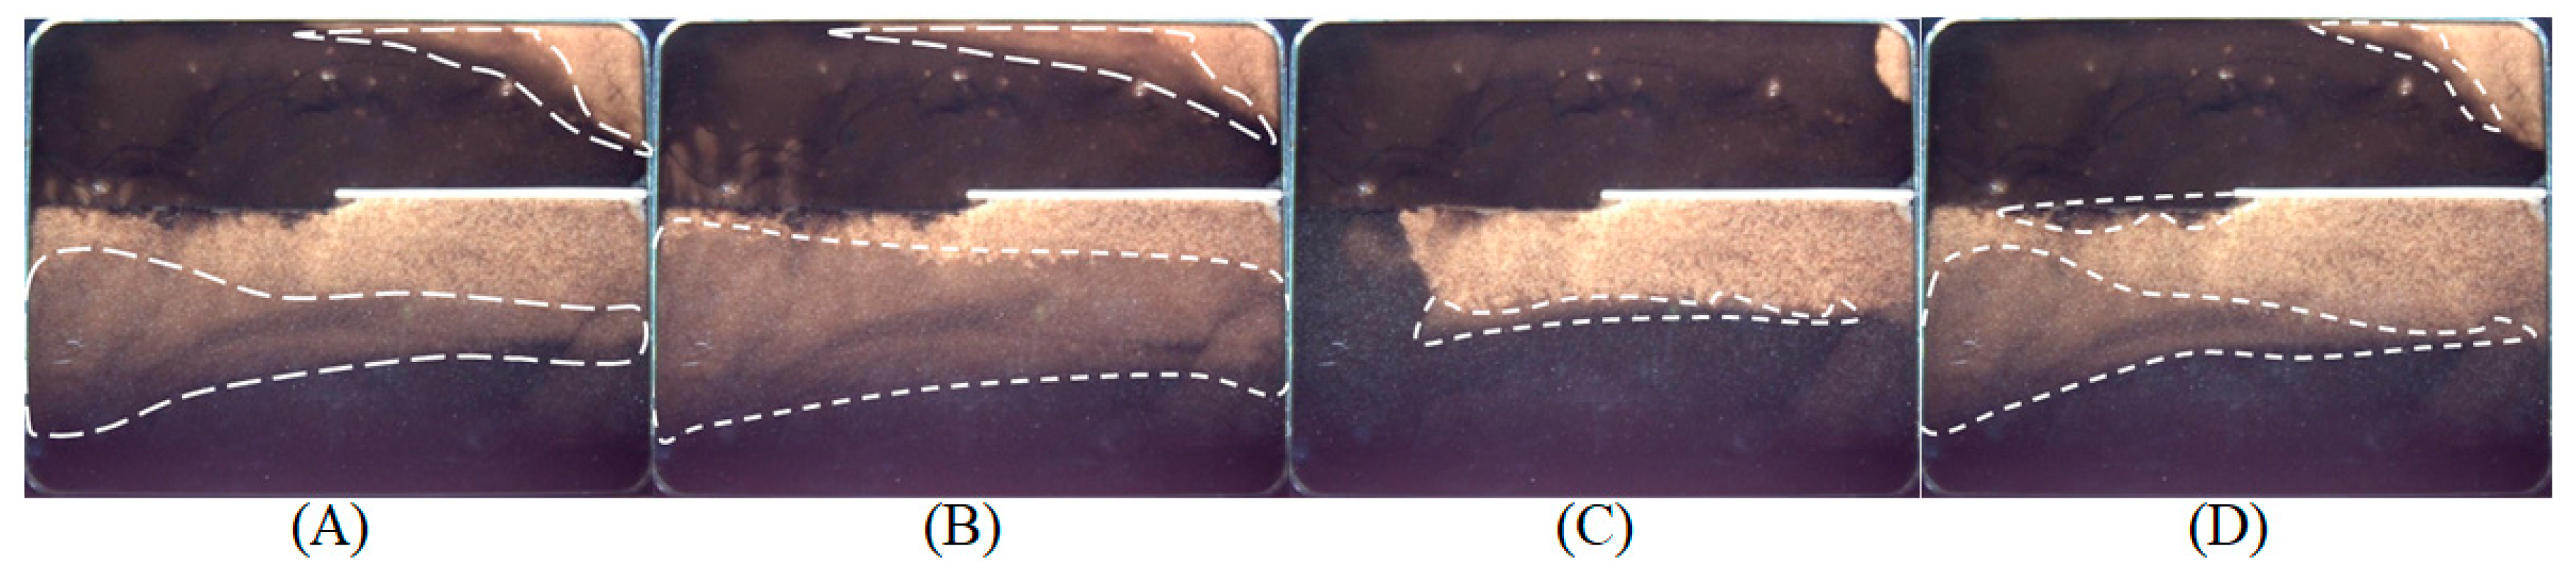
3.1.1. Migration Characteristics of Oil–Gas Interface

By comparing and observing the characteristics of oil–gas interface migration in high- and low-permeability layers, it could be judged that the gas absorption capacity of the reservoir and gravitational differentiation were the key factors affecting the migration and change of oil–gas interface. With the CO2 injection, a semicircular gas cap would be formed first. After the gas cap was formed, the oil–gas interface migrated stably under the actions of gas cap expansion and gravitational differentiation (Figure 10A,B). When shielded by the interlayer or wall, the oil–gas interface developed into a tongue-shaped slope, and continued to migrate in the form of slope expansion under the effect of gravitational differentiation (Figure 10C,E). Subsequently, the change of oil–gas interface was mainly controlled by the gas absorption capacity of the reservoir. When the gas absorption capacity of the reservoir was greater, the oil–gas interface rapidly developed from a tongue-shaped slope to a long column with a slightly inclined front interface and a tip, where the tip pointed to the outlet (Figure 10E,F). On the contrary, the oil–gas interface slowly developed from a small tongue-shaped slope to a large slope with a finger-like front (Figure 10G,H). This was due to the poor gas absorption capacity, weak gravitational differentiation, and large difference in oil and gas viscosities, resulting in slow migration speed of oil and gas and slow change of oil–gas interface, and it was easy to form the fingering phenomenon that developed in the horizontal direction at the front end of oil and gas contact.

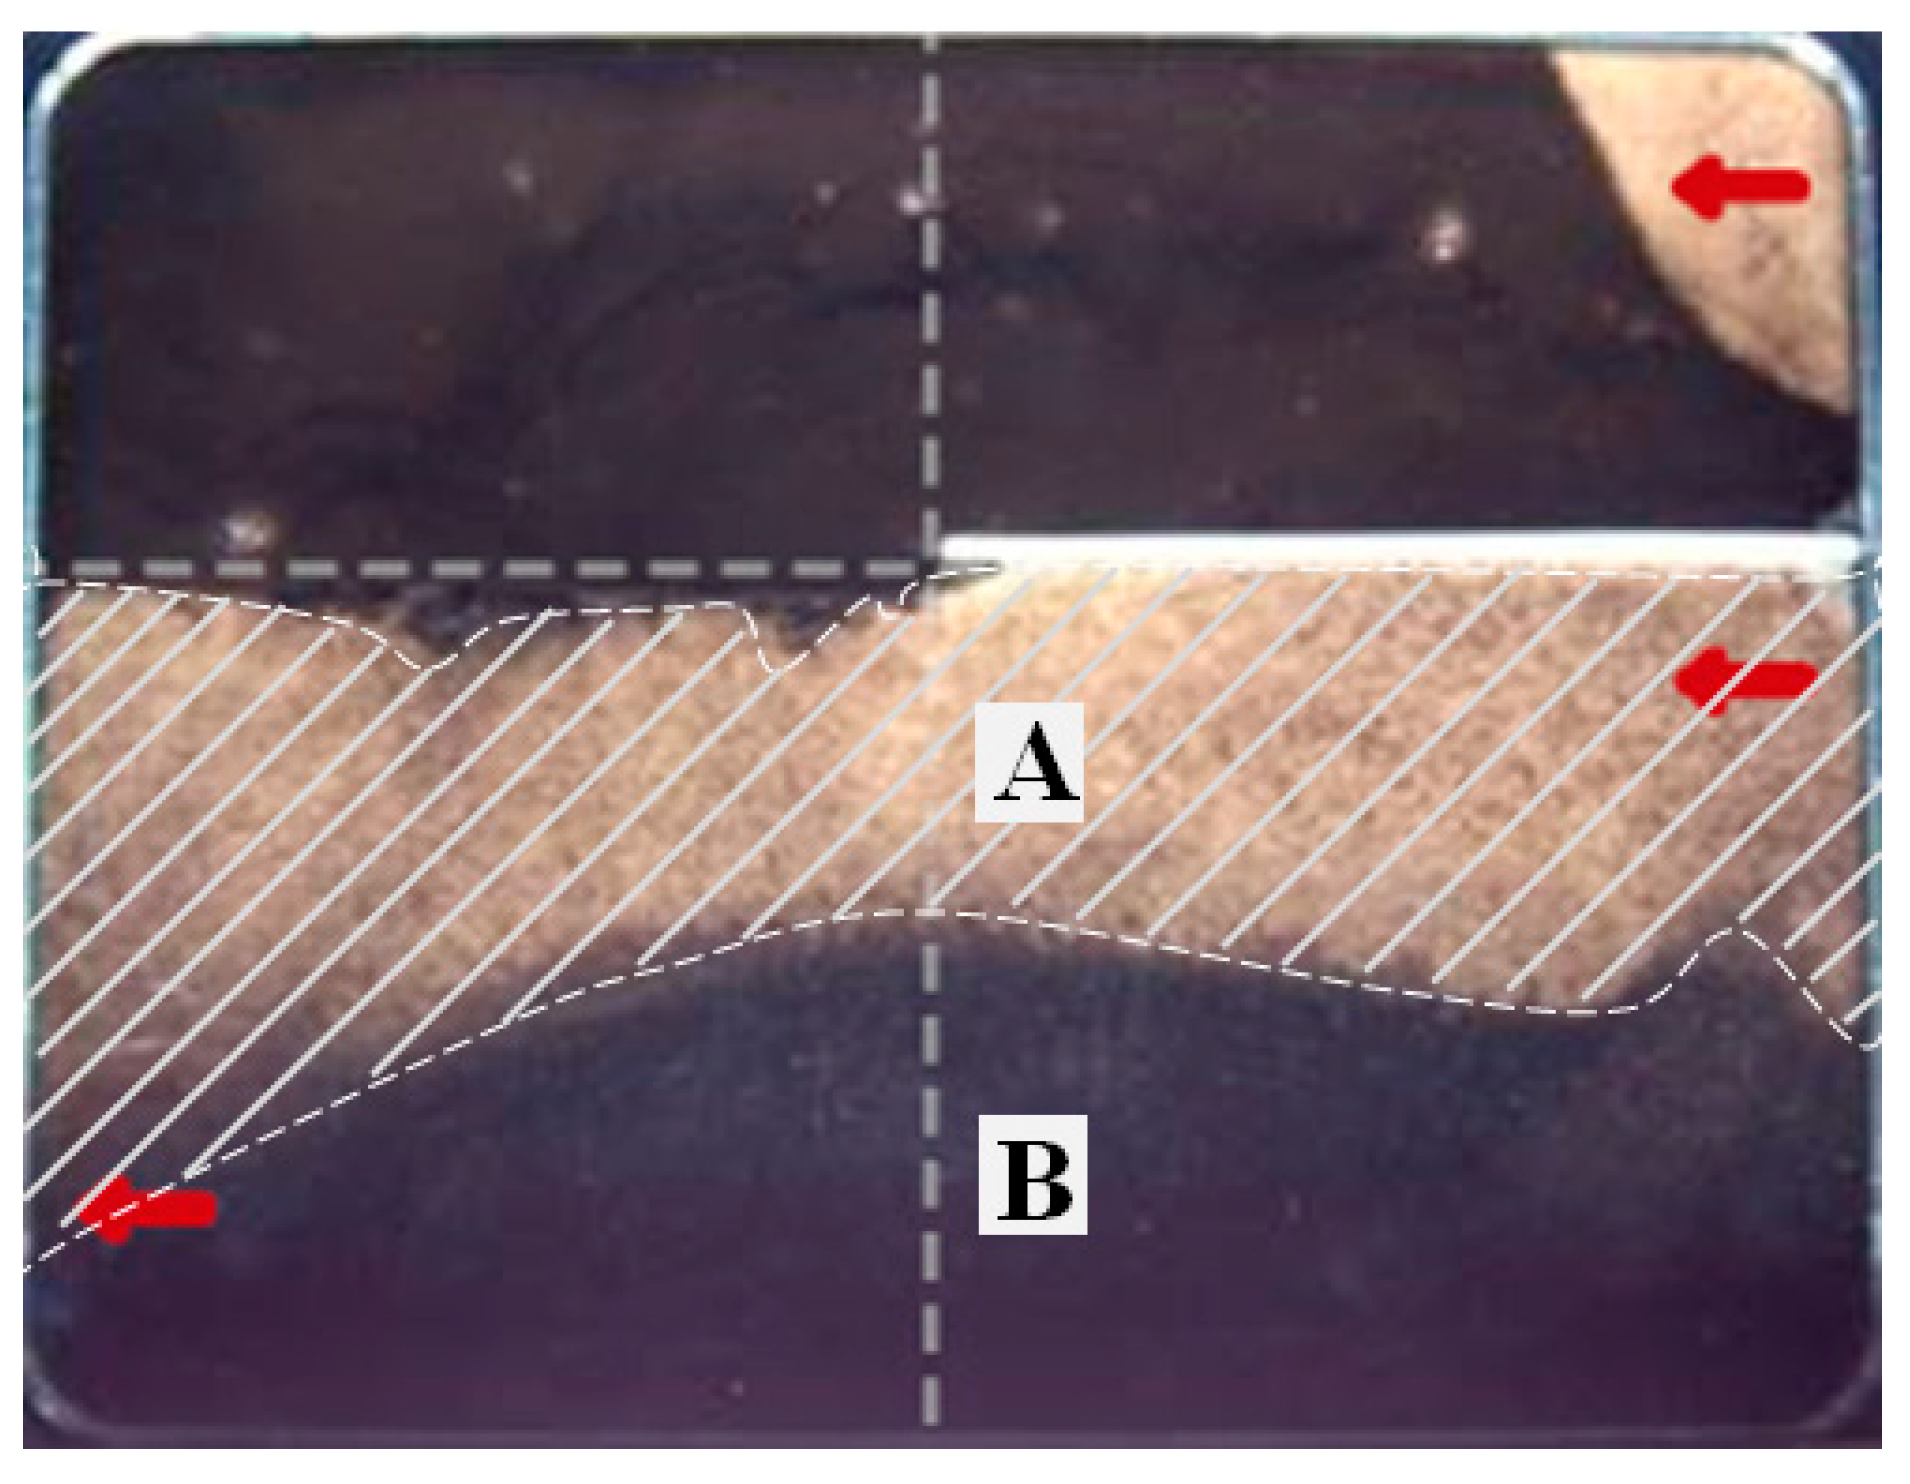
3.1.2. Distribution Characteristics of Miscible Zone

The formation and distribution characteristics of the miscible zone were mainly related to the miscible mass transfer and displacement power. From the whole process of CO2 miscible flooding, it could be found that there was a miscible zone with a lighter color than the oil layer at the contact position of oil and gas, and the oil–gas interface was no longer obvious with the expansion of the miscible zone. The color of the miscible zone also became darker with the enhancement of the miscible mass transfer between oil and gas (Figure 11A,B). Among them, when the displacement power was greater, the displacement was the main. The effect of miscible mass transfer was weaker at this stage, resulting in a slow formation speed of the miscible zone with a small distribution range, and only existed in contact parts of the oil and gas. As the displacement progressed, it was rapidly displaced by CO2. When the displacement power was weaker, the mutually soluble mass transfer between oil and gas could be fully exerted in the miscible state, the remaining oil efficiently produced, the sweep efficiency improved, and the distribution characteristics of the miscible zone developing in multiple directions could be formed, as shown in Figure 11C,D).

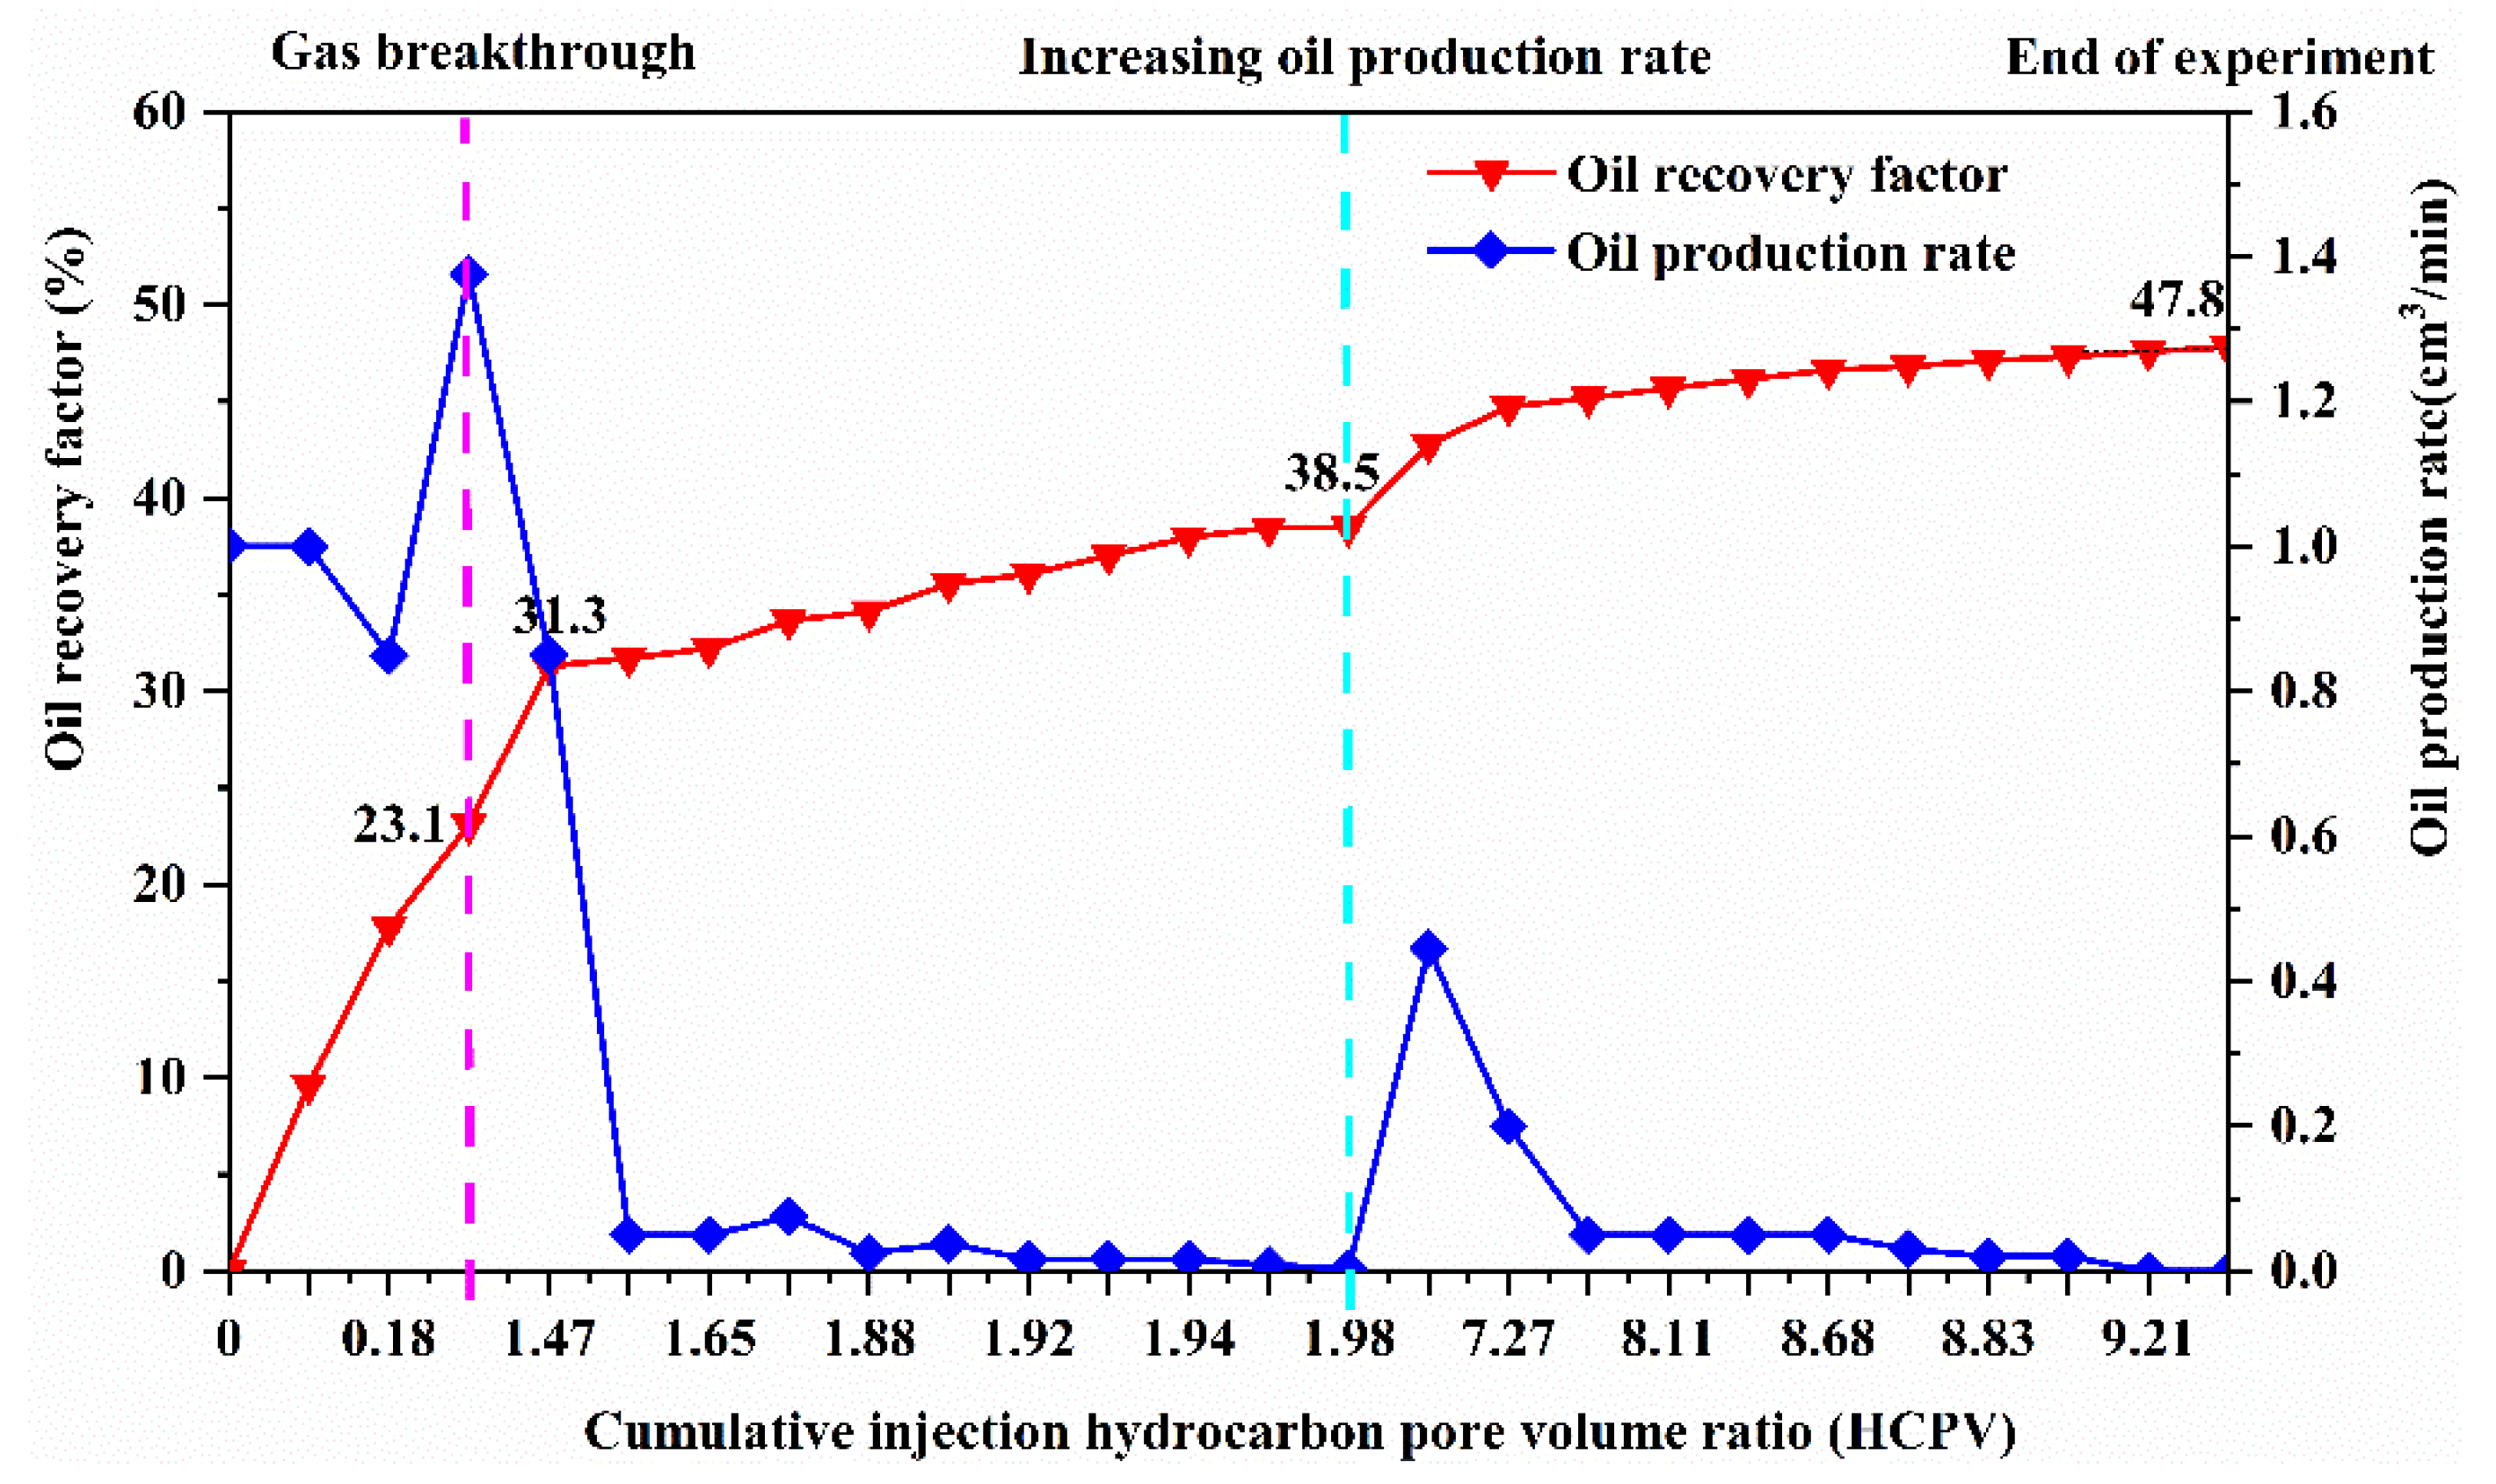
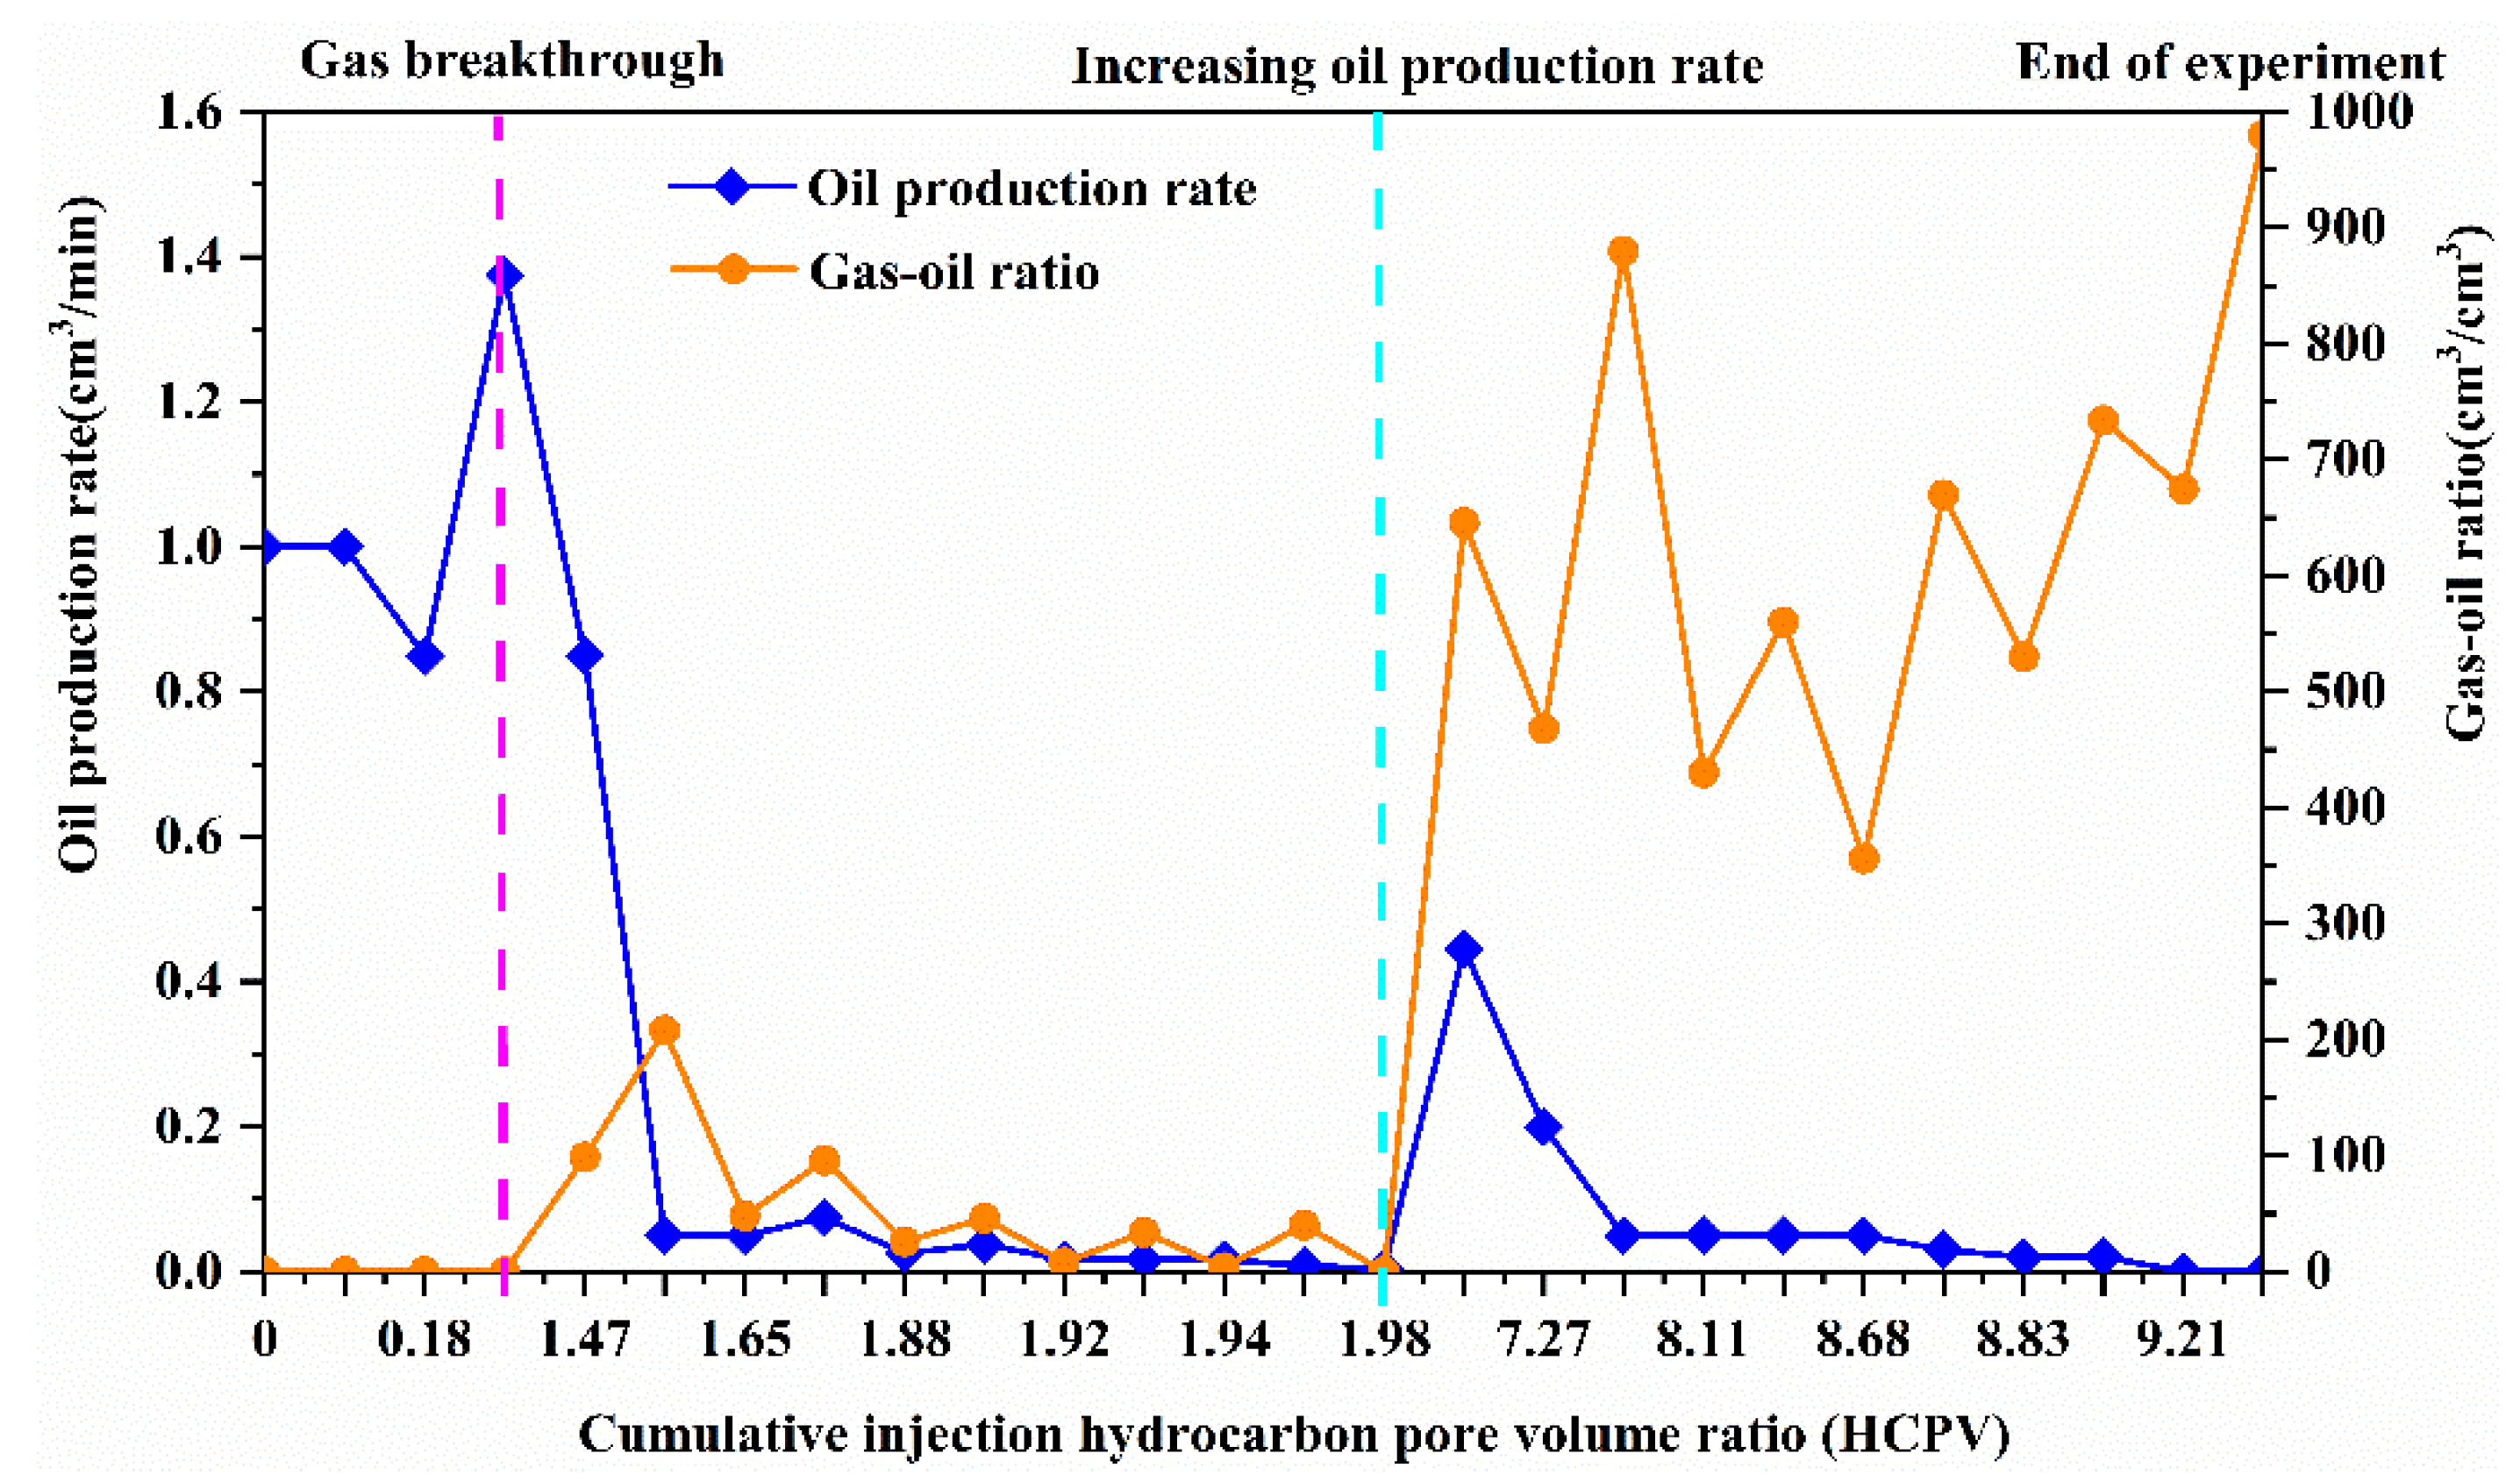
3.2. Oil Displacement Effect of CO2 Miscible Flooding

The oil displacement effect of CO2 miscible flooding in this experiment were comprehensively analyzed based on the sweep characteristics of dynamic CO2 flooding, combined with the changes in the oil recovery factor, gas–oil ratio, and oil production rate. As shown in Figure 12 and Figure 13, the entire displacement process could be divided into three stages: the gas-free rapid oil production, low gas–oil ratio stable oil production, and high gas–oil ratio slow oil production stages.
The process from CO2 injection to gas breakthrough involved rapid oil production without the gas, which was dominated by the displacement. As shown in Figure 12 and Figure 13, the oil production rate in this process was relatively high, and the oil recovery factor showed a rapid growth trend. When gas breakthrough occurred, the oil recovery factor was 23.1%, while the total gas injection volume was 0.23 HCPV, the growth amplitude was 100.4%/HCPV, and the oil displacement effect was better. Combined with Figure 5A–E, it can be observed that this process was affected by the difference in the gas absorption capacity of the reservoir, and the displacement range of the high-permeability layer with its significant gas absorption capacity expanded rapidly, which was consistent with the curve change characteristics.
The stage of stable oil production with a low gas–oil ratio occurred from the gas breakthrough to before the increase of oil production rate. It was caused by the combined actions of the displacement and miscible mass transfer. As shown in Figure 12 and Figure 13, after the gas breakthrough, there was an obvious turning point in the curve of the oil recovery factor when the injection volume was 1.47 HCPV and the oil recovery factor was 31.3%. Combined with Figure 5E–G, it can be observed that after the gas breakthrough to the formation of the gas preferential pathway, the displacement range of the entire reservoir further expanded, and the change in the sweep range of the entire reservoir obviously slowed down after the formation of the channel. Therefore, it could be determined that the turning point was the point where the gas preferential pathway formed. From this turning point to before the increase of oil production rate, the oil production rate and gas-oil ratio fluctuated and decreased, the growth amplitude of the oil recovery factor was 14.1%/HCPV, and the oil displacement efficiency decreased significantly. Combined with Figure 5G–J, it can be concluded that this was caused by the miscible mass transfer. After the formation of the gas preferential pathway, a large amount of CO2 occupied the pores of the reservoir, the displacement power weakened, and the displacement mode changed, with the miscible mass transfer as the main factor and displacement as a supplementary factor. The miscible zone began to form, and its range gradually expanded.
After the oil production rate increased, it is the stage of slow oil production with high gas–oil ratio, which is dominated by the effect of CO2 carrying. As shown in Figure 12 and Figure 13, after the increase of oil production rate, the gas–oil ratio and oil recovery factor increased sharply, and the amount of CO2 injected also increased to approximately 7 HCPV. It could be determined that once the oil production rate increased, the miscible zone would be rapidly carried out by a large amount of CO2. Subsequently, owing to the lower amount of remaining oil, the overall gas–oil ratio increased, mass transfer became weaker, and exchange scale between the oil and gas became smaller. The remaining oil was carried and produced only by high-speed CO2, and the oil production rate decreased to zero. The final recovery factor was 47.8%, and the total injection volume at this stage was 7.47 HCPV, with a growth amplitude of 1.3%/HCPV. The oil displacement effect was poorer.
In addition, as shown in Figure 5K, there was a large amount of remaining oil distributed in the low-permeability layer and a small amount at the bottom of the high-permeability layer, but the final recovery factor was 47.8%. Thus, high-efficiency displacement and a sweep of the oil layer in the high-permeability layer were achieved, giving full play to the advantages of CO2 miscible flooding.

4. Conclusions

In this study, a 2D double-layer heterogeneous visualization model was designed. Based on this model, a physical simulation experiment involving CO2 miscible flooding was conducted by adopting an injection-production mode of “united injection and single production”, which highlighted the significant vertical heterogeneity of ultra-low permeability reservoirs. The characteristics of CO2 dynamic miscible flooding were comprehensively analyzed, and combined with the oil displacement effect, the sweep law of CO2 miscible flooding in the heterogeneous reservoir of Jilin was thoroughly studied. The main conclusions are summarized as follows.
(1)
Under the combined influence of internal and external control factors, which included the reservoir thickness, permeability, and injection-production mode, the gas absorption capacity of the high-permeability layer was much greater than that of the low-permeability layer. This directly affected the sweep area and remaining oil distribution of the two layers.
(2)
The gas absorption capacity of the reservoir and gravitational differentiation were the key factors affecting the migration and variation of the oil–gas interface, and the miscible mass transfer and displacement power were the main factors affecting the formation and distribution characteristics of miscible zone.
(3)
The entire displacement process of the CO2 miscible flooding could be divided into three stages: gas-free rapid oil production, low gas–oil ratio stable oil production, and high gas–oil ratio slow oil production. The process from the CO2 injection to gas breakthrough was the stage of rapid oil production without gas, which was dominated by the displacement. The stage of stable oil production with a low gas–oil ratio occurred from the gas breakthrough to before the increase of oil production rate, it was jointly affected by the displacement and miscible mass transfer. After the oil production rate increased, the stage of slow oil production with a high gas–oil ratio was dominated by the effect of CO2 carrying.

Author Contributions

Conceptualization and formal analysis, H.Y. and W.L.; methodology and supervision, H.Y.; investigation, W.L.; oilfield data, J.L.; writing—original draft, W.L.; writing—review and editing, Z.Y., H.Y. and W.L.; paper layout, W.L., X.C. and L.M. All authors have read and agreed to the published version of the manuscript.

Funding

This work was supported by the major Science and Technology Projects of China National Petroleum Corporation (2021ZZ01-03).

Institutional Review Board Statement

Not applicable.

Informed Consent Statement

Not applicable.

Data Availability Statement

Not applicable.

Conflicts of Interest

The authors declare no conflict of interest.

References

  1. China Mineral Resources Report. 2021: Ministry of Natural Resources, PRC; Geology Press: Beijing, China, 2021; ISBN 978-7-116-12858-3.
  2. Zhang, X.; Kou, G.; Wang, Z.; Zhang, H.; Zhang, G.S. Technical Discussion on Development Effects of CO2 Flooding in Jilin Extra-Low Permeability Reservoir. Drill. Prod. Technol. 2019, 42, 64–67. [Google Scholar]
  3. Qi, Y.D.; Lei, Q.; Yu, R.Z.; Yan, J.; Liu, X.W.; Zhan, J.F. Analysis on factors influencing development effect of extra-ultra low permeability sandstone reservoirs. J. China Univ. Pet. (Ed. Nat. Ence) 2013, 37, 89–94. [Google Scholar]
  4. Lou, Y.; Yang, S.; Zhang, X.; Yu, Y.; Yin, D.; Li, M.; Wen, B. Experimental research on CO2 miscible flooding by advanced gas injection in low permeability reservoir-case of H79 block, Jilin oilfield. Pet. Geol. Recovery Effic. 2012, 19, 78–80. [Google Scholar] [CrossRef]
  5. Li, Y. Technical advancement and prospect for CO2 flooding enhanced oil recovery in low permeability reservoirs. Pet. Geol. Recovery Effic. 2020, 27, 1–10. [Google Scholar] [CrossRef]
  6. Wang, S.-T.; Tan, J.-L.; Lei, X.-H.; Shi, H.-X.; Tang, Z.-W. CO2 flooding technology for low pereability sandstone reservoir of Changqing oilfield. Int. Field Explor. Dev. Conf. 2018, 2018, 2542–2553. [Google Scholar]
  7. Yu, H.-W.; Yang, S.-Y.; Li, S.; Yang, Y.Z. Rules of Water Cut Variation in Low Permeability Oil Reservoir CO2 Flooding Process. J. Jilin Univ. (Earth Sci. Ed.) 2011, 41, 1028–1032. [Google Scholar] [CrossRef]
  8. Liu, F.; Yue, P.; Wang, Q.; Yu, G.; Zhou, J.; Wang, X.; Fang, Q.; Li, X. Experimental Study of Oil Displacement and Gas Channeling during CO2 Flooding in Ultra—Low Permeability Oil Reservoir. Energies 2022, 15, 5119. [Google Scholar] [CrossRef]
  9. Qian, K.; Yang, S.L.; Dou, H.; Zhang, J. Microscopic Characteristics of Oil Displacement with Different CO2 Injection Modes in Extra-Low Permeability Reservoirs. Xinjiang Pet. Geol. 2020, 41, 204–208. [Google Scholar]
  10. Wang, X.; Wang, L.; Xia, Z.; Shi, F. Microscopic mechanism of oil displacement under different CO2 injection modes in tight oil reservoirs. China Encepaper 2018, 13, 1754–1758. [Google Scholar]
  11. Wang, J.; Liu, Y.; Jiang, R.; Guan, C. 2-D physical modeling of water coning of horizontal well production in bottom water driving reservoirs. Pet. Explor. Dev. 2007, 5, 590–593. [Google Scholar]
  12. Qian, C.; Liu, Y.; Chi, X.; Zhou, X.; Luo, F. Physical Simulation Researches on the Water Cresting Constraint of the Horizontal Wells in Bottom-Water-Driven Oil Reservoir. Pet. Geol. Oilfield Dev. Daqing 2012, 31, 5. [Google Scholar]
  13. Huang, S.; Zeng, B.; Zhao, F.; Cheng, L.; Du, B. Water Breakthrough Shape Description of Horizontal Wells in Bottom-Water Reservoir. Math. Probl. Eng. 2014, 2014, 460896. [Google Scholar] [CrossRef]
  14. Li, B.; Liu, K. Visualization Study of Anti-water Coning Using Foam. Int. Field Explor. Dev. Conf. 2017, 2017, 1508–1514. [Google Scholar]
  15. Liu, Y.; Lu, J.; Wang, J.; Gao, J.; Li, Y. Physical modeling of in-depth fluid diversion by “gel dam” placed with a horizontal well. Pet. Explor. Dev. 2011, 38, 332–335. [Google Scholar]
  16. Xu, K.; Liu, W.; Guo, Y.; Yan, W.; Luo, L.; Gou, F.; Zhang, C. Experimental Study of Profile Control with Gel-dam. Sci. Technol. Eng. 2015, 15, 187–190. [Google Scholar]
  17. Qin, J.; Zhang, K.; Chen, X. Mechanism of the CO2 flooding as reservoirs containing high water. Acta Pet. Sin. 2010, 31, 797–800. [Google Scholar]
  18. Guo, X. Study on microscopic migration characteristics of heavy oil by CO2 flooding at high temperature and high pressure. Pet. Geol. Recovery Effic. 2019, 26, 99–104. [Google Scholar] [CrossRef]
  19. Yu, H.; Wang, L.; Zhou, D.; Wang, F.; Li, S.; Li, J.; Chen, X.; Cao, A.; Han, H. Experimental Study on Sweep Characteristics of Gas Gravity Drainage in the Interlayer Oil Reservoir. Front. Energy Res. 2021, 9, 660. [Google Scholar] [CrossRef]
  20. Jian, G.; Yang, S.; Li, J.; Wang, H.; Zhou, T. Main Controlling Factors of the CO2 Injectivity for Jilin Daqingzi Oilfifld. Pet. Geol. Oilfield Dev. Daqing 2016, 35, 128–131. [Google Scholar]
Figure 1. Design diagram of the 2D double-layer heterogeneous visualization model.
Energies 15 05755 g001
Figure 2. Experimental flow chart.1: computer operating terminal; 2: Quizix qx5210 high-pressure precision displacement pump; 3: distilled water; 4: simulated oil intermediate container; 5: gas intermediate container; 6: 2D double-layer heterogeneous visualization model; 7: constant temperature water bath equipment; 8: high-speed camera; 9: back-pressure controller; 10: output liquid flow device; 11: separation bottle; 12: gas flow meter; 13–21: stop valve.
Energies 15 05755 g002
Figure 3. Schematic diagram of the injection-production mode of the 2D double-layer heterogeneous visualization model. (The arrow at the right side is the injection end; the arrow at the left side is the production end).
Energies 15 05755 g003
Figure 4. Diagram of minimum miscible pressure measured by slim tube experiment.
Energies 15 05755 g004
Figure 5. State diagram of CO2 miscible flooding at different production time. (A) 0 min; (B) 1 min; (C) 2 min; (D) 20 min; (E) 24 min; (gas breakthrough); (F) 34 min; (G) 74 min; (H) 164 min; (I) 344 min; (J) 358 min (increasing oil production rate); (K) 468 min (end of experiment). (The arrow at the right side is the injection end; the arrow at the left side is the production end).
Energies 15 05755 g005
Figure 6. Distribution of remaining oil in high-permeability layer when gas preferential pathway is formed. (A—Displacement area channel; B—remaining oil distribution area). (The arrow at the right side is the injection end; the arrow at the left side is the production end).
Energies 15 05755 g006
Figure 7. Distribution of miscible mass transfer between the bottom oil layer on the left side of the low-permeability layer and the CO2 in the high-permeability layer. (The arrow at the right side is the injection end; the arrow at the left side is the production end).
Energies 15 05755 g007
Figure 8. Distribution of miscible zone formed by contact between remaining oil and CO2 in two layers. (The arrow at the right side is the injection end; the arrow at the left side is the production end).
Energies 15 05755 g008
Figure 9. Development diagram of fingering phenomenon at the bottom of low-permeability layer. (The arrow at the right side is the injection end; the arrow at the left side is the production end).
Energies 15 05755 g009
Figure 10. Migration diagram of oil–gas interface.
Energies 15 05755 g010
Figure 11. Distribution diagram of miscible zone formation.
Energies 15 05755 g011
Figure 12. Relationship between cumulative injection hydrocarbon pore volume ratio (HCPV), oil recovery factor, and oil production rate.
Energies 15 05755 g012
Figure 13. Relationship between cumulative injection hydrocarbon pore volume ratio (HCPV), gas-oil ratio, and oil production rate.
Energies 15 05755 g013
Table 1. Data table of the proportion of gas absorption range of high and low permeability layers in total reservoir space at different production time.
State0 min1 min2 min20 min24 min34 min74 min164 min344 min358 min468 min
The proportion of the sweep area in the high-permeability0%1.0%2.3%19.2%22.9%33.0%34.5%35.7%38.4%39.6%40.9%
The proportion of the sweep area in the low-permeability0%0%0%0.7%0.8%2.8%4.5%5.3%6.4%7.0%9.0%
Publisher’s Note: MDPI stays neutral with regard to jurisdictional claims in published maps and institutional affiliations.

