
Life Cycle Assessment Model of a Catering Product: Comparing Environmental Impacts for Different End-of-Life Scenarios


Abstract
:1. Introduction
1.1. Research History and Hypothesis
1.2. The Literature Review
1.3. Research Aims
2. Materials and Methods
2.1. Data Collection
2.2. Life Cycle Assessment Methodology
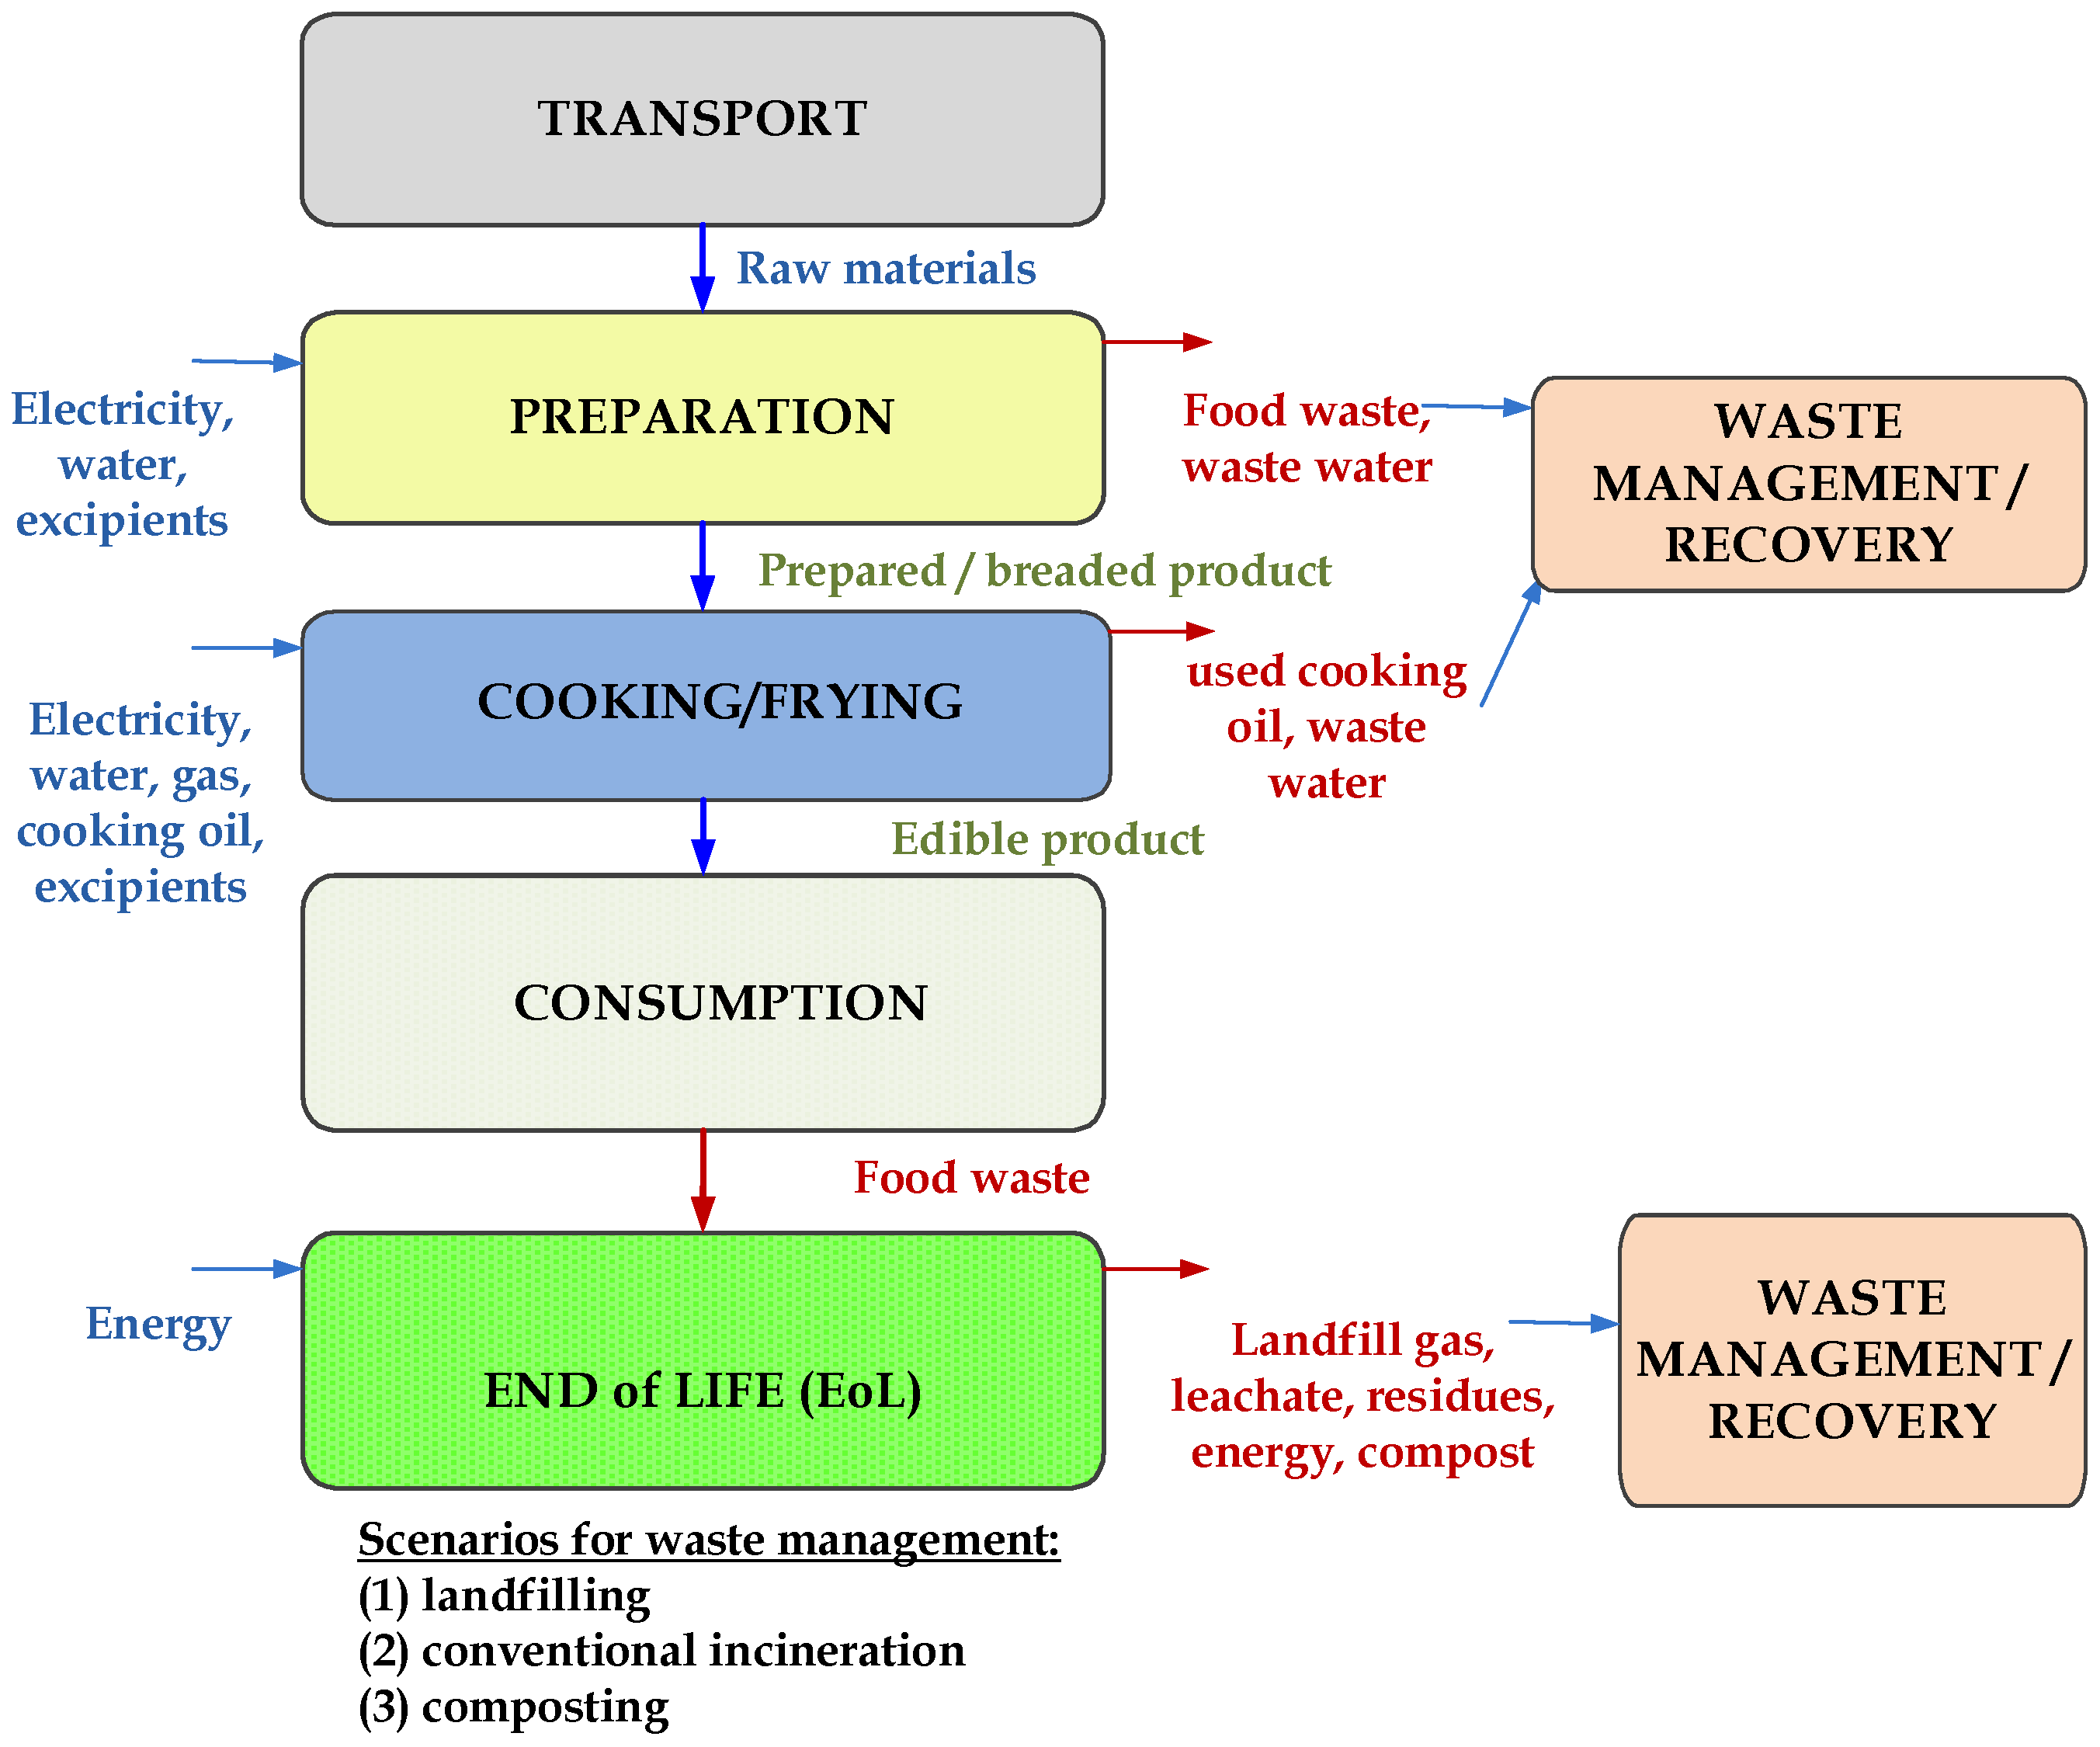
2.3. System Boundaries, Functional Unit and Allocation
2.4. LCA Software
2.5. Life Cycle Inventory
2.6. Life Cycle Impact Assessment Method
3. Results
3.1. Life Cycle Assessment Set Up
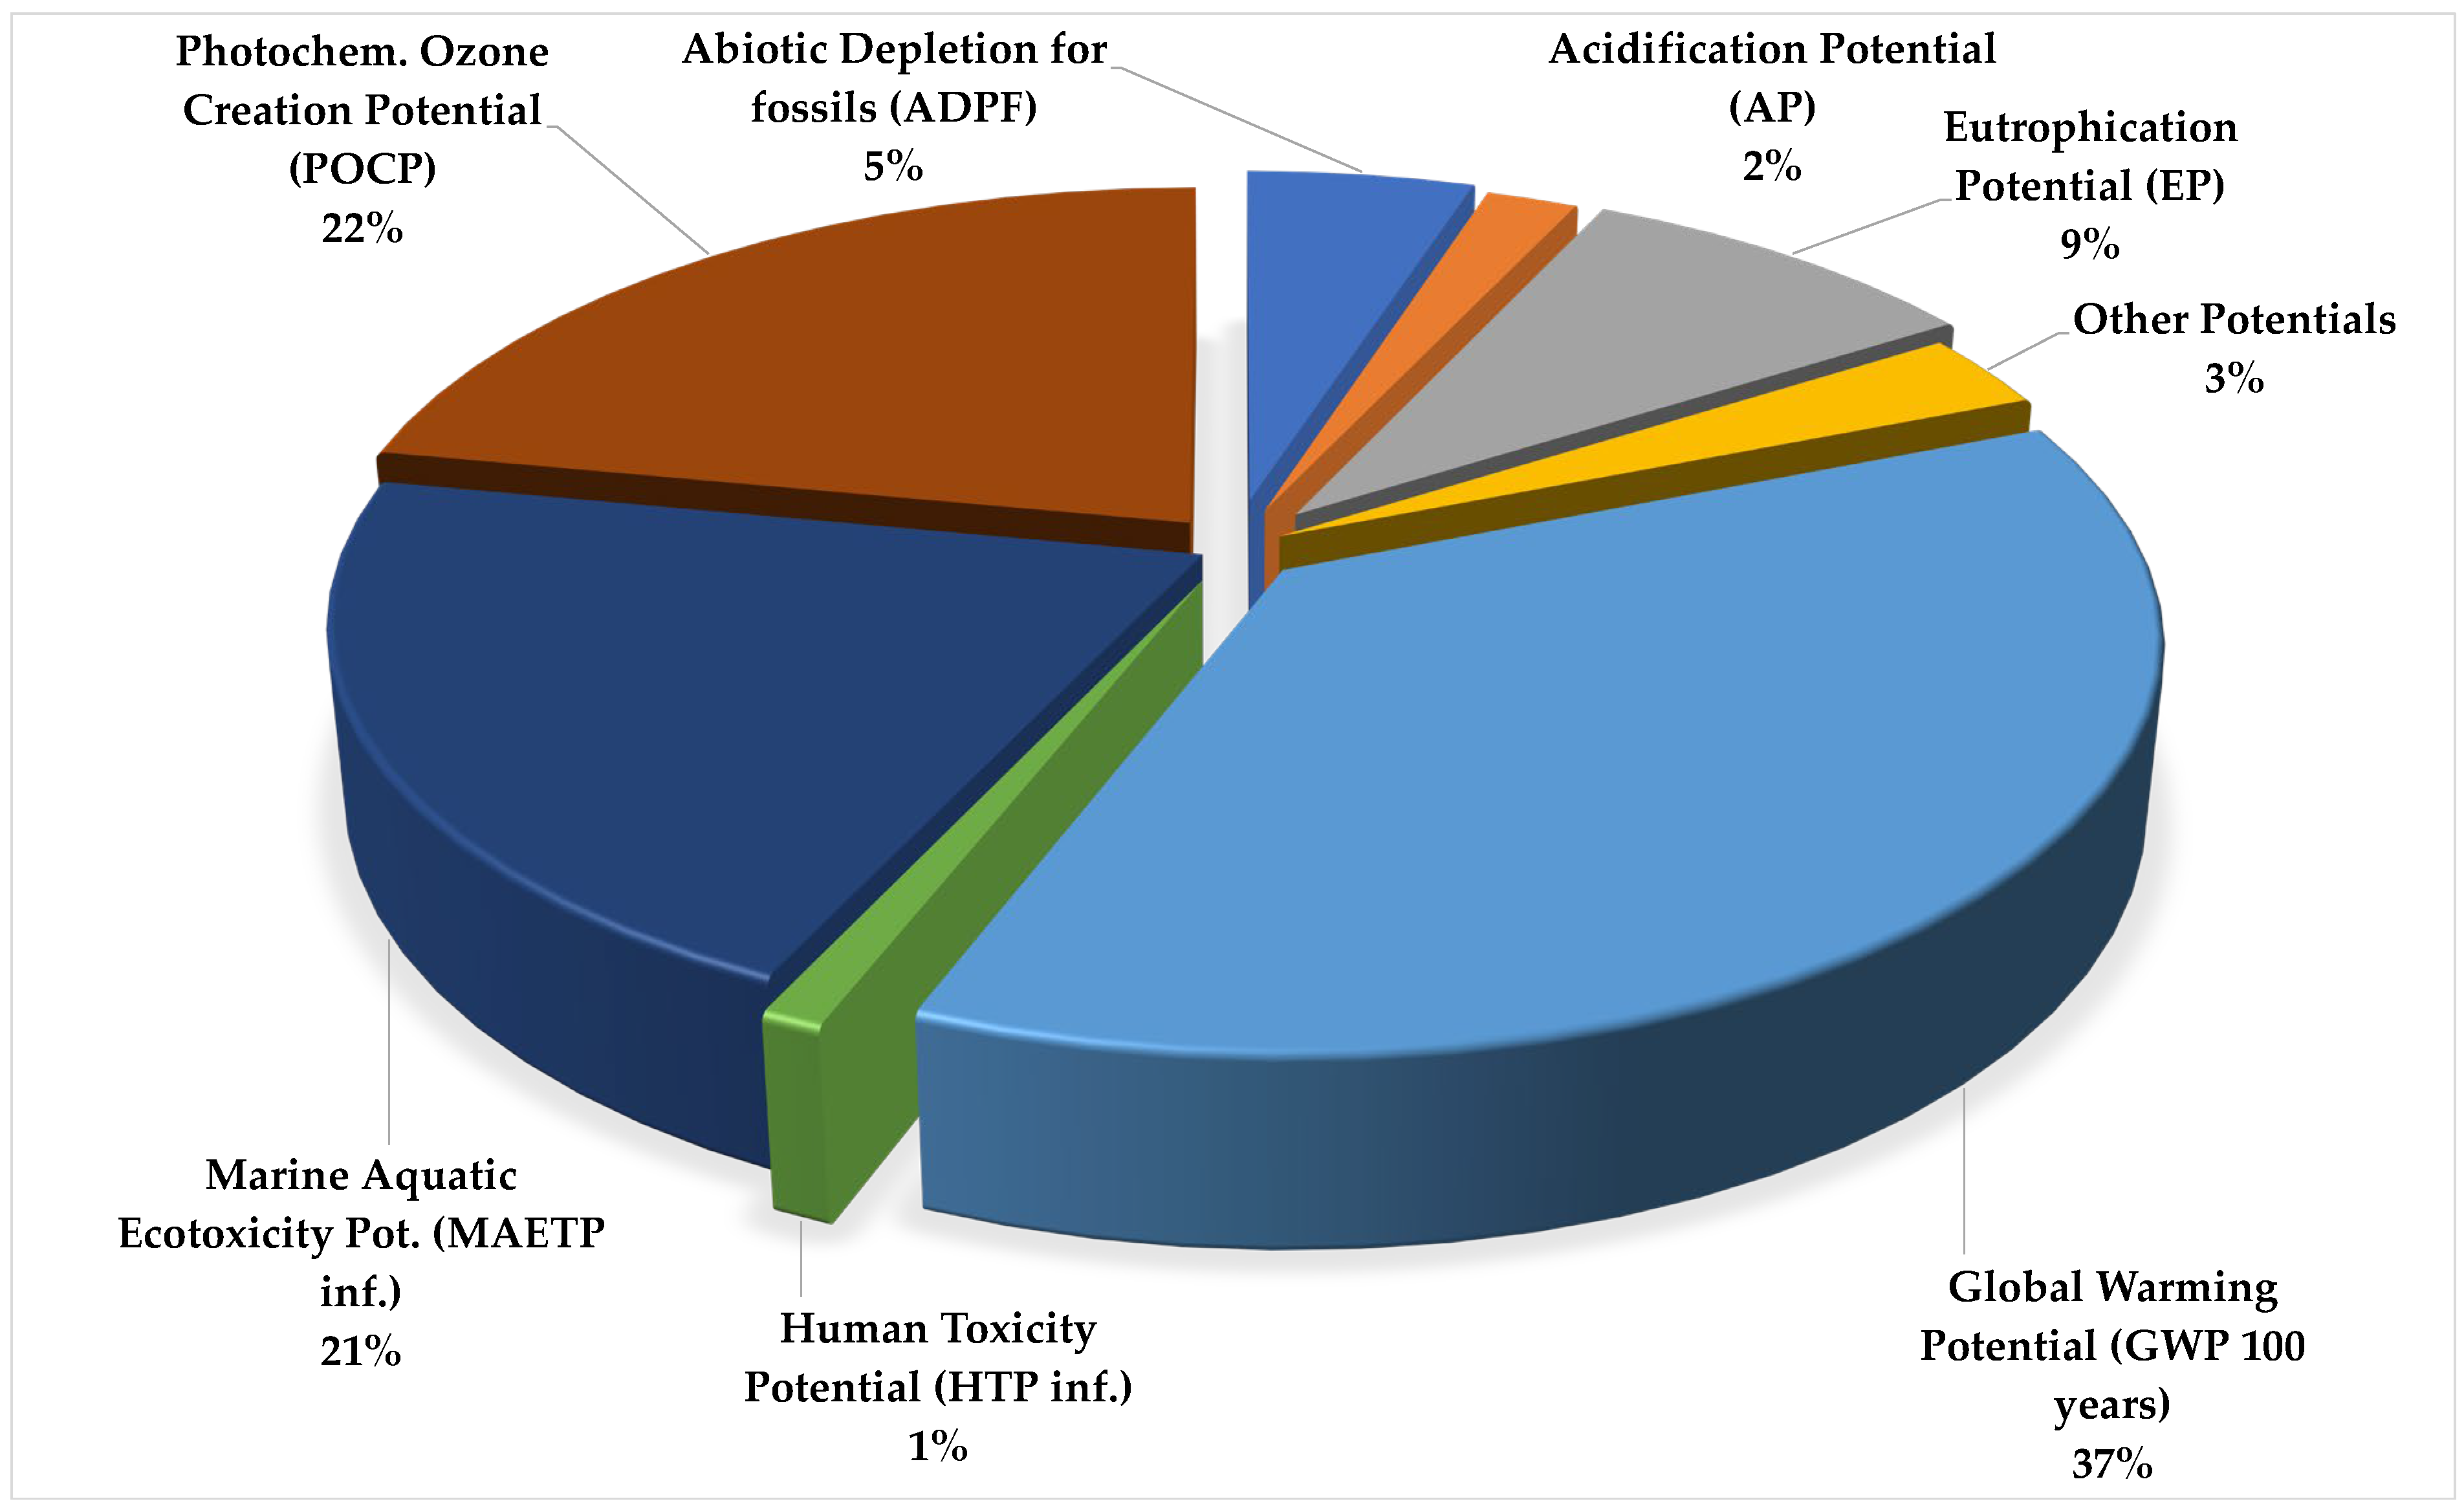
3.2. Environmental Impact Results for the Production Stage
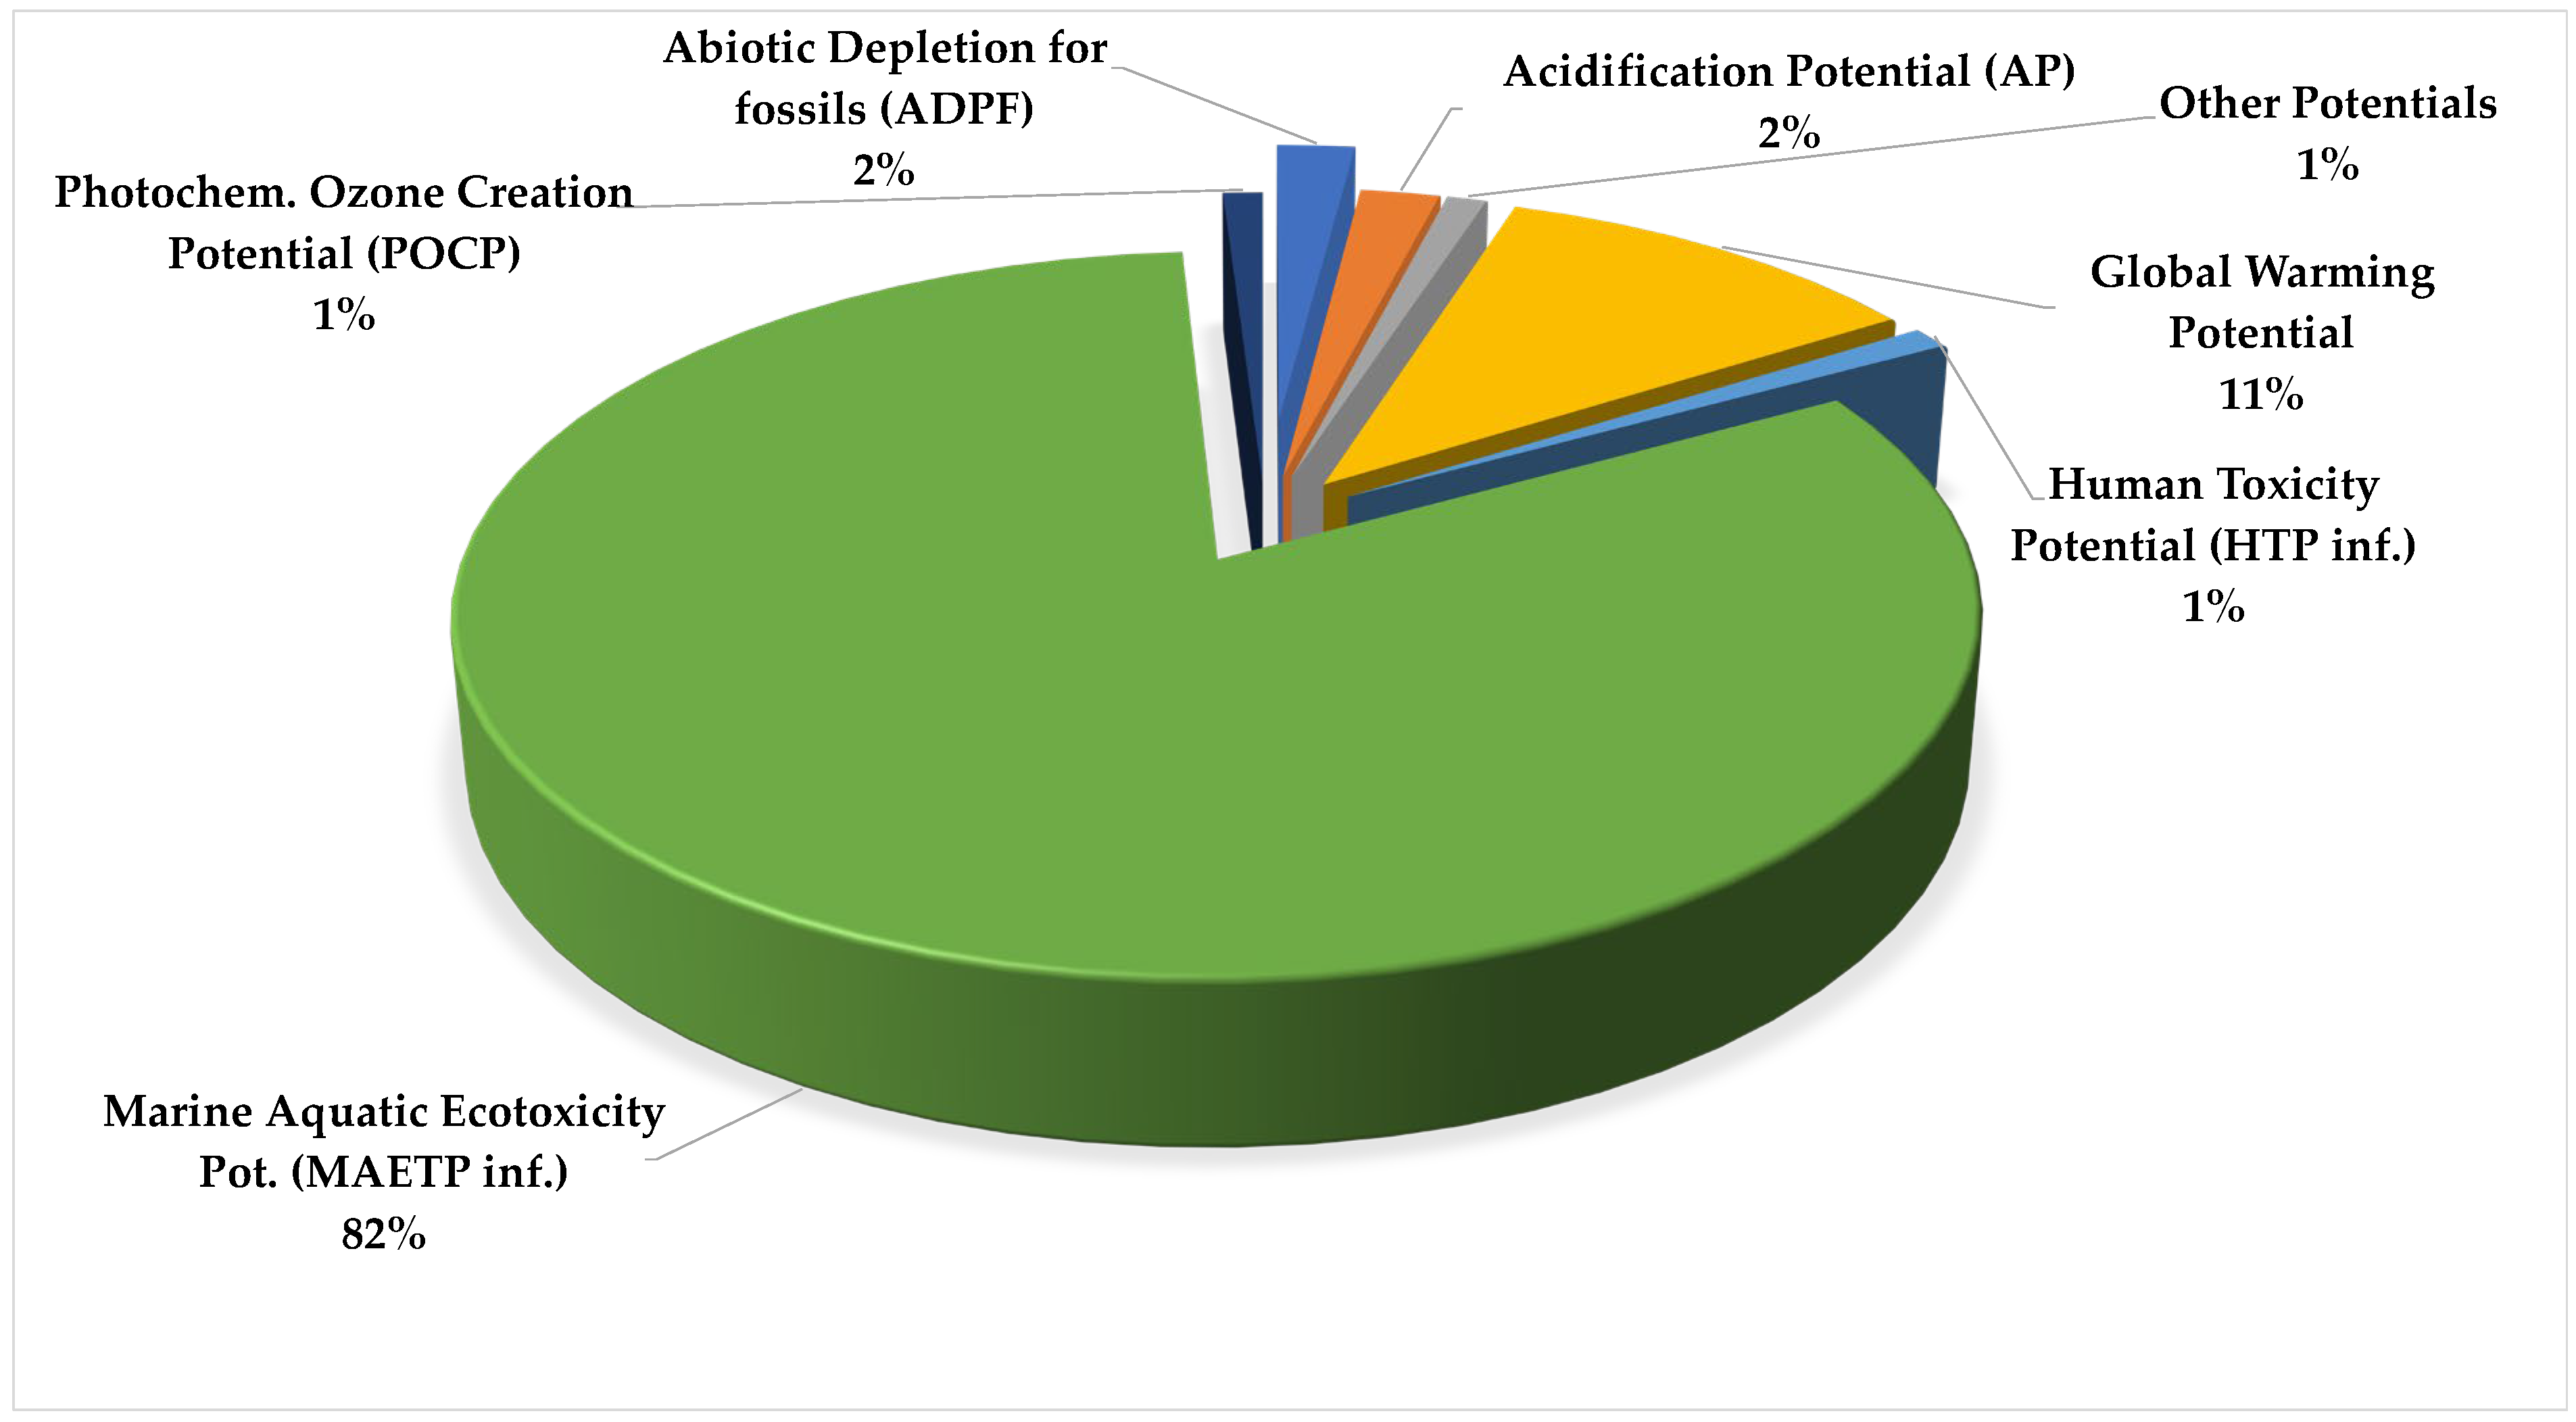
3.3. Environmental Impact Results for the End-of-Life Stage
3.4. Comparison of Traditional and Sous Vide Cooking Technologies
4. Discussion
5. Conclusions
Author Contributions
Funding
Institutional Review Board Statement
Informed Consent Statement
Data Availability Statement
Conflicts of Interest
Abbreviations
| ADPE | Abiotic Depletion Potential for Elements |
| ADPF | Abiotic Depletion Potential for fossils |
| AP | Acidification Potential |
| CE | Circular Economy |
| CES | Circular Economy Strategy |
| EGD | European Green Deal |
| EFSA | European Food Safety Authority |
| EoL | End-of-Life |
| EP | Eutrophication Potential |
| EPD | Environmental Product Declaration |
| EU | European Union |
| FU | Functional Unit |
| GWP | Global Warming Potential |
| HTP | Human Toxicity Potential |
| IPCC | Intergovernmental Panel on Climate Change |
| ILCD | International Reference Life Cycle Data System |
| LCA | Life Cycle Assessment |
| LCI | Life Cycle Inventory |
| LCIA | Life Cycle Impact Assessment |
| MAETP | Marine Aquatic Ecotoxicity Potential |
| MSW | Municipal Solid Waste |
| NÉBIH | National Food Chain Safety Office |
| POCP | Photochemical Ozone Creation Potential |
| SDGs | Sustainable Development Goals |
References
- Borsato, E.; Marinello, F.; Tarolli, P. Sustainable patterns of main agricultural products combining different footprint parameters. J. Clean. Prod. 2018, 179, 357–367. [Google Scholar] [CrossRef]
- Grygierek, K.; Ferdyn-Grygierek, J.; Gumińska, A.; Baran, Ł.; Barwa, M.; Czerw, K.; Gowik, P.; Makselan, K.; Potyka, K.; Psikuta, A. Energy and Environmental Analysis of Single-Family Houses Located in Poland. Energies 2020, 13, 2740. [Google Scholar] [CrossRef]
- Kim, M.J.; Hall, C.M. Can Climate Change Awareness Predict Pro-Environmental Practices in Restaurants? Comparing High and Low Dining Expenditure. Sustainability 2019, 11, 6777. [Google Scholar] [CrossRef] [Green Version]
- Baldwin, C.; Wilberforce, N.; Kapur, A. Restaurant and food service life cycle assessment and development of a sustainability standard. Int. J. Life Cycle Assess. 2010, 16, 40–49. [Google Scholar] [CrossRef]
- Kaza, S.; Yao, L.; Bhada-Tata, P.; Van Woerden, F. What a waste 2.0: A global snapshot of solid waste management to 2050. In Urban Development Series, 1st ed.; World Bank Group: Washington, DC, USA, 2018; pp. 17–37. [Google Scholar] [CrossRef]
- Stahel, W.R. Circular economy. Nature 2016, 531, 435–438. [Google Scholar] [CrossRef] [PubMed] [Green Version]
- D’Adamo, I. Adopting a Circular Economy: Current Practices and Future Perspectives. Soc. Sci. 2019, 8, 328. [Google Scholar] [CrossRef] [Green Version]
- D’Adamo, I.; Falcone, P.; Huisingh, D.; Morone, P. A circular economy model based on biomethane: What are the opportunities for the municipalty of Rome and beyond? Renew. Energy 2021, 163, 1660–1672. [Google Scholar] [CrossRef]
- Göbel, C.; Langen, N.; Blumenthal, A.; Teitscheid, P.; Ritter, G. Cutting food waste through cooperation along the food supply chain. Sustainability 2015, 7, 1429–1445. [Google Scholar] [CrossRef] [Green Version]
- Brancoli, P.; Bolton, K. Life Cycle Assessment of Waste Management Systems. In Sustainable Resource Recovery and Zero Waste Approaches, 1st ed.; Taherzadeh, M.J., Bolton, K., Pandey, A., Eds.; Elsevier: Philadelphia, PA, USA, 2019; pp. 23–33. [Google Scholar] [CrossRef]
- Kuznets, S. Economic Growth and Income Inequality. AER 1955, 45, 1–28. Available online: http://www.jstor.org/stable/1811581 (accessed on 15 October 2021).
- Grossman, G.; Krueger, A. Economic Growth and Income Inequality. Q. J. Econ. 1995, 110, 353–377. [Google Scholar] [CrossRef] [Green Version]
- Friedl, B.; Getzner, M. Determinants of CO2 emissions in a small open economy. Ecol. Econ. 2003, 45, 133–148. [Google Scholar] [CrossRef]
- United Nations Department of Economic and Social Affairs Statistics Division. Global Indicator Framework for the Sustainable Development Goals and Targets of the 2030 Agenda for Sustainable Development. Available online: https://unstats.un.org/sdgs/indicators/indicators-list (accessed on 15 October 2021).
- Bjørn, A.; Owsianiak, M.; Molin, C.; Laurent, A. Main Characteristics of LCA. In Life Cycle Assessment, 1st ed.; Springer: Cham, Switzerland, 2018; pp. 9–16. [Google Scholar] [CrossRef]
- Brusseau, M.L. Sustainable Development and Other Solutions to Pollution and Global Change. Environ. Pollut. Sci. 2019, 3, 585–603. [Google Scholar] [CrossRef]
- McManus, M.C.; Taylor, M. The changing nature of life cycle assessment. Biomass Bioenergy 2015, 82, 13–26. [Google Scholar] [CrossRef] [PubMed] [Green Version]
- Borodin, Y.V.; Aliferova, T.E.; Ncube, A. Waste management through life cycle assessment of products. IOP Conf. Ser. Mater. Sci. Eng. 2015, 81, 012085. [Google Scholar] [CrossRef] [Green Version]
- Curran, M. Life-Cycle Assessment. In Encyclopedia of Ecology, 2nd ed.; BAMAC, Ltd.: Rock Hill, SC, USA, 2016; Volume 4, pp. 359–366. [Google Scholar] [CrossRef]
- Society of Environmental Toxicology and Chemistry (SETAC). Guidelines for Life-Cycle Assessment: A ‘Code of Practice’ from the Workshop Held at Sesimbra. Environ. Sci. Pollut. Res. 1994, 1, 55. [Google Scholar] [CrossRef]
- Longo, S.; Mistretta, M.; Guarino, F.; Cellura, M. Life Cycle Assessment of organic and conventional apple supply chains in the North of Italy. J. Clean. Prod. 2017, 140, 654–663. [Google Scholar] [CrossRef]
- Tsangas, M.; Gavriel, I.; Doula, M.; Xeni, F.; Zorpas, A.A. Life Cycle Analysis in the Framework of Agricultural Strategic Development Planning in the Balkan Region. Sustainability 2020, 12, 1813. [Google Scholar] [CrossRef] [Green Version]
- Iannone, R.; Miranda, S.; Riemma, S.; De Marco, I. Improving environmental performances in wine production by a life cycle assessment analysis. J. Clean. Prod. 2016, 111, 172–180. [Google Scholar] [CrossRef]
- Masuda, K. Measuring eco-efficiency of wheat production in Japan: A combined application of life cycle assessment and data envelope analysis. J. Clean. Prod. 2016, 126, 373–381. [Google Scholar] [CrossRef]
- EFSA. Register of Questions. 2018. Available online: http://registerofquestions.efsa.europa.eu/roqFrontend/login?4 (accessed on 27 June 2017).
- Kharrazi, A.; Kraines, S.B.; Hoang, L.; Yarime, M. Advancing quantification methods of sustainability: A critical examination emergy, exergy, ecological footprint, and ecological information-based approaches. Ecol. Indic. 2014, 37, 81–89. [Google Scholar] [CrossRef]
- Arbault, D.; Rugani, B.; Barna, L.; Benetto, E. A semantic study of the emergy sustainability index in the hybrid lifecycle-emergy framework. Ecol. Indic. 2014, 43, 252–261. [Google Scholar] [CrossRef]
- Cano, N.; Hasenstab, C.; Velasquez, H. Life-Cycle Assessment (LCA) of Exergy Indicators in the Colombian Gold Mining Sector: A Case Study in an Open-Pit and in an Alluvial Mining Processes. In Proceedings of the 32nd International Conference on Efficiency, Cost, Optimization, Simulation and Environmental Impact of Energy Systems, Wrocław, Poland, 23–28 June 2019; Available online: https://jsm.gig.eu/journal-of-sustainable-mining/vol19/iss3/2/ (accessed on 14 October 2020).
- Giannetti, B.F.; Bonilla, S.H.; Almeida, C.M.V.B. An emergy-based evaluation of a reverse logistics network for steel recycling. J. Clean. Prod. 2013, 46, 48–57. [Google Scholar] [CrossRef]
- Sanyé-Mengual, E.; Sala, S. Life Cycle Assessment support to environmental ambitions of EU policies and the Sustainable Development Goals. Integr. Environ. Assess. Manag. 2022. [Google Scholar] [CrossRef]
- ISO 14040:2006; Environmental Management—Life Cycle Assessment—Principles and Framework. ISO: Geneva, Switzerland, 2006. Available online: https://www.iso.org/standard/37456.html (accessed on 6 June 2019).
- ISO 14044:2006; Environmental Management—Life Cycle Assessment—Requirements and Guidelines. ISO: Geneva, Switzerland, 2006. Available online: https://www.iso.org/standard/38498.html (accessed on 6 June 2019).
- Amoo, L.M.; Fagbenle, L. Climate Change in Developing Nations of the World; Woodhead Publishing Series in Energy; Applications of Heat, Mass and Fluid Boundary Layers; Woodhead Publishing: Cambridge, UK, 2020; pp. 437–471. ISBN 9780128179499. [Google Scholar] [CrossRef]
- Farinha, C.; de Brito, J.; Do Veiga, M. Eco-Efficient Rendering Mortars; Woodhead Publishing Series in Civil and Structural Engineering; Woodhead Publishing: Cambridge, UK, 2021; pp. 205–234. [Google Scholar] [CrossRef]
- Dincer, I. Refrigerants. Compr. Energy Syst. 2018, 2, 435–474. [Google Scholar] [CrossRef]
- Managi, S.; Jena, P.R. Environmental productivity and Kuznets curve in India. Ecol. Econ. 2008, 65, 432–440. [Google Scholar] [CrossRef]
- Narayan, P.K.; Saboori, B.; Soleymani, A. Economic growth and carbon emissions. Econ. Model. 2016, 53, 388–397. [Google Scholar] [CrossRef]
- Zhang, M.; Li, B.; Yin, S. Is Technological Innovation Effective for Energy Saving and Carbon Emissions Reduction? Evidence from China. IEEE Access 2020, 8, 83524–83537. [Google Scholar] [CrossRef]
- Zhang, Y. The impact of financial development on carbon emissions: An empirical analysis in China. Energy Policy 2011, 39, 2197–2203. [Google Scholar] [CrossRef]
- Zhang, N.; Yu, K.; Chen, Z. How does urbanization affect carbon dioxide emissions? A cross-country panel data analysis. Energy Policy 2017, 107, 678–687. [Google Scholar] [CrossRef]
- Rauf, A.; Zhang, J.; Ji, J.; Amin, W. Structural changes, energy consumption and carbon emissions in China: Empirical evidence from ARDL bound testing model. Struct. Chang. Econ. Dyn. 2018, 47, 194–206. [Google Scholar] [CrossRef]
- Huppes, G.; Ishikawa, M. Eco-efficiency and Its xs Terminology. J. Ind. Ecol. 2005, 9, 43–46. [Google Scholar] [CrossRef]
- Kruszelnicka, W.; Kasner, R.; Bałdowska-Witos, P.; Flizikowski, J.; Tomporowski, A. The Integrated Energy Consumption Index for Energy Biomass Grinding Technology Assessment. Energies 2020, 13, 1417. [Google Scholar] [CrossRef] [Green Version]
- Farr-Wharton, G.; Foth, M.; Choi, H.J. Identifying factors that promote consumer behaviours causing expired domestic food waste. J. Consum. Behav. 2014, 13, 393–402. [Google Scholar] [CrossRef] [Green Version]
- Stancu, V.; Haugaard, P.; Lähteenmäki, L. Determinants of consumer food waste behaviour: Two routes to food waste. Appetite 2016, 96, 7–17. [Google Scholar] [CrossRef] [PubMed]
- Stangherlin, I.C.; Barcellos, M.D. Drivers and barriers to food waste reduction. Br. Food J. 2018, 120, 2364–2387. [Google Scholar] [CrossRef]
- Grosso, M.; Niero, M.; Rigamonti, L. Circular economy, permanent materials and limitations to recycling: Where do we stand and what is the way forward? Waste Manag. Res. 2017, 35, 793–794. [Google Scholar] [CrossRef]
- European Commission DIRECTIVE (EU) 2018/851 of the European Parliament and of the Council of 30 May 2018 Amending Directive 2008/98/EC on Waste. Available online: https://eur-lex.europa.eu/eli/dir/2018/851/oj (accessed on 30 May 2018).
- European Commission (2019) Supplementing Directive 2008/98/EC of the European Parliament and of the Council as Regards a Common Methodology and Minimum Quality Requirements for the Uniform Measurement of Levels of Food Waste. Available online: http://ec.europa.eu/transparency/regdoc/rep/3/2019/EN/C-2019-3211-F1-EN-MAIN-PART-1.PDF (accessed on 14 May 2019).
- Oláh, J.; Kasza, G.; Szabó-Bódi, B.; Lakner, Z. Household Food Waste Research: The Current State of the Art and a Guided Tour for Further Development. Front. Environ. Sci. 2022, 10, 1–18. [Google Scholar] [CrossRef]
- Szabó-Bódi, B.; Kasza, G.; Szakos, D. Assessment of domestic food waste in Hungary. Br. Food J. 2018, 120, 625–638. [Google Scholar] [CrossRef]
- Evans, D. Beyond the throwaway society: Ordinary domestic practice and a sociological approach to household food waste. Sociology 2012, 46, 41–56. [Google Scholar] [CrossRef]
- Mallinson, L.J.; Russell, J.M.; Barker, M.E. Attitudes and behaviour towards convenience food and food waste in the United Kingdom. Appetite 2016, 103, 17–28. [Google Scholar] [CrossRef] [Green Version]
- Djekic, I.; Miloradovic, Z.; Djekic, S.; Tomasevic, I. Household food waste in Serbia–attitudes, quantities and global warming potential. J. Clean. Prod. 2019, 229, 44–52. [Google Scholar] [CrossRef]
- Kasza, G.; Dorkó, A.; Kunszabó, A.; Szakos, D. Quantification of Household Food Waste in Hungary: A Replication Study Using the FUSIONS Methodology. Sustainability 2020, 12, 3069. [Google Scholar] [CrossRef] [Green Version]
- Peattie, K.; Crane, A. Green marketing: Legend, myth, farce or prophesy? Qual. Mark. Res. 2005, 8, 357–370. [Google Scholar] [CrossRef] [Green Version]
- Larsson, S.; Khan, M.A. A Study of Factors That Influence Green Purchase. Adv. Mater. Res. 2014, 1051, 1035–1039. Available online: http://www.diva-portal.org/smash/get/diva2:614312/FULLTEXT02 (accessed on 1 July 2022).
- Lee, T.M.; Markowitz, E.M.; Howe, P.D.; Ko, C.Y.; Leiserowitz, A.A. Predictors of Public Climate Change Awareness and Risk Perception around the World. Nat. Clim. Chang. 2015, 5, 1014–1020. [Google Scholar] [CrossRef]
- Dal, B.; Alper, U.; Özdem-Yilmaz, Y.; Öztürk, N.; Sönmez, D. A model for pre-service teachers’ climate change awareness and willingness to act for pro-climate change friendly behavior: Adaptation of awareness to climate change questionnaire. Int. Res. Geogr. Environ. Educ. 2015, 24, 1–17. [Google Scholar] [CrossRef]
- Mannheim, V. Life Cycle Assessment Model of Plastic Products: Comparing Environmental Impacts for Different Scenarios in the Production Stage. Polymers 2021, 13, 777. [Google Scholar] [CrossRef]
- Zimon, D.; Madzik, P.; Domingues, P. Development of Key Processes along the Supply Chain by Implementing the ISO 22000 Standard. Sustainability 2020, 12, 6176. [Google Scholar] [CrossRef]
- Voběrková, S.; Vaverková, M.D.; Burešová, A.; Adamcová, D.; Vršanská, M.; Kynický, J.; Brtnický, M.; Adam, V. Effect of inoculation with white-rot fungi and fungal consortium on the composting efficiency of municipal solid waste. Waste Manag. 2017, 61, 157–164. [Google Scholar] [CrossRef] [PubMed]
- Koda, E.; Miszkowska, A.; Sieczka, A. Levels of Organic Pollution Indicators in Groundwater at the Old Landfill and Waste Management Site. Appl. Sci. 2017, 7, 638. [Google Scholar] [CrossRef] [Green Version]
- Kiss, N.É.; Tamás, J.; Szőllősi, N.; Gorliczay, E.; Nagy, A. Assessment of Composted Pelletized Poultry Litter as an Alternative to Chemical Fertilizers Based on the Environmental Impact of Their Production. Agriculture 2021, 11, 1130. [Google Scholar] [CrossRef]
- Norouzi, O.; Dutta, A. The Current Status and Future Potential of Biogas Production from Canada’s Organic Fraction Municipal Solid Waste. Energies 2022, 15, 475. [Google Scholar] [CrossRef]
- Onyeaka, H.; Nwabor, F.O.; Jang, S.; Kechrist, O.; Hart, A.; Miri, T. Sous vide processing: A viable approach for the assurance of microbial food safety. J. Sci. Food Agric. 2022, 102, 9. [Google Scholar] [CrossRef]
- Bhuyan, A.; Hussain, I.A.; Sarma, P. Sous-Vide Technique. Agric. Food E-Newsl. 2022, 4, 5. [Google Scholar]
- Karki, R.; Bremer, P.; Silcock, P.; Oey, I. Effect of Sous vide Processing on Quality Parameters of Beef Short Ribs and Optimisation of Sous vide Time and Temperature Using Third-Order Multiple Regression. Food Bioprocess Technol. 2022, 15, 1629–1646. [Google Scholar] [CrossRef]
- Schellekens, M. New research issues in sous-vide cooking. Trends Food Sci. Technol. 1996, 7, 256–262. [Google Scholar] [CrossRef]
- Kalakul, S.; Malakul, P.; Siemanond, K.; Gani, R. Integration of life cycle assessment software with tools for economic and sustainability analyses and process simulation for sustainable process design. J. Clean. Prod. 2014, 71, 98–109. [Google Scholar] [CrossRef]
- CML. Institute of Environmental Sciences, Leiden University. CML-IA Characterisation Factors Portal. 2016. Available online: https://www.universiteitleiden.nl/en/research/researchoutput/science/cml-ia-characterisation-factors (accessed on 29 June 2018).
- Van Oers, L.; De Koning, A.; Guinée, J.B.; Huppes, G. Abiotic resource depletion in LCA. In Improving Characterisation Factors for Abiotic Resource Depletion as Recommended in the New Dutch LCA Handbook; RWS-DWW: Delft, The Netherlands, 2002; Available online: http://www.leidenuniv.nl/cml/ssp/projects/lca2/report_abiotic_depletion_web.pdf (accessed on 29 February 2016).
- Kupfer, T.; Baitz, M.; Colodel, C.M.; Kokborg, M.; Schöll, S.; Rudolf, M.; Thellier, L.; Bos, U.; Bosch, F.; Gonzalez, M. GaBi Database & Modeling Principles. In GaBi Thinkstep AG; Sphera: Chicago, IL, USA, 2018. [Google Scholar]
- The Global Risks Report 2020; The World Economic Forum: Geneva, Switzerland, 2020; Available online: https://www.weforum.org/reports/the-global-risks-report-2020 (accessed on 15 October 2021).
- Kaczmarczyk, B.; Urych, I. Perception of the Transition to a Zero-Emission Economy in the Opinion of Polish Students. Energies 2022, 15, 1102. [Google Scholar] [CrossRef]
- Civancik-Uslu, D.; Ferrer, L.; Puig, R.; Fullana-i-Palmer, P. Are functional fillers improving environmental behavior of plastics? A review on LCA studies. Sci. Total Environ. 2018, 626, 927–940. [Google Scholar] [CrossRef]
- Civancik-Uslu, D.; Puig, R.; Ferrer, L.; Fullana-i-Palmer, P. Influence of end-of-life allocation, credits and other methodological issues in LCA of compounds: An in-company circular economy case study on packaging. J. Clean. Prod. 2019, 212, 925–940. [Google Scholar] [CrossRef]
- Alwaeli, M.; Mannheim, V. Investigation into the Current State of Nuclear Energy and Nuclear Waste Management—A State-of-the-Art Review. Energies 2022, 15, 4275. [Google Scholar] [CrossRef]
- Szita, K. The Application of Life Cycle Assessment in Circular Economy. Hung. Agric. Eng. 2017, 31, 5–9. [Google Scholar] [CrossRef]
- Bałdowska-Witos, P.; Kruszelnicka, W.; Tomporowski, A. LCA analyzes were also performed for the production of PET bottle. Life cycle assessment of beverage bottles. J. Phys. Conf. Ser. 2020, 1426, 012038. [Google Scholar] [CrossRef]
- Mannheim, V.; Simenfalvi, Z. Total Life Cycle of Polypropylene Products: Reducing Environmental Impacts in the Manufacturing Phase. Polymers 2020, 12, 1901. [Google Scholar] [CrossRef] [PubMed]
- Bianco, I.; Panepinto, D.; Zanetti, M. End-of-Life Tyres: Comparative Life Cycle Assessment of Treatment Scenarios. Appl. Sci. 2021, 11, 3599. [Google Scholar] [CrossRef]
- Da Silva, L.F.; Resnitzkyd, M.H.C.; Santibanez Gonzalez, E.D.R.; de Melo Conti, D.; da Costa, P.R. Management of Plastic Waste and a Circular Economy at the End of the Supply Chain: A Systematic Literature Review. Energies 2022, 15, 976. [Google Scholar] [CrossRef]
- Boldrin, A.; Neidel, T.L.; Damgaard, A.; Bhander, S.G.; Møller, J.; Christensen, T.H. Modelling of environmental impacts from biological treatment of organic municipal waste in EASEWASTE. Waste Manag. 2011, 31, 619–630. [Google Scholar] [CrossRef] [PubMed] [Green Version]
- Erdélyi, É.; Avató, L.J.; Kocsis, T. A new trend in education and research at Budapest Business School: Green Catering. Georg. Agric. 2019, 23, 16–30. Available online: https://georgikon.szie.hu/egyetemi-elet/kiadvanyaink/georgikon-for-agriculture (accessed on 28 June 2019).
- Wang, N.; Lee, J.C.K.; Zhang, J.; Chen, H.; Li, H. Evaluation of urban circular economy development: An empirical research of 40 cities in China. J. Clean. Prod. 2018, 180, 876–887. [Google Scholar] [CrossRef]
- Symeonides, D.; Loizia, P.; Zorpas, A.A. Tire waste management system in Cyprus in the framework of circular economy strategy. Environ. Sci. Pollut. Res. 2019, 26, 35445–35460. [Google Scholar] [CrossRef]
- Loizia, P.; Voukkali, I.; Zorpas, A.A.; Pedreño, J.N.; Chatziparaskeva, G.; Inglezakis, V.J.; Vardopoulos, I.; Doula, M. Measuring the level of environmental performance in insular areas, through key performed indicators, in the framework of waste strategy development. Sci. Total Environ. 2021, 753, 141974. [Google Scholar] [CrossRef] [PubMed]
- Voukkali, I.; Loizia, P.; Pedreño, J.N.; Zorpas, A.A. Urban strategies evaluation for waste management in coastal areas in the framework of area metabolism. Waste Manag. Res. 2021, 39, 448–465. [Google Scholar] [CrossRef] [PubMed]
- Gibbs, W.; Myhrvold, N. The Science of Sous Vide. Sci. Am. 2010, 304, 24. [Google Scholar] [CrossRef]
- Baldwin, D.E. Sous Vide Cooking: A Review. Int. J. Gastron. Food Sci. 2012, 1, 15–30. [Google Scholar] [CrossRef] [Green Version]
- Kilibarda, N.; Brdar, I.; Branislav, B.; Baltic, M.; Stanišić, S. The Safety and Quality of Sous Vide Food. Meat Technol. 2018, 59, 38–45. [Google Scholar] [CrossRef] [Green Version]
- Modzelewska-Kapituła, M.; Pietrzak-Fiečko, R.; Zakrzewski, A.; Więk, A. The Influence of Sous Vide Parameters on Nutritional Characteristics and Safety of Pikeperch Fillets. Foods 2022, 11, 1605. [Google Scholar] [CrossRef]
- Cui, Z.; Yan, H.; Manoli, T.; Zhang, H.; Zhen, H.; Ji, M.; Bi, C. Advantages and challenges of sous vide cooking. Food Sci. Technol. Res. 2021, 27, 25–34. [Google Scholar] [CrossRef]


| Name of Impact Category | Interpretation of Impact Category |
|---|---|
| Abiotic Depletion for elements, kg Sb Equivalent | Use of elements and minerals (deals with the extraction of rare earth metals and their ores). |
| Abiotic Depletion for fossil, MJ | Use of fossil energy carriers (coal, petroleum, natural gas) as raw materials. |
| Acidification Potential, kg SO2 Equivalent | Acidification of lakes, while in terrestrial ecosystems it indicates the acidification of forests. |
| Eutrophication Potential, kg Phosphate Equivalent | Damage to marine and freshwater ecosystems. |
| Global Warming Pot., kg CO2 Equivalent | Effect of greenhouse gases on the atmosphere. |
| Human Toxicity Potential, kg DCB Equivalent | Potentially harmful effect of emitted substances (e.g., arsenic, hydrogen fluoride, sodium dichromate) on human health. |
| Marine A. Ecotox. Pot., kg DCB Equivalent | Impact of the release of toxic substances (e.g., heavy metals) on the marine ecosystem. |
| Photochem. Ozone Creat. Pot., kg Ethylene Equiv. | Ethylene equivalent emissions due to high NOx concentrations from photochemical oxidation. |
| Name of Impact Categories | Preparation Phase | Cooking/Frying Phase |
|---|---|---|
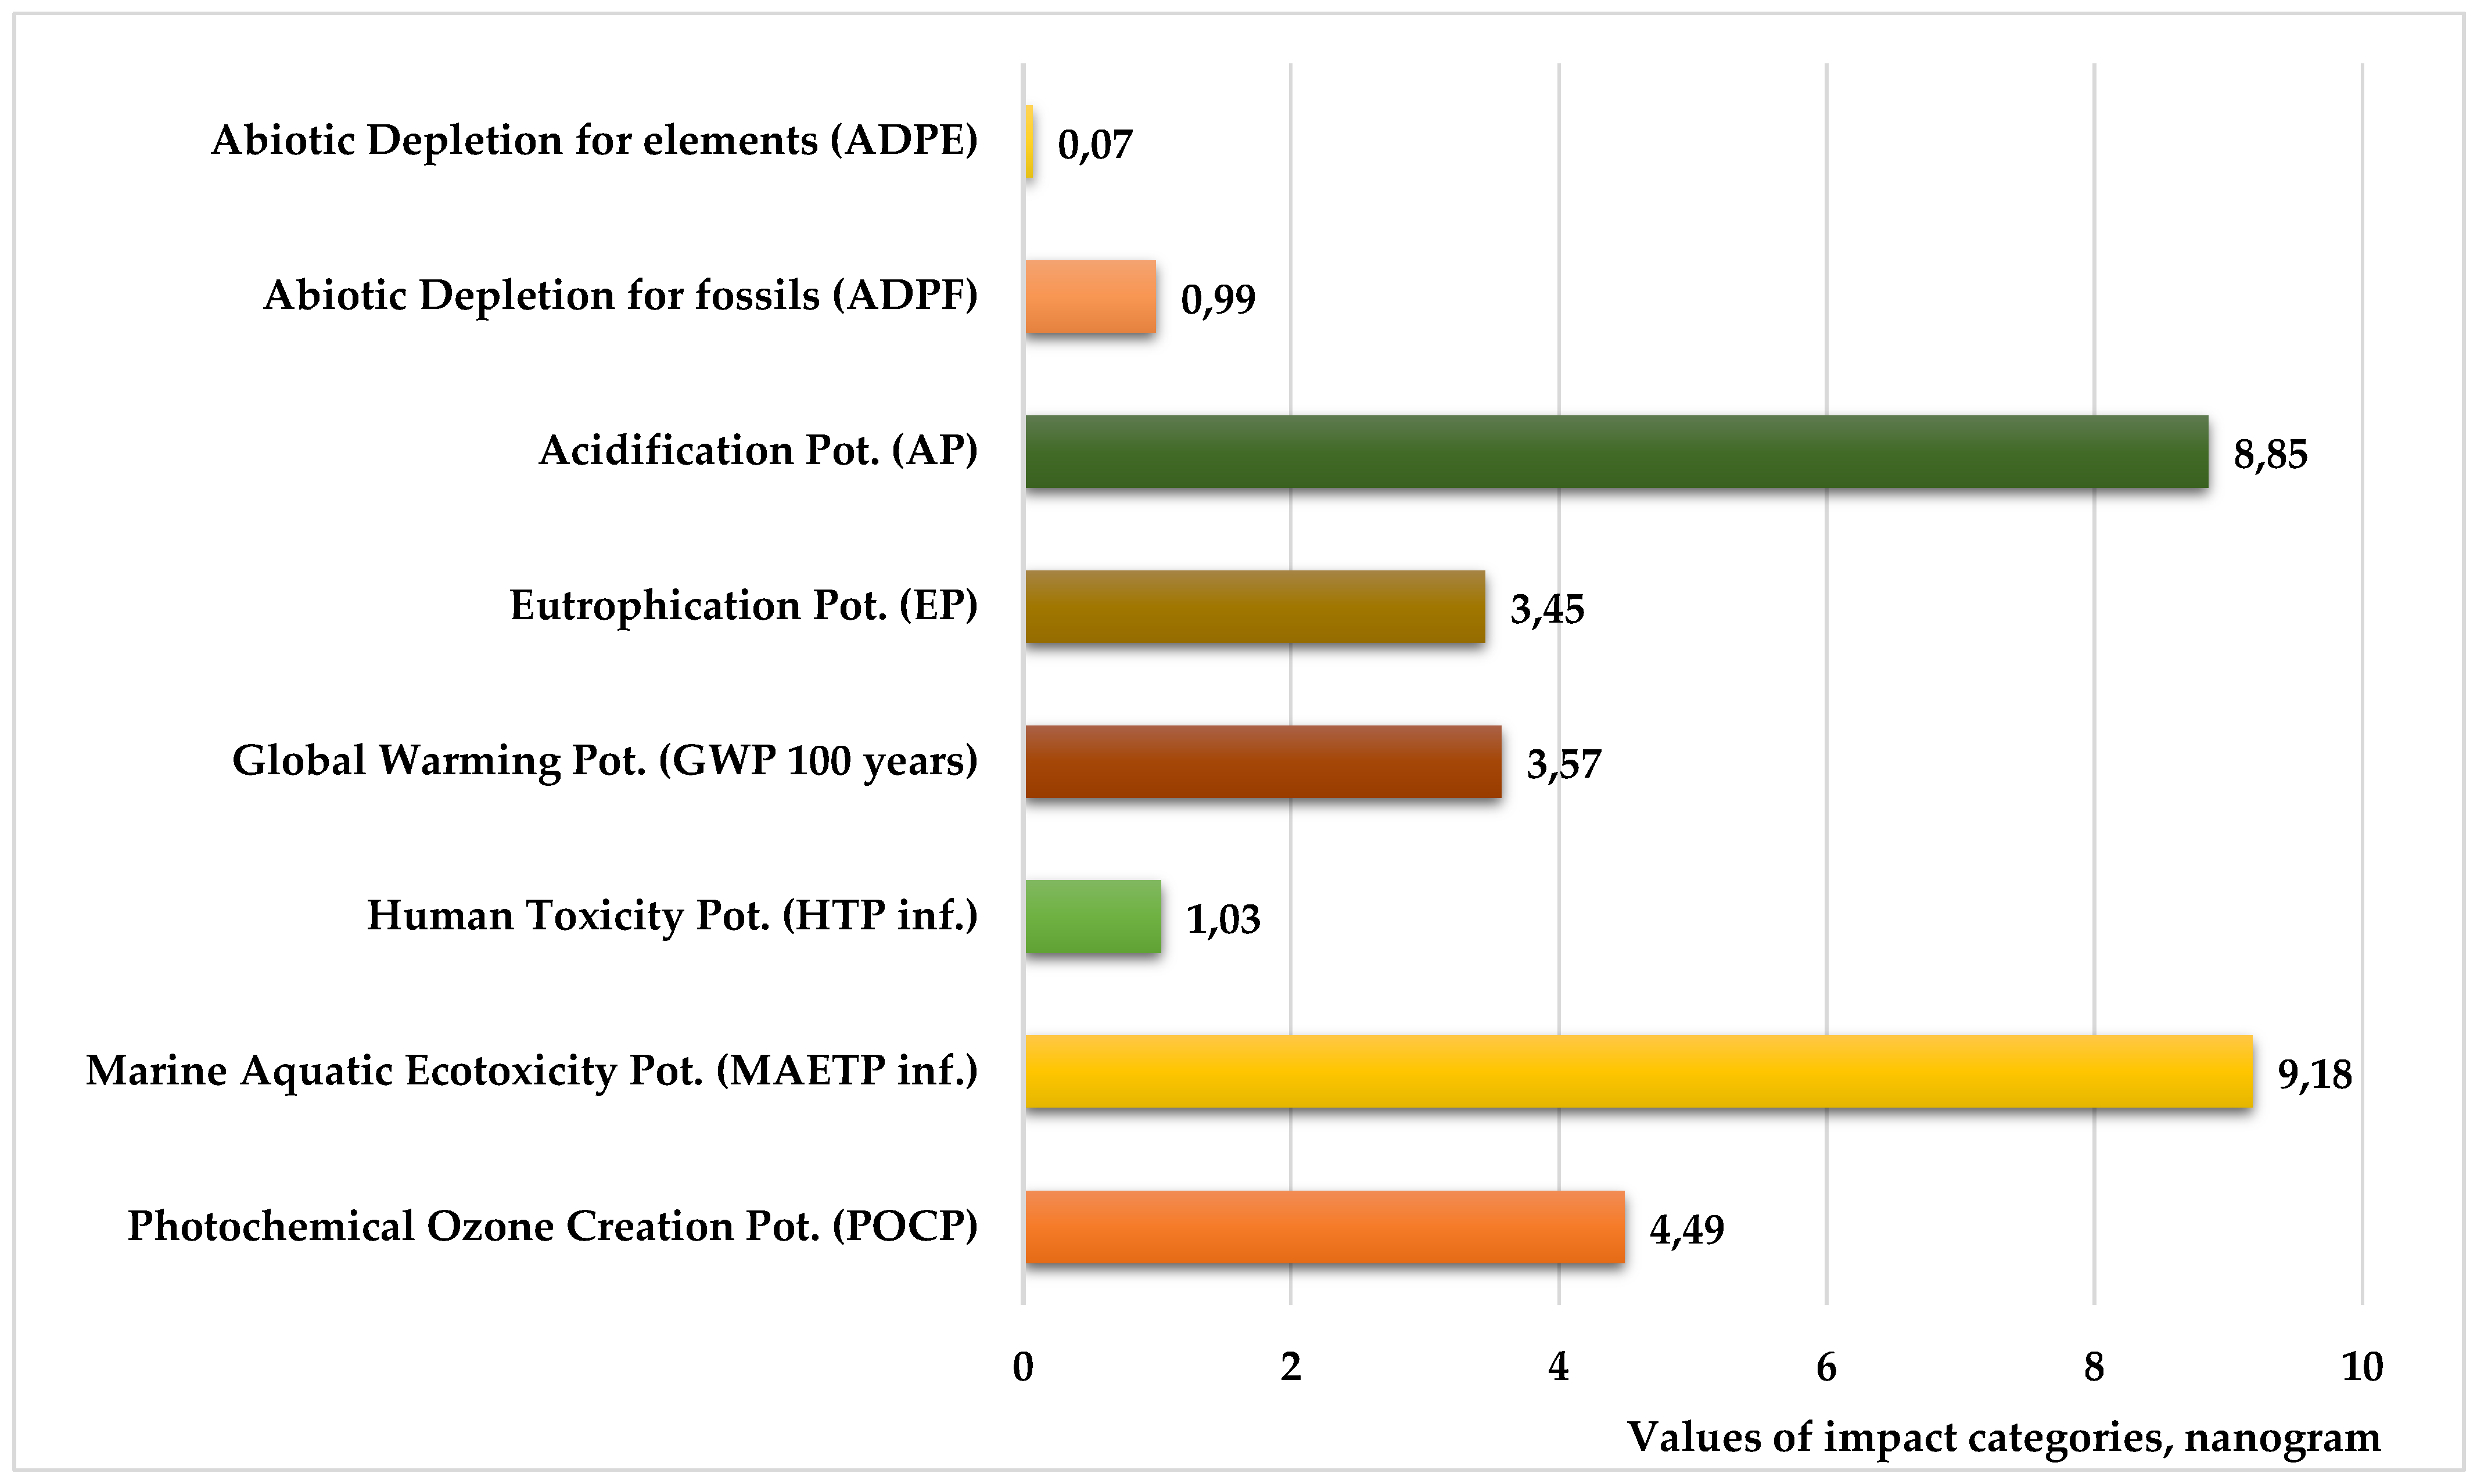
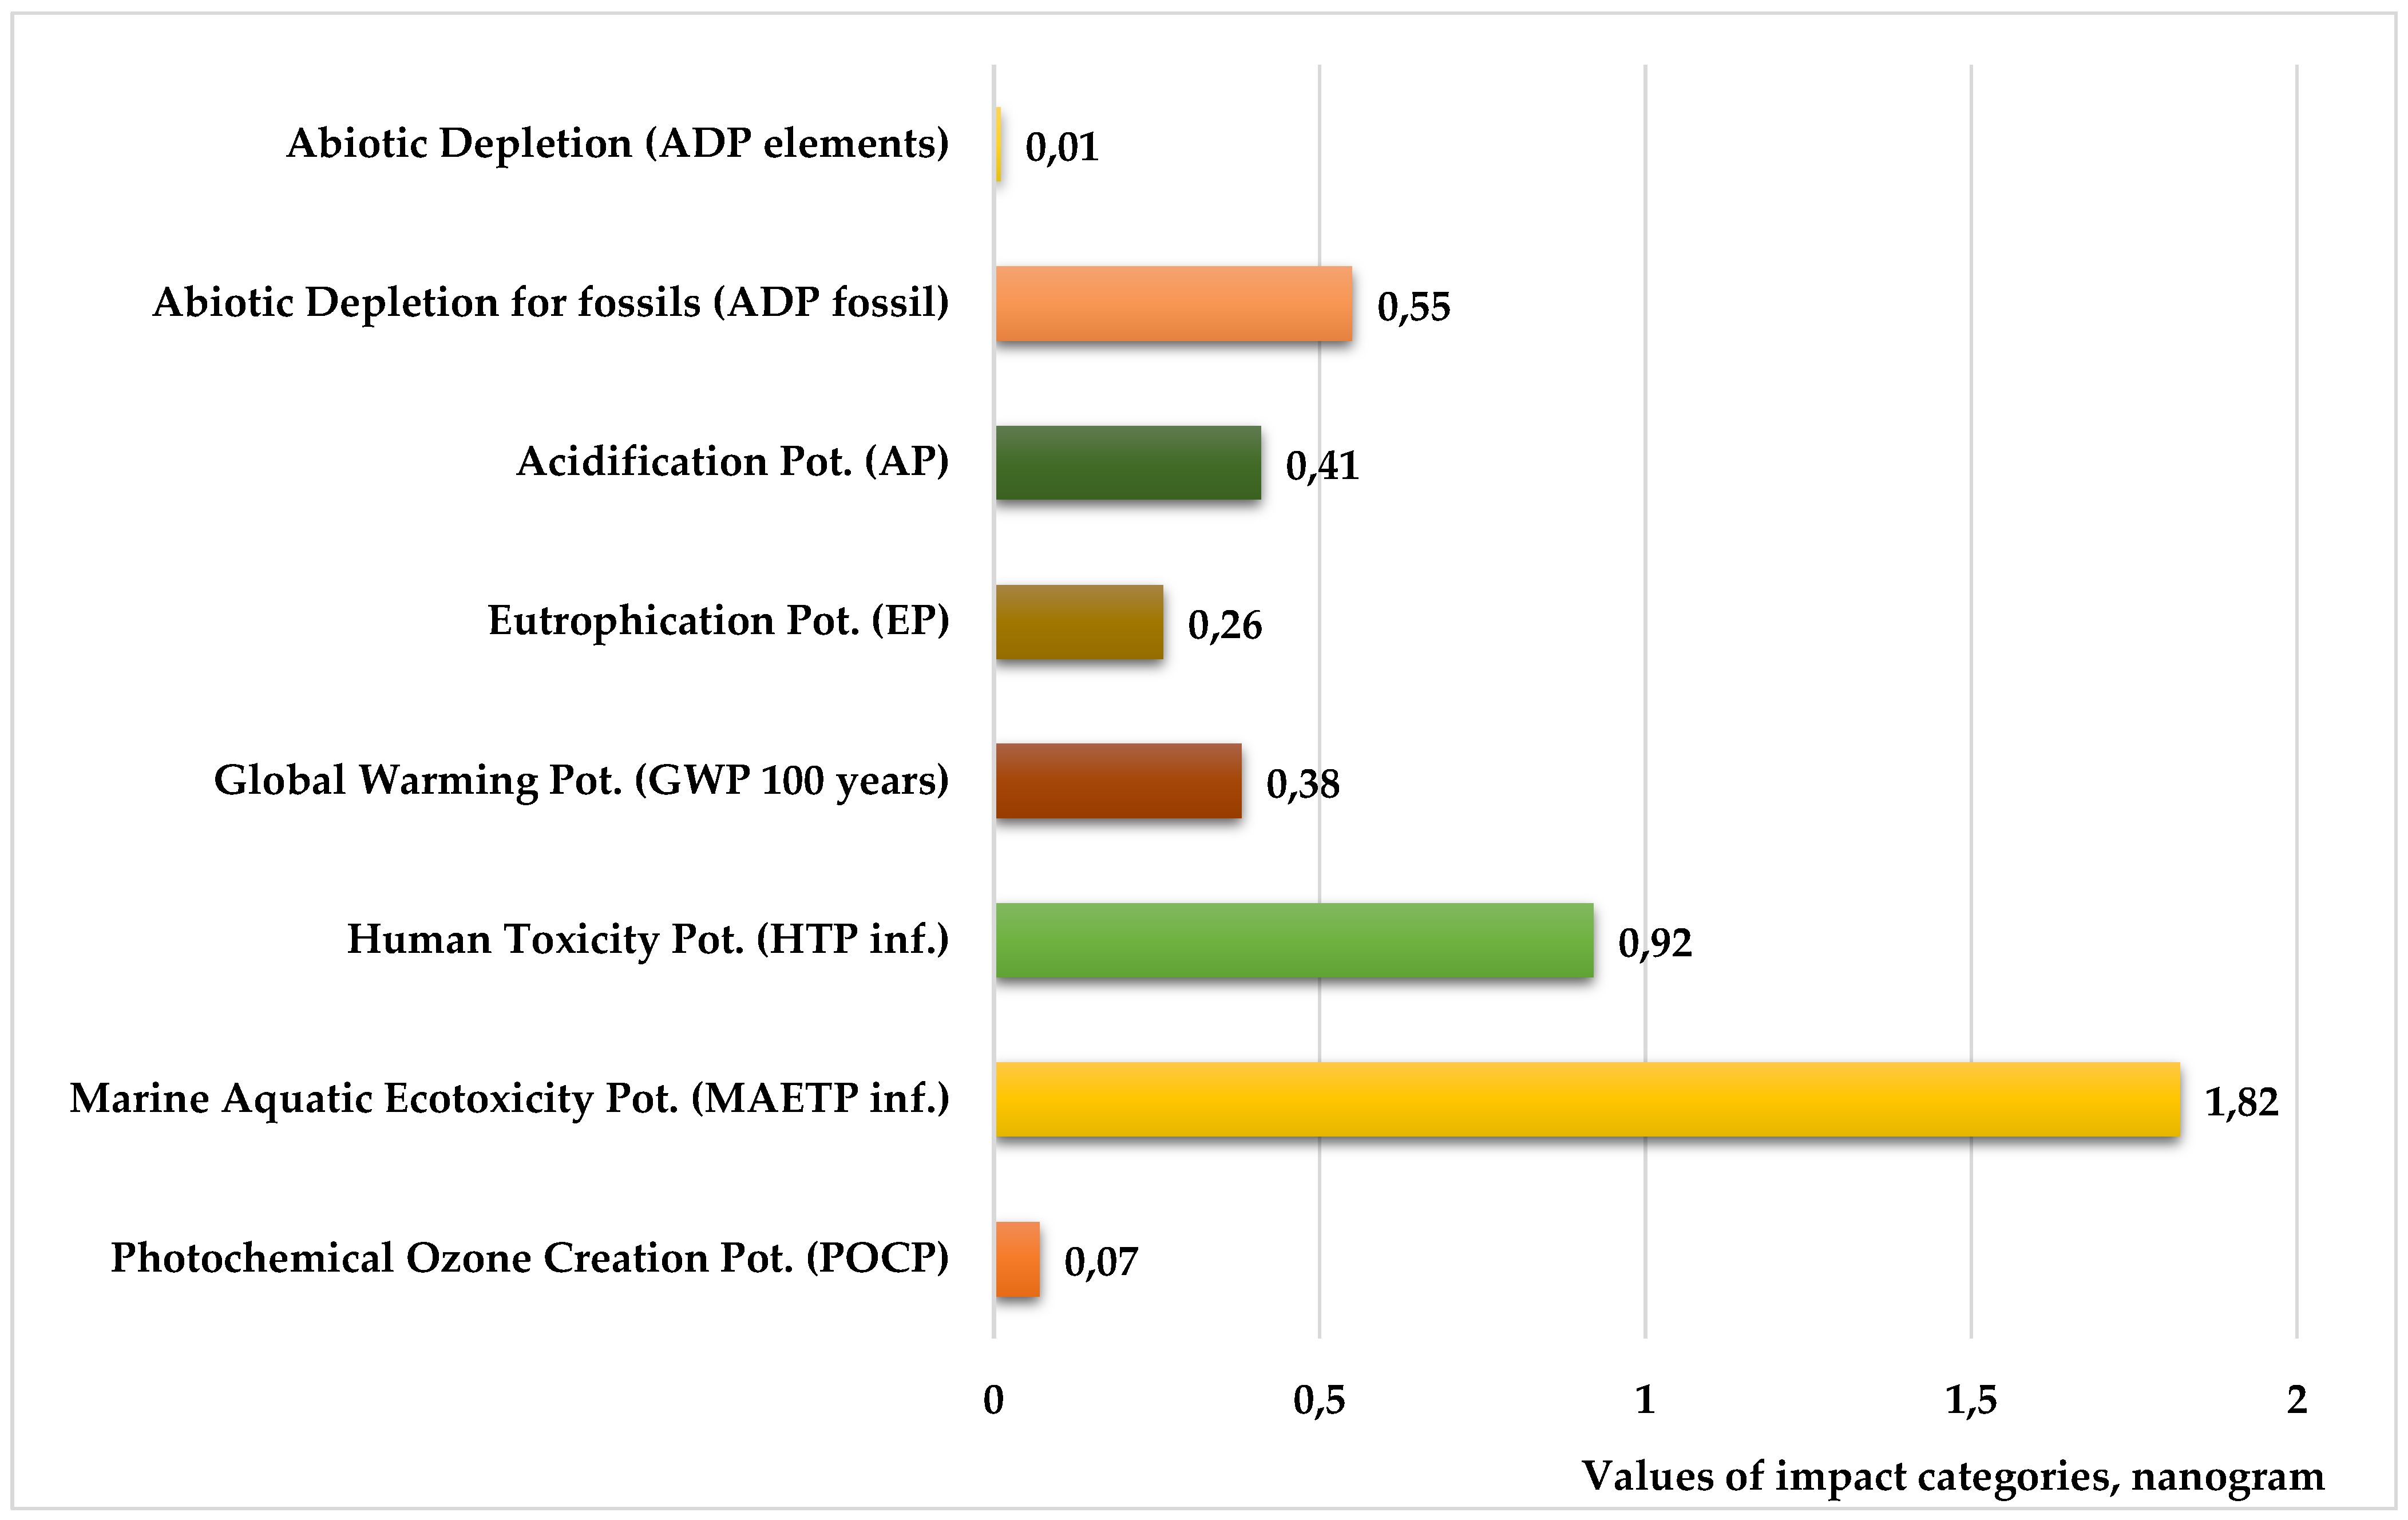
| Abiotic Depletion ADP elements | 0.071 | 0.014 |
| Abiotic Depletion ADP fossils | 0.986 | 0.549 |
| Acidification Potential AP | 8.850 | 0.413 |
| Eutrophication Potential EP | 3.450 | 0.261 |
| Global Warming Pot. GWP 100 years | 3.570 | 0.382 |
| Human Toxicity Potential HTP inf. | 1.030 | 0.921 |
| Marine A. Ecotox. Pot. MAETP inf. | 9.180 | 1.820 |
| Photochem. Ozone Creat. Pot. POCP | 4.490 | 0.072 |
| Type of Primary Energy | Preparation | Cooking/Frying |
|---|---|---|
| Primary energy demand from ren. and non ren. resources (gross cal. value) | 33.4 | 7.24 |
| Primary energy demand from ren. and non ren. resources (net cal. value) | 32.9 | 6.93 |
| Primary energy from non renewable resources (gross cal. value) | 7.63 | 3.69 |
| Primary energy from non renewable resources (net cal. value) | 7.13 | 3.38 |
| Primary energy from renewable resources (gross cal. value) | 25.8 | 3.55 |
| Primary energy from renewable resources (net cal. value) | 25.8 | 3.55 |
| Type of Primary Energy | Scenario 1 Landfilling | Scenario 2 Incineration | Scenario 3 Composting |
|---|---|---|---|
| Primary energy demand from ren. and non ren. resources (gross cal. value) | 0.110 | 0.083 | 0.004 |
| Primary energy demand from ren. and non ren. resources (net cal. value) | 0.102 | 0.078 | 0.001 |
| Primary energy from non renewable resources (gross cal. value) | 0.103 | 0.072 | 0.034 |
| Primary energy from non renewable resources (net cal. value) | 0.095 | 0.067 | 0.032 |
| Primary energy from renewable resources (gross cal. value) | 0.007 | 0.011 | −0.030 |
| Primary energy from renewable resources (net cal. value) | 0.007 | 0.011 | −0.030 |
| Name of Life Cycle Phase | Traditional Technique | Sous Vide Technique |
|---|---|---|
| Preparation | 4.280 | 1.860 |
| Cooking/Frying | 0.391 | 0.775 |
| End-of-life (Scenario 1) | 0.031 | 0.029 |
| Total life cycle | 4.702 | 2.664 |
Publisher’s Note: MDPI stays neutral with regard to jurisdictional claims in published maps and institutional affiliations. |
© 2022 by the authors. Licensee MDPI, Basel, Switzerland. This article is an open access article distributed under the terms and conditions of the Creative Commons Attribution (CC BY) license (https://creativecommons.org/licenses/by/4.0/).
Share and Cite
Avató, J.L.; Mannheim, V. Life Cycle Assessment Model of a Catering Product: Comparing Environmental Impacts for Different End-of-Life Scenarios. Energies 2022, 15, 5423. https://doi.org/10.3390/en15155423
Avató JL, Mannheim V. Life Cycle Assessment Model of a Catering Product: Comparing Environmental Impacts for Different End-of-Life Scenarios. Energies. 2022; 15(15):5423. https://doi.org/10.3390/en15155423
Chicago/Turabian StyleAvató, Judit Lovasné, and Viktoria Mannheim. 2022. "Life Cycle Assessment Model of a Catering Product: Comparing Environmental Impacts for Different End-of-Life Scenarios" Energies 15, no. 15: 5423. https://doi.org/10.3390/en15155423