Article

Technological and Energetic Aspects of Multi-Component Co-Digestion of the Beverage Industry Wastes and Municipal Sewage Sludge

by
Aleksandra Szaja
1,*,
Agnieszka Montusiewicz
1,
Sylwia Pasieczna-Patkowska
2 and
Magdalena Lebiocka
1
1
Faculty of Environmental Engineering, Lublin University of Technology, Nadbystrzycka 40B, 20-618 Lublin, Poland
2
Department of Chemical Technology, Faculty of Chemistry, Maria Curie Skłodowska University, Pl. Marii Curie-Skłodowskiej 3, 20-031 Lublin, Poland
*
Author to whom correspondence should be addressed.
Energies 2022, 15(15), 5395; https://doi.org/10.3390/en15155395
Submission received: 27 June 2022 / Revised: 14 July 2022 / Accepted: 23 July 2022 / Published: 26 July 2022
(This article belongs to the Collection Feature Papers in Energy, Environment and Well-Being)

Abstract

:
In the present study, the co-digestion effectiveness of the selected beverage wastes and municipal sewage sludge in two- and three-component mixtures was evaluated. Orange peels and orange pulp, as well as brewery spent grain were applied as co-substrates to sewage sludge at the following doses: 1.5 and 3.0 g of orange peels, 2.5 and 5 g of orange pulp, and 1.5 g brewery spent grain. Mono-digestion of sewage sludge was used as a control. The experiments were performed under mesophilic conditions in batch reactors. As compared to the control, only in the presence of the highest dose of pulp, brewery spent grain and sewage sludge was the increased methane production of 395 mL CH4 g−1 VS accompanying an additional energy profit of 82% observed. Moreover, in this case, the enhanced volatile solids removal and lower accumulation of p-cymene were found. These results were despite the increased limonene and phenol content in the feedstock, confirming a synergistic effect at the highest dose of pulp, brewery spent grain and sewage sludge.

1. Introduction

Currently, industrial food production generates considerable amounts of by-products, the effective management of which still remains a technological and economical challenge. A significant share of the global market is represented by beverage manufacturing (both alcoholic and non-alcoholic). Despite major technological improvements, this industry is recognised as the most energy- and water-consuming. Moreover, its production is related to substantial CO2 emissions. Presently, the global beverage market is dominated by the orange juice and beer industry [1,2,3]. When processing orange juice, about 50–60% of the fresh fruit becomes waste, which includes peel, seeds, pulp and membrane residues [4,5,6]. In contrast, about 85% of all by-products generated by the beer industry are represented by brewery spent grain [7]. This solid fraction is composed mainly by the husk and pericarp-seed coat that covers the barley grain [8]. Disposal of both solid residues indicates many difficulties for companies. Due to significant moisture content, their properties deteriorate rapidly, making long-term storage impossible; long-distance transport should also be avoided because of the significant costs. Additionally, both types of waste contain a high organic load; for this reason, they cannot be directly discharged into the environment. Therefore, their reuse, recovery and recycling are limited [4,9].
In turn, the afore-mentioned wastes comprise numerous valuable components. Orange waste contains various nutrients, including vitamins A, B and C; minerals (phosphorus, calcium, and potassium); triterpenes; amino acids; phenolic acids and carotenoids [10]. In contrast, brewery spent grain exhibits a significant content of lipids, proteins, minerals (calcium, phosphorus, magnesium, sulphur, and potassium) and vitamins (folic acid, biotin, niacin, thiamine, choline, riboflavin, pyridoxine, and pantothenic acid), providing a high buffering capacity [7,11,12].
Another interesting pathway is their energetic application. This is particularly important, bearing in mind the current geo-political situation and a need to become independent from conventional energy sources. Anaerobic digestion (AD) is a widespread and well-known technology for effective waste management [13,14,15]. Compared to other methods of waste recovery such as biodiesel generation and biomaterials production, it allows for both alternative energy production as well as the generation of a valuable by-product (digestate) that might be used as fertilizer [16,17,18]. However, as a multi-stage and complex process that involves a wide range of bacteria and archaea, it is vulnerable to the instability caused by many factors, including the accumulation of long-chain fatty acids, volatile fatty acids (VFAs), free ammonia and other inhibitors, as well as frequently unfavourable operating conditions [13,18,19,20].
Due to the valuable composition and significant biogas potential, both orange wastes and brewery spent grain seem to meet the requirements of energy recovery. However, their anaerobic bioconversion may be difficult. Orange waste is characterised by low pH and high biodegradability that together may lead to the fast accumulation of VFAs. Moreover, it has a relatively small amount of protein and fat, containing limonene—a major AD inhibitor which affects the hydrolytic–acidogenic and methanogenic activity [2,9,21,22]. Using brewery spent grain as an AD mono-substrate is ineffective, mainly due to phenol (mainly p-cresol) inhibition [23]. What is more, brewery spent grain contains lignin, commonly known for low bioconversion efficiency related to its fibrous structure, lending itself to rigidity of materials and inhibiting hydrolysis; thus, it requires prolonged retention time, as compared to other substrates [12,24,25,26,27]. In order to overcome these difficulties, both by-products should be pre-treated prior to AD. In the case of orange waste, steam explosion and distillation, solvent leaching, as well as biological methods (fungi, alkali application and ensiling) have been involved to remove limonene [22]. In turn, for brewery spent grain, thermal [28] and thermochemical [24] pre-treatments, as well as the addition of trace elements [29], have been studied.
Nonetheless, the application of these methods requires additional investment and operating costs that many facilities cannot afford. In this context, anaerobic co-digestion with other adequate selected waste may be a promising solution. The state-of-the-art shows that both orange waste and brewery spent grain have been co-digested with various by-products. The orange peels were added to residual glycerol, wherein the methane production reached the value of 330 mL CH4 g−1 VS. However, an inhibition occurred at high organic loads [30]. The beneficial results were observed in tertiary mixtures with sewage sludge and biochar addition. In this case, the methane production exceeded the value of 500 mL CH4 g−1 VS [22]. Moreover, citrus pulp was co-digested with multiple agricultural residues, such as corn silage, cattle manure, poultry litter, whey and olive pomace [31]. In this study, at the presence of highest dose of citrus pulp (42%), the enhanced biogas production of 231 mL CH4 g−1 VS was observed. The brewery spent grain was anaerobically treated with sewage sludge and cheese whey [32], azo dye [33], cow dung and pig manure [34], cattle dung [35] as well as Jerusalem artichokes [36]. In those studies, the average biogas productions varied between 290 and 640 mL g−1 VS. In turn, an application of ultrasonic cavitation as brewery spent grain pre-treatment method before its AD resulted in four-fold higher methane production as compared to the control reactor [16].
Nevertheless, it should be noticed that more favourable results were observed in the tertiary mixtures for both the brewery spend grain and orange waste substrates. Taking into account both the economic factor and the easy implementation in a full scale, the application of sewage sludge as a basic substrate for orange waste and brewery spent grain co-digestion seems to be particularly beneficial. It should be noted that sewage sludge is the main by-product from wastewater treatment plants (WWTPs), generated globally in large quantities [37]. Its treatment is related to a significant operational WWTP cost due to high energy consumption, while the mono-digestion of sewage sludge results in low methane production, as it corresponds to the substrate characteristics—i.e., deficiency of organic matter, imbalanced C/N ratio (carbon to nitrogen ratio) and presence of inhibitors (heavy metals, pharmaceuticals and pathogens). At many WWTPs, the digesters are usually oversized (even up to 30%), which enables introducing an additional substrate without any investments [18]. The implementation of both beverage wastes as co-substrates for sewage sludge anaerobic digestion might improve the feedstock composition by ensuring a significant amount of organic matter. It should be pointed out that such a study has not yet been conducted.
The basic novelty of the work is such a multi-aspect investigation, estimating the effect of another substrate (brewery spent grain) addition on the efficiency of orange waste and sewage sludge co-digestion. It is worth mentioning that many studies conducted in this field have concerned only two-component mixtures. The works involving additional components are rare—although the use of an additional substrate may allow for the efficient anaerobic bioconversion of orange waste in anaerobic co-digestion, with sewage sludge providing an additional energy gain for the WWTPs. Orange waste could increase the C/N ratio, while brewery spent grain could provide the required buffering capacity. Importantly, each of these indicates a significant biogas potential and contains the micro-elements stimulating the activity of methanogens, and thus contributing to the increase in biogas production. However, anaerobic co-digestion performance and its operational conditions should be constantly monitored due to the presence and effect of inhibitors typical of the co-substrates mentioned.
The aim of this study is to evaluate the effectiveness of the co-digestion of selected beverage wastes and municipal sewage sludge in tertiary mixtures, comparing the results with those for two-substrate configurations. Orange peels and pulp as well as brewery spent grain have been applied as co-substrates. The influence of orange waste and brewery spent grain addition on sewage sludge anaerobic digestion is examined on the basis of biogas/methane yields, kinetics (using four different models) and volatile solids removal (VSR). Additionally, the effects of limonene, phenols and p-cymene are evaluated by Fourier-transform infrared photoacoustic spectroscopy (FT-IR/PAS) analysis. To evaluate the possible energy profits resulting from the implementation of these substrates to the existing digester, the energy analysis is also provided. It should be noted that the proposed technology might be easily implemented on a technical scale without significant financial outlays.

2. Materials and Methods

2.1. Substrates and Inoculum

The sewage sludge and inoculum were collected from a mechanical-biological municipal WWTP in Lublin (Hajdów), Poland. The inoculum originated as effluent sludge from mesophilic digesters. Immediately after collection it was transported to the laboratory and then it was sieved to remove fibres and particles above 5 mm. Subsequently, it was introduced into batch reactors, where it was stored under anaerobic conditions at 37 °C to diminish the non-specific biogas production. The procedure of inoculum preparation was adopted from a study conducted by Angelidaki et al. [38]. This sample was characterised by total solids (TS) and volatile solids (VS) of 18.85 ± 0.23 and 9.95 ± 0.16 g kg−1, respectively, as well as a pH of 7.9 ± 0.1.
The sewage sludge was a main substrate; it was prepared as a mixture of primary and waste sludge, both thickened, and taken separately from Hajdów WWTP. Immediately after collection, the samples were sieved and mixed in a volumetric ratio of 60:40 v/v under laboratory conditions. Such a proportion is recommended as beneficial for an effective biogas production from sewage sludge.
In the present study, the following beverage solid residues were used as additives for co-digestion with sewage sludge: orange peels, pulp and brewery spent grain. The first two substrates were prepared under laboratory conditions as by-products from a bench-scale orange juice processor. These were mechanically blended to obtain a particle size of 2–5 mm. Then, these samples were frozen and stored at −25 °C in a laboratory freezer. Before each experiment, they were thawed. Brewery spent grain originated from a craft brewery located in Lublin, Poland. Before supplying the reactor, it was dried at a temperature of 55 °C for at least for two hours in a laboratory dryer. Such preparation of the substrates was adopted to maintained unchanged co-substrate properties during the experiment. This procedure allowed for the elimination of the substrate composition variability’s influence on the obtained results. The composition of the sewage sludge and co-substrates was controlled every time while introducing them into the reactors (Table 2).

2.2. Laboratory Installation and Operational Set-Up

The batch tests were conducted with the specially designed BioReactor Simulator (Bioprocess Control AB, Lund, Sweden). It compromised 6 reactors, with an active volume of 2.0 L. Each digester was equipped with a mechanical stirrer operating on a cycle of 5 min mixing and 25 min resting. In order to maintain a proper temperature, reactors were kept in a water bath. The biogas production was monitored and recorded automatically by using a wet gas flow-measuring unit that operated on the principle of liquid displacement and buoyancy and was integrated with the system for continuous data acquisition. Before the experiments, all reactors were flushed with inert gas (N2) to achieve anaerobic conditions.
Each bottle was supplied with 1.4 L of inoculum and 0.4 L of sewage sludge. The substrate-to-inoculum ratio was adopted based on a procedure given by Angelidaki et al. [38]. In order to evaluate the co-digestion efficiency, a separate control series (R1) was provided, wherein no co-substrates were added. In R2–R5, the anaerobic co-digestion of sewage sludge and orange waste in a two-component system was studied. In turn, in R6–R8, three-component co-digestion was evaluated. The adopted operational set-up is shown in Table 1. The study was conducted under mesophilic conditions (37 °C) and lasted 21 days. The experiments were repeated three times under unchanged operational conditions; for each one, new samples of inoculum and sewage sludge were taken and prepared in the same manner.

2.3. Analytical Methods

Feedstock and digestate composition were monitored by analysing the following parameters: total chemical oxygen demand (COD), TS, VS, total nitrogen (TN) and total phosphorus (TP). The soluble chemical oxygen demand (SCOD), VFA, alkalinity (ALK), ammonia nitrogen (NH4+−N) and orthophosphate phosphorus (PO43−−P) were measured in supernatant. The soluble fraction was obtained by centrifugation of the samples at 4000 r min−1 for 30 min. The composition of substrates was examined after their collection. For each one, the analogous parameters, as listed above, were included. TS and VS were determined using the Standard Methods for the Examination of Water and Wastewater [39]. Other analyses were performed using Hach Lange UV–VIS DR 3900 (Hach, Loveland, CO, USA) and s cuvette tests. The pH values were monitored using a HQ 40D Hach Lange multimeter (Hach, Loveland, CO, USA).
In order to examine the biogas composition, a ThermoTrace GC-Ultra gas chromatograph provided by Thermo Fisher Scientific (Milan, Italy) was applied. It was equipped with a conductivity detector fitted with divinylbenzene (DVB) packed columns (RTQ-Bond). The parameters for the analyses were: 50 °C for the injector and 100 °C for the detector; the employed carrier gas was helium, with a flow rate of 1.5 cm3 min−1.
Trace GC Ultra PolarisQ (Thermo Electron, Italy) was used to analyse the limonene and p-cymene contents. The parameters of the capillary column were: Supelco (30 m × 0.25 mm ID × 0.25 μm). The spectra were taken under the following conditions: transporter gas helium, with a flow rate of 1.5 cm3 min−1; injection volume of 1 mL. The inlet temperature was initially 40 °C. It was then raised by 5 °C/min to reach the level of 250 °C, where it was kept for 3 min. In order to estimate the peak areas, the CHROM-CARD software was involved.

2.4. Kinetic Modelling

The kinetic evaluation was performed using four different models: Hyperbolic, modified Gompertz, cone and logistic growth. Their equations are presented below:
  • Hyperbolic
P ( t ) = P m · ( k · t 1 + k · t ) ,
  • Modified Gompertz
P ( t ) = P m · e x p ( e x p ( R m · e P m e x p ( λ t ) + 1 ) ) ,
  • Cone
P ( t ) = P m 1 + ( k · t ) n   ,
  • Logistic growth model
P ( t ) = P m ( 1 + exp ( 4 · R m · ( λ t P m ) ) + 2 )     ,
where:
  • P(t) is the cumulative methane production (mL CH4 g VS−1);
  • Pm is the methane production (mL CH4 g−1 VS);
  • Rm is the is the maximum methane production rate (mL CH4 g−1 VS d−1);
  • e is a constant (2.71828);
  • λ is the lag phase (d);
  • n is the dimensionless shape factor;
  • k is rate constant (d−1).
To indicate the suitability of the model, the root-mean-square error (RMSE) was applied. It was estimated using the following equation [40]:
RMSE = ( P e x p P m o d ) 2 N   ,
where:
  • Pexp is the methane production achieved in the experiment (mL CH4 g−1 VS);
  • Pmod is the methane production achieved in kinetic evaluation (mL CH4 g−1 VS);
  • N is a number of measurements.

2.5. FT-IR/PAS Analysis

The samples of feed and digestate were collected from the reactors for FT-IR/PAS (Fourier-transform infrared photoacoustic spectroscopy). First, they were dried via sublimation (i.e., lyophilised). The 50 mL samples were frozen at a temperature of −25 °C in the laboratory freezer and subsequently dried at −56 °C by means of an Alpha 1–4 freeze dryer. The FT-IR/PAS spectra of the lyophilised samples were obtained by using a Nicolet 6700 spectrometer and a Gasera PA301 photoacoustic cell in the 3800–700 cm−1 range, resolution 4 cm−1, at room temperature. Dry helium was utilized to purge the photoacoustic cell prior to the collection of data. By computing the ratio of a sample spectrum to the spectrum of a carbon black standard, the spectra were normalised. A stainless-steel cup with a diameter of 10 mm was filled with the sample that had a thickness of less than 3 mm. Interferograms of 1024 scans were averaged for the spectrum; thus, a good signal-to-noise (S/N) ratio was provided. The smoothing functions were not used. All spectral measurements were performed with at least three repetitions.

2.6. Statistical Analysis

All performed analyses were performed in triplicates; the average values and standard deviation are given in tables and figures. For statistical analysis, ANOVA (Shapiro-Wilk’s, Levene’s and Tukey’s tests were included) was performed with Statsoft Statistica software (v 13). The significance level was assumed at p < 0.05. All kinetic constants were established using a non-linear regression method. The strength of the relationships between the results was determined using Pearson’s correlation coefficient (R) and determination coefficient (R2).

3. Results and Discussion

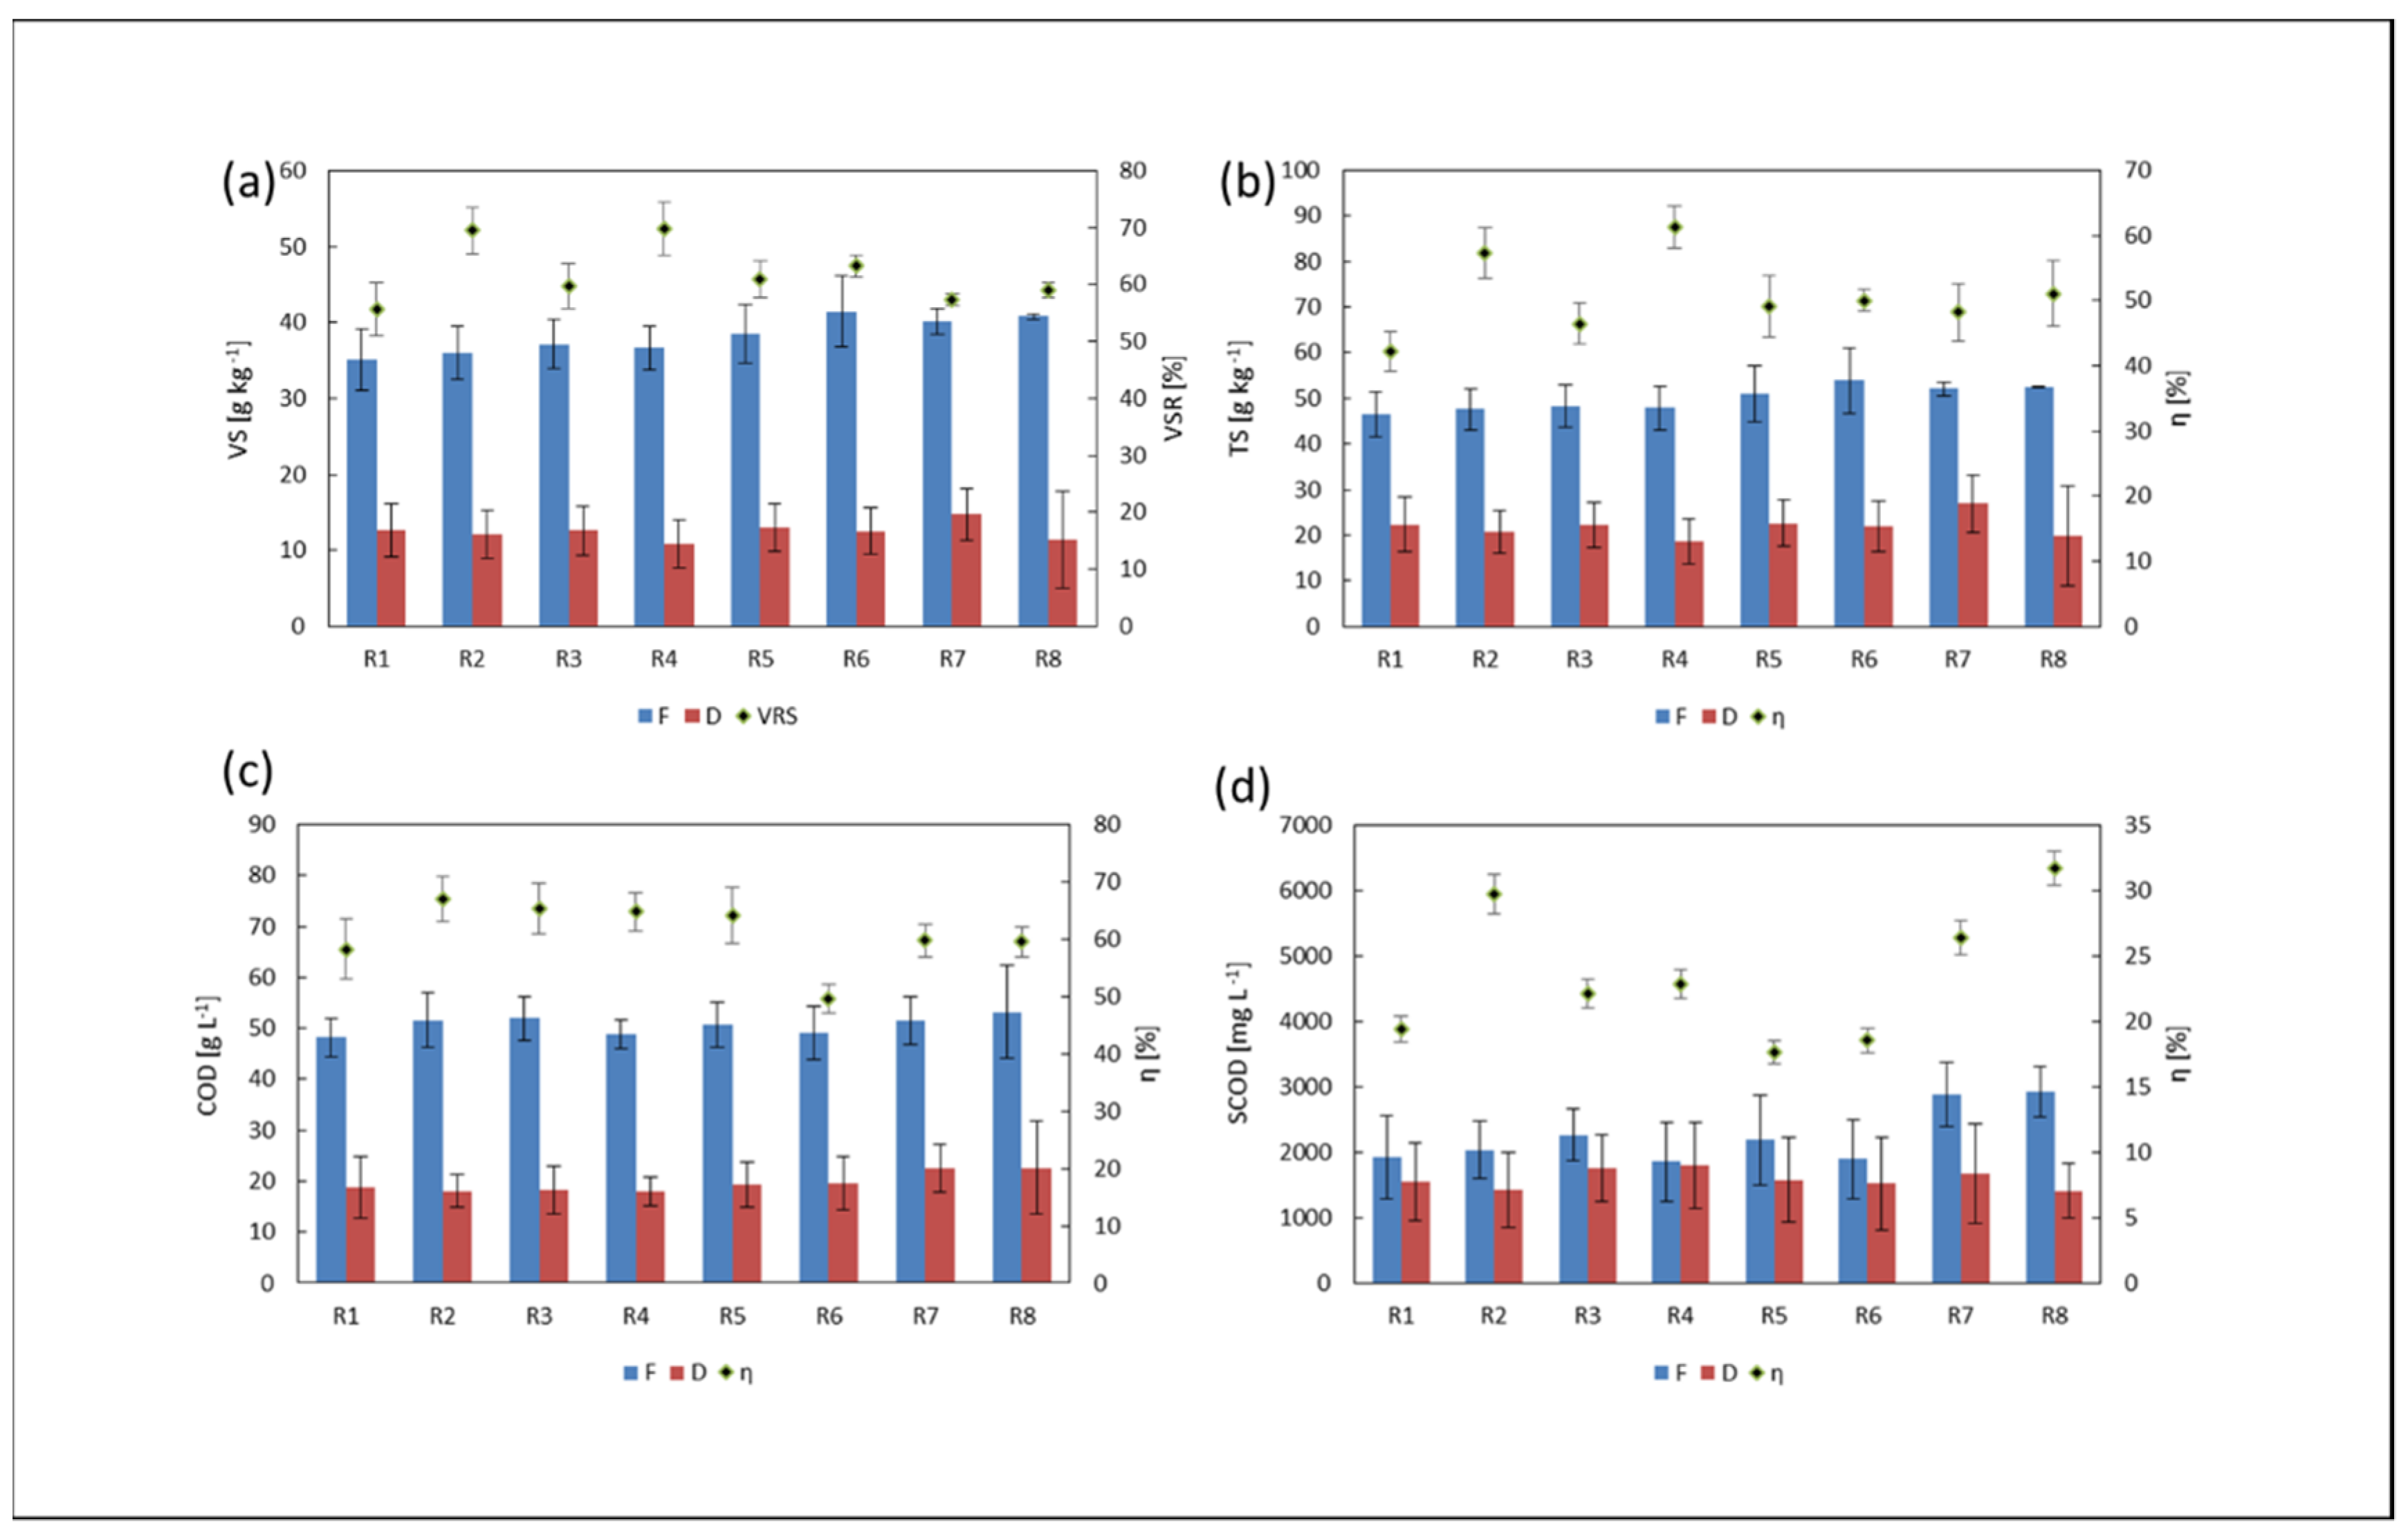
3.1. Characteristics of Substrates and Organic Removal

The characteristics of the applied substrates are presented in Table 2. The used orange wastes indicated similar composition. Both orange peels and pulp were characterised by a low pH, relatively high organic content and comparable nutrient contents. The major differences were observed for TS, VS and phenol and limonene content. It should be pointed out that the orange peels presented an enhanced concentration of inhibitors: phenol and limonene, which might be problematic in anaerobic bioconversion. In turn, brewery spent grain was characterised by the highest organic content as well as nitrogen and phosphorus concentrations. Moreover, to other applied substrates, it indicated an enhanced alkalinity.
The composition of feedstock and digestate is shown in Figure 1. Introducing co-substrates resulted in an increase in the VS, TS and COD contents as compared to the control (sewage sludge only), and the highest enhancements were observed for VS and TS in three-component anaerobic co-digestion.
This observation was related to the enrichment of feedstock with brewery spent grain (Table 2) by 18, 14 and 16% for VS, as well as 15, 12 and 12.5% for TS in R6, R7 and R8, respectively. Considering COD, in two-component anaerobic co-digestion, the major increase of 7% was found in the presence of both orange pulp doses, while in three-component series it was 10% when involving 5 g of orange pulp and 1.5 g of brewery spent grain (R8). Similarly, the highest growths for SCOD of approx. 50% occurred in R7 and R8 at both doses of orange pulp mixed with brewery spent grain.
In relation to sewage sludge mono-digestion, the VSR and TS removal were improved every time (Figure 1a,b), although to a lesser extent in the series with brewery spent grain. The highest increases were found in the lowest co-substrates doses (with comparable VS loads to control). An increased organic load in feedstock might result in poor process performance and promote the process instability caused by VFA accumulation. In particular, this effect might occur in anaerobic co-digestion with easily biodegradable substrates such as fruit and other food wastes [41,42,43]. Nevertheless, such an effect was not observed when analysing the VFA in digestate (Table 3).
The results in terms of VSR were consistent with other studies. Serrano et al. [44] performed the mesophilic anaerobic co-digestion of sewage sludge and orange peels mixed at a proportion of 70:30 (wet weight), achieving the VSR of 76%; in sewage sludge, the mono-digestion was only 53%. Martínez et al. [22] evaluated the anaerobic co-digestion of sewage sludge and orange peels, as well as sewage sludge, orange peels and biochar addition. At HRT of 20 days, VS was removed by 63 and 49% in the two- and three-component systems, respectively.
Considering the COD and SCOD, their removal was also improved as compared to the control, wherein a significant drop referred to the latter and reached 36 and 64% in R7 and R8, respectively. The increases might point to the effective consumption of soluble organics via anaerobic co-digestion. The exceptions were the reactors supplied by the orange peels and brewery spent grain (R6), as well as the highest orange peel dose (R5), wherein a declining trend occurred. It seems to indicate that the process inhibition was caused by the high concentration of p-cymene (Table 3) as a product of limonene conversion. Importantly, in R5 and R6, the highest concentrations of this compound in the feedstock were found.

3.2. Inhibitors Presence

To evaluate the influence of the co-substrate application on the process stability, the following parameters were analysed: the pH value, ALK, VFA concentration and the VFA/ALK ratio (Table 3).
It should be noted that all of the analysed parameters reached the values recommended for adequate methanogenic activity [45]. Stable process performance was also confirmed by the VFA/ALK ratio, which reached values much below 0.3, ranging from 0.052 to 0.068 in all anaerobic co-digestion series, with the highest values found in the two-component system.
Due to the possible inhibitory effect, the contents of the phenolic compounds in the feedstock and digestate were also analysed [46]. Their negative influence on the AD process is connected to the damage of microbial cells through changing the membrane permeability, which might lead to the leakage of intra-cellular components and the inactivation of essential enzymatic systems [47]. However, its toxicity is dependent upon several factors, such as: concentration, micro-organisms’ consortium and acclimatization period [48].
The application of orange pulp and orange peels increased the content of phenols in the feedstock; however, the difference was of no statistical significance. The significant changes were found in the three-component anaerobic co-digestion. In R6, the concentration was enhanced twice, while in R7 and R8, more than three-fold increases were noticed. It was not surprising due to the composition of substrates used and their doses (Table 1 and Table 2).
Compared to the feedstock compositions in R1, R3 and R4, a slight increase in the phenol content in the digestate was found. In the remaining series, the concentration of phenols decreased, indicating their metabolization through anaerobic co-digestion. Importantly, the major removal efficiency of approx. 57% was noted in the anaerobic co-digestion of orange pulp and brewery spent grain. Some studies have indicated that the presence of easily biodegradable substrates might improve the degradation of recalcitrant compounds, such as phenol; this effect is related to the occurring co-metabolism and presence of enzymes involved in these mechanisms [49,50,51]. This observation also confirmed the synergistic effect occurring between substrates.
In the present study, the limonene and p-cymene contents were also analysed. This was due to the possible inhibitory effect of limonene, which is related to the occurrence of cymene which is generated during biotransformation of the former in AD [21]. Inhibition is expected because essential oils might accumulate in the cell membrane and change its fluidity, resulting in increased permeability and finally lead to leakage of the cell contents [52].
The application of both orange wastes resulted in a significant increase in the limonene concentration, as compared to sewage sludge. There were 3.8, 4.7, 10.7, 21.1, 16.1, 9.9 and 13.3-fold increases in feedstock for R2, R3, R4, R5, R6, R7 and R8, respectively—the greatest increase being in the presence of orange peels. The major increment was obviously related to the application of the highest orange peel dose. In turn, the p-cymene content was at a low level. The introduction of co-substrates slightly increased its concentration in the feedstock, with the exception of R2. As shown in Table 3, in all series, limonene was efficiently degraded in the AD process. The related removal efficiencies were 67, 85, 85, 94, 95, 97, 93 and 96% in R1, R2, R3, R4, R5, R6, R7 and R8, respectively. Simultaneously, a significant increase in the p-cymene content of the digestate was noted. The exception was a control series fed with sewage sludge, wherein its removal was observed. Furthermore, the major increases indicating the accumulation of p-cymene through anaerobic co-digestion were observed in the presence of orange peels, and they corresponded with both the high content of limonene in the feedstock (R4, R5 and R6) and the orange peel dose.
In three-component anaerobic co-digestion, using orange pulp and brewery spent grain as co-substrates (R7 and R8), and despite a significant content of limonene in the feedstock, a lower accumulation of p-cymene has been recorded. This seems to indicate the greater flexibility of such a configuration and its usefulness in metabolizing the by-products generated through the biotransformation of limonene. The synergistic effect in anaerobic co-digestion of orange pulp, brewery spent grain and sewage sludge was confirmed. The obtained results are consistent with other studies that suggested the co-digestion strategy for reducing the toxicity of individual substrates [53]. The previous studies have indicated that anaerobic micro-organisms exhibit some adaptability to the inhibitory effect of essential oils, while its extent depends on various factors such as the type of substrate and kind of inoculum, as well as the temperature [54].
The beneficial effect observed in the batch system needs to be confirmed each time in the semi-flow configuration, where operational factors (i.e., organic loading rate and hydraulic retention time) significantly affect the anaerobic co-digestion performance. In such systems, the process inhibition might occur more rapidly due to the continuous supply of the substrate, the accumulation of toxicants and insufficient biomass adaptation. Accordingly, studies in future would continue to involve a semi-flow mode.

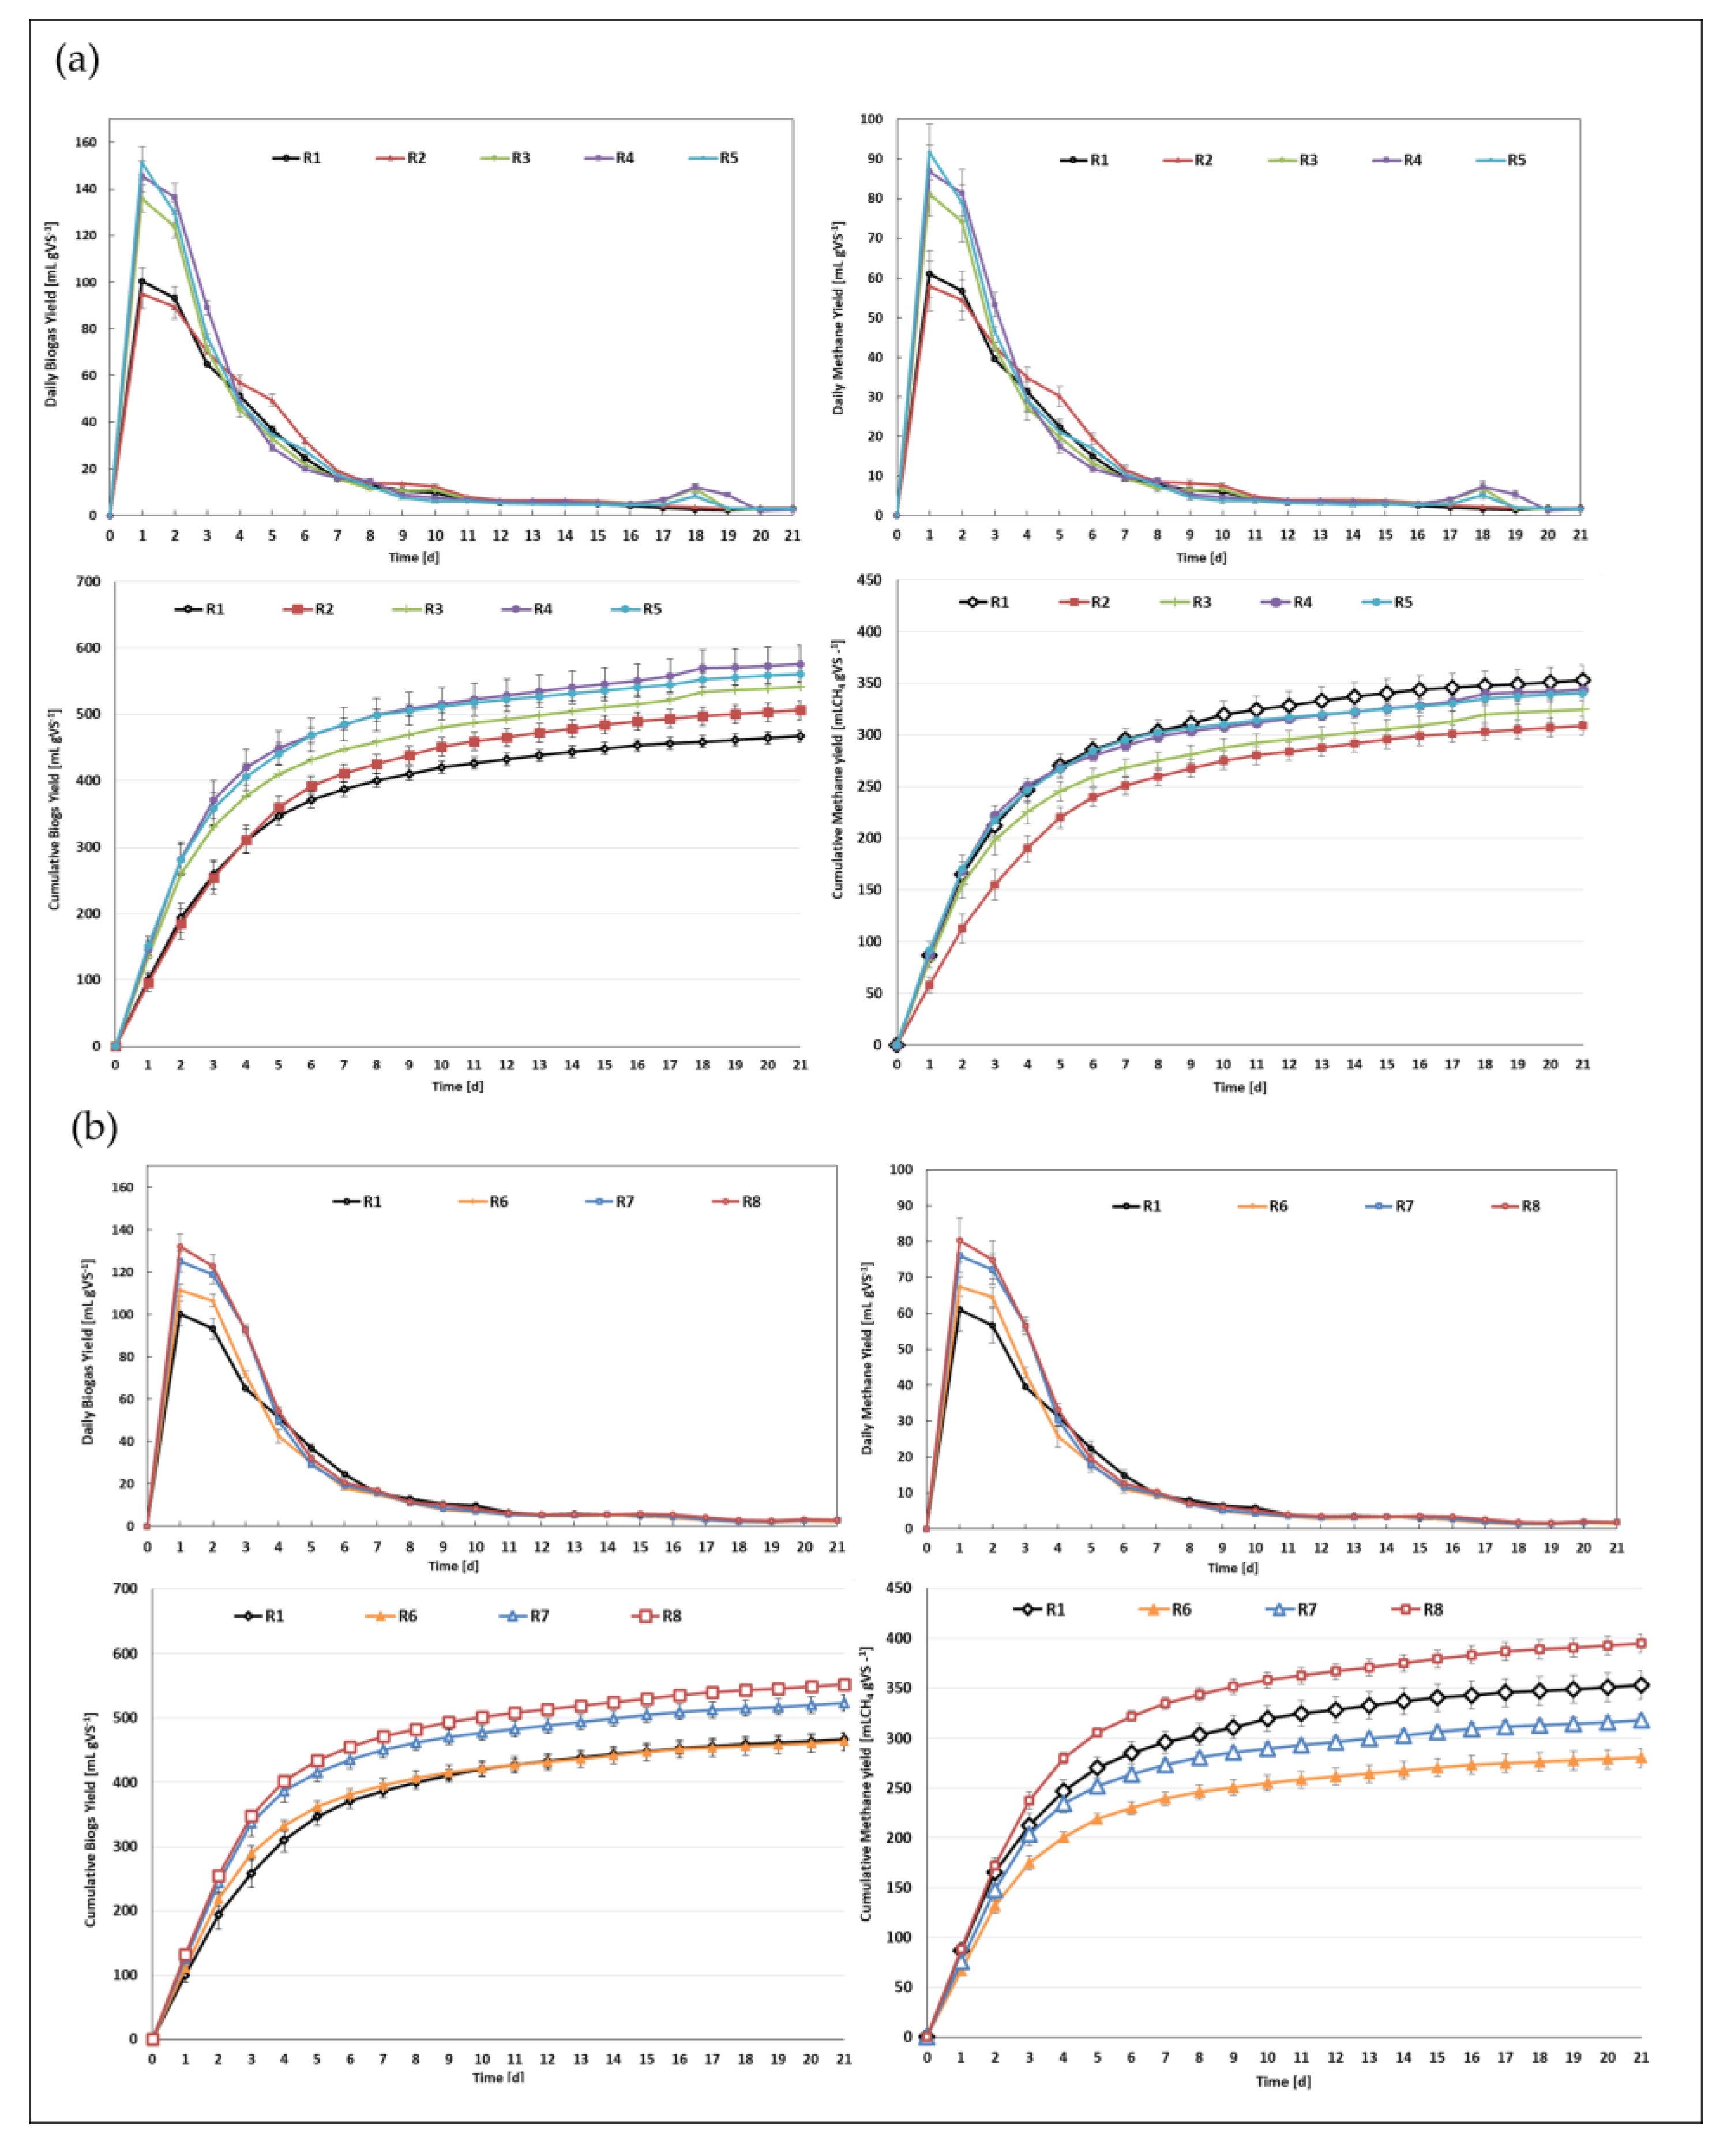
3.3. Biogas and Methane Productions

The results of biogas and methane production are presented in Figure 2 and Table 4. As is shown in Figure 2, in all reactors, the peak related to decomposition of carbohydrates occurred within the first three days of the experiment. The highest initial growth was found at both orange peel doses. As compared to the control, the decrease in daily biogas and methane yields were observed only in the presence of the lowest dose of orange pulp (R2), with the subsequent enhancement between 4 and 10 days of the experiment. Moreover, between 17 and 20 days, a minor additional peak was noticed in the cases of R3, R4 and R5. Such fluctuations might result from the decomposition of the more complex compounds such as proteins and lignocellulose presented in the co-substrates [55].
The cumulative biogas production was improved in almost all of the co-digestion series. The statistically significant increments of 23, 20 and 18% were achieved in R4, R5 and R8, respectively, as compared to sewage sludge mono-digestion. Moreover, it should be pointed out that in R7, supplied by a lower dose of orange pulp and brewery spent grain, the enhancement of 12% occurred as compared to the control reactor (R1); however the observed change was of no statistical significance. The achieved increases were attributed to the introduction of co-substrates rich in organic matter, improving C/N and providing deficient micro- and macro-elements. This was favourable for the anaerobic co-digestion performance, which was indicated by the enhanced values of the biogas production rate (GPR) (Table 4). Ensuring optimal conditions for anaerobic micro-organisms contributed to enhancing the microbial activity, resulting in increased biogas production.
A different trend was observed in the tertiary mixtures in the presence of sewage sludge, orange peels and brewery spent grain (R6); therein, a comparable result to sewage sludge mono-digestion was found. This tendency occurred despite improved feedstock composition, as well as high VSR. It might indicate process inhibition related to the lowest pH in the feedstock and the presence of both limonene and phenol (Table 3). Moreover, in this case, micro-organisms were additionally involved in the transformation of complex compounds present in brewery spent grain, also contributing to the lower biogas production. This seems to be confirmed by the GPR value, which was the lowest among all the experiments (Table 4). The explanation might be the fact that cellulose, hemicellulose and lignin, as well as the interactions of these components, create a highly resistant structure for AD microbes [25]. Importantly, in the presence of both orange pulp and brewery spent grain, there was no adverse effect observed, which testifies to their proper selection for anaerobic co-digestion with sewage sludge.
It is not a surprise that the application of carbohydrate-rich substrates resulted in a reduction of the methane content in the biogas (Table 4). This obviously influenced the results in terms of methane production (Figure 2).
As compared to sewage sludge mono-digestion, an improvement of 12% was observed only in the presence of the highest dose of orange pulp and brewery spent grain (R8), accompanied by the highest MPR value. In turn, a major, statistically significant drop of 26% was found in three-component anaerobic co-digestion with orange peels and brewery spent grain, also confirming the process inhibition visible in the lowest MPR and cumulative methane production (Figure 2).
The results in terms of biogas/methane production, as well as the process disturbances, correspond to the previous studies referring to the application of citrus wastes in the anaerobic digestion process. The methane potential of various citrus peels varied between 353.9 and 398.2 mL CH4 g−1 VS [21]. However, in this case, process inhibition was observed for a limonene content higher than 200 mg kg−1. In turn, the AD of pre-treated orange peels by steam distillation resulted in the production of 230 mL CH4 g−1 VS. The higher values of 400–600 mL CH4 g−1 VS were observed under thermophilic conditions [6]. In a semi-flow system, Serrano et al. [44] evaluated the mesophilic anaerobic co-digestion of sewage sludge and orange peels mixed at a proportion of 70:30 (wet weight). The achieved methane yield was 165 mL CH4 g−1 VS, and the VSR reached 76%. Nevertheless, in this case, at the highest organic loads, the methane production decreased due to ammonia inhibition. Martinez et al. [22] supplemented the two-component mixture with biochar to overcome the limitation of the anaerobic degradation of sewage sludge and citrus peels. The enhanced values of 500 and 704 mL CH4 g−1 VS were observed in the presence of 10 and 30 g of biochar, respectively. The methane potential of sewage sludge and orange peels mixed at a VS ratio of 1:1 was only 298 mL CH4 g−1 VS. The increases in biochar presence were explained by the adsorption of inhibitors, as well as provided the high surface area that promoted the adhesion and growth of micro-organisms.

3.4. Kinetic Evaluation

According to Kainthola et al. [56], to analyse the results of a kinetic study, the percentage error between the experimental and predicted values should not exceed 25%. As was shown in Table 4, this condition has been fulfilled for all the applied models. Moreover, the results indicated that the best fitted model for selected substrates were the modified Gompertz, cone and logistic growth models; this fact was also confirmed by high R2 values as well as a low value of RMSE. Previous studies indicated that the modified Gompertz showed the best fit for anaerobic co-digestion systems [57,58]. In turn, the cone and logistic growth models have been frequently applied for various food wastes [58,59,60,61].
In both the hyperbolic and cone models, the k constant was improved in almost all of the anaerobic co-digestion series as compared to control, indicating enhanced rates of degradation in the presence of co-substrates [58,62]. The highest k values were found in the presence of both doses of orange peels and sewage sludge (R4 and R5), corresponding to increased biogas production. However, in R8, supplied by 5 g of orange pulp and 1.5 g of brewery spent grain, a comparable result to the control was found. This fact might be related to both the introduction of hardly biodegradable brewery spent grain with a significant lignin content and the increased dose of orange pulp [59,63]. A similar trend, indicating a drop in k during the anaerobic digestion of fruit residues with significant lignin content, was also observed by Zhao et al. [59].
In R2, fed by sewage sludge and the lowest dose of orange pulp, a decreased k was observed. This seems to confirm to the process inhibition caused by toxic compounds. It should be pointed out that the obtained k constants were higher than for those from other studies [64,65]. This is probably due to the fact that the value of k is directly related to the feedstock characteristic, as well as to the adopted process conditions (mono- or co-digestion, temperature, substrate doses and type of inoculum). It typically varies between a wide range of 0.02–0.49 d−1 [66]. Moreover, the higher k values were found in the cone model, though the same observation was found in the study performed by Zhao et al. [59].
While considering R8, there was no concordance between the tendency observed for the experimental data (MPR) and the k constant from the models listed above. It was shown that in the experiment an increased MPR value was found as compared to control. This seems to indicate some inadequacy in using such models for a complex, three-component feedstock of sewage sludge, orange pulp and brewery spent grain. It is commonly known that models are usually well verified for mono-substrates with strictly defined composition, although they might be inadequate for describing the complexity of the co-digestion of sewage sludge with other waste.
Regarding the maximum methane production rate, the increased values were found in the presence of both doses of orange peels (R4 and R5), as well as for orange pulp and brewery spent grain (R7 and R8) in the two- and three-component systems, respectively. Importantly, as compared to control, the decrease in this parameter occurred for both doses of pulp (R2 and R3) and for orange peels and brewery spent grain (R6), which is consistent with the trend observed for MPR (Table 4).
Lag phase describes the microbial adaptation to the substrates. In both modified Gompertz and logistic growth models, this parameter reached values below zero, indicating a sufficient acclimatization of micro-organisms to degrade the substrates and a rapid start to the reaction. The results also indicated the absence of the lag phase. Similar findings were reported by Zhao et al. [59] and Liew et al. [66]. The lowest values of λ corresponded to the highest dose of easily biodegradable orange pulp (R3). In contrast, the increased λ was obtained in the presence of co-substrates with a complex structure, such as brewery spent grain.
The values of the shape factor in the cone model were comparable to the results reported in literature (1.3–3.6) [58,60,64,67]. The increased values occurred in the presence of both the pulp and brewery spent grain co-substrates.

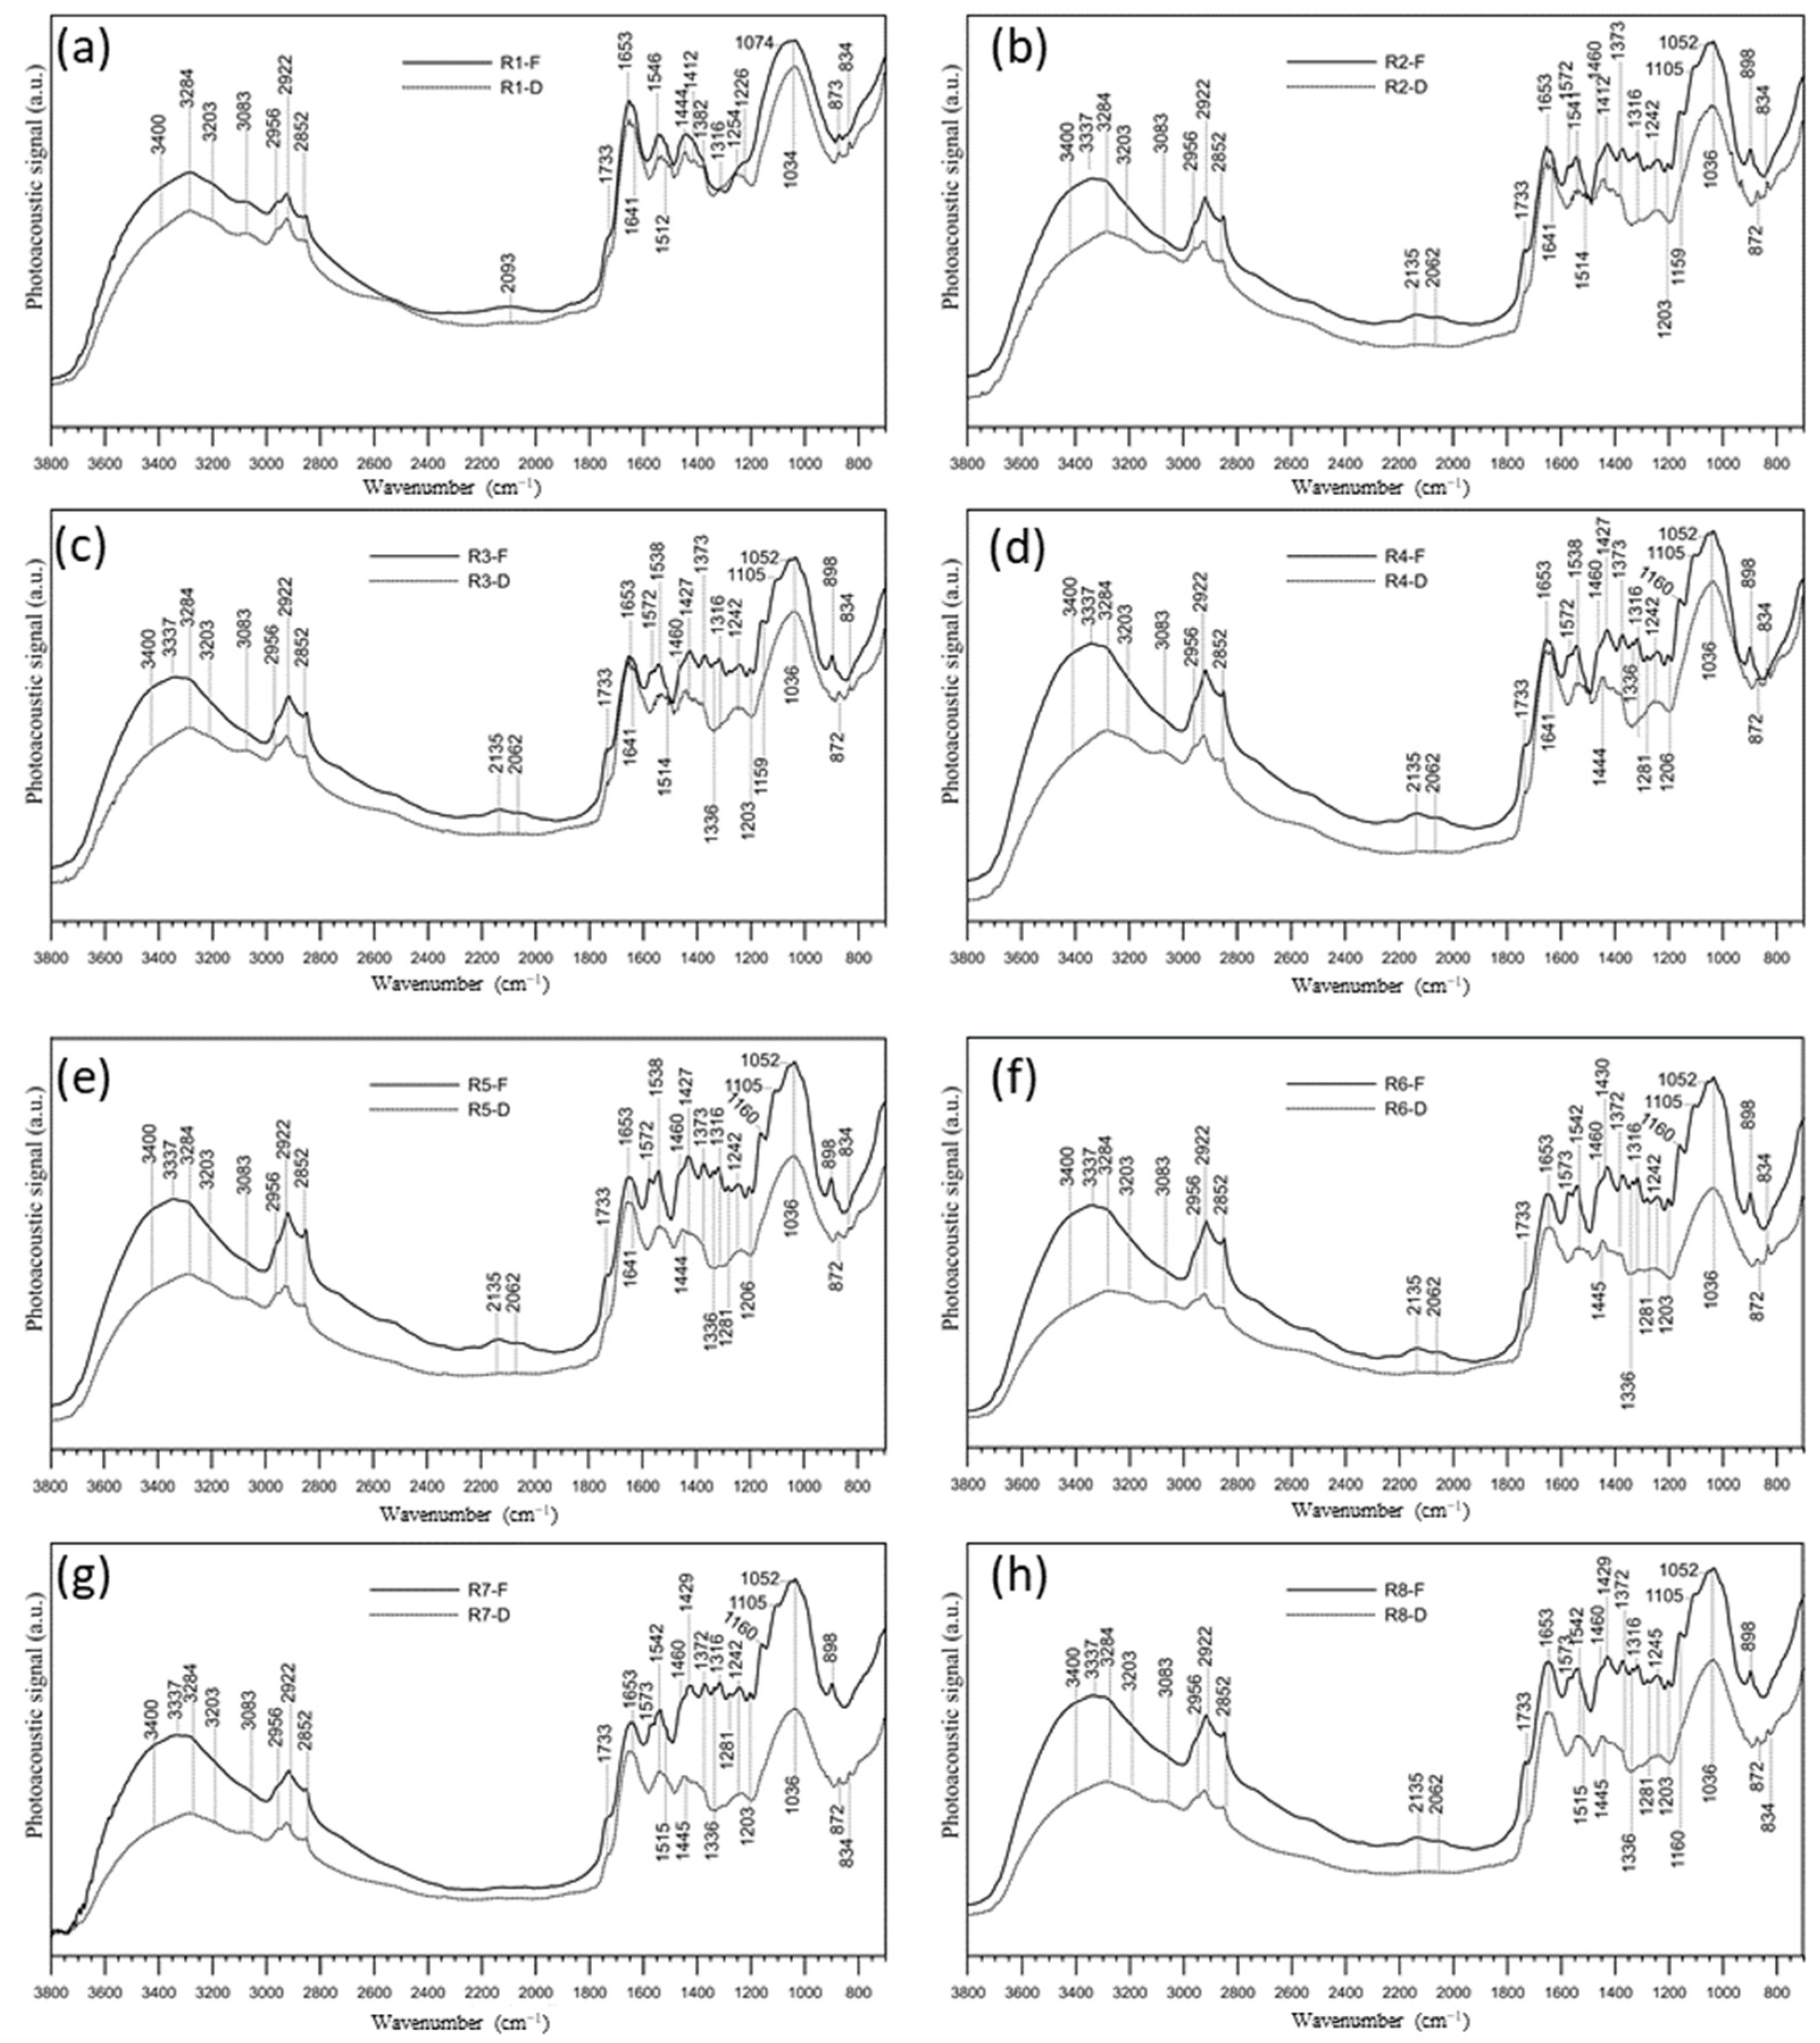
3.5. FT-IR/PAS Analysis

The FT-IR/PAS analysis was used to evaluate both the feed and digestate quality and provided insight into the transformations of organic matter resulting from anaerobic co-digestion.
The FT-IR/PAS spectra of both the raw and digested sewage sludge, as well as the spectra of the sewage sludge with the addition of pulp, orange pulp and brewery spent grain (both raw and digested) are shown in Figure 3a. The intensities of the IR bands are lower in the spectra of the digested samples than in the raw ones. The smallest differences were observed in the raw and digested sewage sludge spectra without an added co-substrate (Figure 3a). The bands indicating the presence of nitrile –C=N and isonitrile –N=C bands (2135 and 2062 cm–1, respectively) almost completely disappeared for the digested samples. The intensity changes of bands within 2956–2852 cm–1 (C-H stretching) also indicate the decomposition processes of organic components and can be used to evaluate the anaerobic digestion efficiency [68].
The addition of orange pulp and orange peels causes the appearance of new bands in the FT-IR/PAS spectra (Figure 3, R2-F–R8-F) and increases the intensity of other bands. Broad bands with maxima at 3400 and ~3340 cm−1 are typical of the alcohol hydroxyl. The band at 1733 cm–1 (C=O stretching) is more intense and sharper than in the spectrum of sewage sludge (Figure 3, R1-F). A similar situation occurs in the case of vibration of the C–H groups (2956–2852 cm–1). The band at ~1572 cm−1 is due to the presence of a C=O stretching vibration in flavonoids [69], aromatic C=C [70], COO and/or amide II. This band may also indicate the presence of C=C vibration in the terminal methylene group of limonene, which may be confirmed by the presence of the band at 898 cm−1 (out-of-plane bending of the terminal methylene group) [71]. The band at 1460 cm−1, as well as the band at 1412 cm−1, may have contributions from more than one group vibration: aliphatic C–H, aromatic C=C and C–O in alcohols. The first of the mentioned bands is characteristic for limonene and p-cymene [72,73]. The band at 1373 cm−1 is probably due to the combination of the O–H deformation vibration and C–O stretching vibration in the phenolic compounds. The band at 1203 cm−1 is due to C–O stretching vibration in alcohols, as well as the bands at 1105 and 1052 cm−1 [69]. The band at 1052 cm−1 may also correspond to C–O–H or C–O–R in alcohols or esters [74].
The decrease in intensity of the bands in the FT-IR/PAS spectra may be evidence of the reduction of organic compounds in the digestate. In the case of the R1-F and R1-D samples (sewage sludge without co-addition before and after anaerobic digestion, respectively), these changes are not as significant as in the cases of the subsequent samples, although the decrease in peak intensities is observable for O–H stretching of hydroxyl and =C–H in aromatic structures groups (3600–3080 cm−1), C–H and –OH of COOH in hydroxyl or amine compounds (1412 cm−1), C=C in aromatic rings, C–H and C–O–C in ethers (1254–1226 cm−1) and C–O–C (1074–1034 cm−1). As mentioned before, the addition of co-substrates changes the spectral characteristics. The additional bands visible in the spectrum of the R2-F–R8-F samples disappear completely for digested ones (R2-D–R8-D). Additionally, the intensities of the other bands also decrease. In the R5-F and R6-F spectra, the flavonoids, limonene and p-cymene bands (1572, 1538, 1460, 898 cm−1) are the most intense, which suggests that their highest contents are in these samples. These bands, but of lower intensity, are also visible in the spectra of other samples with the pulp and orange peels and with brewery spent grain co-additions. However, the addition of the latter does not significantly affect the shape of the IR spectrum. The absence of the mentioned bands in the spectra of the samples after digestion (R3-D–R8-D) suggests the decomposition of flavonoids, p-cymene and limonene during the AD process. The band at 1572 cm−1 and 898 cm−1 disappear completely, same as the bands of the hydrogen-bonded –OH groups in alcohols (3400, 3340, 1203, 1105 and 1052 cm−1), while the bands of O–H deformation vibration and C-O stretching vibration in phenolic compounds (1373 cm−1) have much lower intensity. In the spectra of all digested samples, except R1 (Figure 3a), a decrease in the intensity of the aliphatic C-H groups bands can be observed within the 2956–2852 cm−1 range.
The decrease in the intensity of all bands, and thus the highest degree of decomposition, can be observed for the three-component systems (R6–R8, Figure 3f–h). These observations were consistent with the results presented and discussed in the previous sections.

3.6. Energy Balance

To estimate the potential energy profits in full-scale facilities, the energy balance for the most favourable two- and three-component series (R5 and R8) was performed. This evaluation was performed on the basis of the procedure described by Szaja and Montusiewicz [32]. The detailed calculations are presented in Table 5.
The evaluation was made for an existing digester with a volume of 2500 m3, operating at an HRT of 20 days under mesophilic conditions (35 °C) (located at the WWTP in Lublin, Poland).
In co-digestion series R5 and R8, the obtained thermal energy would completely cover the digester energetic demand necessary for heating the feedstock as well as the heat losses. Importantly, in both cases, an additional energy surplus was found. As compared to the control, the energy profit was improved by 15.4 and 81.2% in R5 and R8, respectively. Moreover, the related thermal/electric power production was enhanced by 5.4 and 23.3%. The beneficial results for R8 were attributed to the synergistic effect of the substrates used; thus, significantly higher methane production accompanied the increased VS load in the feedstock.
The results in terms of energy balance, regarding the implementation of this technology in an existing digester, are particularly important. Such a solution might provide energy neutrality to WWTPs. However, consideration should be taken regarding the seasonality of these wastes or, eventually, the necessity of their storage, as well as their transport cost.

4. Conclusions

The conducted research has investigated the effectiveness of the co-digestion of selected beverage wastes and municipal sewage sludge in two and tertiary mixtures. As compared to the control, the increased methane production was achieved only in three-component co-digestion in the presence of the highest dose of orange pulp and brewery spent grain (R8). This was accompanied by an increased VSR, comparable kinetics and a lower accumulation of p-cymene. Importantly, therein was the essential improvement of energy balance by 81.2% as compared to control also observed. These were achieved despite the increased limonene and phenol content in the feedstock, confirming that a synergistic effect occurred in this case. Moreover, the FT-IR/PAS analysis also seems to indicate such a three-component anaerobic co-digestion as a beneficial choice.

Author Contributions

Conceptualization, A.S. and A.M.; methodology, A.S., M.L. and S.P.-P.; formal analysis, A.S. and A.M.; investigation, A.S., M.L. and S.P.-P.; resources, A.S.; data curation, A.S.; writing—original draft preparation, A.S., A.M. and S.P.-P.; writing—review and editing, A.S., A.M. and S.P.-P.; visualization, A.S. and M.L.; supervision, A.M.; project administration, A.S.; funding acquisition A.S., M.L. and A.M. All authors have read and agreed to the published version of the manuscript.

Funding

The authors thank for the financial support provided by the Ministry of Science and Higher Education in Poland (grant numbers FD-20/IS-6/036, FD-20/IS-6/023, FD-20/IS-6/020).

Data Availability Statement

Not applicable.

Acknowledgments

The authors thank Paweł Golianek for the provided technical support.

Conflicts of Interest

The authors declare no conflict of interest.

References

  1. Olajire, A.A. The brewing industry and environmental challenges. J. Clean. Prod. 2012, 256, 102817. [Google Scholar] [CrossRef]
  2. Calabrò, P.S.; Paone, E.; Komilis, D. Strategies for the sustainable management of orange peel waste through anaerobic digestion. J. Environ. Manag. 2018, 212, 462–468. [Google Scholar] [CrossRef]
  3. Sovacool, B.K.; Bazilian, M.; Griffiths, S.; Kim, J.; Foley, A.; Rooney, D. Decarbonizing the Food and Beverages Industry: A Critical and Systematic Review of Developments, Sociotechnical Systems and Policy Options. Renew. Sustain. Energy Rev. 2021, 143, 110856. [Google Scholar] [CrossRef]
  4. Braddock, R.J.; Weiss, E. Handbook of Citrus By-Products and Processing Technology; John Wiley & Sons: New York, NY, USA, 1999. [Google Scholar]
  5. Wilkins, M.R.; Suryawati, L.; Maness, N.O.; Chrz, D. Ethanol production by Saccharomyces cerevisiae and Kluyveromyces marxianus in the presence of orange-peel oil. World J. Microbiol. Biotechnol. 2007, 23, 1161–1168. [Google Scholar] [CrossRef]
  6. Martín, M.A.; Siles, J.A.; Chica, A.F.; Martín, A. Biomethanization of orange peel waste. Bioresour. Technol. 2010, 101, 8993–8999. [Google Scholar] [CrossRef]
  7. Mussatto, S.I.; Dragone, G.; Roberto, I.C. Brewers’ spent grain: Generation, characteristics and potential applications. J. Cereal Sci. 2006, 43, 1–14. [Google Scholar] [CrossRef]
  8. Connolly, A.; Cermeño, M.; Crowley, D.; O’Callaghan, Y.; O’Brien, N.M.; FitzGerald, R.J. Characterisation of the in vitro bioactive properties of alkaline and enzyme extracted brewers’ spent grain protein hydrolysates. Food Res. Int. 2019, 121, 524–532. [Google Scholar] [CrossRef]
  9. Negro, V.; Mancini, G.; Ruggeri, B.; Fino, D. Citrus waste as feedstock for bio-based products recovery: Review on limonene case study and energy valorization. Bioresour. Technol. 2016, 214, 806–815. [Google Scholar] [CrossRef]
  10. Rezzadori, K.; Benedetti, S.; Amante, E.R. Proposals for the residues recovery: Orange waste as raw material for new products. Food Bioprod. Process. 2012, 90, 606–614. [Google Scholar] [CrossRef]
  11. Ikram, S.; Huang, L.; Zhang, H.; Wang, J.; Yin, M. Composition and Nutrient Value Proposition of Brewers Spent Grain. J. Food Sci. 2017, 82, 2232–2242. [Google Scholar] [CrossRef] [Green Version]
  12. Naibaho, J.; Korzeniowska, M. The variability of physico-chemical properties of brewery spent grain from 8 different breweries. Heliyon 2021, 7, e06583. [Google Scholar] [CrossRef]
  13. Morales-Polo, C.; Cledera-Castro, M.d.M.; Revuelta-Aramburu, M.; Hueso-Kortekaas, K. Bioconversion Process of Barley Crop Residues into Biogas—Energetic-Environmental Potential in Spain. Agronomy 2021, 11, 640. [Google Scholar] [CrossRef]
  14. De Sanctis, M.; Chimienti, S.; Pastore, C.; Piergrossi, V.; Di Iaconi, C. Energy efficiency improvement of thermal hydrolysis and anaerobic digestion of Posidonia oceanica residues. Appl. Energy 2019, 252, 113457. [Google Scholar] [CrossRef]
  15. Morales-Polo, C.; Cledera-Castro, M.; Hueso-Kortekaas, K.; Revuelta-Aramburu, M. Anaerobic digestion in wastewater reactors of separated organic fractions from wholesale markets waste. Compositional and batch characterization. Energy and environmental feasibility. Sci. Total Environ. 2020, 726, 138567. [Google Scholar] [CrossRef]
  16. Buller, L.S.; Sganzerla, W.G.; Michele, W.G.; Lima, M.N.; Muenchow, K.E.; Timko, M.T.; Forster-Carneiro, T. Ultrasonic pretreatment of brewers’ spent grains for anaerobic digestion: Biogas production for a sustainable industrial development. J. Clean. Prod. 2022, 355, 131802. [Google Scholar] [CrossRef]
  17. Castilla-Archilla, J.; Thorn, C.; Pau, S.; Lens, P.N. Screening for suitable mixed microbial consortia from anaerobic sludge and animal dungs for biodegradation of brewery spent grain. Biomass Bioenergy 2022, 159, 106396. [Google Scholar] [CrossRef]
  18. Mata-Álvarez, J.; Dosta, J.; Romero-Guiza, M.S.; Fonoll, X.; Peces, M.; Astals, S. A critical review on anaerobic co-digestion achievements between 2010 and 2013. Renew. Sustain. Energy Rev. 2014, 36, 412–427. [Google Scholar] [CrossRef]
  19. Chen, Y.; Cheng, J.J.; Creamer, K.S. Inhibition of anaerobic digestion process: A review. Bioresour. Technol. 2008, 99, 4044–4064. [Google Scholar] [CrossRef]
  20. Amha, Y.M.; Anwar, M.Z.; Brower, A.; Jacobsen, C.S.; Stadler, L.B.; Webster, T.M.; Smith, A.L. Inhibition of anaerobic digestion processes: Applications of molecular tools. Bioresour. Technol. 2018, 247, 999–1014. [Google Scholar] [CrossRef]
  21. Ruiz, B.; Flotats, X. Effect of limonene on batch anaerobic digestion of citrus peel waste. Biochem. Eng. J. 2016, 109, 9–18. [Google Scholar] [CrossRef]
  22. Martínez, E.J.; Rosas, J.G.; Sotres, A.; Morán, A.; Cara, J.; Sánchez, M.E.; Gómez, X. Codigestion of sludge and citrus peel wastes: Evaluating the effect of biochar addition on microbial communities. Biochem. Eng. J. 2018, 137, 314–325. [Google Scholar] [CrossRef]
  23. Sežun, M.; Grilc, V.; Zupančič, G.D.; Marinšek-Logar, R. Anaerobic digestion of brewery spent grain in a semi-continuous bioreactor: Inhibition by phenolic degradation products. Acta Chim. Slov. 2011, 58, 158–166. [Google Scholar] [PubMed]
  24. Panjičko, M.; Zupančič, G.D.; Zelić, B. Anaerobic Biodegradation of Raw and Pre-treated Brewery Spent Grain Utilizing Solid State Anaerobic Digestion. Acta Chim. Slov. 2015, 62, 818–827. [Google Scholar] [CrossRef] [Green Version]
  25. Sawatdeenarunat, C.; Surendra, K.C.; Takara, D.; Oechsner, H.; Khanal, S.K. Anaerobic digestion of lignocellulosic biomass: Challenges and opportunities. Bioresour. Technol. 2015, 178, 178–186. [Google Scholar] [CrossRef] [PubMed]
  26. Taghizadeh-Alisaraei, A.; Hosseini, S.H.; Ghobadian, B.; Motevali, A. Biofuel production from citrus wastes: A feasibility study in Iran. Renew. Sustain. Energy Rev. 2017, 69, 1100–1112. [Google Scholar] [CrossRef]
  27. Li, P.; Liu, D.; Pei, Z.; Zhao, L.; Shi, F.; Yao, Z.; Li, W.; Sun, Y.; Wang, S.; Yu, Q.; et al. Evaluation of lignin inhibition in anaerobic digestion from the perspective of reducing the hydrolysis rate of holocellulose. Bioresour. Technol. 2021, 333, 125204. [Google Scholar] [CrossRef]
  28. Bochmann, G.; Drosg, B.; Fuchs, W. Anaerobic digestion of thermal pretreated Brewers’ spent grains. Environ. Prog. Sustain. 2015, 34, 1092–1096. [Google Scholar] [CrossRef]
  29. Bougrier, C.; Dognin, D.; Laroche, C.; Gonzalez, V.; Benali-Raclot, D.; Cacho Rivero, J.A. Anaerobic digestion of Brewery Spent Grains: Trace elements addition requirement. Bioresour. Technol. 2018, 247, 1193–1196. [Google Scholar] [CrossRef]
  30. Martín, M.A.; Fernández, R.; Serrano, A.; Siles, J.A. Semi-continuous anaerobic co-digestion of orange peel waste and residual glycerol derived from biodiesel manufacturing. Waste Manag. 2013, 33, 1633–1639. [Google Scholar] [CrossRef]
  31. Valenti, F.; Zhong, Y.; Sun, M.; Porto, S.M.; Toscano, A.; Dale, B.E.; Sibilla, F.; Liao, W. Anaerobic co-digestion of multiple agricultural residues to enhance biogas production in southern Italy. Waste Manag. 2018, 78, 151–157. [Google Scholar] [CrossRef] [PubMed]
  32. Szaja, A.; Montusiewicz, A. Enhancing the co-digestion efficiency of sewage sludge and cheese whey using brewery spent grain as an additional substrate. Bioresour. Technol. 2019, 291, 121863. [Google Scholar] [CrossRef]
  33. Gonçalves, I.C.; Fonsec, A.; Morao, A.M.; Pinheirob, H.M.; Duarte, A.P.; Ferra, M.I.A. Evaluation of anaerobic co-digestion of spent brewery grains and an azo dye. Renew. Energy 2015, 74, 489–496. [Google Scholar] [CrossRef]
  34. Poulsen, T.G.; Adelard, L.; Wells, M. Improvement in CH4/CO2 ratio and CH4 yield as related to biomass mix composition during anaerobic co-digestion. Waste Manag. 2017, 61, 179–187. [Google Scholar] [CrossRef] [PubMed]
  35. Tewelde, S.; Eyalarasan, K.; Radhamani, R.; Karthikeyan, K. Biogas production from co-digestion of brewery wastes [BW] and cattle dung [CD]. IJLTAFS 2012, 2, 90–93. [Google Scholar]
  36. Malakhova, D.V.; Egorova, M.A.; Prokudina, L.I.; Netrusov, A.I.; Tsavkelova, E.A. The biotransformation of brewer’s spent grain into biogas by anaerobic microbial communities. World J. Microbiol. Biotechnol. 2015, 31, 2015–2023. [Google Scholar] [CrossRef] [PubMed]
  37. Zhu, A.; Qin, Y.; Wu, J.; Ye, M.; Li, Y.Y. Characterization of biogas production and microbial community in thermophilic anaerobic co-digestion of sewage sludge and paper waste. Bioresour. Technol. 2021, 337, 125371. [Google Scholar] [CrossRef]
  38. Angelidaki, I.; Alves, M.; Bolzonella, D.; Borzacconi, L.; Campos, J.L.; Guwy, A.J.; Kalyuzhnyi, S.; Jenicek, P.; van Lier, J.B. Defining the biomethane potential (BMP) of solid organic wastes and energy crops: A proposed protocol for batch assays. Water Sci. Technol. 2008, 59, 927–934. [Google Scholar] [CrossRef] [Green Version]
  39. American Public Health Association (APHA). Standard Methods for the Examination of Water and Wastewater, 22nd ed.; APHA: Washington, DC, USA, 2012. [Google Scholar]
  40. Panigrahi, S.; Sharma, H.B.; Dubey, B.K. Anaerobic co-digestion of food waste with pretreated yard waste: A comparative study of methane production, kinetic modeling and energy balance. J. Clean. Prod. 2020, 243, 118480. [Google Scholar] [CrossRef]
  41. Li, B.Y.; Xia, Z.Y.; Gou, M.; Sun, Z.Y.; Huang, Y.L.; Jiao, S.B.; Dai, W.Y.; Tang, Y.Q. Production of volatile fatty acid from fruit waste by anaerobic digestion at high organic loading rates: Performance and microbial community characteristics. Bioresour. Technol. 2022, 346, 126648. [Google Scholar] [CrossRef]
  42. Qin, S.; Wainaina, S.; Liu, H.; Soufiani, A.M.; Pandey, A.; Zhang, Z.; Awasthi, M.K.; Taherzadeh, M.J. Microbial dynamics during anaerobic digestion of sewage sludge combined with food waste at high organic loading rates in immersed membrane bioreactors. Fuel 2021, 303, 121276. [Google Scholar] [CrossRef]
  43. Cui, P.; Ge, J.W.; Chen, Y.; Zhao, Y.; Wang, S.; Su, H. The Fe3O4 nanoparticles-modified mycelium pellet-based anaerobic granular sludge enhanced anaerobic digestion of food waste with high salinity and organic load. Renew. Energy 2021, 185, 376–385. [Google Scholar] [CrossRef]
  44. Serrano, A.; Siles López, J.A.; Chica, A.F.; Martin, M.; Karouach, F.; Mesfioui, A.; El Bari, H. Mesophilic anaerobic co-digestion of sewage sludge and orange peel waste. Environ. Technol. 2014, 35, 898–906. [Google Scholar] [CrossRef] [PubMed]
  45. Mao, C.; Feng, Y.; Wang, X.; Ren, G. Review on research achievements of biogas from anaerobic digestion. Renew. Sustain. Energy Rev. 2015, 45, 540–555. [Google Scholar] [CrossRef]
  46. Piątek, M.; Lisowski, A.; Dąbrowska, M. The effects of solid lignin on the anaerobic digestion of microcrystalline cellulose and application of smoothing splines for extended data analysis of its inhibitory effects. Bioresour. Technol. 2021, 320, 124262. [Google Scholar] [CrossRef] [PubMed]
  47. Monlau, F.; Sambusiti, C.; Barakat, A.; Quéméneur, M.; Trably, E.; Steyer, J.P.; Carrère, H. Do furanic and phenolic compounds of lignocellulosic and algae biomass hydrolyzate inhibit anaerobic mixed cultures? A comprehensive review. Biotechnol. Adv. 2014, 32, 934–951. [Google Scholar] [CrossRef]
  48. Caroca, E.; Serrano, A.; Borja, R.; Jiménez, A.; Carvajal, A.; Braga, A.F.M.; Fermoso, F.G. Influence of phenols and furans released during thermal pretreatment of olive mill solid waste on its anaerobic digestion. Waste Manag. 2021, 20, 202–208. [Google Scholar] [CrossRef]
  49. Veeresh, G.S.; Kumar, P.; Mehrotra, I. Treatment of phenol and cresols in upflow anaerobic sludge blanket (UASB) process: A review. Water Res. 2005, 39, 154–170. [Google Scholar] [CrossRef] [PubMed]
  50. Levén, L.; Nyberg, K.; Schnürer, A. Conversion of phenols during anaerobic digestion of organic solid waste--a review of important microorganisms and impact of temperature. J. Environ. Manag. 2012, 95, 99–103. [Google Scholar] [CrossRef]
  51. Rosenkranz, F.; Cabrol, L.; Carballa, M.; Donoso-Bravo, A.; Cruz, L.; Ruiz-Filippi, G.; Chamy, R.; Lema, J.M. Relationship between phenol degradation efficiency and microbial community structure in an anaerobic SBR. Water Res. 2013, 47, 6739–6749. [Google Scholar] [CrossRef]
  52. Bakkali, F.; Averbeck, S.; Averbeck, D.; Idaomar, M. Biological effects of essential oils—A review. Food Chem. Toxicol. 2008, 46, 446–475. [Google Scholar] [CrossRef]
  53. Kunatsa, T.; Xia, X. A review on anaerobic digestion with focus on the role of biomass co-digestion, modelling and optimisation on biogas production and enhancement. Bioresour. Technol. 2022, 334, 126311. [Google Scholar] [CrossRef] [PubMed]
  54. Ruiz, B.; Flotats, X. Citrus essential oils and their influence on the anaerobic digestion process: An overview. Waste Manag. 2014, 34, 2063–2079. [Google Scholar] [CrossRef] [PubMed]
  55. Chen, J.; Yun, S.; Shi, J.; Wang, Z.; Abbas, Y.; Wang, K.; Han, F.; Jia, B.; Xu, H.; Xing, T.; et al. Role of biomass-derived carbon-based composite accelerants in enhanced anaerobic digestion: Focusing on biogas yield, fertilizer utilization, and density functional theory calculations. Bioresour. Technol. 2020, 307, 123204. [Google Scholar] [CrossRef]
  56. Kainthola, J.; Kalamdhad, A.S.; Goud, V.V.; Goel, R. Fungal pretreatment and associated kinetics of rice straw hydrolysis to accelerate methane yield from anaerobic digestion. Bioresour. Technol. 2019, 286, 121368. [Google Scholar] [CrossRef]
  57. Atelge, M.R.; Atabani, A.E.; Abut, S.; Kaya, M.; Eskicioglu, C.; Semaan, G.; Lee, C.; Yildiz, Y.Ş.; Unalan, S.; Mohanasundaram, R.; et al. Anaerobic co-digestion of oil-extracted spent coffee grounds with various wastes: Experimental and kinetic modeling studies. Bioresour. Technol. 2021, 322, 124470. [Google Scholar] [CrossRef] [PubMed]
  58. Karki, R.; Chuenchart, W.; Surendra, K.C.; Sung, S.; Raskin, L.; Kumar Khanal, S. Anaerobic co-digestion of various organic wastes: Kinetic modeling and synergistic impact evaluation. Bioresour. Technol. 2020, 343, 126063. [Google Scholar] [CrossRef]
  59. Zhao, C.; Yan, H.; Liu, Y.; Huang, Y.; Zhang, R.; Chen, C.; Liu, G. Bio-energy conversion performance, biodegradability, and kinetic analysis of different fruit residues during discontinuous anaerobic digestion. Waste Manag. 2016, 52, 295–301. [Google Scholar] [CrossRef]
  60. Bedoić, R.; Špehar, A.; Puljko, J.; Čuček, L.; Ćosić, B.; Pukšec, T.; Duić, N. Opportunities and challenges: Experimental and kinetic analysis of anaerobic co-digestion of food waste and rendering industry streams for biogas production. Renew. Sustain. Energy Rev. 2020, 130, 109951. [Google Scholar] [CrossRef]
  61. Sedighi, A.; Karrabi, M.; Shahnavaz, B.; Mostafavinezhad, M. Bioenergy production from the organic fraction of municipal solid waste and sewage sludge using mesophilic anaerobic co-digestion: An experimental and kinetic modeling study. Renew. Sustain. Energy Rev. 2022, 153, 111797. [Google Scholar] [CrossRef]
  62. Usmani, A.; Pangkumhang, B.; Wongaree, M.; Wantala, K.; Khunphonoi, R. Kinetic study of biogas production from anaerobic digestion of vinasse waste. Water Pract. Technol. 2021, 16, 886–894. [Google Scholar] [CrossRef]
  63. Sarto, S.; Hildayati, R.; Syaichurrozi, I. Effect of chemical pretreatment using sulfuric acid on biogas production from water hyacinth and kinetics. Renew. Energy 2019, 132, 335–350. [Google Scholar] [CrossRef]
  64. Zhen, G.; Lu, X.; Kobayashi, T.; Kumar, G.; Xu, K. Anaerobic co-digestion on improving methane production from mixed microalgae (Scenedesmus sp., Chlorella sp.) and food waste: Kinetic modeling and synergistic impact evaluation. Chem. Eng. J. 2016, 99, 332–341. [Google Scholar] [CrossRef]
  65. Jin, Y.; Borrion, A.; Li, H.; Li, J. Effects of organic composition on mesophilic anaerobic digestion of food waste. Bioresour. Technol. 2017, 244, 213–224. [Google Scholar] [CrossRef]
  66. Liew, B.; Morris, S.; Masters, A.; Netto, K. A comparison and update of direct kinematic-kinetic models of leg stiffness in human running. J. Biomech. 2017, 64, 253–257. [Google Scholar] [CrossRef] [PubMed]
  67. Villamil, J.A.; Mohedano, A.F.; Rodriguez, J.J.; De la Rubia, M.A. Anaerobic co-digestion of the aqueous phase from hydrothermally treated waste activated sludge with primary sewage sludge. A kinetic study. J. Environ. Manag. 2019, 231, 726–733. [Google Scholar] [CrossRef] [PubMed]
  68. Grube, M.; Lin, J.G.; Lee, P.H.; Kokorevicha, S. Evaluation of sewage sludge-based compost by FT-IR spectroscopy. Geoderma 2006, 130, 324–333. [Google Scholar] [CrossRef]
  69. Socrates, G. Infrared and Raman Characteristic Group Frequencies. Tables and Charts, 3rd ed.; Wiley: New York, NY, USA, 2001. [Google Scholar]
  70. Abbasa, O.; Compère, G.; Larondelle, Y.; Pompeu, D.; Rogez, H.; Baeten, V. Phenolic compound explorer: A mid-infrared spectroscopy database. Vib. Spectrosc. 2017, 92, 111–118. [Google Scholar] [CrossRef]
  71. Schulz, H.; Schrader, B.; Quilitzsch, R.; Steuer, B. Quantitative analysis of various citrus oils by ATR/FT-IR and NIR-FT Raman spectroscopy. Appl. Spectrosc. 2002, 56, 117–124. [Google Scholar] [CrossRef]
  72. Boughendjioua, H.; Djeddi, S. Fourier Transformed Infrared Spectroscopy Analysis of Constituents of Lemon Essential Oils from Algeria. AJOP 2017, 5, 30–35. [Google Scholar] [CrossRef] [Green Version]
  73. NIST Chemistry WebBook. p-Cymene. Available online: https://webbook.nist.gov/cgi/cbook.cgi?ID=C99876&Type=IR-SPEC&Index=2#IR-SPEC (accessed on 20 July 2022).
  74. Zapata, B.; Balmaseda, J.; Fregoso-Israel, E.; Torres-García, E. Thermo-kinetics study of orange peel in air. J. Therm. Anal. Calorim. 2009, 98, 309–315. [Google Scholar] [CrossRef]
Figure 1. Content of VS (a), TS (b), COD (c) and SCOD (d) in feedstock (F) and digestate (D), as well as related removal efficiencies (average values and standard deviations are given).
Energies 15 05395 g001
Figure 2. Daily biogas and methane yields, as well as cumulative biogas and methane productions in two- (a) and three- (b) component co-digestion series (average values and standard deviations are given).
Energies 15 05395 g002
Figure 3. FT-IR/PAS spectra before (F) and after digestion (D) in the series (a) R1, (b) R2, (c) R3, (d) R4, (e) R5, (f) R6, (g) R7, (h) R8.
Energies 15 05395 g003
Table 1. Experimental settings.
SeriesFeedstock CompositionComponent
Volume
Additive MassFeedstock Volume: Additive MassVS Load
in Feedstock
Sewage SludgeOrange PulpOrange PeelsBrewery Spent Grain
LgL:gg kg−1
R1sewage sludge (control)0.4----14.21 ± 4.88
R2sewage sludge + orange pulp2.5--1:6.2514.41 ± 4.49
R3sewage sludge + orange pulp5.0--1:12.514.84 ± 4.61
R4sewage sludge + orange peels-1.5-1:3.7514.68 ± 4.80
R5sewage sludge + orange peels-3.0-1:7.515.39 ± 6.09
R6sewage sludge + orange peels + brewery spent grain-1.51.51:3.75:3.7516.57 ± 7.10
R7sewage sludge + orange pulp + brewery spent grain2.5-1.51:6.25:3.7516.05 ± 1.48
R8sewage sludge + orange pulp + brewery spent grain5.0-1.51:12.5:3.7516.31 ± 1.8
Table 2. Composition of the substrates used in the experiment (average values and standard deviation are given).
ParameterUnitOrange PeelsOrange PulpBrewery Spent Grain
Chemical oxygen demand (COD)mg L−110,185 ± 30411,750 ± 23333,600 ± 678
Volatile fatty acids (VFA)mg L−1611 ± 20.2432.5 ± 15.2608 ± 10.9
pH-4.35 ± 0.24.33 ± 0.15.01 ± 0.3
Alkalinity (ALK)mg L−127.1 ± 7.2835.3 ± 6.08242.0 ± 2.83
Total solids (TS)g kg−1235.09 ± 0.50155.18 ± 0.23937.78 ± 0.32
Volatile solids (VS)g kg−1224.41 ± 0.87149.28 ± 0.47878.21 ± 0.77
%VS% dry weight95.596.293.7
Total nitrogen (TN)mg L−192.05 ± 15.49111 ± 12.73739.4 ± 93.7
Total phosphorus (TP)mg L−116.87 ± 0.3819.37 ± 0.89433.25 ± 54.6
Ammonium nitrogen (N-NH4+)mg L−14.57 ± 0.133.96 ± 0.172.83 ± 0.25
Ortho-phosphate phosphorus (P-PO43−)mg L−114.7 ± 0.1414.95 ± 0.88223.75 ± 2.64
Phenolmg L−160.1 ± 6.536.1 ± 4.2449.9 ± 0.4
Limoneneµg g−1 TS297 ± 5.150.3 ± 2.1nd.
Table 3. The pH values and ALK, VFA, phenol, limonene and p-cymene concentrations in feedstock (F) and digestate (D) (average values and standard deviation are given).
ParameterUnit R1R2R3R4R5R6R7R8
ALKmg L−1F844 ± 17.7847 ± 24.5854 ± 33.8852 ± 25.5876 ± 35.3894 ± 52.2996 ± 15.1907 ± 24.4
D4547 ± 183.24893 ± 212.45240 ± 233.84942 ± 209.74984 ± 219.94131 ± 122.04796 ± 158.44636 ± 348.2
VFAmg L−1F560 ± 15.2566 ± 11.2578 ± 18.4540 ± 31.3593 ± 61.7642 ± 77.5677 ± 51.3804 ± 35.7
D239 ± 18.0335 ± 16.8325 ± 47.2324 ± 47.4338 ± 20.0238 ± 17.6252 ± 22.2250 ± 22.1
pH F6.23 ± 0.056.30 ± 0.046.22 ± 0.046.01 ± 0.146.04 ± 0.086.02 ± 0.086.08 ± 0.016.02 ± 0.01
D7.44 ± 0.017.42 ± 0.017.41 ± 0.027.43 ± 0.027.43 ± 0.037.44 ± 0.027.45 ± 0.027.44 ± 0.01
phenolmg L−1F7.4 ± 0.69.9 ± 1.98.4 ± 0.77.6 ± 0.79.7 ± 0.915.0 ± 2.324.4 ± 2.524.6 ± 2.4
D8.6 ± 0.649.5 ± 0.7210.0 ± 1.110.1 ± 1.079.4 ± 0.759.5 ± 0.8510.5 ± 0.9710.1 ± 0.97
limoneneppbF51.9 ± 12.2198.2 ± 21.0246.0 ± 39.7558.1 ± 38.181098.8 ± 20.9835.1 ± 22.4513.2 ± 34.4689.5 ± 19.4
D17.0 ± 1.330.1 ± 7.637.6 ± 3.436.1 ± 3.551.1 ± 2.322.8 ± 2.637.7 ± 4.627.0 ± 9.9
p-cymeneppbF31.1 ± 4.243.7 ± 3.533.6 ± 3.635.5 ± 0.332.4 ± 2.337.7 ± 1.334.8 ± 0.833.7 ± 0.7
D16.7 ± 3.144.5 ± 2.144.7 ± 3.73797.6 ± 689024.5 ± 2503119.3 ± 78542.3 ± 21143.6 ± 15.3
Table 4. The results of experimental data in terms of biogas/methane productions as well as estimated kinetic parameters.
ModelParametersUnitR1R2R3R4R5R6R7R8
Modified GompertzPmmL g−1 VS337.3296.7305.6323.7323.9267.7302.8376.9
RmmL g−1 VS d−159.0044.3353.6764.6664.0050.8661.6369.82
λd−0.43−0.30−0.49−0.32−0.34−0.30−0.20−0.25
R2-0.98850.99380.98470.98580.98910.98980.99040.9911
RMSE 9.27.011.011.59.67.48.710.6
Hyperbolic PmmL g−1 VS403.2373.3364.2382.4380.6318.8359.5453.7
kd−10.3680.2590.3780.4200.4300.3880.4050.360
R2-0.99780.99590.99790.99640.99690.99620.99460.9954
RMSE 28.837.222.822.423.122.124.133.7
ConePmmL g−1 VS372.7328.6342.7353.9351.6290.5325.0408.4
kd−10.4120.3190.4150.4630.4710.4370.4540.413
n-1.291.411.211.321.341.391.471.44
R2-0.99960.99960.99800.99730.99920.99940.99880.9992
RMSE 11.211.410.46.06.45.84.17.6
Logistic growth modelPmmL g−1 VS334.3293.3302.7320.8321.5265.4300.1373.4
RmmL g−1 VS d−155.3042.1250.2961.8859.9948.2859.4966.86
λd−0.49−0.30−0.55−0.32−0.38−0.31−0.17−0.24
R2-0.97970.98690.97520.97680.98070.98150.98270.9819
RMSE 11.09.012.713.211.08.710.212.6
Experimental dataBPmL g−1 VS467.0 ± 9.4506.3 ± 13.8541.5 ± 15.5575.8 ± 27.7561.1 ± 11.4463.4 ± 14.4523.5 ± 12.8552.2 ± 20.8
PmL CH4 g−1 VS353.3 ± 14.2308.9 ± 8.8324.7 ± 11.2343.6 ± 16.8341 ± 6.9280.5 ± 9.5317.8 ± 6.6395.2 ± 9.4
GPRmL g−1 VS d−122.3 ± 2.024.1 ± 3.325.8 ± 3.727.4 ± 1.626.7 ± 2.722.1 ± 2.424.9 ± 3.126.3 ± 2.9
MPRmL CH4 g−1 VS d−116.8 ± 1.214.7 ± 2.115.4 ± 2.716.3 ± 7.716.2 ± 1.713.3 ± 1.315.1 ± 1.618.8 ± 3.2
Methane content%62.3 ± 1.3761.0 ± 0.3859.8 ± 2.1859.7 ± 0.9860.7 ± 0.6260.4 ± 0.9360.8 ± 1.2960.9 ± 0.93
Table 5. The energy balance evaluation of selected reactors.
ParameterUnitR1
Control
R5R8
Characterisation data
VSg kg–135.1338.4740.77
Feedstock densitykg m–3947.8949.7952.4
VS loadkg d–1416245674854
Methane yieldmL CH4 g−1 VS353341395
Daily methane productionm3 CH4 d–1147115551918
Feedstock temperature °C888
Feedstock flow rate m3 d−1125125125
Energy terms
Theoretical thermal energyMJ d−152,64855,68068,675
Thermal energy needed for heating the feedstockMJ d–114,17514,17514,175
Thermal energy needed for covering the heat loss MJ d–13766.03766.03766.0
Thermal energy demandMJ d–119,73519,73519,735
Profit of thermal energy%166.8182.1248.0
Net thermal energy profits%15.481.2
Daily energy productionkWh d−114,70615,55319,183
Energy productionkWh t−1117.6124.4153.5
Power terms
Theoretical thermal power productionkW263.5278.7343.7
Theoretical electric power productionkW232.8246.3303.7
Profit of both theoretic thermal and electric power productions%5.423.3
Publisher’s Note: MDPI stays neutral with regard to jurisdictional claims in published maps and institutional affiliations.

