Article

Electric Vehicles Charging Algorithm with Peak Power Minimization, EVs Charging Power Minimization, Ability to Respond to DR Signals and V2G Functionality

1
Ekoenergetyka Polska S.A., ul. Nowy-Kisielin-Wysockiego 8, 66-002 Zielona Góra, Poland
2
Institute of Mathematics, University of Zielona Góra, ul. Licealna 9, 65-417 Zielona Góra, Poland
*
Author to whom correspondence should be addressed.
Energies 2022, 15(14), 5195; https://doi.org/10.3390/en15145195
Submission received: 30 June 2022 / Revised: 12 July 2022 / Accepted: 14 July 2022 / Published: 18 July 2022
(This article belongs to the Section E: Electric Vehicles)

Abstract

:
The number of electric vehicles (EV) on the roads, as well as the share of EVs in use, will inevitably increase in coming decades. This creates a number of problems. A large EV fleet is a significant additional load in the power system that is impossible to accurately predict. Another related problem is the limited distribution network capacity, which is not ready for the additional load from the widespread EV infrastructure. There is a need for an EV charging coordination algorithm capable of fulfilling the charging EV needs, while using as low demanded power as possible and using the lowest power values in each EV charging profile. We propose an EV coordinating algorithm that is capable of ensuring that all connected EVs in the considered parking lot will be charged at the user-defined departure time. The algorithm also controls the charging/discharging power of every connected EV in such a way that the parking lot as a whole will use minimal possible peak power while minimizing the charging power of every EV. The proposed algorithm is also capable of responding to demand response (DR) signals. The paper also includes the results of simulation with a statistical summary of the proposed algorithm effectiveness.

1. Introduction

In the last half of the last century, there was a clear increase of environmental concerns that were a result of technological advancement and growth. Over the years, these concerns were increasingly reflected in global initiatives and legislation [1]. Based on these initiatives, different countries set ambitious goals regarding non-fossil-fuel power generation, power share from renewable sources and GHG emissions [2,3], which in part push for an increase of electric vehicle (EV) use. Additionally, numerous reports state unanimously that the number of EVs on the roads, as well as share of EVs in use, will inevitably increase in coming decades [4,5,6] and will ultimately reach as much as 100%. This, however, creates a number of problems. First, a large EV fleet is a significant additional load in the power system, which is stochastic in nature and is impossible to accurately predict.
Series of studies have been conducted on the EV fleet impact on the peak load increment in different countries. Predicted increment in system peak load depending on different levels of EV adoption is presented in Table 1 (based on data from [7]).
According to this data [7], 100% EV penetration will increase the peak system load more than double in most cases. Another related problem is the limited distribution network capacity, which is not ready for the additional load from the widespread EV infrastructure. All this makes providing the necessary connection power for the EV parking lots a difficult task. It is, however, possible to ensure the fulfillment of all EV charging demands while using lower demanded power using certain EV charging coordinating algorithms. Such control algorithms could also have the possibility to react to the demand response (DR) signals to help the power system even further. Last, every EV charging algorithm should take the life of EV batteries into consideration by operating with charging power values much lower than maximal in all possible situations. In summary, there is a need for an EV charging coordination algorithm capable of fulfilling the charging EV needs, while using as low demanded power as possible and using the lowest power values in each EV’s charging profile.
Numerous studies can be found in the literature presenting the developed EV charging control algorithms that consider the peak load reduction of the power load profile in a variety of situations, using different base loads, different projected EV loads, different computational methods, different objectives and different constraints [8,9,10,11,12,13,14,15,16,17,18,19,20,21,22,23,24,25,26,27,28,29,30]. Among them, a number of publications address these problems locally, from the standpoint of a single EV parking lot or the distribution transformer [17,18,19,20,21,22,23,24,25,26,27,28,29,30]. However, studies that consider most of the mentioned issues are [28,29,30].
In [28], the authors developed an EV charging algorithm that ensures the EV will be charged before departure time while maximizing the number of EVs accepted for charging at the considered parking lot at any given time, as well as incorporating DR functionality by introducing a certain demand limit for a specified time. It allows them to take part in different DR events by lowering the total load of the parking lot during the DR event. All of the algorithm’s functionalities were proven by simulations of different scenarios of the 24 h load profile with and without DR events. In this charging algorithm, the authors used a binary objective function at the core of the system. This makes the charging regulation an on/off problem that makes the charging process intermittent. This does not allow for precise control of the EV’s charging power, thus making it is impossible to reduce the EV charging power to extend battery life. This algorithm also does not consider the vehicles supplying power back to the grid (V2G), which in certain situations can increase the parking lots’ DR capabilities.
Two EV charging strategies were proposed in [29] considering an EV parking lot connected to the industrial network. These algorithms ensure a high SOC level at the user-defined departure time; however, the exact SOC value is appointed by the charging coordinator. The SOC values are shown to be high by the conducted statistical analysis; however, the exact SOC level at departure time is impossible to determine before that time. One of those strategies provides considerable benefits in terms of peak-to-average power ratio (PAR) and distribution transformer peak load reduction. The effectiveness of the algorithm was proven in a series of simulations of distribution transformer daily load with and without the use of the EV coordination system. The presented algorithm considers flattening the total transformer load demand, which is a sum of base industrial load and EV charging load. Additionally, this strategy does allow for two-directional power flow but does not consider minimizing charging power profiles of individual EVs, nor does it allow the parking lot to lower its load in certain time periods as a reaction to a DR signal.
In [30], a charging coordinating algorithm is proposed considering also an individual parking lot. The proposed algorithm guarantees fulfilling all charging demands before its departure time defined at the EV arrival and can be used to create a charging schedule that smooths out the power consumption, which was proven by a series of simulations of algorithm-shaped daily load. Like [29], the considered power consumption consists of the base system load and the EV charging station load. This study focuses further on the reduced-complexity equivalent of the full algorithm to be able to achieve low response times and be used in large parking lots. The presented algorithm, however, does not include minimizing the power consumption in certain time periods as a result of receiving a DR signal. It also does not have V2G functionality, nor does it consider minimizing the EV charging power profiles.
Taking the literature review into account, we propose an EV coordinating algorithm that is capable of ensuring that all connected EV in the considered parking lot (Figure 1) will be charged at the user-defined departure time. The algorithm also controls the charging/discharging power of every connected EV in such a way that the parking lot as a whole will use minimal possible peak power while minimizing the charging power of every EV. The proposed algorithm is also capable of responding to DR signals by either adjusting the total parking lot load to the point that it can even supply power back to the grid if the charging plan of connected EVs allows it.
Considering the above, the primary contribution of the paper is the development and simulation verification of an EV charging algorithm that is able to perform five main objectives at the same time in a considered EV parking lot, which are as follows:
  • Minimize the total power required by the EV parking lot;
  • Lower demanded power, which then in turn reduces the strain on the powerlines. The algorithm’s demanded-power lowering potential is maximized by using two-directional energy flow to, from and between the connected vehicles (V2G);
  • Minimize the EV charging power, as well as minimize the charging profile variability to maximally extend the life of EV batteries;
  • Allow regulatory action, which can take the form of total load reduction or even power supply (V2G) in a certain time period based on DR signal;
  • Ensure the satisfaction of every connected EV for charging needs at the user-specified departure time.
  • These tasks are performer at the same time while:
  • The algorithm prevents overcharging or overdischarging of every EV, prevents using higher charging power than the nominal and can be set to not discharge EVs below a specified SOC and to allow or disable V2G functionality based on the type of EV or client preferences.
Based on the conducted statistical simulation, the algorithm effectiveness on a wide range of randomly generated scenarios had been verified.
To the best of the authors’ knowledge, there were no studies presenting a charging algorithm accomplishing all those tasks simultaneously during its functioning.
Section 2 of this paper consists of a mathematical description of the algorithm and the used objective functions, as well as optimization constraints. Section 3 includes a series of simulation results with a statistical summary of the proposed algorithm’s effectiveness, as well as a detailed analysis of several typical situations occurring in the system showing different parts of the algorithm’s functionality with examination of charging profiles of each and every EV connected to the system. The conclusions are presented in Section 4.

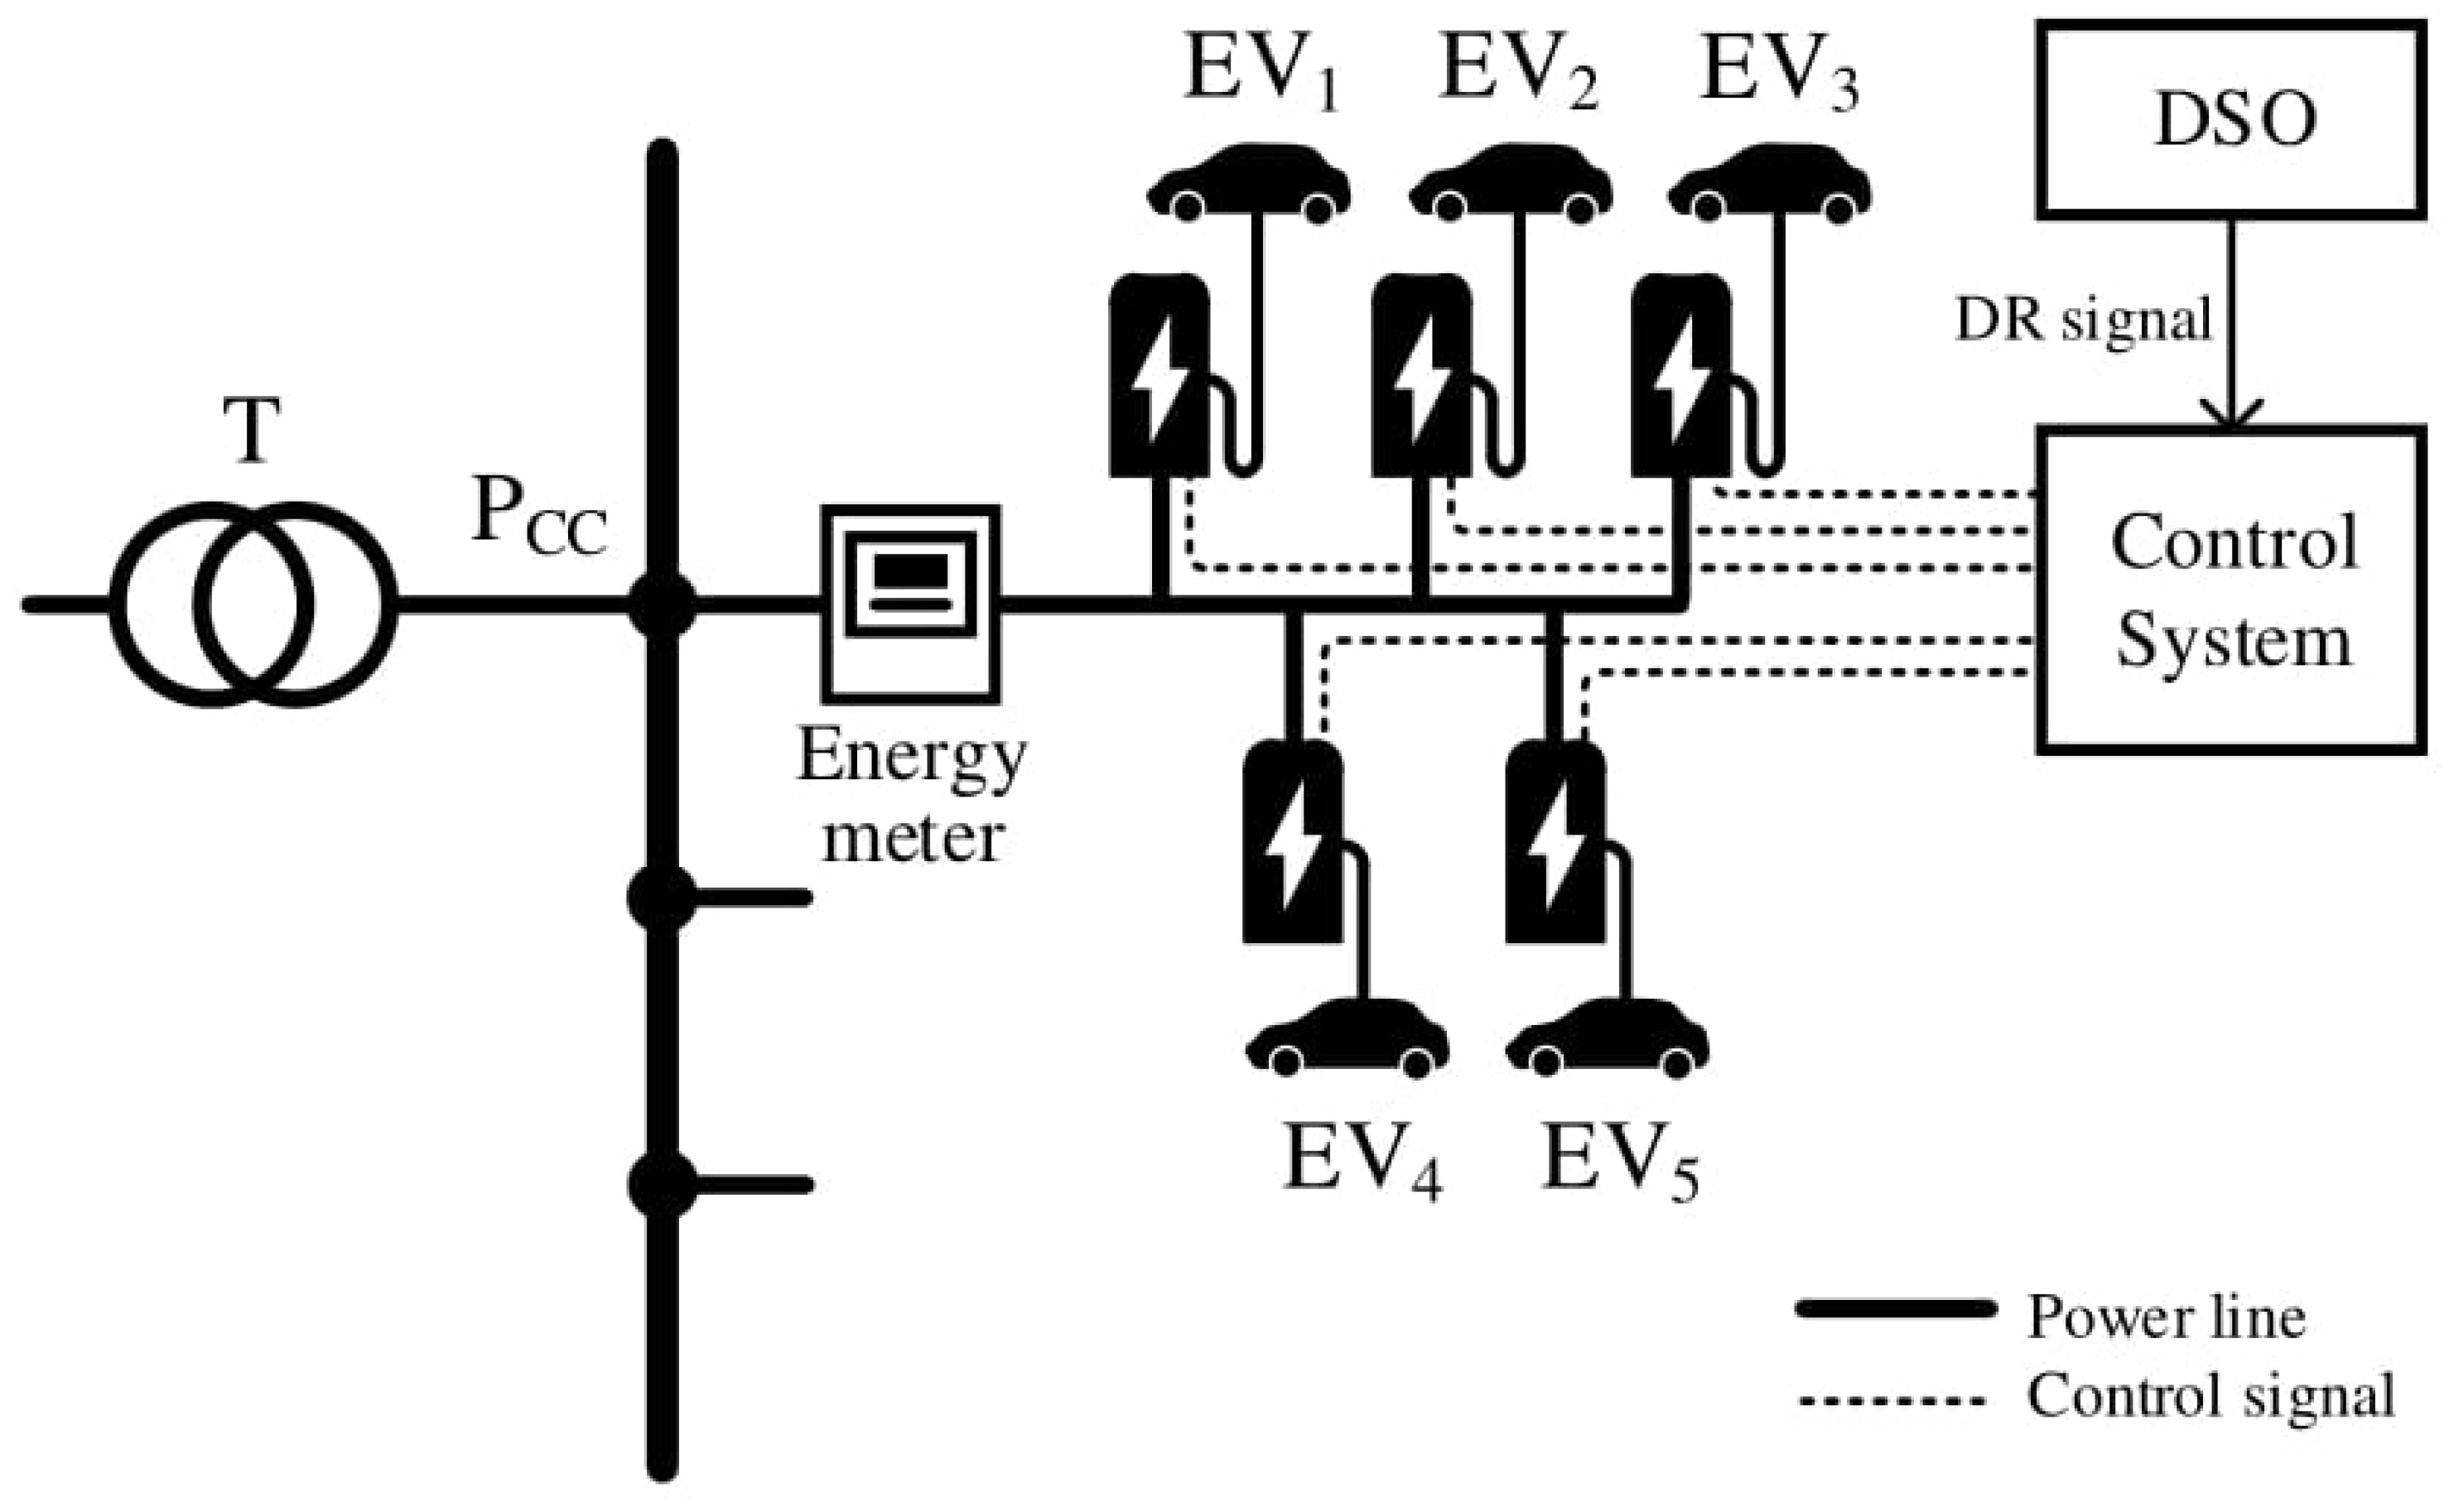
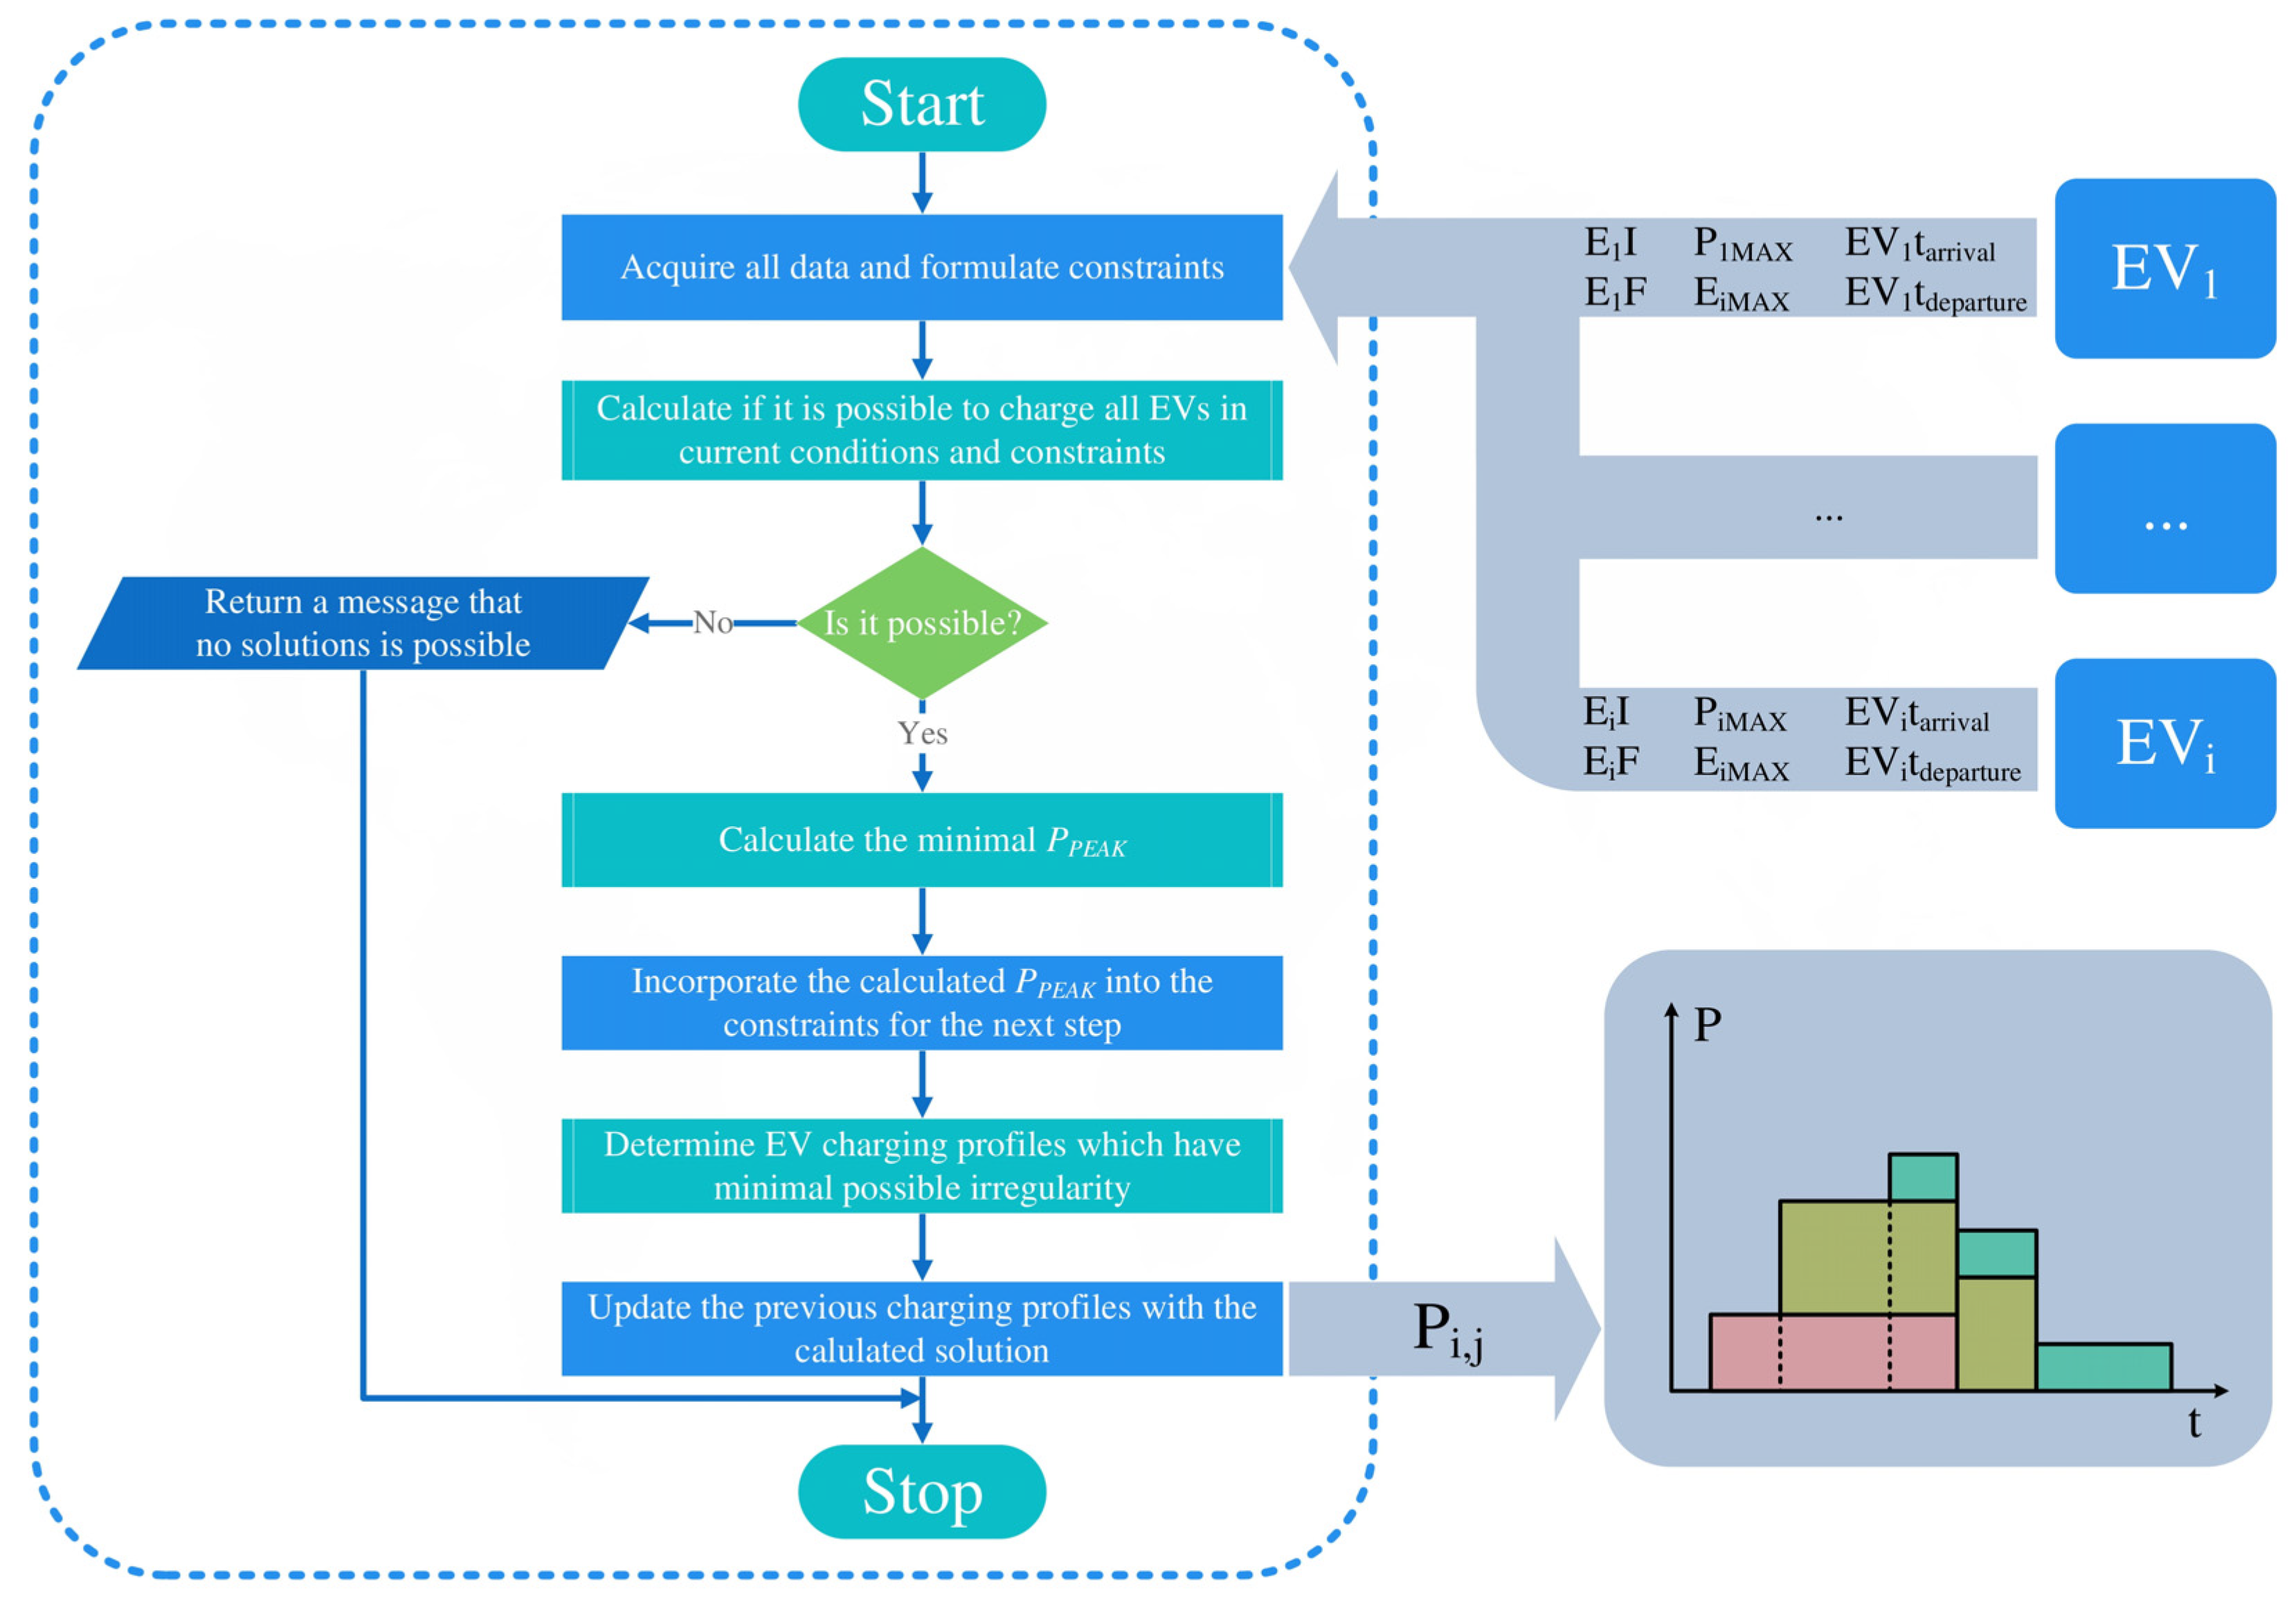
2. Materials and Methods

The objective of the proposed EV charging control algorithm is to set a charging profile for every connected EV in such a way that it minimizes the peak load of the whole considered parking lot while ensuring that the EV batteries are charged by the time of their departure based on all obtained data (usable battery capacity, battery rated power, battery C-rate, battery state of charge, time of arrival and time of departure).
The proposed algorithm also reduces the EV charging power profile irregularity to minimize the unavoidable battery degradation. The algorithm is also able to respond to a DR signal and reduce the charging power of the whole parking lot to a certain level or even supply energy back to the grid.
Determining the EV charging profiles by the algorithm is done in three phases. In the first phase, the algorithm calculates if it is physically possible to charge all considered vehicles while maintaining all of the power-, energy- and time-related constraints of the presented situation.
The second phase consists of peak load (PPEAK) minimization. In this phase, the algorithm calculates the individual charging profiles in such a way that the total parking lot’s load profile has the lowest possible peak load (PPEAK).
In the third and final phase, the algorithm determines the final EV charging/discharging profiles for peak load (PPEAK) set in phase 2. The final EV profiles determined here are characterized by the minimal possible profile irregularity for the considered situation. The whole algorithm structure is presented in Figure 2.
In the beginning, the algorithm acquires all available data for the current scenario. This includes usable battery capacity, battery rated power, battery state of charge, time of arrival and time of departure. In the first phase of the algorithm, it is determined if it is possible to set the EV charging profiles for the current scenario maintaining all constraints. If it is, the algorithm proceeds to further phases, where the exact EV charging profiles for every considered (connected and newly arrived) EV are determined. If it is impossible to set EV charging profiles that maintain all constraints, the algorithm returns a message informing the user of this fact.
The considered algorithm relies on solving a number of optimization problems, one after another, to determine such charging profiles of each individual EV, so that the total parking lot load profile has the minimal possible PPEAK. The optimization problem consists of a target function (three target functions are considered in the proposed algorithm), the value of which is being minimized, and various problem constraints that represent the physical limitations of considered EV batteries and parking lot infrastructure.
The optimization constraints include physical power-related battery limitations, the necessity to charge an EV battery (supply a specific amount of energy to the EV battery), duration of charging periods between tn moments of time and time left to EV departure. To take into account the above-mentioned aspects of the problem, the following constraints are introduced (an example of adopted notation is illustrated in Figure 3):
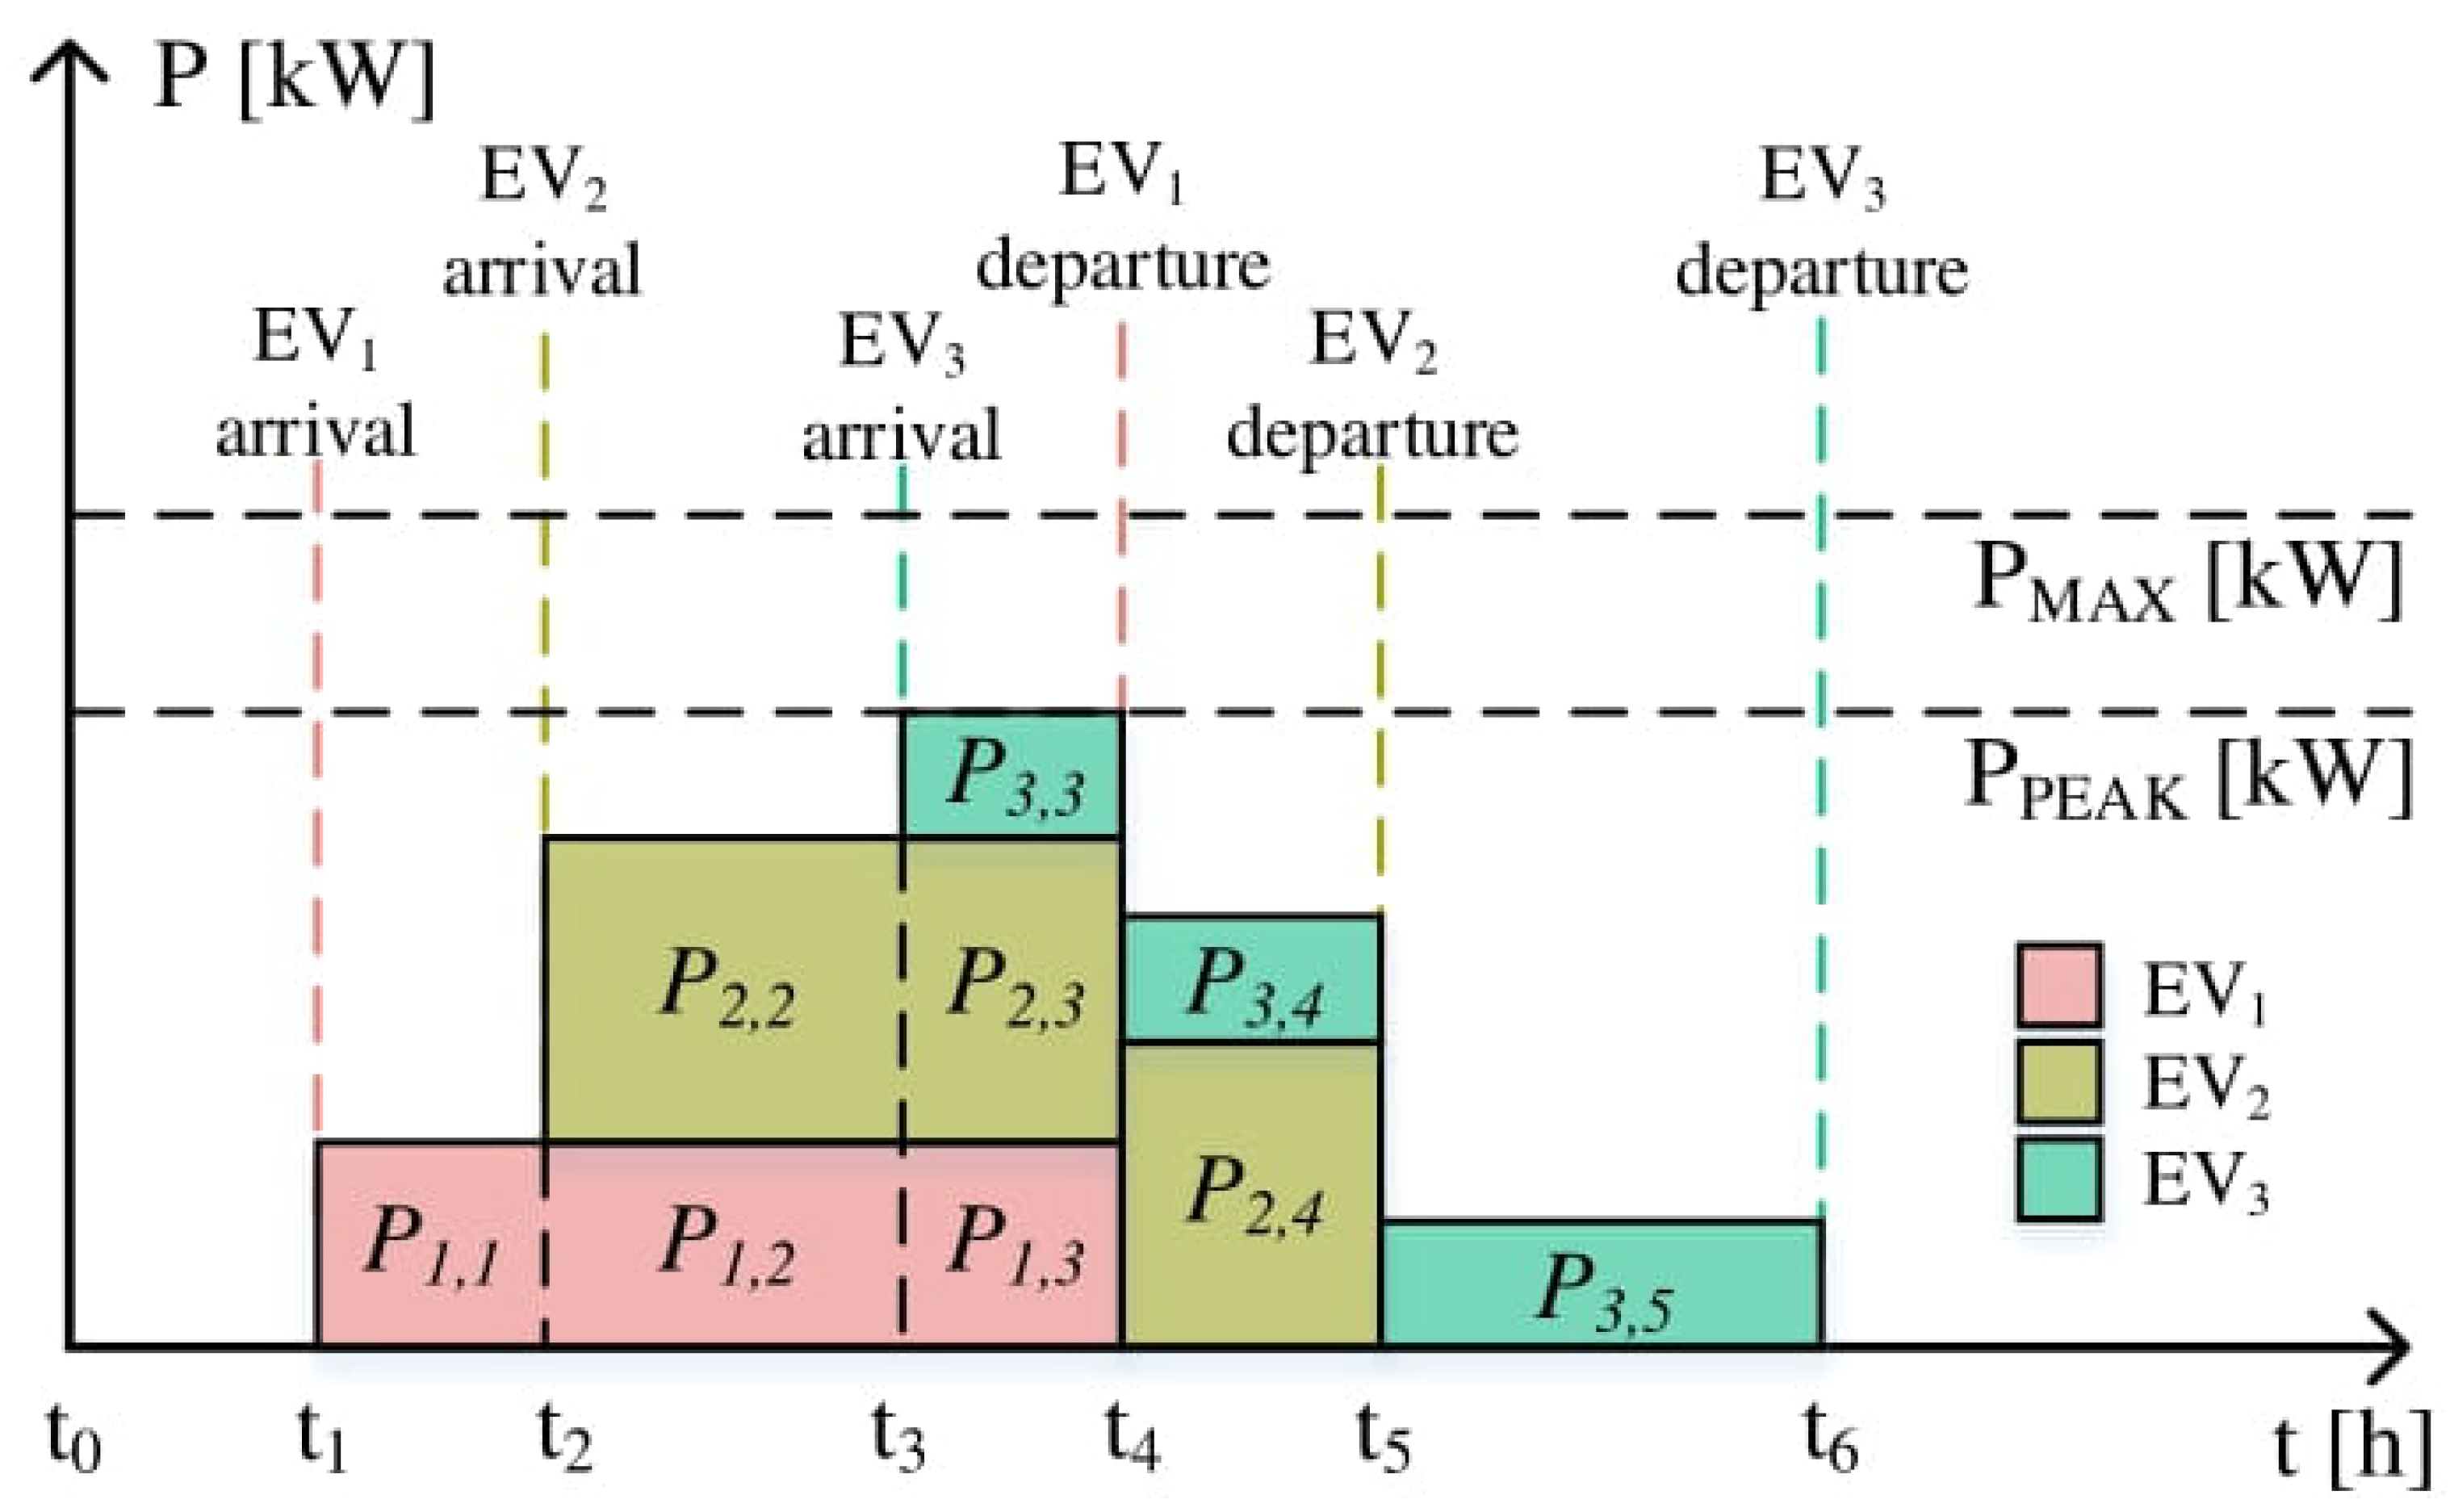
  • To ensure that the exact amount of energy is fed to the batteries of individual EVs to charge them before their departure time:
E1I + Σ(j=1,…, K−1) P1,j … (tj + 1tj) = E1F
E2I + Σ(j = 1,…, K−1) P2,j … (tj + 1tj) = E2F
ENI + Σ(j = 1,…, K−1) PN,j … (tj + 1tj) = ENF
where EiI—initial energy of the i-th vehicle, i = 1, …, N; EiF—final energy of the i-th vehicle, i = 1, …, N (80% of maximal energy EiMax because of constant current charging). Pi,j—the power of charging the i-th vehicle in the time interval from tj to tj + 1, i = 1, …, N, j = 1, …, K − 1 (variables to determine); t1, t2, …, tK—the moments in which vehicles connects or disconnects from the charging station or the DR response starts or ends (t1—the connection of the first vehicle, tK—the disconnection of the last vehicle).
This study will consider a charged battery when it completes the constant current (CC) phase of the charging process. Charging EVs in the CC, as well as in the constant voltage (CV), charging phase is not economically and practically feasible because of the decreasing effectiveness of charging in the CV phase while still occupying the charging terminal.
b.
To ensure that the total parking lot load does not exceed the demanded power PMAX during the charging process:
Σ(i = 1,…, N) Pi,1βPMAX
Σ(i = 1,…, N) Pi,2βPMAX
Σ(i = 1,…, N) Pi,K−1βPMAX
where PMAX—total parking lot power; β—describes what part of the total parking lot power is used and β ∈ (0, 1], (β = 1 denotes 100% use of available power for the parking lot).
In case of a DR event, the total power in the concerning (j-th) interval can be limited to a desired value:
Σ(i = 1,…, N) Pi,jPDR
where PDRtotal power limit during a DR event (can have a positive or negative value).
c.
To ensure that charging power of each individual EV Pi,j does not exceed its rated maximum charging/discharging power PiMAX during the whole charging process:
Pi,j = 0.
If the i-th vehicle is not connected during the period [tj, tj + 1):
Pi,j ≤ α … PiMAX.
If the i-th vehicle is connected during the period [tj, tj + 1) for i = 1, …, N and j = 1, …, K − 1 where P1MAX,…, PNMAX–maximum charging power for vehicles connected to the station; a—describes what part of the maximum charging power for vehicles is used, α ∈ (0, 1], (α = 1 denotes 100% of the maximum charging power).
In the models discussed further, parameters α and β are treated as additional variables.
d.
To protect against excessive battery discharge (because negative values of Pi,j are permitted):
EiI + Pi,1 … (t2t1) = sEiMAX
EiI + Pi,1 … (t2t1) + Pi,2 … (t3t2) = sEiMAX
EiI + Σ(j = 1,…, K−2) Pi,j … (tj + 1tj) = sEiMAX
for i = 1, …, N,
Where s (in %) denotes the acceptable minimum energy level of the vehicle.
In the following section, objective functions and models for optimizations problems are considered.
  • Considered objective functions:
Fα: = α,
Fβ: = β,
FP: = Σ(i = 1,…, N) Σ(j = 1, …, K−2) [(Pi,j + 1Pi,j)/PiMAX]2
  • Models:
The proposed algorithm has three stages in its structure and relies on solving an optimization problem using three different target functions consecutively while being subject to constraints that are based on technical limitations, as well as on values calculated in previous stages of the algorithm operation.
Model (I) is used to determine the minimum part of the battery rated power that is necessary to charge the considered vehicles (it is useful for determining if the problem is solvable—can be solved using charging power Pi,j less than nominal PiMAX):
I.
Minimize Fα,
  • subject to: (a), (b), (c), (d) and β ≤ 1.
Model (II) can be used to determine at which least peak load PPEAK a given scenario can be realized:
II.
Minimize Fβ,
  • subject to: (a), (b), (c), (d) and α ≤ 1.
In model (III), the main goal is to set the EV charging profiles characterized by the least irregularity while maintaining the PPEAK set in (II):
III.
Minimize FP,
  • subject to: (a), (b), (c), (d) and α ≤ 1, ββOPT, where (βOPT = βMIN from model (II)).
From a mathematical point of view, models (I) and (II) are linear programming tasks (objective function and all functions in the constraints are linear). In model (III), the objective function is quadratic, so we are dealing with a quadratic programming task.
The proposed algorithm uses the (1) target function in model (I) first to determine if it is possible to find a solution to the problem, namely to find a set of charging profiles that maintain the EV’s charging power below its rated value while keeping all other constraints. If in solution (I) was obtained Fα = α > 1, then the problem is unsolvable (in uncoordinated charging as well) and the algorithm informs the user that is impossible to charge every EV in the specified time, keeping all the power limits. If, however, α ≤ 1, then the algorithm proceeds to use target function (2) in model (II) with constraints: (a)–(d) and α ≤ 1.
Target function (2) in model (II) is used to determine the minimal peak load PPEAK (β·PMAX) that is possible to set in a given scenario. The minimization of PPEAK may have infinity possible results (sets of viable EV charging profiles). Since all of them are equally good regarding the value of PPEAK, the algorithm then uses target function (3) from model (III) to find the one result (a specific set of EV charging profiles) that is characterized by the lowest charging power and the lowest charging profile irregularity from the possible results (Figure 4). To do this, the minimal β (βMIN) from model (II) is then used as βOPT in model (III) as an additional constraint. The effect of using the aforementioned target functions is illustrated in Figure 5.
The difference between the individual charging profiles in the same scenario after only PPEAK minimization (II) and the charging profile irregularity minimization (III) are presented in Figure 5. It is noticeable that after using (III) the resulting profiles are indeed more regular. The severity of the difference between the results of these two optimizations varies depending on the situation; however, using (III) optimization never produced worse charging profiles when it comes to irregularity. This in turn translates to prolonging battery life.

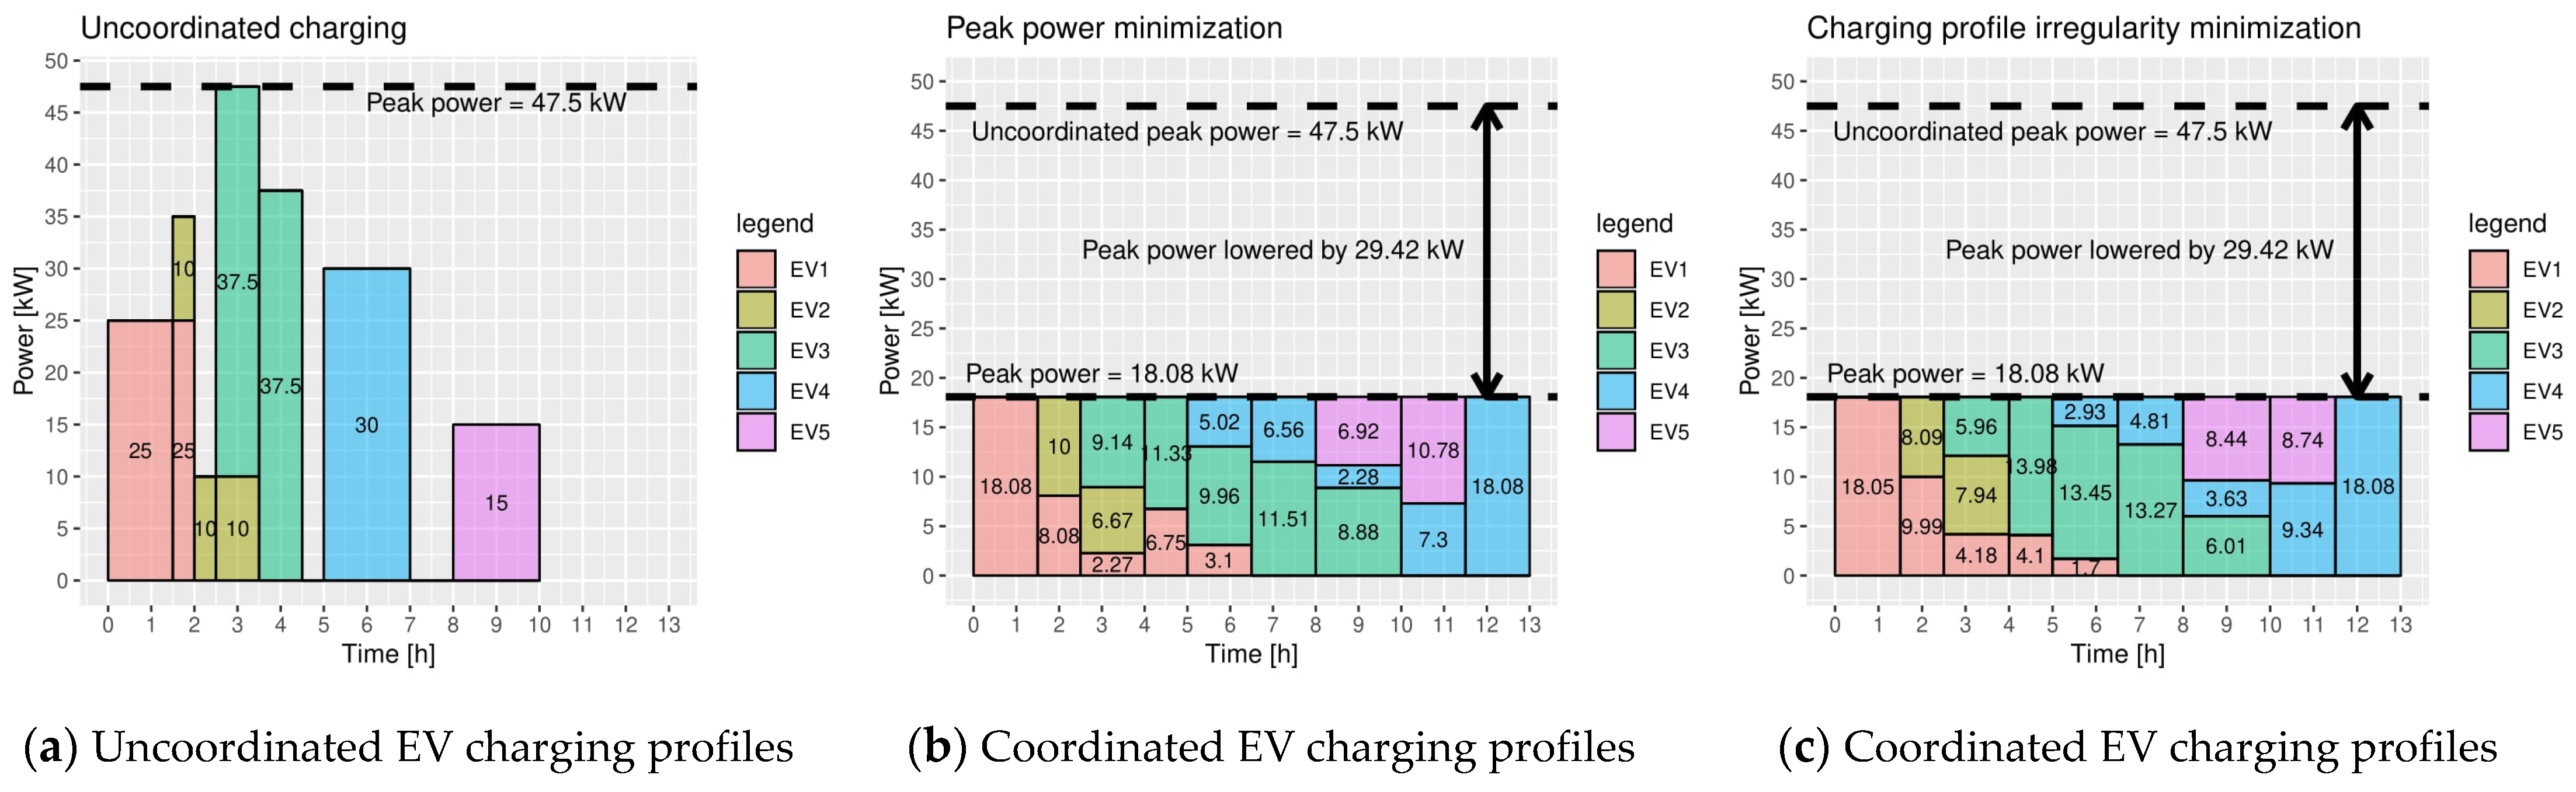
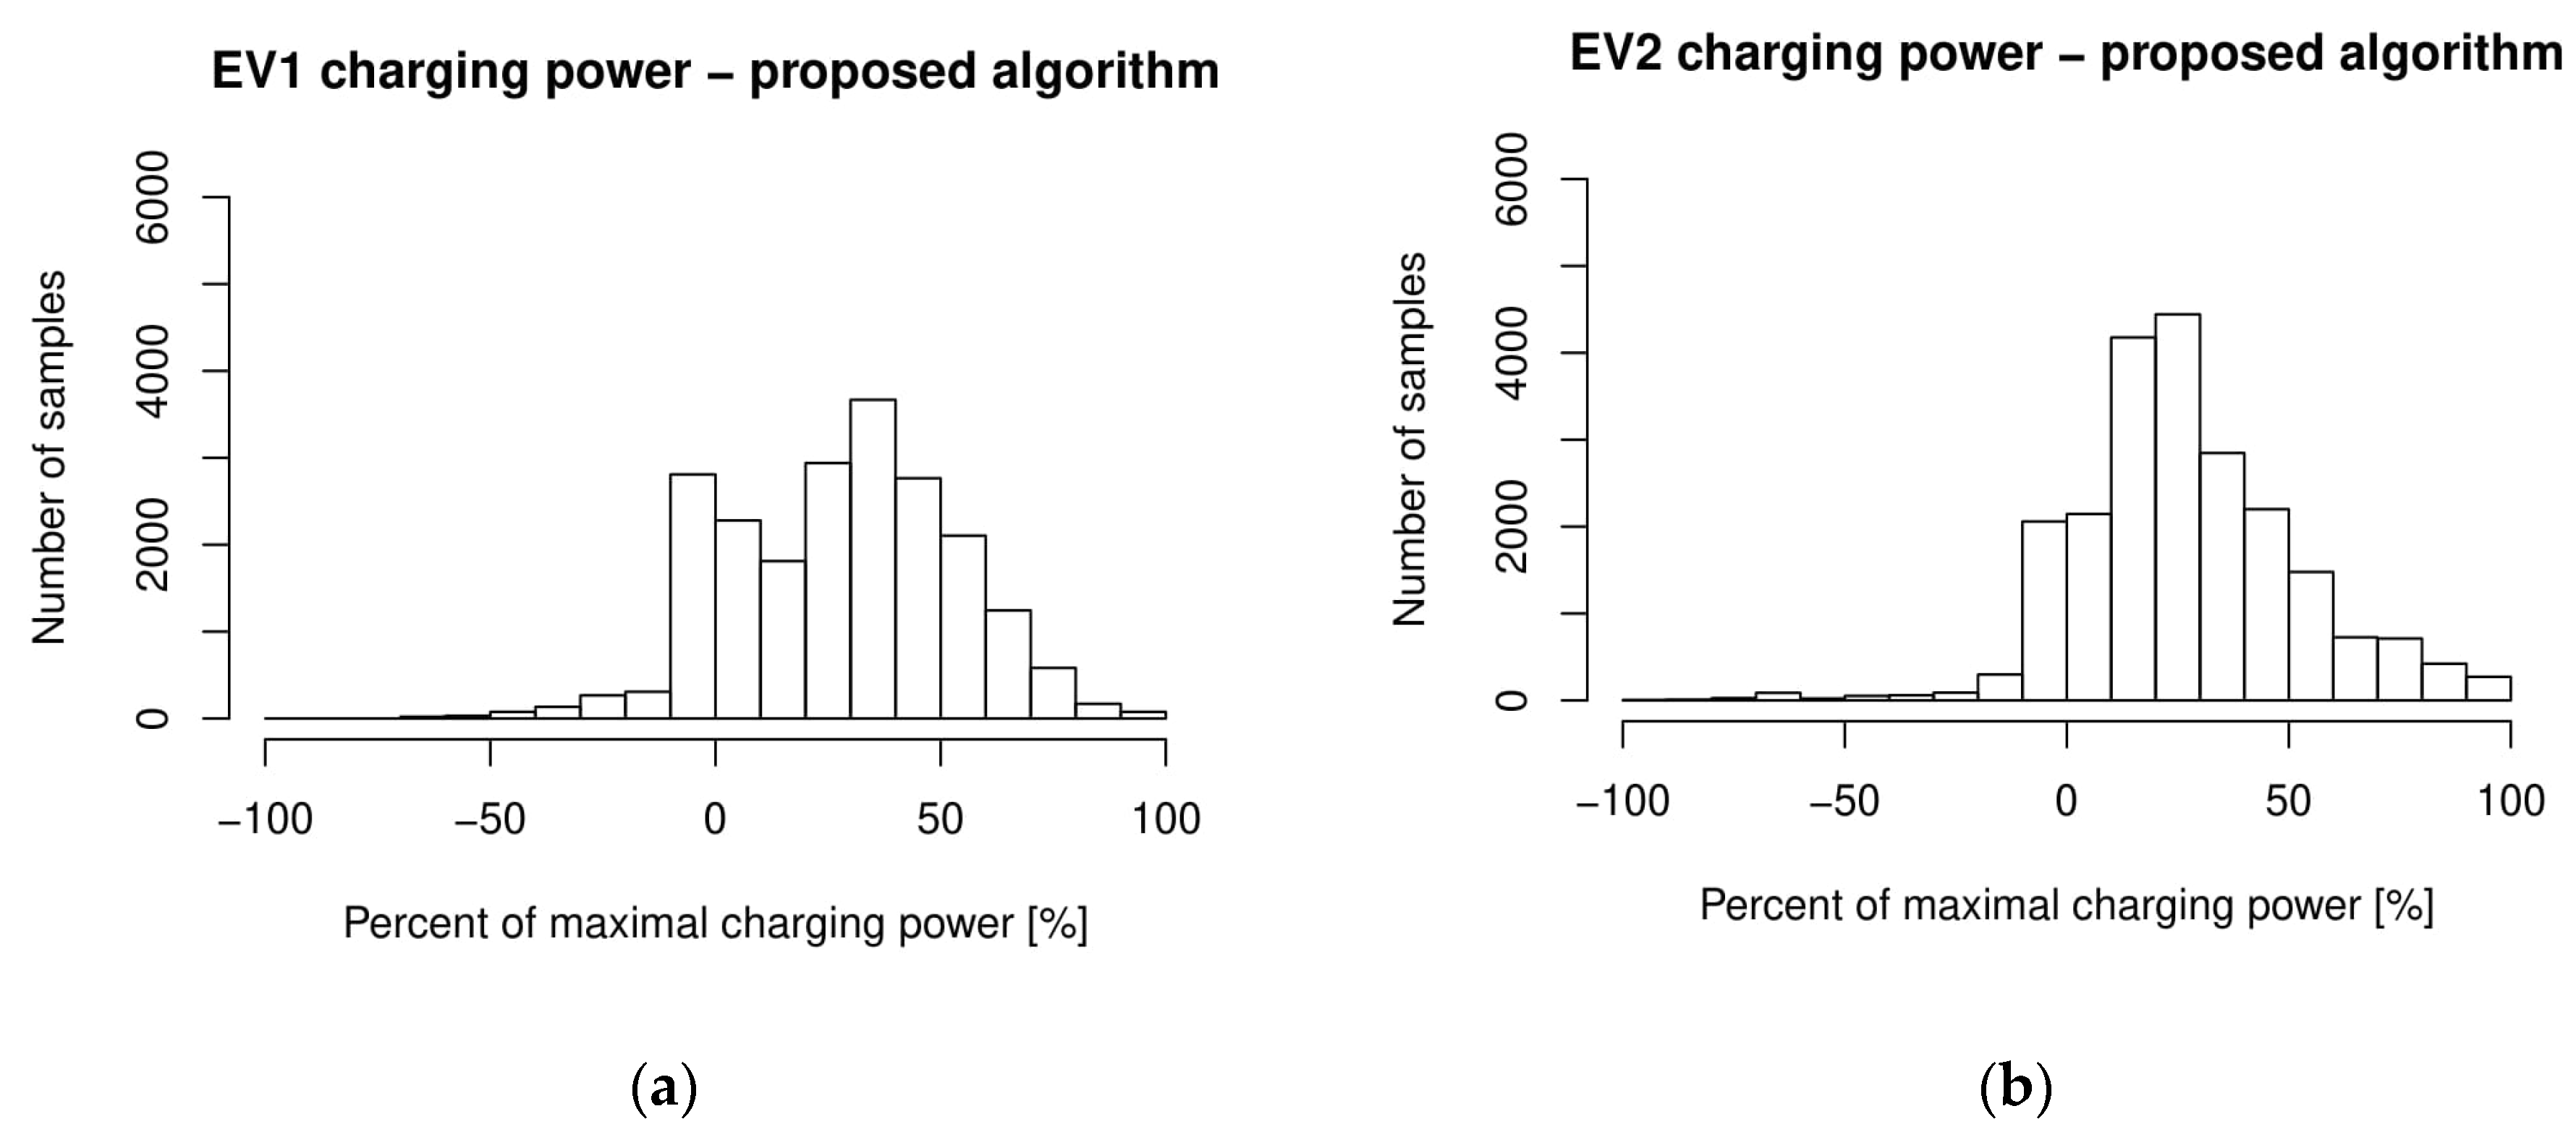
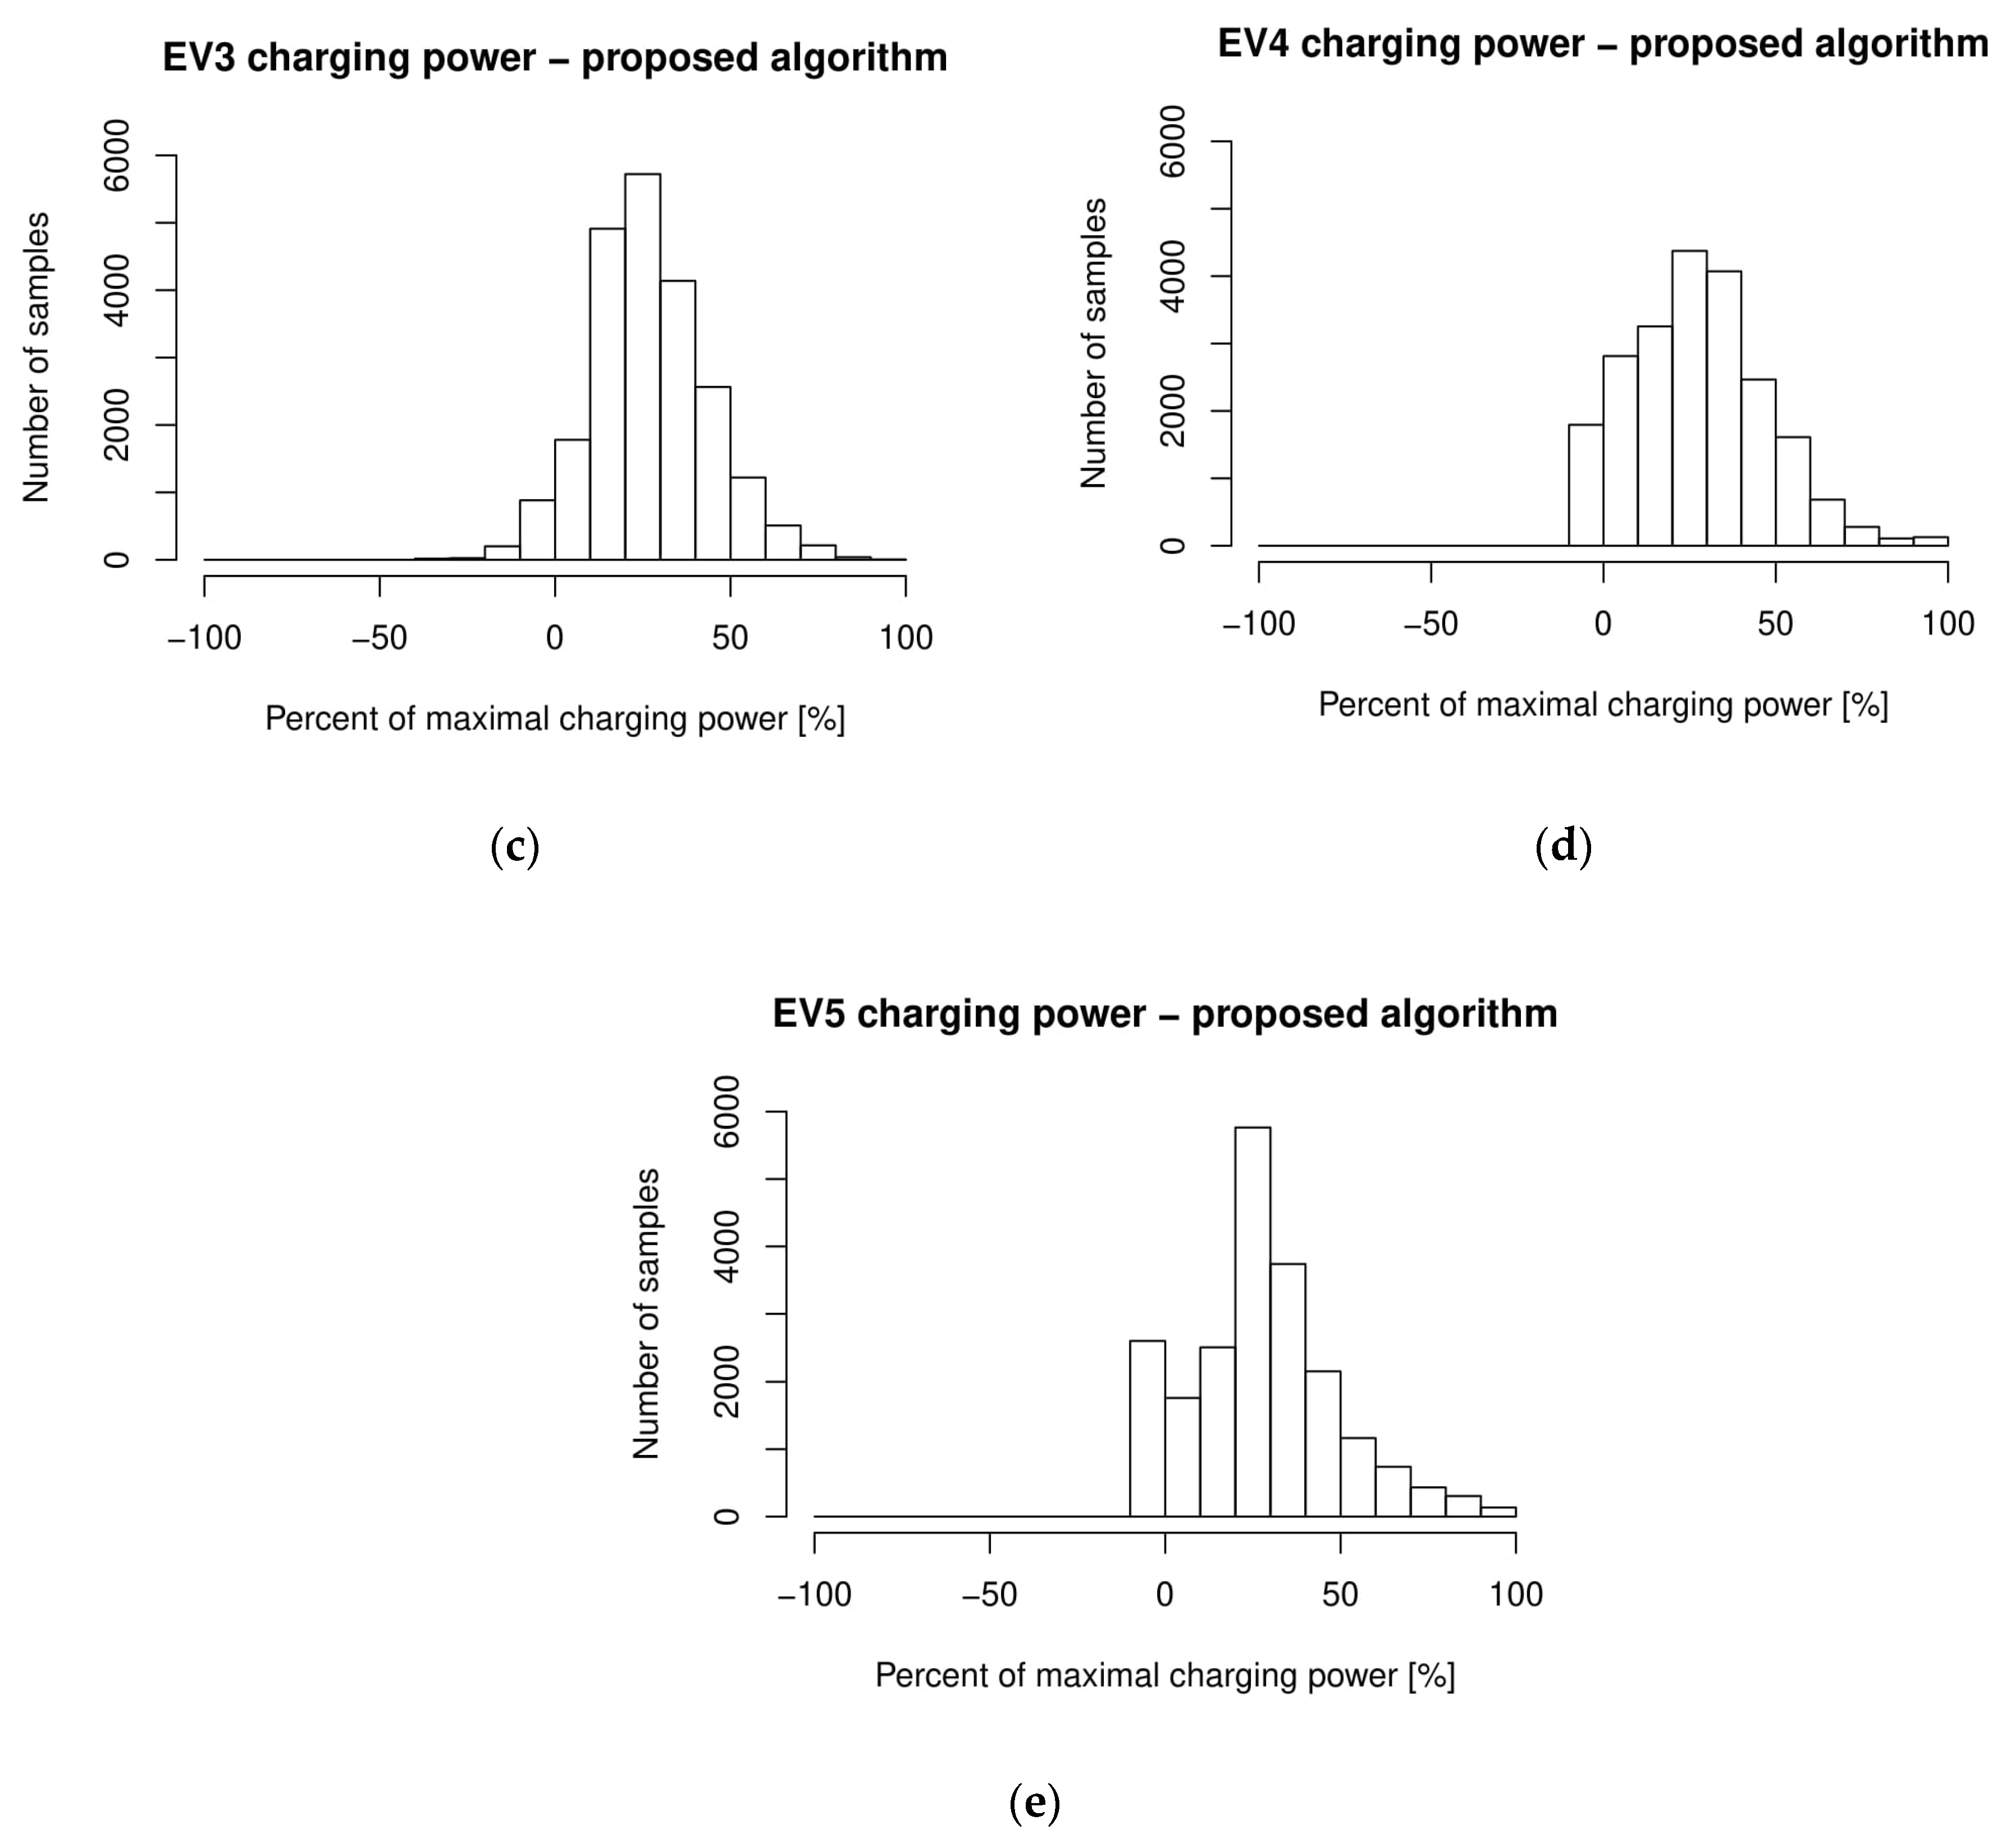
3. Results and Discussion

In this section, the simulation assumptions and description of the used scenario randomization over 300 simulated scenarios are presented, as well as the statistical simulation results, including the distribution of the peak load value (PPEAK), scenario duration, parking lot demanded power utilization efficiency and the momentary EV charging power during all 300 scenarios. Every histogram presenting the simulated values is followed by its explanation.

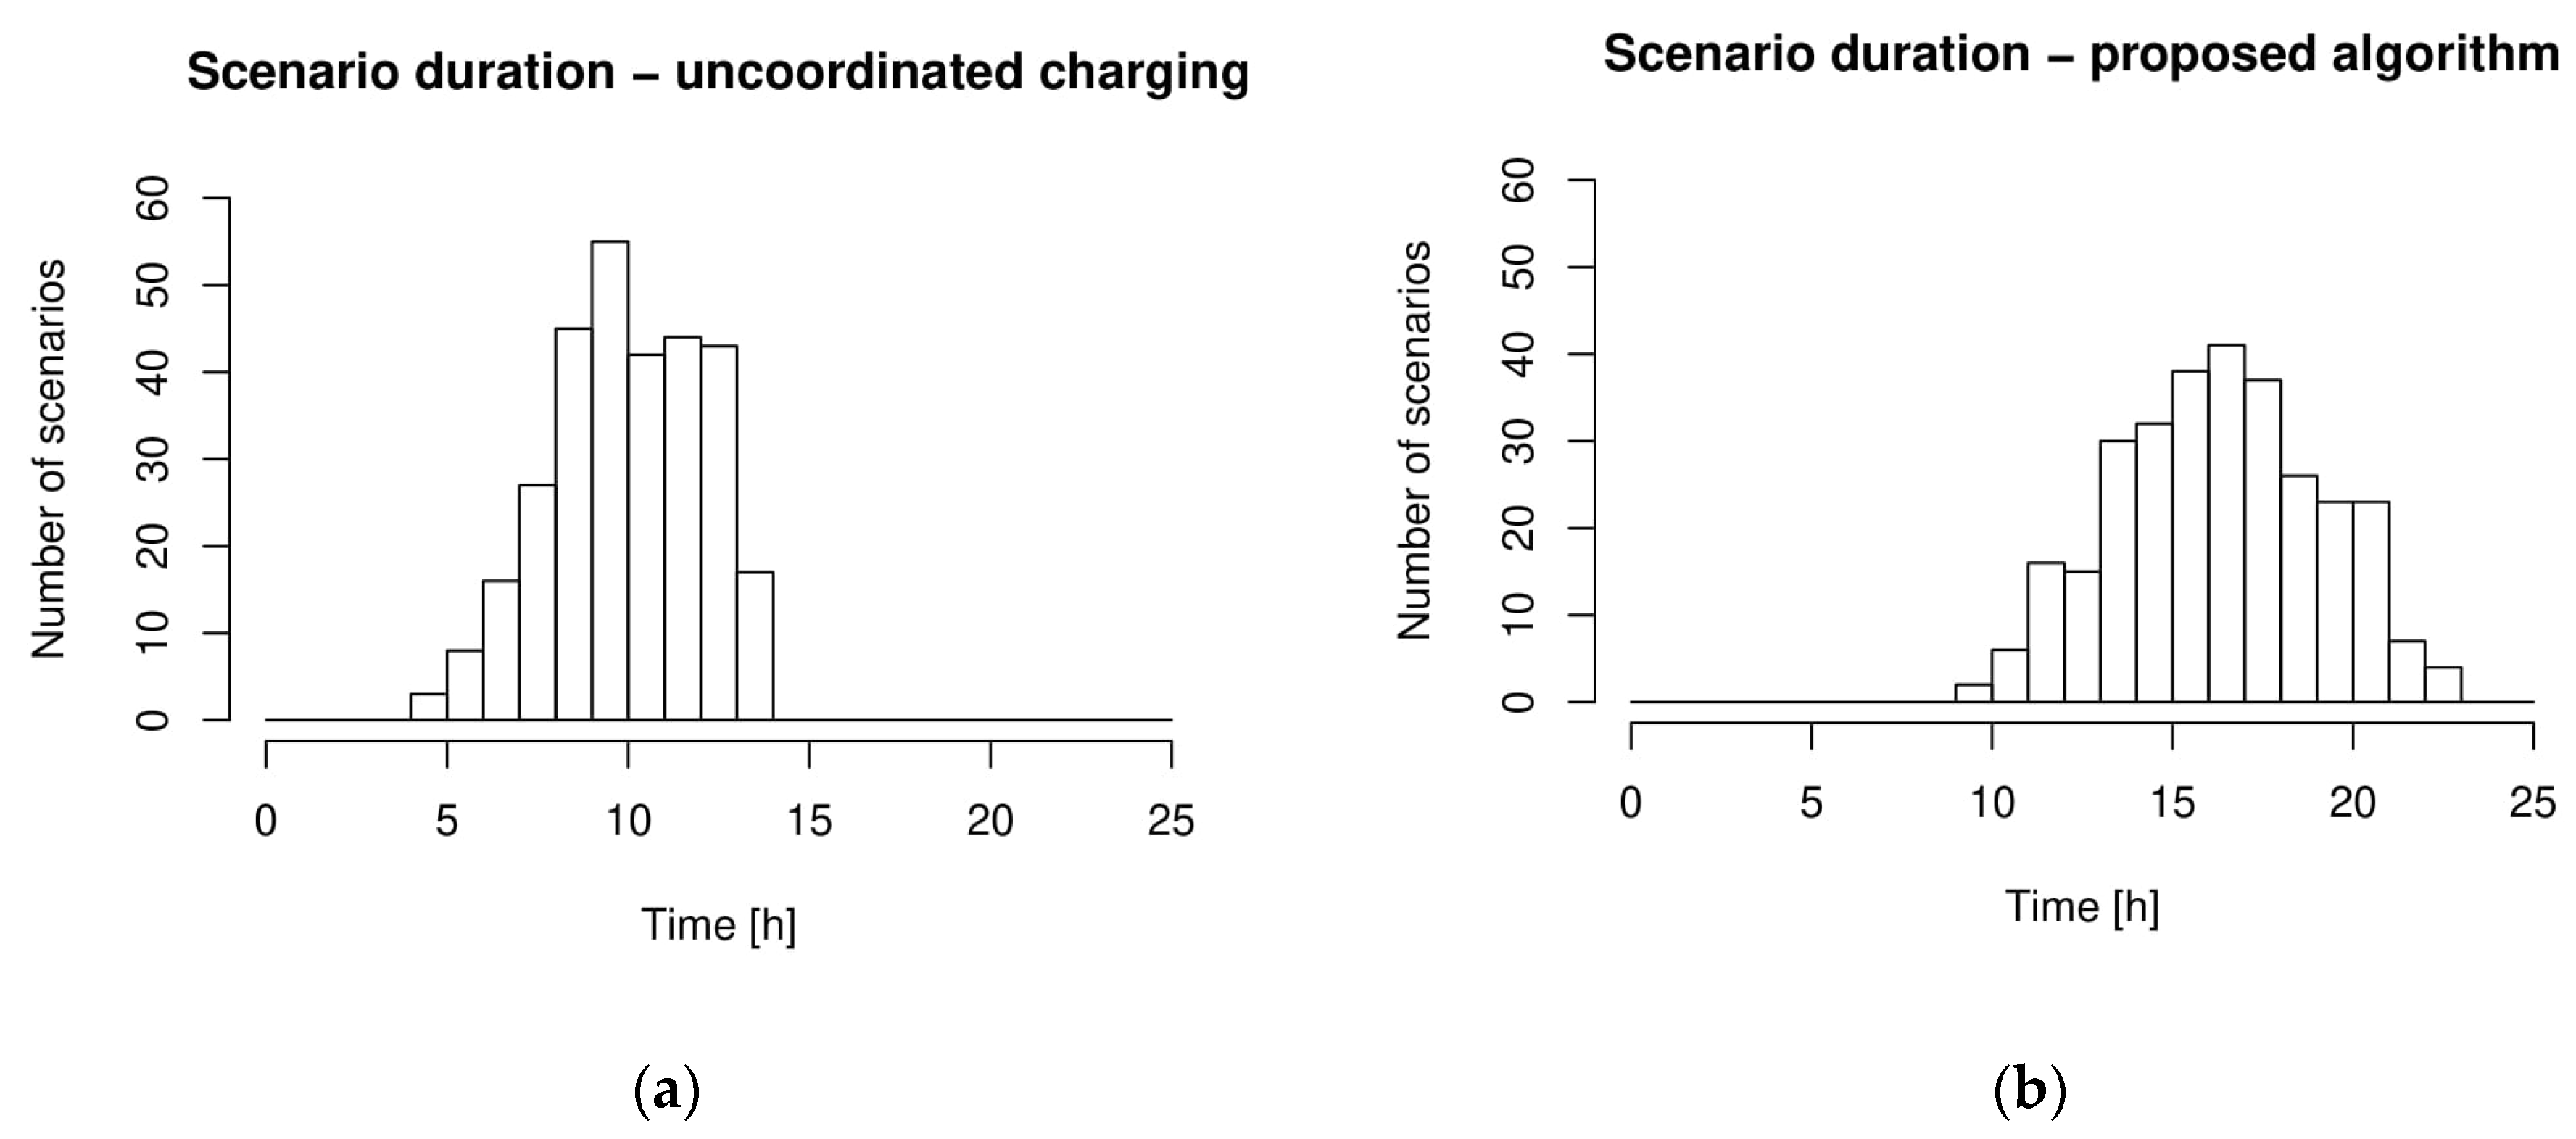
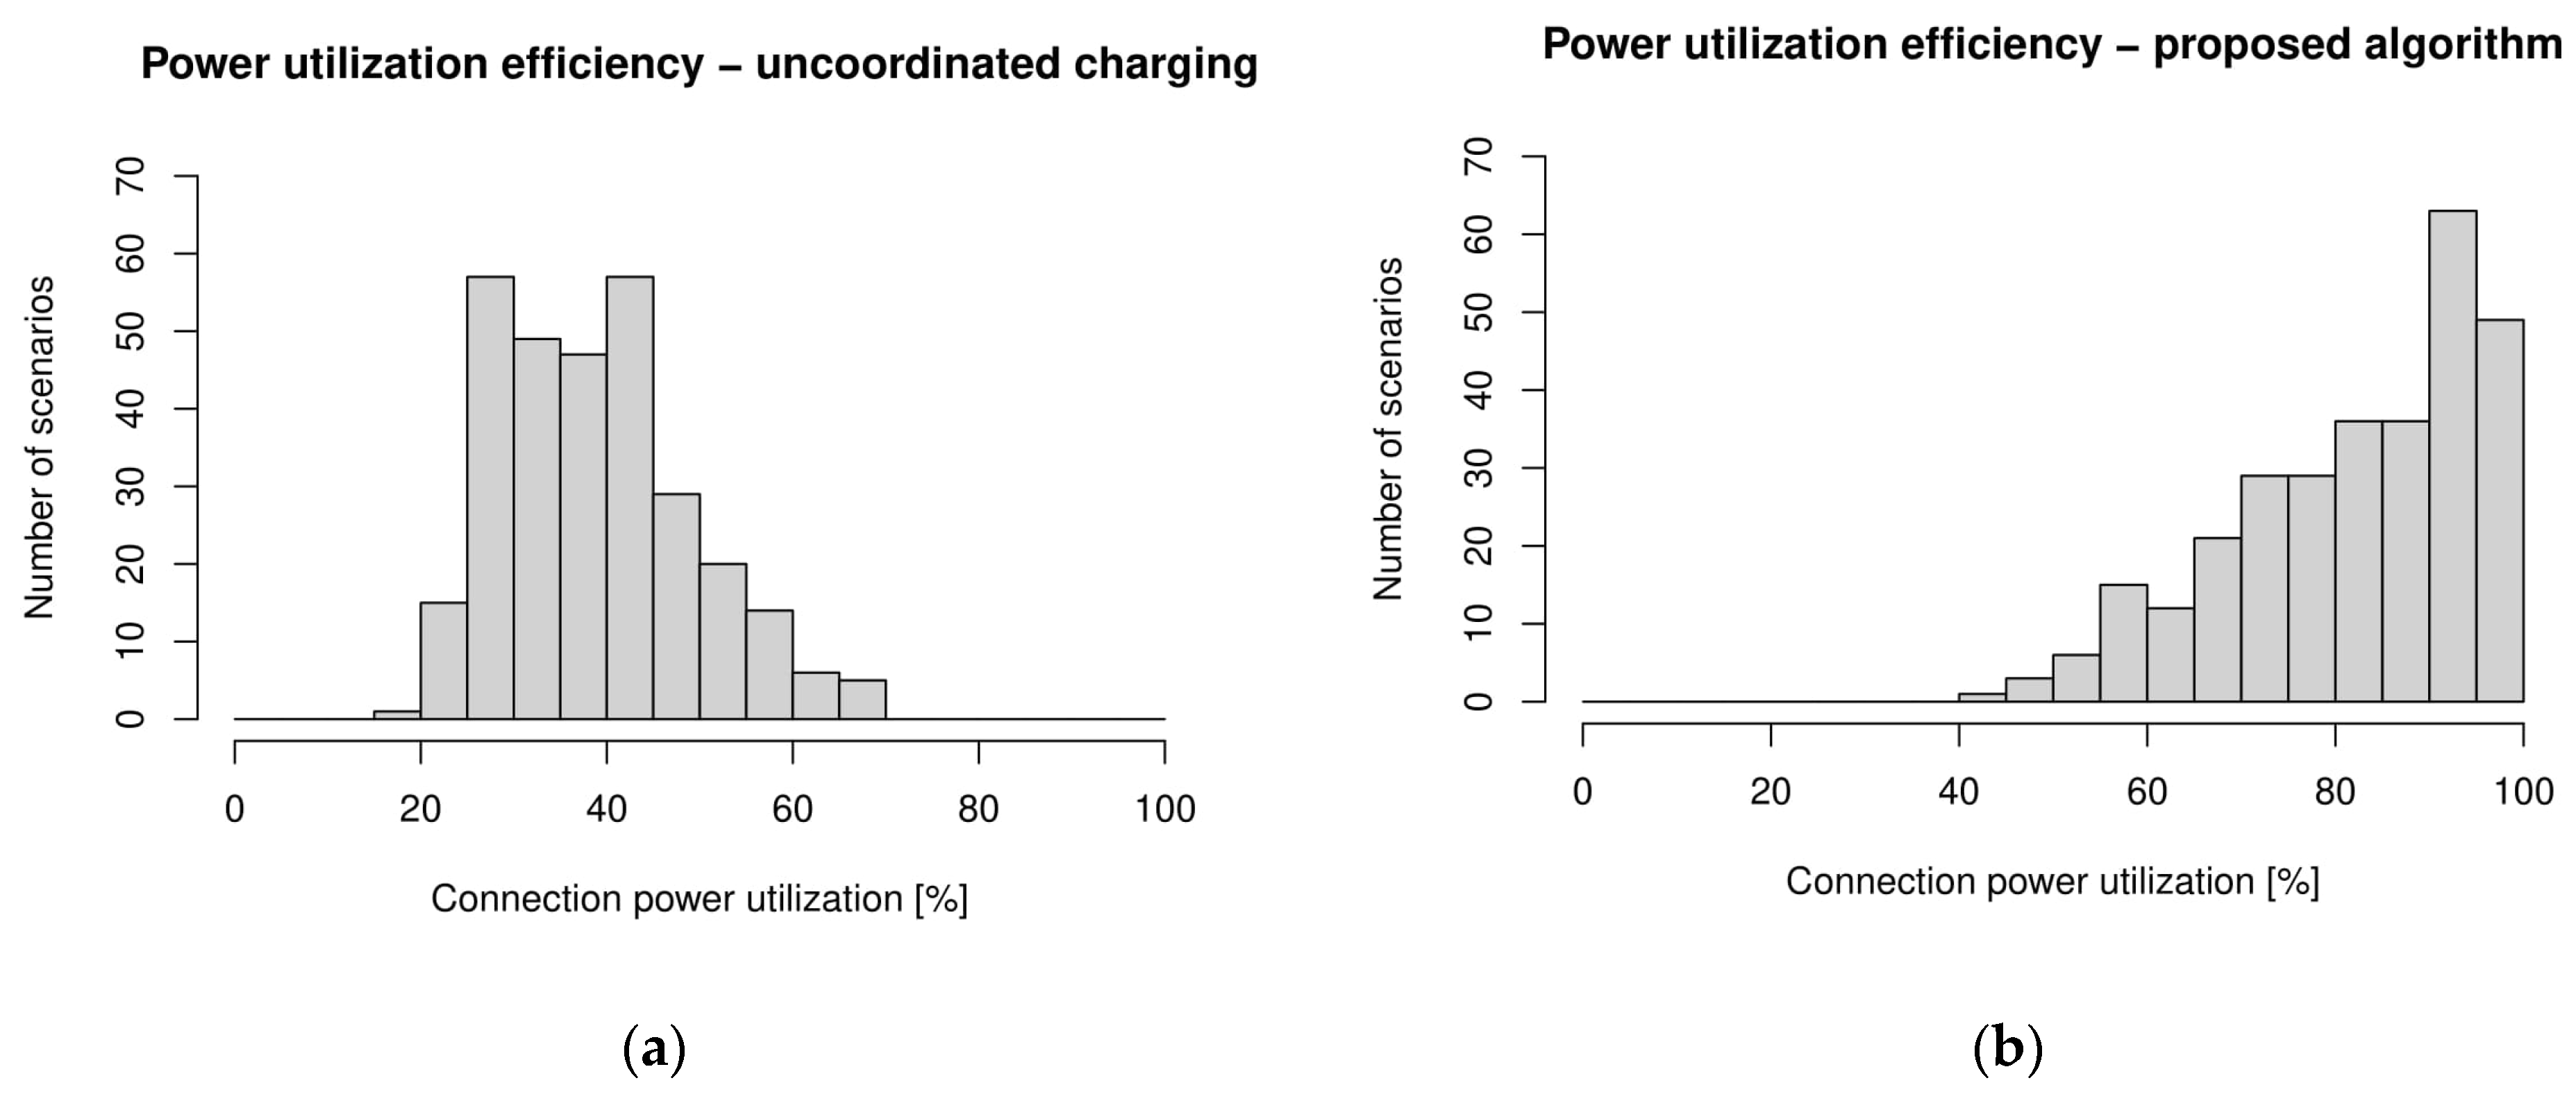
3.1. Random Scenario Generation

Tests were performed for 300 random scenarios where the number of time intervals in a scenario K = 10, the number of electric vehicles (available terminals) N = 5, the acceptable minimum energy level (in %) s = 0 (allowing complete discharge in the usable battery range while charging if it is possible to fully charge the battery in before the defined departure time), parking lot demanded power PMAX = 125 [kW] and a set of maximal EV power values for each vehicle P1MAX,…, P5MAX, as well as starting battery energy E1I,…, E5I and final battery energy E1F,…, E5F, which are presented below.
P1MAX = 25 [kW], E1I = 0 [kWh], E1F = 50 [kWh],
P2MAX = 10 [kW], E2I = 0 [kWh], E2F = 20 [kWh],
P3MAX = 37.5 [kW], E3I = 0 [kWh], E3F = 75 [kWh],
P4MAX = 30 [kW], E4I = 0 [kWh], E4F = 60 [kWh],
P5MAX = 15 [kW], E5I = 0 [kWh], E5F = 30 [kWh].
The demanded power of the parking lot PMAX is set to the value that enables all possible scenarios to be realized in the analysis (enables all EVs to be charged to full power). The simplification of initial battery charge (EiI = 0 [kWh]), even though it does not perfectly mimic reality, does not affect the general consideration. The battery capacities of considered EVs are selected to reflect the variety of EVs on the market.
The values that are randomly changing in every simulated scenario are the arrival and departure time of every considered EV. In the conducted simulations, the EV arrival time is a random value between 0 h and 12 h. This means that all five simulated EVs will arrive in the first 12 h of the simulated scenario. The ranges of the departure time are set in such a way that the charging time of the uncoordinated charging of a single EV is always 2 h and the time of the coordinated charging of a single EV is random value between 2 h and 12 h (Table 2).
Therefore, the maximal EV charging current in conducted simulations is assumed to be 0.5 C. Consequently, the shortest possible EV charging time is 2 h. The uncoordinated charging time is always equal to 2 h because the whole charging process takes place at maximal power. The coordinated charging can use the maximal charging power (0.5 C) or less. The exact power values for every EV in every charging interval is determined based on the user-specified time of departure. Therefore, the EV charging duration time for the coordinated charging is set to be a random value between 2 h (at their max power) and 12 h (it is assumed that the EV owners will not leave their vehicles charging for more than 12 h). See Table 2.

3.2. Simulation Results

Figure 6 shows an example of the proposed algorithm’s DR capabilities in a single selected scenario, where the DR event takes place from 4 to 5 h. It can reduce the total load of the considered EVs in the time frame of a DR event. The results show that the proposed EV charging algorithm lowered the peak load of the considered parking lot in all considered situations considerably (over 50–70% decrease in most cases).
Another thing to note is that among all 300 simulated scenarios the worst case of coordinated charging (PPEAK < 35 [kW]) was still better than the best case of uncoordinated charging (PPEAK > 35 [kW]), which is illustrated in Figure 7.
Due to the different natures of uncoordinated and coordinated charging, the simulated scenario duration times were different and presented in Figure 8. In the conducted simulations, the uncoordinated charging was assumed to always use 0.5 C charging current; thus, the charging of an individual EV takes 2 h. The coordinated charging requires the definition of a specific time of departure (end of charging) time. In the simulations, the duration of charging every single EV using coordinated charging was a random value between 2 h and 12 h. Because of this, the five simulated EV scenario duration times were longer when using coordinated charging, even though the arrival times were identical.
Demanded power utilization efficiency (Figure 9) is another indicator illustrating the proposed algorithm’s effect. It shows what percentage of the profile’s peak load is used over the entire duration of the whole profile (in other words, what percentage of rectangle created by the peak load value and scenario duration’s area is taken by the set of EV charging profiles).
The histograms of charging/discharging power (6 min sampling rate) of every individual EV over the course of 300 simulated scenarios are presented in Figure 10. The concern was that by lowering the peak load value in the overall parking lot profile, the individual EV charging profiles will become more irregular, which will lead to charging the vehicles at their rated power some part of the time. Results show, however, that even when determining the lowest possible peak load value in each simulated scenario the vehicles almost never use their rated power values. For most of the time, the vehicles stay in the range between 0% and 50% of their 0.5 C power (0.5 C is assumed as it is faster than slow EV charging, yet slower than rapid charging at transit charging terminals). For comparison, the uncoordinated charging uses 100% of the battery 0.5 C power during the whole charging duration.
An important thing to highlight is the power values in the histograms that are bellow 0 kWh. This means that this specific EV has been supplying power to other EVs. In certain situations, to maximally lower the peak load in the parking lot’s load, it is necessary to allow EVs to supply power to each other. In the presented simulation setup, the first two vehicles (EV1 and EV2) supply power the most, which is understandable as the few final vehicles in the parking lot may not have any EVs to supply their power to.

4. Conclusions

In this paper, an EV charging coordination algorithm is proposed. The algorithm has the ability to determine the set of individual EV charging profiles in such a way that the total peak load of considered EVs is the lowest value possible in a given scenario. To do that, some scenarios require the EVs to supply power to each other. The proposed algorithm also allows that. It also has DR capabilities; it can reduce the total load of the considered EVs in the time frame of an DR event (Figure 6). From this point where the peak load value has been lowered and possible DR signals considered, there is still an infinite number of solutions (sets of EV charging profiles). Because of this, the algorithm then chooses the single set of EV charging profiles characterized by the lowest charging profile irregularity to minimize the EV battery degradation. Based on the conducted statistical simulation, the algorithm effectiveness on a wide range of randomly generated scenarios had been verified. In 300 simulated scenarios, the algorithm managed to lower the total parking lot peak load significantly, over a 50–70% decrease in most cases (Figure 7), and the utilization of the much-lowered peak power value had increased significantly (Figure 9). All this is done maintaining the EV charging power in the range between 0% and 50% of their assumed rated power (0.5 C) a large majority of the time (Figure 10). Last, Figure 10 also shows that EVs indeed help to lower the peak load value optimally by supplying power to each other when necessary.
In conclusion, the contribution of this paper is the development and simulation verification of an EV charging algorithm that is able to perform three main objectives at the same time in a considered EV parking lot, which are as follows:
Minimize the total power required by the EV parking lot while continuing to satisfy the needs of every connected EV to allow for lower demanded power, which then in turn reduces the strain on the power lines (to achieve the lowest possible demanded power, the algorithm allows for two-directional energy flow, from grid to vehicle but also from vehicle to grid or between the vehicles to maximize the algorithms power lowering potential),
Minimize the EV charging power, as well as minimize the charging profile variability to maximally extend the lives of EV batteries,
Allow regulatory action, which can take the form of total load reduction or even power supply (V2G) in a certain time period based on DR signal,
Ensuring that every accepted EV is charged as much it can be while staying in the constant current (CC) part of the charging characteristic before the user-specified departure time.
In addition, the algorithm prevents overcharging or overdischarging of every EV, prevents using higher charging power than the nominal and can be set to not discharge EVs below a specified SOC and to allow or disallow V2G functionality with different EVs.
To the best of the authors’ knowledge, there were no studies presenting a charging algorithm accomplishing all those tasks simultaneously during its functioning.
The proposed algorithm allows for better management of electric vehicle charging stations, including by reducing peak power.

Author Contributions

Project administration—G.B.; conceptualization—G.B., B.W. and M.J.; methodology—R.D. and B.W.; software, validation, formal analysis—B.W. and R.D.; investigation, visualization—B.W.; writing—original draft, writing—review and editing—B.W., G.B., R.D. and M.J. All authors have read and agreed to the published version of the manuscript.

Funding

This research received no external funding.

Institutional Review Board Statement

Not applicable.

Informed Consent Statement

Not applicable.

Data Availability Statement

Data is contained within the article.

Conflicts of Interest

The authors declare no conflict of interest.

References

  1. The Paris Agreement. 2016. Available online: https://www.seforall.org/sites/default/files/The-Paris-Agreement.pdf (accessed on 16 May 2022).
  2. Burch, I.; Gilchrist, J.; Center for Climate Protection. Survey of Global Activity to Phase Out Internal Combustion Engine Vehicles. September 2018 Revision. Available online: https://theclimatecenter.org/wp-content/uploads/2018/09/Survey-on-Global-Activities-to-Phase-Out-ICE-Vehicles-FINAL.pdf (accessed on 16 May 2022).
  3. The World Bank. Electric Mobility & Development—An Engagement Paper from the World Bank and the International Association of Public Transport, Advanced Public Transport, Esmap. 2018. Available online: https://openknowledge.worldbank.org/bitstream/handle/10986/30922/eMobility_and_Development.pdf (accessed on 16 May 2022).
  4. U.S. Department of Energy. EV Everywhere Grand Challenge Blueprint. 2013. Available online: https://energy.gov/sites/prod/files/2014/02/f8/eveverywhere_blueprint.pdf (accessed on 15 June 2022).
  5. Accelerating the EV Transition. Report Prepared for WWF by Vivideconomics, Part 1—March, 2018. Final Report Part 1. Available online: https://www.wwf.org.uk/sites/default/files/2018-03/Final%20-%20WWF%20-%20accelerating%20the%20EV%20transition%20-%20part%201.pdf (accessed on 16 May 2022).
  6. Center for Climate Protection. The Transition to a Zero Emission Vehicle Fleet for Cars in the EU by 2050, a Policy Support Study Carried Out as Part of the EAFO Project for the European Commission Directorate General Mobility & Transport. Available online: http://www.eafo.eu/sites/default/files/The%20transition%20to%20a%20ZEV%20fleet%20for%20cars%20in%20the%20EU%20by%202050%20EAFO%20study%20November%202017.pdf (accessed on 16 May 2022).
  7. Habib, S.; Kamran, M.; Rashid, U. Impact analysis of vehicle-to-grid technology and charging strategies of electric vehicles on distribution networks—A review. J. Power Sources 2015, 277, 205–214. [Google Scholar] [CrossRef]
  8. Zhang, G.; Tan, S.T.; Wang, G.G. Real-time smart charging of electric vehicles for demand charge reduction at non-residential sites. IEEE Trans. Smart Grid 2017, 9, 4027–4037. [Google Scholar] [CrossRef]
  9. Liang, H.; Liu, Y.; Li, F.; Shen, Y. Dynamic economic/emission dispatch including pevs for peak shaving and valley filling. IEEE Trans. Ind. Electron. 2018, 66, 2880–2890. [Google Scholar] [CrossRef]
  10. Rassaei, F.; Soh, W.-S.; Chua, K.-C. Demand response for residential electric vehicles with random usage patterns in smart grids. IEEE Trans. Sustain. Energy 2015, 6, 1367–1376. [Google Scholar] [CrossRef]
  11. Xu, Z.; Su, W.; Hu, Z.; Song, Y.; Zhang, H. A hierarchical framework for coordinated charging of plug-in electric vehicles in China. IEEE Trans. Smart Grid 2015, 7, 428–438. [Google Scholar] [CrossRef]
  12. Karfopoulos, E.L.; Hatziargyriou, N.D. Distributed coordination of electric vehicles providing v2g services. IEEE Trans. Power Syst. 2015, 31, 329–338. [Google Scholar] [CrossRef]
  13. Cardona, J.E.; López, J.C.; Rider, M.J. Decentralized electric vehicles charging coordination using only local voltage magnitude measurements. Electr. Power Syst. Res. 2018, 161, 139–151. [Google Scholar] [CrossRef]
  14. Zheng, Y.; Shang, Y.; Shao, Z.; Jian, L. A novel real-time scheduling strategy with near-linear complexity for integrating large-scale electric vehicles into smart grid. Appl. Energy 2018, 217, 1–13. [Google Scholar] [CrossRef]
  15. Wang, L.; Sharkh, S.; Chipperfield, A. Optimal decentralized coordination of electric vehicles and renewable generators in a distribution network using a* search. Int. J. Electr. Power Energy Syst. 2018, 98, 474–487. [Google Scholar] [CrossRef]
  16. Omran, N.G.; Filizadeh, S. A semicooperative decentralized scheduling scheme for plug-in electric vehicle charging demand. Int. J. Electr. Power Energy Syst. 2017, 88, 119–132. [Google Scholar] [CrossRef]
  17. Xydas, E.; Marmaras, C.; Cipcigan, L.M. A multi-agent based scheduling algorithm for adaptive electric vehicles charging. Appl. Energy 2016, 177, 354–365. [Google Scholar] [CrossRef] [Green Version]
  18. Hajforoosh, S.; Masoum, M.A.S.; Islam, S.M. Online optimal variable charge-rate coordination of plug-in electric vehicles to maximize customer satisfaction and improve grid performance. Electr. Power Syst. Res. 2016, 141, 407–420. [Google Scholar] [CrossRef] [Green Version]
  19. Bina, V.T.; Ahmadi, D. Stochastic modeling for scheduling the charging demand of ev in distribution systems using copulas. Int. J. Electr. Power Energy Syst. 2015, 71, 15–25. [Google Scholar] [CrossRef]
  20. López, M.A.; de La Torre, S.; Martin, S.; Aguado, J.A. Demand-side management in smart grid operation considering electric vehicles load shifting and vehicle-to-grid support. Int. J. Electr. Power Energy Syst. 2015, 64, 689–698. [Google Scholar] [CrossRef]
  21. Masoum, A.S.; Deilami, S.; Abu-Siada, A.; Masoum, M.A.S. Fuzzy approach for online coordination of plug-in electric vehicle charging in smart grid. IEEE Trans. Sustain. Energy 2014, 6, 1112–1121. [Google Scholar] [CrossRef] [Green Version]
  22. Alam, M.J.E.; Muttaqi, K.; Sutanto, D. Effective utilization of available pev battery capacity for mitigation of solar pv impact and grid support with integrated v2g functionality. IEEE Trans. Smart Grid 2015, 7, 1562–1571. [Google Scholar] [CrossRef] [Green Version]
  23. Sun, B.; Huang, Z.; Tan, X.; Tsang, D.H.K. Optimal scheduling for electric vehicle charging with discrete charging levels in distribution grid. IEEE Trans. Smart Grid 2016, 9, 624–634. [Google Scholar] [CrossRef]
  24. Hafez, O.; Bhattacharya, K. Integrating ev charging stations as smart loads for demand response provisions in distribution systems. IEEE Trans. Smart Grid 2016, 9, 1096–1106. [Google Scholar] [CrossRef]
  25. Liu, C.; Chai, K.K.; Zhang, X.; Lau, E.T.; Chen, Y. Adaptive blockchain-based electric vehicle participation scheme in smart grid platform. IEEE Access 2018, 6, 25657–25665. [Google Scholar] [CrossRef]
  26. Dubey, A.; Santoso, S. Electric vehicle charging on residential distribution systems: Impacts and mitigations. IEEE Access 2015, 3, 1871–1893. [Google Scholar] [CrossRef]
  27. Hussain, S.; Ahmed, M.A.; Kim, Y.-C. Efficient power management algorithm based on fuzzy logic inference for electric vehicles parking lot. IEEE Access 2019, 7, 65467–65485. [Google Scholar] [CrossRef]
  28. Yao, L.; Lim, W.H.; Tsai, T.S. A real-time charging scheme for demand response in electric vehicle parking station. IEEE Trans. Smart Grid 2016, 8, 52–62. [Google Scholar] [CrossRef]
  29. Mehta, R.; Srinivasan, D.; Khambadkone, A.M.; Yang, J.; Trivedi, A. Smart charging strategies for optimal integration of plug-in electric vehicles within existing distribution system infrastructure. IEEE Trans. Smart Grid 2016, 9, 299–312. [Google Scholar] [CrossRef]
  30. Tang, W.; Bi, S.; Zhang, Y.J.A. Online coordinated charging decision algorithm for electric vehicles without future information. IEEE Trans. Smart Grid 2014, 5, 2810–2824. [Google Scholar] [CrossRef] [Green Version]
Figure 1. Architecture of the considered EV parking lot.
Energies 15 05195 g001
Figure 2. Flowchart of the proposed EV coordination algorithm.
Energies 15 05195 g002
Figure 3. Notation for exemplary scenario.
Energies 15 05195 g003
Figure 4. Illustration of a charging scenario: (a) no EV charging coordination, (b,c) with the utilization of the proposed algorithm.
Energies 15 05195 g004
Figure 5. Comparison of EV charging profiles on different stages of algorithm operation. (a) Individual EV charging profiles after Fβ minimization. (b) Individual EV charging profiles after FP (profile irregularity) minimization.
Energies 15 05195 g005
Figure 6. Example of the proposed algorithm’s DR capabilities in a single selected scenario, where the DR event takes place from 4 to 5 h. (a) Uncoordinated charging without DR signals. (b) Coordinated charging without DR signals. (c) Increasing the parking lot load to 25 kW during DR event. (d) Load reduction to 10 kW during DR event. (e) Load reduction to 0 kW during DR event. (f) Supplying 20 kW to the grid during DR event.
Energies 15 05195 g006
Figure 7. A summary of peak load values in simulated scenarios. (a) Peak power values when using uncoordinated charging. (b) Peak power values when using coordinated charging.
Energies 15 05195 g007
Figure 8. A summary of simulated scenario duration. (a) Without the proposed algorithm. (b) With the proposed algorithm.
Energies 15 05195 g008
Figure 9. A summary of demanded power utilization efficiency. (a) Without the proposed algorithm. (b) With the proposed algorithm.
Energies 15 05195 g009
Figure 10. Histograms of charging/discharging power (6 min sampling rate) of every EV over the course of 300 simulated situations. (a) EV1, (b) EV2, (c) EV3, (d) EV4, (e) EV5—charging power with the utilization of the proposed algorithm.
Energies 15 05195 g010aEnergies 15 05195 g010b
Table 1. Peak load increments simulation results in different countries (based on [7]).
CountriesLevel of EV PenetrationIncrement in Peak Load
United Kingdom10%18%
20%36%
USA (Los Angeles)5%3%
15%13%
Belgium30%56%
Western Australia17%37%
31%74%
USA (California)10%17%
20%43%
The Netherlands30%54%
Portugal11%14%
Table 2. Random parameter ranges in conducted statistical simulations.
Uncoordinated ChargingCoordinated Charging
EV arrival timerandom between 0 h and 12 hrandom between 0 h and 12 h
EV charging time2 hrandom between 2 h and 12 h
Publisher’s Note: MDPI stays neutral with regard to jurisdictional claims in published maps and institutional affiliations.

