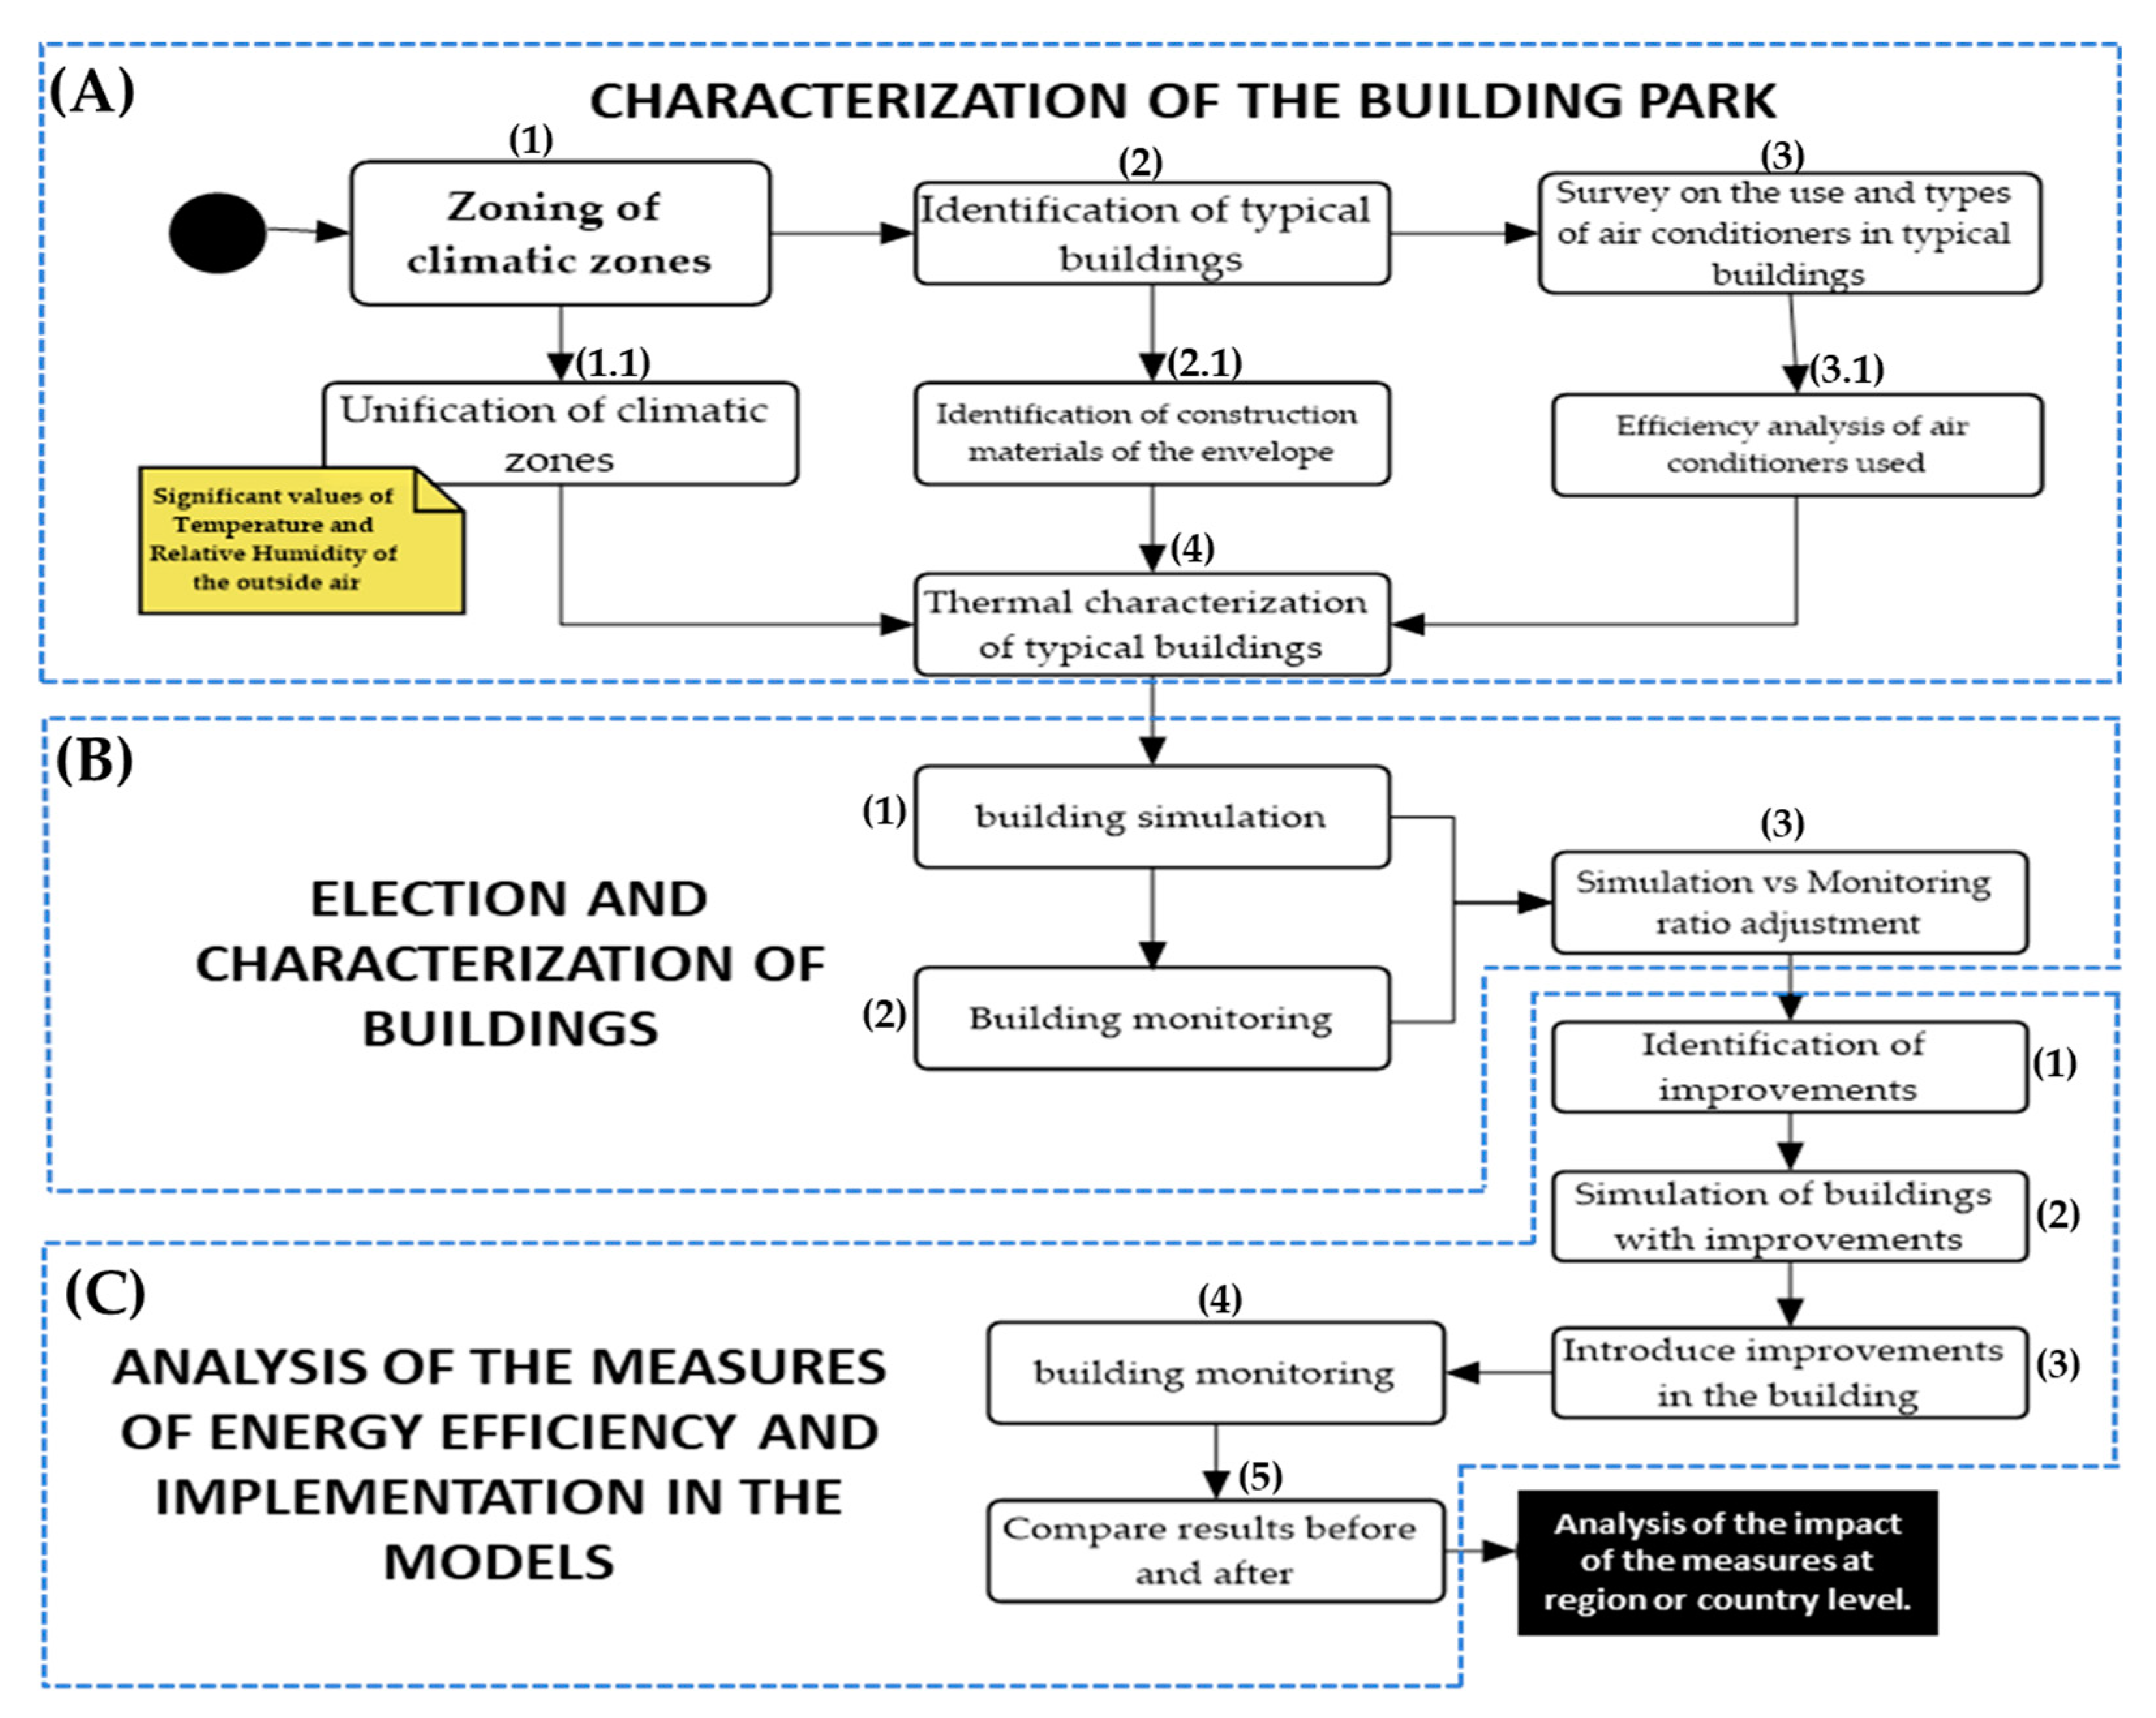
Article

Methodology to Determine Energy Efficiency Strategies in Buildings Sited in Tropical Climatic Zones; Case Study, Buildings of the Tertiary Sector in the Dominican Republic

by
Joan Manuel Felix Benitez
1,2,*,
Luis Alfonso del Portillo-Valdés
1,
Rene Pérez
2 and
David Sosa
2
1
ENEDI Research Group, Energy Engineering Department, University of the Basque Country (UPV/EHU), 48013 Bilbao, Spain
2
Directorate of Scientific Research Management, East Central University (UCE), San Pedro de Macorís 21000, Dominican Republic
*
Author to whom correspondence should be addressed.
Energies 2022, 15(13), 4715; https://doi.org/10.3390/en15134715
Submission received: 12 April 2022 / Revised: 20 June 2022 / Accepted: 22 June 2022 / Published: 27 June 2022
(This article belongs to the Topic Sustainable Built Environment)

Abstract

:
The application of energy-efficiency strategies in buildings is a hot topic around the world; in some countries, there are regulations with more or less degree of compliance, but in most countries located in the tropical zone, there are no regulations, and it is not easy to transfer regulations of countries outside of tropical zone. For countries located in tropical zones, the implementation of strategies to reduce the heat flow from outside to inside buildings is a key point. As a case study, the Dominican Republic (DR) was chosen, and during 2020, an analysis focusing on buildings of the tertiary level was carried out with the goal of using scientific methodology focused on tropical climates that allows for a significant reduction in energy consumption by implementing Energy Efficiency Strategies (EESs) that are available, with minimal intrusion into the building and low cost. The study includes, as parts of the proposed methodology, the characterization of building parks, including the climatic zonification of the country, an in-depth study of the building typologies in DR, and a massive survey around the country about the technical characteristics of air conditioning units and their usage; the election and characterization of buildings, including simulation and validation throughout the monitoring of eight different buildings; an analysis of the measures of energy efficiency and implementation in the models, including the election of a demonstrative building, the election of the most convenient EESs, modeling of EESs, implementing EESs in the building, monitoring, and validation; and an analysis of the impact of the measures at the region or country level, throughout which important conclusions can be obtained in order to reduce energy consumption in the country. The results show that this methodology is a valid tool for countries situated in tropical areas in order to reduce the energy consumption associated with air conditioning units with low cost, availability, and no intrusive EESs.

1. Introduction

For countries situated in tropical areas, the electricity consumed by the air conditioning in order provide indoor thermal comfort for productive office work in offices of public and commercial buildings represents 40–60% of their total energy consumption [1]. Different studies [2,3] have shown that these air conditioners’ consumption of electricity is relatively high, “ranging between 1900–5400 kWh per air conditioner unit per year, depending on the COP and on the cooling capacity [4]”. The low energy efficiency qualification of these air conditioners is an important factor that contributes to their high electricity consumption.
Determining the actual energy consumption and usage patterns of air conditioning system is important in evaluating its energy efficiency. The running time of an air conditioning unit is essential information for the calculation of values such as SEER (Seasonal Energy Efficiency Ratio) and AFP (Annual Factor Performance), which can help reduce the cost of electrical energy [5,6].
Heat gains from incident solar radiation in buildings are the main cause of the energy consumption attributable to the air conditioning units [7,8,9] and are even higher when its operations are in an hourly phase with solar radiation. In that case, the air conditioning unit works by trying to carry out the gained heat flow, which happens when the difference between the indoor and the outdoor temperature is very high, as is the case in countries located in tropical latitudes.
A good choice of air conditioning systems that combines good EESs to reduce thermal loads in the construction and rehabilitation of buildings can provide users with the necessary indoor air comfort with lower energy consumption [10].
According to statistical data, 44% of all the energy used is consumed in buildings of domestic, tertiary, or industrial sectors, and buildings are responsible for 36% of CO2 emissions [11]. The majority of the existing buildings today in the DR were built at a time when energy efficiency was not a major priority, and even today, this factor is still not considered as important as it should be. This leads to a large consumption of energy to cool buildings; in fact, tis factor consumes the most electricity in a building [12].
In Hong Kong, China, Jia [13] conducted a study that involved sixty-six (66) office buildings. Jia analyzed the cooling energy consumption in these buildings from 2004 to 2013. Factors examined in these 66 buildings included window-to-wall ratio; the shading coefficient; wall, ceiling, and widow-glass thicknesses; U-value; and the area covered by the air conditioner. Factors that were taken into consideration included the type of air conditioning systems, indoor and outdoor temperature, indoor lighting power, ventilation rate, nominal coefficient of performance (COP) of refrigeration units, and power of the cooling system fan. The result was that, with the change in water-cooled air conditioning units, a higher COP was achieved; this, along with shading techniques in windows, could reduce energy consumption in commercial buildings by about 36 W/m2 to 24 W/m2, i.e., by 33% of total consumption.
Alireza et al. [14] carried out a study in an office building in Tehran; the building was modeled and simulated using DesignBuilder in order to carry out the analysis of the thermal energy performance of the building. It was determined that, due to its conventional construction materials, energy losses were higher than normal. By optimizing the building’s materials, the losses were reduced by approximately 82%. By optimizing the building, they achieved savings of around 2 MWh of energy in one year.
In order to reduce the energy consumption of a building with respect to cooling, various obligatory international standards have been implemented for the use of energy in the construction of new residential and commercial buildings or the rehabilitation of existing buildings [15]. These standards require a significant thermal improvement in the building’s envelope, introducing strategies in windows, roofs, and exterior walls. Similarly, it is necessary for building designers, architects, and engineers to use simulation tools to study energy performance so that it can result in energy savings that comply with different standards [16,17,18]. Therefore, the accuracy of simulation results is fundamental to achieving an energy efficient building.
Different methods have been developed to analyze the energy performance of buildings using computer simulation [19,20]. The method used in these studies combines the analysis of strategies for design with plans to introduce electrical and thermal measurements into the building, and it also uses an energy simulation tool.
There are many Sustainability Certification Systems (SCS) [21] as Building Research Establishment Environmental Assessment Methodology (BREEAM), German Sustainable Building Council (DGNB), High Quality Environmental (HQE), Leadership in Energy and Environmental Design (LEED), and others. All of them have similar hierarchical structures that state similar protocols for the evaluation of the buildings’ sustainable performance. These protocols lead technicians step-by-step to the final goal; that is, to obtain a more sustainable building. One of the items that these SCSs use to validate the final goal is energy consumption.
There are also some directives such as the Energy Performance of Buildings in Europe or the Standard ASHRAE 90.1-2007 in the USA that state criteria and procedures in order to optimize the energy performance of buildings. This work has taken into account all these systems, directives, and standards in order to present a new methodology for the improvement in the energy building performance adapted to tropical climates.
Table 1 shows compares the items used in those SCSs and those used in this work in order to reveal the differences in the presented methodology with existing SCSs.
The methodology presented in this research aims to reduce the energy consumption in buildings’ conditioning at the tertiary level in tropical zones. An in-depth characterization of the climate zones of the building park and of the construction topology of the analyzed country or region must be followed by the characterization of a number of significative buildings located in different climatic zones. This part of the methodology includes simulation, monitoring and validation. The next step is to analyze the available EESs in order to choose those that well fit the purpose of the research, including modeling in the modeling tool, its implementation in one of the studied buildings, and monitoring and validation of the retrofitted building. The knowledge generated in this study will allow actions to be determined to achieve the main goal, i.e., energy efficiency performance in buildings. In this work, the simulation was carried out using DesignBuilder, an energy simulation software from Energy Plus [22]. In the second phase, the building was monitored by placing temperature and relative humidity sensors on the building envelope, both inside and outside, together with a data logger to measure the consumption of the units dedicated to the air conditioning. As the building was adjusted, the different strategies used to reduce the energy consumption were evaluated [23].
In the final phase, different strategies were introduced in the envelope in order to carry out analyses of the thermal and energy impact on the building under study. The results showed an impact of the different strategies introduced on the envelope in reducing the energy consumption, also showing that the economic costs could be reliably and correctly predicted in the case of an accurate simulation of existing buildings.

2. Methodology

This work is part of a research project that has been conducted in the Dominican Republic since 2017; one of its objectives is to highlight the Dominican Republic’s need for its own regulations for the construction and/or rehabilitation of buildings in terms of the criteria of energy efficiency adapted to the tropical climate and thus to provide governments with sufficient, high-quality information to progress in that direction.
The proposed methodology is shown in Figure 1, which shows a process flow diagram for energy efficiency analysis in buildings located in countries belonging to the tropical climatic zone.

2.1. Characterization of the Building Park

The proposed methodology starts with a detailed contextualization of the three key elements required in the improvement in energy efficiency in the building sector in a specific country or geographical region, i.e., climatology, building typology, and energy installations.
Detailed knowledge of the different climatic zones is essential to improve the energy efficiency of buildings. Therefore, Peña et al. [24] conducted the first known climatic zoning work for the Dominican Republic, and Felix et al. [25] contributed with a more detailed study that allowed for a new restructuring and unification of the previous climatic zones with criteria based on the most influential climatic variables in the energy management of buildings, i.e., outdoor temperature and relative humidity.
It is also important to know the building typology in the different climatic zones. In this context, is important to highlight the work carried out by Peña [26] when identifying the different building typologies of the DR and associating them with climatic zones.
To finalize the process of contextualizing the building stock of the country or region under study, an analysis of the installed energy systems must be carried out, including the analysis of the use criteria adopted by users. This work can be carried out through massive surveys.
Once the described works have been carried out, it is possible to carry out the thermal characterization of the building stock in accordance with the climatic zoning, the building typology, and the characteristics and operation usage of the energy systems.

2.2. Election and Characterization of Buildings

Taking into account the sector chosen to implement energy saving measures and analyzing the previous characterization of the building stock, the typical buildings of the climatic zones are chosen, and their detailed and complete characterization is carried out.
Therefore, the following steps are carried out:
  • Choice of the building type in each climatic zone;
  • Building modeling;
  • Building monitoring during at less six months, ensuring the tropical two seasons are included;
  • Adjustment of the modeling process;
  • Model validation.

2.3. Analysis of the Measures of Energy Efficiency and Implementation in the Models

Once the typical buildings of each climatic zone have been characterized, the EESs that could be implemented are analyzed, accounting for specific circumstances regarding to the study’s goal, such as economic impact, availability, reliability, intrusion grade, and others. In this way various levels of action can be established in the building.
It is not necessary to implement this phase in all the selected buildings; it must only be carried out in one of the buildings and should be carried out in four phases:
  • Choice of the measures to be implemented in accordance with the estimated economic investment and other factors;
  • Implementation of the measures in the model of the selected building and analysis of the efficiency improvement;
  • Implementation of the measures in the selected building and monitoring for one year;
  • Validation of the implemented EESs in the model through the results of the monitoring of the building.

2.4. Analysis of the Impact of the Measures at Region or Country Level

Finally, a detailed analysis of the impact of the measures at different economic levels can help manage energy saving policies at the regional or country level.

3. Case Study

For this research, the Dominican Republic (DR) was selected as a case study. It has a tropical climate and a significant energy demand, mainly for the operation of air conditioning equipment [27,28].

3.1. Characterization of the Building Park

Referring to steps A.1 an A.1.1 in Figure 1, an analysis of the climatic zoning of the DR has been carried out based on a study of Peña et al. [26], performing a unification of similar climatic zones in terms of the behavior of the two climatic variables that most affect the energy consumption of buildings: maximum and minimum outdoor temperature and relative humidity [25]. The result of this study is shown in Figure 2, where the eight climate zones are shown.
For the analysis of the building typology, the works of Peña et al. [29] and Felix et al. [30] were used.
For step A.3, a massive survey was also carried out concerning the characteristics of air conditioning systems and trends in their use. The survey was carried out in the period from July 2019 to September 2019 through telephone calls.
Taking into account the study shown in Section 3.1, the provinces of San Juan, Monseñor Nouel (Bonao), San José de Ocoa, Santiago, Duarte (San Francisco de Macorís), Pedernales, Punta Cana* (place of tourist importance), and La Romana were selected to carry out the survey. A total of 7617 tertiary level buildings registered in the General Report of the National Registry of Establishments, Volume I 2014–2015, of the aforementioned provinces [31] were identified as buildings that meet with the goal of the study.
A total of 556 buildings were surveyed, with questions about the usual use of air conditioning, as well as other questions regarding air conditioning units such as the number of units, brand and model, and technical specifications.
As a result of the application of step A.3.1 in Figure 1, the obtained results show that 100% of this kind of buildings have at least one air conditioner, 65% of the users have the habit of placing the set point temperature below 20 °C, and 66% of the air conditioners have an efficiency (SEER) less than 6.10.

3.2. Election and Characterization of Buildings

In order to achieve step A.2 marked in Figure 1, a representative building in each of the eight climatic zones must be selected. The election of the eight representative buildings, one per climatic zone, is based on a previous study that matched the different construction typologies with the climatic characteristics.
Figure 3 shows the eight selected buildings, all of which were modeled in DesignBuilder and monitored in order to validate the modeling work.
The following general considerations were taken into account in order to properly simulate the eight buildings:
  • Building envelopes were constructed in a 3D display format with the thermal characteristics of existing materials [32].
  • The energy actions due to use (associated loads outside the air conditioning parameter) were eliminated to ensure that the thermal and energy parameters of the equipment itself were studied.
  • For each of the models built, the office uses characteristics that were assigned by editing only the operating hours of the premises and the metabolic loads according to the average number of people on the premises.
  • The corresponding incident weather data in each province, obtained from the NSRDB data viewer [33], were loaded to calculate the simulation for each model.
  • Simulation analyses focused the greatest effort on visualizing internal gains for each model and the behavior of the climate control equipment.
In order to not be repetitive, more details about the modeling process are given in the next Section; see Section 3.4, which analyzes the chosen building in which EESs are implemented.

3.3. Analysis of the Measures of Energy Efficiency and Implementation in the Models

Because this project is addressed to public servants and politicians in order to help them in the decision-making process of new rules focused on energy-efficiency performance in the DR, the framework for the selection of EESs are low cost, high availability and reliability at the DR level, and a low grade of intrusion in the building.
As a representative building among the eight preselected buildings, the one situated in zone climatic C (see Figure 3) was selected due to the readiness of the property to implement Energy Efficiency Strategies (EESs) and support them economically. The building is located in the province of San José de Ocoa in the Dominican Republic. The building is concretely situated at latitude 18.537240 and longitude 70.507698, with an orientation of 258° to the South West [34], and it is occupied by an insurance company; therefore, it belongs to tertiary-level buildings.
The building consists of a single floor, formed by a reception area and two office rooms. Figure 4 shows a plan view of the building and the location of the temperature and relative humidity sensors.
To elaborate the strategies to be implemented, it was necessary to obtain data concerning the area of the façade vs. the area of glass (consisting in the percentage of glass on each side of the building), as shown in Table 2. This, together with the orientation, allowed for the identification of the façades most exposed to solar radiation.
Due to the geographical situation of the Dominican Republic, i.e., 18.7357° N, 70.1627° W, the façades oriented to the south have the impact of the sun during the entire day, while those looking east have the sun in the morning and those to the west in the evening.

3.3.1. Thermal Characterization of the Building Type

According to step A.2.1 in Figure 1, a study of construction materials was carried out. The construction materials of the tertiary-type buildings define their structural characteristics [30]. These are a highly relevant factor, as they influence the thermal comfort of the building and therefore affect both the quality of life of the occupants and the comfort at work [35].
As a consequence of the application of step A.4 represented in Figure 1, Table 3 shows the physical and thermal properties of the materials and their influence on the transfer of heat towards the indoors.
Table 4 shows the emissivity values of the different materials of the building types in the DR [36].
It can be seen that the majority of the values of the different materials are close to the unit, which means that those materials favor heat transfer and hence increase the energy consumption in the air conditioning units. This is because the smaller the value of the emissivity, the better the insulation by the reflection, which is not the case for the materials used in the DR.

3.3.2. Current Situation with Respect to Air Conditioning of the Building Type

In order to define the current situation of the building type selected with respect to the air conditioning behavior, sensors with data loggers were placed in different parts of the building. They had the following specifications [37]:
  • Brand: WiFi-TH+.
  • Temperature from −20 to +60 °C and the humidity measuring range from 0 to 100%.
  • Accuracy of +/−0.3 °C.
  • The data could be verified wirelessly using EasyLog Cloud.
  • Register memory of up to 500,000 values.
  • The data could be extracted by USB port.
The sensors were placed both inside and outside the building, providing readings of the air temperature and relative humidity from both indoor and exterior ambience.
In addition, an electrical energy meter was placed at the electrical intake of the air conditioner in order to quantify the system’s electricity consumption and thus determine the work interval of the selected building.
The electric energy meter had the following specifications [38]:
  • Brand: ELOG sensor DENT.
  • Configuration for data storage by PC.
  • Storage, depending on the selected values, up to 300,000 values.
  • Configuration for recording data by time preference (from 1 to 10 seconds or 5, 10, 30 minutes.).
  • Recording of energy data (active, apparent and reactive), power, power factor, current, and voltage, among others.
  • Data download by USB port.
Another factor to take into account is that the sensors and the energy meter were installed for a period of 7.5 months, 225 days. Furthermore, the data were taken at intervals of 30 min, for all the parameters measured, so as to have a enough information. As a sample, Scheme 1 shows the collected data of the monitored months.
These data were used to determine the typical day and can be seen in Scheme 2 and Scheme 3.
The temperature and relative humidity are key parameters for both the thermal comfort and the air conditioning control. These values should be taken into account to achieve comfortable conditions for the activity being carried out in the indoor area of a building [25].
In tertiary-level buildings, the temperature and relative humidity necessary for users to be comfortable are around 23.8 °C and 60%, respectively [30].
As shown by the data in Scheme 3, these comfort temperatures are not reached, with the highest temperature being 28 °C, which is far from 23.8 °C, showing that conventional air conditioning systems need to do more work for thermal loads, which in turn implies a greater consumption of electrical energy, exceeding 12.62 kWh/day on average.
As shown in Scheme 3, the relative humidity almost always remains beyond the recommended level, so it can be stated that the indoor comfort is acceptable for this parameter.
Scheme 4 shows the electric energy consumption in air conditioning units (kWh), and Scheme 5 shows the behavior of outdoor temperature. In Scheme 4, it can be seen that for all the typical days of each of the months under study, the amount of electric energy used in the building conditioning is in the same phase as the solar radiation phase. It is also remarkable that during June, July, and August afternoons, the energy consumption remains constant, as well as the outside temperature, which due to the sun’s elevation during those months in the DR.
It is also worth noting that at midday, i.e., rest time, the air conditioning set point is changed to an higher point and then turned back again when the rest time is finished, but this habit leads to a peak in which the A/C unit has to deal with the accumulated heat during rest time, which means that the electric energy consumption is greater during the afternoon period.

3.3.3. Consumption of Electric Energy of the Selected Building Type

Table 5 shows the energy consumption during the last three years in F. Mancebo building, with an average consumption of 4365 kWh.
In order to determine the percentage dedicated to air conditioning in the selected building, Scheme 6 shows the periods (in months) during which the measurements of the first phase of the study were registered.
It can be seen that the average monthly consumption of the building is 373 kWh/month. The period from February to June inclusive was not included in the calculation of this consumption due to the ceasing of working activity due to COVID-19, which meant that the consumption considerably decreased until activity was renewed in July 2020.
This building’s electricity consumption reached its highest values in the months of July and August, with a peak of 454 kWh in the latter month, as shown in Scheme 5. This is because it is the hottest period of the year (summer) in San José de Ocoa, as well as in the other provinces of the DR, which means the installed air conditioning must increase its workload. The building’s average daily consumption in this case was 12.42 kWh/day.

3.4. Building Model

In order to complete step B.1 of Figure 1, a view of the simulated building can be seen in Figure 5.

3.4.1. Calculation of the Heat Transfer

External factors such as solar radiation, exterior temperature, wind speed, and direction, among others, all influence the total heat gain that must be countered inside buildings. Such properties of the materials as the thermal conductivity and their emissivity, as well as the area and thickness of the materials themselves, also contribute to the increase in heat flow towards the indoors [36].
Due to the different layers of materials in a building (typical construction materials in the DR) and the fact that the heat flow must pass through all of them to reach the indoors, they all had to be taken into account when calculating the thermal resistances.
Figure 6 shows the layout of a typical façade of a building in the DR.
The results of the heat transfer calculations for the F. Mancebo building are shown in Scheme 7, Scheme 8 and Scheme 9. The data used for the calculation were obtained from the monitoring of the building using the temperature sensors placed inside and outside the building over the three-month period, with measurement intervals of 30 min.
Scheme 7 and Scheme 8 show that the front wall, oriented 258° to the southwest, and the righthand wall, oriented 177° to the south, increase the heat flow until approximately 12 noon. This is due to the orientation of the building in the DR with respect to the sun. In the same manner, the rear wall, oriented 93° to the east, has an increased heat flow during the morning hours.
The largest and most constant heat gain occurs through the front façade, in both walls and openings, reaching 0.58 kW of heat flow towards the indoors.
The results of the heat transfer by radiation in the building are shown in Scheme 10, Scheme 11 and Scheme 12 concerning the heat flow by radiation through the different façades within the range of hours of activity from 8:00 to 17:00.
Scheme 7, Scheme 8 and Scheme 9 for conduction plus convection and Scheme 10, Scheme 11 and Scheme 12 for radiation show that the most critical points for heat transfer in all three methods are those of the wall on the right hand side, with the peaks reaching 0.86 kW for conduction plus convection and 1.85 kW for radiation, without taking into account the fact that this is the façade that is exposed to the sun for the longest time. It can also be seen that the front façade reaches 0.58 kW for conduction plus convection and 0.89 kW for radiation during the last few working hours of the day.
The graphics show the differences between the heat flows, through both the walls and the openings. It can be seen that the latter have the greatest impact, not only due to the materials and their properties, but also due to the incident radiation coming through them to the indoor of the building, reaching the various surfaces inside, and this suggests an increase in the temperature and more workload for the air conditioning.
As for the orientation, Scheme 8 and Scheme 11 show that at around 14:00, in the side window closest to the front façade, the sun shines directly on it, while, in the results of the front façade, shown in Scheme 7 and Scheme 10, from 15:00 onwards, the sun directly impacts a greater area of the window of the façade, giving rise to heat gains in the building.
The said heat transfer as a whole, together with the internal loads produced in the building, creates an increased sense of discomfort, which does not allow the labor activities to be performed optimally. Furthermore, it also means a greater workload for the air conditioning units installed, which also means a greater energy cost from their use.

3.4.2. Energy Percentage Dedicated to Air conditioning

To obtain the percentage of energy dedicated to air conditioning in the building under study, the average daily value of consumption (12.42 kWh/day) was taken and compared with the values registered by the data logger during the monitoring period of 225 days. The average total consumption of electric energy by the air conditioning units was 3.81 kWh/day; the equivalent of 30.2% of the total average daily consumption, i.e., almost a third of the cost of electric energy was dedicated to the air conditioning.
It should be stressed that the monitoring period did not include the months when the building’s total consumption is usually highest, due to the COVID-19 pandemic situation.

3.4.3. Comparison: Building-Type Simulation vs. Monitoring Data

According to step B.2 of Figure 1 and in order to validate the effectiveness of the strategies before implementing them, the simulation software DesignBuilder was used. However, before that, it was necessary to simulate the building’s current situation to ensure that the margin of error would be the minimum, and to obtain an adjusted building. In various different studies [23,39,40,41], the utility of using DesignBuilder (DB) to simulate the annual energy consumption of an office building has been demonstrated, providing results that coincide with the monthly billing registers of electricity consumption; the largest error was 1.6%, which means that the software is reliable.
For this study, the first step was to construct the F. Mancebo building in DesignBuilder in accordance with the real measurements taken in situ, taking into account the structures both above and to the left of the part of the building under study (adiabatically), as well as the wall to the right. The model is shown in Figure 5.
To ensure that the solar gains, heat flow, and other variables are similar to the real ones, the construction materials of the building were selected from the DB library, giving the walls, windows, and doors their respective values, such as the number of layers, thickness, thermal conductivity, internal energy, specific heat, density, emissivity, and others.
After the model of the building was created in the DB simulation software, certain parameters were adjusted to equalize the simulated and monitored consumption. The following actions were taken to do so.
The archives of the EPW climate data of the DB program were modified using the monitoring from the selected province. The specific days in which real time measurements were taken were then modified in the climate archive. These data were temperature; relative humidity; wind speed and direction; direct, diffuse, and reflected radiation; and dew point temperature, among others. These data were selected to equalize the climatic conditions of the model with those of the province of San José de Ocoa. The following geographical values were also adjusted: latitude, longitude, height above sea level, and data such as wind speed and direction taken from the NSRDB Data Viewer Database [33], as well as the orientation of the building.
Finally, the days and hours that the air conditioning was working were also adjusted.
After all these steps were carried out, the heat flow through different surfaces of the selected building was simulated, together with the energy consumption of the air conditioning, comparing them and obtaining the results shown in Scheme 13, Scheme 14 and Scheme 15:
It is clear that the data obtained from the simulation are fairly close to the calculations from the data obtained in the first stage of monitoring.
It also can be seen that the model correctly predicts the behavior of the building in all cases giving robustness to the model.
It can be seen that the front window and the side window closest to the front wall are the openings with the greatest impact from the sun, as shown in the previous analysis. These results should be taken into account when choosing the EESs.
As for the comparison of the electricity consumption of the air conditioning, Scheme 16 shows the simulated vs. calculated (monitored) energy consumption of the existing air conditioning units (A/C).
As a consequence of step B.3 in Figure 1, the simulated vs. monitoring values shown in Scheme 16 demonstrate that the behavior of the building regarding energy consumption is also well-predicted by the model, in terms of both the value and trends.
In the time period of 12:00 to 14:00, the air conditioning is switched off, as there is no one working between these hours, thus explaining the dip in the graph at this time.
Eight similar studies were carried out for eight representative buildings, and the results were similar to those presented so far. Hence, the validation of the models is satisfactory.

3.4.4. Energy Efficiency Strategies (EESs)

Regarding step C.1 of Figure 1, there are various strategies for improving energy efficiency that include both those that affect the building envelope and those that affect the installed energy system. Table 6 shows some of the strategies that could be considered and that affect the building envelope, and Table 6 shows the alternatives for the replacement of air conditioning systems.
In order to easily identify each measure in this article, each EES has been identified with a capital letter.
The degree of intrusion measures is on a scale of 1 to 5, where 1 represents the least intrusion and 5 the greatest.
The implementation time, measured in months, indicates the estimated time of affectation of the building when an EES is being implemented.
The unit cost is expressed in US dollars per m2 affected.
The indicator index of availability in DR has also been included, which is on a scale of 1 to 10, where 1 represents the minimum accessibility to a certain product in the DR and 10 represents the maximum. This index measures the availability of the product in the construction market in the DR.
Similarly, Table 7 shows relevant data on different types of air conditioning installations.
In this work, following the criteria stated in Section 3.3, the selected EESs are collected in Table 8.
The selected strategies represent a total cost of USD 208.47, which represents a reasonable investment for the monthly cost of the energy consumption of the building’s air conditioning system, which is around USD 57.87 per month.
For the selection of the awning, the Analytic Hierarchy Process (AHP-TOPSIS) was used to compare the types of material and thus determine the best alternative. To do so, several manufacturers in the DR were contacted. The results are summarized in Table 9, showing the criteria used in the selection.
To remain consistent with the criteria for the selection of the energy efficiency strategies, higher priority was given to the cost once the physical properties fit those required in the selected location, San José de Ocoa.
As a consequence of the development of the selection method, the canvas awning manufactured by provider 1 was elected and installed, as its thermal properties favor the desired heat flow reduction, and the price is reasonable.
The selection of microperforated vinyl was made based on the data consulted in two companies, as shown in Table 10.
The choice was made based on the durability of the material and the option of maintaining the view from the indoor of the building to its exterior. The microperforated vinyl of the company provider 5 complies with the conditions of 6 years of useful life, with a thermal conductivity of 0.25 W/mK and an emissivity of 0.94.
Modeling of the building was carried out with design Software SketchUp in order to show the selected energy efficiency strategies, the microperforated blind and the canvas awning. The result is shown in Figure 7 and Figure 8.
Figure 7 shows the building modeled in SketchUp, where the elements to be introduced were designed.
Figure 8 shows the simulation in SketchUp indicating the added elements with the yellow box and Figure 9 shows the elements introduced in situ, a microperforated blind in the front window and an awning for the lateral window.
The logo of the enterprise for the blind was taken into account, thus maintaining the design of the front façade and reducing the intrusion level.

4. Results

4.1. Effectiveness of EEs in the Different Climatic Zones

In order to perform steps C.2 and C.3 shown in Figure 1, an analysis of the effectiveness of the selected EESs in each of the eight selected buildings was carried out. Table 11 shows data regarding the energy consumption before and after the implementation of the EESs within forecast energy consumption reduction for each climatic zone.
It can be seen that the implemented EESs are more effective in climatic zones A, B, and C, while in D, E, and G the effectiveness is more reduced, and in climatic zones F and H, the effectiveness drops down considerably.
The different impacts of the selected EESs also depend on the topology of the building and on the proportion between opaque and transparent surfaces in south-oriented facades so this result must be considered prudently.
In order to avoid these uncertainties, the selected F. Mancebo building was simulated in the eight different climatic zones twice, before and after the implementation of the EESs. Table 12 shows the results of these simulations.
It can see that the influence of the climatic zone on the effectiveness of the selected EESs is significant, going from the highest one in climatic zone H, 49%, to the lowest, 22%, in climatic zone F. Climatic zones A, F, and H are closer to the equator, so during the whole year, the thermal gain due to solar radiation for these zones is higher.
The result of the application of steps C.4 and C.5 depicted in Figure 1 can be seen in Scheme 17 and Scheme 18, where the daily electricity consumption can be seen in detail, and it is consequently remarkable that the lower the significative temperature of a climatic zone is the fastest when the set temperature is reached; see B line evolution.

4.2. Simulation of Energy Efficiency Strategies

As stated in the previous point, two different strategies were modeled, installed, and monitored. For the front window, a microperforated vinyl blind was chosen, and for the lateral window, an awning was installed to stop the direct impact of sunlight into the window.
In order to analyze the effect of each single strategy, they were each simulated separately with the software DesignBuilder, and the results are shown in Scheme 19, where the impact of strategy B is shown, and in Scheme 20, where the impact of strategy F is shown.
Scheme 19 shows that during daytime, and especially in the hours of the sun’s impact into the front window (15:00–17:00), there is an significant reduction in the heat flow. It can be observed that at the peak, around 16:30, the heat flow reduction changes from 0.49 kW to 0.28 kW (42.86%).
On the other hand, for the simulation of the awning in the lateral window, Scheme 20 shows that when strategy B is applied, a reduction in heat flow takes place during all daylight hours showing an average reduction of 77.61% in the heat flow with a peak of 81.11% (0.1 kW) at 15:00.

4.3. Building Monitoring after the Implementation of Energy Efficiency Strategies

Once the strategies were implemented, the building was once again monitored over a period of a year, but due to the pandemic situation, the building was out of service for four months, from March to June inclusive, so the monitoring data of those months were taken out of the analysis.
This analysis takes into consideration variables related to indoor comfort conditions such as inside temperature (see Scheme 21) and relative humidity (see Scheme 22), as well as the energy consumption due to the installation of the air conditioning, comparing the situations before and after (see Scheme 23). An additional graphic, Scheme 23, shows the accuracy between the simulated and monitored energy consumption.
Scheme 21 shows the evolution of inside temperature during a typical day before and after the implementation of energy efficiency strategies. It can be seen that, throughout the morning (between 09:30 and 12:00), the inside temperature remains steady at around 2 °C below the one registered previously. For the rest of the diurnal day (12:30 to 17:00), which is when the sunlight impacts the modified façades, the temperatures are kept mostly below the previous temperatures, with the difference reaching 1 °C below prior to the registrations.
Scheme 22 shows that the relative humidity values inside the modified building are slightly below the previous ones from 10:00 to 13:30 and slightly above the previous ones from 14:00 to 17:30.
Scheme 23 shows the consumption of electricity associated with the air conditioning unit before and after the implementation of energy efficiency strategies. A significant decrease can be seen in the energy consumption, with notable differences at 14:30, when a difference of 0.472 kWh was registered. Taking into account the registered measurements from before and after, the total energy consumption of the building decreased between approximately 16% and 24%.
The forecasted reduction in electrical consumption based on the correct control of the air conditioning equipment based on three scenarios in is presented Table 13.
Usually, under scenario 1, air conditioning units are switched on as soon as the first worker arrives to the building, 08:00 h, and remain on until lunch time, 12:00 h, when they are turned off (all workers have lunch at the same time), and they are turned back on again at 14:00 h; then, once again all A/C units are turned on, they remain on until the end of the working day, i.e., 17:00 h.
In order to analyze the importance of the workers’ habits regarding the use of A/C units on the energy efficiency of the building, another two scenarios were implemented and compared with scenario 1. In scenario 2, A/C units are switched on from 07:00 to 17:00, and in scenario 3, units are switched on from 07:00 to 12:00 and from 14:00 to 17:00.
These results show that a good EES switches on the A/C units one hour before the start of the working day, when the indoor temperature is not yet very high, but the units should be turned off during the lunch time.

4.4. Model Validation through Monitored Data

Monitored data were used also to validate the model once again. Scheme 24 shows the accuracy between modeled and monitored energy consumption. The model predicts properly the behavior of the building and the tendencies throughout a working typical day.
In addition, Scheme 25 shows the accuracy between simulated vs. monitored inside temperatures of the building.

4.5. Economic Considerations about Strategies’ Implementation

There are many different EESs that can be used in order to reduce energy consumption. Jia [13] proposed changing air conditioning units for others with better COP in an office building in Hong Kong. Alireza et al. [14] changed the facades of an office building situated in Teheran with improved construction materials. Fathalian et al. [23] suggested the energy retrofitting of opaque vertical enclosures in an office building in Semana (Iran). Finally, Xiaonuan et al. [42] changed both lighting and air conditioning systems in an office building sited Singapore.
In order to compare the different measurements used by different studies in different buildings and different countries, the saved percentage of energy and its unit cost (USD/%) are sown in Table 14.
It is shown the largest reduction in energy consumption corresponds to the building situated in Teheran, but at the same time, it is the most expensive in terms of cost per % saved. On the other hand, the research carried out in this study has the lowest cost per % saved, and at the same time, it presents a relative good percentage of energy savings.
Taking into account the reduction values, it can be estimated that an investment return period for the amount of USD 208.47 with respect to the reduction was achieved with the application of the vinyl film on the front window and the canvas awning on the right-side window. The results are shown in Scheme 26, where it is evident that the investment return period is amortized at 1.75 years.

5. Conclusions

A methodology to help in making decisions related to the energy efficiency of buildings in tropical areas has been developed and proved in a case study in the Dominican Republic.
A new climatic zoning has also been proposed for the DR within the country’s tertiary building sector.
Eight buildings have been modeled, monitored, and validated, one in each climatic zone. The results show a close accuracy of the models in terms of the buildings’ behavior, giving robustness to the methodology.
A criterion for the election of EESs was applied, and selected EESs were implemented in a representative building of the tropical climate of the Dominican Republic, with the simulation and then implementation of the EESs accuracy between the model and the buildings’ behavior after EESs implementation were demonstrated.
A reduction in the energy consumption of a building was reached through the implementation of low-cost, available, and non-intrusive EESs, which demonstrates that with the implementation of economic EESs, the electrical bill of the tertiary sector’s buildings can be reduced in tropical climates.
It can be inferred from obtained data that the specific energy consumption (kWh/m2) of the whole building in this case study was reduced from 47.08 kWh/m2 to 29.46 kWh/m2.
It is also remarkable that the yearly cost of electricity per square meter before the implementation of EESs was 2788.91 USD/(year·m2), compared to only 1709.01 USD/(year·m2) after the implementation.
This methodology could be a complementary tool in order to assess the effectiveness of certain measurements before their implementation when a specific code is used for the evaluation of the building.
This study is focused on reducing the energy consumption of air conditioning equipment by the improvement in the building envelope according to the climate in which it is found; therefore, this study can be a complementary tool to evaluate the energy indicator when a labeling system needs to be implemented.
This study also shows that public servants and politicians living in tropical areas have a scientific methodology to improve energy efficiency in buildings.
As this research has shown this method to be effective in reducing energy consumption, further studies should lead to more ambitious objectives. For example, in-depth assessment should be conducted of possible EESs to be massively implemented in new buildings in the office buildings sector, considering the context of the country. Furthermore, this kind of study could be applied to residential sector, which has different constraints from the present one.

Author Contributions

Conceptualization, J.M.F.B. and R.P.; Data curation, R.P. and D.S.; Formal analysis, J.M.F.B. and L.A.d.P.-V.; Research, J.M.F.B., L.A.d.P.-V., R.P. and D.S.; Methodology, J.M.F.B.; Project Management, J.M.F.B.; Resources, L.A.d.P.-V.; Software, J.M.F.B. and R.P.; Supervision, L.A.d.P.-V.; Validation, J.M.F.B. and D.S.; Visualization, J.M.F.B.; Writing – original draft, J.M.F.B.; Writing—review and editing, J.M.F.B. and L.A.d.P.-V. All authors have read and agreed to the published version of the manuscript.

Funding

This research received no external funding.

Informed Consent Statement

Informed consent was obtained from all subjects involved in the study.

Data Availability Statement

The link of previously published studies is sent: https://www.mdpi.com/1996-1073/13/14/3731/htm, accessed on 11 April 2022.

Conflicts of Interest

The authors declare no conflict of interest.

References

  1. De Buen, R.O. Diagnóstico y Definición de Líneas Estratégicas Sobre el Uso Racional de Energía (ure) en República Dominicana. 2015. Available online: https://www.cne.gob.do/wp-content/uploads/2015/11/AT-19-2006-Diagnostico-URE-Informe-Final.pdf (accessed on 7 January 2006).
  2. Opoku, R.; Edwin, I.A.; Agyarko, K.A. Energy efficiency and cost saving opportunities in public and commercial buildings in developing countries—The case of air-conditioners in Ghana. J. Clean. Prod. 2019, 230, 937–944. [Google Scholar] [CrossRef]
  3. Opoku, R.; Adjei, E.A.; Ahadzie, D.K.; Agyarko, K.A. Energy efficiency, solar energy and cost saving opportunities in public tertiary institutions in developing countries: The case of KNUST, Ghana. Alex. Eng. J. 2020, 59, 417–428. [Google Scholar] [CrossRef]
  4. Felix Benitez, J.M.; Pérez González, R.; Rondón Rosario, E.M. 4to. Informe_Encuesta Sobre Eficiencia Energética en aa y Estudio de Eficiencia aa. 4to; Tipe -Report; Membership- Directorate of Scientific Research Management, East Central University (UCE): San Pedro de Macorís, Dominican Republic, 2019. [Google Scholar]
  5. Aman, J.; Ting, D.S.-K.; Henshaw, P. Residential solar air conditioning: Energy and exergy analyses of an ammonia–water absorption cooling system. Appl. Therm. Eng. 2014, 62, 424–432. [Google Scholar] [CrossRef] [Green Version]
  6. Minetto, S.; Rossetti, A.; Marinetti, S. Seasonal energy efficiency ratio for remote condensing units in commercial refrigeration systems. Int. J. Refrig. 2018, 85, 85–96. [Google Scholar] [CrossRef]
  7. Wang, Z.; Hong, T.; Piette, M.A. Data fusion in predicting internal heat gains for office buildings through a deep learning approach. Appl. Energy 2019, 240, 386–398. [Google Scholar] [CrossRef] [Green Version]
  8. Ahmed, K.; Kurnitski, J.; Olesen, B. Data for occupancy internal heat gain calculation in main building categories. Data Brief 2017, 15, 1030–1034. [Google Scholar] [CrossRef] [Green Version]
  9. Brouns, J.; Nassiopoulos, A.; Limam, K.; Bourquin, F. Heat source discrimination in buildings to reconstruct internal gains from temperature measurements. Energy Build. 2017, 135, 253–262. [Google Scholar] [CrossRef]
  10. Eguía Oller, P.; Alonso Rodríguez, J.M.; Saavedra González, Á.; Arce Fariña, E.; Granada Álvarez, E. Improving the calibration of building simulation with interpolated weather datasets. Renew. Energy 2018, 122, 608–618. [Google Scholar] [CrossRef]
  11. Feng, C.; Meng, Q.; Zhang, Y. Theoretical and experimental analysis of the energy balance of extensive green roofs. Energy Build 2010, 42, 959–965. [Google Scholar] [CrossRef]
  12. Félix-Benitez, J.M.; Peña-Suárez, J.N.; del Portillo-Valdés, L.A.; del Campo-Diáz, V.J. Reducción de la factura eléctrica del sector comercial en la República Dominicana mediante sistemas de climatización solar. In Proceedings of the CIBEM 2017-XIII Congresso Ibero-Americano de Engenharia Mecânica CIBIM 2017-XIII Congreso Iberoamericano de Ingeniería Mecánica, Lisboa, Portugal, 23–26 October 2017. [Google Scholar]
  13. Jia, J.; Lee, W.L. The rising energy efficiency of office buildings in Hong Kong. Energy Build. 2018, 166, 296–304. [Google Scholar] [CrossRef]
  14. Pirmohamadi, A.; Dastjerdi, S.M.; Ziapour, B.M.; Ahmadi, P.; Rosen, M.A. Integrated solar thermal systems in smart optimized zero energy buildings: Energy, environment and economic assessments. Sustain. Energy Technol. Assess. 2021, 48, 101580. [Google Scholar] [CrossRef]
  15. Yao, J. Modelling and simulating occupant behaviour on air conditioning in residential buildings. Energy Build. 2018, 175, 1–10. [Google Scholar] [CrossRef]
  16. Yao, J. Energy optimization of building design for different housing units in apartment buildings. Appl. Energy 2012, 94, 330–337. [Google Scholar] [CrossRef]
  17. Yao, J. Determining the energy performance of manually controlled solar shades: A stochastic model based co-simulation analysis. Appl. Energy 2014, 127, 64–80. [Google Scholar] [CrossRef]
  18. Yan, C.; Yao, J. Effects on residential buildings from roof in hot summer and cold winter zones. Ind. Constr. 2008, 3. [Google Scholar]
  19. Pedrini, A.; Westphal, F.S.; Lamberts, R. A methodology for building energy modelling and calibration in warm climates. Build. Environ. 2002, 37, 903–912. [Google Scholar] [CrossRef] [Green Version]
  20. Erkoreka, A.; Garcia, E.; Martin, K.; Teres-Zubiaga, J.; Del Portillo, L. In-use office building energy characterization through basic monitoring and modelling. Energy Build. 2016, 119, 256–266. [Google Scholar] [CrossRef]
  21. Mosciatti Jofré, L.A. Análisis Comparativo y Aplicabilidad sobre el Consumo y Demanda de Energía para Edificios de Distintas Certificaciones de Construcción Sustentable en Chile. 2016. Available online: https://repositorio.uchile.cl/handle/2250/143469 (accessed on 7 January 2016).
  22. Ordoñez Garcia, A. Manual de Ayuda Designbuilder en Español, 5th ed.; Sol-Arq: Plano, TX, USA, 2017; Available online: https://www.scribd.com/document/420983264/Manual-Design-Builder-Espanol-2017-03-03-Unlocked (accessed on 7 January 2017).
  23. Fathalian, A.; Kargarsharifabad, H. Actual validation of energy simulation and investigation of energy management strategies (Case Study: An office building in Semnan, Iran). Case Stud. Therm. Eng. 2018, 12, 510–516. [Google Scholar] [CrossRef]
  24. Peña Suárez, J.N.; Del Campo Díaz, V.J.; Del Portillo Valdés, L.A.; Félix Benitez, J.M. Caracterización Climática de la República Dominicana: Limitación de la Demanda Energética en la Edificación. 2017. Available online: https://addi.ehu.es/handle/10810/50328?locale-attribute=es (accessed on 7 January 2020).
  25. Felix, J.; Del Portillo, L.; Izquierdo, R. Análisis comparativo de las diferentes zonas climáticas de la República Dominicana. In Proceedings of the 1st Iberic Conference on Theoretical and Experimental Mechanics and Materials/11th National Congress on Experimental Mechanics, Porto, Portugal, 4–7 November 2018; Universidad del País Vasco: Bilbao, España, 2018. [Google Scholar]
  26. Peña Suárez, J.N.; del Campo Díaz, V.J. Degree-days in a Caribbean and tropical country: The Dominican Republic’s case. Int. J. Ambient. Energy 2021, 42, 795–800. [Google Scholar] [CrossRef]
  27. Aziz, A.A.; Sumiyoshi, D.; Akashi, Y. Low cost humidity controlled air-conditioning system for building energy savings in tropical climate. J. Build. Eng. 2017, 11, 9–16. [Google Scholar] [CrossRef]
  28. Liddle, B.; Loi, T.S.A.; Owen, A.D.; Tao, J. Evaluating consumption and cost savings from new air-conditioner purchases: The case of Singapore. Energy Policy 2020, 145, 111722. [Google Scholar] [CrossRef]
  29. Peña Suárez, J.N. Caracterización Climática, Confort Térmico y Reducción de la Demanda Energética en Viviendas de Tipologia Mayoritaria de la República Dominicana Mediante Paneles Constructivos más Sostenibles y Aprovechamiento de la Ventilación Natural a(TRUNCATED). Available online: https://addi.ehu.es/handle/10810/50328 (accessed on 7 January 2020).
  30. Felix Benitez, J.M.; del Portillo-Valdés, L.A.; del Campo Díaz, V.J.; Martín Escudero, K. Simulation and Thermo-Energy Analysis of Building Types in the Dominican Republic to Evaluate and Introduce Energy Efficiency in the Envelope. Energies 2020, 13, 3731. [Google Scholar] [CrossRef]
  31. Tactuk, P.; ONE. Informe General Registro Nacional de Establecimientos Volumen I 2014–2015. 2016. Available online: https://web.one.gob.do/publicaciones/2016/informe-general-registro-nacional-de-establecimientos-volumen-i-2014-2015/?Alttemplate=publicaciononline (accessed on 7 January 2016).
  32. Felix Benitez, J.M.; Pérez González, R.; Rondón Rosario, E.M. 2DO. Informe: Modelación y Validación de Edificios Tipo de la República Dominicana; Construcción en Designbuilder Edificios Tipo; East Central University (UCE): San Pedro de Macorís, Dominican Republic, 2019. [Google Scholar]
  33. The National Renewable Energy Laboratory (“NREL”). Visor de Datos NSRDB. Available online: https://maps.nrel.gov/nsrdb-viewer/?Al=0&bl=clight&ce=0&lr=0&mc=18.724787372567558%2C-68.47915649414061&zl=14. (accessed on 7 January 2020).
  34. Clima de la República Dominicana. Available online: http://www.jmarcano.com/mipais/geografia/clima/clima2.html (accessed on 7 January 2015).
  35. Luis Gedeón, R.P.; Jaume Avellaneda, M.B. Confort y Comportamiento Termico en Cerramientos con Materiales Naturales, Tecnica de construccion Tejamanil en República Dominicana. 2013. Available online: https://docplayer.es/30374098-Confort-y-comportamiento-termico-en-cerramientos-con-materiales-naturales-tecnica-de-construccion-tejamanil-en-republica-dominicana.html (accessed on 7 January 2013).
  36. Çengel, Y.A.; Ghajar, A.J. Transferencia de Calor y Masa, 4th ed.; Mcgraw-Hill/Interamericana Editores S.A. de C.V.: Mexico City, Mexico, 2011; p. 945. [Google Scholar]
  37. Easy Log EL-wifi-TH+. High Accuracy Wifi Temperature and Humidity Sensor. Available online: https://www.lascarelectronics.com/easylog-el-wifi-thplus (accessed on 7 January 2019).
  38. Dent Instruments. Registrador de Datos de Energía Portátil Elitepro XC™. Available online: https://www.directindustry.es/prod/dent-instruments/product-189622-1861716.html (accessed on 7 January 2021).
  39. Olmos Gormaz, D.V. Herramientas y Técnicas para la Predeterminación del Comportamiento Energético en la Arquitectura. Master’s Thesis, Universidad Politécnica de Cataluña, Barcelona, Spain, 2011. [Google Scholar]
  40. Eskin, N.; Türkmen, H. Analysis of annual heating and cooling energy requirements for office buildings in different climates in Turkey. Istanbul Technical University, Istanbul, Turkey. Energy Build. 2008, 40, 763–773. [Google Scholar] [CrossRef]
  41. Zomorodian, Z.S.; Tahsildoost, M.; Hafezi, M. Thermal comfort in educational buildings: A review article. Renew. Sustain. Energy Rev. 2016, 59, 895–906. [Google Scholar] [CrossRef]
  42. Sun, X.; Gou, Z.; Lau, S.S. Cost-effectiveness of active and passive design strategies for existing building retrofits in tropical climate: Case study of a zero energy building. J. Clean. Prod. 2018, 183, 35–45. [Google Scholar] [CrossRef]
Figure 1. Proposed methodology and detailed steeps for the evaluation of energy efficiency performance in tropical latitudes. Blocks (AC) describe the steps to follow for the analysis of the impact of the measures at region or country level.
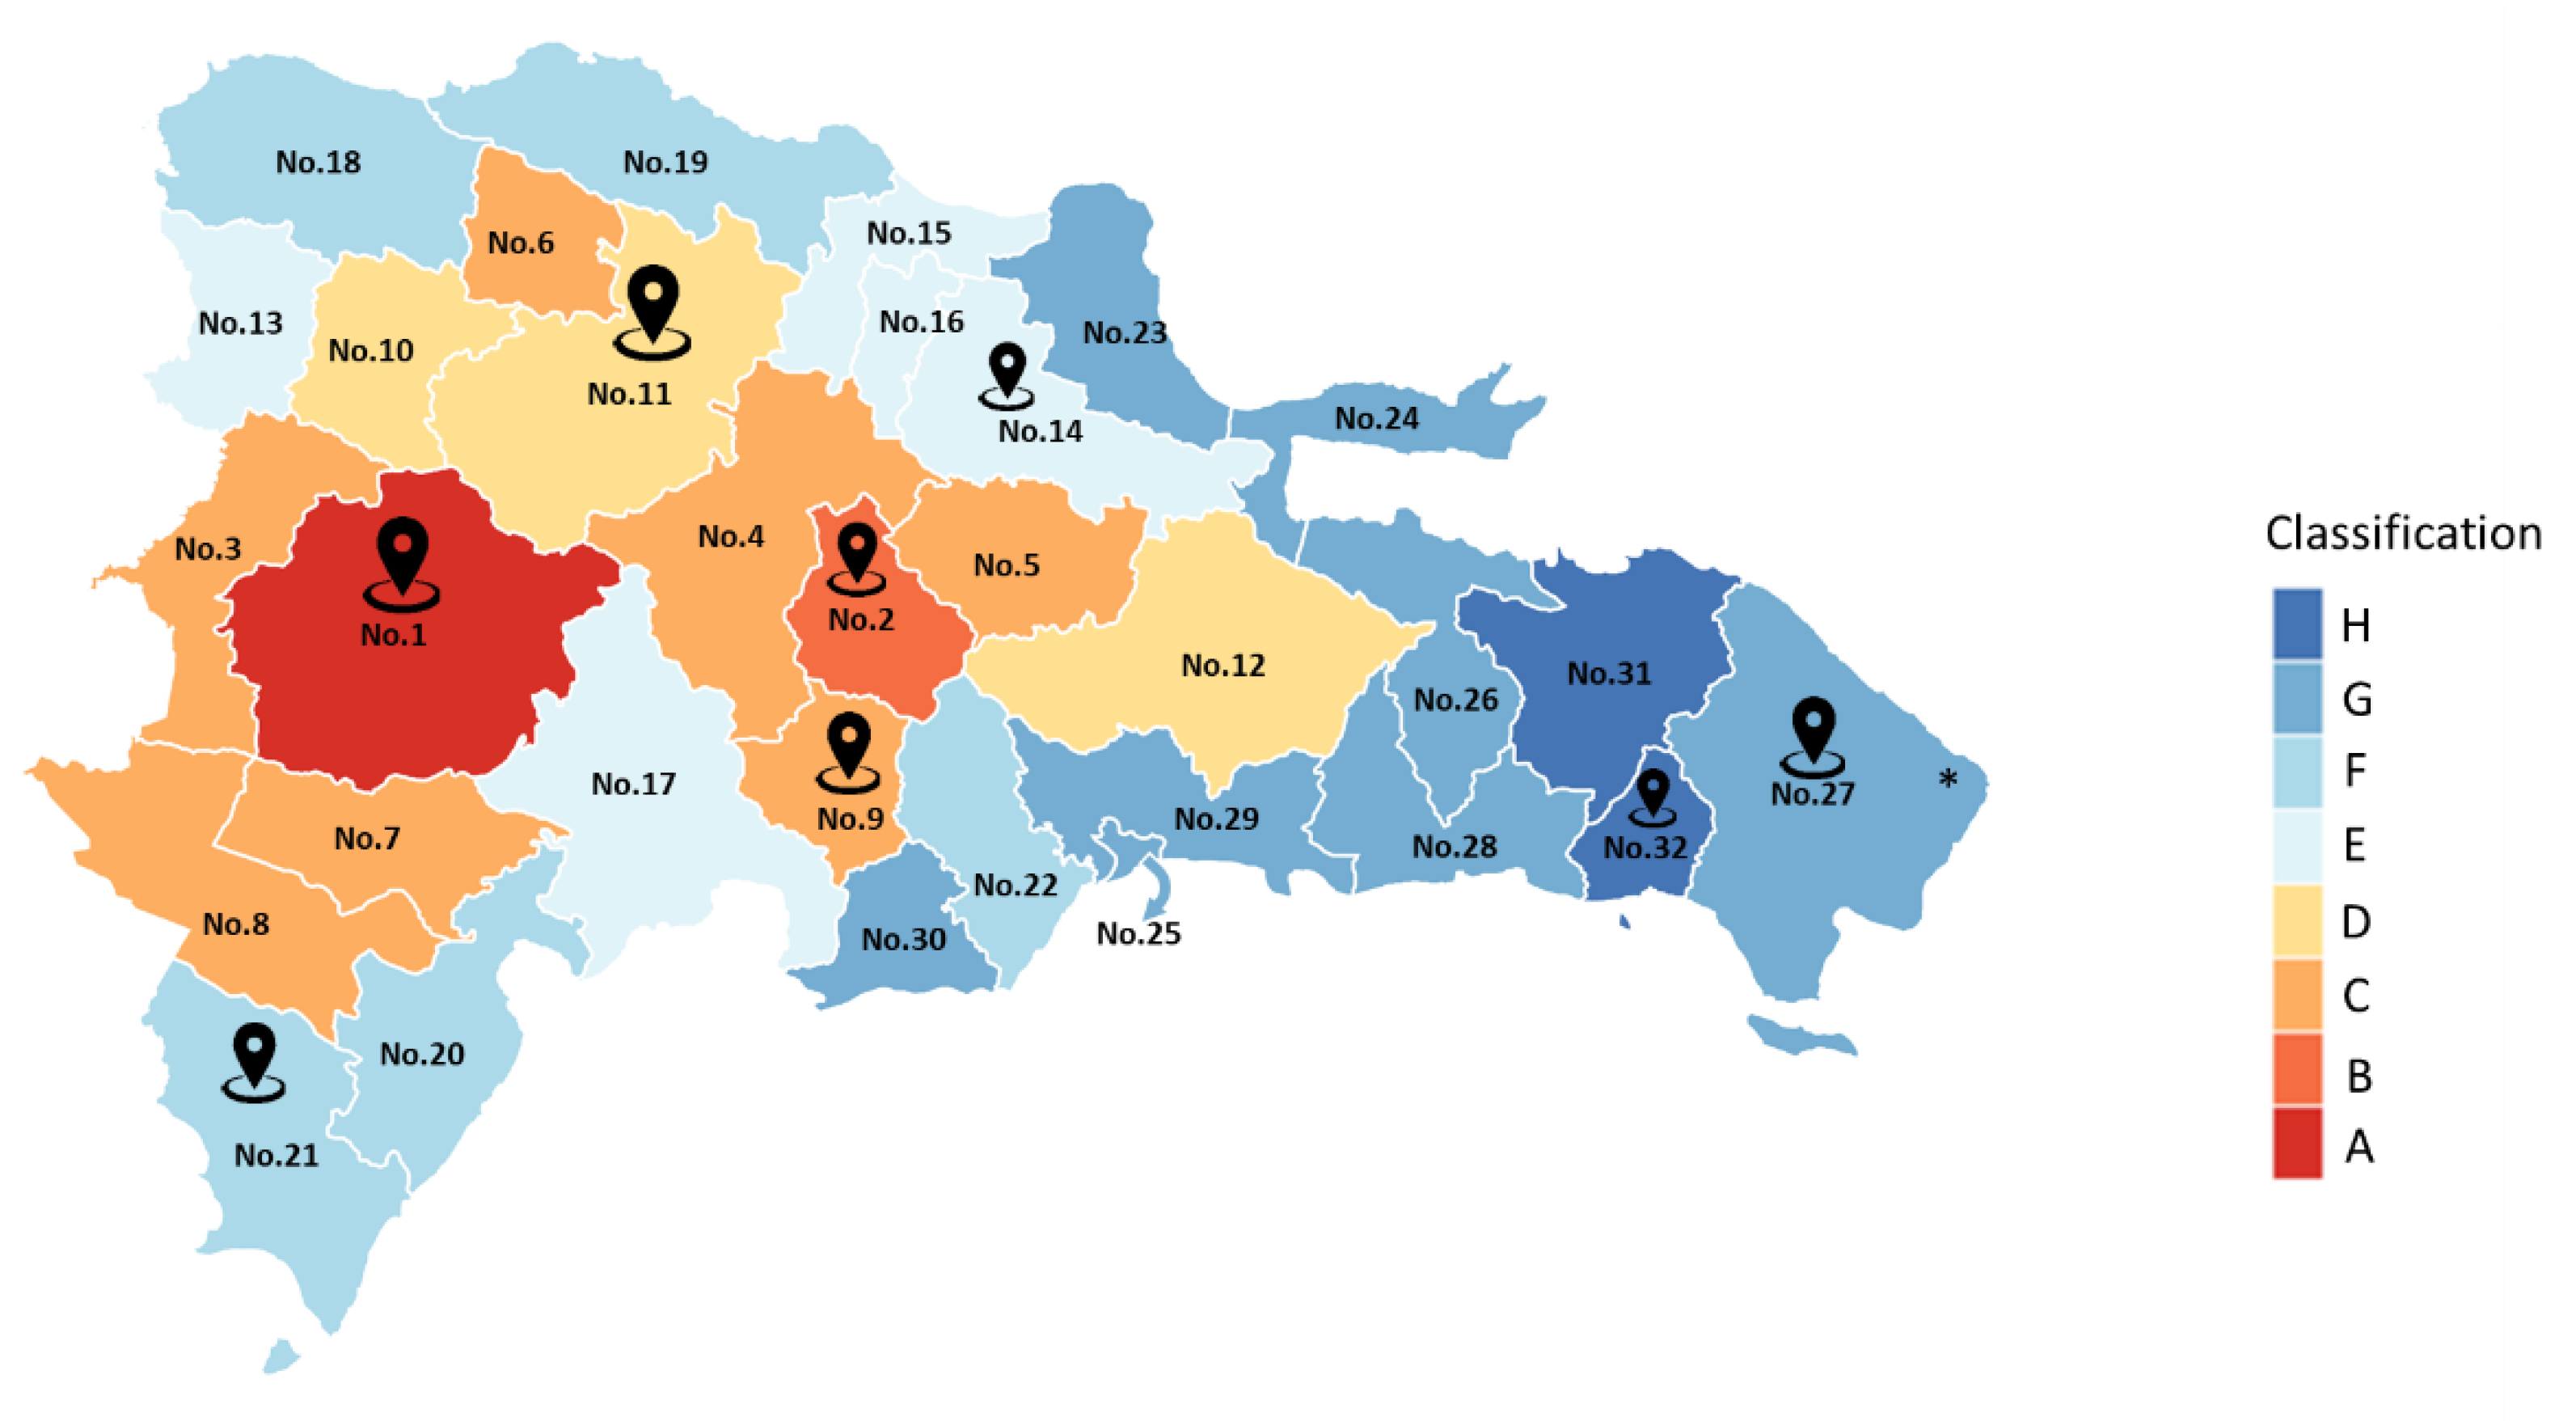
Energies 15 04715 g001
Figure 2. Climatic classification of the provinces according to the significant influence of climatic conditions.
Energies 15 04715 g002
Figure 3. Changed to: View of building types identified in the division of each climatic in Figure 2 (A–H) zone of the case under study in DR.
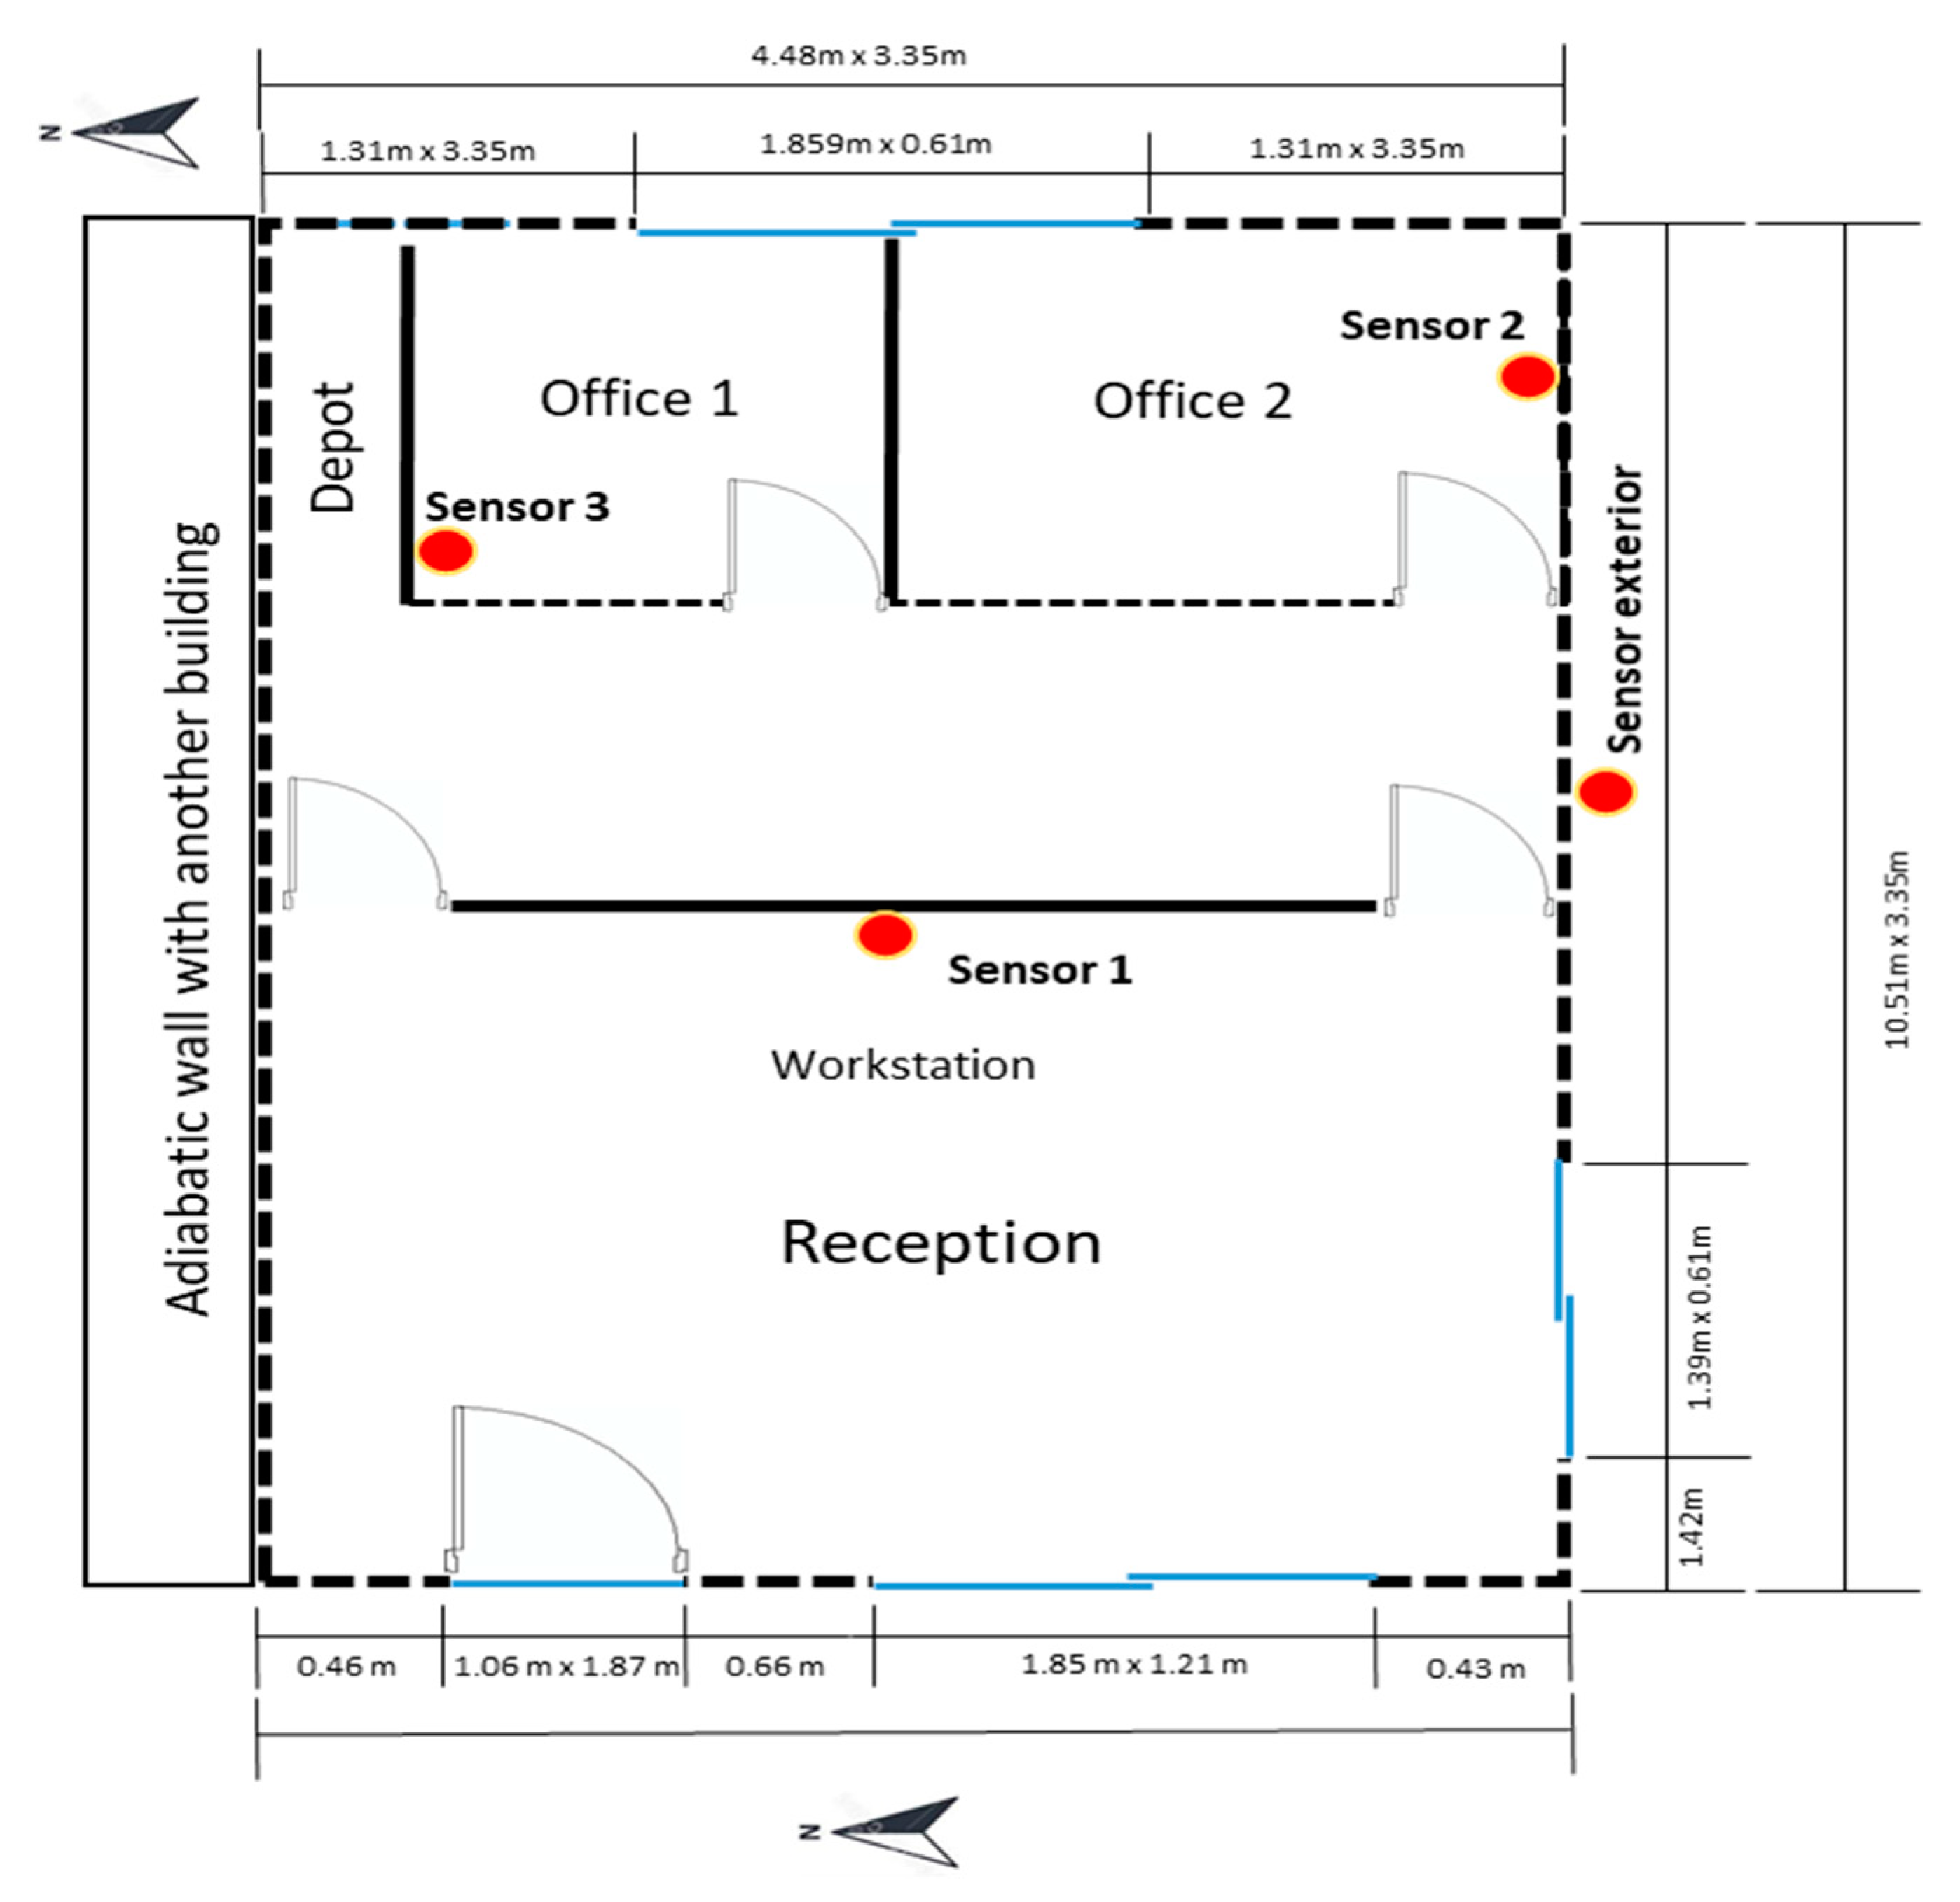
Energies 15 04715 g003
Figure 4. Plan view of the building within the air temperature and relative humidity sensors’ locations.
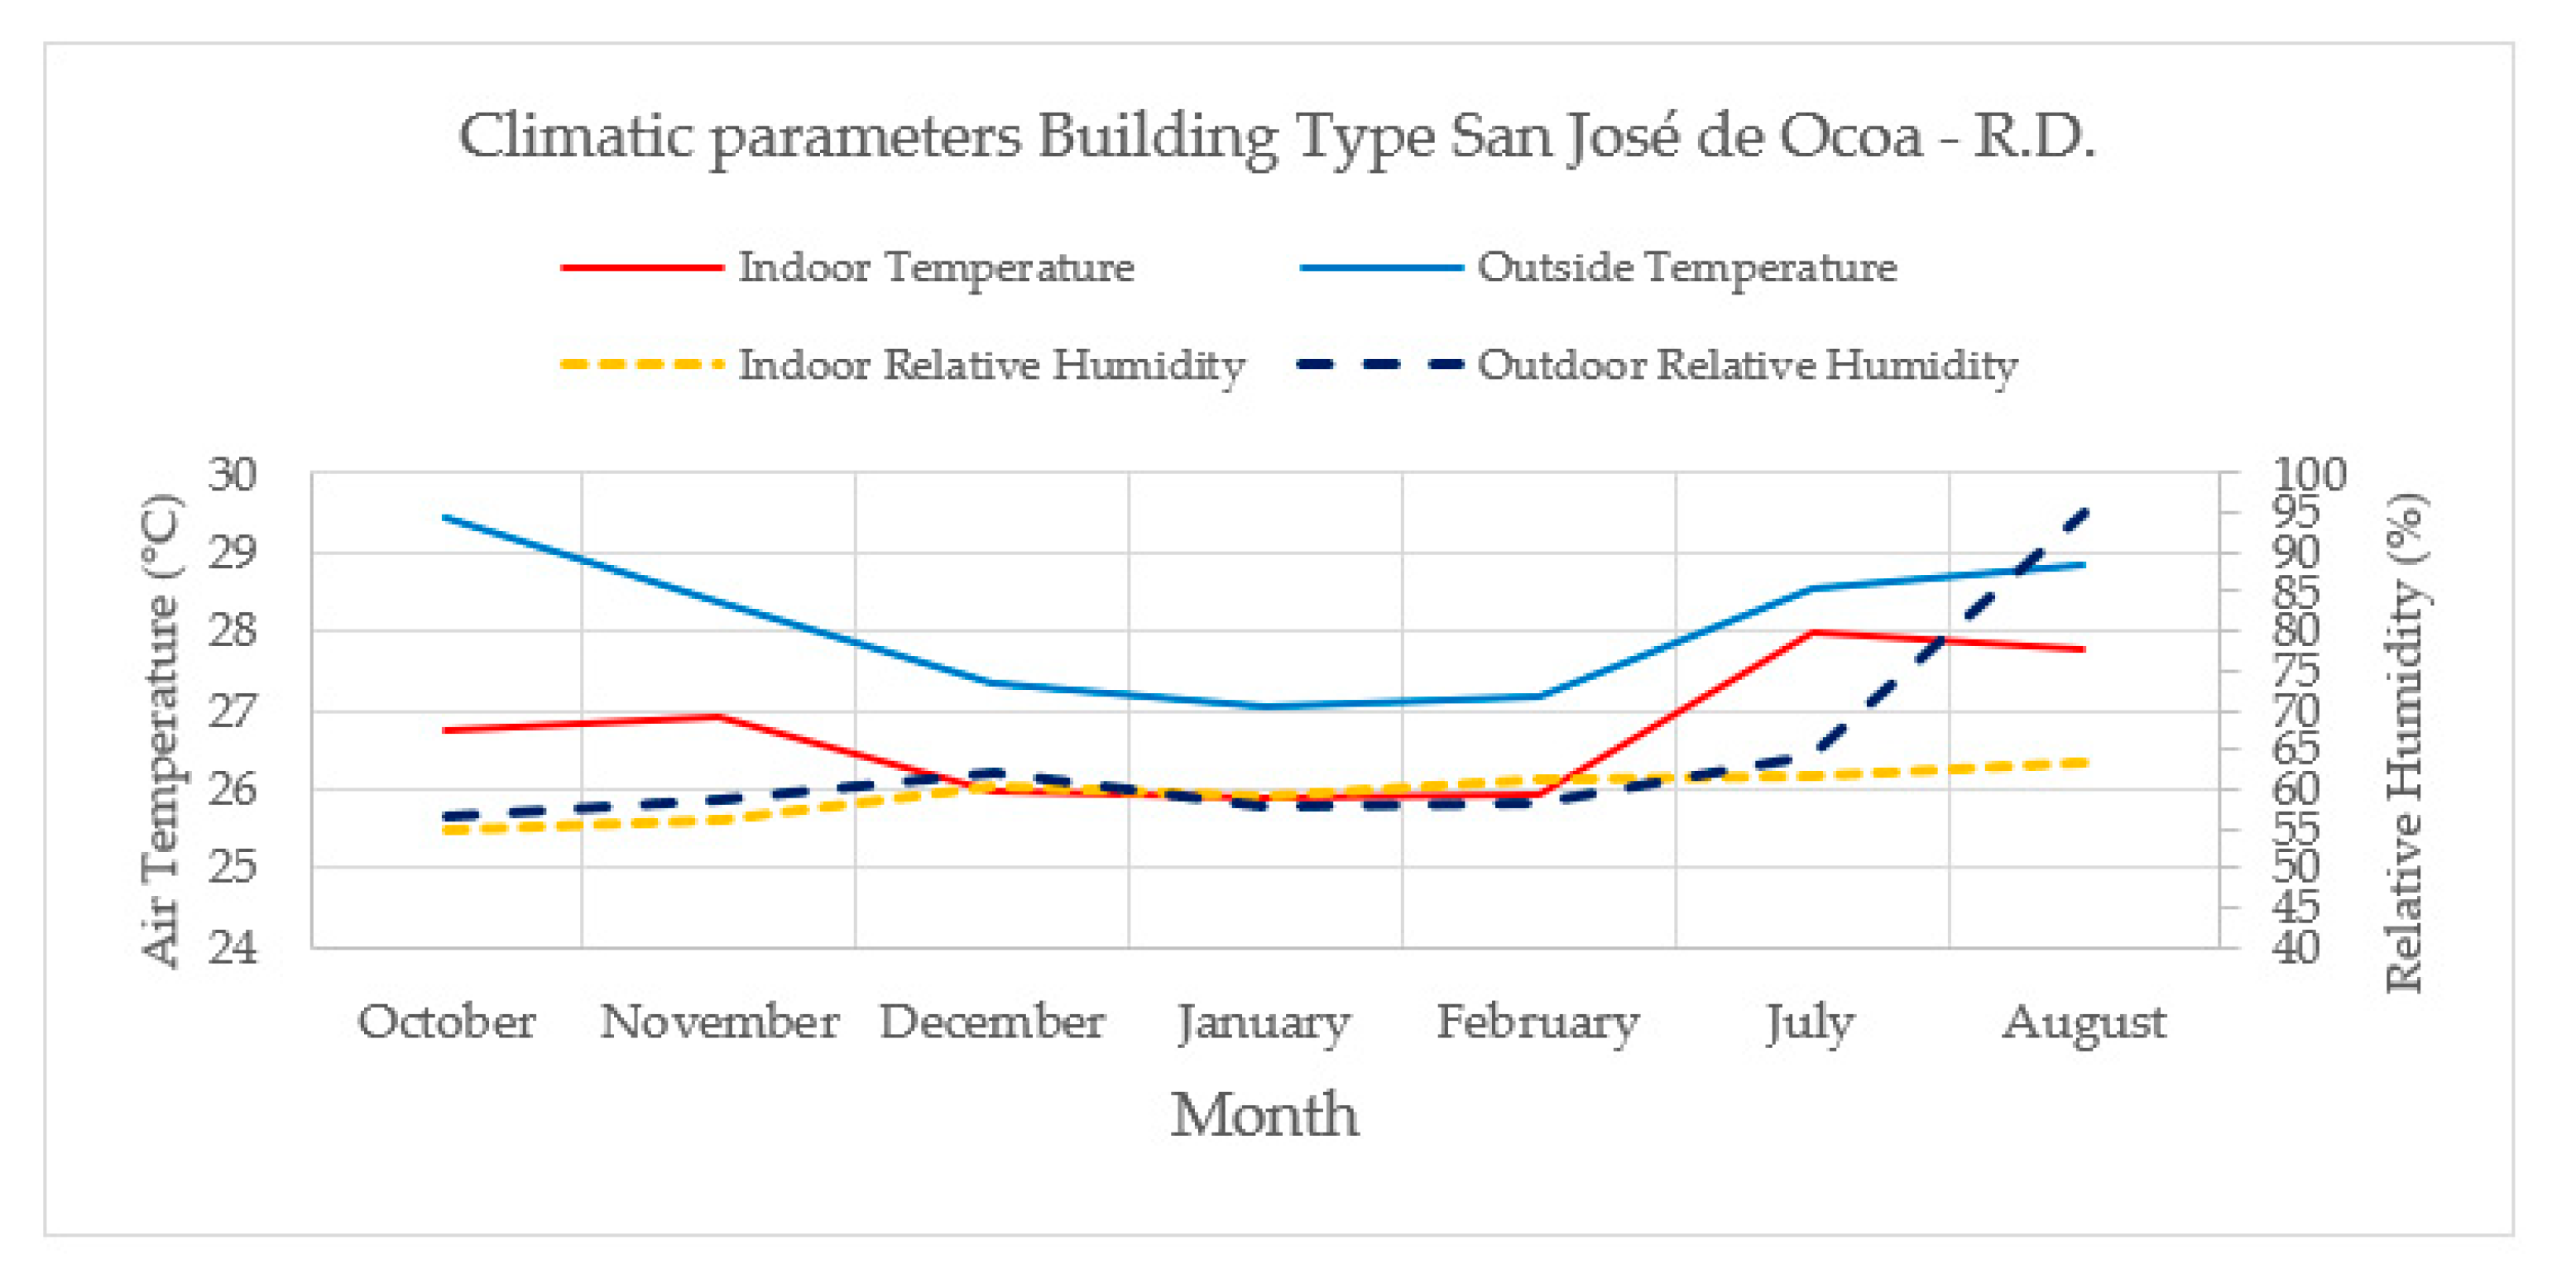
Energies 15 04715 g004
Scheme 1. Climatic parameters collected in the representative building during the monitoring period.
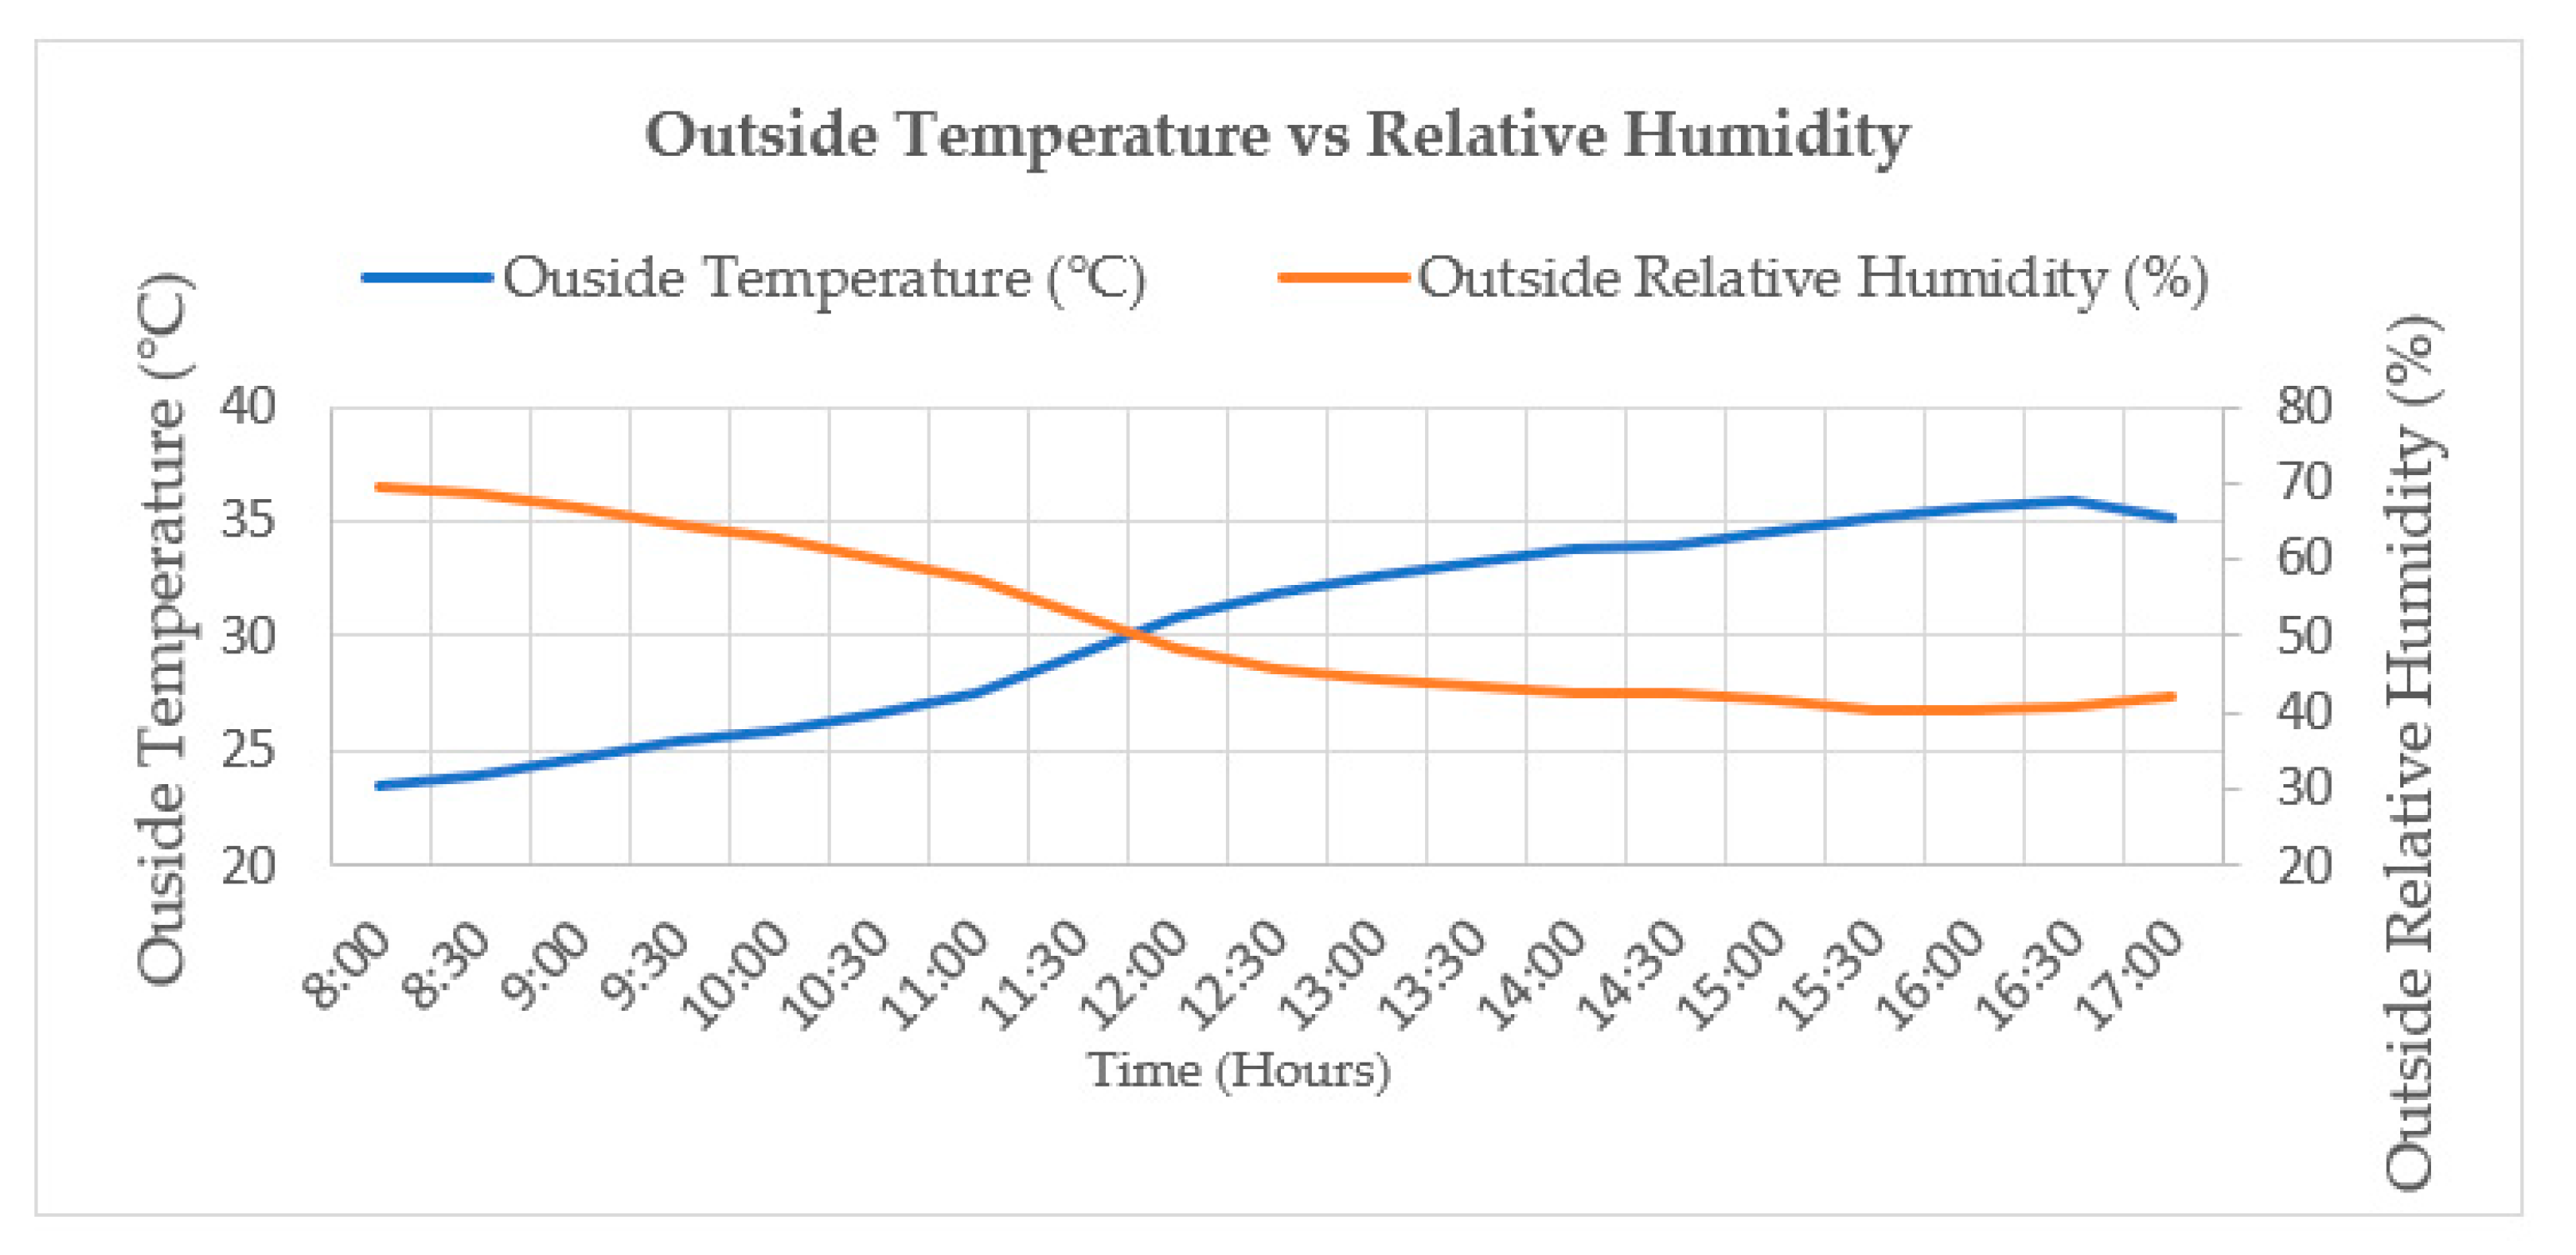
Energies 15 04715 sch001
Scheme 2. Data of outside temperature and relative humidity for the calculated typical day.
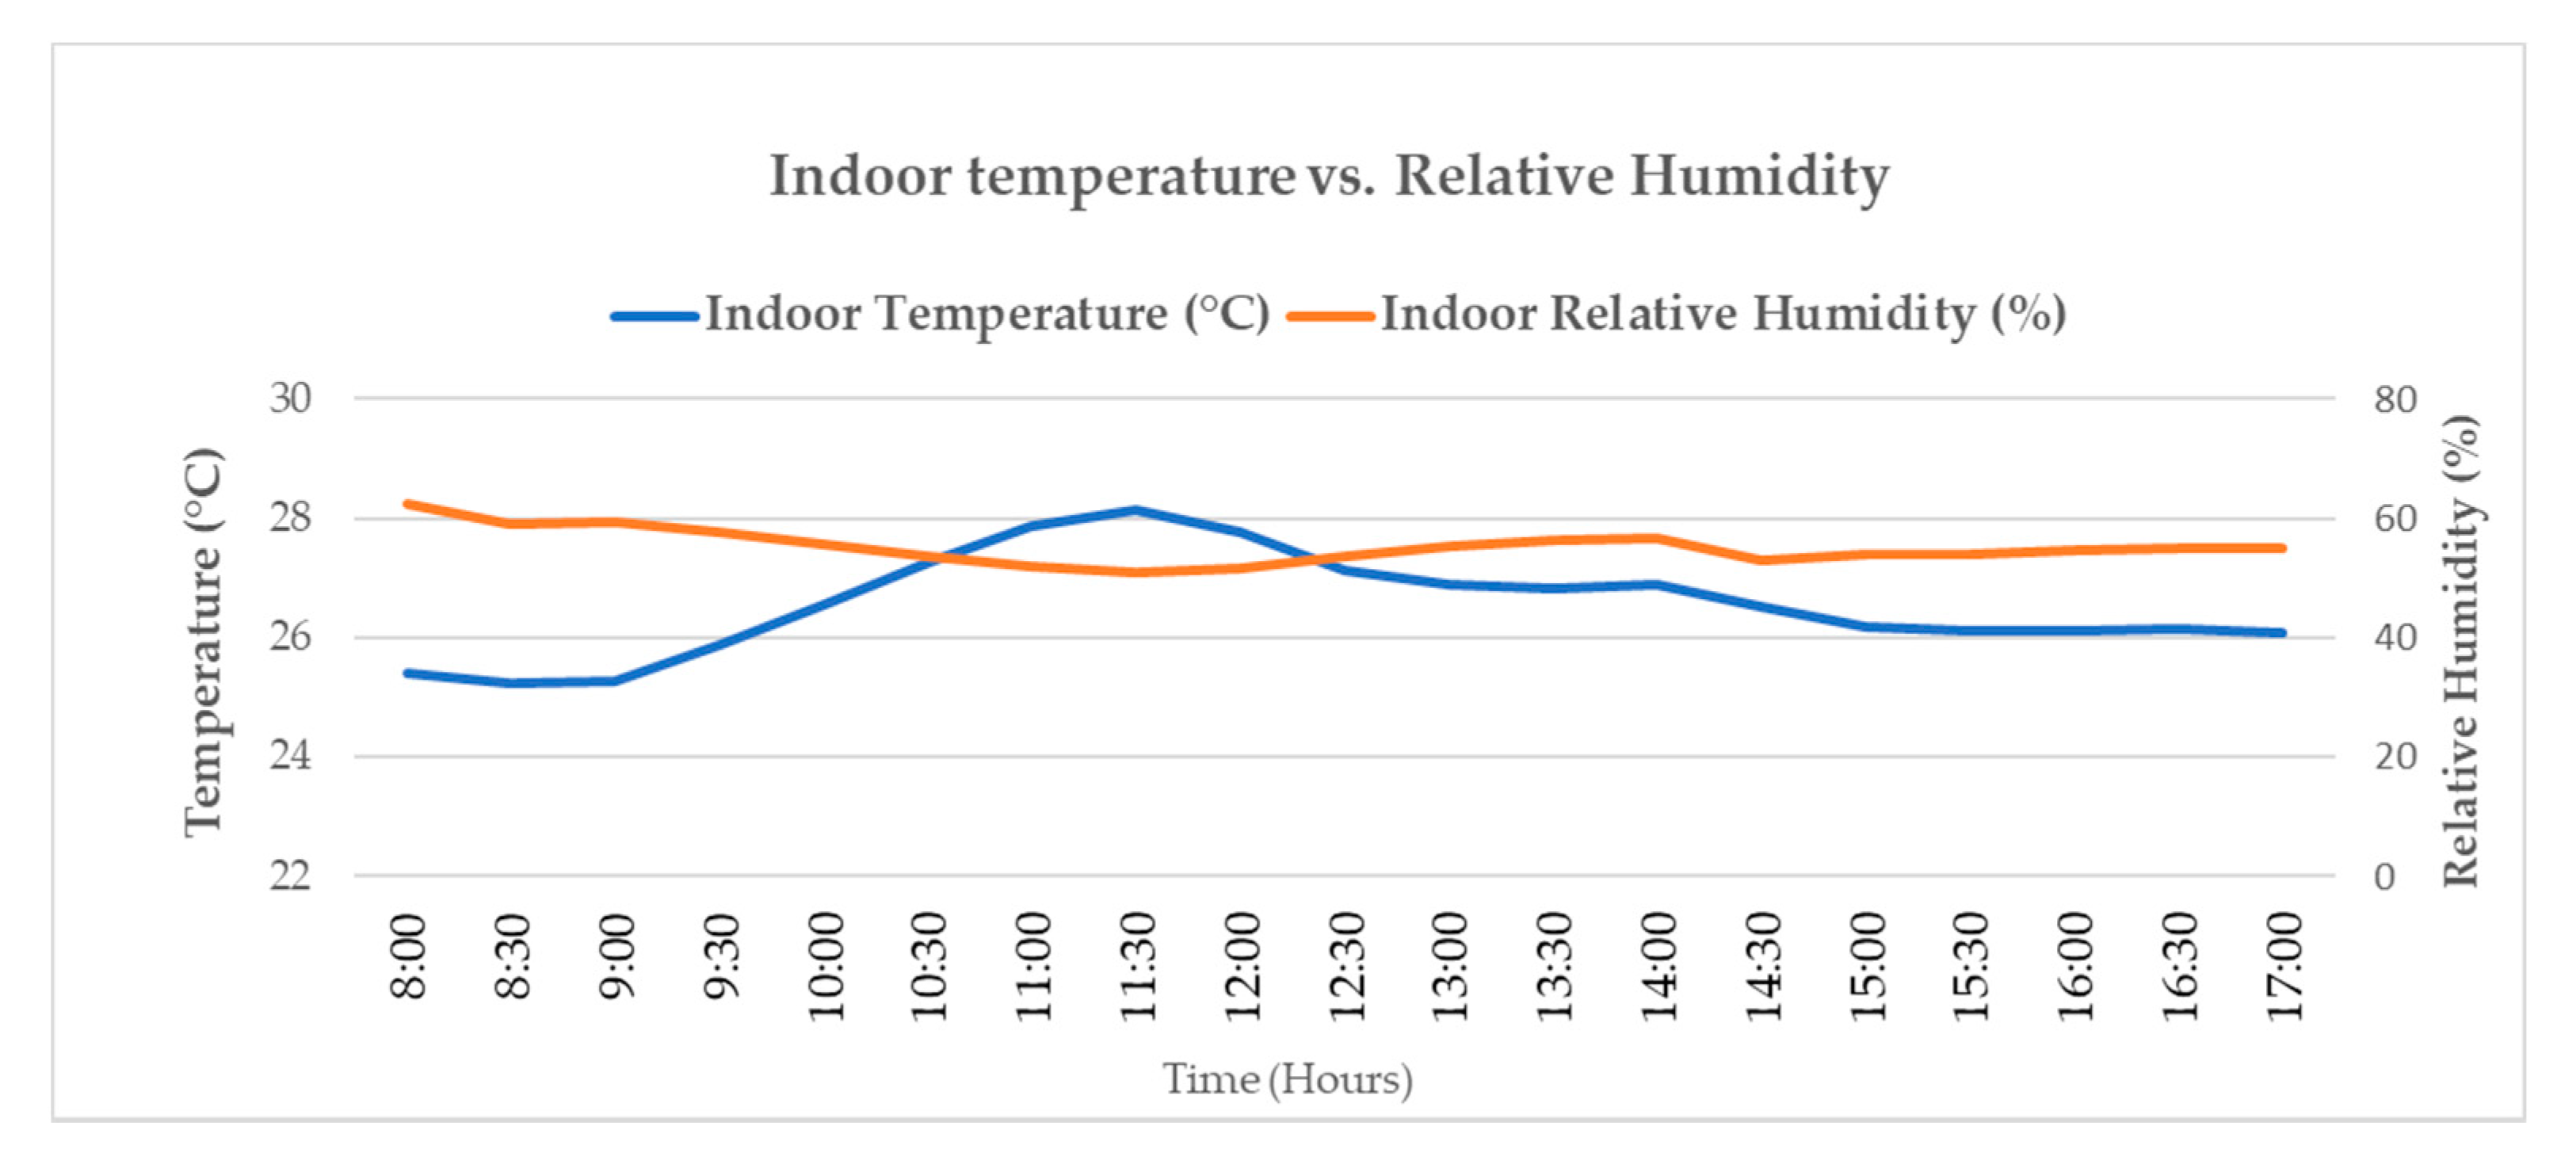
Energies 15 04715 sch002
Scheme 3. Data for indoor temperature and relative humidity for the calculated typical day.
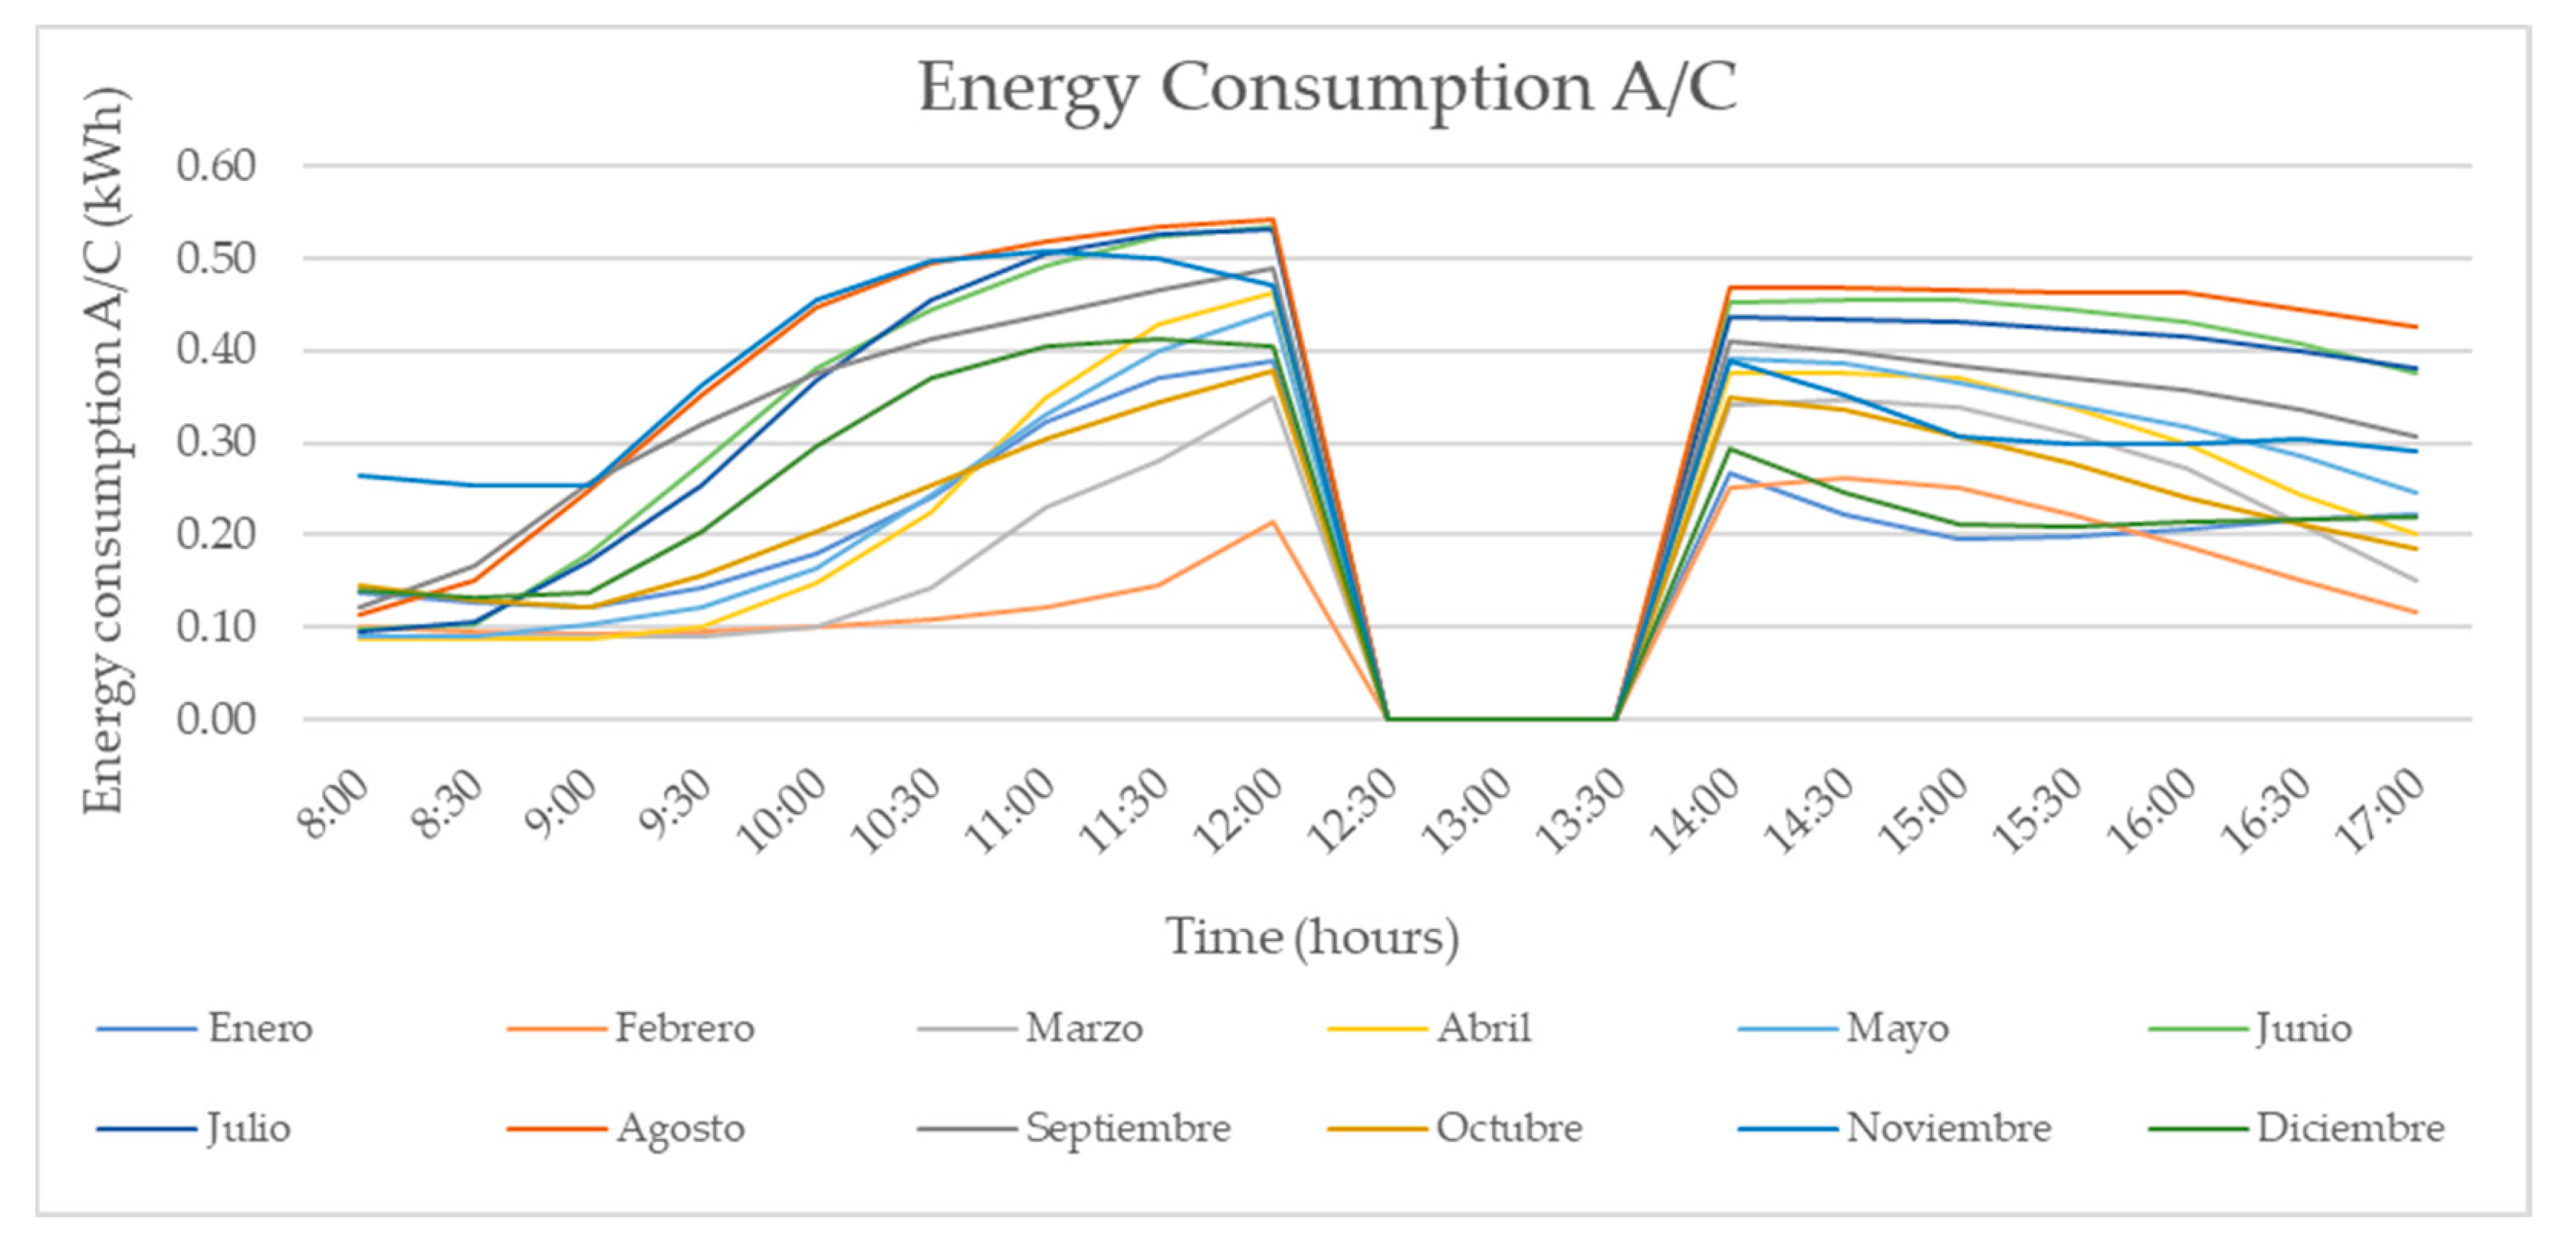
Energies 15 04715 sch003
Scheme 4. Data of energy consumption A/C.
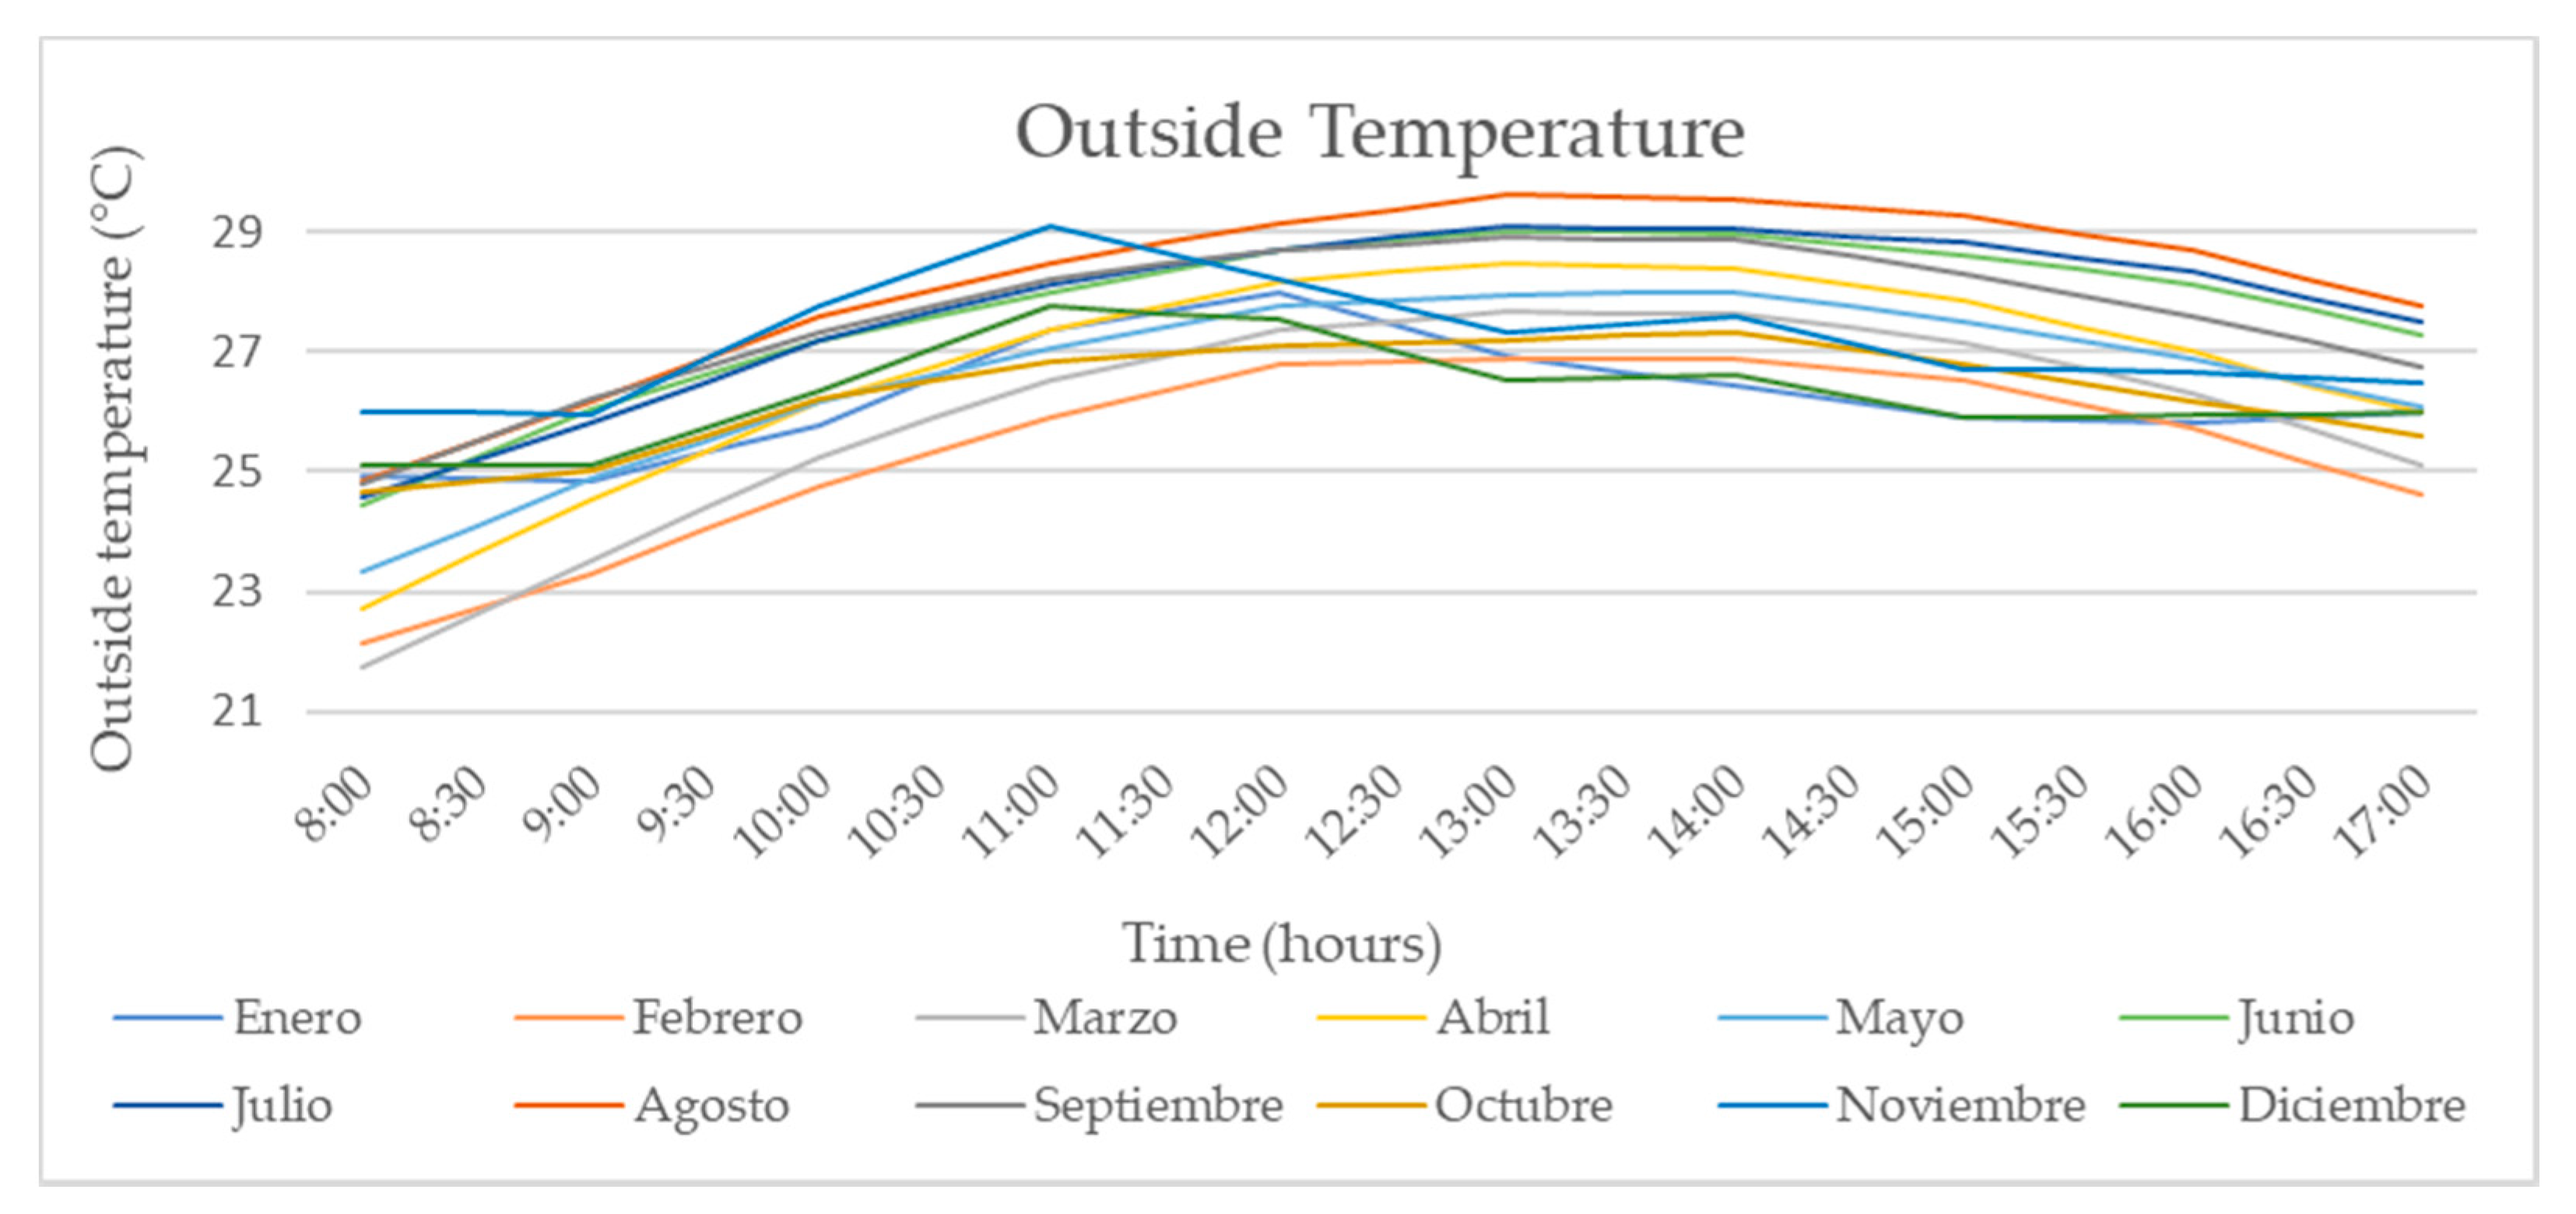
Energies 15 04715 sch004
Scheme 5. Data of outside temperature (°C).
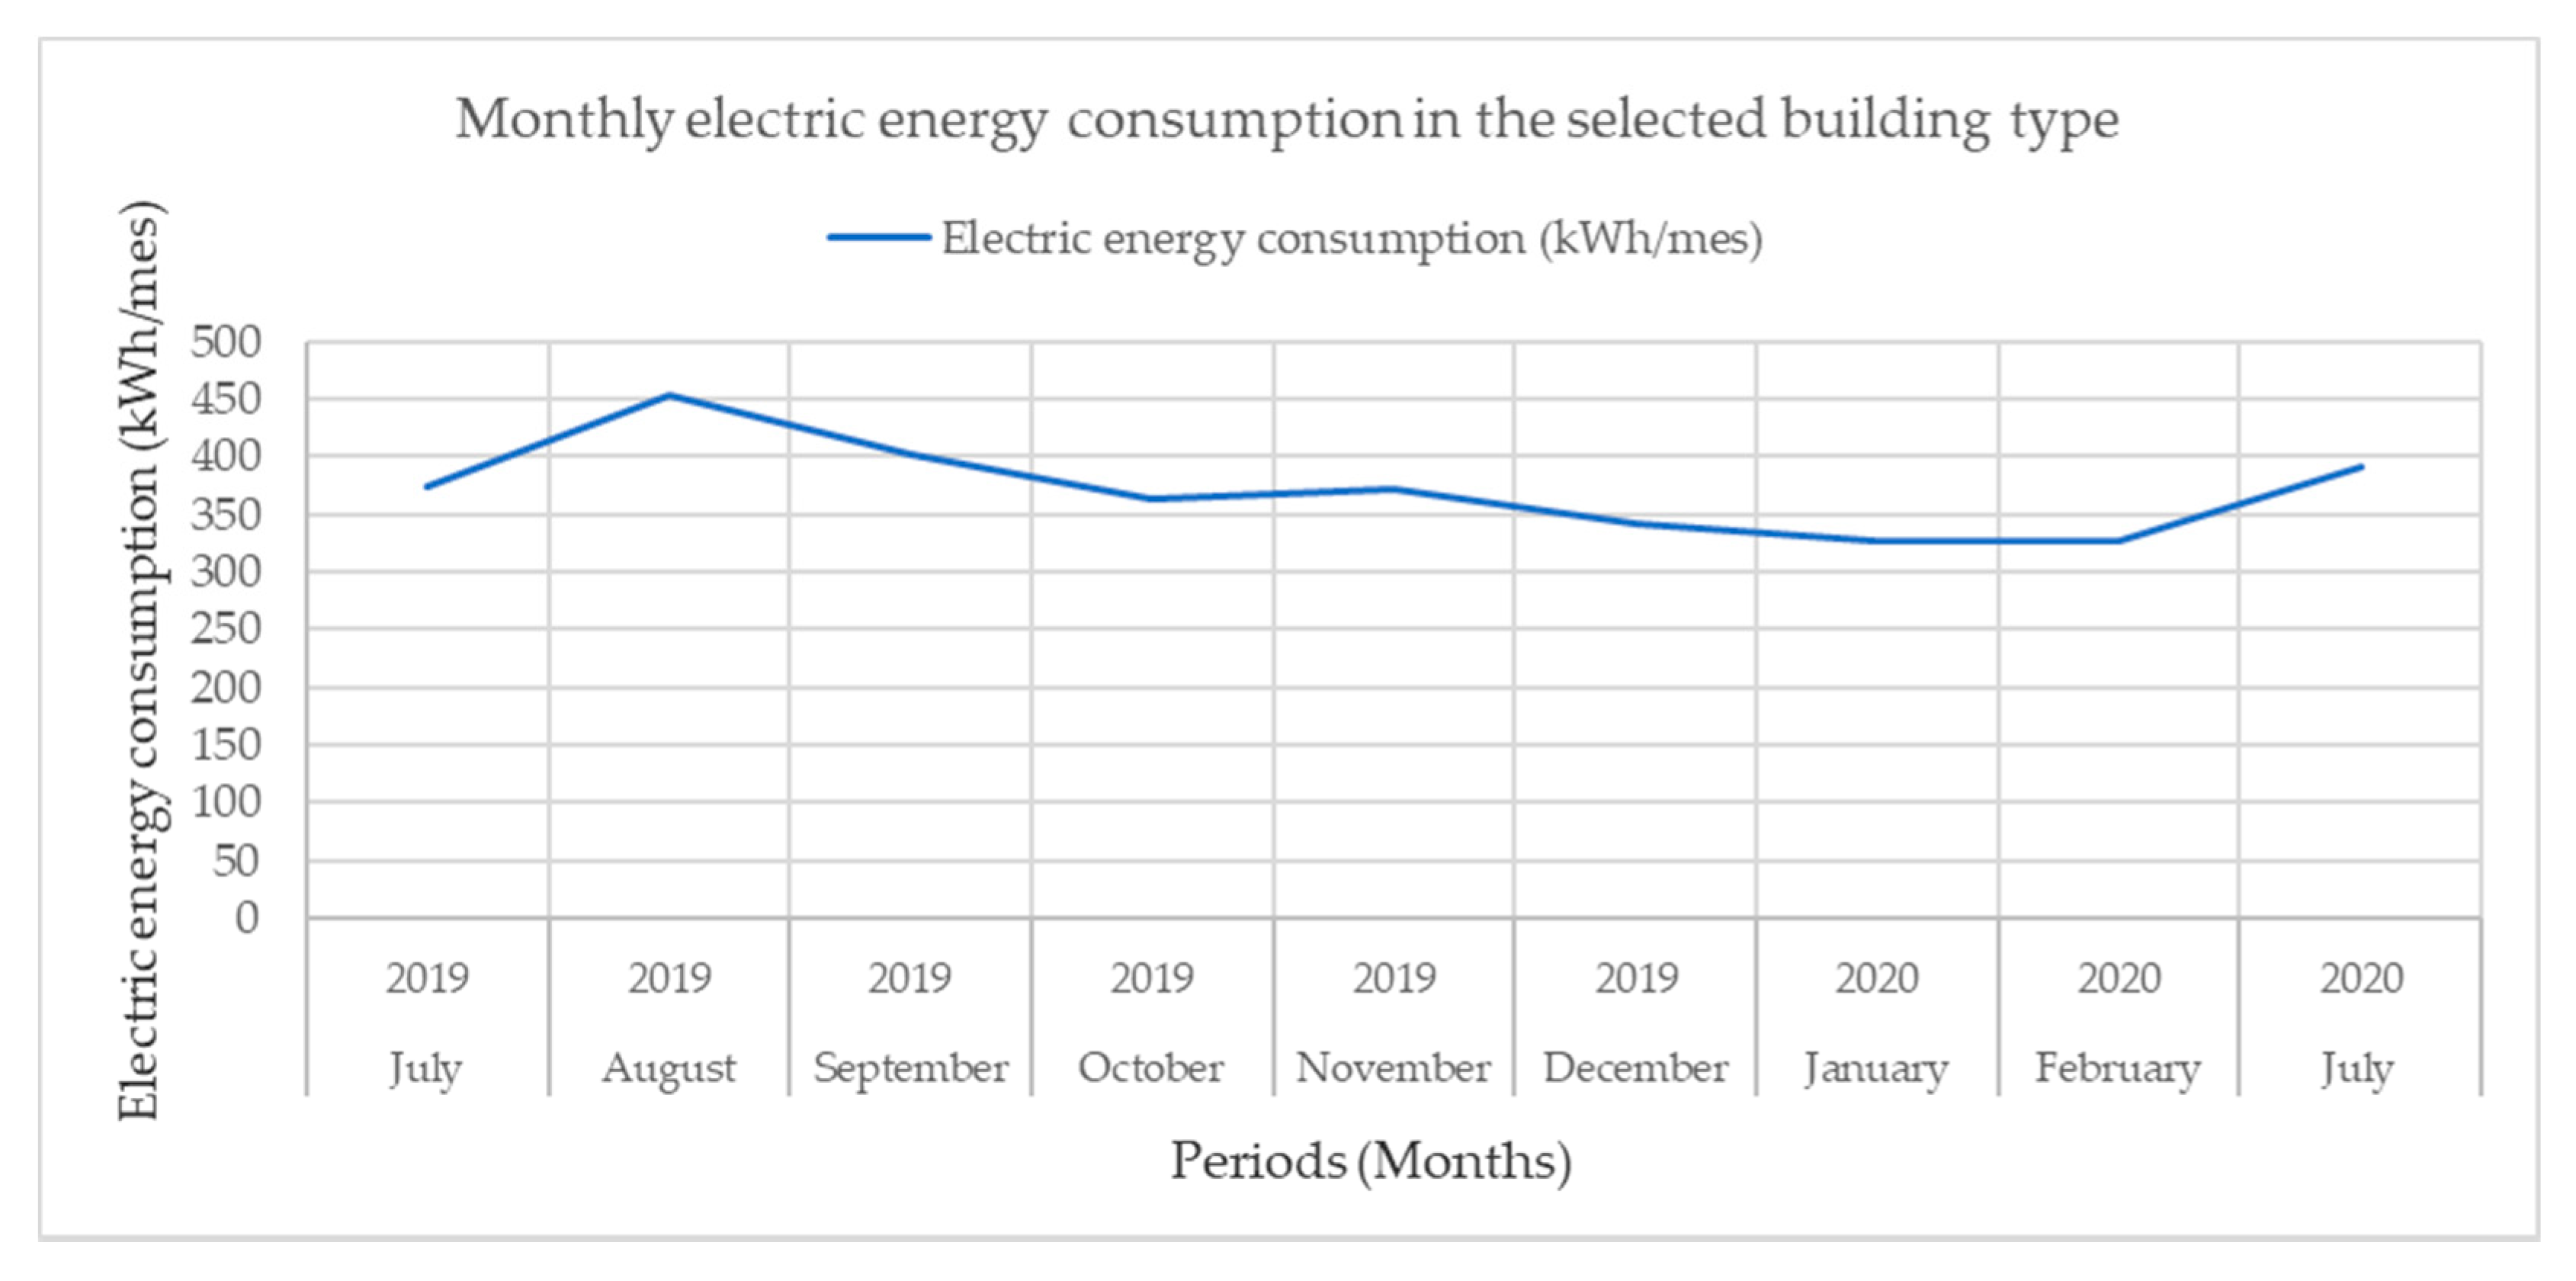
Energies 15 04715 sch005
Scheme 6. Monthly electric energy consumption in the selected building type.
Energies 15 04715 sch006
Figure 5. View of the façades of the model of the F. Mancebo building in DesignBuilder.
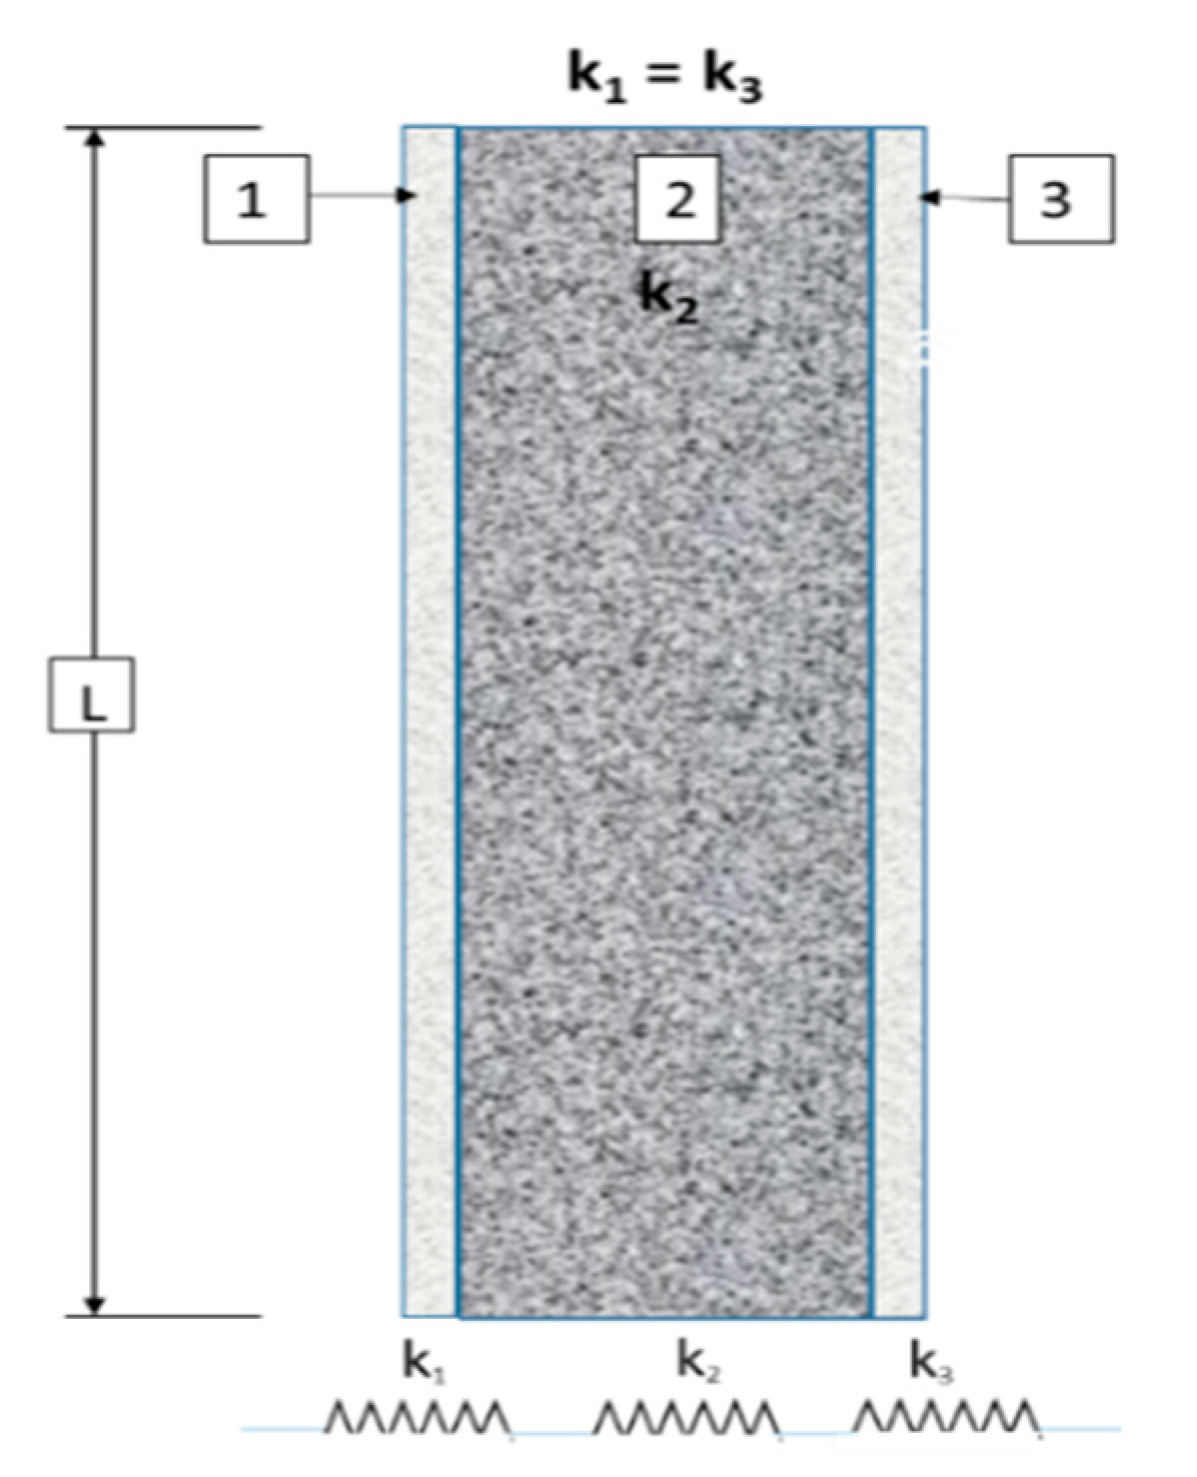
Energies 15 04715 g005
Figure 6. Wall-section of a typical building.
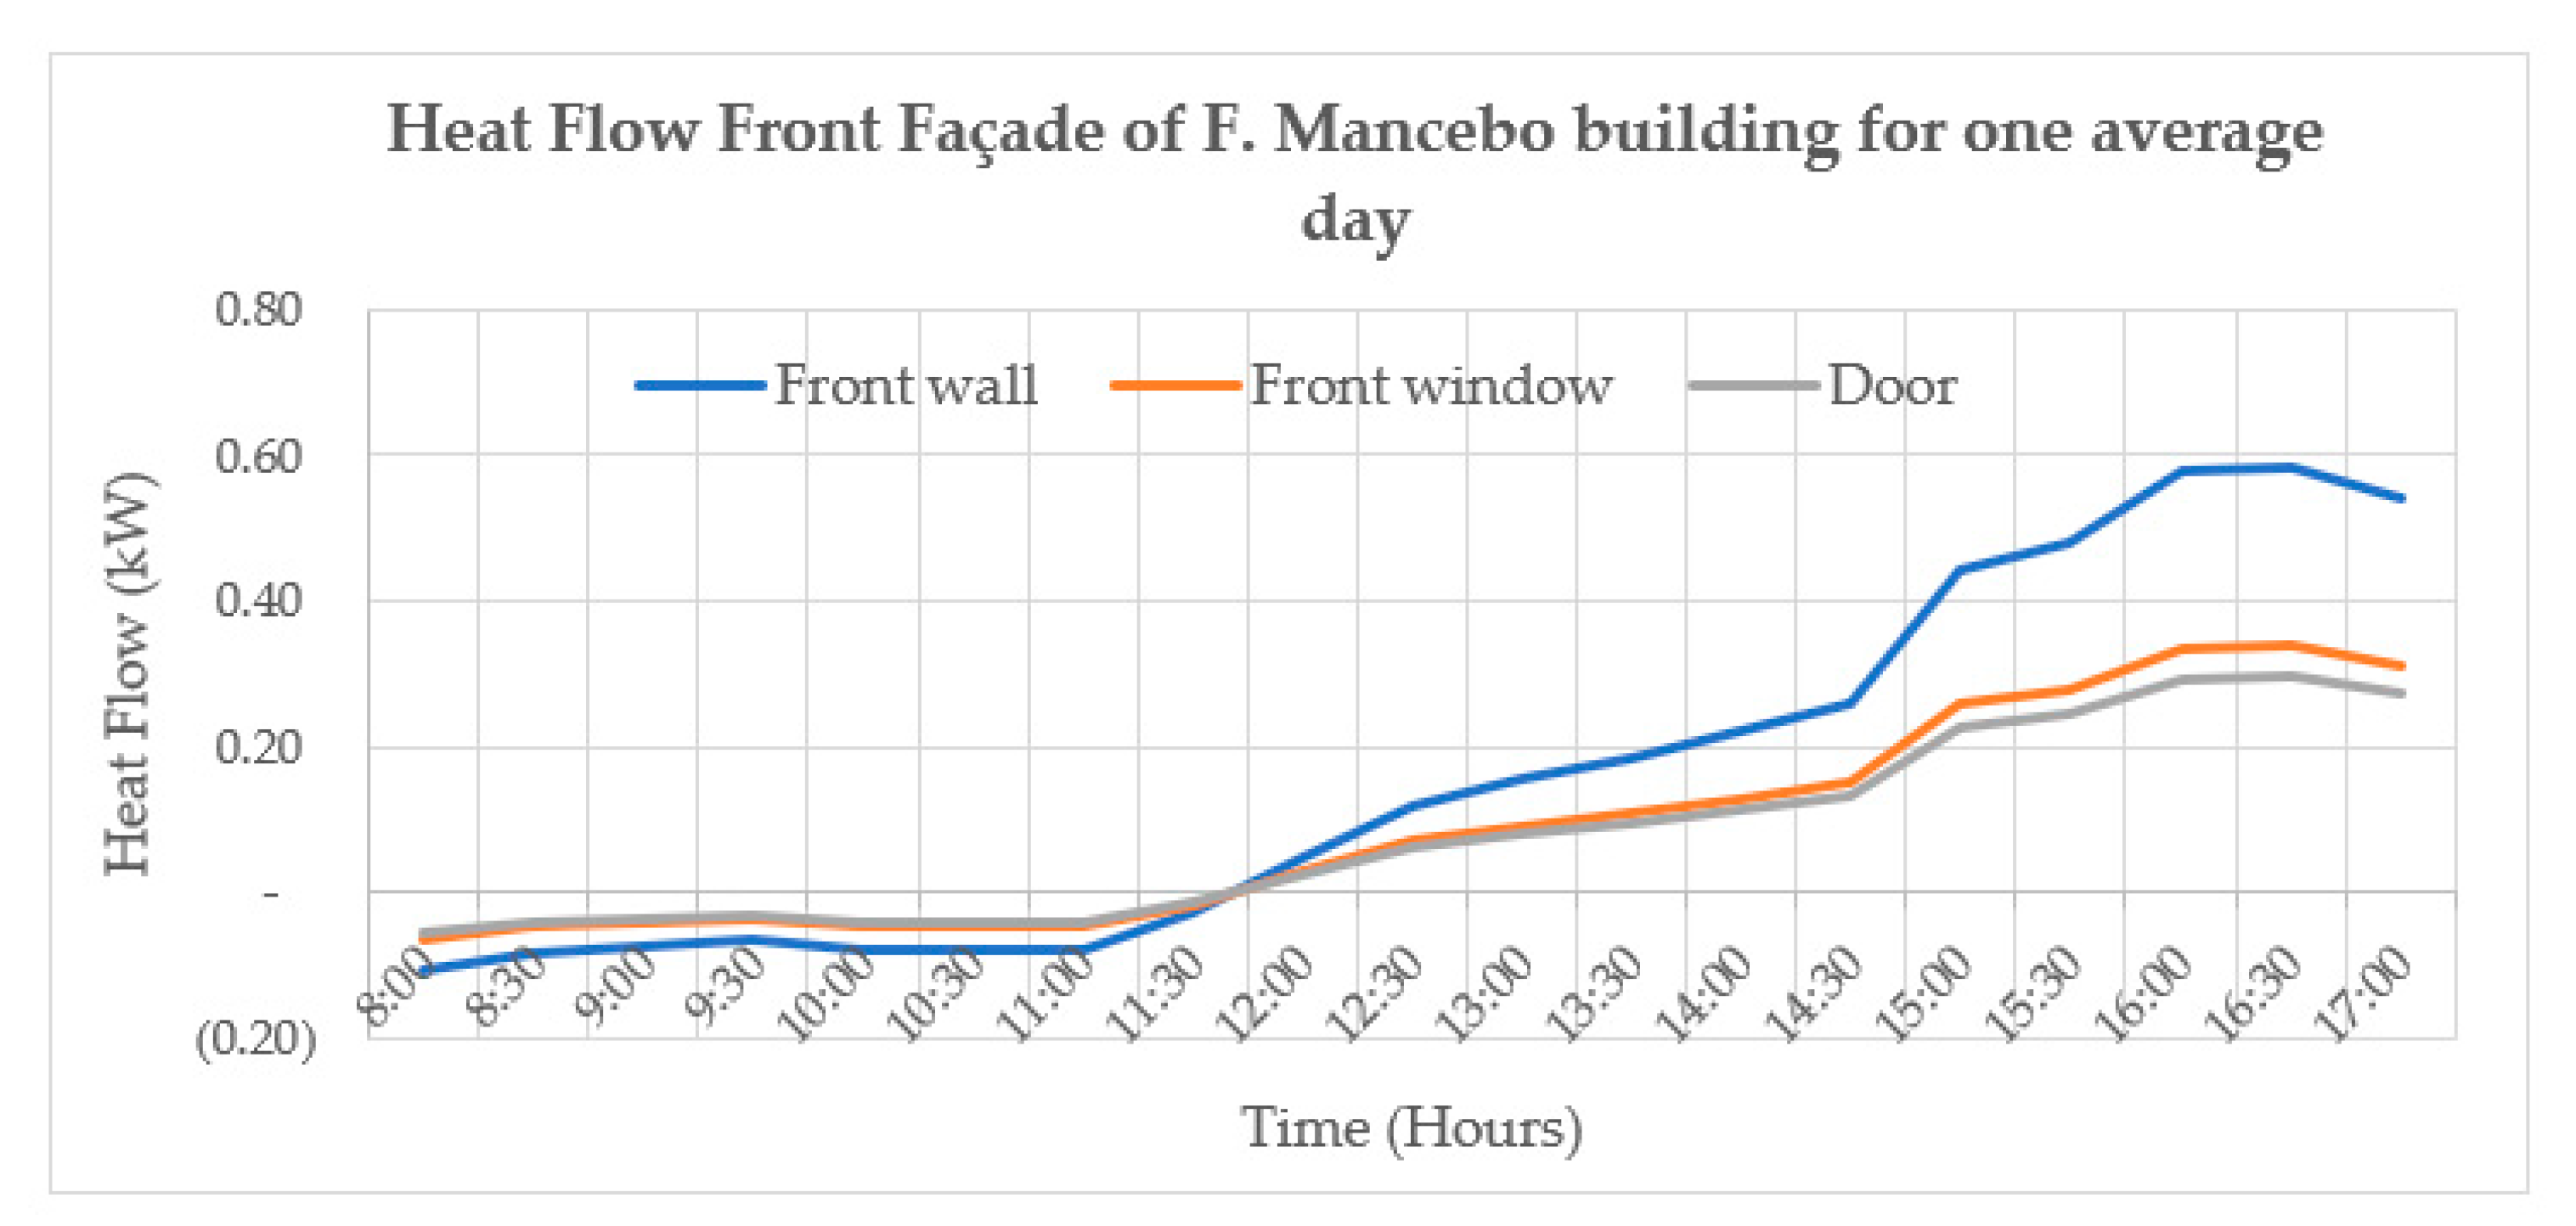
Energies 15 04715 g006
Scheme 7. Heat flow by conduction plus convection in the front façade of the F. Mancebo building for one average day.
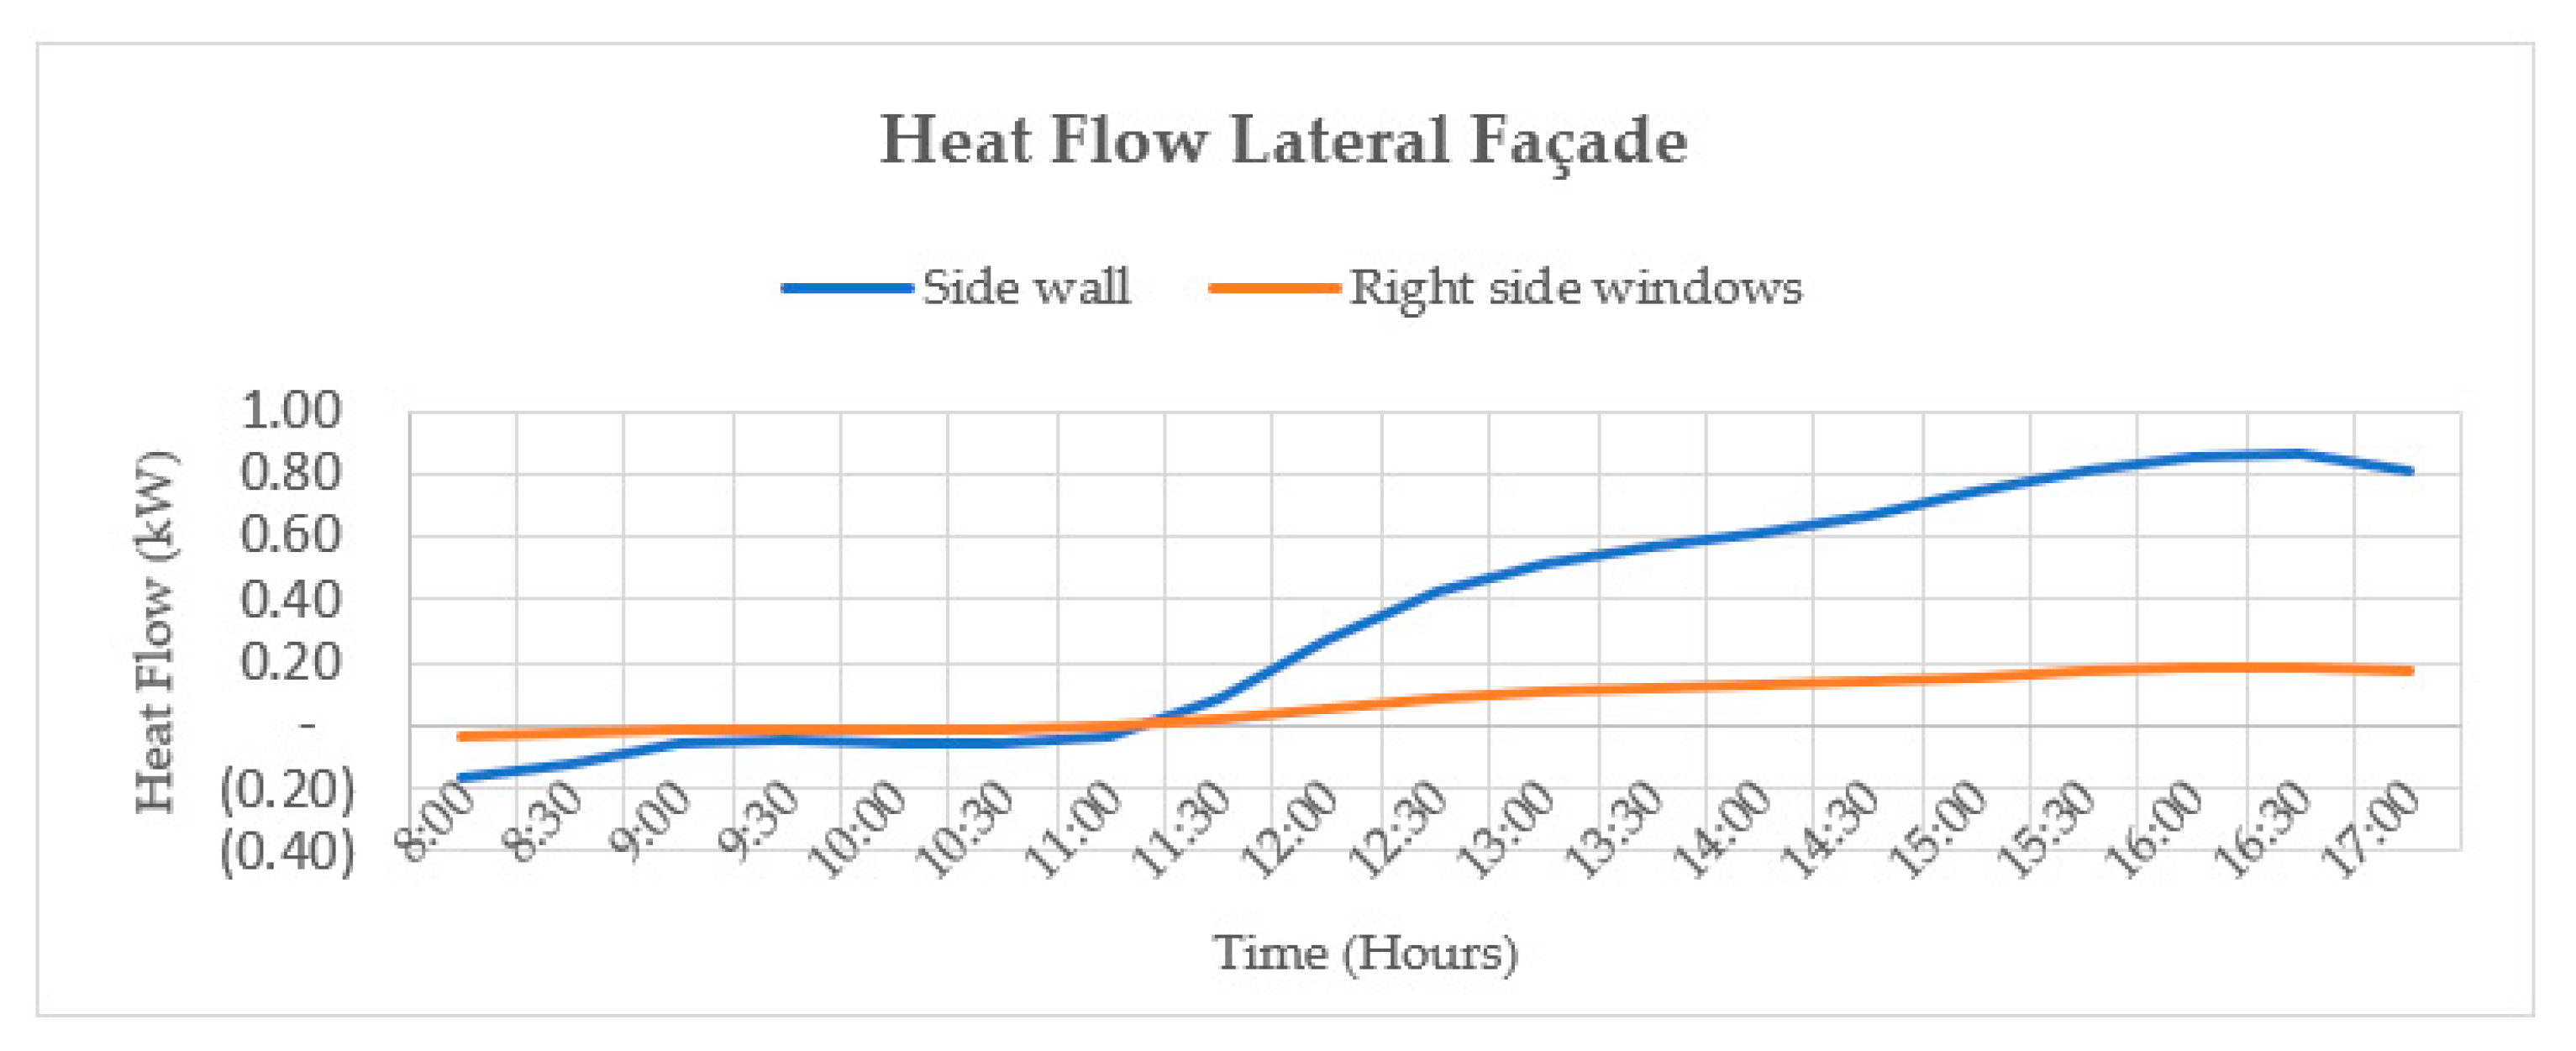
Energies 15 04715 sch007
Scheme 8. Heat flow by conduction plus convection through the right side of the building.
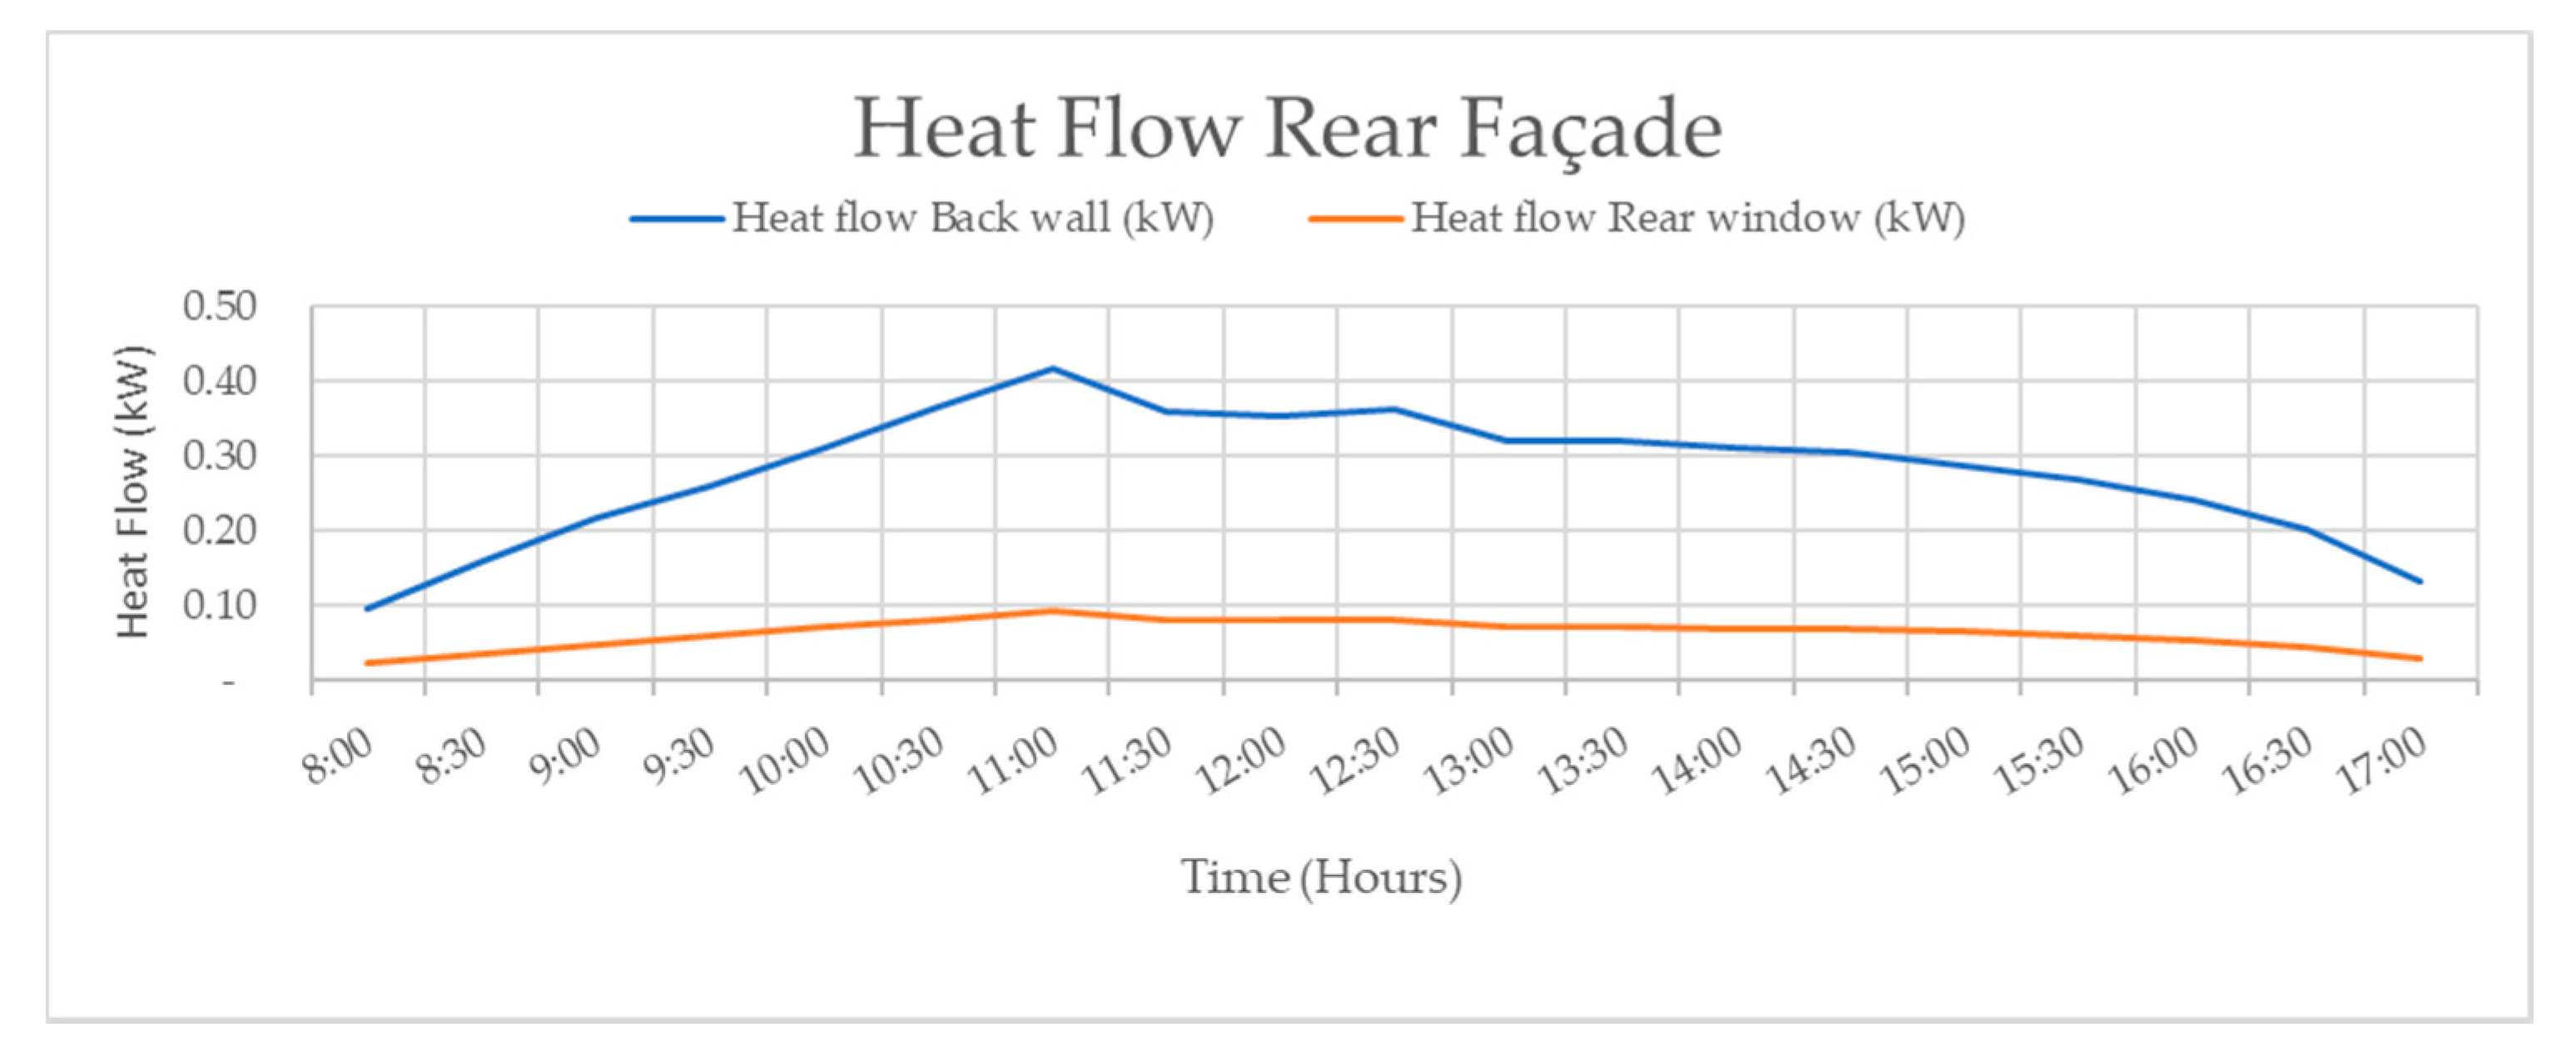
Energies 15 04715 sch008
Scheme 9. Heat flow by conduction plus convection through the rear façade of the building.
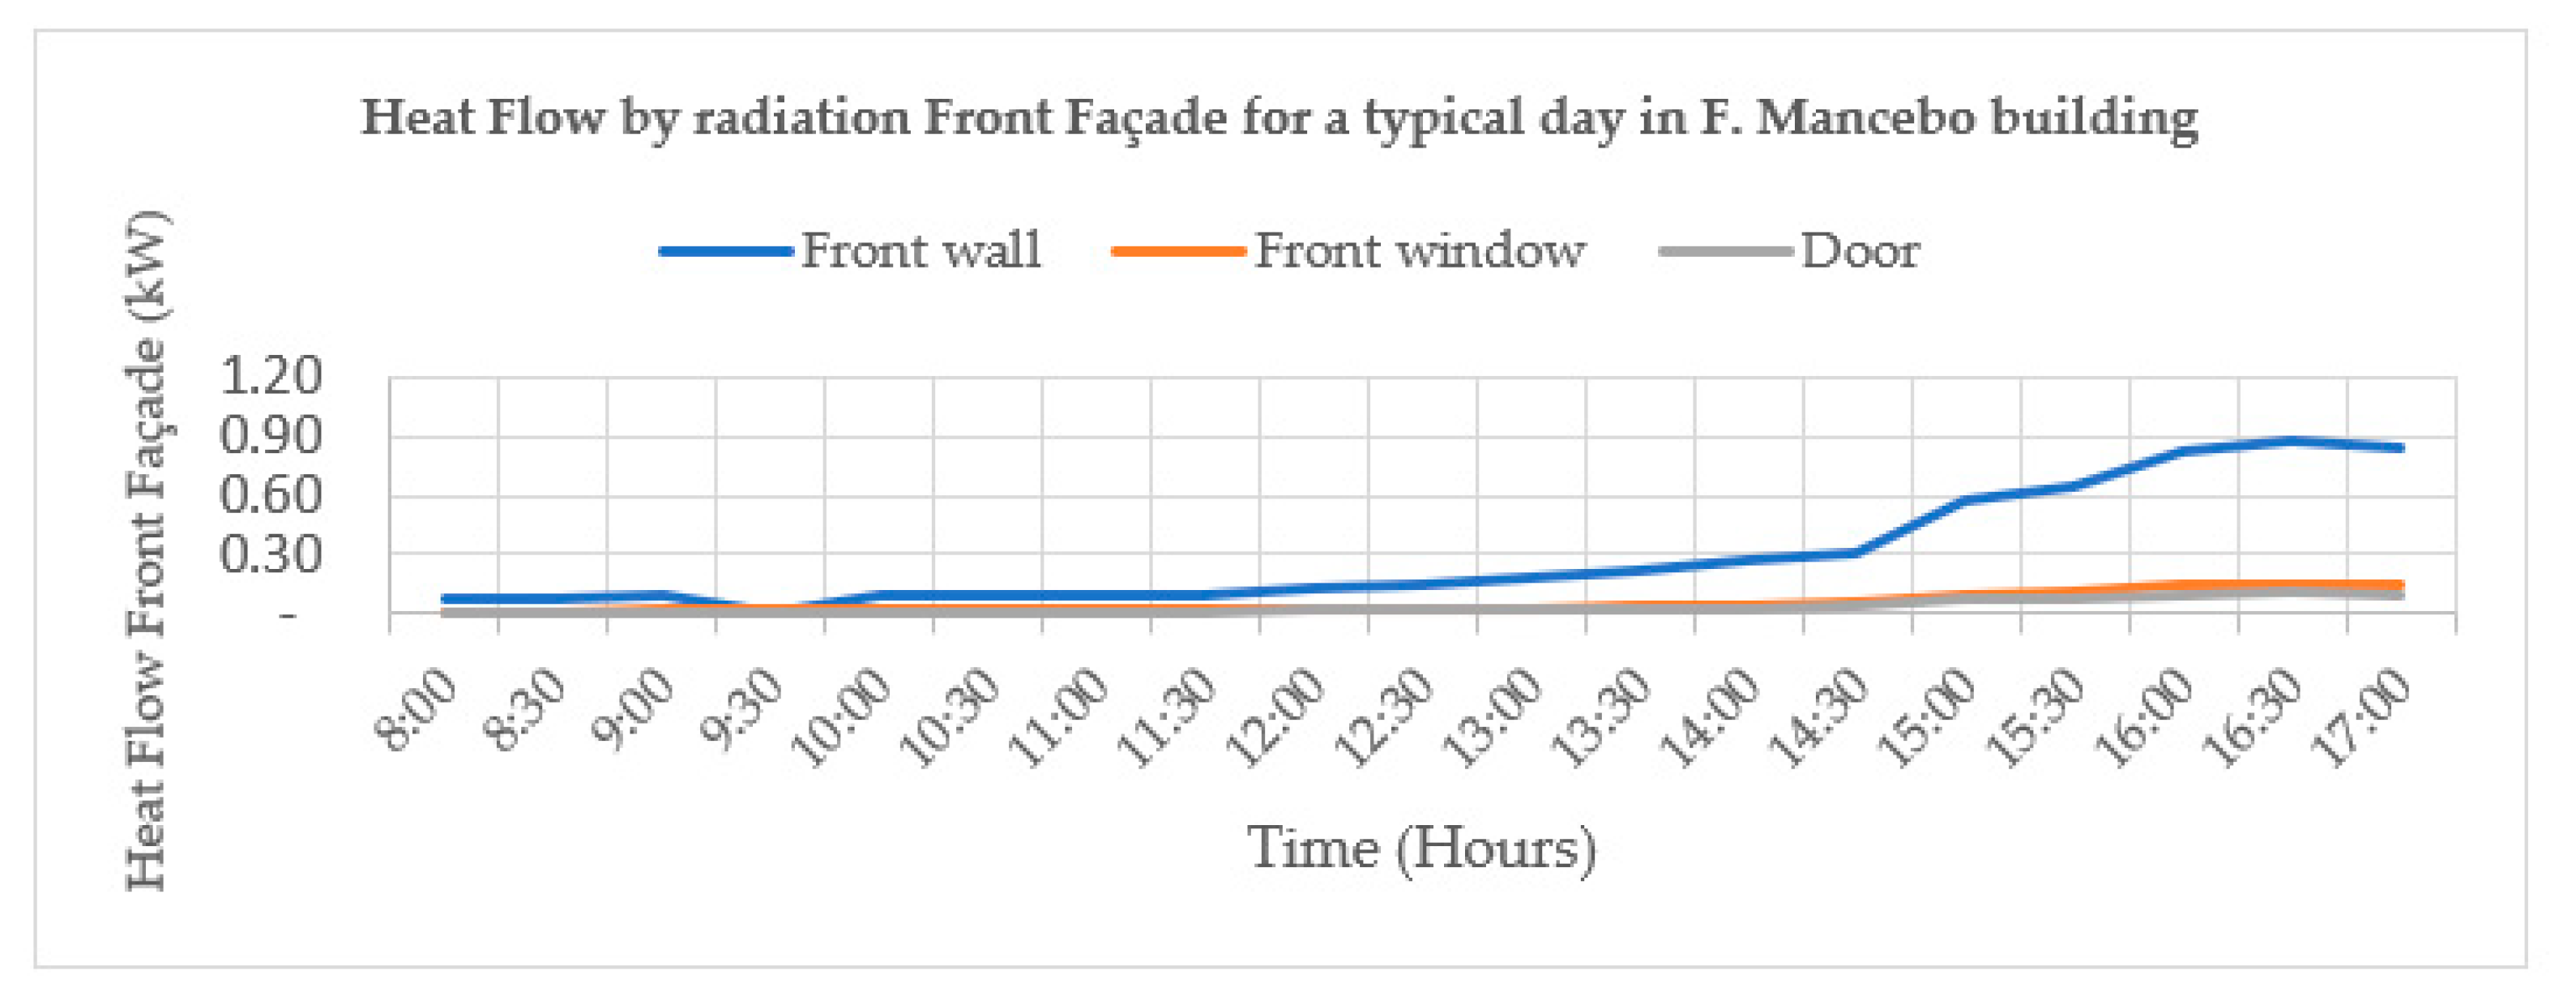
Energies 15 04715 sch009
Scheme 10. Transfer of heat by radiation through the front façade of the building in working hours for a typical day.
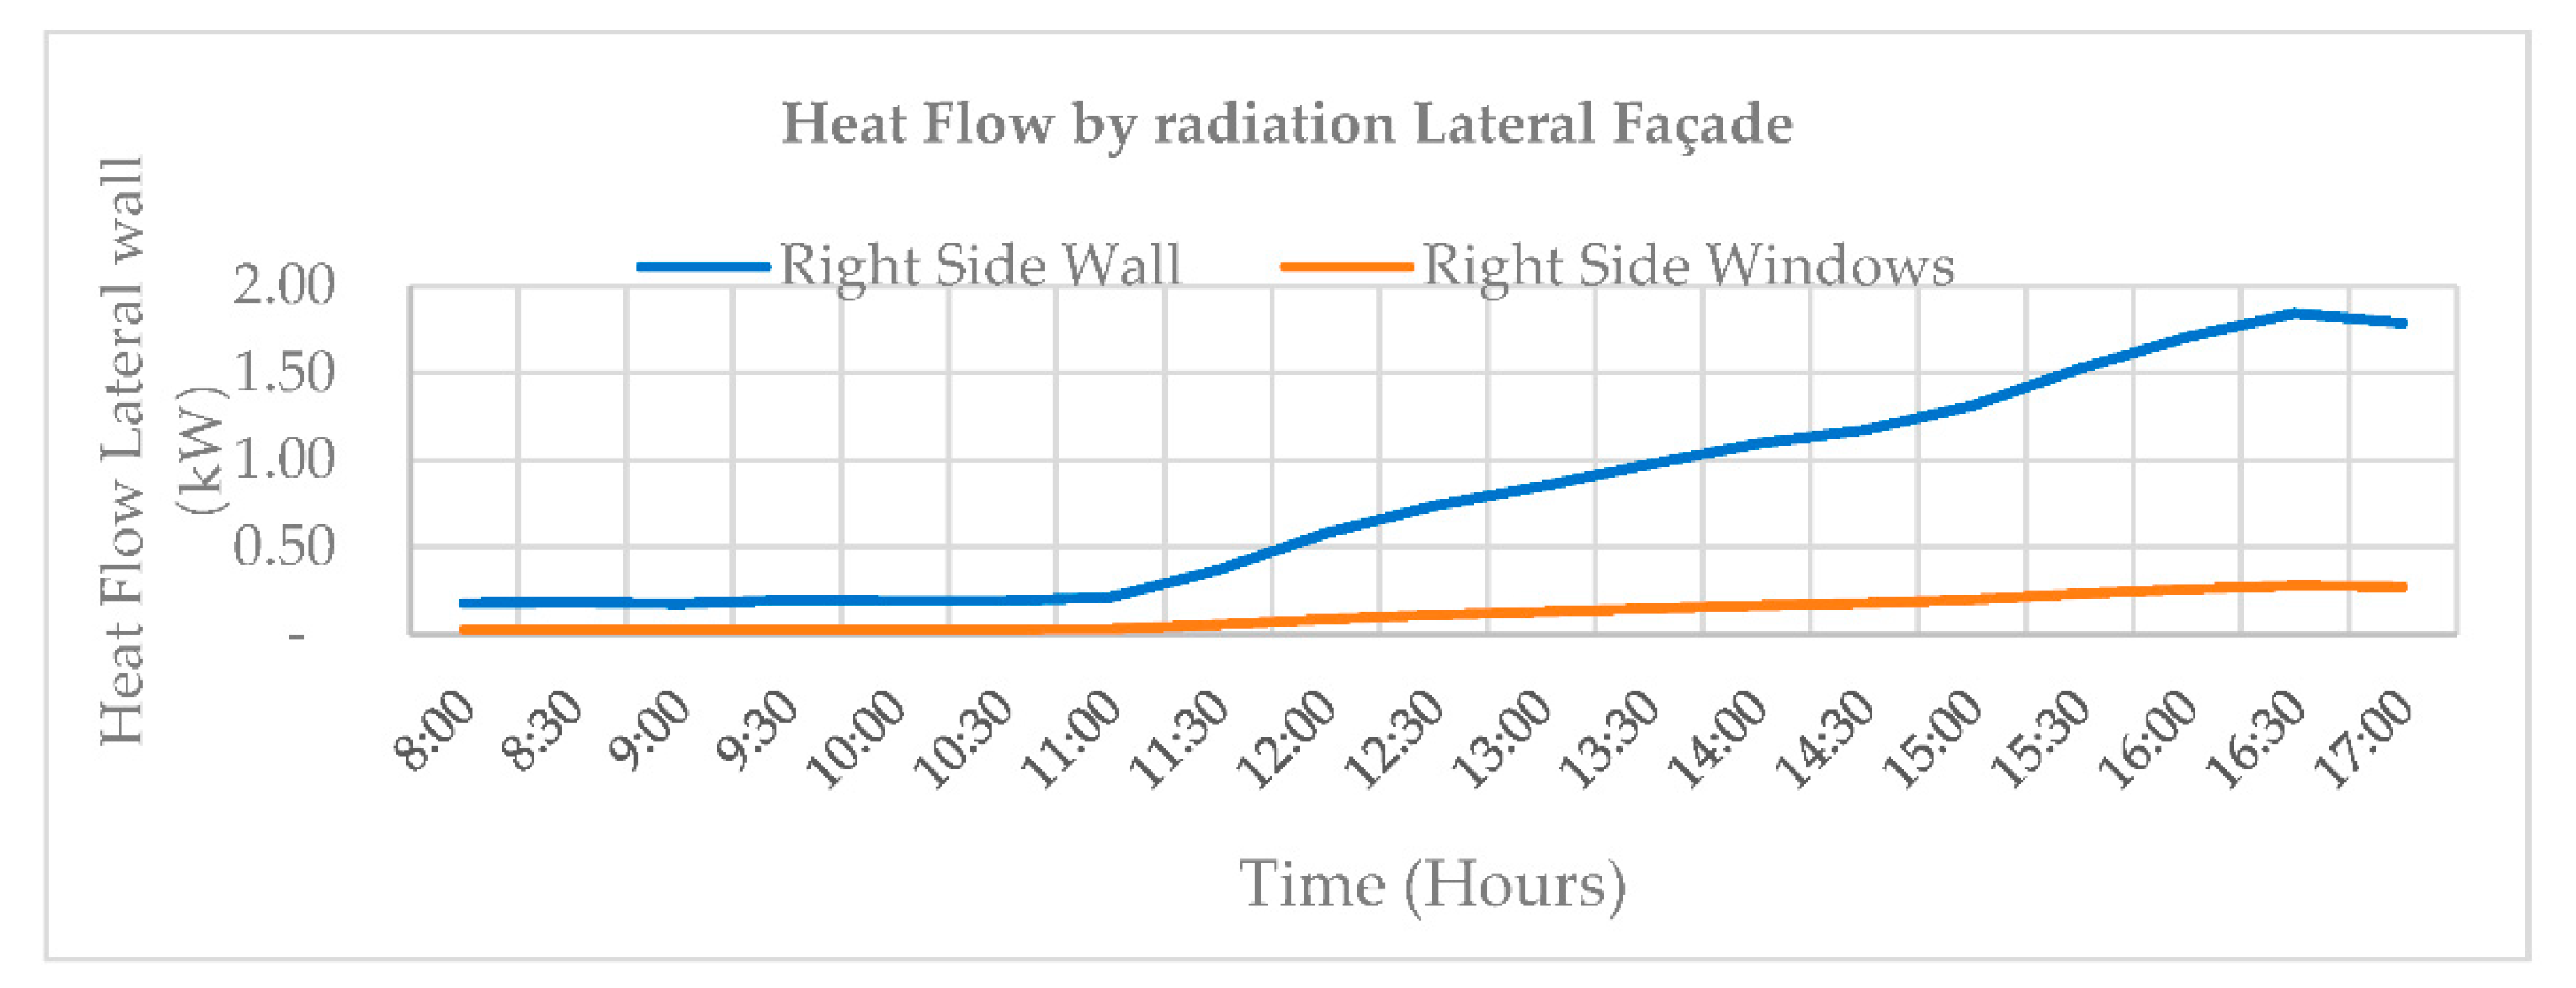
Energies 15 04715 sch010
Scheme 11. Transfer of heat by radiation through the lateral façade during work hours on a typical day.
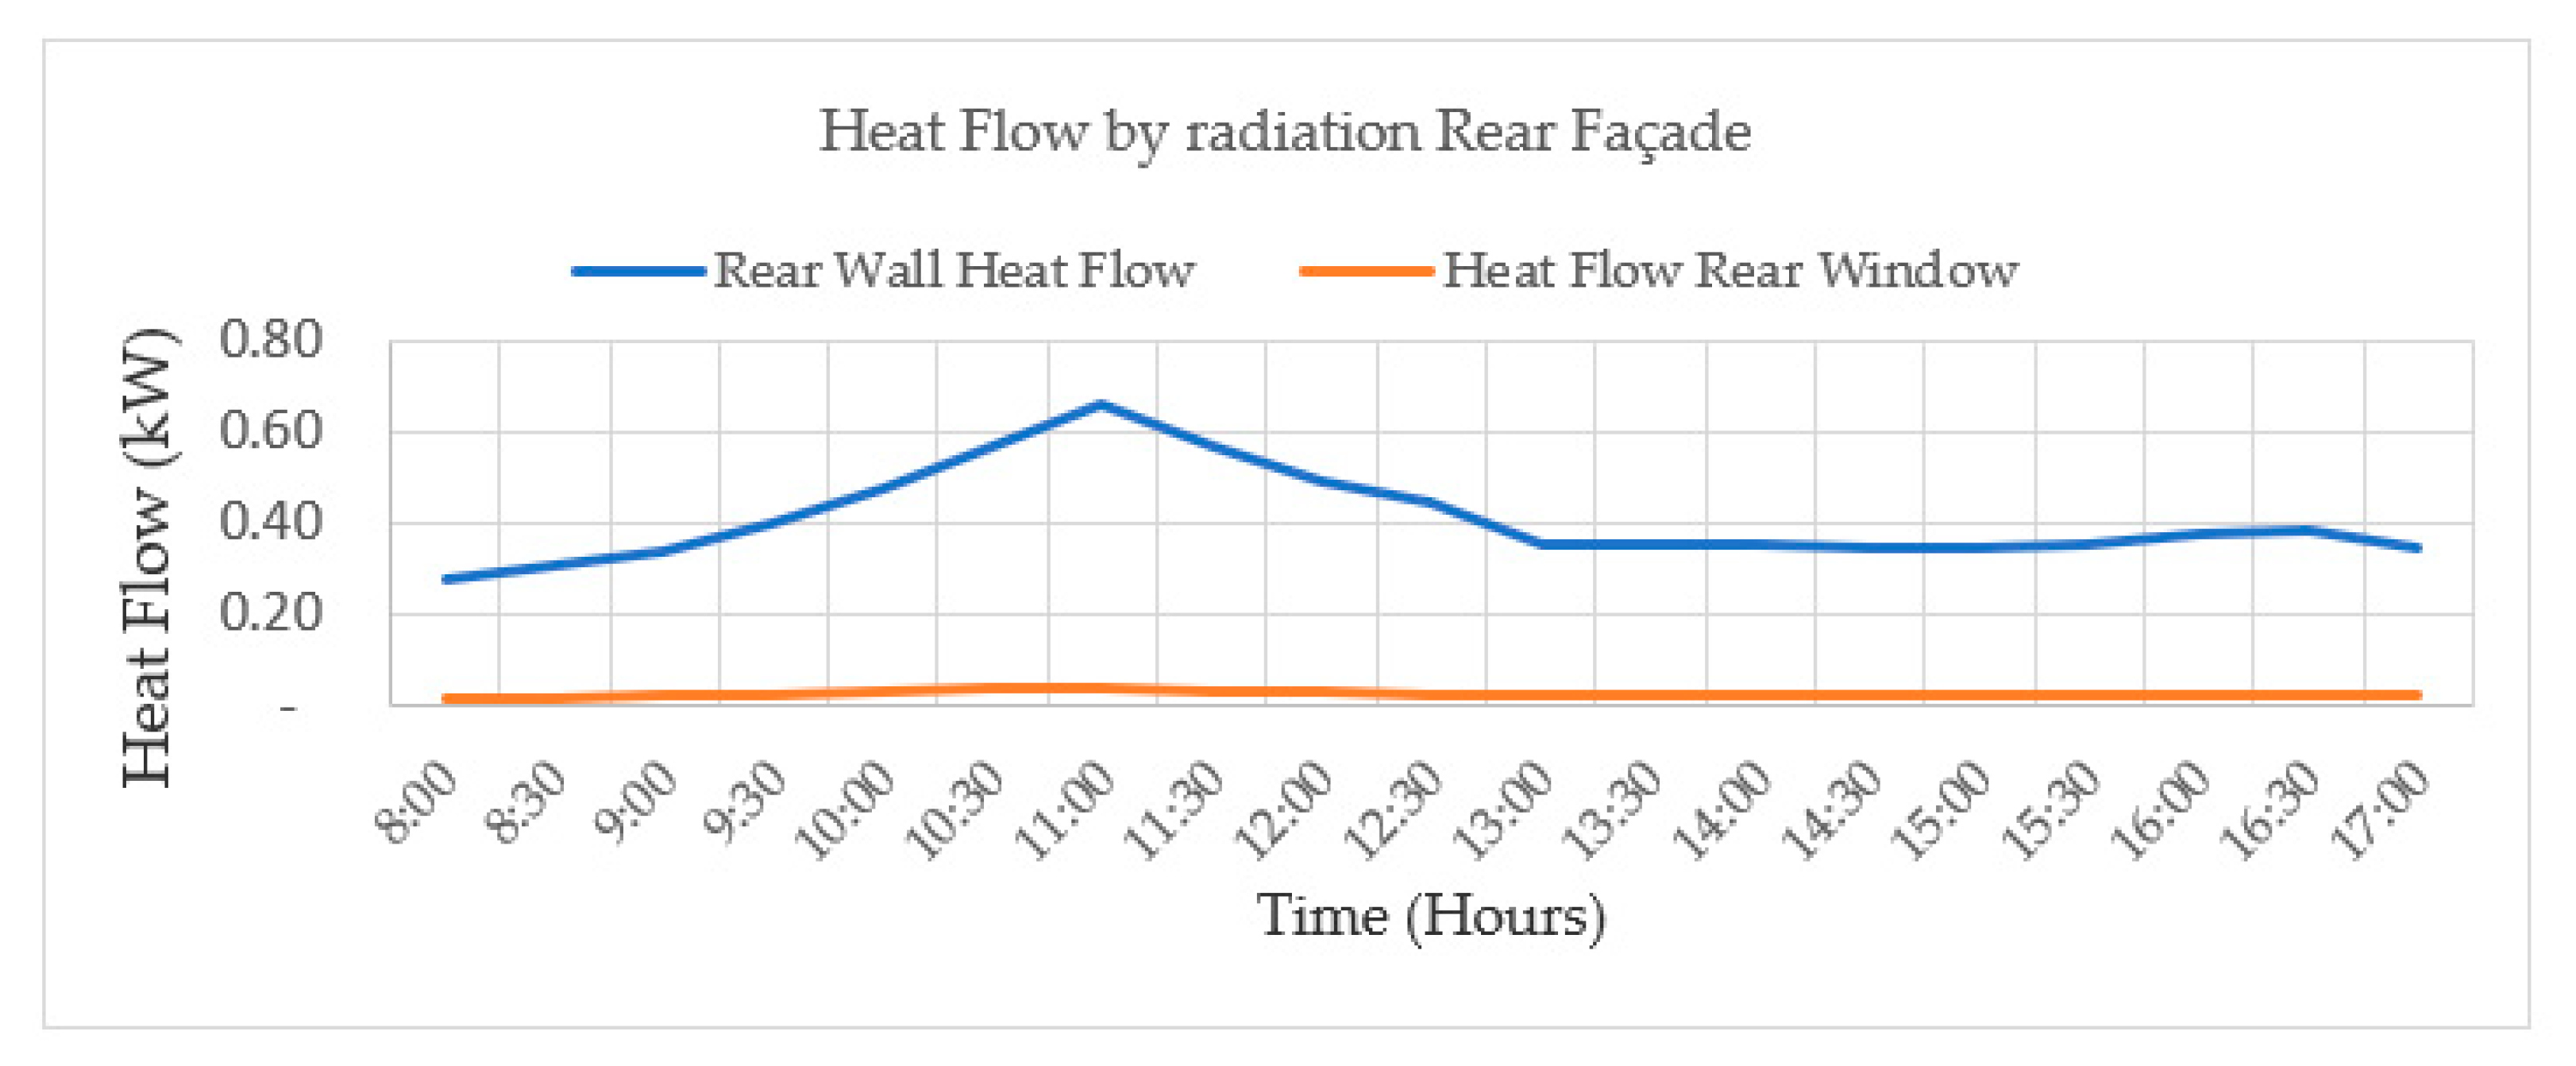
Energies 15 04715 sch011
Scheme 12. Transfer of heat by radiation through the rear wall during working hours on a typical day.
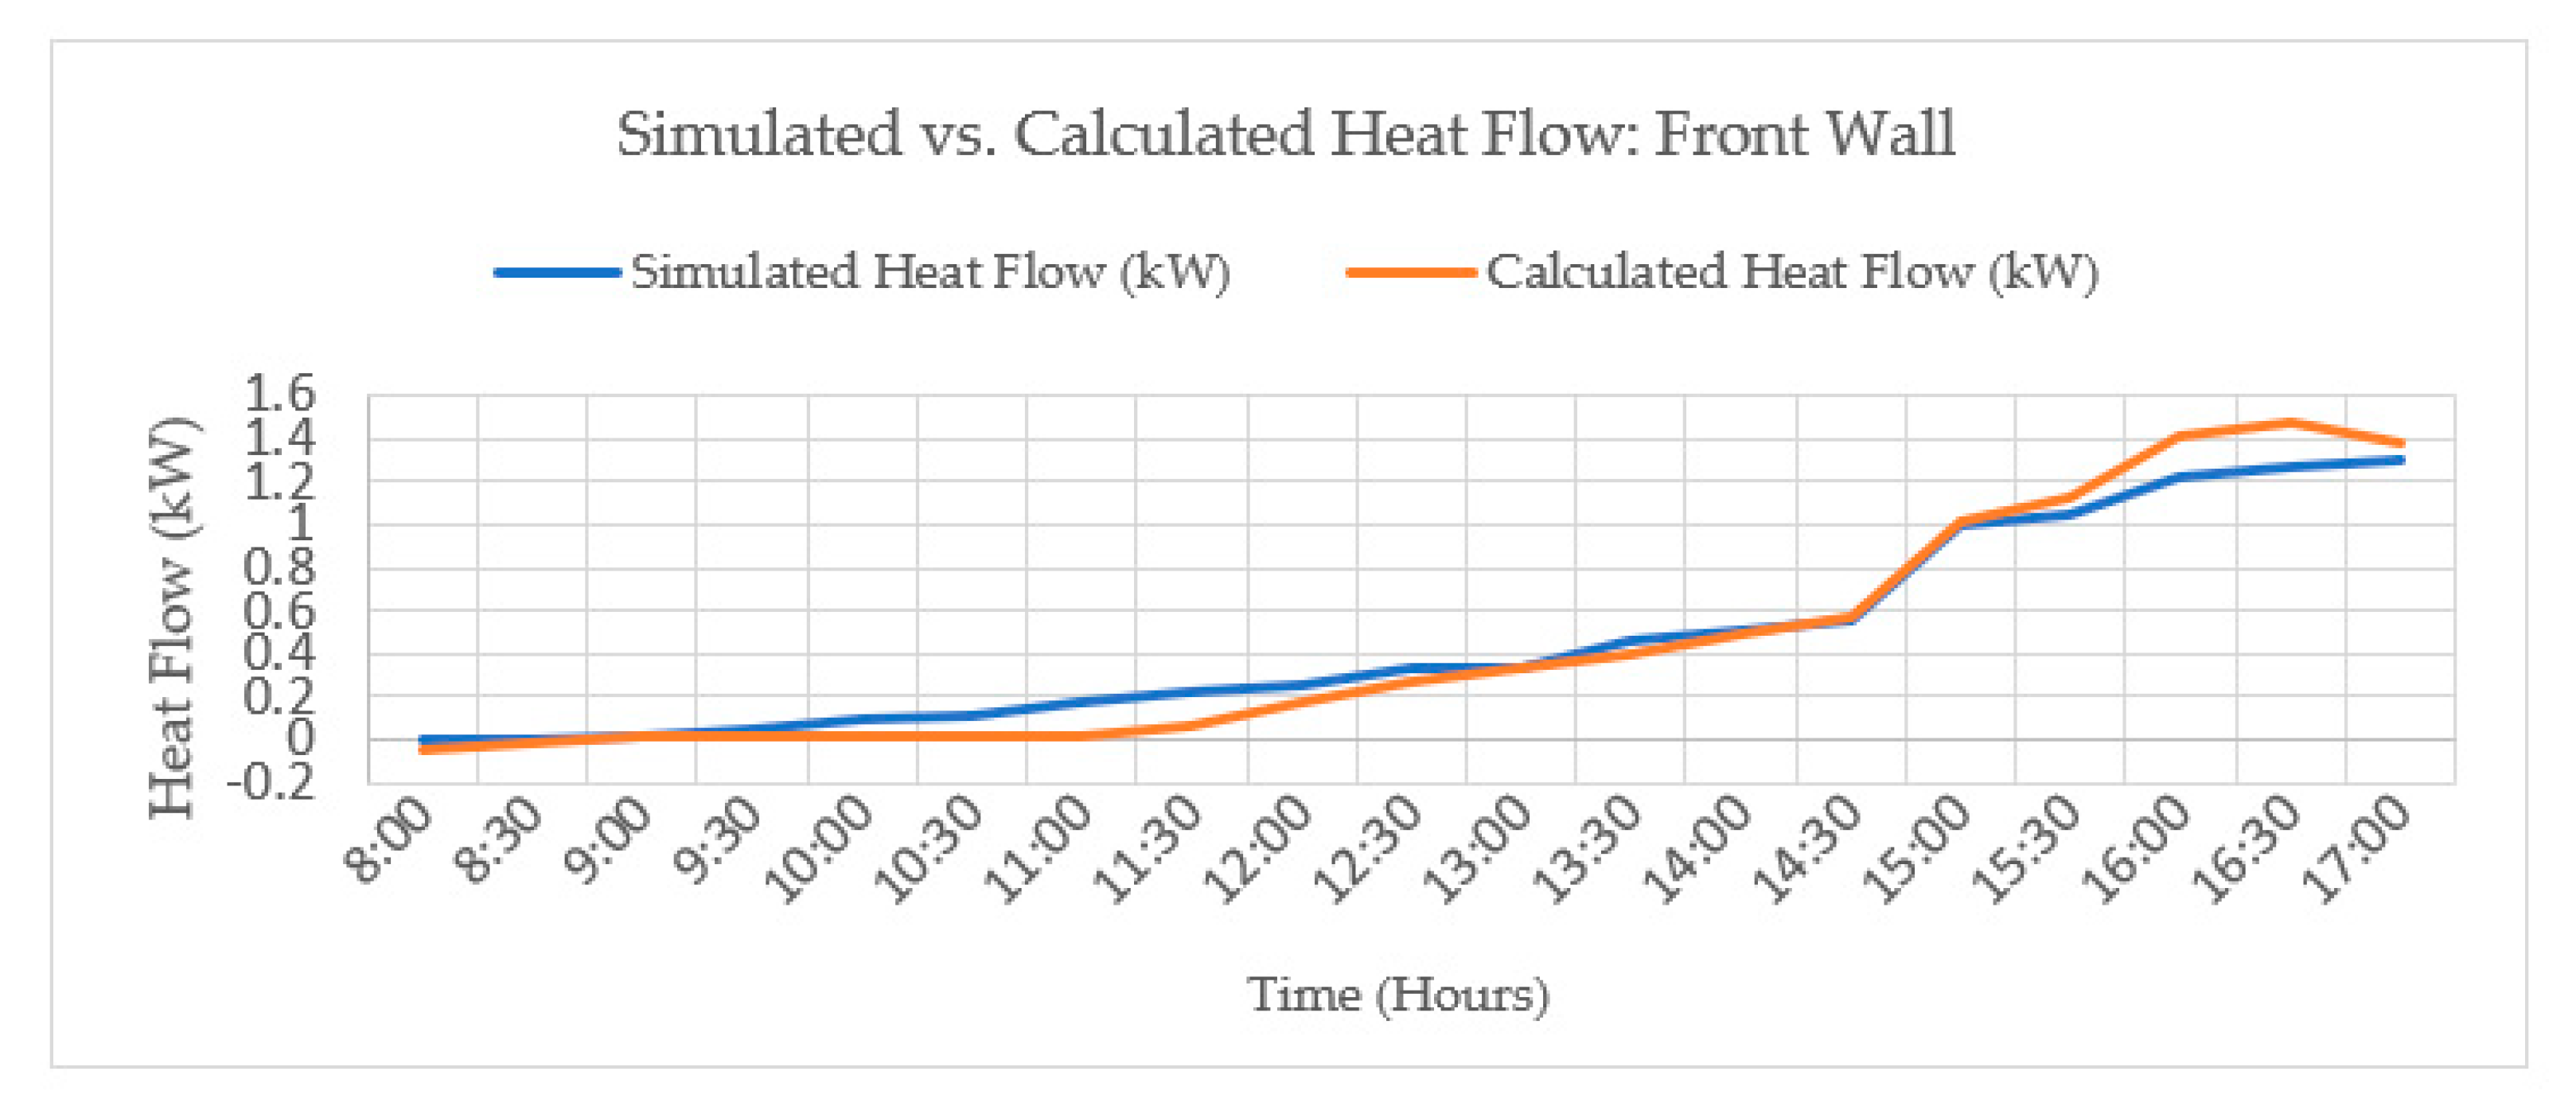
Energies 15 04715 sch012
Scheme 13. Simulated vs. calculated heat flow of the front wall of the F. Mancebo building for a typical day.
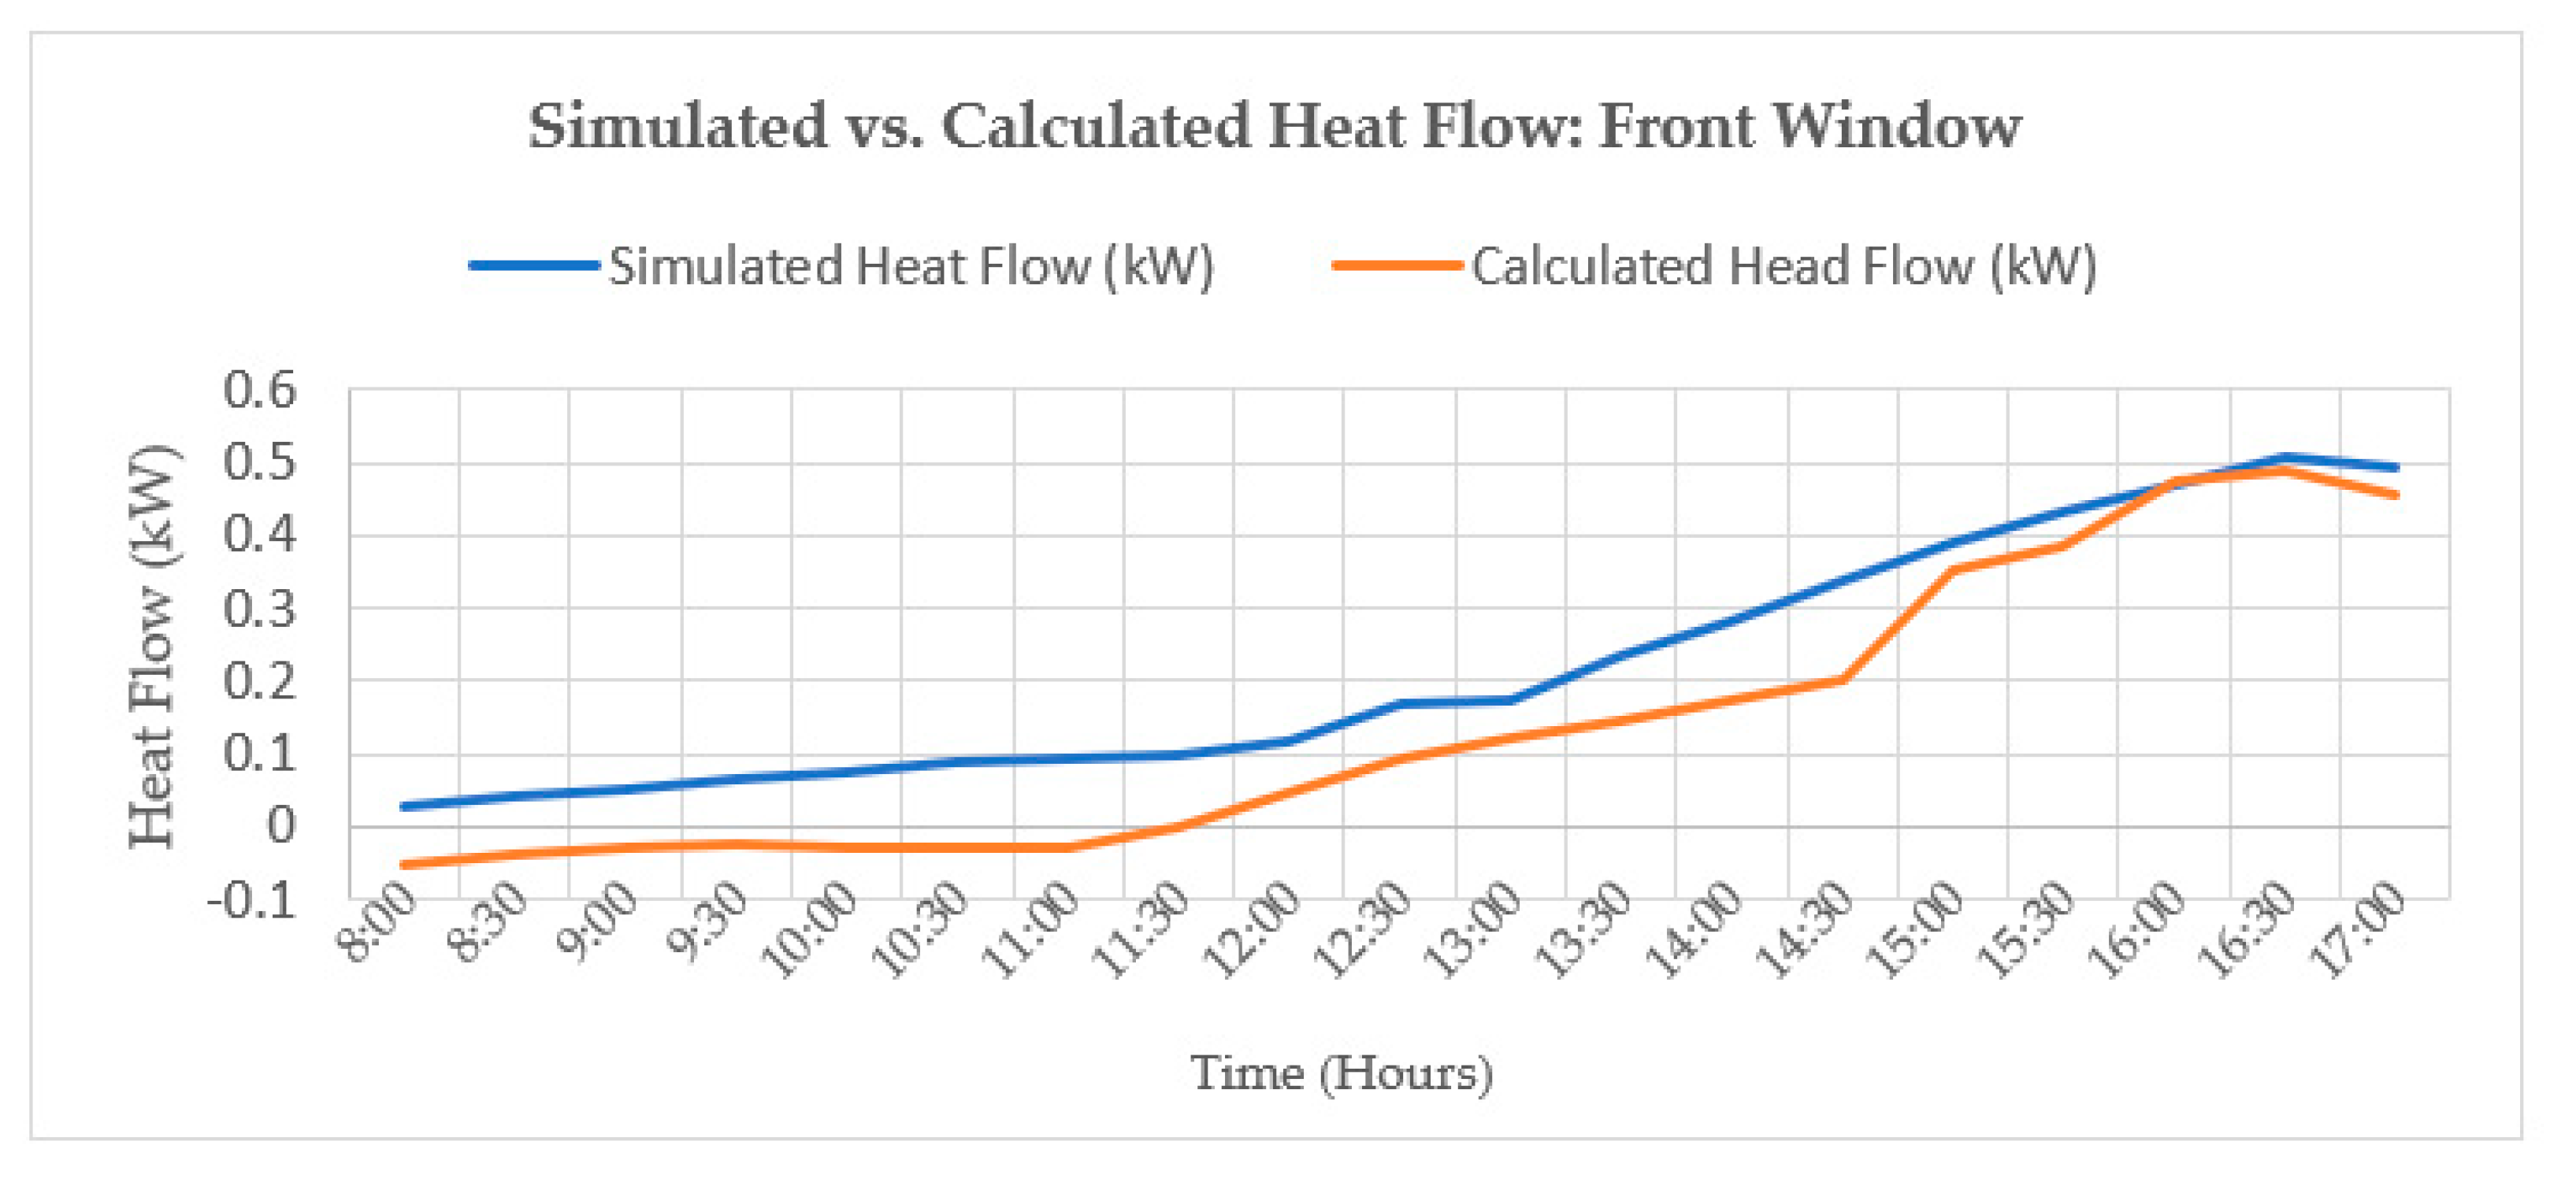
Energies 15 04715 sch013
Scheme 14. Simulated vs. calculated heat flow through the front window of the F. Mancebo building for a typical day.
Energies 15 04715 sch014
Scheme 15. Simulated vs. calculated heat flow in the side window of the F. Mancebo building for a typical day.
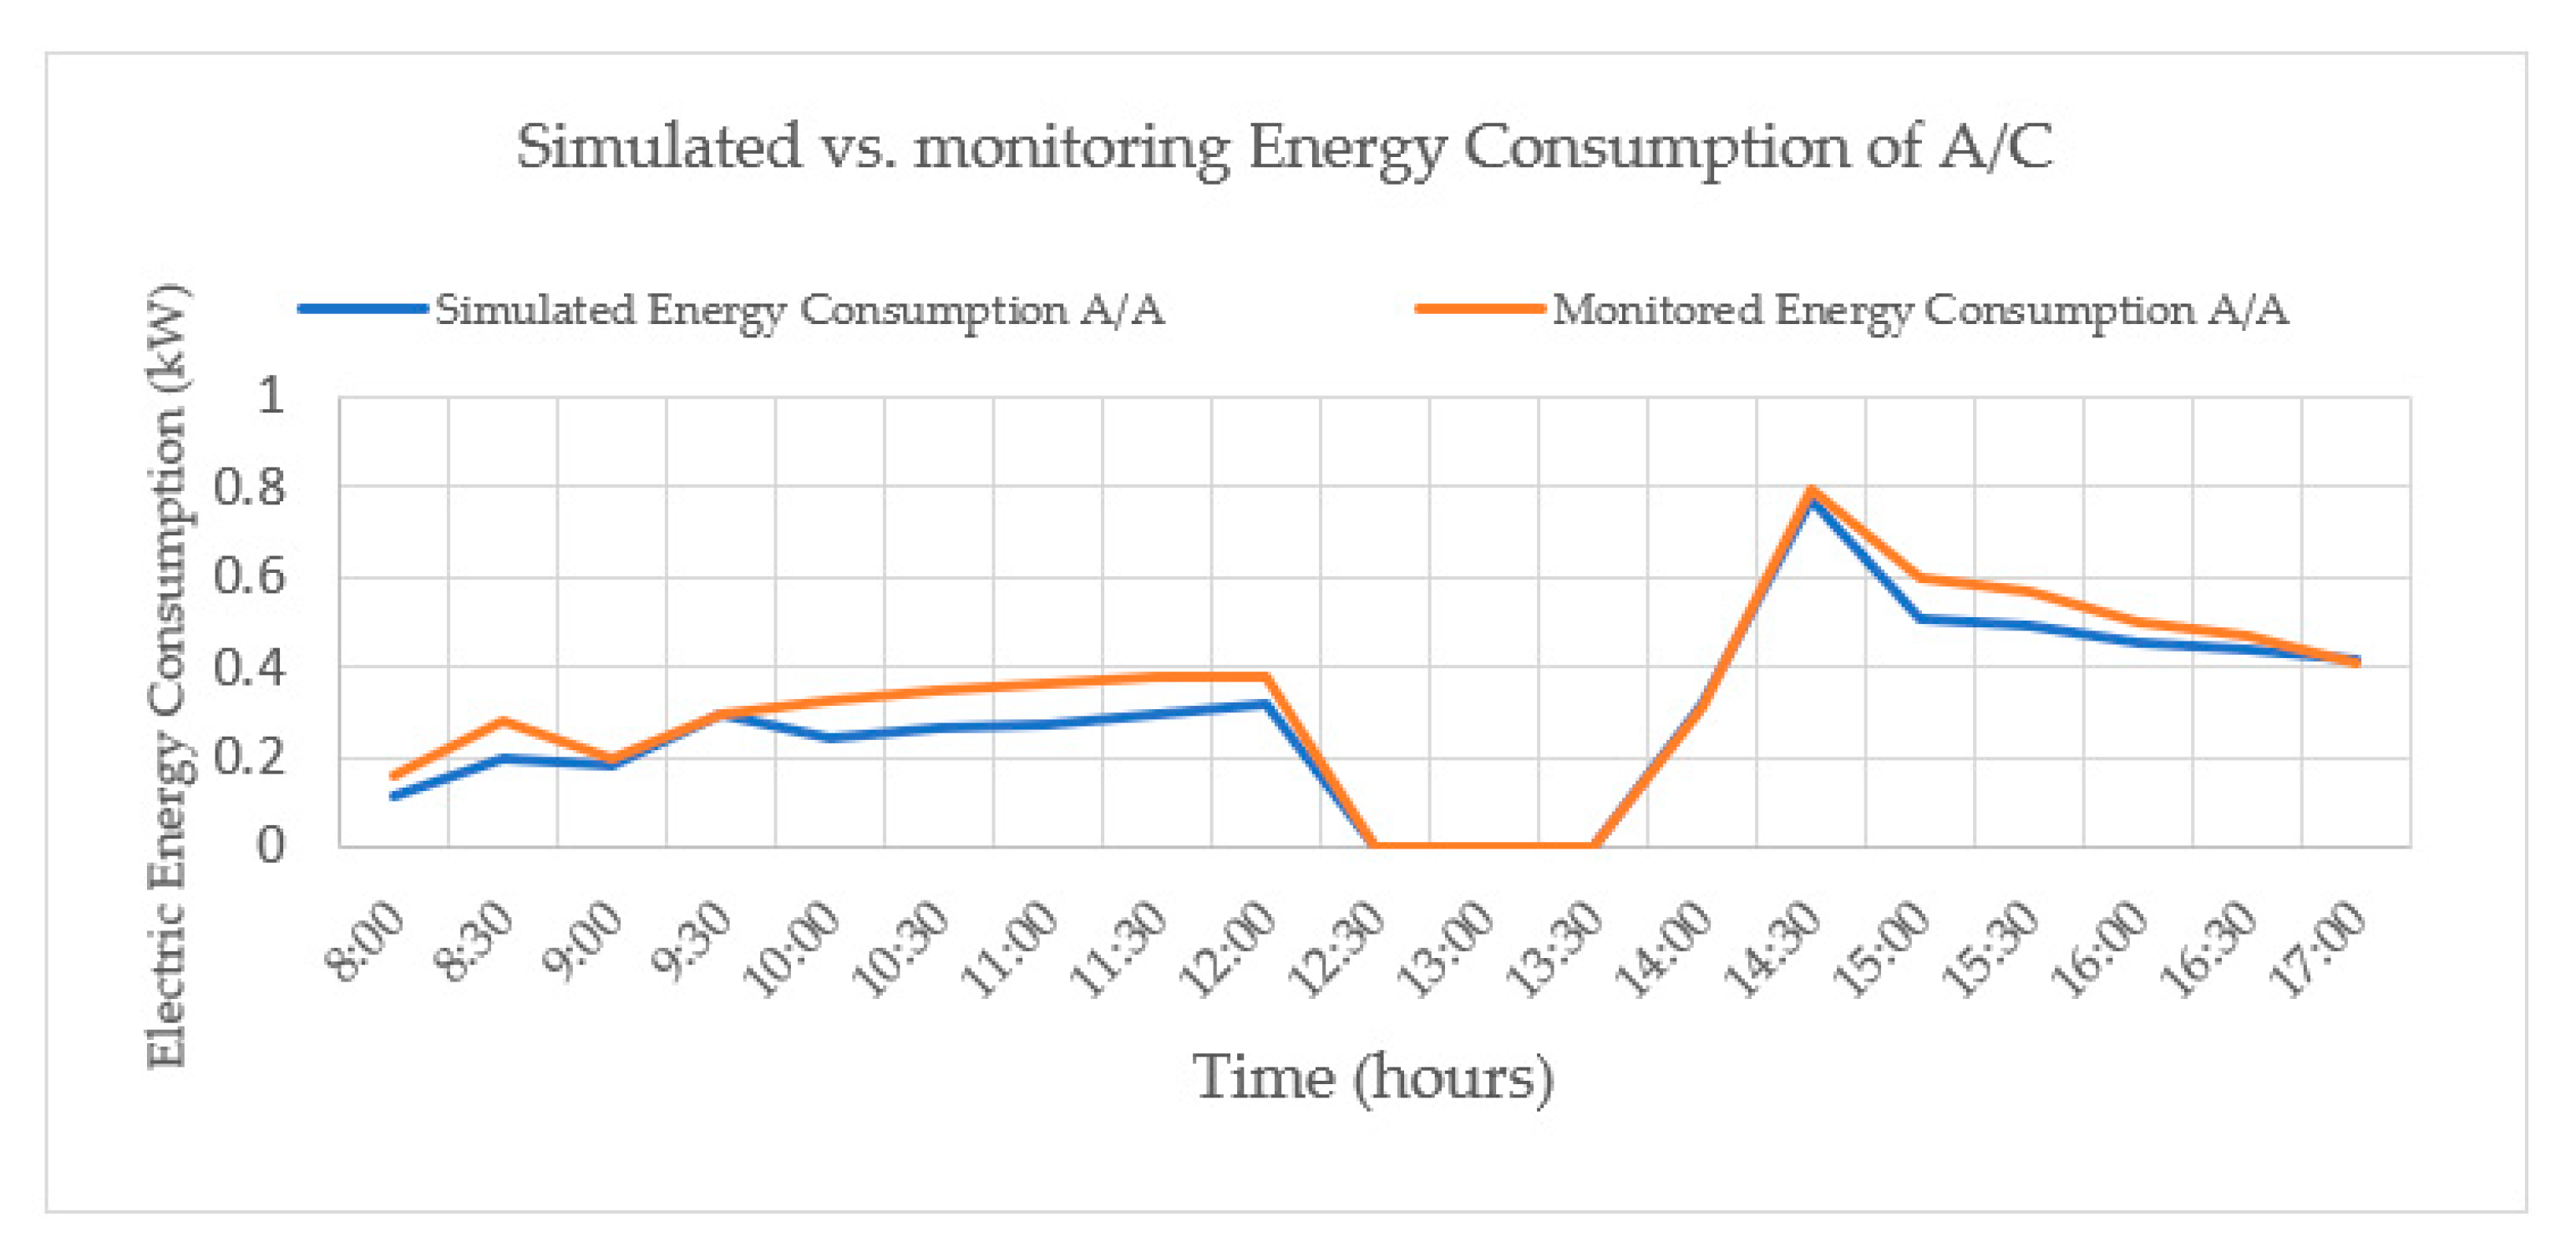
Energies 15 04715 sch015
Scheme 16. Simulated vs. monitoring energy consumption of the air conditioning units (A/C).
Energies 15 04715 sch016
Figure 7. Modeling in SketchUp of the F. Mancebo building.
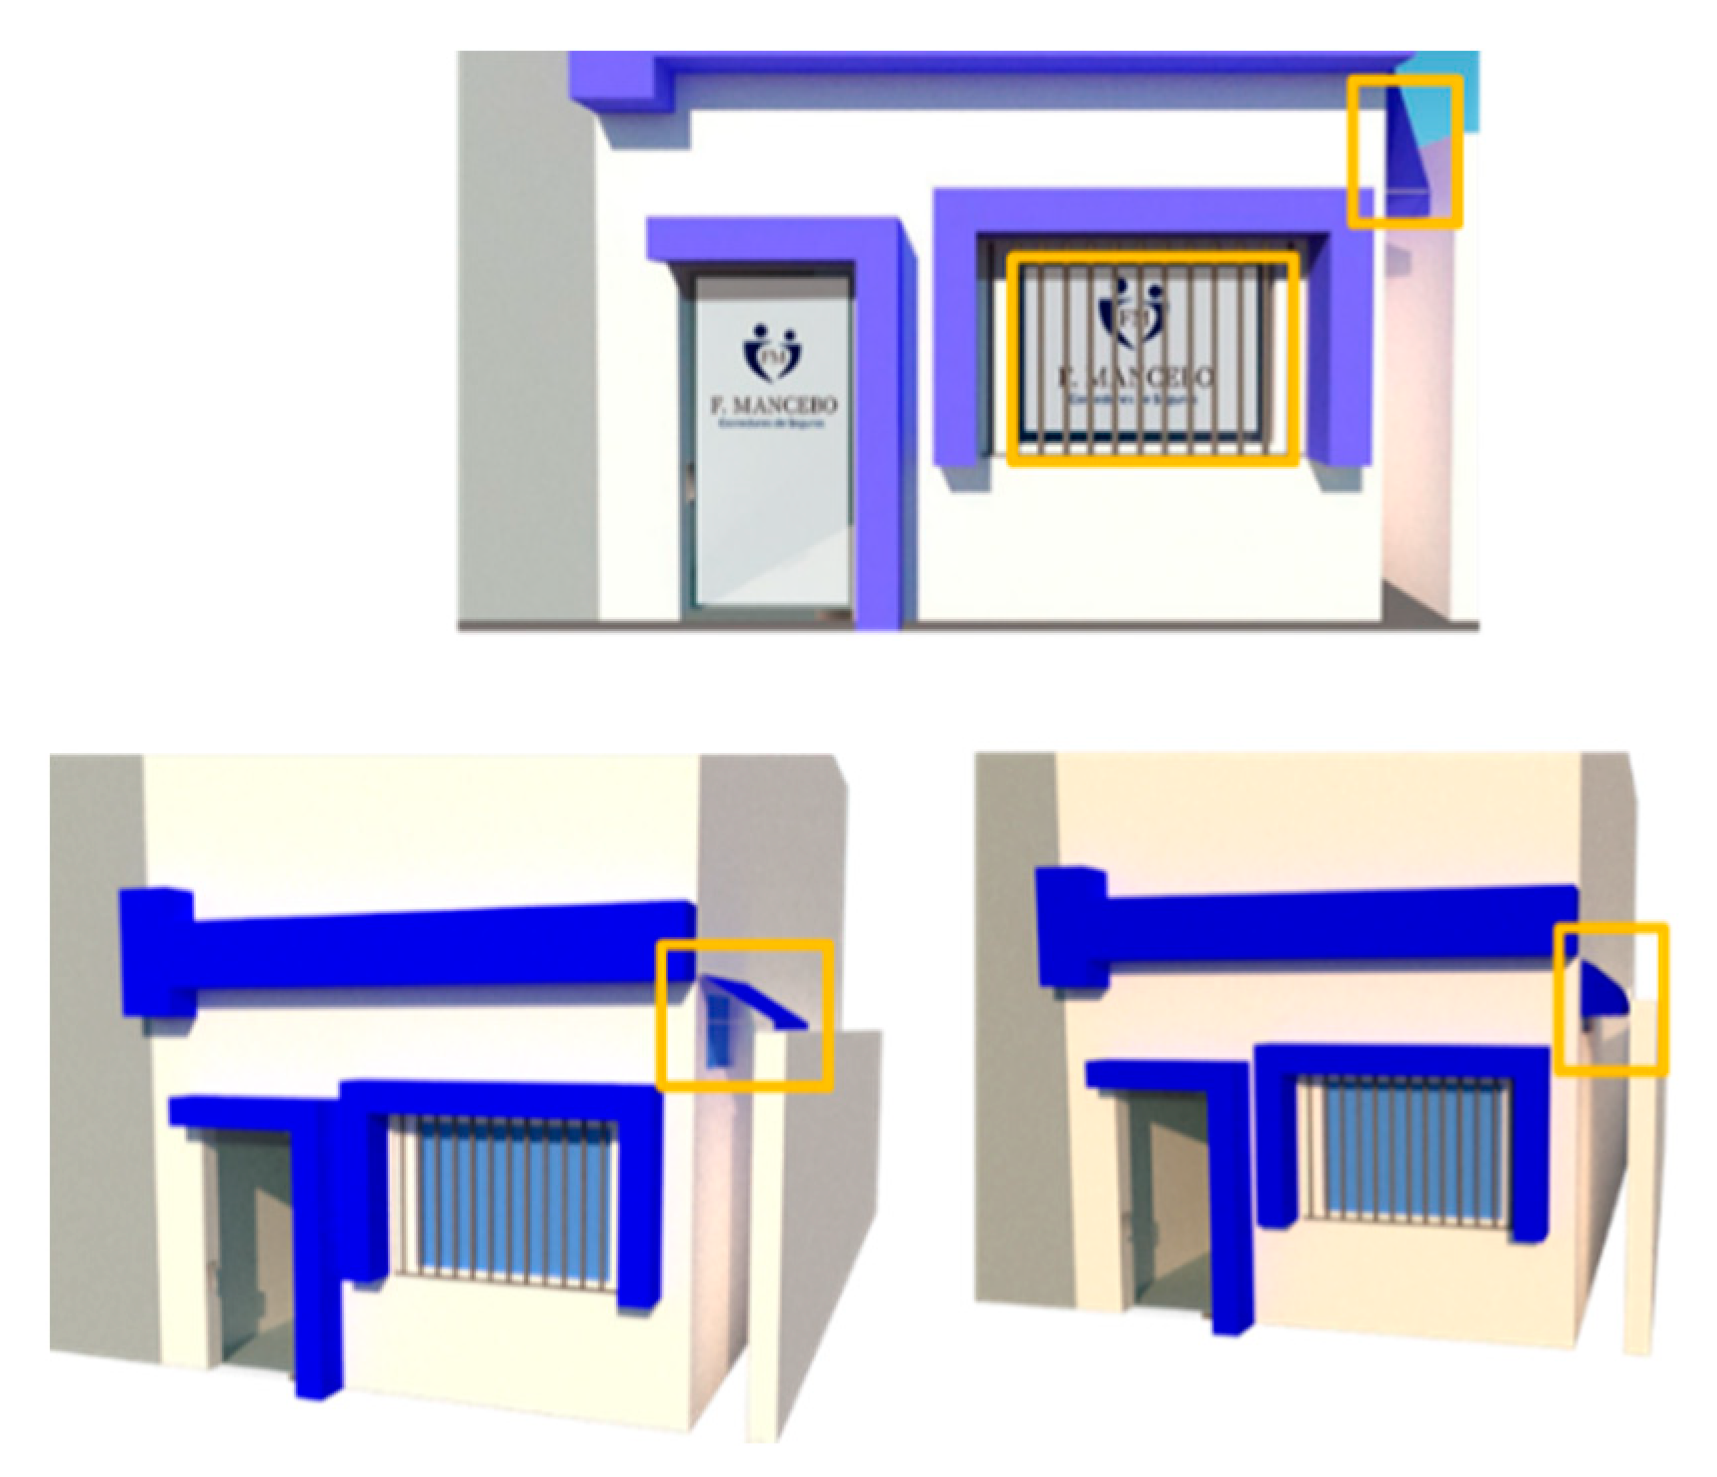
Energies 15 04715 g007
Figure 8. Modeling in SketchUp of the F. Mancebo building with the proposed strategies.
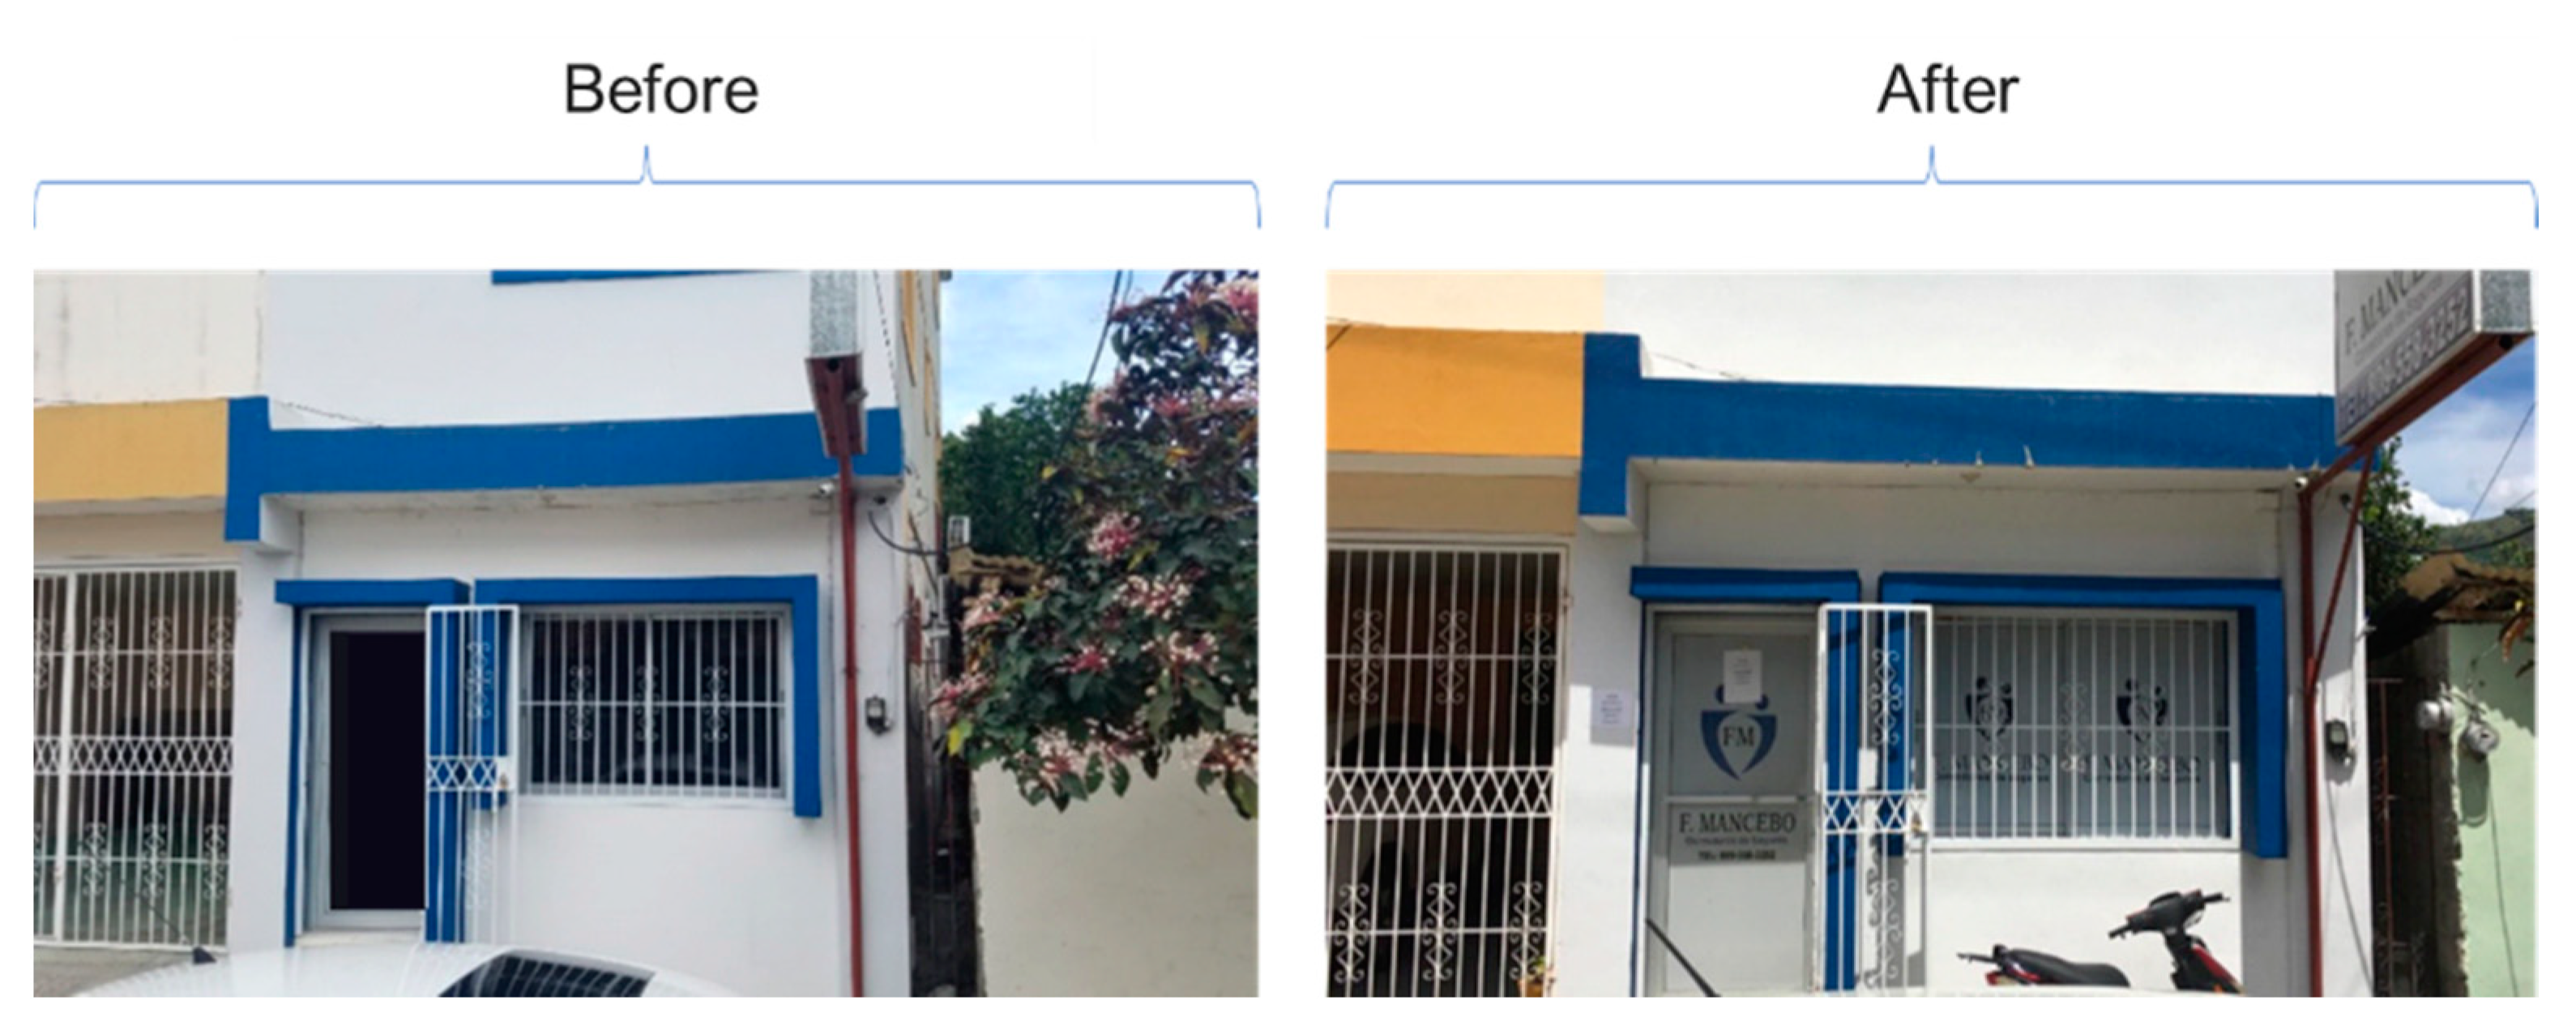
Energies 15 04715 g008
Figure 9. View of the F. Mancebo building before and after the energy efficiency strategies.
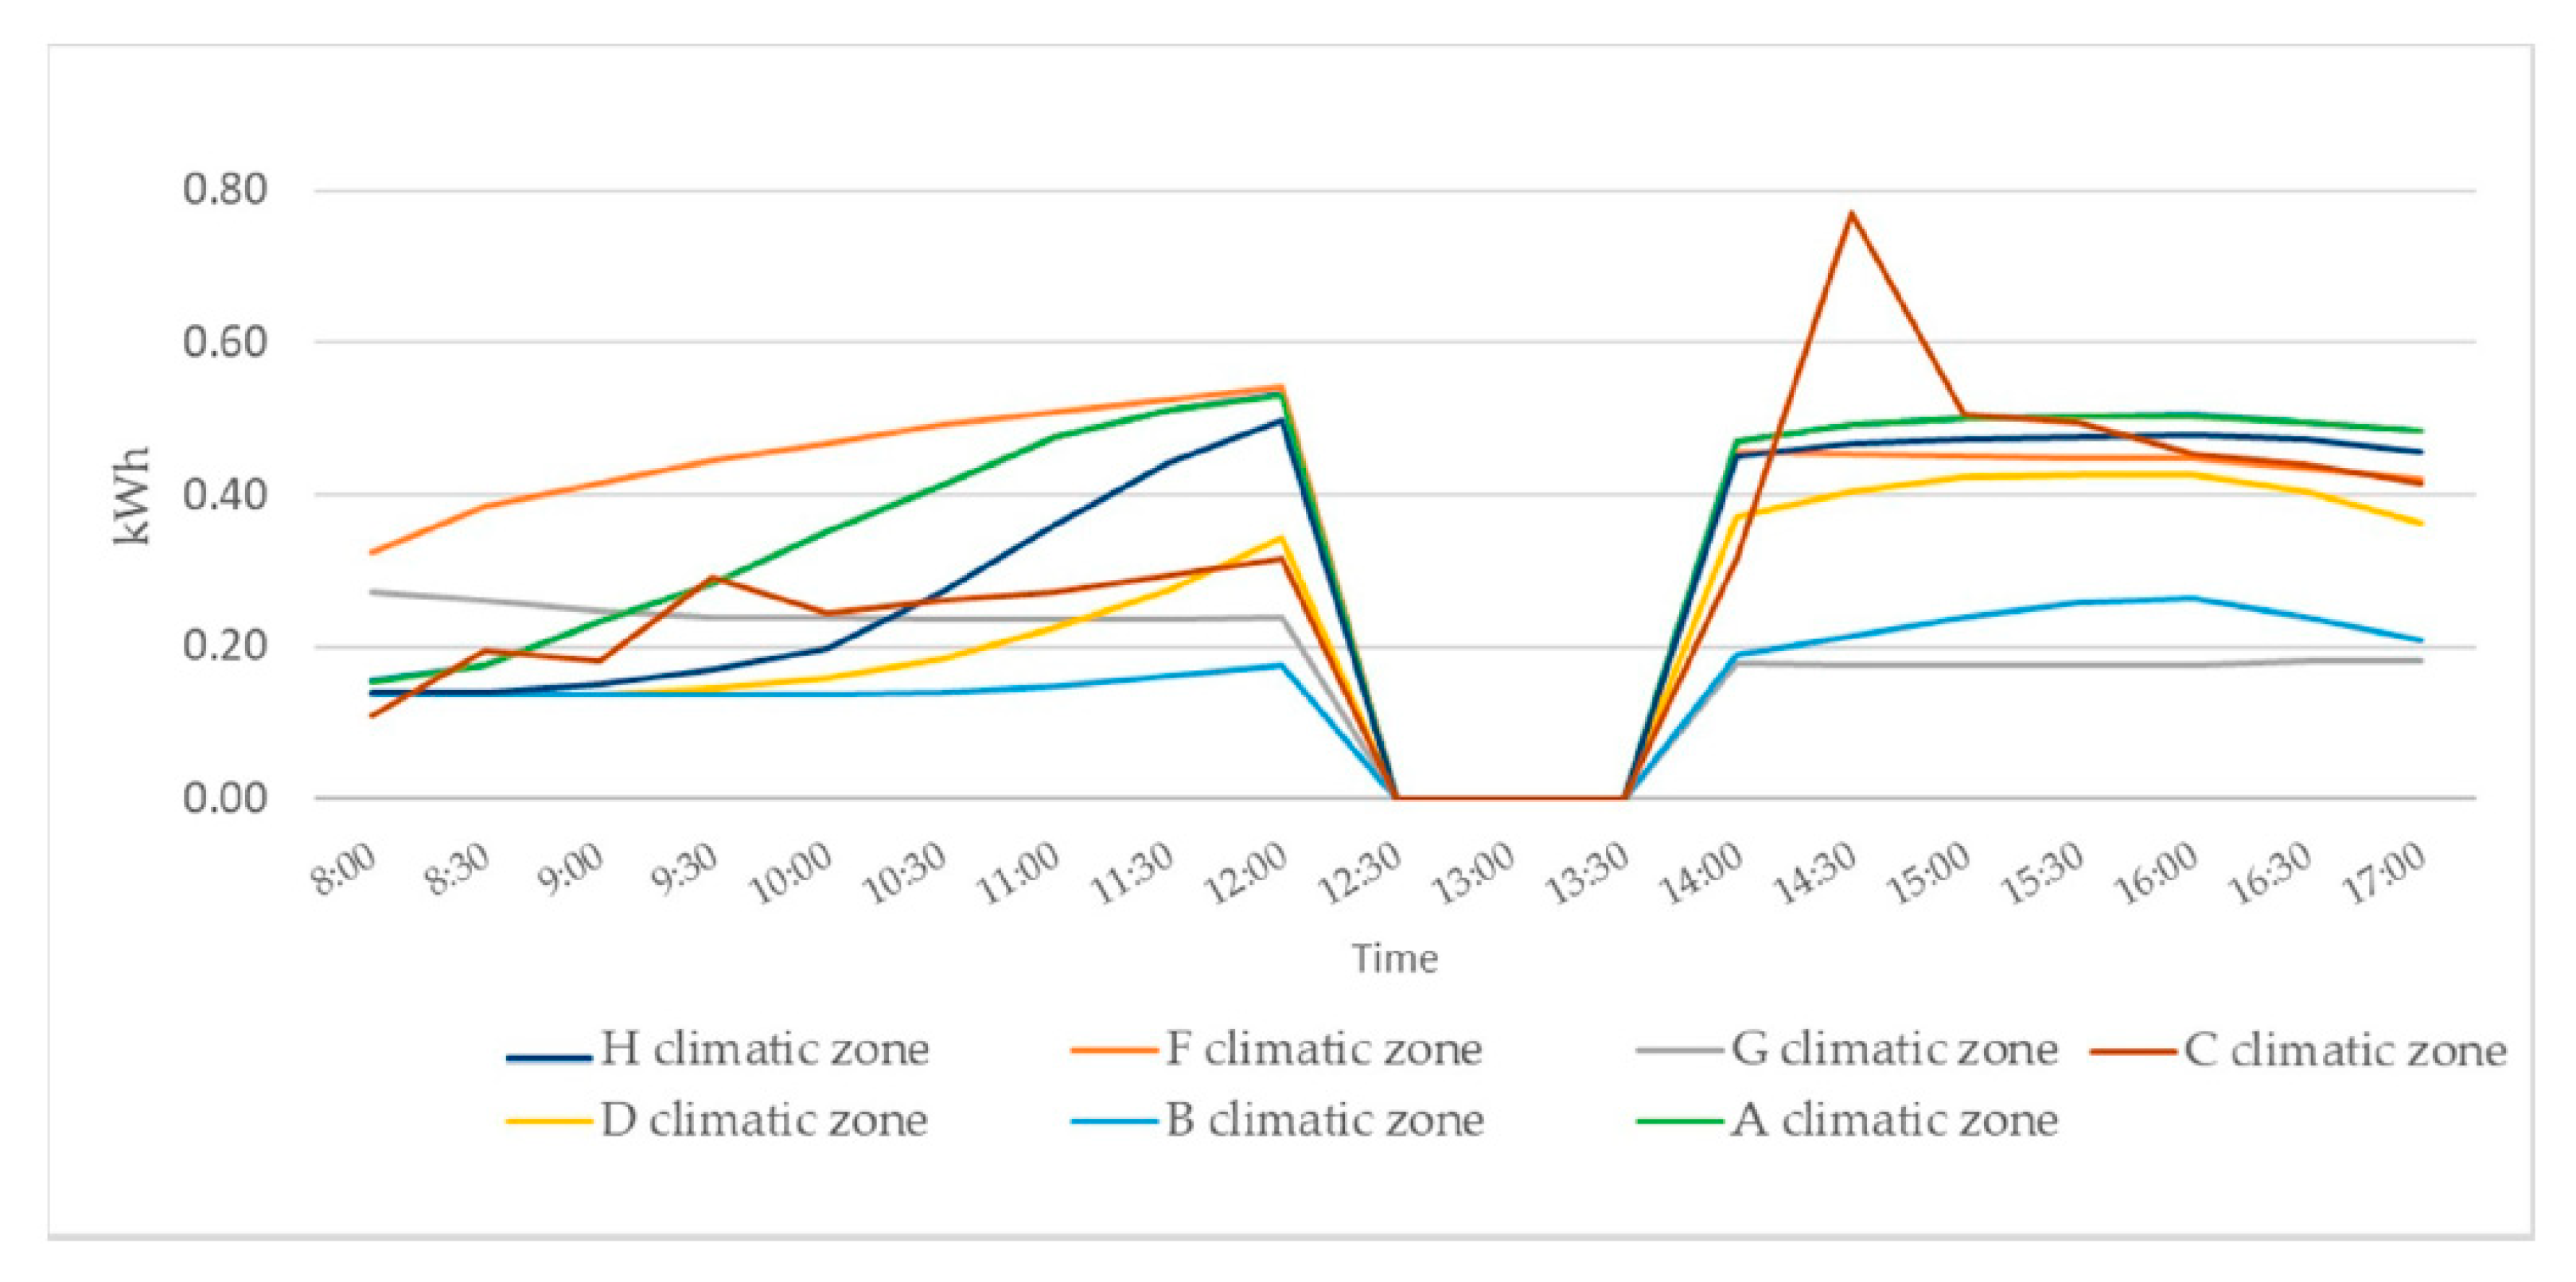
Energies 15 04715 g009
Scheme 17. Daily electricity consumption (kWh) of AC units in the F. Mancebo building in the eight different climatic zones of the DR, before implantation of EESs E.
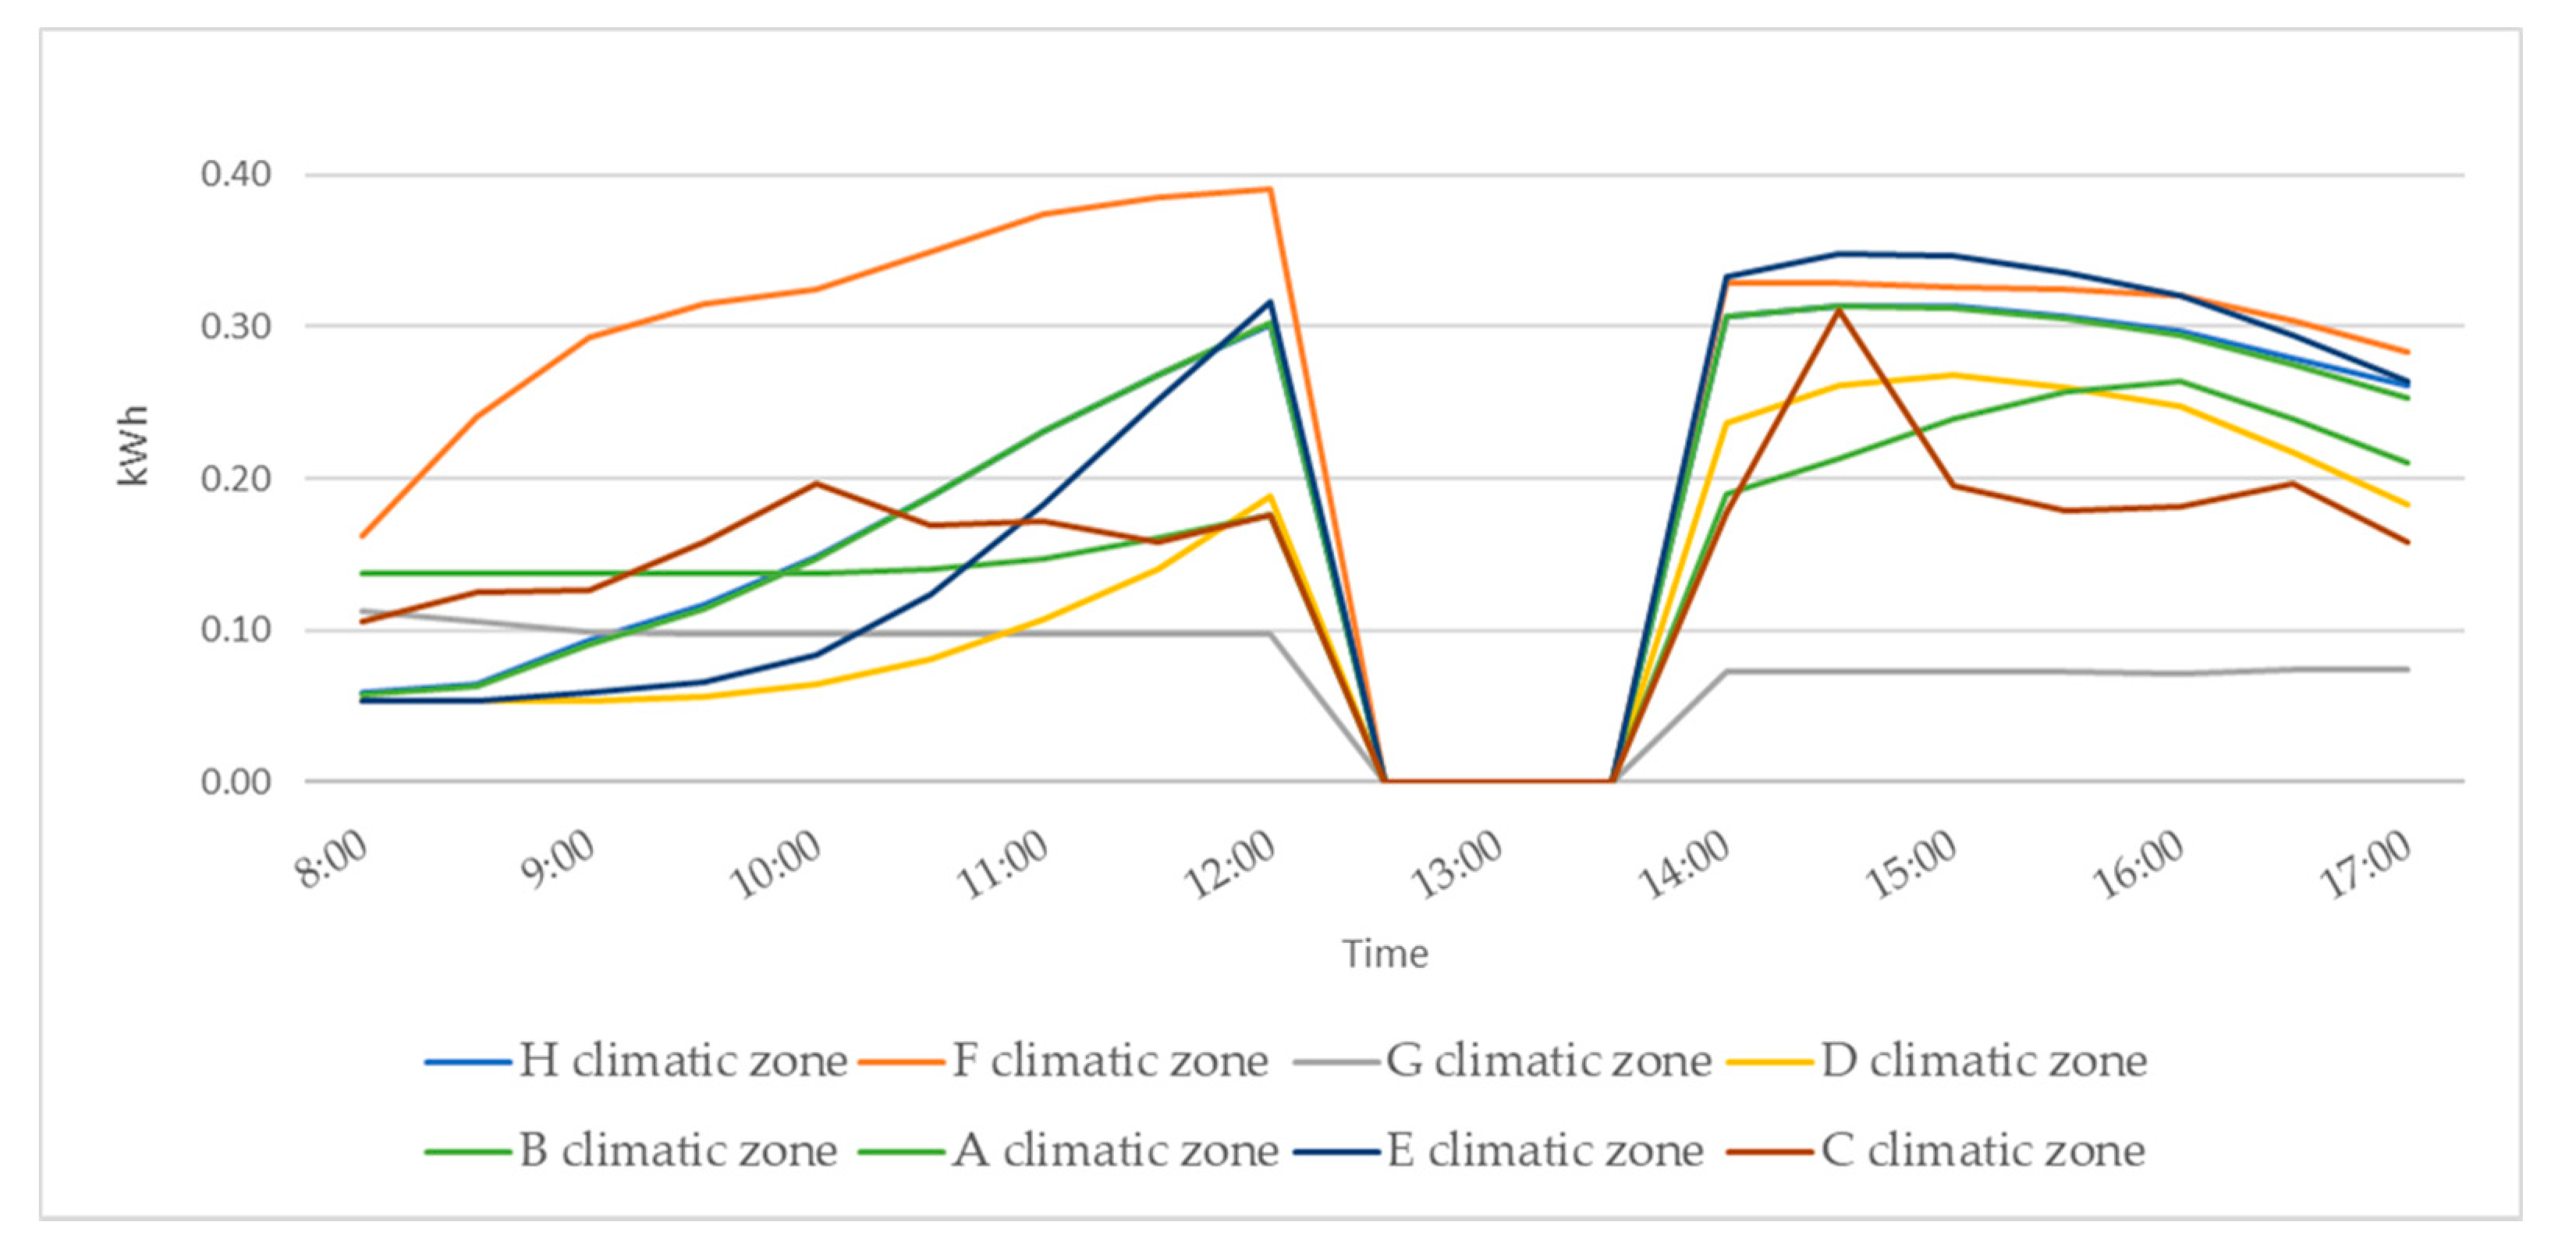
Energies 15 04715 sch017
Scheme 18. Daily electricity consumption (kWh) of AC units of the F. Mancebo building in the eight different climatic zones of the DR, after implementation of EESs.
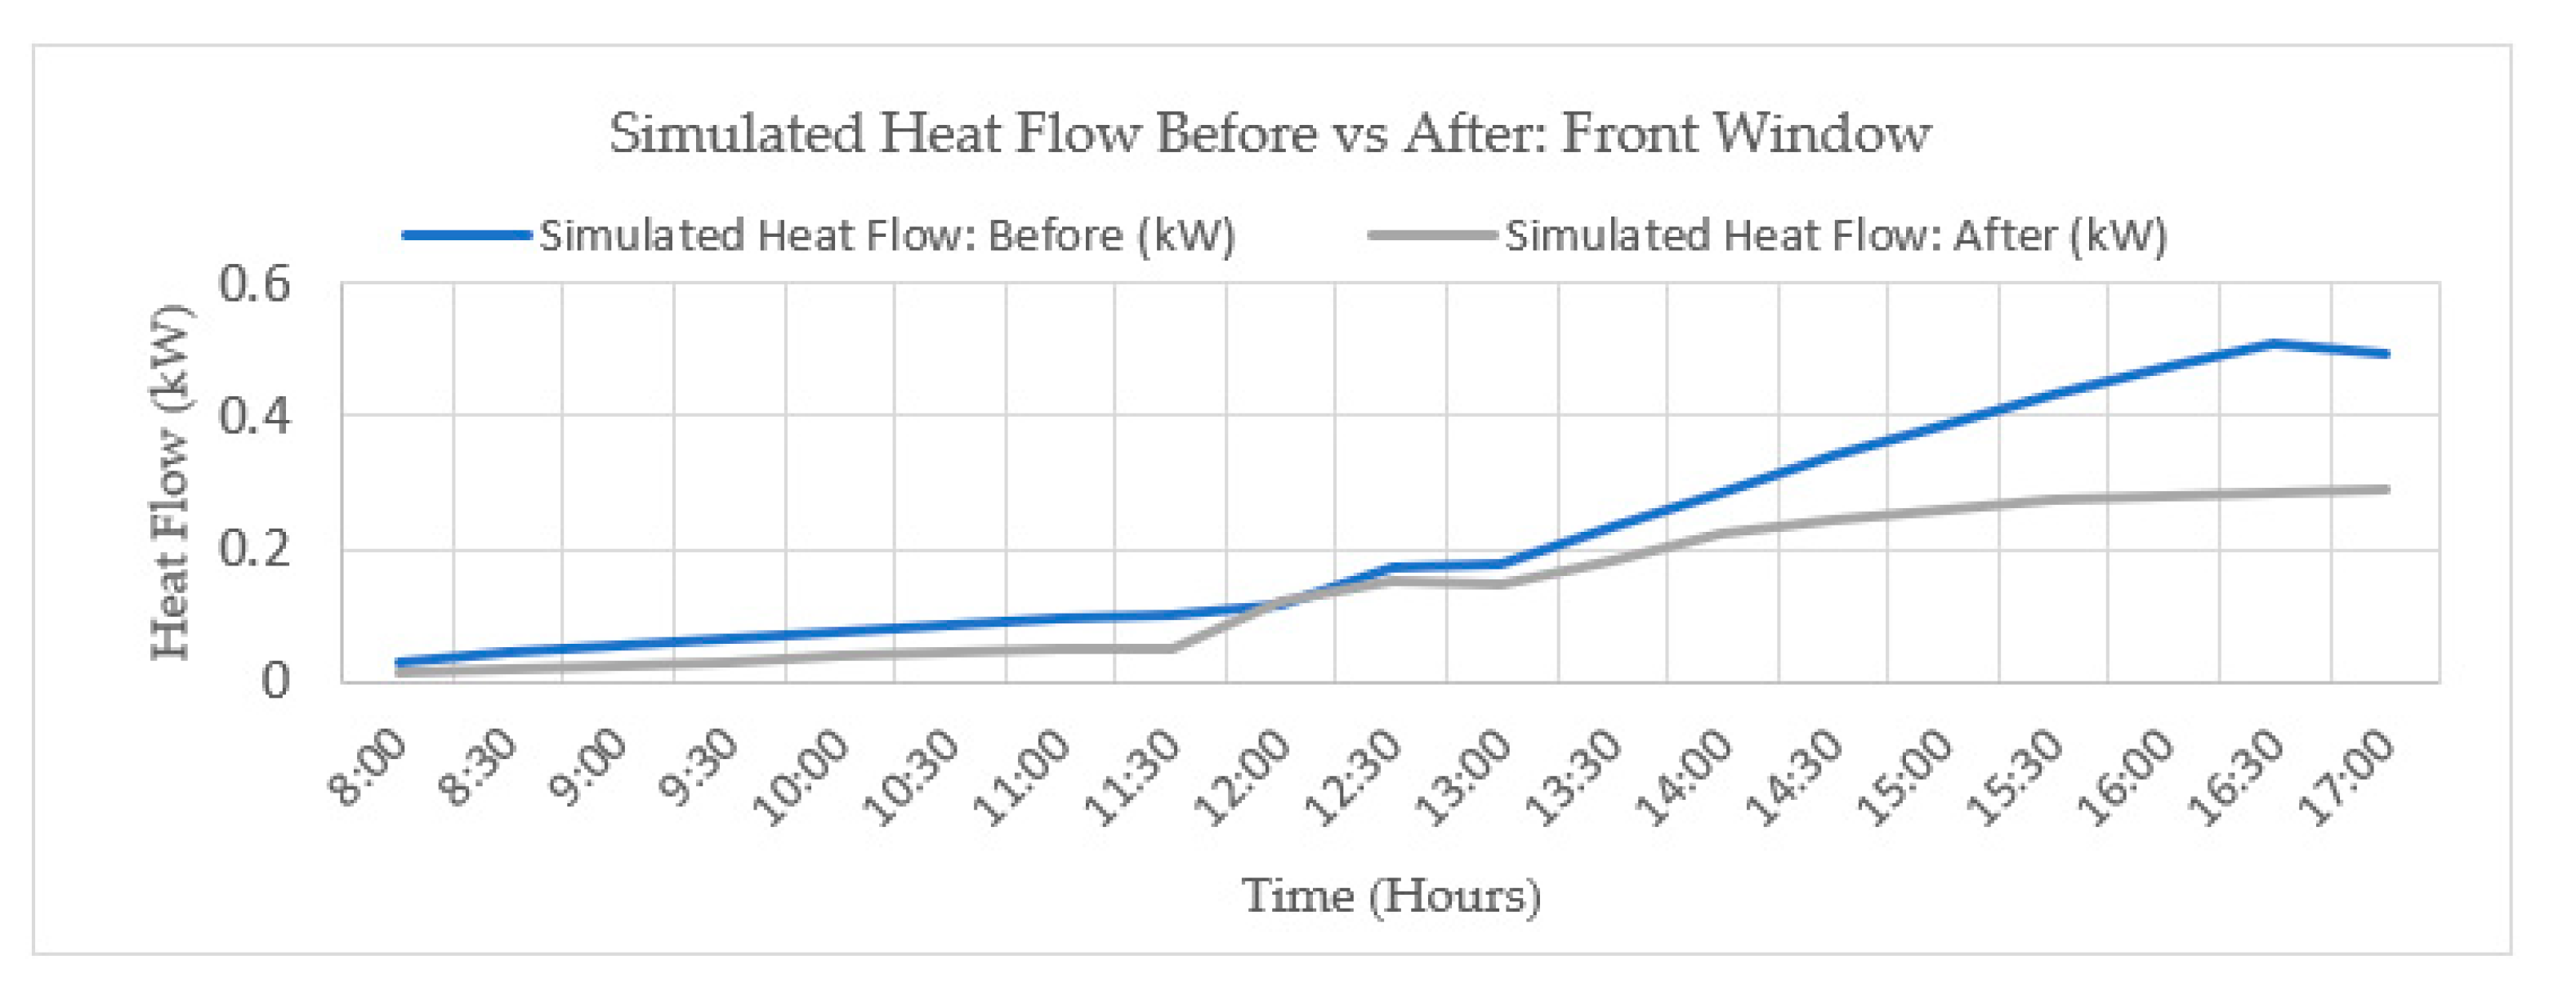
Energies 15 04715 sch018
Scheme 19. Comparison of the simulation of the heat flows in the front window before and after the implementation of the strategies for a typical day.
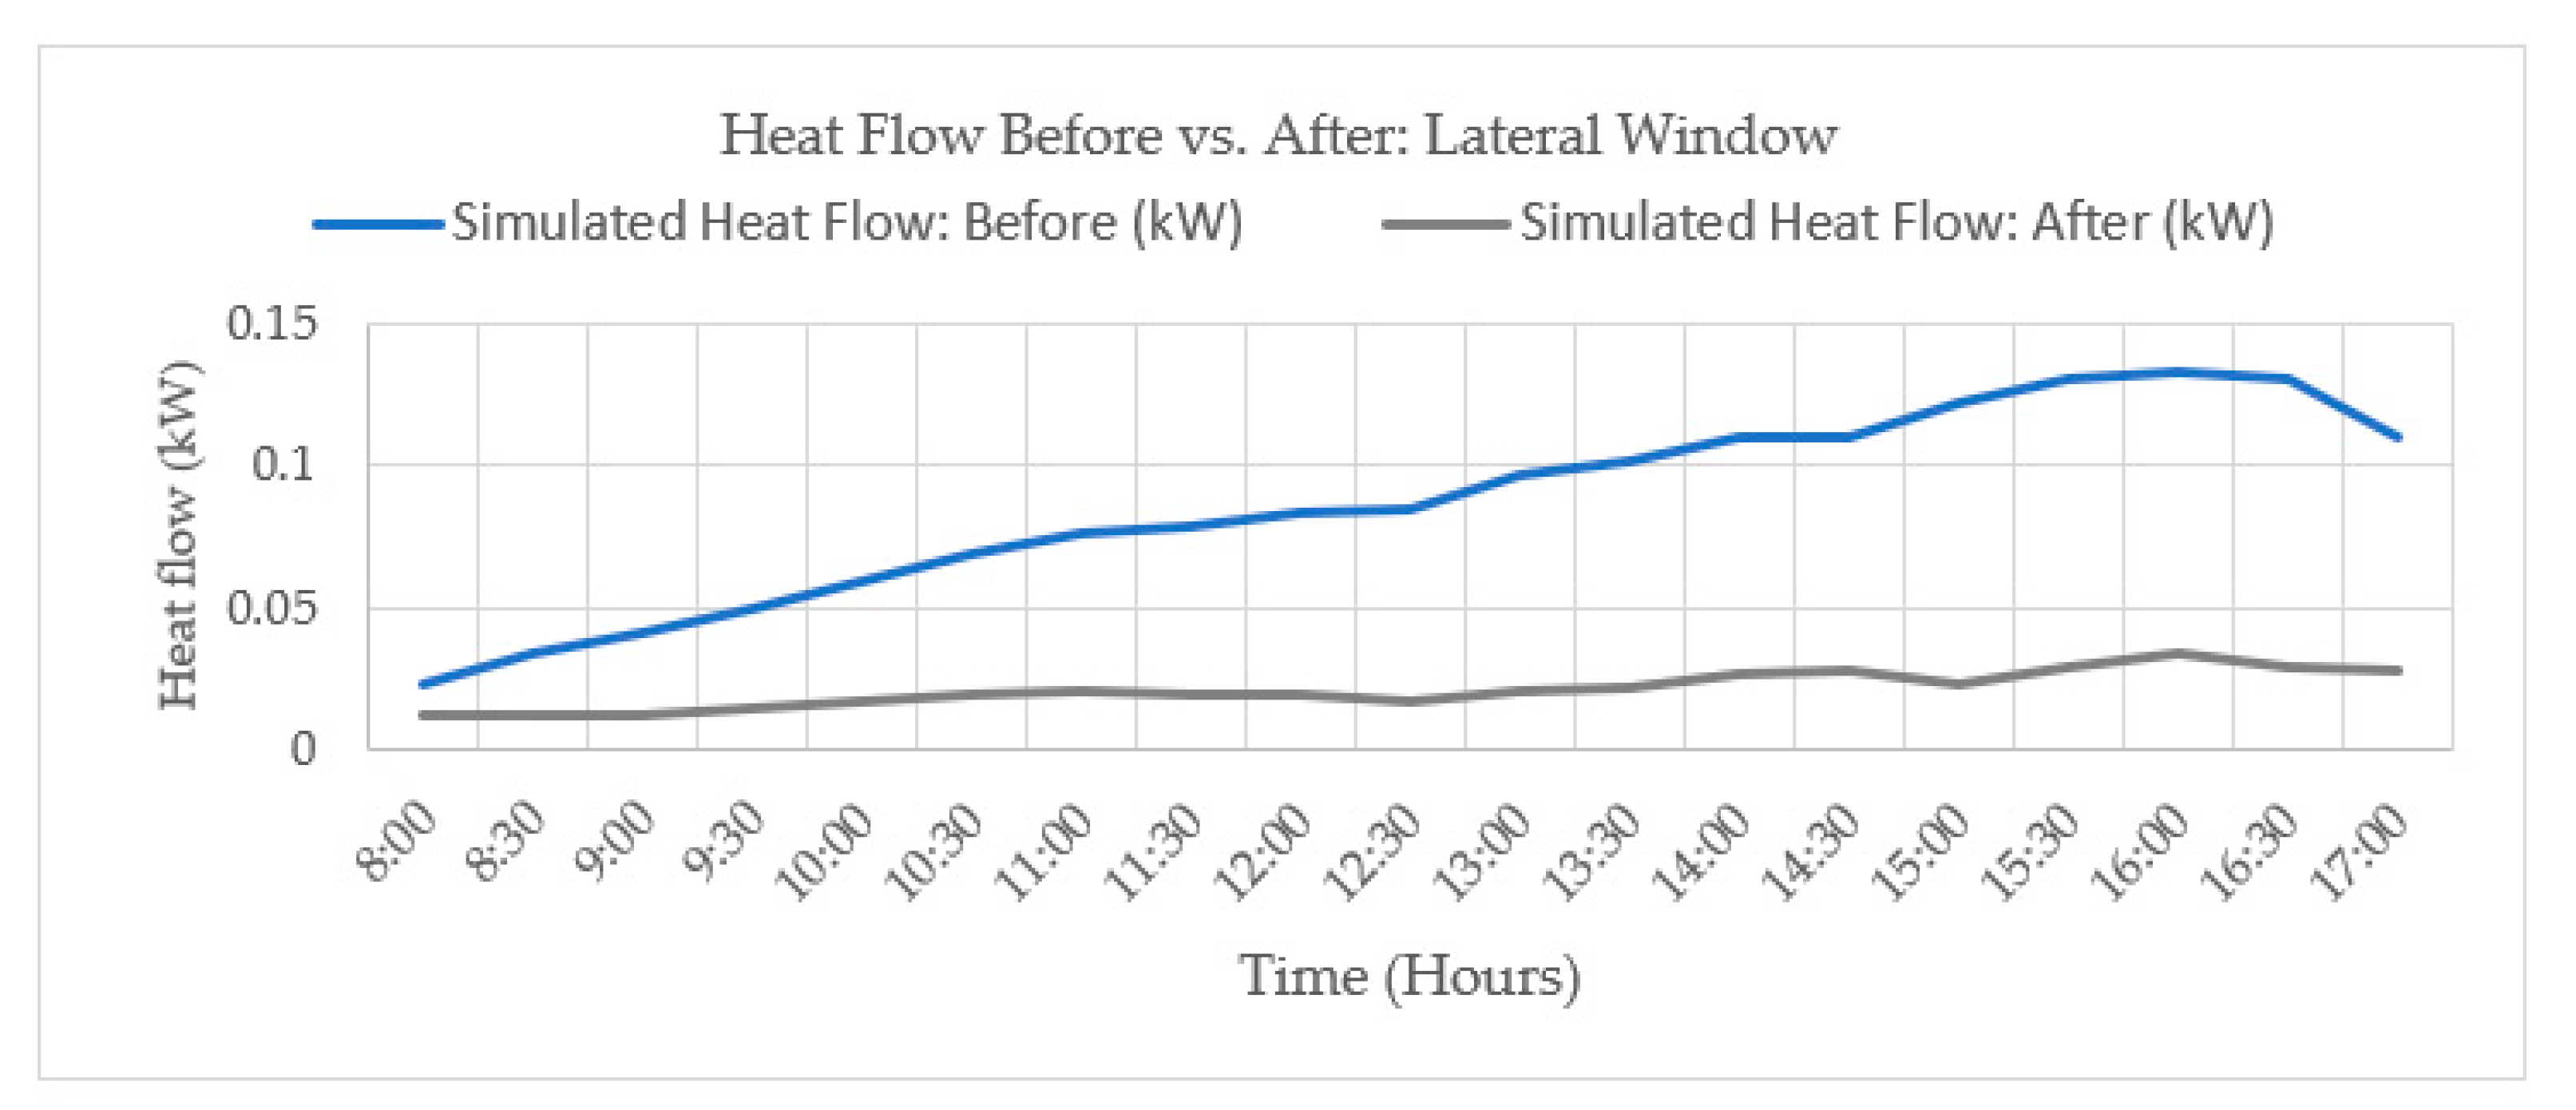
Energies 15 04715 sch019
Scheme 20. Comparison of the heat flow simulation in the lateral window before and after the implementation of F strategy for a typical day.
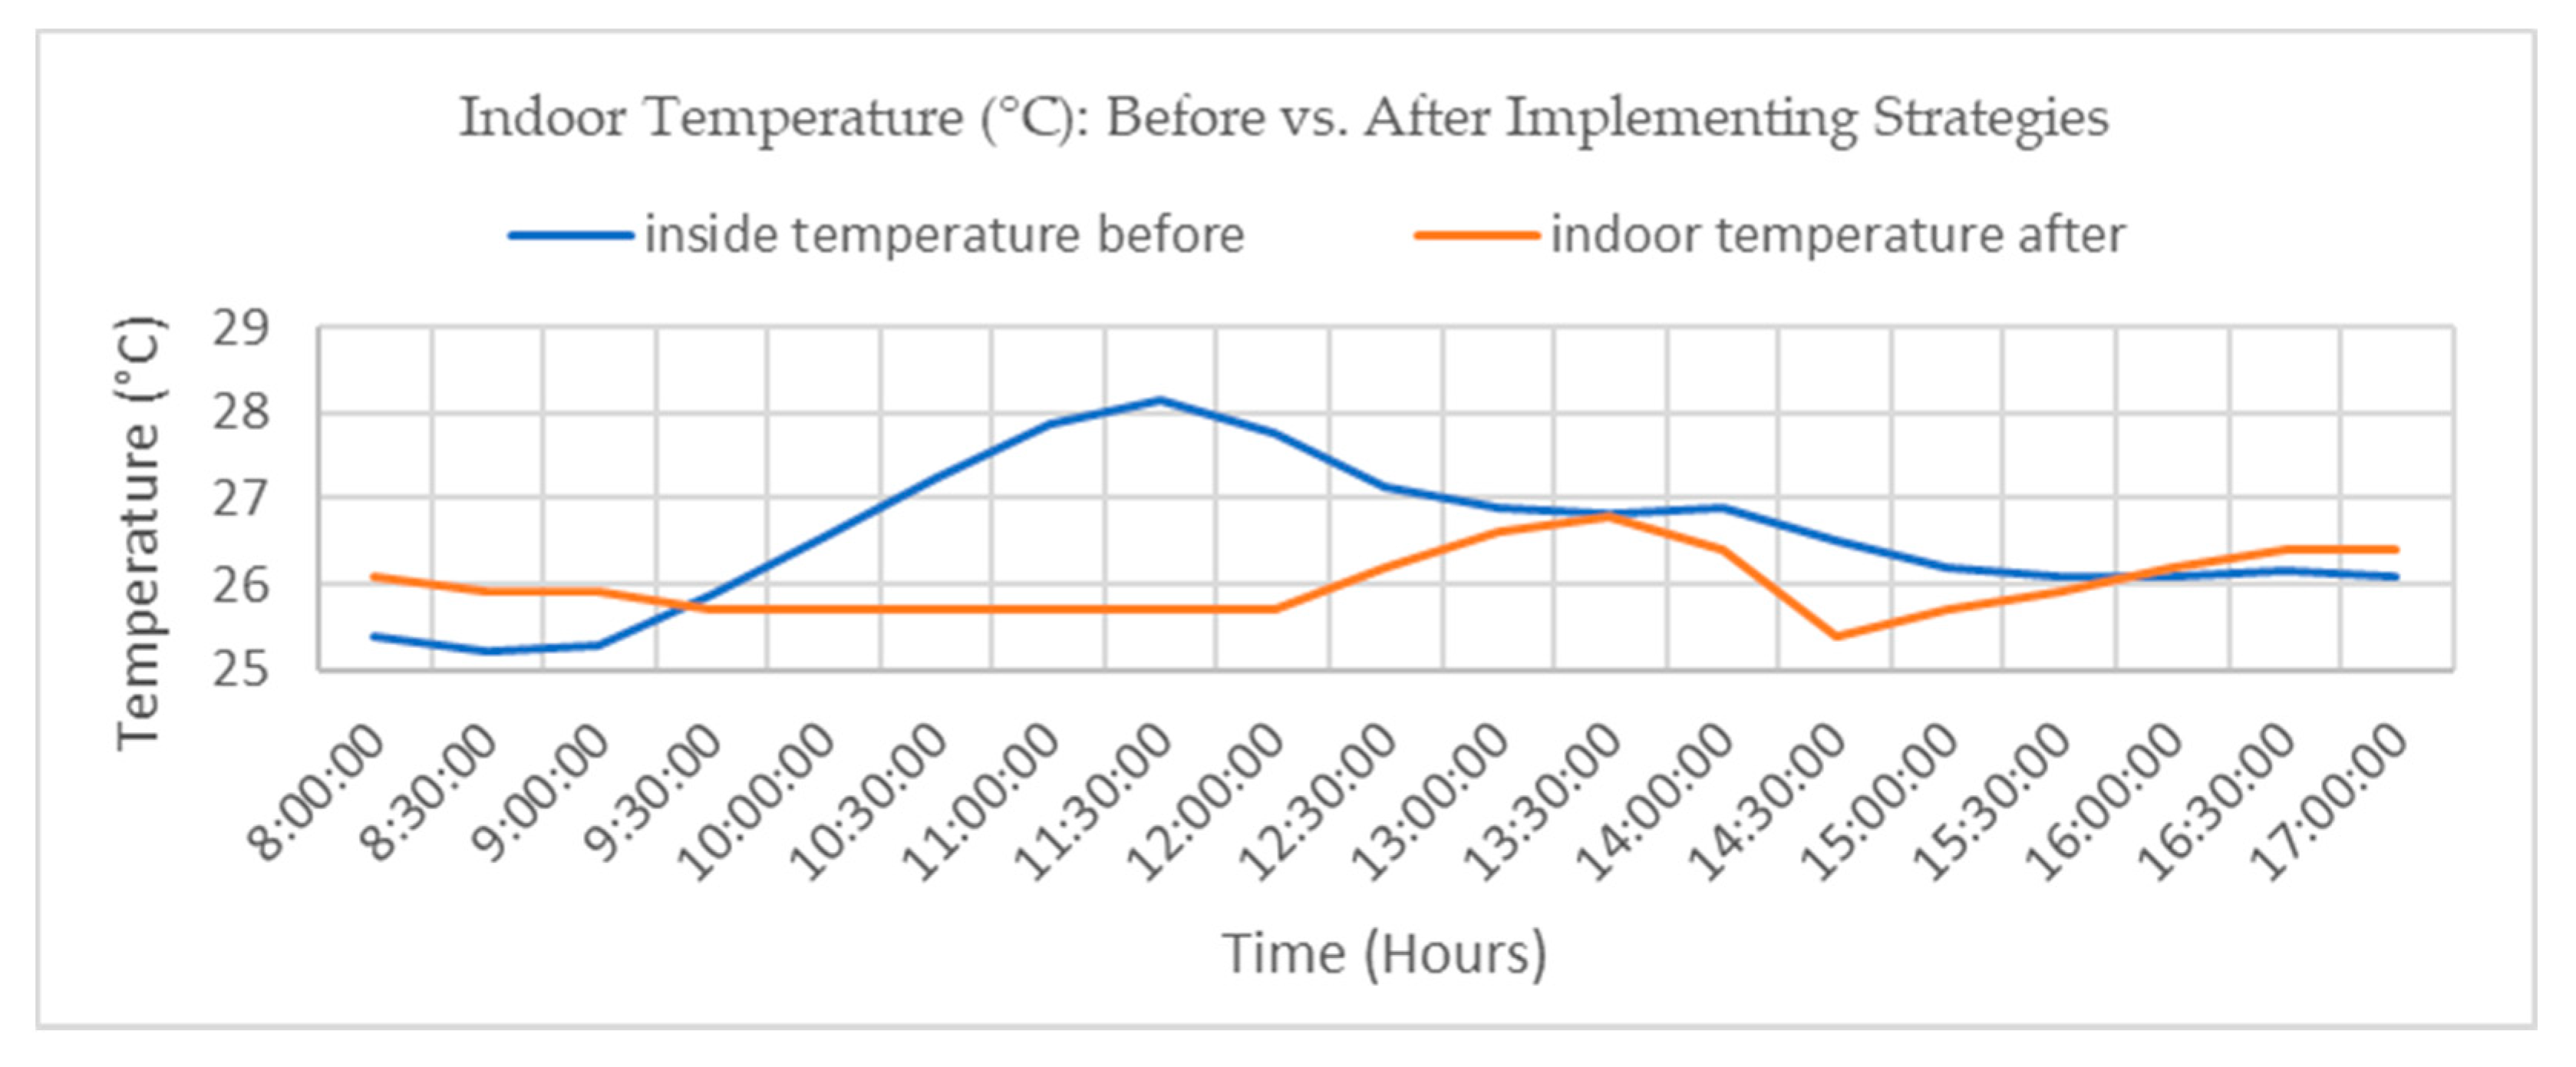
Energies 15 04715 sch020
Scheme 21. Temperatures inside the building before and after the efficiency strategies for a typical day.
Energies 15 04715 sch021
Scheme 22. Relative humidity inside the building before and after the energy efficiency strategies for a typical day.
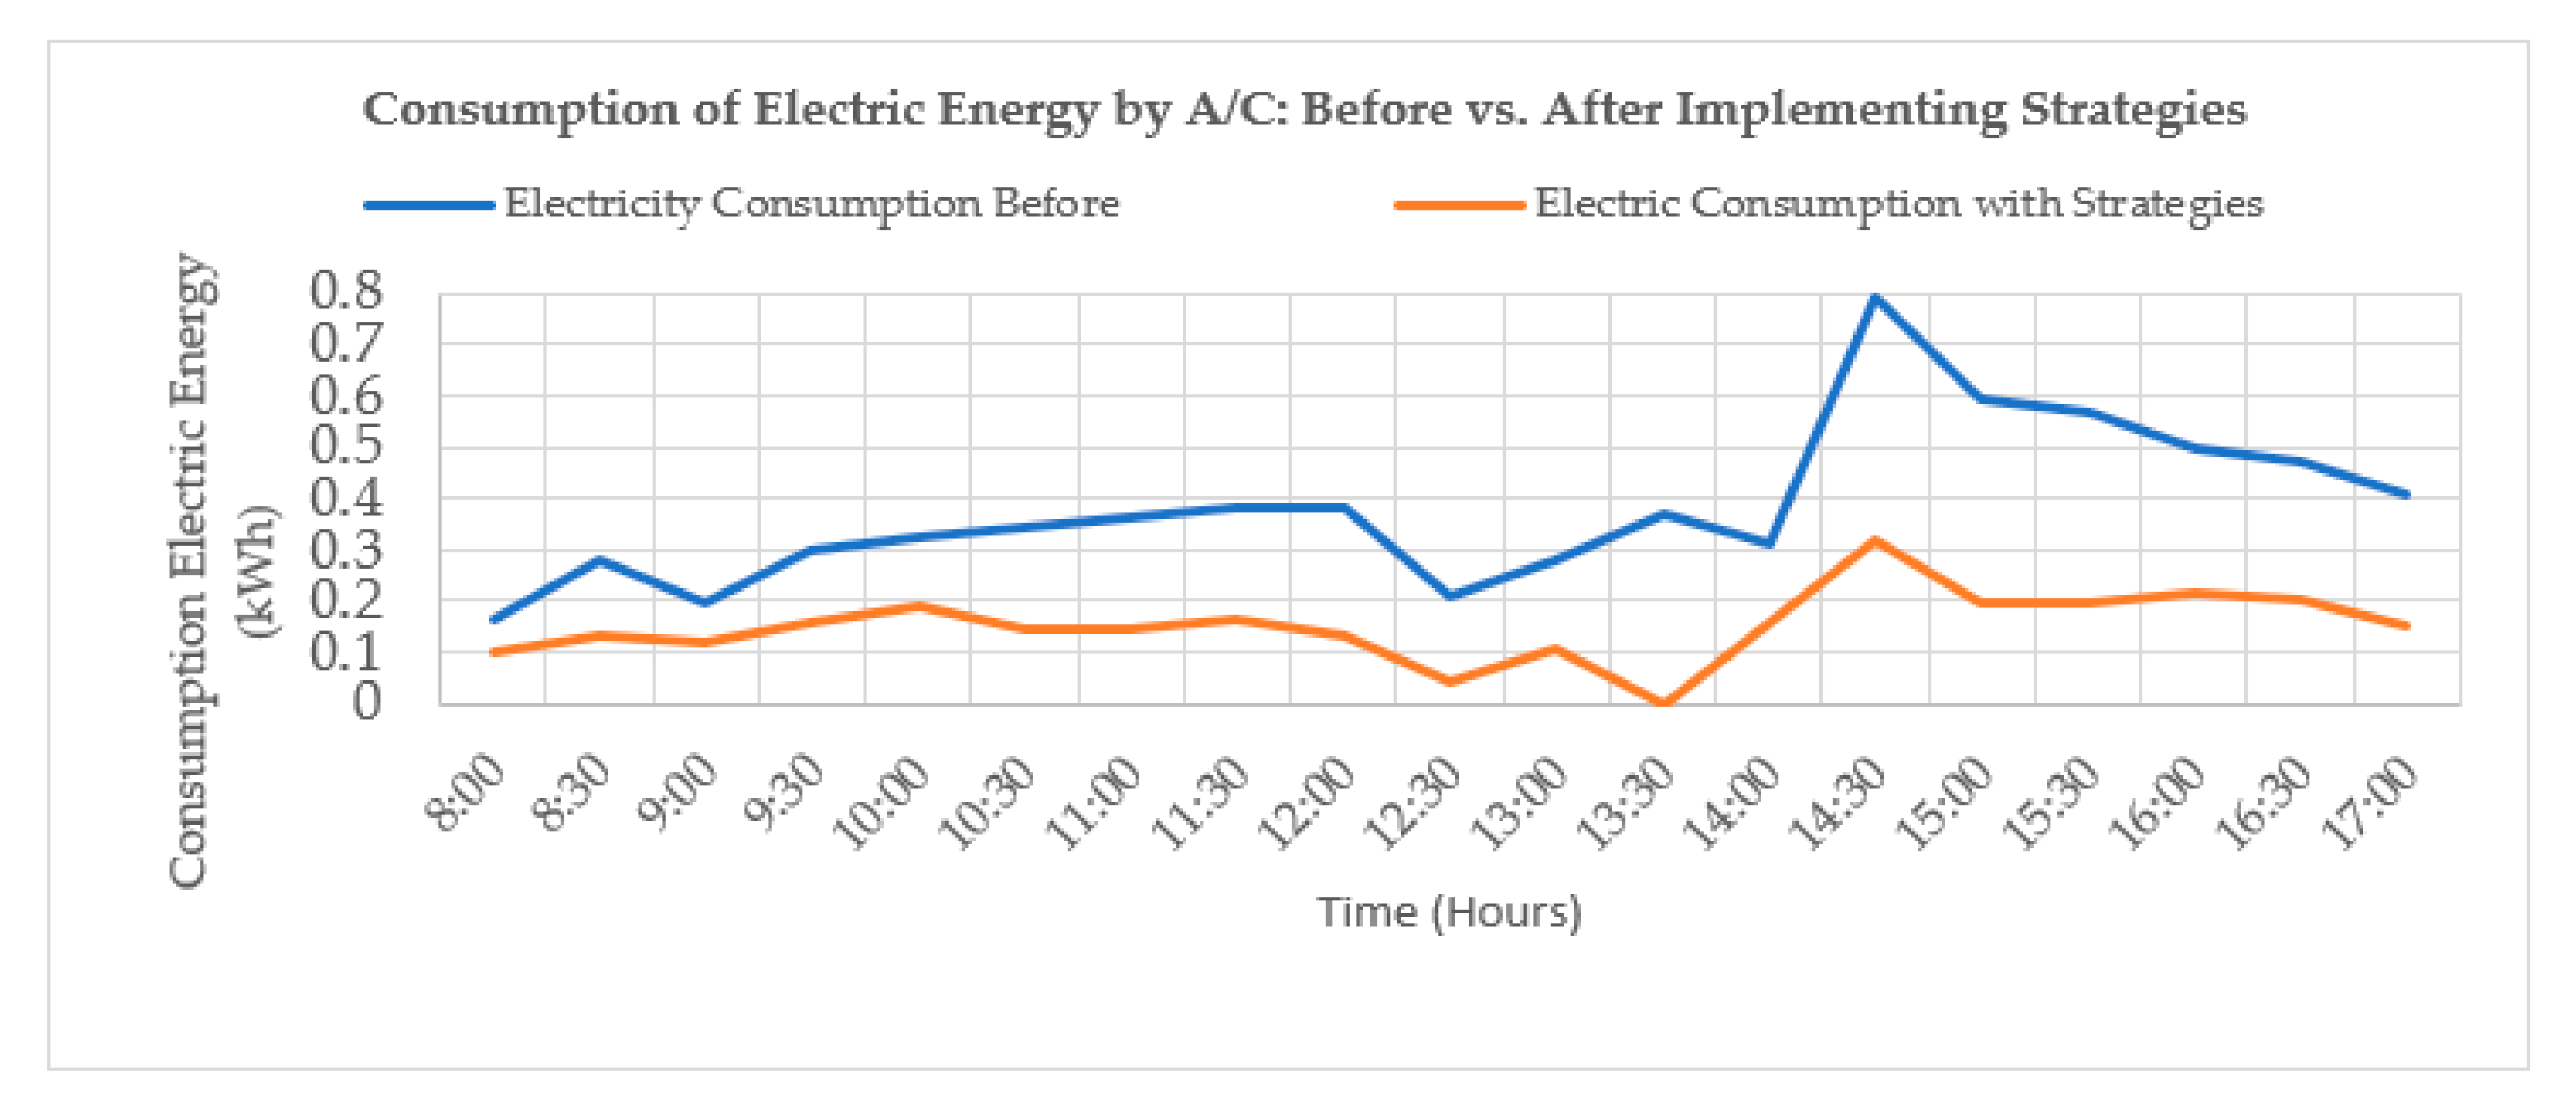
Energies 15 04715 sch022
Scheme 23. Simulated and monitored consumption of electric energy by the A/C before and after the energy efficiency strategies.
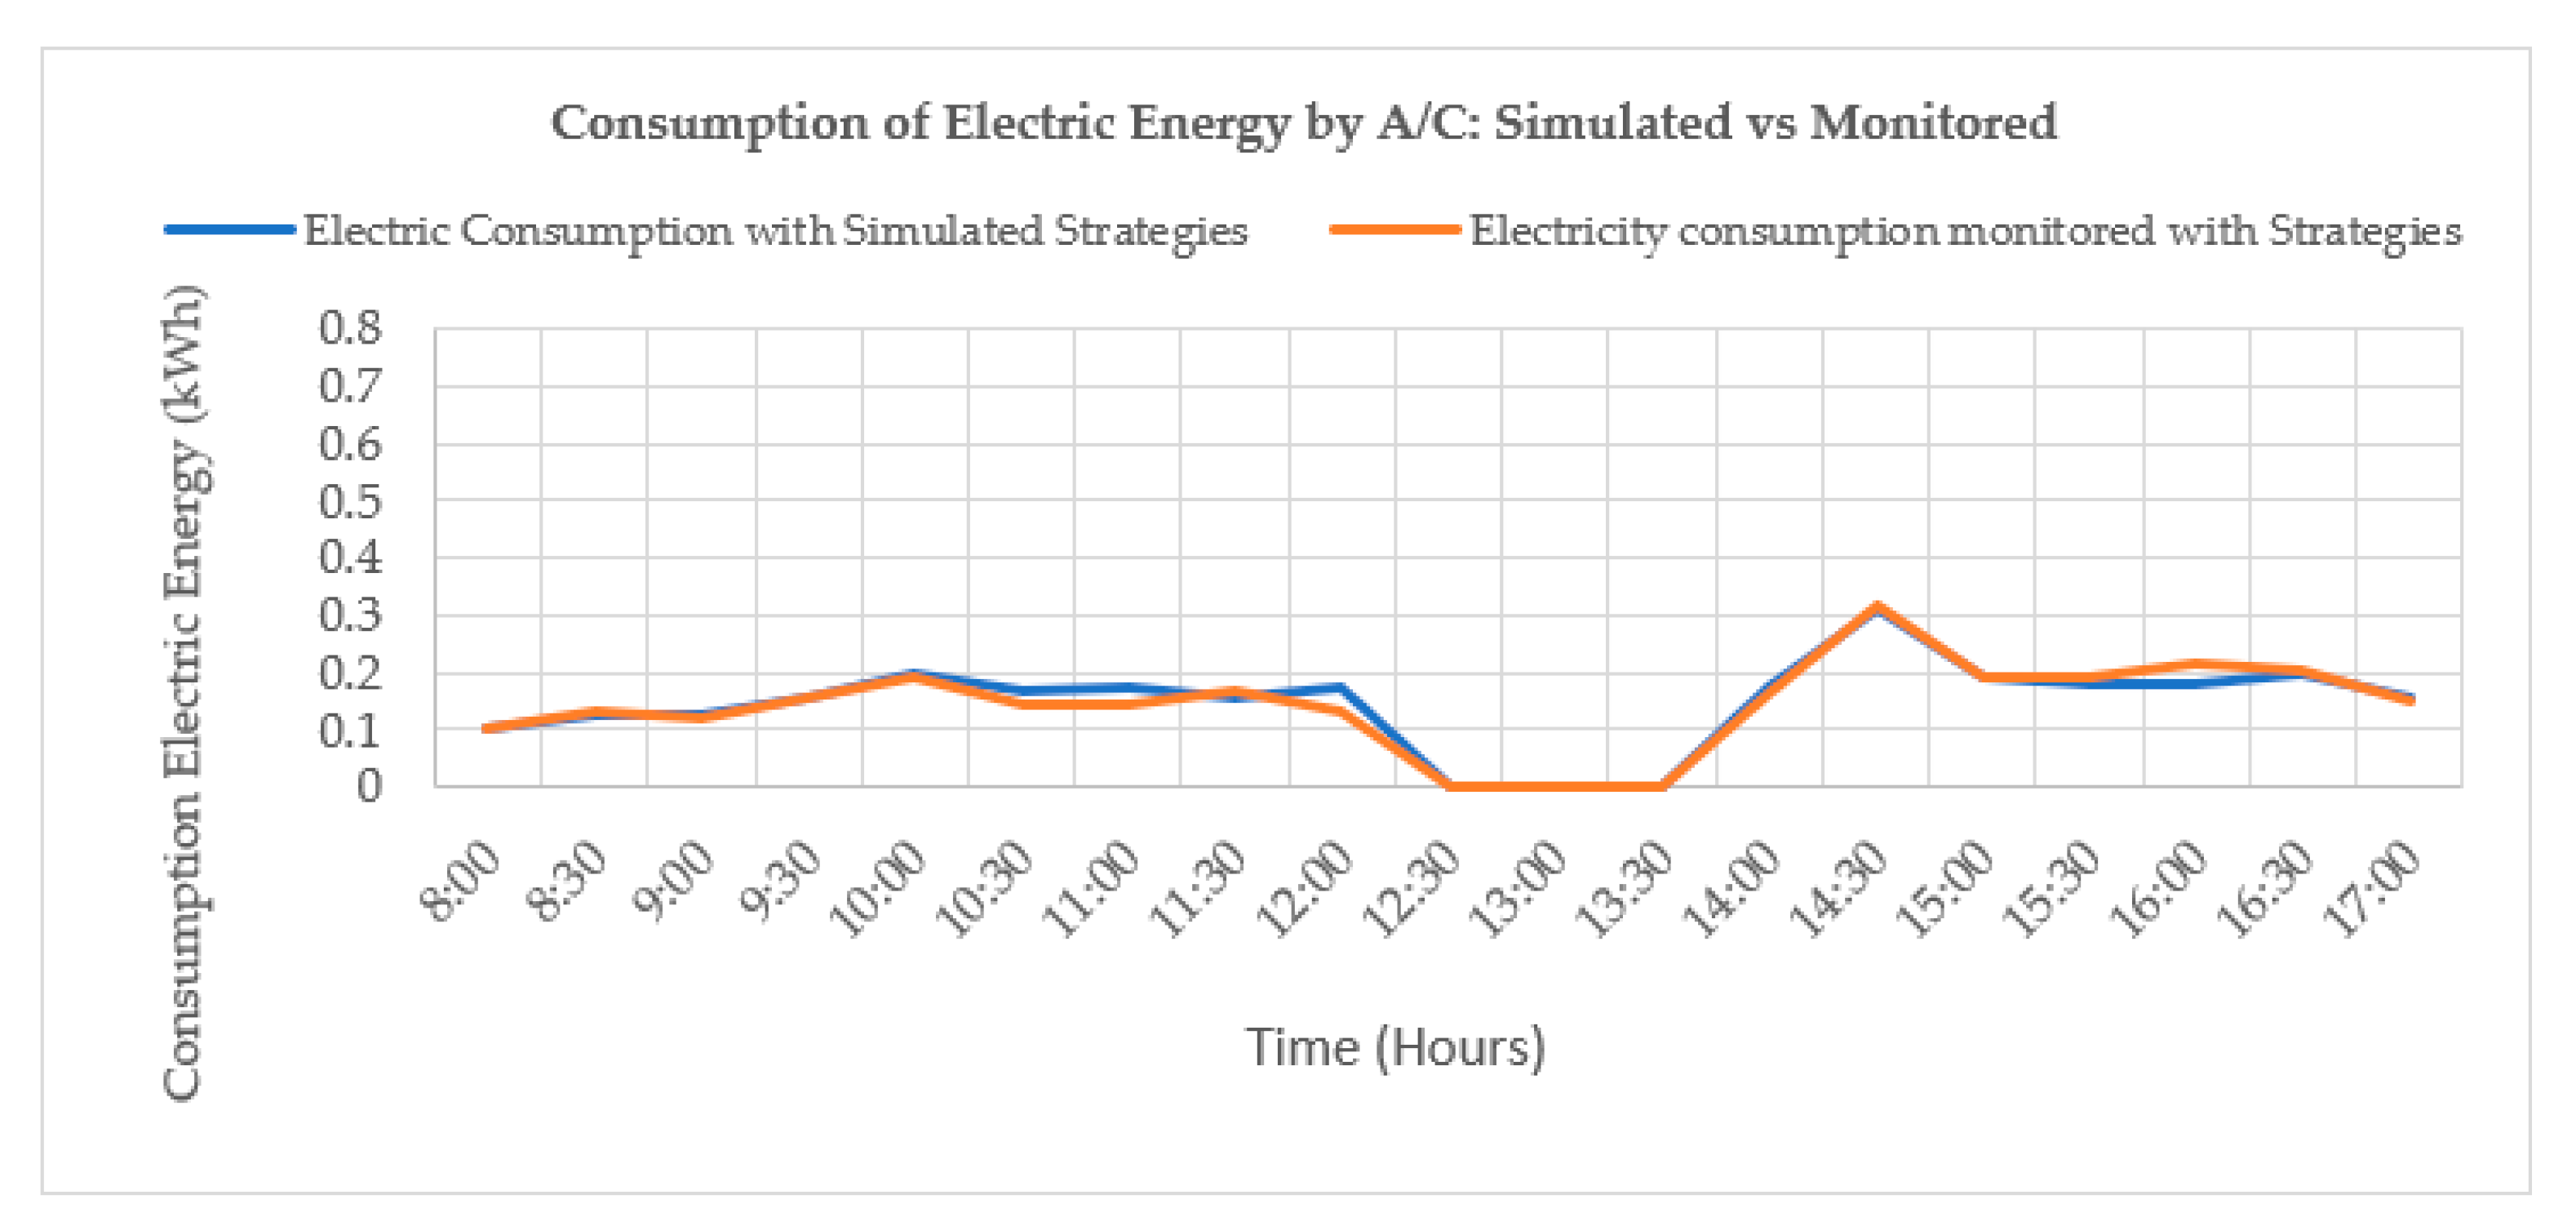
Energies 15 04715 sch023
Scheme 24. Simulated and monitored consumption of electric energy by the A/C after the implementation of the energy efficiency strategies.
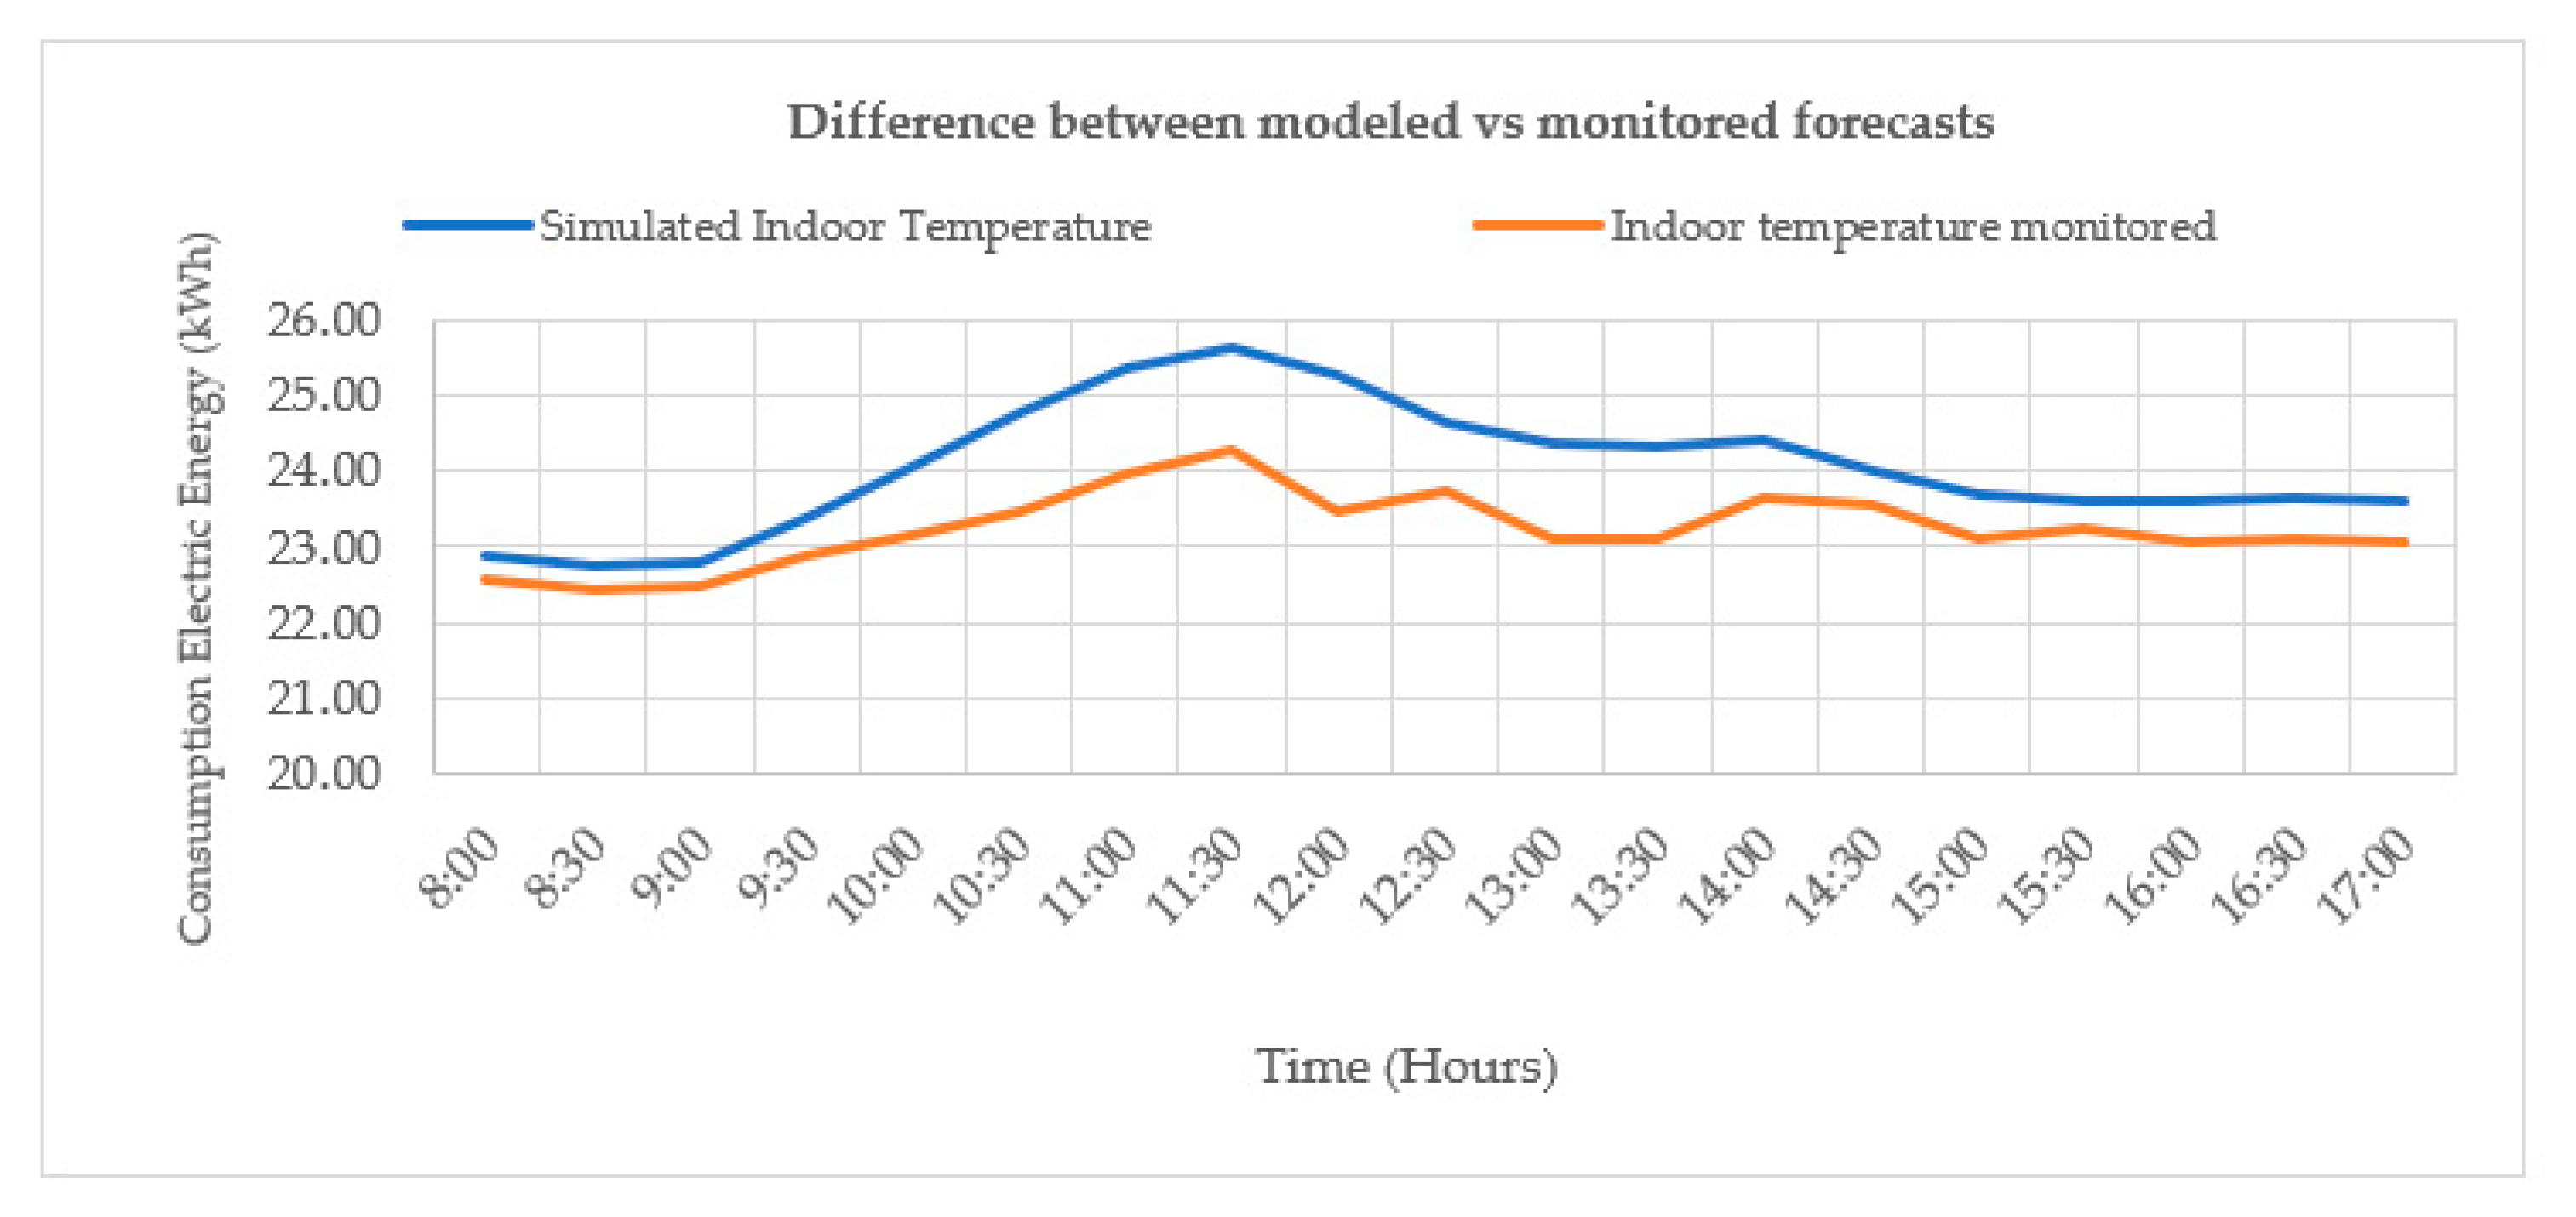
Energies 15 04715 sch024
Scheme 25. Difference between modeled vs. monitored forecasts with indoor temperature.
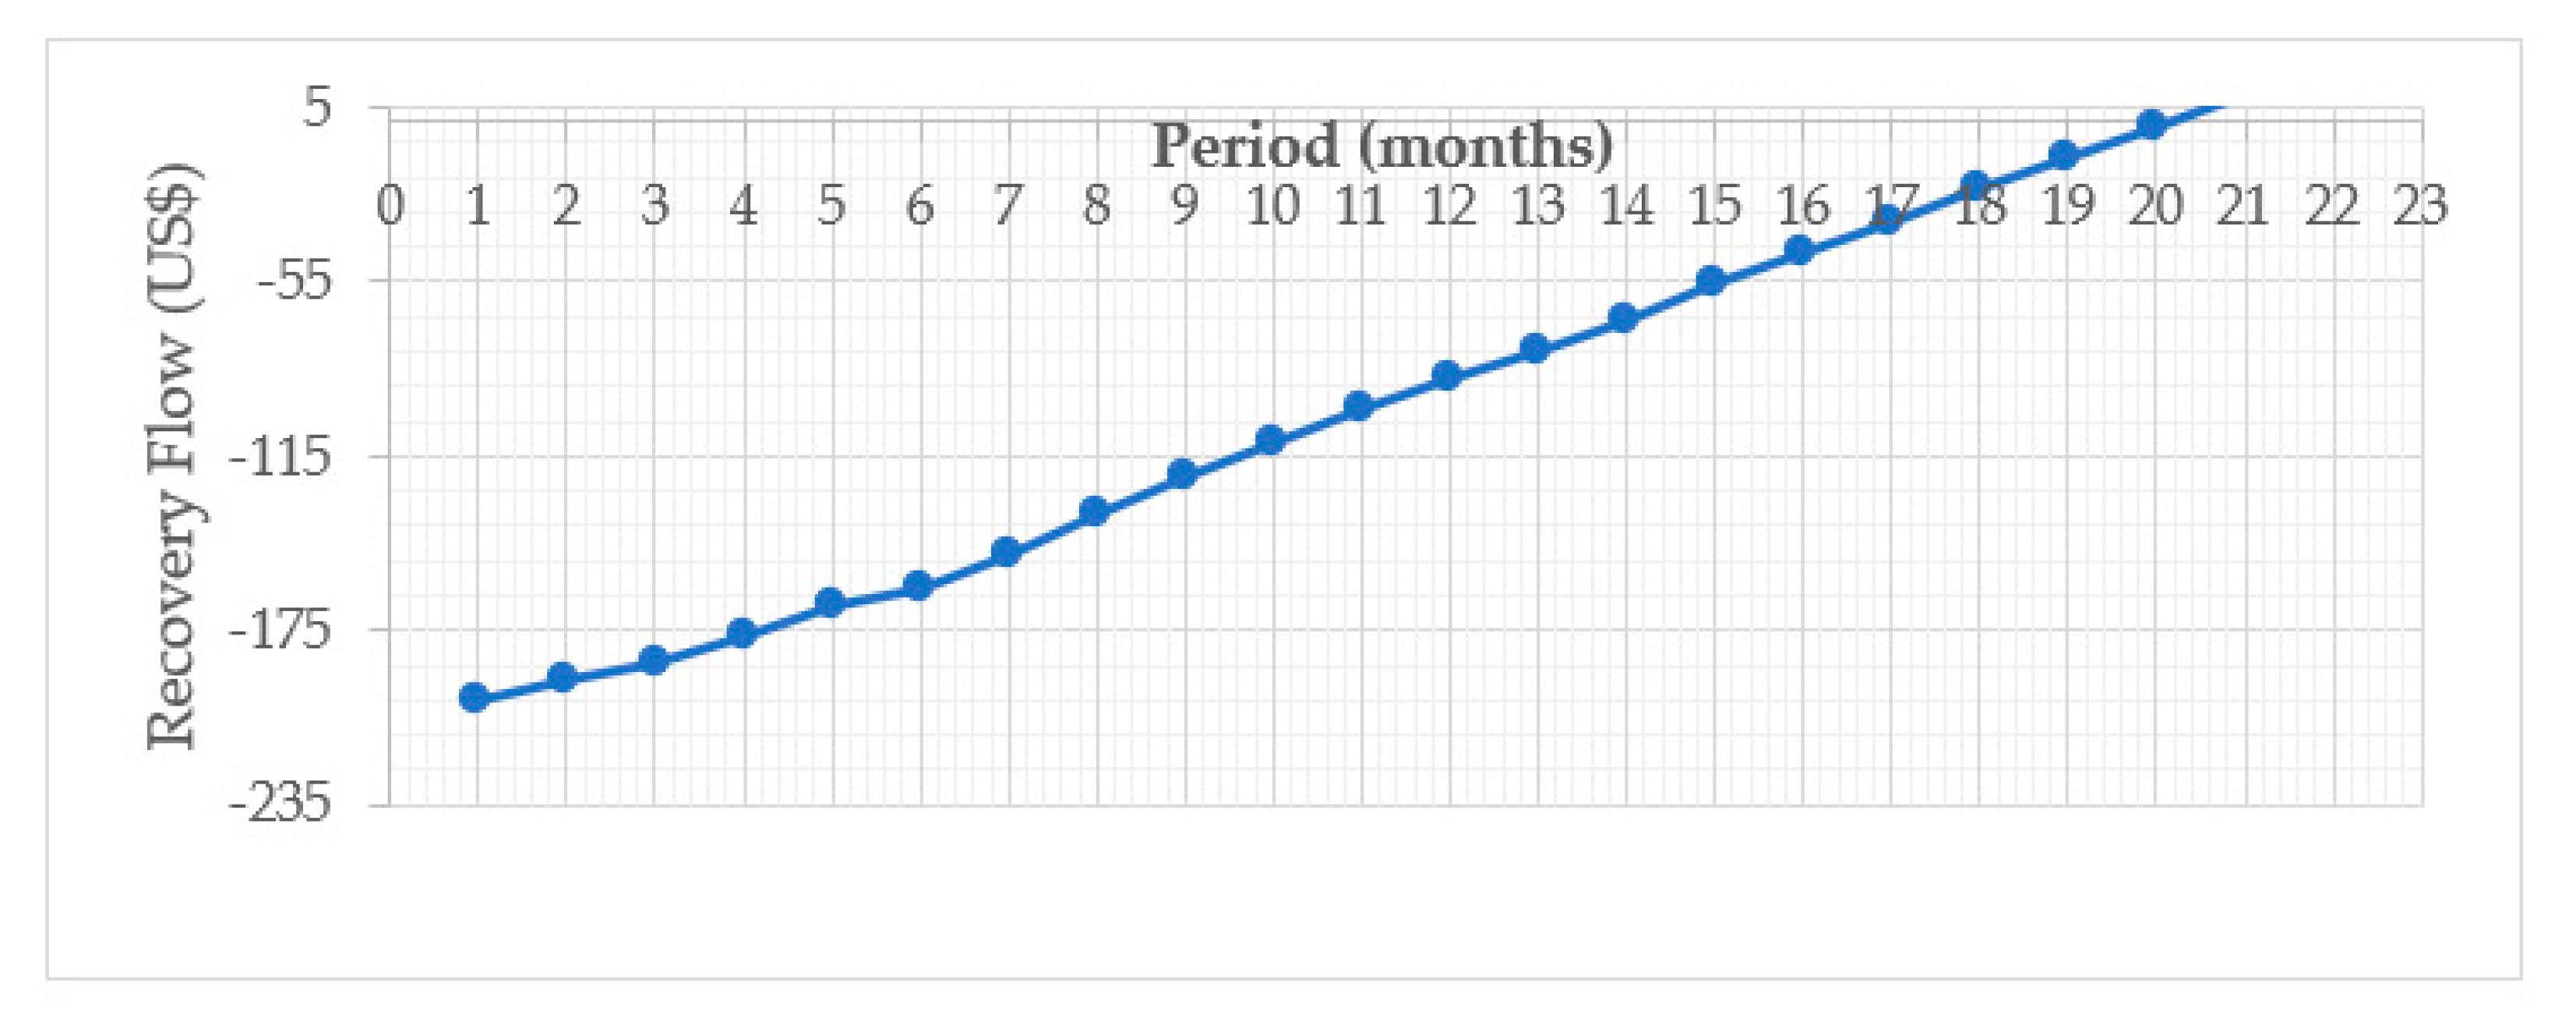
Energies 15 04715 sch025
Scheme 26. Investment recovery period for the implementation of energy efficiency strategies on the premises.
Energies 15 04715 sch026
Table 1. Comparison among items commonly used in different SCSs and items used in this studio.
SCSItemsUsed in This Studio?
LEEDMinimum Energy YieldYES
LEEDOptimized Energy PerformanceYES
LEEDOn-site Renewable EnergyNO
LEEDGreen energyNO
BREEAMEnergy demand for heating and coolingYES
BREEAMPrimary energy consumptionNO
BREEAMTotal CO2 emissionsYES
DGNBNon-renewable primary energy requirementYES
DGNBTotal Energy Decrease RequirementYES
DGNBRenewable primary energyNO
HQEReducing energy demand through architectural designYES
HQEReduction of primary energy consumptionNO
HQEReduction of polluting emissions into the atmosphereYES
Table 2. Percentage of glass in the building’s façades.
% of Glass with Respect to the Wall of the Façade
View% of GlassOrientation
Front façade28.35%258°—South West
Lateral façade7.56%177°—South
Rear façade7.56%93°—East
Table 3. Characteristics and properties of the construction materials in the F. Mancebo building.
MaterialThickness (m)Thermal Conductivity (W/m·K)Density (kg/m3)Specific Heat (J/kg·k)
Concrete Block0.151.1812301000
Mortar0.021.319001000
Concrete ceiling0.041.6523001000
Single glass0.031.052530800
Aluminum (frames)0.012072700880
Table 4. Emissivity values ɛ of the various building materials in the DR.
MaterialEmissivity ε
Concrete blocks0.9
Concrete ceiling0.88
Mortar0.93
White paint0.93
Simple glass0.9
Aluminum (frames)0.03
Table 5. Annual consumption of electrical energy in the type of building selected.
YearElectricity Consumption (kWh/Year)
20194616
20204303
20214176
Table 6. Energy Efficiency Strategies in buildings concerning the envelope.
EESDescriptionIntrusion Degree (1–5)Implementation Time (Months)Unitary Cost ($/m2)Index of Availability in DR (1–10)
AChange to windows with double glazed glass 4/16/4413001
BVinyl film application in windows10.12610
CBlack shade painted film in windows10.11610
DNano ceramic paint10.1246
EApplication of white acrylic paint as a base20.158.710
FCanvas awnings for windows20.115010
GAluminum awnings for windows20.111110
HEnergy retrofitting of opaque vertical enclosures5310807
ILandscaped roof41.530396
Table 7. EES affecting the air conditioning system.
EESPower (kW)SEERUnitary Cost (USD/ud)
J3.51“4.60 ≤ SEER < 5.10”396.55
3.51“5.10 ≤ SEER < 5.60”413.79
3.51“5.60 ≤ SEER < 6.10”465.52
3.51“6.10 ≤ SEER < 8.50”655.17
3.51“SEER > 8.50”775.86
Table 8. Chosen EES.
EESZones of the Building Where Will be ImplementedTotal Cost (USD)
BRight and front facades81.35
FRight facade127.12
Table 9. Criteria for selecting alternatives to implement in the building of the case under study.
Table Summarizing the Alternatives
Provider 1Provider 2Provider 3Provider 4
Type of AwningAluminumCanvasCanvasAluminumCanvasCanvas
Cost of Product (USD)99.15133.33186.32185.3224.62246.15
Emissivity of the material0.040.770.770.040.770.77
Thermal Conductivity (W/mK)2070.0340.03422070.0340.034
Impermeability and Dust Repellence1–101–101–101–101–101–10
Ease of maintenance1–101–101–101–101–101–10
Table 10. Selection criteria for alternatives to be implemented in the front window of the case under study.
Summary Table for the Choice of Front Window Protection
Provider 5Provider 6
Vinyl TypeMicroperforatedFull VinylMicroperforatedFull Vinyl
Product cost (USD m2)26242926
Emissivity of the material0.940.940.940.94
Thermal Conductivity (W/mK)0.250.120.290.16
MateriaPVC polymericPVC polymericPVC monomericPVC monomeric
Thickness (mm)0.00160.00160.00140.0014
Size of holes to allow vision (mm)1.6001.650
Useful Life (years)6735
Table 11. Monthly electric energy consumption (kWh) before and after the implementation of the EESs in each one of the climatic zones.
Climatic ZoneProvinceImplemented EESsAverage Monthly Energy Consumption before Implementation of EESs (KWh)Average Monthly Energy Consumption after Implementation of EESs (KWh)Percentage of the Energy Consumption Reduction
ASan JuanH, E143394841%
BMonseñor Nouel (Bonao)F, H, E93.125847%
CSan José de OcoaF, H, E84.723450%
DSantiagoE, H2326207212%
ESan Francisco de MacorísF, H, E1038420%
FPedernalesB, H, E226421047%
GLa Altagracia (Punta Cana)C, H, E2552206813%
HLa RomanaF, H, E123711745%
Table 12. Results of the simulation of the F. Mancebo building in the eight different climatic zones.
Climatic ZoneLocation in the CountryProvinceDaily Electricity Consumption (kWh) before ImplementationDaily Electricity Consumption (kWh) after ImplementationReduction (%)
ASouthwestSan Juan6.583.5237%
BNorthMonseñor Nouel (Bonao)2.921.2348%
CSouthwestSan José de Ocoa5.562.7840%
DNorthSantiago4.562.4736%
ENorthSan Francisco de Macorís5.653.4330%
FSouthwestPedernales7.225.0522%
GEastLa Altagracia (Punta Cana)3.441.4149%
HSouthwestLa Romana6.583.5536%
Table 13. Hourly energy consumption for the three considered scenarios.
TimeScenario 1 kWhScenario 2 kWhScenario 3 kWh
7:00–7:300.000.160.17
7:30–8:000.000.150.15
8:00–8:300.260.190.19
8:30–9:000.220.180.18
9:00–9:300.200.170.17
9:30–10:000.250.230.24
10:00–10:300.310.310.31
10:30–11:000.370.370.37
11:00–11:300.410.410.41
11:30–12:000.430.420.42
12:00–12:300.430.420.42
12:30–13:000.000.350.00
13:00–13:300.000.330.00
13:30–14:000.000.320.00
14:00–14:300.360.320.33
14:30–15:000.320.290.29
15:00–15:300.280.250.25
15:30–16:000.270.240.24
16:00–16:300.260.240.24
16:30–17:000.260.240.24
17:00–30:300.260.240.24
Total kWh for a Working day4.895.834.86
Table 14. Comparison among different EESs used by different researchers using saved energy (%) and its unit cost ($/%).
ResearchEESSaved Energy (%)Unit Cost (USD/%)
Hong Kong [13]Change AC units19%1947
Teheran [14]Changing facades53%4528
Semnan-Irán [23]Energy retrofitting of opaque vertical enclosures18%14,810
Singapore [42]Change of lighting and AC units40%812
Case StudyPainting facade
Shading windows
37%166
Publisher’s Note: MDPI stays neutral with regard to jurisdictional claims in published maps and institutional affiliations.

