
Does the Moderating Role of Financial Development on Energy Utilization Contributes to Environmental Sustainability in GCC Economies?


1
Department of Business Administration, Cyprus International University, Mersin 10, Nicosia 99040, Turkey
2
Faculty of Economics and Administrative Sciences, Cyprus International University, Mersin 10, Nicosia 99040, Turkey
*
Author to whom correspondence should be addressed.
Energies 2022, 15(13), 4663; https://doi.org/10.3390/en15134663
Submission received: 9 May 2022
/
Revised: 7 June 2022
/
Accepted: 13 June 2022
/
Published: 25 June 2022
(This article belongs to the Special Issue Behavioral Models for Energy with Applications)
Abstract
:This present research examined the association among carbon emissions, financial development, economic growth, natural resources, and energy usage in GCC nations within the environmental Kuznets curve framework by applying the datasets between 1995 and 2019. It used some empirical approaches, including second-generation unit roots and cointegration methods and method of moments quantile regression (MMQR). We detected a cointegrating interconnection between carbon emissions and financial development, energy usage, economic growth, natural resources, and squared of economic growth in the long term. Furthermore, the findings of the MMQR reveal that economic growth, financial development, energy usage, and natural resources degrade the environment, as well as proving the presence of the EKC hypothesis. Moreover, the results also demonstrated that financial development greatly moderates energy usage in order to attain environmental sustainability. Furthermore, the fixed-effect ordinary least squares, fully modified ordinary least squares, and dynamic ordinary least squares were also used in the study as a soundness check of the MMQR approach. The path of causality moves from financial development, economic growth, and squared of economic growth to CO2 emissions. Lastly, the causality direction runs from carbon emissions to energy usage. Based on these findings, the energy mix of the region must be revised by ensuring the promotion of sustainable energy sources and other energy-efficient technology in order to attain the quality of the environment.
1. Introduction
Climate change has become a major problem in recent decades, owing to the environmental risks it poses [1]. Furthermore, the issue of climate change is related to continuous energy usage, increase in population, and human conduct [2]. In light of this, the global attempt to counteract climate change and its catastrophic implications should adopt an all-hands-on-board mentality to ensure a massive effect. As a result, an effective attempt would require worldwide cooperation among emerging and developing countries via technology, financial assistance, research, and information exchange [3].
Systematic assessments of human–nature dynamics are spurred by anthropogenic activities, greenhouse gas (GHGs), and the resultant climatic conditions. As a result, industrial expansion is frequently blamed for degrading the environment. Thus, the connection between CO2 emissions, energy consumption, and economic growth is a hotly disputed subject in environmental economics. This study recommends a rethinking of the aforementioned connection of the Gulf Cooperation Council (Bahrain, Qatar, Oman, Kuwait, and the United Arab Emirates) (GCC) countries. Assessing the drivers of increased carbon emissions and developing suitable reduction initiatives is important for all policymakers, but it is especially important for GCC member nations.
GCC nations are resource-rich and control about 19.8% of natural gas reserves globally [4]. In essence, Qatar, the United Arab Emirates, and Saudi Arabia are among the largest emitters nations globally [5]. Fossil fuels, a copious resource in the GCC, are the backbone of these states, which depend on proceeds from the export of fossil fuels to support industrial operations, which have a significant influence on the sustainable environment [6]. Whereas renewable sources make up only a modest fraction of these nations’ energy basket, they are significantly reliant on fossil fuels. Furthermore, attributable to the growing populace, urban growth; energy usage; and economic expansion in this set of economies is soaring and continues to pose a severe threat to achieving a sustainable environment. These economies are responsible for 2.4% of GHG emissions globally, which is increasingly higher in comparison to European Union member states. As income soars and the demand for luxury products surges, GCC countries are anticipated to experience considerable growth in energy usage.
Recently, many experts have focused on financial development as a means of influencing a sustainable environment. Financial development (FD) is a significant factor that influences environmental degradation in a wide range of aspects. For example, financing from financial institutions can contribute to the growth of business, which can promote energy usage and land use. Financial institutions also facilitate citizens’ financial requirements, and an upsurge in spending capacity can boost resource usage, leading to more environmental damage. Meanwhile, financial institutions may stimulate technological advancement that decreases energy use and, thereby, minimizes environmental impact [7]. Furthermore, financial institutions may be important in assisting efforts that may contribute to technological innovation, which is impossible to achieve without appropriate R&D investment. Recent research on the interaction between carbon emissions and financial development display conflicting findings. For example, the work of [8,9,10], suggested that an increase in FD induces the level of CO2 emissions, meanwhile, the research of [11] emphasized the influence of FD in curbing CO2 emissions. In contrast, “credit facilities” and “investment channels” provided by the associated financial system may provide a stimulating environment for the innovative work of minimal carbon sources of energy, provided that the financial development is linked with eco-friendly regulations and norms. This indicates that financial development might help to minimize environmental pollution by lowering carbon emissions. Furthermore, energy has been the major backbone of any economy that contributes to environmental degradation, however, constraints in technology advancement have compelled the use of obsolete technologies for generating energy. Providing financial resources for the purchase of updated technologies could help mitigate emissions generated into the atmosphere. We evaluated a couple of studies that concentrated on different points regarding CO2 emissions in GCC economies; nonetheless, the basic question of how financial development effects degradation in GCC economies wants further investigation. Our study attempts to identify this significant demand by assessing the moderating role of “financial development” for various determinants of environmental degradation because financial development has an effect on environmental degradation in the same way that economic growth and urbanization do. Regardless of the premise that the majority of these studies employed an appropriate model for evaluation, they neglect to account for the stance of financial development moderating energy utilization. The question arising here is whether financial development plays a crucial role in energy utilization moving towards achieving a sustainable environment. Thus, this present study focuses on investigating the moderating role of financial development on energy utilization on CO2 emissions in GCC nations, in which the study also employs energy usage, financial development, natural resources, and economic growth as independent variables.
Centered on many viewpoints from prior studies, it is suggested that natural resources, energy usage, FD, and economic growth possess a distinct influence on environmental degradation. GCC nations are currently challenged with rising financial development, as well as intensified energy usage, exploitations of natural resources, and GDP creating a significant environmental concern. This study contributes to the literature gap in the following way: (i) this current research could facilitate policymakers to adopt increasingly feasible planning and choice related to environmental mitigation overall, and specifically in GCC economies; (ii) in addition, the study aims to address a shortcoming in the empirical studies by using the method of moments quantile regression (MMQR), which can account for distributional heterogeneity. The estimated results will be extremely relevant and very profound for policymakers in the GCC economies; (iii) the combined impact of energy utilization and FD on CO2 emissions is also detected in this current research; (iv) the effect of these determinants of carbon emission is undertaken within the environmental Kuznets curve (EKC) framework. (v) The fixed effect ordinary least squares (FE-OLS), fully modified ordinary least squares (FMOLS), and dynamic ordinary least squares (DOLS) are employed to verify the accuracy of the MMQR outcome. The remaining part of the study is divided into sections; the second section includes a detailed analysis of prior studies, the third section of this study describes the method and data utilized, section four covers the research’s extensive and in-depth assessments, and section five contains the study’s conclusion and important policy suggestions.
2. Literature Review
As previously stated, this segment of the research presents a summary of the relevant research. A variety of investigations have been undertaken into the effect of energy usage and GDP on environmental degradation. The interaction between environmental degradation and energy usage is crucial to the economic expansion of any country. When a country’s economy is growing and developing, fossil fuels fulfill the bulk of energy needs, which are the major leading sources of environmental pollution due to carbon emission. It is characterized as a side effect, in which the undesirable effect on the environment contribute to a country’s growth economically. In such circumstances, policymakers need to acknowledge that the negative consequences of energy consumption and continual environmental awareness compel them not only to seek sustainable energy but regenerate them with minimal exposure to environmental protection. For instance, the Balsalobre-Lorente et al. [12] study in BRICS economies utilized a dataset covering from 1990 to 2014 to investigate the interconnection between GDP and energy usage (EN) on CO2 emissions. They suggested that GDP and EN increase CO2 emissions. This verdict was also established in the He et al. [13] investigation of ten selected economies, who unearth that the increase in ENE and GDP contributes to the upsurge in CO2 emissions. Likewise, the work of Awosusi et al. [14] in South Korea used the dataset for the period between 1965 and 2019 using the wavelets, ARDL, FMOLS, and DOLS testing approach and confirmed that GDP induces CO2 emissions.
Meanwhile, employing a South Asian countries’ dataset spanning from 1970 to 2018, Sadiq et al. [15] probed into the interaction between GDP, EN, and CO2 emissions deploying the FMOLS approach. They reported that GDP and EN are major determinants that trigger the increase in CO2 emissions. Similarly, in Brazil, the work of Odugbesan et al. [16] investigated the connection between GDP and CO2 emissions in the period from 1965–2019 and found that GDP add to the increase in CO2 emissions. Furthermore, employing the dynamic ARDL approach by using Bangladesh’s dataset spanning between 1972 and 2016, the work of Islam et al. [17] reported that the surge in GDP and EN induced CO2 emissions. In a study on BRICS economies, Ojekemi et al. [18] analyzed the influence of GDP on CO2 emissions for the period between 1980 and 2019. They reported a positive correlation between GDP and CO2 emissions. Meanwhile, in Saudi Arabia, the work of Raggad [19] and Kahia et al. [20] suggested that the increase in GDP decreases the level of CO2 emissions. However, the work of Oladipupo et al. [21] in Japan reported that EN and GDP deteriorate the environment. Furthermore, employing the WAME’s dataset spanning between 1990 and 2017, the work of Beton Kalmaz & Awosusi [22] reported that the surge in GDP and EN induced environmental degradation.
Research Hypothesis 1 (H1):
- Ho: GDP does not affect CO2 emissions in GCC economies;
- Hi: GDP affects CO2 emissions in GCC economies.
Research Hypothesis 2 (H2):
- Ho: EN does not affect CO2 emissions in GCC economies;
- Hi: EN affects CO2 emissions in GCC economies.
Moreover, substantial research on the influence of financial development (FD) on environmental deterioration has shown conflicting results. For instance, utilizing a set of data from 1980 to 2017 and a panel of Latin American Nations, Ramzan et al. [8] examined the drivers of environmental deterioration. Their findings show that GDP and EN increase CO2 emissions. Furthermore, they concluded that FD does not influence CO2 emissions. Meanwhile, the study of Xu et al. [23] in Saudi Arabia concluded a different outcome using a dataset spanning between 1971 and 2016. They established that as FD continues to increase, the environment deteriorates over time in Saudi Arabia. Likewise, the work of Shehzad et al. [9] in Pakistan uses the dataset of the period 1976 to 2018 using the NARDL approach. Their empirical outcome confirmed that FD induces CO2 emissions. Abbasi et al. [24] reported a similar outcome in Pakistan using a group of data spanning from 1990Q1 to 2019Q4. Utilizing the dataset that covers 2003 to 2018, the work of Sheraz et al. [25] in 64 selected nations employing the two-system GMM approach suggested that an increase in FD stimulates the level of CO2 emissions. Furthermore, Ahmad et al. [26] examined the drivers of environmental deterioration in BRICS economies. Their findings concluded that FD positively influence CO2 emissions. The research of Ahmed et al. [27] reported that FD positively influence CO2 emissions in Japan; similarly, as did the work of Ahmed et al. [28] for United states and Ahmad et al. [29] for 17 emerging countries. The study of Weili et al. [10] suggested that an increase in FD induces the level of CO2 emissions in BRI nations.
Conversely, utilizing the dataset that covers 1990–2017, Kirikkaleli et al. [30] explored the interaction between CO2 emissions and FD in Chile. They reported that FD helps in curbing the CO2 emissions level in Chile. Similarly, within the global framework, the work of Kirikkaleli and Adebayo [31] investigated the connection between FD and CO2 emissions using a dataset ranging from 1985–2017 and disclose that FD curbs the level of CO2 emissions. Furthermore, using the wavelets, FMOLS, and DOLS approach by using South Africa’s dataset spanning from 1980–2017, the study by Bekun et al. [32] reported that the surge in FD mitigates CO2 emissions in South Africa. In a study in Brazil, Akinsola et al. [33] reported a negative interconnection between FD and environmental degradation using the period from 1983-2017. Furthermore, the work of Zoaka et al. [11] emphasized the impact of FD to curb the level of CO2 emissions.
Research Hypothesis 3 (H3):
- Ho: FD does not affect CO2 emissions in GCC economies;
- Hi: FD affects CO2 emissions in GCC economies.
Several researchers have recently looked at the relationship between natural resources (NR) and CO2 emissions but their findings have been ambiguous. For example, Awosusi et al. [34] considered the connection between NR and environmental degradation and found that when NR rises, it causes the environmental quality to decline. Miao et al. [35] explored the effect of NR on the environment with the dataset for the period between 1983 and 2017. They detected a positive connection between NR and environmental degradation. Furthermore, employing the dataset of Colombia spanning between 1970 and 2017, the study of Mata et al. [36] reported that the surge in NR stimulates CO2 emissions levels in Colombia. In a study of the G7 nations by [37] using the panel dataset, which spans the timeline between 1990 and 2020, the findings exposed that as the natural resource rent surges, CO2 emissions expands. Onifade et al. [38] inspected the major driver of CO2 emissions using the panel dataset of ten NICs, which spans the period between 1990 and 2018. Their findings revealed that NR increases CO2 emissions. Furthermore, they established the evidence of the EKC hypothesis. The work of Awosusi et al. [39] in Uruguay detected that the upsurge in natural resources intensifies CO2 emissions. Conversely, using the panel dataset spanning from 1990–2018, the investigation of Tufail et al. [40] in seven selected nations testified that the increase in NR curbs the level of degradation in the environment. Similarly, the work of Dada et al. [41] in Nigeria detected that the upsurge in natural resources abates environmental degradation.
Research Hypothesis 4 (H4):
- Ho: NR does not affect CO2 emissions in GCC economies;
- Hi: NR affects CO2 emissions in GCC economies.
Premised on the contradictory findings of the reviewed literature earlier in this section, more investigation is needed to elucidate the dynamic association between energy usage, GDP, natural resources, and FD in GCC nations using a novel approach, namely MOMQR techniques. Furthermore, this study will be conducted within the framework of EKC and the interaction term between energy usage, which is the lifeline of any economy, and financial development is examined in this study. As a result, by using MMQR to evaluate the relationship between CO2 emissions and these determinants, the current work bridges the gap in the environmental research and aids in the development of the productive policy choices for neutralizing carbon emissions in the region.
3. Data and Methods
3.1. Data
By focusing on the research’s objective, this research probed into the effect of energy usage, economic growth, natural resources, and financial development on carbon emissions by using a balanced set of data of GCC economies that covers the period between 1995 and 2019. The variables used for this study are described in Table 1 below, stating that the data on carbon emissions are extracted from the database of British Petroleum, and financial development is derived from the International Monetary Fund database; the data on energy usage, economic growth, and natural resources are obtained from the World Bank development indicators. These variables are transformed into their natural logarithm value with the sole aim of reducing heteroscedasticity.
3.2. Methods
Inspired by recent research that studied the determinants of environmental sustainability from the standpoint of GCC economies [6,44,45,46], the present research revised the carbon emissions function by incorporating both natural resources and financial development with the framework of the EKC hypothesis, which is stated as follows:
where , t, and i indicate the error term, period of study (1995–2019), and cross-section term, respectively.
3.2.1. Estimation Strategy
In this sort of panel data research, the findings are misleading and inaccurate due to a failure of recognizing the cross-sectional dependency (CSD) or arbitrary assertions. In panel data investigations, econometricians adopt the CSD test to determine whether to use first-generation or more modern econometric methodologies for estimation. In comparison to second-generation econometric approaches, ref. [47] asserted that the group of first-generation econometric procedures is unreliable in taking account of CSD in panel data. The Pesaran scale LM and Bia-corrected scaled LM testing procedure are utilized to evaluate CSD in this research. Pertaining to the pre-evaluation diagnostic, the investigators further look for slope homogeneity. The drawbacks of arbitrarily assuming slope homogeneity when the converse applies, results in distorted and inaccurate results. The researchers utilize the [48] slope homogeneity test to ensure that all deficiencies are addressed under the econometric procedures, which are defined in the following equations as follows:
where the adjusted delta tilde and delta tilde are portrayed by and respectively.
The CSD is identified using the report of the Pesaran scale LM and Bia-corrected scaled LM CSD test. In such circumstances, the rational estimations option is to deploy a recent stationary testing procedure (CIPS and CADF test), created by [49], whose results determine the stationarity pattern of the variable used in the current study, which reduces reliance on the outcome of a specific unit root testing procedure and enhances robustness. The equation of CADF is:
where (t − 1) describes the lagged average; indicates the average first difference.
Equation (5) shows the CIPS computation as:
where CADF and CIPS represent the cross-sectional augmented ADF and cross-sectional augmented IPS, respectively.
It is regarded vital to examine the long-term connection amongst specified parameters for the model. Unfortunately, due to over reliance on the arbitrary notion of CSD, the array of first-generation cointegration testing approaches generates erroneous findings. In [50], the authors presented a second-generation cointegration testing procedure that is more applicable since it accommodates cross-sectional dependency, whose equation is defined as follows:
where these four statistics include two groups mean statistics (Gt, Ga) and two pooled panel statistics (Pt, Pa).
3.2.2. Cointegration Regression
Phillips & Hansen [51] proposed a fully modified ordinary least squares (FM-OLS) with the intention of providing optimal estimation of co-integrating regression analysis. The OLS is modified in this technique to permit serial correlation influence and endogeneity in the explanatory variables due to the co-integrating connection [51]. To minimize the issues of autocorrelation and endogeneity, the FMOLS technique adopts a non-parametric approach. In [52], the authors presented the dynamic ordinary least squares (DOLS); the DOLS was designed to enable an impartial evaluation between OLS and FMOLS estimations in constrained samples [53]. The parametric method is employed by the DOLS approach to deal with endogeneity by augmenting the exogenous parameters’ leads and lags as compared to FMOLS. Because of the significant disruption triggered by CSD and autocorrelation, the researchers utilize the FE-OLS estimation method enhanced with the standard errors of [54], which has been proven to be reliable for basic aspects of autocorrelation and CSD up to a specific lag. The FMOLS and DOLS equations are stated as follows:
For FMOLS:
where , i is FMOLS estimator’s ith term
For DOLS
where the leads and lags are Ki and −Ki, respectively.
3.2.3. MMQR
The MMQR approach outperforms the estimators (FMOLS, DOLS) and conventional quantile regression (PQR) techniques. The preceding arguments restrict the latter: (a) linear estimating approaches do not limit data distributions; instead, they maintain only averages. (b) When constructing estimators for several percentiles, conventional quantile regression lacks non-crossing estimations, resulting in an erroneous response distribution. (c) incapacity to accommodate for unexplained variability in cross-sections of panels [55] developed the MMQR with fixed effects, whereas [56] allowed the PQR approach to evaluate a variety of various quantiles of the endogenous parameter based on provided estimates of the independent parameters. The researchers, obviously conscious of the shortcomings of the conventional PQR, consider the strengths of the MMQR approach effective in obtaining the conditional heterogeneity of emissions–energy usage, economic growth, natural resources, and financial development nexus at various provisional quantile distribution functions of carbon emission by integrating the fixed effect, which is inaccurately lacking in traditional mean regressions. The provisional quantiles of the underlying location–scale model are as follows:
where, in this Equation (13), the computed variables are depicted as (), Ƶ΄ indicates the k-vector of modules that have been identified, is the probability, and represents the error term. The conventional momentum restrictions are accounted for by normalizing :.
where denotes the conditional influence at quantile .
4. Findings and Discussion
4.1. Preliminary Estimation Outcomes
The results of the research are presented in this part, which is based on the methodology employed in Section 3. We started by evaluating the CSD and slope heterogeneity (SH) test, whose results are shown in Table 2. The CSD test is performed to inspect the interdependence of cross-sections within the dataset [57]. As shown in Table 2, the findings of the CSD tests indicate that the null hypothesis of no CSD is rejected. Moreover, these results indicate that a shock experienced by one country (Qatar) regarding the variable of concern would potentially extend to other economies (UAE, Saudi Arabia, Oman), suggesting a spillover effect. Furthermore, the findings of the SH, presented in Table 2, suggest that we should reject the null hypothesis of homogeneity across cross-sectional tests. Thus, we conclude that the cross-section is heterogeneous in nature. Furthermore, Table 3 displays the summary of the CADF and CIPS unit root test, indicating that there is no unit root issue at the first difference, and it also serves as a robustness check for the CSD test.
4.2. Co-Integration Test Outcomes
The Westerlund and Edgerton [50] co-integration approach is applied to ascertain the long-term interaction between carbon emissions and its explanatory variables. The approach minimizes the notion of the common-factor restrictions on tests, as opposed to the [58] approach that guarantees such common-factor restrictions during analysis. As mentioned earlier, the [50] co-integration comprises four tests, whose null hypothesis (Ho) suggests no co-integration. It is critical to preserve the residual of the power-driven co-integrating interaction in structural processes [59]. With this constraint eliminated, long and short term alteration operations are no longer needed to be comparable. By utilizing the [50] co-integration, we tend to decrease the distortion effects of the CSD procedure. Following the rejection of the null hypothesis of “no co-integrating association”, it is confirmed that the parameters considered in this present study are cointegrating in the long term, as shown in Table 4. As a result, we confirmed the long-term relationship between carbon emissions and energy usage, GDP, natural resources, and FD.
4.3. DOLS, FMOLS, and FE-OLS Outcome
The effect of these regressors on carbon emissions will be detected using the DOLS, FMOLS, and FE-OLS estimators, whose findings are summarized in Table 5. The findings of these three estimators show that the direction of the regressors to carbon emissions are similar, as well as their coefficients’ magnitude. As seen in Table 5, the influence of GDP on carbon emissions is positive in the long term, in which a 1% rise in GDP is attributed to an upturn in carbon emissions level by 0.0423%, 0.0477%, and 0.0251% as detected by FMOLS, DOLS, and FE-OLS, respectively. Moreover, since the current research is undertaken within the framework of the EKC, an increase in the square of GDP by 1% will cause a decline in the level of carbon emissions by 0.2328%, 0.2572%, and 0.1360% as discovered by FMOLS, DOLS, and FE-OLS, respectively. These findings show the validity of the EKC hypothesis in GCC nations, thereby aligning with the work of [13] for ten selected economies and the work of [21] in Japan.
The usage of energy is positively associated with carbon emissions for these estimators (DOLS, FMOLS, and FE-OLS). This exposes that a 1% growth in EN causes the intensification of carbon emissions by 0.3791%, 0.3807%, and 0.6760% as detected by FMOLS, DOLS, and FE-OLS, respectively. This means that EN contributes to the upsurge in carbon emissions in GCC economies. This result is in agreement with the investigations of [60] in Argentina, ref. [32] in South Africa, ref. [61] in Brazil, ref. [62] in Japan; ref. [12] in BRICS economies; ref. [13] in ten selected economies; [14] in South Korea; [15] in South Asian countries; and ref. [16] in Brazil, who reported that EN increases environmental deterioration.
Moreover, we observed a positive linkage between NR and CO2 emissions. This indicates that a 1% rise in NR causes a 0.0901%, 0.0840%, and 0.1065% rise in carbon emissions, as detected by FMOLS, DOLS, and FE-OLS, respectively. This illustrates that the depletion of natural resources deteriorates the environment in GCC economies. This finding is consistent with the findings of [34] in BRICS nations, ref. [38] in NICs, and ref. [36] in Colombia, which reported that the surge in NR stimulates carbon emissions.
Furthermore, the findings of the FMOLS, DOLS, and FE-OLS show that the financial development influence on carbon emissions is positive and significant. This reveals that a 1% increase in financial development causes a 4.4327%, 4.2071%, and 2.2860% upsurge in carbon emissions, as detected by FMOLS, DOLS, and FE-OLS, respectively. This indicates that financial development increases CO2 emissions in GCC economies, which is in line with the work of [23] in Saudi Arabia, and as the FD continues to increase, the environment deteriorates over time in Brazil. Likewise, the work of [9] in Pakistan, ref. [28] in the United States, and ref. [29] in 17 emerging countries
Finally, the interacting impact of FD and EN on carbon emissions is negative in GCC economies, indicating that the moderating effect of financial development on energy consumption potentially reduces carbon emissions, thus enhancing the quality of the environment.
4.4. Results of MMQR
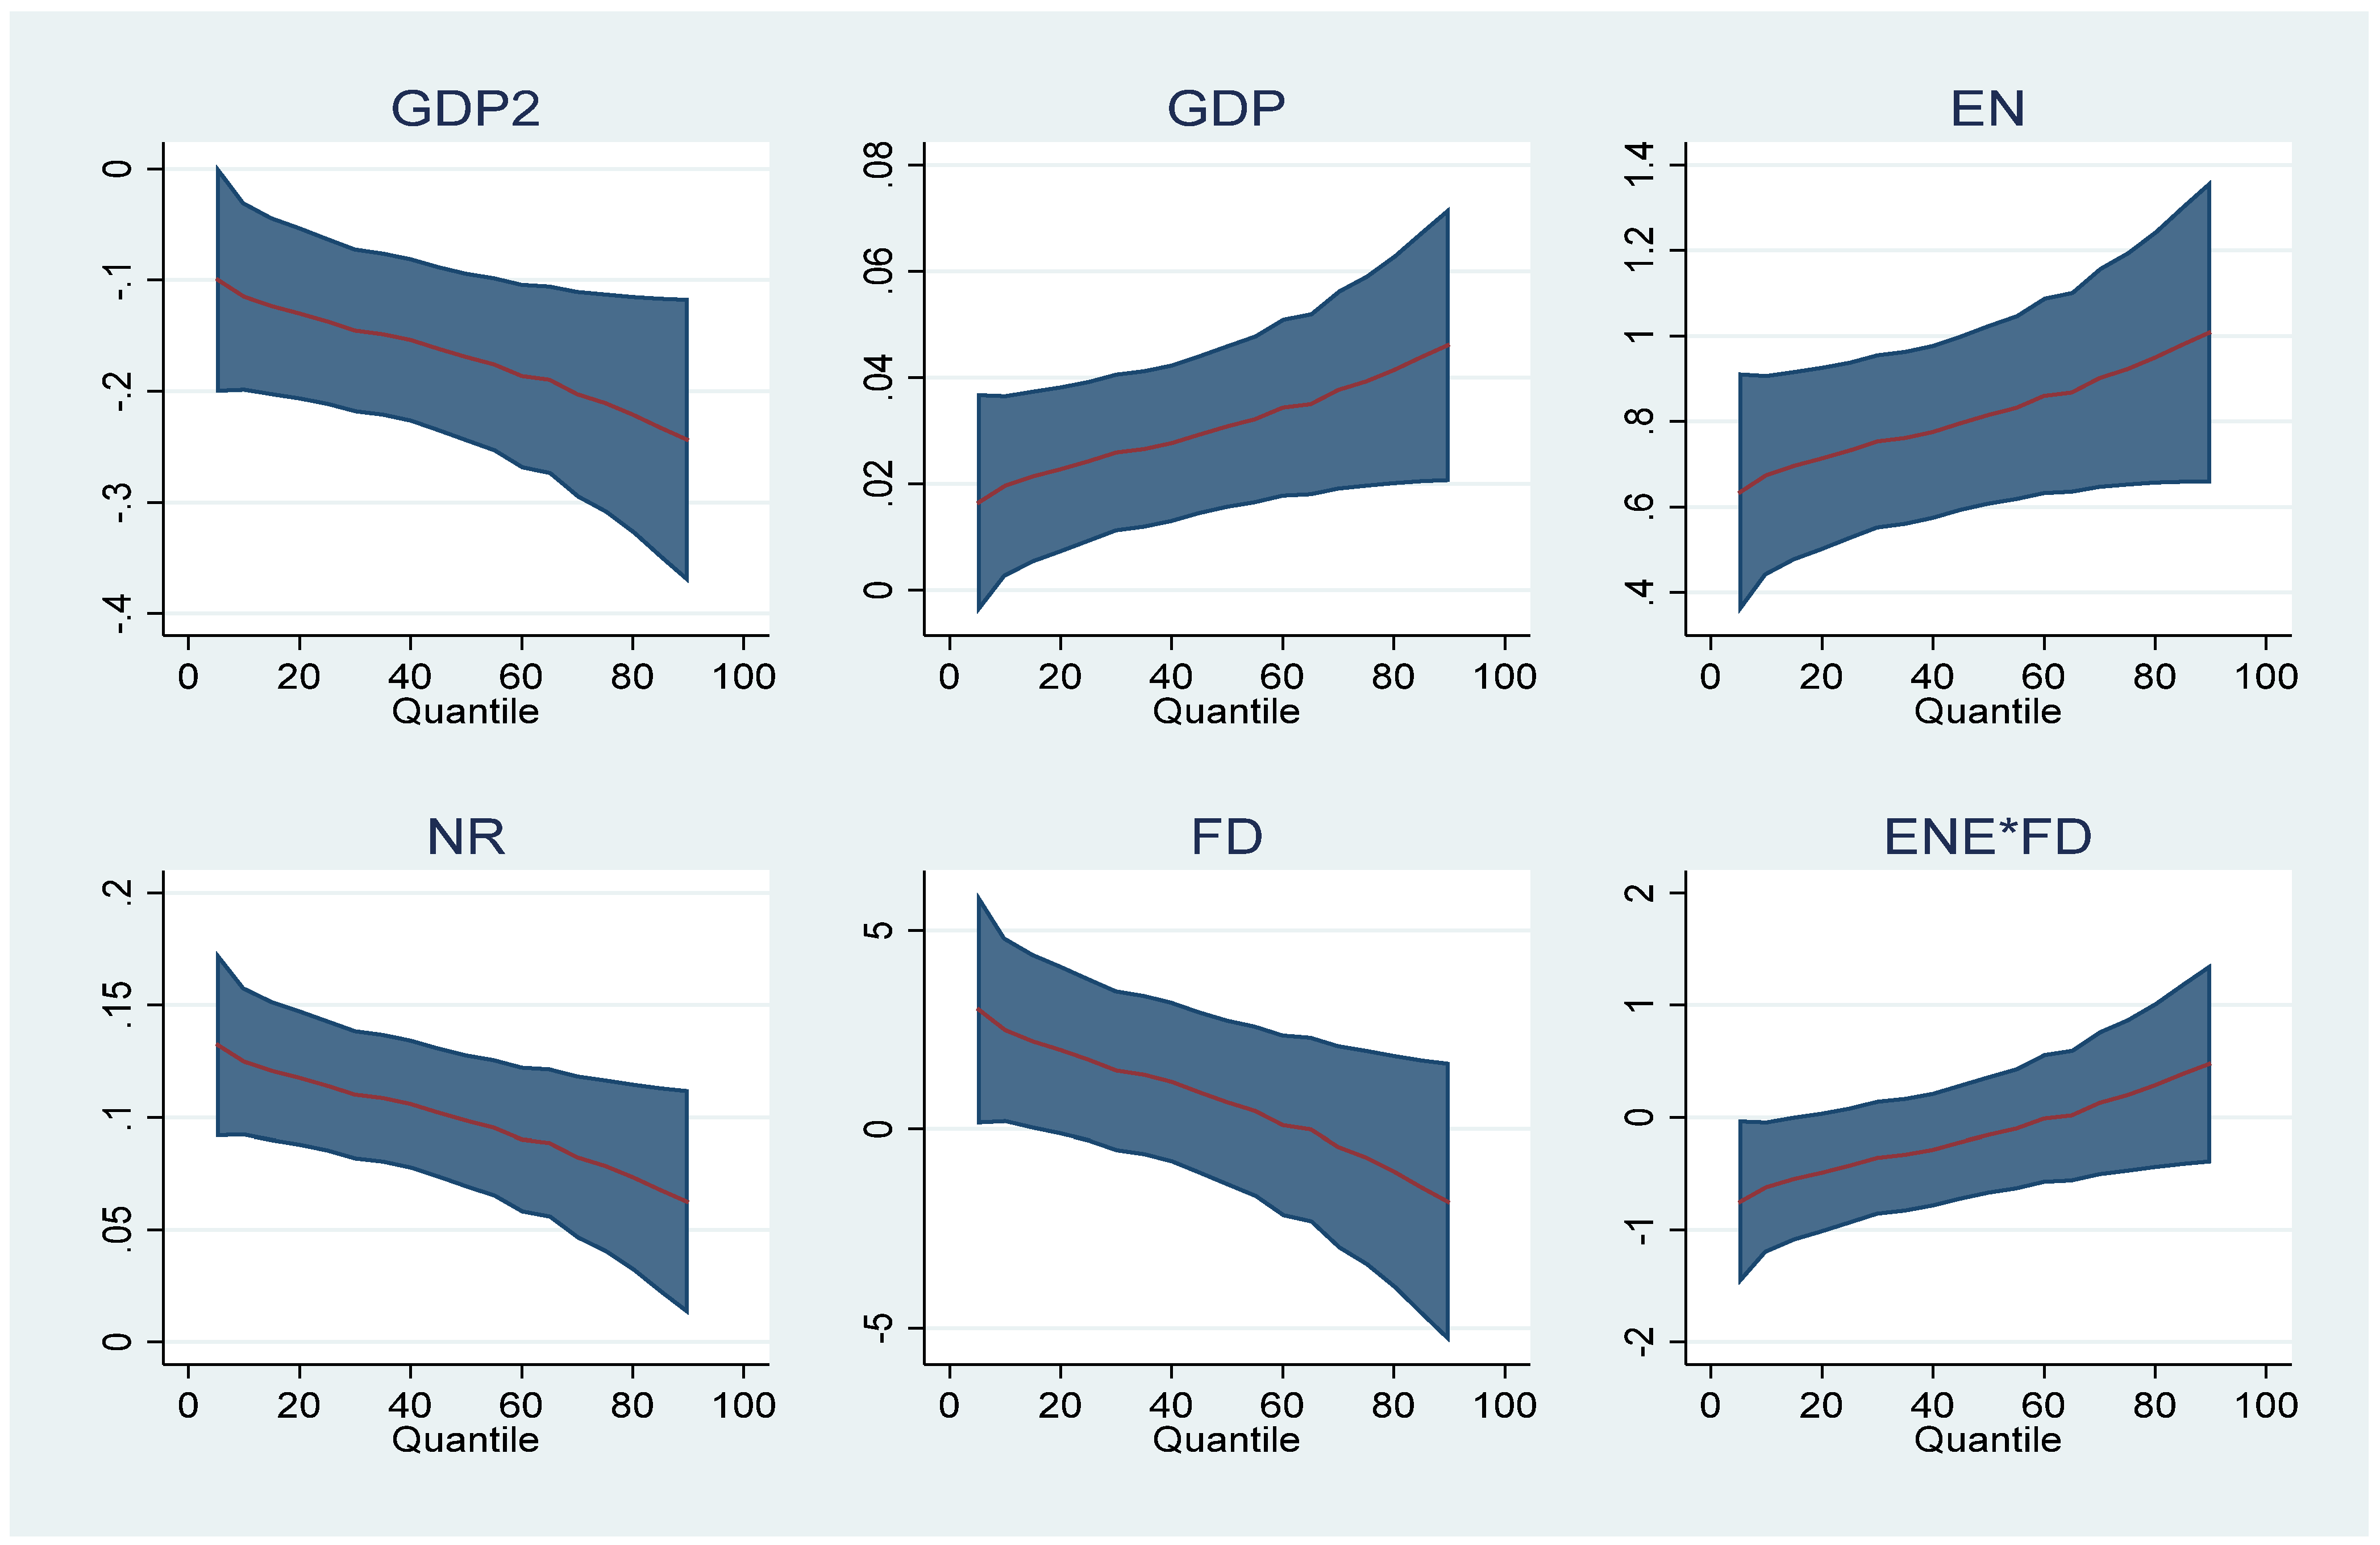
We then examined the impact of GDP, GDP2, EN, NR, FD, and EN*FD on carbon emissions for different quantiles. This is executed by employing the MMQR, the results of which are shown in Figure 1 and Table 6. First, the hypothesis of EKC is tested across quantiles. This study reports that economic expansion increases environmental pollution in the early stages, whereas the reducing effect occurs when a certain threshold is achieved. This result is supported by the study of [63] in Turkey and [64] in G7 economies. Thus, GDP in countries with lower, moderate, and wider concentrations of pollution has scale, composite, and technique impacts, respectively [65]. Hence, this set of nations are implementing environmentally beneficial measures in parallel with growth.
We found a positive association between carbon emission and energy usage across quantiles. This means that the EN effect on carbon emission is positive across quantiles (0.1–0.90). Meanwhile, as the quantile level increases, the contribution of EN deteriorates the environment. This research demonstrates that the trend toward EN contributes to carbon emission increases in countries with lower levels of emissions, while it has a very big emission-increasing effect in countries with higher levels of emissions. The main rationale for this outcome is because these countries’ energy mix constitutes largely of fossil fuel, which emits greater levels of carbon. This outcome calls for an increase in the usage of renewable energy in these countries’ energy mix. This finding aligns with the studies of [12,18] in BRICS economies and [15] in South Asian economies.
Furthermore, we established a positive connection between carbon emissions and NR across all quantiles (0.1–0.90). Thus, the percentage of NR to environmental degradation increases as the quantile level expands. This research demonstrates that the trajectory toward NR leads to greater emission increases in countries. This outcome aligns with the study of [36] in Colombia, [37] in G7 nations, [38] in ten newly NICs but contradicts the study of [40] in seven selected nations and of [41] in Nigeria.
Moreover, the influence of FD on carbon emissions is positively related in the small and medium quantiles (0.1–0.6), meanwhile, the impact of FD on carbon emissions is negative in the upper quantiles. This suggests that as the quantiles increase, FD develops a positive impact, and then improves the quality of the environment. This finding indicates that, of nations with lower and medium carbon emissions, the trajectory of FD leads to increased carbon emissions at a reducing rate. Meanwhile, it exerts considerable emission reduction impact in countries with greater levels of emissions. This result aligns with the investigations of [10] in BRI nations, ref. [24] in Pakistan, ref. [25] in 64 selected nations, ref. [26] in BRICS economies, and ref. [27] in Japan but contradicts the outcome of [30] in Chile and [32] in South Africa.
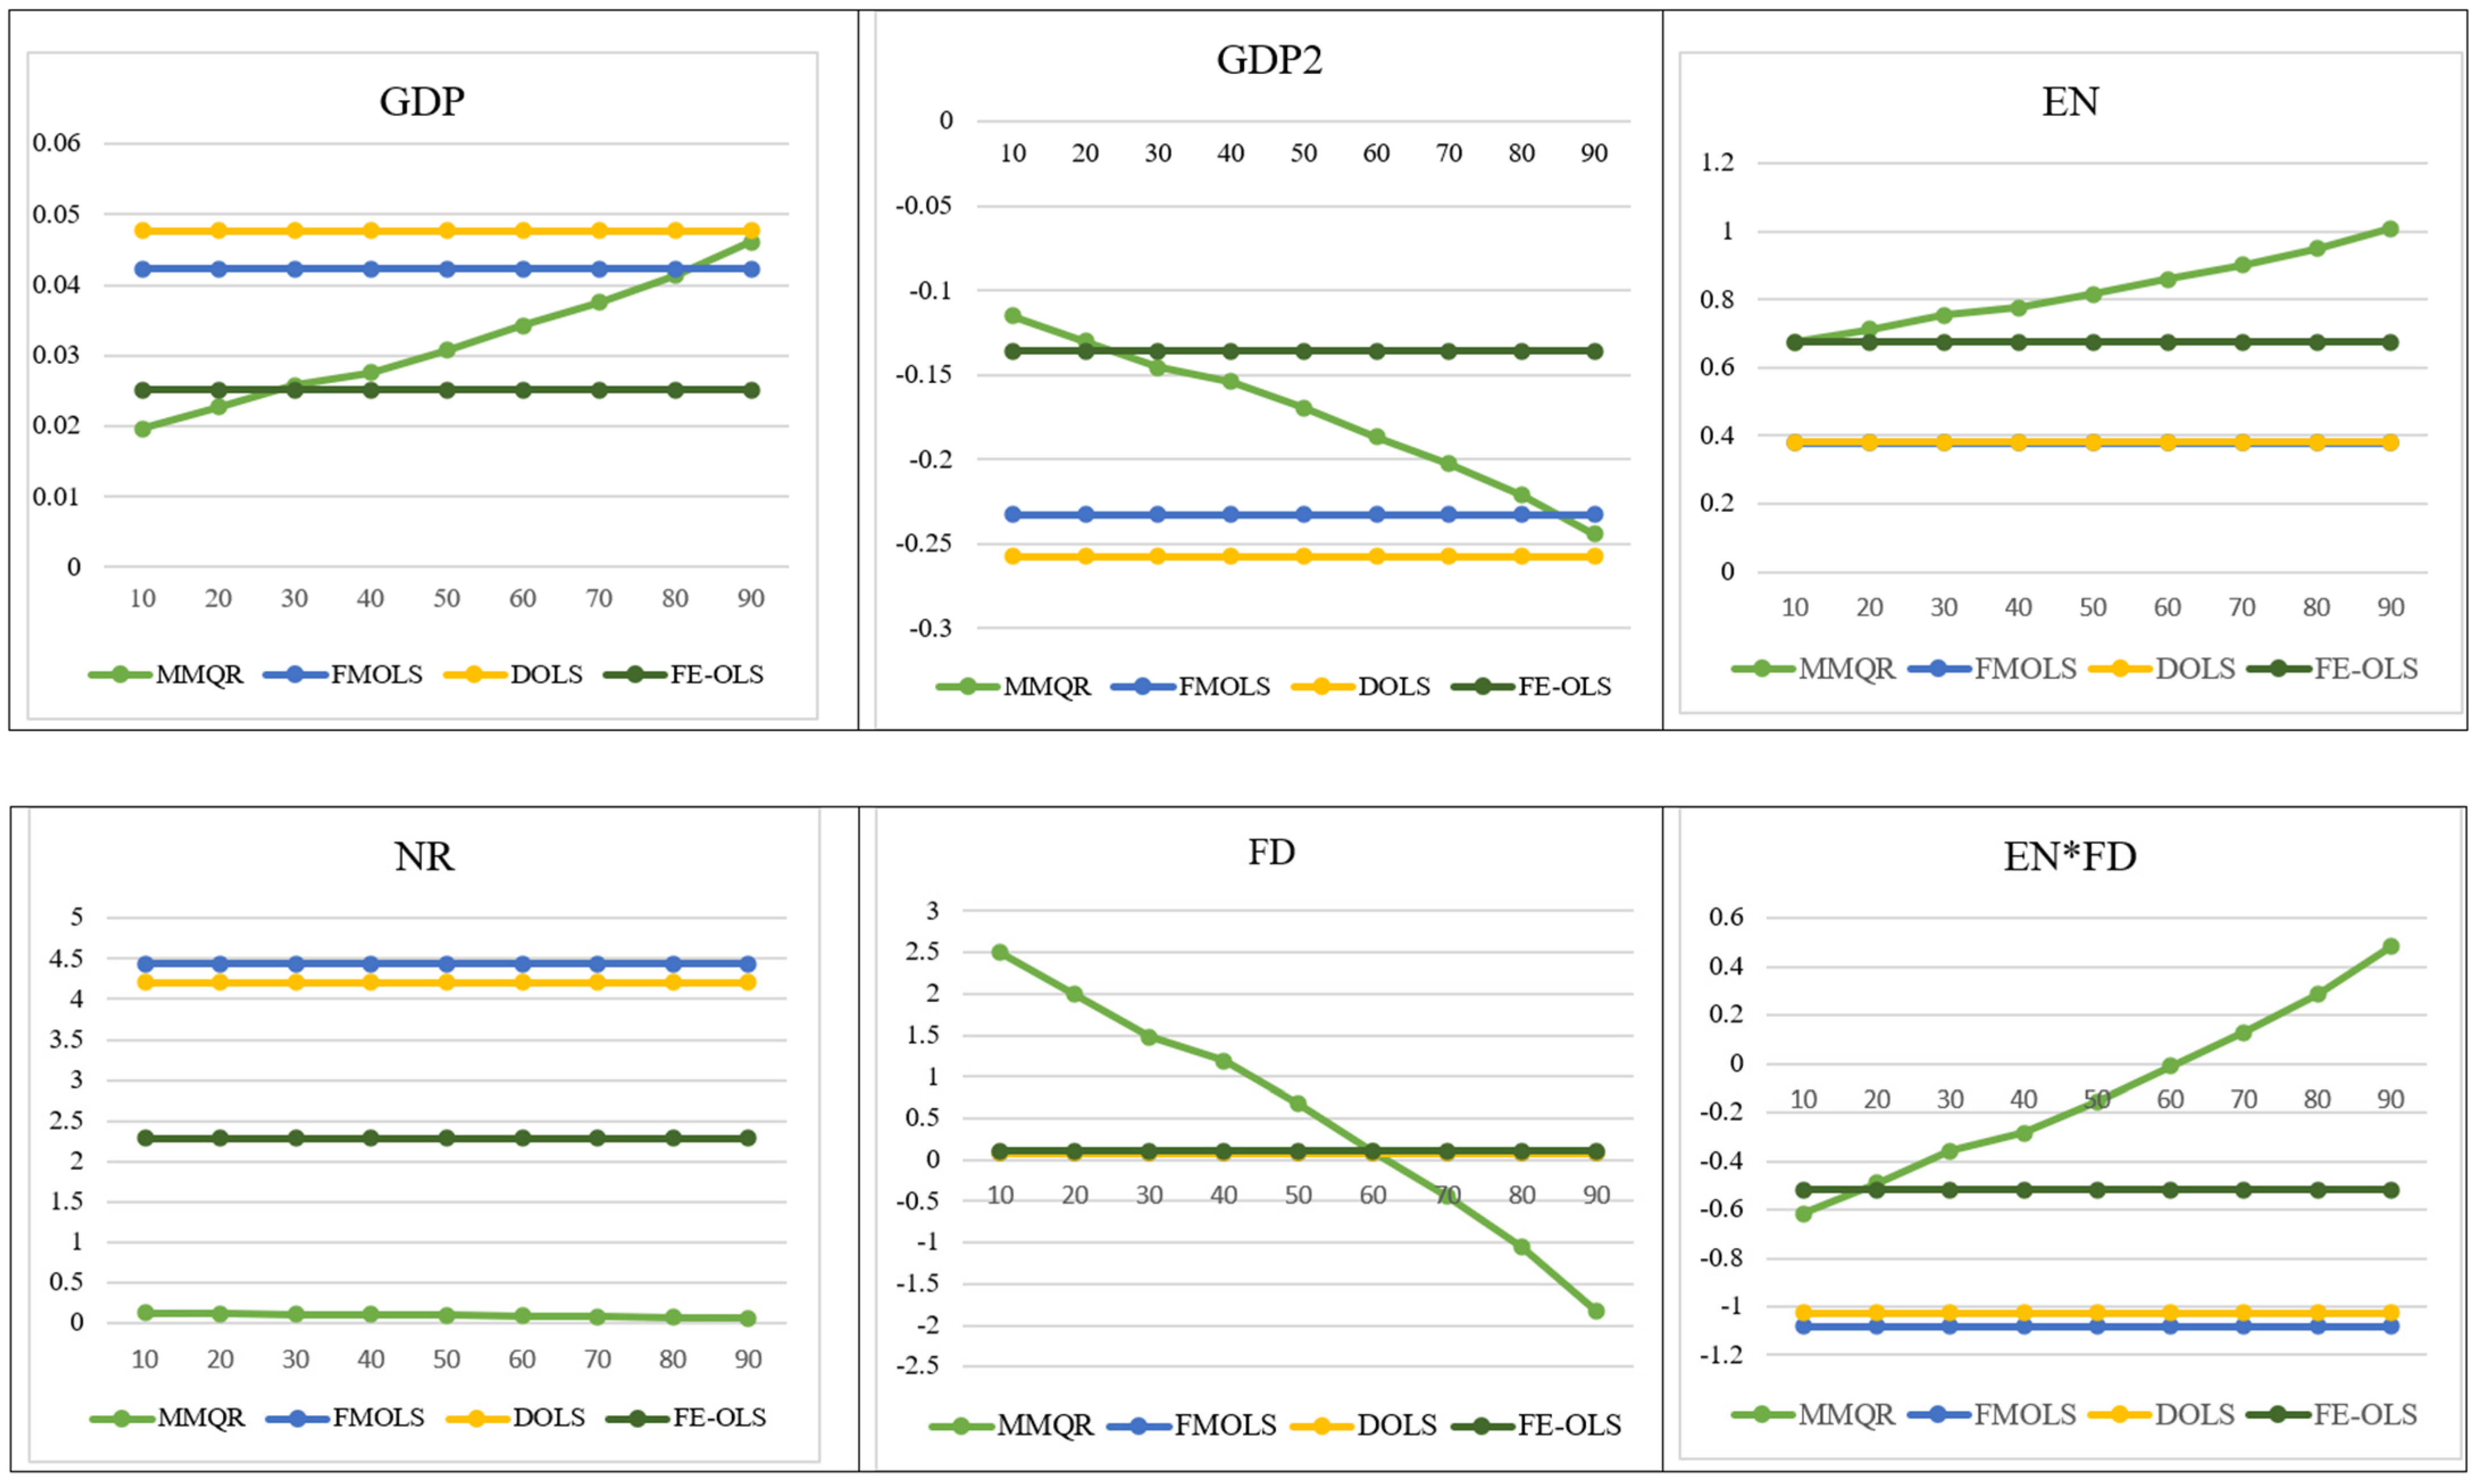
Finally, we looked at the impact of FD and EN on carbon emissions as a whole. The impact of FD*EN on carbon emissions is negative at lower and medium quantiles (0.1–0.60), showing that the interacting term of FD*EN helps GCC economies reduce environmental deterioration at lower and medium quantiles; meanwhile, the effect of FD*EN on carbon emissions is positive at upper quantiles (0.7–0.90). This finding indicates that, of nations with lower and medium carbon emissions, the trajectory of FD*EN mitigates carbon emissions at a reducing rate and the emission-increasing effect in countries with greater levels of emissions. Furthermore, Figure 2 also presents comparison of all four estimators (MMQR, FMOLS, DOLS, and FE-OLS) used in this empirical analysis.
4.5. Causality Test
The outcome of the causality pathway of carbon emissions and its regressors are presented in Table 7. Based on the revelation, the path of causality moves from GDP to CO2 emissions, indicating that GDP predicts the pattern of carbon emissions in the future. Moreover, the Granger causality runs from GDP2 to CO2 emissions. However, the causal interrelation runs from CO2 emissions to EN, indicating that carbon emissions predict the pattern of EN in the future. Lastly, the causality direction runs from FD to carbon emissions, suggesting that FD predicts CO2 emissions.
5. Conclusions and Policy Suggestions
5.1. Conclusions
A review of the environmental literature indicated a diverse range of nations, groupings of countries, and nomenclature, with limited attention to the issue of GCC economies. As a result, this research indicated the intention of showing the serious position of GCC economies regarding the quality of the environment amidst the pattern of financial development, energy utilization, and the ambition for economic growth. As a result, this research utilized a range of crucial datasets between 1995 and 2019 to examine the GCC nations. Using a number of empirical approaches, including cointegration methods, MOMR regression (which compensates for distributional heterogeneity), and panel Granger causality approach, significant findings were uncovered, prompting a policy perspective. We detect a cointegrating interaction between carbon emissions and energy usage, financial development, natural resources, GDP, and squared of economic growth in the long term. Furthermore, the findings of the MMQR, FE-OLS DOLS, and FMOLS confirmed that natural resources, financial development, energy usage, and GDP deteriorate the environmental quality, as well as prove the presence of the EKC hypothesis. Moreover, the results also demonstrated that financial development greatly moderates energy usage in order to attain environmental sustainability. The path of causality moves from GDP, GDP2, and FD to CO2 emissions. Lastly, the causality direction runs from carbon emissions to EN.
5.2. Policy and Prospects for Future Study
The GCC economies need to exhibit caution when pursuing measures that encourage economic progress at the expense of the environment. The existing energy mix of the region must be revised by ensuring the promotion of sustainable energy sources and other energy-efficient technologies in order to attain environmental quality. The GCC nations should pursue a more dramatic and persistent approach to establishing a greener environment via green industrialization and investment in low-carbon technology, particularly concerning specific countries, which are currently motivated to recover their development path in the wake of the COVID-19 outbreak. Given that financial development seems to possess a considerable influence on moderating the sustainable environment component of energy utilization, there is a major insight for the GCC nations, particularly in terms of financial development. As a result, the financial sector of these nations should be expanded, particularly in the economies where the financial sectors are in their initial phases of structural reform. Furthermore, this study constitutes shortcomings that can be addressed in subsequent work. One such shortcoming is that the research utilized the aggregate metric of the natural resource rents. Thus, subsequent research may be conducted to look into specific forms of natural rents, such as forest, mineral, oil, coal, and natural gas rents. Moreover, carbon emissions were used as a proxy for environmental quality in this study. Subsequent studies might look at other types of environmental deterioration, such as greenhouse gas emissions and ecological footprint, and then evaluate the results. Finally, subsequent research in this region could incorporate environmentally important parameters, namely fiscal policy, political uncertainty, etc., to better reflect the situation of the GCC economies.
Author Contributions
H.O.: Introduction, data analysis, discussion of findings, and conclusion; M.B.: Literature review, methodology, and supervision. All authors have read and agreed to the published version of the manuscript.
Funding
This research received no external funding.
Institutional Review Board Statement
Not applicable.
Informed Consent Statement
Not applicable.
Data Availability Statement
Data is readily available at request from the corresponding authors.
Conflicts of Interest
The authors declare no conflict of interest.
References
- Caglar, A.E.; Zafar, M.W.; Bekun, F.V.; Mert, M. Determinants of CO2 emissions in the BRICS economies: The role of partnerships investment in energy and economic complexity. Sustain. Energy Technol. Assess. 2022, 51, 101907. [Google Scholar] [CrossRef]
- Chunling, L.; Memon, J.A.; Le Thanh, T.; Ali, M.; Kirikkaleli, D. The Impact of Public-Private Partnership Investment in Energy and Technological Innovation on Ecological Footprint: The Case of Pakistan. Sustainability 2021, 13, 10085. [Google Scholar] [CrossRef]
- Destek, M.A.; Sinha, A. Renewable, non-renewable energy consumption, economic growth, trade openness and ecological footprint: Evidence from organisation for economic Co-operation and development countries. J. Clean. Prod. 2019, 242, 118537. [Google Scholar] [CrossRef]
- British Petroleum Global. Statistical Review of World Energy. 2021. Available online: https://www.bp.com/en/global/corporate/energy-economics/statistical-review-of-world-energy.html (accessed on 6 June 2022).
- Hertog, S.; Luciani, G.; Valeri, M. Business Politics in the Middle East; Hurst Publishers: London, UK, 2013. [Google Scholar]
- Ansari, M.A.; Ahmad, M.R.; Siddique, S.; Mansoor, K. An environment Kuznets curve for ecological footprint: Evidence from GCC countries. Carbon Manag. 2020, 11, 355–368. [Google Scholar] [CrossRef]
- Saleem, H.; Khan, M.B.; Shabbir, M.S. The role of financial development, energy demand, and technological change in environmental sustainability agenda: Evidence from selected Asian countries. Environ. Sci. Pollut. Res. 2019, 27, 5266–5280. [Google Scholar] [CrossRef] [PubMed]
- Adebayo, T.S.; Ramzan, M.; Iqbal, H.A.; Awosusi, A.A.; Akinsola, G.D. The environmental sustainability effects of financial development and urbanization in Latin American countries. Environ. Sci. Pollut. Res. 2021, 28, 57983–57996. [Google Scholar] [CrossRef] [PubMed]
- Shehzad, K.; Zaman, U.; Ahmad, M.; Liu, X. Asymmetric impact of information and communication technologies on environmental quality: Analyzing the role of financial development and energy consumption. Environ. Dev. Sustain. 2021, 24, 1761–1780. [Google Scholar] [CrossRef]
- Weili, L.; Khan, H.; Khan, I.; Han, L. The impact of information and communication technology, financial development, and energy consumption on carbon dioxide emission: Evidence from the Belt and Road countries. Environ. Sci. Pollut. Res. 2022, 29, 27703–27718. [Google Scholar] [CrossRef]
- Zoaka, J.D.; Ekwueme, D.C.; Güngör, H.; Alola, A.A. Will financial development and clean energy utilization rejuvenate the environment in BRICS economies? Bus. Strat. Environ. 2022, 95, 1–15. [Google Scholar] [CrossRef]
- Balsalobre-Lorente, D.; Driha, O.M.; Halkos, G.; Mishra, S. Influence of growth and urbanization on CO2 emissions: The moderating effect of foreign direct investment on energy use in BRICS. Sustain. Dev. 2021, 30, 227–240. [Google Scholar] [CrossRef]
- He, K.; Ramzan, M.; Awosusi, A.A.; Ahmed, Z.; Ahmad, M.; Altuntaş, M. Does Globalization Moderate the Effect of Economic Complexity on CO2 Emissions? Evidence From the Top 10 Energy Transition Economies. Front. Environ. Sci. 2021, 9, 555. [Google Scholar] [CrossRef]
- Adebayo, T.S.; Awosusi, A.A.; Kirikkaleli, D.; Akinsola, G.D.; Mwamba, M.N. Can CO2 emissions and energy consumption determine the economic performance of South Korea? A time series analysis. Environ. Sci. Pollut. Res. 2021, 28, 38969–38984. [Google Scholar] [CrossRef] [PubMed]
- Sadiq, M.; Kannaiah, D.; Khan, G.Y.; Shabbir, M.S.; Bilal, K.; Zamir, A. Does sustainable environmental agenda matter? The role of globalization toward energy consumption, economic growth, and carbon dioxide emissions in South Asian countries. Environ. Dev. Sustain. 2022, 85, 1–20. [Google Scholar] [CrossRef]
- Adebayo, T.; Awosusi, A.; Odugbesan, J.A.; Akinsola, G.; Wong, W.-K.; Rjoub, H. Sustainability of Energy-Induced Growth Nexus in Brazil: Do Carbon Emissions and Urbanization Matter? Sustainability 2021, 13, 4371. [Google Scholar] [CrossRef]
- Islam, M.; Khan, M.K.; Tareque, M.; Jehan, N.; Dagar, V. Impact of globalization, foreign direct investment, and energy consumption on CO2 emissions in Bangladesh: Does institutional quality matter? Environ. Sci. Pollut. Res. 2021, 28, 48851–48871. [Google Scholar] [CrossRef]
- Ojekemi, O.S.; Rjoub, H.; Awosusi, A.A.; Agyekum, E.B. Toward a sustainable environment and economic growth in BRICS economies: Do innovation and globalization matter? Environ. Sci. Pollut. Res. 2022, 98, 4851–4871. [Google Scholar] [CrossRef]
- Raggad, B. Carbon dioxide emissions, economic growth, energy use, and urbanization in Saudi Arabia: Evidence from the ARDL approach and impulse saturation break tests. Environ. Sci. Pollut. Res. 2018, 25, 14882–14898. [Google Scholar] [CrossRef]
- Kahia, M.; Omri, A.; Jarraya, B. Does Green Energy Complement Economic Growth for Achieving Environmental Sustainability? Evidence from Saudi Arabia. Sustainability 2020, 13, 180. [Google Scholar] [CrossRef]
- Adebayo, T.; Awosusi, A.; Oladipupo, S.; Agyekum, E.; Jayakumar, A.; Kumar, N. Dominance of Fossil Fuels in Japan’s National Energy Mix and Implications for Environmental Sustainability. Int. J. Environ. Res. Public Health 2021, 18, 7347. [Google Scholar] [CrossRef]
- Beton Kalmaz, D.; Awosusi, A.A. Investigation of the driving factors of ecological footprint in Malaysia. Environ. Sci. Pollut. Res. 2022, 100, 1–14. [Google Scholar] [CrossRef]
- Xu, Z.; Baloch, M.A.; Danish; Meng, F.; Zhang, J.; Mahmood, Z. Nexus between financial development and CO2 emissions in Saudi Arabia: Analyzing the role of globalization. Environ. Sci. Pollut. Res. 2018, 25, 28378–28390. [Google Scholar] [CrossRef] [PubMed]
- Abbasi, K.R.; Hussain, K.; Haddad, A.M.; Salman, A.; Ozturk, I. The role of Financial Development and Technological Innovation towards Sustainable Development in Pakistan: Fresh insights from consumption and territory-based emissions. Technol. Forecast. Soc. Chang. 2021, 176, 121444. [Google Scholar] [CrossRef]
- Sheraz, M.; Deyi, X.; Sinha, A.; Mumtaz, M.Z.; Fatima, N. The dynamic nexus among financial development, renewable energy and carbon emissions: Moderating roles of globalization and institutional quality across BRI countries. J. Clean. Prod. 2022, 343, 130–150. [Google Scholar] [CrossRef]
- Ahmad, M.; Ahmed, Z.; Bai, Y.; Qiao, G.; Popp, J.; Oláh, J. Financial Inclusion, Technological Innovations, and Environmental Quality: Analyzing the Role of Green Openness. Front. Environ. Sci. 2022, 10, 223–230. [Google Scholar] [CrossRef]
- Ahmed, Z.; Zhang, B.; Cary, M. Linking economic globalization, economic growth, financial development, and ecological footprint: Evidence from symmetric and asymmetric ARDL. Ecol. Indic. 2020, 121, 107060. [Google Scholar] [CrossRef]
- Kihombo, S.; Saud, S.; Ahmed, Z.; Chen, S. The effects of research and development and financial development on CO2 emissions: Evidence from selected WAME economies. Environ. Sci. Pollut. Res. 2021, 28, 51149–51159. [Google Scholar] [CrossRef]
- Ahmad, M.; Ahmed, Z.; Yang, X.; Hussain, N.; Sinha, A. Financial development and environmental degradation: Do human capital and institutional quality make a difference? Gondwana Res. 2022, 105, 299–310. [Google Scholar] [CrossRef]
- Kirikkaleli, D.; Güngör, H.; Adebayo, T.S. Consumption-based carbon emissions, renewable energy consumption, financial development and economic growth in Chile. Bus. Strat. Environ. 2021, 31, 1123–1137. [Google Scholar] [CrossRef]
- Kirikkaleli, D.; Adebayo, T.S. Do renewable energy consumption and financial development matter for environmental sustainability? New global evidence. Sustain. Dev. 2020, 29, 583–594. [Google Scholar] [CrossRef]
- Adebayo, T.S.; Awosusi, A.A.; Bekun, F.V.; Altuntaş, M. Coal energy consumption beat renewable energy consumption in South Africa: Developing policy framework for sustainable development. Renew. Energy 2021, 175, 1012–1024. [Google Scholar] [CrossRef]
- Akinsola, G.D.; Awosusi, A.A.; Kirikkaleli, D.; Umarbeyli, S.; Adeshola, I.; Adebayo, T.S. Ecological footprint, public-private partnership investment in energy, and financial development in Brazil: A gradual shift causality approach. Environ. Sci. Pollut. Res. 2021, 29, 10077–10090. [Google Scholar] [CrossRef] [PubMed]
- Awosusi, A.A.; Adebayo, T.S.; Altuntaş, M.; Agyekum, E.B.; Zawbaa, H.M.; Kamel, S. The dynamic impact of biomass and natural resources on ecological footprint in BRICS economies: A quantile regression evidence. Energy Rep. 2022, 8, 1979–1994. [Google Scholar] [CrossRef]
- Miao, Y.; Razzaq, A.; Adebayo, T.S.; Awosusi, A.A. Do renewable energy consumption and financial globalisation contribute to ecological sustainability in newly industrialized countries? Renew. Energy 2022, 187, 688–697. [Google Scholar] [CrossRef]
- Awosusi, A.A.; Mata, M.N.; Ahmed, Z.; Coelho, M.F.; Altuntaş, M.; Martins, J.M.; Martins, J.N.; Onifade, S.T. How Do Renewable Energy, Economic Growth and Natural Resources Rent Affect Environmental Sustainability in a Globalized Economy? Evidence From Colombia Based on the Gradual Shift Causality Approach. Front. Energy Res. 2022, 9, 259–271. [Google Scholar] [CrossRef]
- Liu, Q.; Zhao, Z.; Liu, Y.; He, Y. Natural resources commodity prices volatility, economic performance and environment: Evaluating the role of oil rents. Resour. Policy 2022, 76, 102548. [Google Scholar] [CrossRef]
- Adebayo, T.S.; Onifade, S.T.; Alola, A.A.; Muoneke, O.B. Does it take international integration of natural resources to ascend the ladder of environmental quality in the newly industrialized countries? Resour. Policy 2022, 76, 102616. [Google Scholar] [CrossRef]
- Awosusi, A.A.; Xulu, N.G.; Ahmadi, M.; Rjoub, H.; Altuntaş, M.; Uhunamure, S.E.; Akadiri, S.S.; Kirikkaleli, D. The sustainable environment in Uruguay: The roles of financial development, natural resources, and trade globalization. Front. Environ. Sci. 2022, 10, 689–702. [Google Scholar] [CrossRef]
- Tufail, M.; Song, L.; Adebayo, T.S.; Kirikkaleli, D.; Khan, S. Do fiscal decentralization and natural resources rent curb carbon emissions? Evidence from developed countries. Environ. Sci. Pollut. Res. 2021, 28, 49179–49190. [Google Scholar] [CrossRef]
- Dada, J.T.; Adeiza, A.; Noor, A.I.; Marina, A. Investigating the link between economic growth, financial development, urbanization, natural resources, human capital, trade openness and ecological footprint: Evidence from Nigeria. J. Bioecon. 2022, 75, 1–27. [Google Scholar] [CrossRef]
- World Bank. GDP per Capita (constant 2015 US$). 2021. Available online: https://data.worldbank.org/indicator/NY.GDP.PCAP.KD (accessed on 6 June 2022).
- IMF. IMF: Financial Development. 2021. Available online: https://www.imf.org/en/Data (accessed on 6 June 2022).
- Baydoun, H.; Aga, M. The Effect of Energy Consumption and Economic Growth on Environmental Sustainability in the GCC Countries: Does Financial Development Matter? Energies 2021, 14, 5897. [Google Scholar] [CrossRef]
- Majeed, A.; Wang, L.; Zhang, X.; Muniba; Kirikkaleli, D. Modeling the dynamic links among natural resources, economic globalization, disaggregated energy consumption, and environmental quality: Fresh evidence from GCC economies. Resour. Policy 2021, 73, 102204. [Google Scholar] [CrossRef]
- Yang, B.; Jahanger, A.; Usman, M.; Khan, M.A. The dynamic linkage between globalization, financial development, energy utilization, and environmental sustainability in GCC countries. Environ. Sci. Pollut. Res. 2021, 28, 16568–16588. [Google Scholar] [CrossRef] [PubMed]
- Adebayo, T.S.; Awosusi, A.A.; Rjoub, H.; Panait, M.; Popescu, C. Asymmetric Impact of International Trade on Consumption-Based Carbon Emissions in MINT Nations. Energies 2021, 14, 6581. [Google Scholar] [CrossRef]
- Pesaran, M.H.; Yamagata, T. Testing slope homogeneity in large panels. J. Econ. 2008, 142, 50–93. [Google Scholar] [CrossRef] [Green Version]
- Pesaran, M.H. A simple panel unit root test in the presence of cross-section dependence. J. Appl. Econ. 2007, 22, 265–312. [Google Scholar] [CrossRef] [Green Version]
- Westerlund, J. Testing for Error Correction in Panel Data. Oxf. Bull. Econ. Stat. 2007, 69, 709–748. [Google Scholar] [CrossRef] [Green Version]
- Phillips, P.C.B.; Hansen, B.E. Statistical Inference in Instrumental Variables Regression with I (1) Processes. Rev. Econ. Stud. 1990, 57, 99–125. [Google Scholar] [CrossRef]
- Stock, J.H.; Watson, M.W. A simple estimator of cointegrating vectors in higher order integrated systems. Econometrica 1993, 61, 783–820. [Google Scholar] [CrossRef]
- Kao, C.; Chiang, M.-H. On the estimation and inference of a cointegrated regression in panel data. In Nonstationary Panels, Panel Cointegration, and Dynamic Panels; Emerald Group Publishing Limited: Bingley, UK, 2004; pp. 179–222. [Google Scholar] [CrossRef] [Green Version]
- Driscoll, J.C.; Kraay, A.C. Consistent Covariance Matrix Estimation with Spatially Dependent Panel Data. Rev. Econ. Stat. 1998, 80, 549–560. [Google Scholar] [CrossRef]
- Machado, J.A.F.; Santos Silva, J. Quantiles via moments. J. Econom. 2019, 213, 145–173. [Google Scholar] [CrossRef]
- Koenker, R. Quantile regression for longitudinal data. J. Multivar. Anal. 2004, 91, 74–89. [Google Scholar] [CrossRef] [Green Version]
- Pesaran, M.H. Testing Weak Cross-Sectional Dependence in Large Panels. Econ. Rev. 2014, 34, 1089–1117. [Google Scholar] [CrossRef] [Green Version]
- Pedroni, P. Panel Cointegration: Asymptotic and Finite Sample Properties of Pooled Time Series Tests with an Application to the PPP Hypothesis. Econom. Theory 2004, 20, 597–625. [Google Scholar] [CrossRef] [Green Version]
- Shahbaz, M.; Balsalobre-Lorente, D.; Sinha, A. Foreign direct Investment–CO2 emissions nexus in Middle East and North African countries: Importance of biomass energy consumption. J. Clean. Prod. 2019, 217, 603–614. [Google Scholar] [CrossRef] [Green Version]
- Yuping, L.; Ramzan, M.; Xincheng, L.; Murshed, M.; Awosusi, A.A.; Bah, S.I.; Adebayo, T.S. Determinants of carbon emissions in Argentina: The roles of renewable energy consumption and globalization. Energy Rep. 2021, 7, 4747–4760. [Google Scholar] [CrossRef]
- Xu, D.; Salem, S.; Awosusi, A.A.; Abdurakhmanova, G.; Altuntaş, M.; Oluwajana, D.; Kirikkaleli, D.; Ojekemi, O. Load Capacity Factor and Financial Globalization in Brazil: The Role of Renewable Energy and Urbanization. Front. Environ. Sci. 2022, 9, 689–702. [Google Scholar] [CrossRef]
- Ahmad, M.; Ahmed, Z.; Majeed, A.; Huang, B. An environmental impact assessment of economic complexity and energy consumption: Does institutional quality make a difference? Environ. Impact Assess. Rev. 2021, 89, 106603. [Google Scholar] [CrossRef]
- Genç, M.C.; Ekinci, A.; Sakarya, B. The impact of output volatility on CO2 emissions in Turkey: Testing EKC hypothesis with Fourier stationarity test. Environ. Sci. Pollut. Res. 2021, 29, 3008–3021. [Google Scholar] [CrossRef]
- Khan, S.; Yahong, W.; Chandio, A.A. How does economic complexity affect ecological footprint in G-7 economies: The role of renewable and non-renewable energy consumptions and testing EKC hypothesis. Environ. Sci. Pollut. Res. 2022, 25, 1–14. [Google Scholar] [CrossRef]
- Grossman, G.M.; Krueger, A.B. Economic Growth and the Environment. Q. J. Econ. 1995, 110, 353–377. [Google Scholar] [CrossRef] [Green Version]
Figure 1.
Plots for MMQR estimates.

Figure 2.
Results of the comparison of the three estimators and MMQR.


Table 1.
Details of the dataset used.
| Symbol | Indicators | Measurement | Source |
|---|---|---|---|
| CO2 | Carbon emission | Per capita emissions | BP [4] |
| GDP | Economic growth | GDP per capita (constant 2010$) | WDI [42] |
| ENE | Energy consumption | Energy use (kg of oil equivalent per capita) | |
| NR | Natural resources | Total natural resource rents (% of GDP) | |
| FD | Financial development | A broad measure of financial development (index) | IMF [43] |
Note: WDI-World development indicators; BP: British Petroleum database, IMF: International Monetary Fund.
Table 2.
Outcome of CSD test and Slope homogeneity test.
| CSD Outcome | ||
|---|---|---|
| Parameters | Pesaran Scale LM | Breusch–Pagan LM |
| CO2 | 18.7184 * | 18.5934 * |
| GDP | 7.5946 * | 7.4726 * |
| GDP2 | 7.6577 * | 7.5327 * |
| EN | 26.1795 * | 26.0545 * |
| NR | 48.7027 * | 48.5777 * |
| FD | 11.1249 * | 10.9999 * |
| ENE*FD | 8.0873 * | 7.9623 * |
| Slope Homogeneity Test Results | ||
| 1.694 | 0.090 *** | |
| 2.054 | 0.040 ** | |
*, **, and *** portrays rejecting the null hypothesis at 0.01, 0.05, and 0.1 level of significance.
Table 3.
Unit root test results.
| Variable | CIPS | CADF | ||
|---|---|---|---|---|
| I (0) | I (1) | I (0) | I (1) | |
| CO2 | −2.059 | −5.043 * | −1.681 | −3.585 * |
| GDP | −1.481 | −2.733 *** | −1.594 | −2.734 * |
| EN | −2.648 | −3.808 * | −2.346 | −3.375 * |
| NR | −3.101 | −5.314 * | −0.762 | −2.832 * |
| FD | −3.004 | −4.887 * | −2.386 | −3.466 * |
| ENE*FD | −2.897 | −4.853 * | −2.266 | −3.402 * |
* and *** portrays rejecting the null hypothesis at 1% and 10% significance level, respectively.
Table 4.
Results of Westerlund [50] cointegration test.
Table 4.
Results of Westerlund [50] cointegration test.
| Statistic | Value | Z-Value | Robust p-Value |
|---|---|---|---|
| Gt | −2.336 | 2.205 | 0.500 |
| Ga | −2.524 | 4.730 | 0.000 * |
| Pt | −5.976 | 1.265 | 0.000 * |
| Pa | −5.431 | 3.134 | 0.000 * |
* portrays rejecting the null hypothesis at 1% significance level.
Table 5.
Result of DOLS, FMOLS, and FE-OLS.
| GDP | GDP2 | EN | NR | FD | ENE*FD | |
|---|---|---|---|---|---|---|
| FMOLS | 0.0423 a | −0.2328 a | 0.3791 a | 0.0901 a | 4.4327 a | −1.0826 a |
| DOLS | 0.0477 a | −0.2572 a | 0.3807 a | 0.0840 a | 4.2071 a | −1.0270 a |
| OLS | 0.0251 a | −0.1360 a | 0.6760 a | 0.1065 a | 2.2860 a | −0.5168 a |
a portrays rejecting the null hypothesis at 0.01 level of significance.
Table 6.
MMQR estimation report.
| Variable | Locat. | Scale | 10th | 20th | 30th | 40th | 50th | 60th | 70th | 80th | 90th |
|---|---|---|---|---|---|---|---|---|---|---|---|
| GDP | 0.0322 | 0.0089 | 0.0196 b | 0.0227 a | 0.0258 a | 0.0276 a | 0.0308 a | 0.0343 a | 0.0376 a | 0.0414 a | 0.0461 a |
| GDP2 | 0.1761 | 0.0435 | −0.1149 a | −0.1300 a | −0.1453 a | −0.1539 a | −0.1692 a | −0.1864 a | −0.2025 a | −0.2210 a | −0.2441 a |
| EN | 0.8333 | 0.1129 | 0.6746 a | 0.7136 a | 0.7535 a | 0.7757 a | 0.8154 a | 0.8598 a | 0.9017 a | 0.9495 a | 1.0095 a |
| NR | 0.0952 | 0.0210 | 0.1248 a | 0.1175 a | 0.1101 a | 0.1059 a | 0.0985 a | 0.0902 a | 0.0824 a | 0.0735 a | 0.0623 a |
| FD | 0.4445 | 1.4599 | 2.4957 b | 1.9908 c | 1.4754 a | 1.1890 a | 0.6750 b | 0.1016a | −0.4402 | −1.0575 | −1.8331 |
| EN*FD | 0.0952 | 0.3709 | −0.6173 b | −0.4890 c | −0.3581 c | −0.2853 a | −0.1548 b | −0.0091 b | 0.1284 a | 0.2852 c | 0.4823 a |
a, b, and c portrays rejecting the null hypothesis at 0.01, 0.05, and 0.1 level of significance.
Table 7.
Causality test.
| Causal Movement | W-Stat | Zbar-Stat. |
|---|---|---|
| GDP → CO2 | 2.41212 * | 1.88813 |
| CO2 → GDP | 2.08729 | 1.41881 |
| GDP2 → CO2 | 2.42105 *** | 1.90103 |
| CO2 → GDP2 | 2.06278 | 1.38341 |
| EN → CO2 | 0.87363 | −0.33467 |
| CO2 → EN | 2.44104 *** | 1.92991 |
| NR → CO2 | 0.36184 | −1.07408 |
| CO2 → NR | 0.62543 | −0.69326 |
| FD → CO2 | 2.24396 *** | 1.64518 |
| CO2 → FD | 0.94681 | −0.22894 |
| ENE*FD → CO2 | 2.19608 | 1.57600 |
| CO2 → ENE*FD | 0.89314 | −0.30648 |
* and *** portrays rejecting the null hypothesis at 0.01 and 0.1 level of significance.
Publisher’s Note: MDPI stays neutral with regard to jurisdictional claims in published maps and institutional affiliations. |
© 2022 by the authors. Licensee MDPI, Basel, Switzerland. This article is an open access article distributed under the terms and conditions of the Creative Commons Attribution (CC BY) license (https://creativecommons.org/licenses/by/4.0/).
Share and Cite
MDPI and ACS Style
Omer, H.; Bein, M. Does the Moderating Role of Financial Development on Energy Utilization Contributes to Environmental Sustainability in GCC Economies? Energies 2022, 15, 4663. https://doi.org/10.3390/en15134663
AMA Style
Omer H, Bein M. Does the Moderating Role of Financial Development on Energy Utilization Contributes to Environmental Sustainability in GCC Economies? Energies. 2022; 15(13):4663. https://doi.org/10.3390/en15134663
Chicago/Turabian StyleOmer, Halmat, and Murad Bein. 2022. "Does the Moderating Role of Financial Development on Energy Utilization Contributes to Environmental Sustainability in GCC Economies?" Energies 15, no. 13: 4663. https://doi.org/10.3390/en15134663
Note that from the first issue of 2016, this journal uses article numbers instead of page numbers. See further details here.