Article

A Hybrid Taguchi Particle Swarm Optimization Algorithm for Reactive Power Optimization of Deep-Water Semi-Submersible Platforms with New Energy Sources

1
College of Intelligent Systems Science and Engineering, Harbin Engineering University, Harbin 150001, China
2
Innovation Laboratory for Science and Technologies of Energy Materials of Fujian Province (IKKEM), Xiamen 361005, China
3
Comac Beijing Civil Aircraft Center, Beijing 102209, China
*
Author to whom correspondence should be addressed.
Energies 2022, 15(13), 4565; https://doi.org/10.3390/en15134565
Submission received: 10 May 2022 / Revised: 17 June 2022 / Accepted: 20 June 2022 / Published: 22 June 2022

Abstract

:
In order to realize the sustainable development of energy, the combination of new energy power generation technology and the traditional offshore platform has excellent research prospects. The access to new energy sources can provide a powerful supplement to the power grid of the offshore platform, but will also create new challenges for the planning, operation, and control of the power grid of the platform; hence, it is very important to optimize the reactive power of the offshore platform with new study, a mathematical model was first built for the reactive power optimization of offshore platform power systems with new energy sources, and the Taguchi method was then used to optimize the parameters and population of particle swarm optimization, thereby addressing a defect in particle swarm optimization, namely, that it can easily fall into local optimal solutions. Finally, the algorithm proposed in this paper was applied to solve the reactive power optimization problem of the offshore platform power system with new energy sources. The experimental results show that the proposed algorithm has stronger optimization ability, reduces the system active power loss to the greatest extent, and improves the voltage quality. These results provide theoretical support for the practical application and optimization of the deep-water semi-submersible production platform integrated with new energy sources.

1. Introduction

As a result of the continual improvement in new energy power generation technology represented by wind and photovoltaic power generation, this technology has been widely applied to various island power generation systems. The power generation equipment of traditional offshore platforms comprises mainly diesel generator sets or gas turbine generator sets. The application of new energy power generation technology in the power system of offshore platforms can save fuel, and improve power supply reliability and energy efficiency. However, new energy power generation also has greater requirements regarding the stability and safety of the power system of the offshore platform. For a deep-water semi-submersible platform power system with new energy sources, the reactive power balance is a very important research topic. A reasonable distribution of the reactive power of the platform power system can ensure the platform power system operates under safe and stable operating conditions. Therefore, the reactive power optimization of the power system of the deep-water semi-submersible platform with new energy sources, as examined in this study, can reduce the platform’s active power loss and operating cost, and improve the quality and safety of power supply. This has very important research significance for offshore platforms integrating new energy sources.
The reactive power optimization algorithm is an important part of power system reactive power optimization, and the performance of the algorithm determines the optimization results. As a result of the rapid development of computer technology and mathematical theory, many kinds of reactive power optimization algorithms have emerged, which can be roughly divided into traditional algorithms and artificial intelligence algorithms. However, traditional methods have a number of problems, such as: dependence on an accurate model; strict initial value; and “dimensional disaster” [1,2]. In order to address the disadvantages of traditional methods, various artificial intelligence algorithms have been applied to solve the reactive power optimization problem of power systems. In [3], the author undertook a comprehensive review in combination with previous studies on the reactive power optimization of power systems, and noted the advantages and limitations of various artificial intelligence algorithms in solving reactive power optimization problems of power systems. Various artificial intelligence algorithms, such as elephant herding optimization (EHO) [4], slime mold algorithm (SMA) [5], tabu search (TS) [6], earthworm optimization algorithm (EWA) [7], Harris hawks optimization (HHO) [8], enhancement of the general DE algorithm (NSODE and C-DEEPSO) [9,10], and particle swarm optimization (PSO) [11,12,13].
Particle swarm optimization (PSO) is widely used because of its small number of parameter settings and simple structure. However, the particle swarm optimization (PSO) algorithm also has the problem of being easily trapped in a local optimum. Based on this, many researchers have improved the particle swarm optimization (PSO) algorithm [10,11,12,13,14]. Jiang et al. [14] proposed an improved adaptive particle swarm algorithm with guiding strategy (GSAPSO), which was applied to reactive power optimization (RPO). In [15,16], the author proposed a hybrid technique of grey wolf optimization and particle swarm optimization (GMO-PSO) to improve the performance of the algorithm by effectively controlling the local search and pushing the algorithm towards the direction of global optimization, and applied it to the solution of optimal reactive power scheduling (ORPD) problems within the grid. Liu et al. [17] studied the reactive power optimization problem of photovoltaic power generation penetration distribution networks, and used the improved PSO to reduce the inertia weight factor at linear speed in the iterative process. The Taguchi method is a low-cost and high-efficiency quality engineering method, which uses an orthogonal array and the signal-to-noise ratio (SNR) to determine the optimal parameter setting of the system with the least number of tests, thereby improving the performance of the system [18,19,20]. Chen et al. [21] used the Taguchi method to identify the three parameters of the particle swarm optimization (PSO), namely, inertia weight ω , and acceleration coefficients c 1 and c 2 . Based on particle swarm optimization with nonlinear time-varying evolution (PSO-NTVE) [22], Tsai et al. [23] further executed Taguchi-based crossover to find the best particles. Chen et al. [24] proposed a Taguchi particle swarm optimization (TPSO) to solve optimal reactive power flow problems.
For this reason, this study first took the power system of the actual deep-water semi-submersible oil production platform as the research object, added the wind power and photovoltaic power generation systems to the platform power system, took the active power network loss and voltage deviation as the objective function, and established the mathematical model of reactive power optimization. In this paper, the basic principle of the Taguchi method is also briefly introduced. The parameters and populations of the particle swarm optimization algorithm were optimized and improved using the Taguchi method. Finally, the algorithm was applied to the reactive power optimization of the deep-water semi-submersible platform power system with new energy sources, and the results were compared with those of other existing algorithms. The experimental results demonstrate the effectiveness and superiority of the proposed algorithm.

2. Problem Formulation

Reactive power optimization of the power system of a deep-water semi-submersible production platform with new energy sources involves the adjustment of the key parameters of the system to reduce the system’s power loss and improve the voltage quality to the maximum extent under various constraints. The operation performance of the platform power system is optimized by adjusting the terminal voltage of the synchronous generator, the tap position of the on-load voltage regulating transformer, and the reactive power output of the new energy power generation system. Therefore, it is necessary to establish the corresponding mathematical model of reactive power optimization, which can be divided into two aspects: objective function and constraint conditions.

2.1. Objective Function

According to the different emphasis of the reactive power optimization calculation, the objective function differs. Considering the economy and security of the platform power system, in this study, the minimum active power loss and voltage deviation were chosen as the objective function.

2.1.1. Minimum Active Power Losses

The active power loss of the power system is often regarded as one of the important indexes of the system operation’s economy. Therefore, the expression with the minimum active power loss as the objective function is as follows:
min P l o s s = m i n i , j N B G i j ( V i 2 + V j 2 2 V i V j cos θ i j )
where V i and V j are the voltage magnitude at buses i and j, respectively; G i j and θ i j are the conductance and voltage angle difference between bus i and j; and N B is the total number of buses.

2.1.2. Minimum Voltage Deviation

Voltage is one of the most basic and important safety and service quality indicators affecting power quality. The smaller the voltage deviation, the more stable the system and the better the power quality. Therefore, the expression with the minimum voltage deviation as the objective function is as follows:
m i n   Δ V = m i n i = 1 N L | V i V i * |
where V i * is the desired voltage magnitude, and usually V i * = 1; N L is the number of load buses.
For different objective functions, the optimal solution is different, and comprehensive consideration is needed to obtain a compromise solution. In order to reduce the active power loss to the greatest extent on the premise of improving the voltage quality, this paper uses the weight factor to realize the transformation from multiple objectives to a single objective. Due to the large dimensional difference in the value of the objective function, it is necessary to transform it into a standard value for processing. The expression of the converted objective function is shown as follows:
min F = m i n { ω 1 P l o s s P l o s s , 0 + ω 2 Δ V Δ V 0 }
where ω represents the weight coefficients; Δ V 0 is the voltage deviation before reactive power optimization; P l o s s , 0 represents the line active power loss before reactive power optimization.
For the reactive power optimization problem in this paper, the priority is to minimize the active power loss and the minimum voltage deviation, so the weight coefficients are selected as ω 1 = 0.8, ω 2 = 0.2.

2.2. Constraints

In the reactive power optimization problem of the power system of the deep-water semi-submersible production platform with new energy sources, the feasible solution of the optimization problem must be within the range of various constraints, which can be divided into the following two kinds.

2.2.1. Equality Constrains

The equality constraints are typical load flow equations, including the active power constraint equation and the reactive power constraint equation. These can be formulated as follows:
{ P G i + P D G i P L i V i j N i V j ( G i j cos θ i j + B i j sin θ i j ) = 0 Q G i + Q D G i Q L i V i j N i V j ( G i j sin θ i j B i j cos θ i j ) = 0
where P G i and Q G i are the active power and reactive power of the generator at bus i; P D i and Q D i are the active power and reactive power of the load demand at bus i; B i j is the susceptance between bus i and j; and N i is the set of buses connected with the bus i.

2.2.2. Inequality Constraints

Inequality constraints can be divided into control variable constraints and state variable constraints. Control variables include generator bus voltage, transformer tap position, and reactive power compensation capacity of the shunt capacitor. State variables include load bus voltage and generator reactive power.
Control variable constraints:
{ V G i m i n V G i V G i m a x   , i N G T k i m i n T k i T k i m a x   , i N T Q C i m i n Q C i Q C i m a x   , i N C
State variable constraints:
{ V L i m i n V L i V L i m a x   , i N L Q G i m i n Q G i Q G i m a x   , i N G
where V G i is the voltage magnitude of the generator; Q C i is the compensation capacity of the shunt capacitor; T k i is the tap position of the transformer; V L i is the voltage magnitude of the load bus; Q G i is the reactive power of the generator; N G , N T , and N C are the number of generators, transformers, and capacitor banks, respectively.

3. Proposed Method

The particle swarm optimization (PSO) algorithm is widely used in many optimization problems because of its fast convergence speed, simple rules, and easy implementation. However, particle swarm optimization (PSO) is also prone to being trapped in a local optimum in later periods. Through the Taguchi method, particle swarm optimization (PSO) was improved to avoid premature convergence.

3.1. Particle Swarm Optimization

Particle swarm optimization (PSO) is an evolutionary computation technique that was first proposed in 1995 by Kennedy and Eberhart. Its basic principle is to randomly generate a swarm of particles, which are regarded as a potential solution to the problem to be optimized. Each particle moves at a different velocity, and then the fitness function value is used to judge the quality of each particle. By tracking the optimal particles in the population (one is the best position of the current particle itself, the other is the best position of the entire population), the particles update their velocity and position, and obtain the optimal solution of the optimization problem through multiple iterations. The velocity and position of particle i are updated by the following equations:
V i k + 1 = ω V i k + c 1 r 1 ( p b e s t i k x i k ) + c 2 r 2 ( g b e s t k x i k ) .  
x i k + 1 = x i k + V i k + 1
where V i k is the current velocity of particle i at iteration k; ω is the inertia weight; c 1 , c 2 are the acceleration coefficients; r 1 , r 2 are random numbers within [0, 1]; p b e s t i k is the best individual position of particle i at iteration k; g b e s t k is the best global position of the entire population at iteration k; x i k is the current position of particle i at iteration k.

3.2. Taguchi Method

The Taguchi method was developed by Dr. Genichi Taguchi in 1985 and applied to quality engineering. This method uses the concept of the SNR, and effectively uses it as an experimental index in orthogonal experimental design to select the optimal level combination of parameters. The Taguchi method has the advantages of fewer experiments, reliable conclusions, good reproducibility, and simple calculation. As a result, it has been widely used.
The SNR is used to find the appropriate level for each factor to improve the quality of the solution. The greater the SNR, the more important the corresponding factor level. The greater the range of the SNR, the greater the influence of the corresponding factor on the system. According to the different application requirements, the SNR can be divided into nominal-the-best characteristics, smaller-the-better characteristics, and larger-the-better characteristics. In this paper, the active power losses and voltage deviation should be as small as possible, that is, smaller-the-better characteristics. The SNR of smaller-the-better characteristics is defined as follows:
S N = 10 l g 1 n i = 1 n y i 2
where y is the output characteristic of the system.

3.3. Proposed Hybrid Algorithm

In order to enhance the global search ability and prevent a premature solution, the Taguchi method was applied to optimize the parameters and population of the particle swarm optimization (PSO).

3.3.1. Strategy for Parameter Tunning

Compared with other optimization algorithms, particle swarm optimization (PSO) has the advantage of fewer adjustment parameters. These parameters directly affect the performance and convergence of the particle swarm optimization (PSO), so the parameter setting is very important. At present, many methods are available to improve the parameters of the particle swarm optimization (PSO). For different optimization problems, various improvement methods have their own advantages. In addition, for a specific optimization problem, the improvement method to be adopted to obtain the best result is an issue that needs to be considered.
(a) Inertia weight   ω
The inertia weight keeps the particle inertia in motion, so that the particle has a tendency to expand the search space and has the ability to explore new areas. A large inertial weight has strong global search capability, but the search efficiency is low. A small inertial weight has strong local search capability, but is easily trapped in a local optimum. Setting a reasonable inertia weight is the key to improving the performance of the particle swarm optimization (PSO). In this paper, the linearly decreasing inertia weight (LDIW) is applied, as shown in Equation (9):
ω = ω m a x ( ω m a x ω m i n ) i t e r I t e r m a x
where ω m a x and ω m i n are the maximum and minimum inertia weights, respectively. i t e r is the current iteration number, and I t e r m a x is the maximum number of iterations.
(b) Acceleration coefficient   c
The acceleration coefficients c 1 and c 2 are used to adjust the maximum step length of particles flying towards the best individual position and the best global position, respectively. They determine the influence of particles’ own experience and group experience on the trajectory of particles, reflecting the information exchange between particles. If c 1 = 0, the particles lack self-cognition ability and only have group experience. The convergence speed is fast. For complex problems, particle swarm optimization (PSO) is easily trapped in a local optimum. If c 2   = 0, the particles only have their own experience, and there is no information exchange between individuals. The possibility of particle swarm optimization (PSO) obtaining the optimal solution is very small. In [18], sine cosine acceleration coefficients (SCAC) were introduced to efficiently control the local search ability and global search ability.
{ c 1 = sin ( ( 1 i t e r I t e r m a x ) π 2 ) + δ c 2 = cos ( ( 1 i t e r I t e r m a x ) π 2 ) + δ
where and δ are constant.
(c) Population size N P
When the population size is too small, the running time is short, but the global search capability is weak. As the population size increases, the search space becomes larger, and particle swarm optimization (PSO) can more easily find the global optimal solution. At the same time, the running time is longer. Therefore, it is necessary to comprehensively consider the optimization effect and running time.
The Taguchi method is a powerful tool for parameter design, which determines the best parameter setting with the least number of experiments. Therefore, an improved particle swarm optimization (PSO) based on the Taguchi method was developed, which selects the parameters of inertia weight, acceleration coefficients, and population size. In this paper, the L 16 ( 4 5 ) orthogonal array is chosen to optimize the parameters, as shown in Table 1.
The orthogonal array has 5 factors, namely the maximum inertia weight ω m a x , the minimum inertia weight ω m i n , the two constants and δ of the acceleration coefficient, and the population size N P . Each factor has 4 levels. If the Full-Factorial Experiment is performed, 1024 experiments are required to determine the optimal parameter combination. The Taguchi orthogonal array only needs 16 experiments to obtain the optimal parameter combination. According to the parameters of each group of experiments mentioned above, the particle swarm optimization algorithm was run independently several times, and the experimental results, namely, the fitness function values of the particle swarm optimization algorithm, were recorded. The SNR of each group of experiments was obtained according to the SNR calculation in Formula (9), of the desired small characteristic, and the factor reaction table/graph was drawn, so as to obtain the best parameter combination scheme.

3.3.2. Strategy for Population Optimization

As the number of iterations increases, the population of the particle swarm optimization algorithm (PSO) tends to be similar. As a result, the algorithm searches repeatedly in the solution space of the local optimal solution of the optimization problem, and cannot fully search other solution spaces. In order to improve the diversity of the population of a random sample after the completion of two particles, the Taguchi method is used to extract the best factors in the extraction of the particle and to generate new particles. New particles and extracted particles are compared, and, if a better alternative to the extracted particles is found, the individual extremum and global extremum are updated for the next iteration. In order to obtain better optimization results, particles can also be randomly selected from individual extreme values after each population update. The other steps are the same. This paper uses several common mathematical functions, including Sphere, Rosenbrock, Rastrigin, and Griewank functions, to verify the two population optimization strategies mentioned above.
For these four common mathematical functions, the optimal target value is 0, and their respective function expressions and search ranges are shown in Table 2. Parameters of the particle swarm optimization (PSO) are set as follows: the maximum number of iterations is set to 2000, the population size is set to 60, the inertia weight is set to 0.729, the learning factor is set to 2, the dimension of each function is set to 20, and each function runs independently for 50 times.
Therefore, the experiments were carried out according to the above parameters, and the convergence precision of each function under different population optimization strategies is shown in Table 3.
The above table shows that the algorithm of extracting particles from individual extreme values under the same conditions has better performance; thus, this paper adopts this population optimization strategy. In order to more clearly demonstrate the optimization process of the Taguchi method on the particle swarm optimization algorithm population, an L 8 ( 2 7 ) orthogonal table was selected for a simple demonstration, as shown in Table 4. The rows in the orthogonal table represent the experimental order (1–8), which represent the newly generated particles, and the columns represent the factors (A–G), which represent the dimension of the particles. Each factor has two levels: 1, representing the dimensions of the corresponding particle from the extracted particle; and 2, representing the dimensions of the corresponding particle from the extracted particle.
The Taguchi method is implemented after each population update. The specific steps are as follows:
(1) Two particles are randomly selected from the individual extremum of the current population and denoted P 1 and P 2 ;
(2) The relevant dimensions of the extracted particles P 1 and P 2 are allocated according to the above orthogonal table, so as to generate 8 new particles. The value 1 means from P 1 , 2 means from P 2 ;
(3) The fitness value of each new particle in the orthogonal table is calculated, denoted f i ;
(4) Each factor is evaluated according to the formula below:
E ( f a c t o r , l e v e l ) = i ( l e v e l = 1 ) o r ( l e v e l = 2 ) D f i 2
For example, for level 1 of factor B, there is E ( B , 1 ) = f 1 2 + f 2 2 + f 5 2 + f 6 2 . For level 2 of factor B, there is E ( B , 2 ) = f 3 2 + f 4 2 + f 7 2 + f 8 2 ;
(5) The factors are horizontally assigned to the optimal particle P 0 according to the following rules. For example: E ( B , 1 ) < E ( B , 2 ) , the level value (dimension value) corresponding to the B factor (dimension value) of the P 1 particle is assigned to the optimal particle P 0 . This continues, to generate an optimal particle P 0 and calculate its fitness value;
(6) If the optimal particle P 0 is better than the two selected particles P 1 and P 2 , the poorer particle is replaced and the global optimal value of the population is updated;
(7) The next iteration is continued until the maximum number of iterations is met.
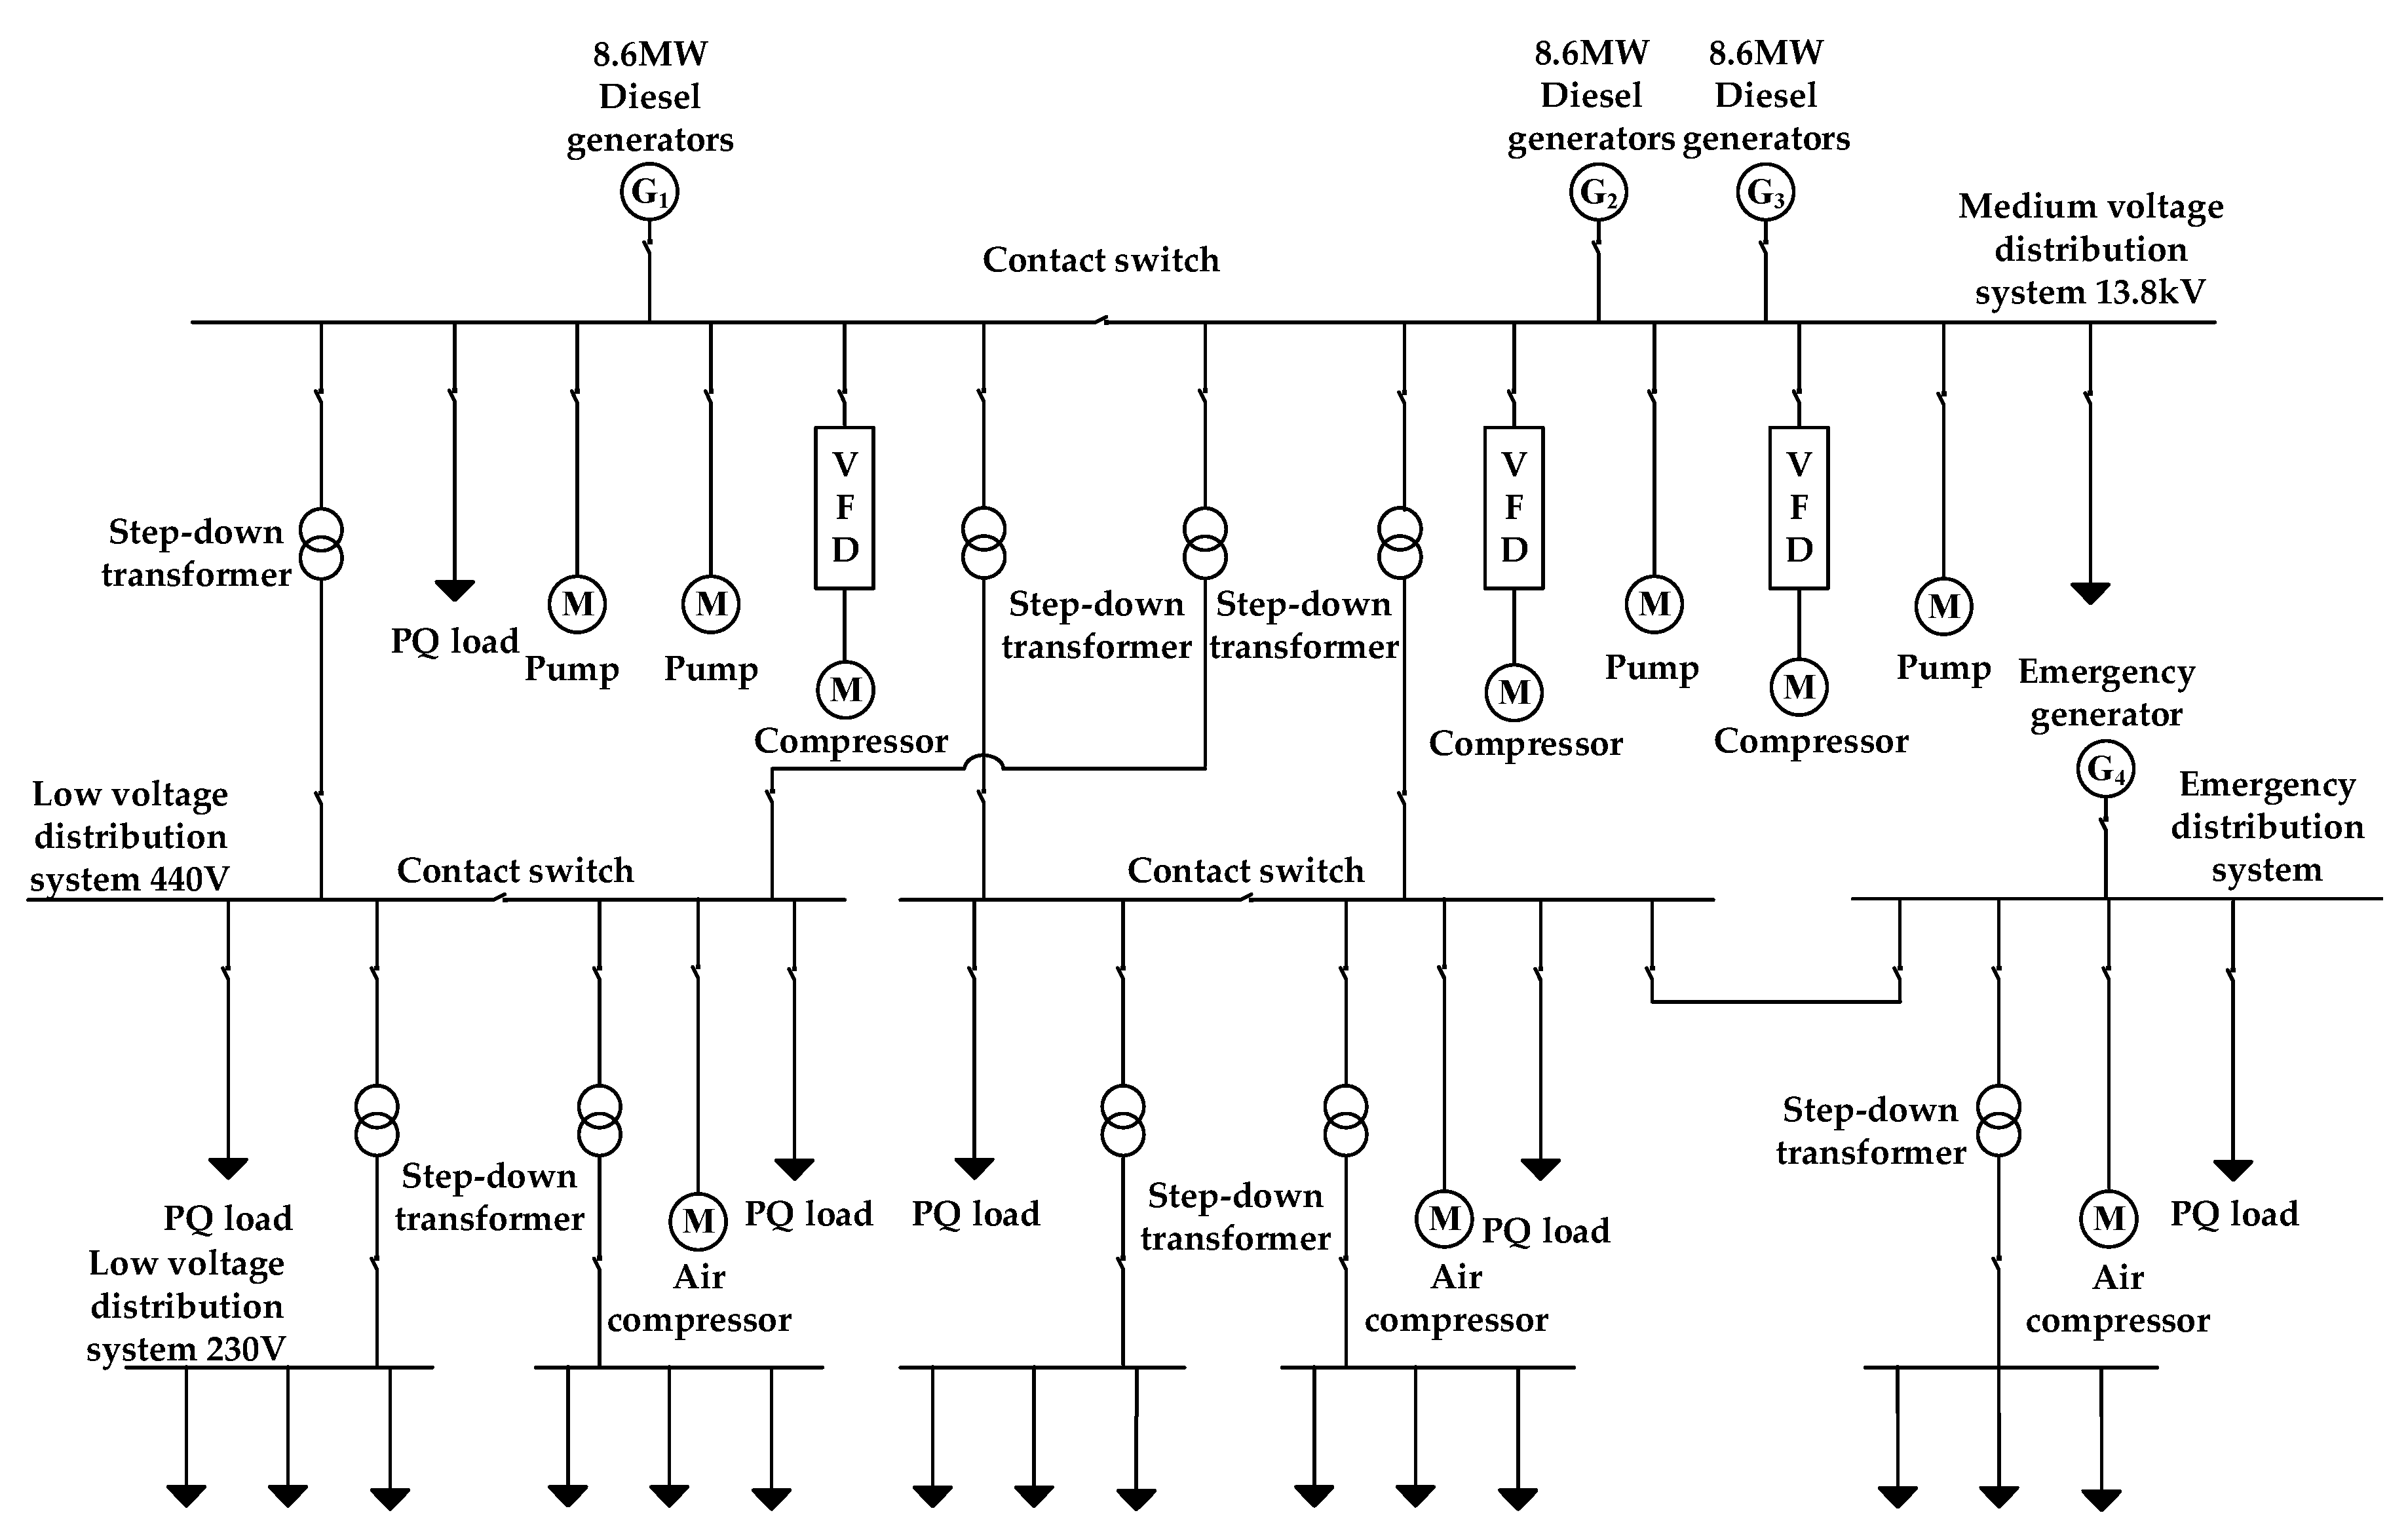
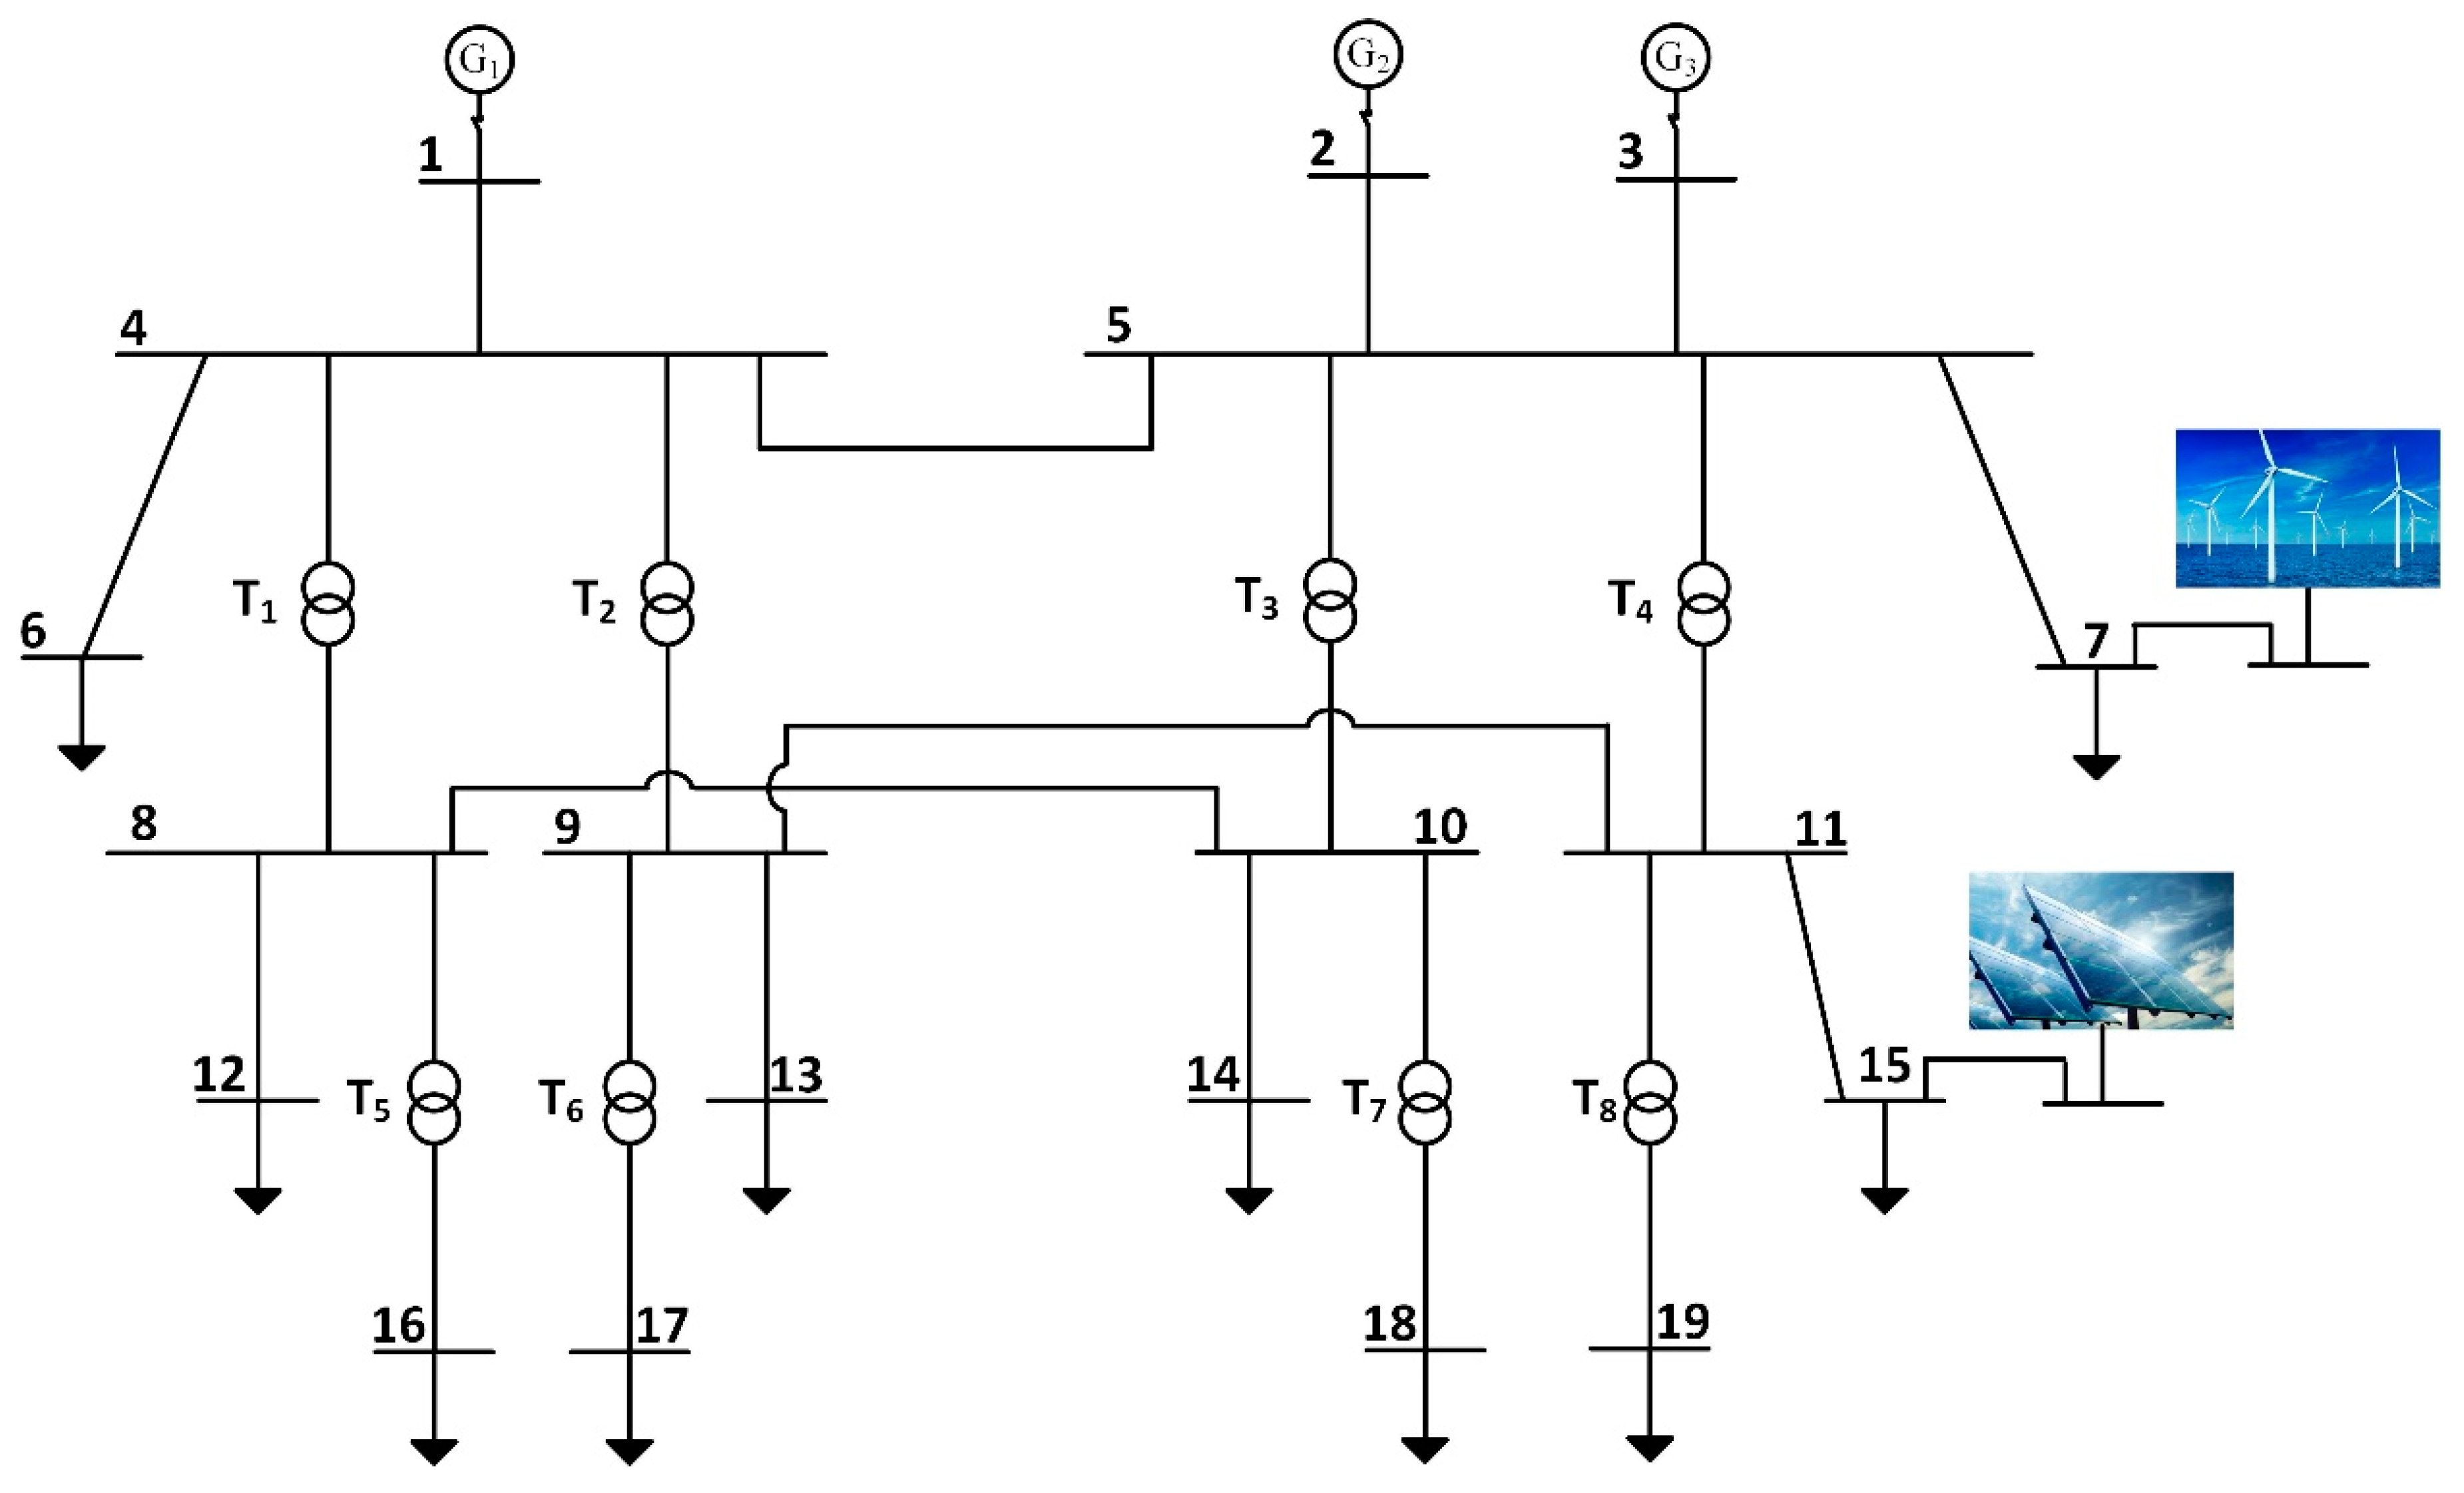
The selection of the orthogonal table should be chosen according to the actual optimization problem. For example, for the deep-water semi-submersible production platform with new energy sources, there are 13 control variables; that is, the particle dimension is 13, and the first 13 columns of the orthogonal table L 16 ( 2 13 ) can be selected.

3.3.3. Algorithm Flowchart

The proposed Taguchi particle swarm optimization (HTPSO) algorithm was applied to solve the reactive power optimization (RPO) problem, Figure 1 is HTPSO algorithm flowchart:

4. Simulation Results

4.1. Power System Structure of Deep-Water Semi-Submersible Production Platform

The deep-water semi-submersible production platform is composed of four power station subsystems and one emergency subsystem, in which the active power of each power station subsystem is 25 MW, and the total power is 100 MW. Under normal operation, each power station subsystem operates independently. In order to facilitate the research, this paper only analyzes a single power station. Its power system structure is shown in Figure 2. Each power station subsystem is composed of three independent diesel generator sets in parallel, the output voltage of each diesel generator set is 13.8 kV, and the active power of each diesel engine is 8.6 MW. The photovoltaic power generation system adopts the form of a series–parallel combination of photovoltaic cells, with a rated power of 200 kW, and a double-fed wind turbine with a rated power of 2 MW. The main loads in the production platform are four 20 MW dry gas compressors, four 20 MW wet gas compressors, typical motor loads, and other household electrical equipment.

4.2. Basic System Data

The topological structure of the power system of the deep-water semi-submersible production platform with new energy sources and the access location of the wind and solar power generation system are shown in Figure 3, where the system is simplified and does not consider the participation of the emergency power generation system. The platform system includes a total of 19 nodes, of which nodes 1, 2, and 3 are diesel generator nodes, and the terminal voltage range is set to [0.95, 1.1]; the grid-connected position of the wind power generation system is node 7, and its active power output is 1 MW; the reactive power output adjustment range is [−0.4, 0.5 Mvar]; the grid-connected position of the photovoltaic power generation system is node 15, its active power output is 0.3 MW, and the reactive power output adjustment range is [−0.1, 0.1 Mvar]. There are 20 branches in the system, among which branches 4–8, 4–9, 5–10, 5–11, 8–16, 9–17, 10–18, and 11–19 are on-load voltage-regulating transformer branches. The transformer tap has a total of nine gears, and the step size is 0.025; that is, the transformation ratio is 1 ± 4 × 2.5% [25]. For the power system of the deep-water semi-submersible production platform with new energy, the control variables include the terminal voltage of the diesel generator set, the tap position of the on-load voltage-regulating transformer, and the reactive power output of the wind and solar power generation systems. According to the calculation of the initial data, the active power loss of the system is 0.774843 MW, and the voltage deviation of the load node is 0.33845 p.u.
Due to the poor optimization ability of the standard particle swarm optimization algorithm, the reactive power optimization of the system is often trapped in the solution space of a local optimal solution, and the optimization results can be further improved. Therefore, the Taguchi method was first used to set the parameters of the particle swarm optimization algorithm according to Table 1. There were 16 groups of experiments, and each group of experiments was run independently 10 times. The SNR of each group of experiments was obtained according to Equation (9), as shown in Table 5:
Based on the SNR results of each group of experiments above, the response table/figure of each factor can be drawn, as shown in Table 6/Figure 4:
The larger the signal-to-noise ratio of O, the more important the factor level. Therefore, the optimal parameter combination of the improved particle swarm optimization algorithm after parameter tuning can be concluded as A3, B3, C4, D1, and E4; that is, ω m a x is 0.8, ω m i n is 0.4, is 1, δ is 0, and N is 40. In the parameter setting, due to using the Taguchi method to optimize the species of the particle swarm optimization (PSO) algorithm, the algorithm has superior performance. For the deep-water semi-submersible platform production with a new energy power system, and a total of 13 control variables, the first 13 columns of the L 16 ( 2 15 ) orthogonal table are chosen. The population optimization steps of Section 3.3.2 are used in a rainfall distribution in an analogy to references [11,14].
The algorithm proposed in this paper was compared with several other improved particle swarm optimization algorithms when applied to the power system of the deep-water semi-submersible production platform containing new energy sources. Figure 5 shows the adaptability convergence curve of the algorithm proposed in this paper and several other improved algorithms when applied to the power system of the platform containing new energy sources.
In the figure, PSO is the standard particle swarm optimization algorithm; PSO-LDIW is a particle swarm optimization with a linear decrease in inertia weight; PSO-SCAC is the particle swarm optimization of the learning factor sine and cosine changes; TPSO1 is an improved particle swarm optimization algorithm that only adopts a parameter tuning strategy; TPSO2 is an improved particle swarm optimization algorithm using only a population optimization strategy; and HTPSO is the algorithm proposed in this paper. By comparing the convergence curves of fitness, it can be seen that the algorithm proposed in this paper has better convergence and robustness. The control variable results of each algorithm after optimization are shown in Table 7.
Table 7 shows the active power loss and voltage deviation after optimization of various algorithms. Compared with the initial active power loss of 0.74843 MW, the active power loss after optimization of other algorithms is reduced by 13.31%, 16.89%, 15.25%, 19.17%, and 15.70%, respectively, and the active power loss after optimization of the proposed algorithm is reduced by 20.98%. Similarly, compared with the initial voltage deviation of 0.33845 p.u., the optimized voltage deviation of other algorithms is reduced by 22.29%, 44.63%, 40.06%, 61.74%, and 61.45% respectively. The optimized voltage deviation of the algorithm proposed in this paper is reduced by 70.11%, which is obviously superior to that of other algorithms. The active power network loss of each optimization algorithm is shown in Figure 6, and the voltage distribution is shown in Figure 7.
Overall, compared with other improved algorithms, the proposed algorithm can reduce, to a great extent, the energy loss on platforms with new energy power systems and improve the power quality, ensure that the electrical equipment has a safe and stable operation status, and increase the economy and reliability of the platform of the power system. This provides theoretical support for the practical application and optimization of integrating new energy sources into deep-water semi-submersible production platforms, and has certain reference value.

5. Conclusions

Based on the practical deep-water semi-submersible production platform and combined with the reactive power regulation ability of new energy sources, this study examined the reactive power optimization problem of the deep-water semi-submersible production platform with new energy sources. The main research results are as follows:
(1)
The mathematical model of reactive power optimization for the power system of the deep-water semi-submersible production platform with new energy sources was established. In this model, the minimum active power loss and voltage deviation are selected as objective functions, and the weight factor is used to realize the transformation from multiple objectives to a single objective.
(2)
To address the defect of particle swarm optimization (PSO), namely, that it can easily fall into a local optimum, the parameters and population of particle swarm optimization are optimized by the Taguchi method, and the optimal parameter combination is set as ω m a x is 0.8, ω m i n is 0.4, is 1, δ is 0, and N is 40. These parameters are used to improve the iterative optimization ability of the particle swarm optimization (PSO).
(3)
According to the established reactive power optimization mathematical model and the proposed algorithm, the reactive power optimization of the deep-water semi-submersible production platform integrated with new energy sources was carried out. The optimized active power loss and voltage deviation were reduced by 20.98% and 70.11%, respectively, compared with the initial situation. The proposed algorithm can minimize the active power loss of the system and improve the power quality, so that the system can run safely, economically, and stably.

Author Contributions

Conceptualization, P.C.; data curation, C.S.; funding acquisition, P.C.; investigation, P.C. and R.L.; methodology, Z.X. and C.S.; project administration, P.C. and R.L.; resources, P.C.; software, Z.X.; validation, Z.X., R.L. and C.S.; visualization, C.S.; writing—original draft, Z.X.; writing—review & editing, Z.X. All authors have read and agreed to the published version of the manuscript.

Funding

This research was funded by [Science and Technology Projects of Innovation Laboratory for Sciences and Technologies of Energy Materials of Fujian Province] grant number [RD2021020504].

Acknowledgments

The authors acknowledge the support of Science and Technology Projects of Innovation Laboratory for Sciences and Technologies of Energy Materials of Fujian Province (IKKEM) project number RD2021020504.

Conflicts of Interest

The authors declare no conflict of interest.

References

  1. Polprasert, J.; Ongsakul, W.; Dieu, V.N. Optimal Reactive Power Dispatch Using Improved Pseudo-gradient Search Particle Swarm Optimization. Electr. Power Compon. Syst. 2016, 44, 518–532. [Google Scholar] [CrossRef]
  2. Badar, A.Q.H.; Umre, B.S.; Junghare, A.S. Reactive power control using dynamic Particle Swarm Optimization for real power loss minimization. Int. J. Electr. Power Energy Syst. 2012, 41, 133–136. [Google Scholar] [CrossRef]
  3. Rojas, D.G.; Lezama, J.L.; Villa, W. Metaheuristic techniques applied to the optimal reactive power dispatch: A review. IEEE Lat. Am. Trans. 2016, 14, 2253–2263. [Google Scholar] [CrossRef]
  4. Dhillon, S.S.; Agarwal, S.; Wang, G.-G.; Lather, J.S. Automatic generation control of interconnected power systems using elephant herding optimization. Intell. Comput. Tech. Smart Energy Syst. 2020, 607, 9–18. [Google Scholar]
  5. Manar, M.; Hegazy, R.; Mokhtar, A.; Ahmed, E.M. A new strategy based on slime mould algorithm to extract the optimal model parameters of solar PV panel. Sustain. Energy Technol. Assess. 2020, 42, 100849. [Google Scholar]
  6. Uniyal, A.; Sarangi, S. Optimal network reconfiguration and DG allocation using adaptive modified whale optimization algorithm considering probabilistic load flow. Electr. Power Syst. Res. 2021, 192, 106909. [Google Scholar] [CrossRef]
  7. Ghosh, I.; Roy, P.K. Application of earthworm optimization algorithm for solution of optimal power flow. In Proceedings of the 2019 International Conference on Opto-Electronics and Applied Optics (Optronix), Kolkata, India, 18–20 March 2019; p. 8862335. [Google Scholar]
  8. Qu, C.; He, W.; Peng, X.; Peng, X. Harris Hawks optimization with information exchange. Appl. Math. Model. 2020, 84, 52–75. [Google Scholar] [CrossRef]
  9. Gao, D.; Wang, G.G.; Pedrycz, W. Solving fuzzy job-shop scheduling problem using DE algorithm improved by a selection mechanism. IEEE Trans. Fuzzy Syst. 2020, 28, 3265–3275. [Google Scholar] [CrossRef]
  10. Marcelino, C.G.; Avancini, J.V.C.; Delgado, C.A.D.M.; Wanner, E.F.; Jiménez-Fernández, S.; Salcedo-Sanz, S. Dynamic Electric Dispatch for Wind Power Plants: A New Automatic Controller System Using Evolutionary Algorithms. Sustainability 2021, 13, 11924. [Google Scholar] [CrossRef]
  11. Sahli, Z.; Hamouda, A.; Bekrar, A.; Trentesaux, D. Reactive Power Dispatch Optimization with Voltage Profile Improvement Using an Efficient Hybrid Algorithm. Energies 2018, 11, 2134. [Google Scholar] [CrossRef] [Green Version]
  12. Bayat, A.; Bagheri, A. Optimal active and reactive power allocation in distribution networks using a novel heuristic approach. Appl. Energy 2019, 233, 71–85. [Google Scholar] [CrossRef]
  13. Chen, K.; Zhou, F.; Yin, L.; Wang, S.; Wang, Y.; Wan, F. A hybrid particle swarm optimizer with sine cosine acceleration coefficients. Inf. Sci. 2018, 422, 218–241. [Google Scholar] [CrossRef]
  14. Jiang, F.; Zhang, Y.; Zhang, Y.; Liu, X.; Chen, C. An Adaptive Particle Swarm Optimization Algorithm Based on Guiding Strategy and Its Application in Reactive Power Optimization. Energies 2019, 12, 1690. [Google Scholar] [CrossRef] [Green Version]
  15. Mahapatra, S.; Badi, M.; Raj, S. Implementation of PSO it’s variants and Hybrid GWO-PSO for improving Reactive Power Planning. In Proceedings of the Global Conference for Advancement in Technology (GCAT), Bangalore, India, 18–20 October 2019; pp. 1–6. [Google Scholar]
  16. Shaheen, M.A.M.; Hasanien, H.M.; Alkuhayli, A. A novel hybrid GWO-PSO optimization technique for optimal reactive power dispatch problem solution. Ain Shams Eng. J. 2021, 12, 621–630. [Google Scholar] [CrossRef]
  17. Liu, H.; Huang, G.; Wang, C.; Wang, Z.; Liu, H.; Xu, Z.; Shi, L. Reactive power optimization of power grid with photovoltaic generation based on improved particle swarm optimization. In Proceedings of the 2019 IEEE Innovative Smart Grid Technologies-Asia (ISGT Asia), Chengdu, China, 21–24 May 2019; pp. 1536–1540. [Google Scholar]
  18. Sarshenas, M.; Firouzeh, Z.H. A Robust Hybrid Taguchi-Gradient Optimization Method for the Calculation of Analytical Green’s Functions of Microstrip Structures. IEEE Antennas Wirel. Propag. Lett. 2015, 14, 1366–1368. [Google Scholar] [CrossRef]
  19. Vishnu, M.; TK, S.K. An improved solution for reactive power dispatch problem using diversity-enhanced particle swarm optimization. Energies 2020, 13, 2862. [Google Scholar] [CrossRef]
  20. Basetti, V.; Chandel, A.K. Hybrid power system state estimation using Taguchi differential evolution algorithm. IET Sci. Meas. Technol. 2015, 9, 449–466. [Google Scholar] [CrossRef]
  21. Chen, J.H.; Yau, H.T.; Hung, T.H. Design and implementation of FPGA-based Taguchi-chaos-PSO sun tracking systems. Mechatronics 2015, 25, 55–64. [Google Scholar] [CrossRef]
  22. Ko, C.N.; Chang, Y.P.; Wu, C.J. An orthogonal-array-based particle swarm optimizer with nonlinear time-varying evolution. Appl. Math. Comput. 2007, 191, 272–279. [Google Scholar] [CrossRef]
  23. Tsai, J.T.; Yang, C.I.; Chou, J.H. Hybrid sliding level Taguchi-based particle swarm optimization for flowshop scheduling problems. Appl. Soft Comput. 2014, 15, 177–192. [Google Scholar] [CrossRef]
  24. Chen, G.; Lei, H.; Fang, H. Hybrid Taguchi-Particle Swarm Optimization Based Optimal Reactive Power Flow. In Proceedings of the 2010 2nd International Workshop on Intelligent Systems and Applications, Wuhan, China, 22–23 May 2010. [Google Scholar]
  25. Power Systems Test Case Archive. Available online: https://www.ee.washington.edu/research/pstca/pf30/pg_tca30bus.htm (accessed on 15 May 2020).
Figure 1. HTPSO algorithm flowchart.
Energies 15 04565 g001
Figure 2. Power system structure diagram of deep-water semi-submersible production platform.
Energies 15 04565 g002
Figure 3. Structure diagram of offshore platform power system integrated with new energy.
Energies 15 04565 g003
Figure 4. Factor response figure.
Energies 15 04565 g004
Figure 5. Fitness convergence curve.
Energies 15 04565 g005
Figure 6. Active power loss diagram of each algorithm.
Energies 15 04565 g006
Figure 7. Voltage distribution diagram.
Energies 15 04565 g007
Table 1. L 16 ( 4 5 ) orthogonal array.
Experiment
ω m a x
ω m i n
δ
N P
ABCDE
110.22.5010
210.320.520
310.41.5130
410.511.540
50.90.22140
60.90.32.51.530
70.90.41020
80.90.51.50.510
90.80.21.51.520
100.80.31110
110.80.42.50.540
120.80.52030
130.70.210.530
140.70.31.5040
150.70.421.510
160.70.52.5120
Table 2. Information about each function.
FunctionFunctional ExpressionSearch Scope
Sphere f 1 = i = 1 n x i 2 [−100, 100]n
Rosenbrock f 2 = i = 1 n 1 [ 100 ( x i + 1 x i 2 ) 2 + ( x i 1 ) 2 ] [−30, 30]n
Rastrigin f 3 = i = 1 n [ x i 2 10 cos ( 2 π x i ) + 10 ] [−5.12, 5.12]n
Griewank f 4 = 1 4000 i = 1 n x i 2 i = 1 n cos ( x i i ) + 1 [−600, 600]n
Table 3. Convergence accuracy.
FunctionTPSO (Population)TPSO (Individual Extremum)
BestAverageWorstBestAverageWorst
Sphere6.19 × 10−523.97 × 10−493.01 × 10−483.82 × 10−651.19 × 10−611.63 × 10−60
Rosenbrock3.48 × 10−149.59 × 10−13.995.1 × 10−221.283.99
Rastrigin9.9524.1442.789.95 × 10−17.1214.92
Griewank02.27 × 10−20.101.18 × 10−28.09 × 10⁻²
Table 4. L 8 ( 2 7 ) orthogonal array.
ExperimentFactorFitness Value
ABCDEFG
1234567
11111111 f 1
21112222 f 2
31221122 f 3
41222211 f 4
52121212 f 5
62122121 f 6
72211221 f 7
82212112 f 8
Table 5. Experimental results.
Exp. f 1   f 2   f 3   f 4   f 5   f 6   f 7   f 8   f 9   f 10   SNR
10.83030.81690.8610.77520.79930.81910.72690.84220.8520.87061.7196
20.81560.81910.81390.80440.81910.8670.77740.74550.86850.81611.7727
30.79830.76780.72890.72720.70290.81910.70040.76590.86810.75832.3225
40.74160.81560.76340.74190.78460.69880.77170.81610.71710.81562.2965
50.70040.76350.79740.70580.72380.81610.81390.74680.81610.69312.3931
60.81910.82980.80080.83950.81610.80370.81610.85590.81260.81611.7120
70.80090.73870.77970.73020.76110.7440.77210.83460.76010.73012.3179
80.77640.87170.76650.87230.83310.90650.86220.85660.87810.8681.4096
90.81390.78340.81610.81610.84390.79030.80940.81390.81680.89211.7229
100.81260.91560.92190.86220.83450.87050.81130.78060.77650.98391.3168
110.74670.7080.80310.77690.70320.70360.73950.81390.69160.72132.5927
120.69230.69370.70270.72610.70040.75020.74040.69580.73630.70062.9241
130.7130.73960.75040.7320.72620.7850.74940.81060.7540.7122.5243
140.70230.72530.76020.70080.72780.75080.7050.73140.74790.72322.7606
150.86180.86420.94520.84970.91880.80990.86630.82270.91430.87151.1762
160.89860.81070.85710.79460.81870.81610.80610.78180.88640.7981.6427
Table 6. Factor response table.
ω m a x ω m i n δ N
ABCDE
Level 12.0278392.0899721.9167572.4305421.40554
Level 21.9581321.890412.0664982.0748171.772339
Level 32.1391252.1023352.0539141.9187652.370713
Level 42.0259282.0682172.1138551.7268992.510732
Range0.1809930.2118350.1970980.7036431.105192
Table 7. Control variable results after optimization of different algorithms.
Control VariablesPSOPSO-LDIWPSO-SCACTPSO1TPSO2HTPSO
V 1 1.0318551.0120881.0354521.0366121.0364081.035973
V 2 1.028381.0136121.0406821.0382631.0396921.038323
V 3 1.0313621.0135891.0370391.0384511.0379151.039065
T 1 1.02511.0251.0251.0251.025
T 2 1.02511.0251.0251.0251.025
T 3 1.02511.0251.0251.0251.025
T 4 1.02511.0251.0251.0251.025
T 5 10.9751.0510.951
T 6 0.95110.9511
T 7 0.951.051.025111
T 8 0.950.950.95111.025
Q D F I G −0.2708770.5−0.2343280.22026−0.229580.487951
Q P V −0.10.0089620.0694330.0598140.0576490.018529
P l o s s (MW)0.6716750.6439380.6567060.6263050.6532110.612319
VD(p.u)0.2630150.1873930.202860.1294810.1304840.101149
Publisher’s Note: MDPI stays neutral with regard to jurisdictional claims in published maps and institutional affiliations.

