Article

Research on the Influence of Various Attribute Factors on Passive Interference in UHV Transmission Lines Based on Orthogonal Test

1
State Key Laboratory of Power Grid Environmental Protection, China Electric Power Research Institute Wuhan Branch, Wuhan 430073, China
2
School of Electrical Engineering, Beijing Jiaotong University, Beijing 100044, China
*
Author to whom correspondence should be addressed.
Energies 2022, 15(13), 4510; https://doi.org/10.3390/en15134510
Submission received: 18 May 2022 / Revised: 13 June 2022 / Accepted: 16 June 2022 / Published: 21 June 2022

Abstract

:
Considering the problem of passive interference caused by electromagnetic scattering effects of transmission lines to neighboring radio stations and other communication equipment, this paper refines the passive interference calculation model for UHV transmission lines. The solution calculation is carried out by the Method of Moments, and the law of passive interference effect of the tower structure, auxiliary angles, and ground roughness under different frequency incident waves, is summarized. By designing an orthogonal test, the degree of influence of the above attributing factors on passive interference results in the established joint model of three towers with two stall distances was explored by using Analysis of Variance. The results demonstrate that both auxiliary angles and rough ground show a pattern of enhanced electromagnetic scattering effect with increasing plane wave frequency in single-factor analysis. When multiple factors are combined, the rough ground has a significant effect on the results. This method effectively evaluates the passive interference influence factor while reducing the modeling and simulation engineering and provides a reference for the passive interference prediction in subsequent practical projects.

1. Introduction

The continuous emergence of ultra-high voltage (UHV) AC and DC experimental demonstration projects in China marks the gradual maturity of UHV technology. However, because UHV transmission lines consist of extremely large, metal, electric towers and split conductors, their erection, their operation in electric fields and magnetic fields, and radio interference constitute a complex metal environment that may bring heavy passive interference problems to neighboring communication equipment [1]. When the neighboring radio stations emit electromagnetic signals that pass through the line, the induced current is generated on the surface of metal bodies such as iron towers and transmission conductors, and its induction of a secondary radiation field will further affect the transmitting or receiving signal, causing serious interference to the quality of communications [2].
Early research on the problem of passive interference on transmission lines was conducted by establishing an experimental model of the isometric reduction of the line and observing the variations in the surrounding spatial electric field to determine the level of passive interference [3,4]. One of the experimental models of transmission lines was first proposed by C.W. Trueman and S.J. Kubian to simplify the scheme by equating transmission line towers and broadcast antennas to a reduced scale cylindrical linear model [5]. In a subsequent study of the passive interference level of the line, the two considered the spatial structure of the tower in the transmission line tower modeling and equated both the main and diagonal sections to a cylinder of 0.01 m radius [6]. IEEE recommended a line model modeling approach that equates transmission lines to cylinders based on other subsequent studies [7]. For example, in determining the protection spacing of passive interference on transmission lines, Zheyuan, Gan et al. [8] initially distinguished and discussed the configuration of a tower’s structure, and established line models for drum towers, wineglass towers, and cathead towers containing only the main material. Liu, Jin et al. [9] established a line model of ±800 kV DC towers containing only the main material without discussing the effect of tower auxiliary materials when analyzing the passive interference problem of HV DC lines in the short-wave frequency band. Tang Bo [10] conducted research on passive interference of tower line models in his doctoral thesis and compared the impact of auxiliary angle-steel in passive interference analysis through the establishment of a ZP30101 type DC transmission tower containing only the main material and the auxiliary angle-steel model. The results show that auxiliary materials have a prominent influence on the outcome in high-frequency passive interference analysis. The above simulation model was gradually refined in order to further fit the actual tower model. Jun, Zou et al. [11,12] studied the passive interference of HVDC lines by using MoM and spatial spectrum measurement algorithm and concluded that under the vertical polarization plane wave excitation, the horizontal building materials in the towers do not act as the main scatterer, so the towers are equated to the pyramidal line model with a simple structure. The results showed that the higher the tower and the smaller the distance, the greater the echo interference and the significant measurement error. With the continuous improvement of computing power, based on the current transmission tower line model in passive interference analysis, surface model, line surface hybrid, and other optimization models are gradually derived [13,14,15]. However, most of the tower models mentioned above are related to the study of passive interference in high voltage or extra-high voltage transmission lines, while with the increase of transmission voltage level, the call height and cross-arms, as well as the overall dimensions of the towers in UHV transmission lines, have been widened, so it is very necessary to revisit several issues in the modeling of towers in UHV to discuss the laws affecting the results of passive interference.
In a study of electromagnetic scattering for rough ground, in 1980, a four-component model of soil was developed by Schmugge and Wang [16], which gives different models of rough ground depending on the sand and clay content of the soil [17]. Early studies on rough surfaces focused on the analysis of scattering coefficients from different rough surfaces [18] and the problem of stratified ground scattering [19], and subsequently, related scholars launched an exploration of the characteristics of electromagnetic scattering from complex targets (ships, aircraft, and tanks, etc.) on rough surfaces [20,21]. However, there is less research that considers the level of passive interference in transmission lines under rough ground. If the ground influence is not ignored, the final passive interference level can be weakened by about 50% at most. Therefore, the previous method of simplifying the earth model and modeling as a pure conductor is no longer applicable.
In addition to the above-mentioned tower structures as well as the ground, as UHV transmission lines act as electromagnetic scatterers in passive interference, the scattering effect of overhead conductors is increasingly not negligible [22,23]. The aforementioned authors Gan et al. [14] added overhead conductors to the established three-towers array in a subsequent study, indicating that their influence on passive interference results is related to the polarization mode of incident waves. Ying Lu’s team at North China Electric Power University [24,25] optimized the conductor modeling in the passive interference under the radar station, incorporating the actual structure, and concluded that “different conductor heights have significantly different effects on the electric field strength”, but did not consider the impact of the sag characteristics of overhead conductors. Through horizontal comparison of the above studies, the respective modeling priorities and research deficiencies are more clearly obtained in Table 1.
Therefore, in this paper, in order to further complete the passive interference calculation model for UHV transmission lines and to analyze the degree of significance of each factor in the results of passive interference on UHV transmission lines, the following work was carried out:
(1) The model of passive interference was optimized on transmission lines from three aspects: terrain topography, truss angle, and tower system, and the corresponding law changes were summarized. For the towers, 1000 kV cup-type towers and 1000 kV dry-type towers were selected for modeling, and the tower type and auxiliary angle-steel were used as research factors to compare their effects and the laws of electromagnetic scattering under different frequencies of incident waves. In terms of topography, four types of two-dimensional rough ground Gaussian models with different root-mean-square heights and relevant lengths were established: sandy-fleshed ground, silty fertile ground, powdery sandy loam ground, and powdery clay ground, and the respective electromagnetic scattering experiments were completed and the effect law of passive interference on rough ground was derived. For the tower line system, an array model considering the overhead ground line sag was established, and the electromagnetic scattering effect when subjected to the vertical polarization plane wave incidence, was compared under two sag lengths.
(2) A tower array of three towers with two file distances and a simulation model of passive interference considering ground roughness was established. An orthogonal experiment with an unequal number of levels was designed to investigate the degree of influence of three types of attribute factors: ground roughness, tower type, presence, or absence of auxiliary materials, and one type of numerical factor: sag length, in the level of passive interference caused by UHV transmission lines in three frequency points, using polar difference and ANOVA methods based on the above joint model.

2. Basic Principles of Electromagnetic Scattering from Transmission Lines

2.1. Equivalence and Solution Method of Passive Interference in Tower Line Model

In the study of passive interference of UHV transmission lines, this paper expands and optimizes the transmission line passive interference model [10] established by Tang, B., as shown in Figure 1. Among them, the iron tower and overhead ground wire in the UHV transmission line are thin wire models. The iron tower ignores the width of the angle-steel, and the overhead ground wire ignores its radius.
The passive interference level of the transmission line is defined in [11], as shown in the following formula:
S = 20 log E s E i
In the model shown in Figure 1, Ei in Equation (1) represents the electric field intensity of the incident plane electromagnetic wave at observation point P without the model. Es represents the spatial scattered electric field intensity measured at observation point P after the addition of the UHV transmission line model. Since each metal part of the line is assumed to be an ideal conductor, the boundary conditions shown in Equation (2) are satisfied.
t × ( E s ( r ) + E i ( r ) ) = 0
Before using the method of moments (MoM) to calculate the relevant electromagnetic field, it is necessary to use the Hallen principle [26] to give equivalence to the line model elements, however, this method is used when the excitation electromagnetic wave frequency is increased, and the equivalent model has a large number of line cells whose length-to-diameter ratios do not meet the requirements, leading to standing waves when calculating the results of the induced currents and eventually making errors in the passive interference results [13]. In the pre-processing of the grid dissection of the tower and overhead ground line models, the line grid cell length is set to l = 0.1λ and the equivalent radius a = 0.01 m.
As the frequency increases and the wavelength decreases, the length of the corresponding grid line cell l decreases and no longer meets the requirement that the length of the one-dimensional grid line cell should be much larger than the radius of the line cell a, l / a . In this paper, when using the MoM for the calculation of the induced current in the line model, the basis function is chosen as the pulse basis function [11], as follows:
f f N = n = 1 N a n N f n
where f denotes the unknown function in the MoM, the value of the induced line current to be found under the tower line model. f N is the set of linearly independent induction current basis functions, and a n N is the induction current expansion coefficient. Where, N denotes the number of grid divisions for the line model equivalent to the number of line cells. The larger N is, the finer the model dissection is, and the closer f N is to the approximate solution f; the smaller N is, the lower the grid number is, and the faster the momentum method is calculated. Since the MoM is influenced by N, only an approximate solution J(l) for the induced current on the surface of transmission line pylons under electromagnetic wave incidence can be obtained, the literature [11] gives the integral equation for the electric field in the line model as follows:
l E i ( r ) = j ω μ L l l g ( r , r ( l ) ) I ( l ) d l 1 j ω μ d d l L g ( r , r ( l ) ) d I ( l ) d l d l
where l is the unit vector along the equivalent fine wire axis direction; I ( l ) is the line current density along the equivalent fine wire axis direction; I ( l ) = 2 π a J ( l ) , a is the fine wire radius; J ( l ) is the line induced current.

2.2. Surface Roughness Characterization Parameters and Electromagnetic Scattering Characteristics

The roughness of a rough surface is mainly characterized by statistical parameters such as height undulation, relevant length, root mean square (RMS) height undulation, and RMS slope, among which, RMS height undulation and relevant length are the two most important physical quantities in rough surface simulation. The RMS height δ represents the average height of each point on the rough surface deviating from the reference surface and describes the variation of the random rough surface in the “longitudinal” direction. Figure 2a shows the numerical simulation of the 1D Gaussian rough surface with different RMS heights. Figure 2b shows the numerical simulation of the 1D Gaussian rough surface with different relevant lengths.
As can be seen in Figure 2a, the greater the RMS height, the greater the undulation of the rough surface when the relevant lengths are the same. It follows that the RMS height determines the “longitudinal” variation characteristics of the rough surface. As seen in Figure 2b, when the RMS height is fixed, the smaller the relevant length is, the more drastic the rough surface transformation is, and the smaller the period of change is. It follows that the relevant length determines the “transverse” variation characteristics of the rough surface.
The method of moments is used to solve the passive interference on transmission lines in rough surface environments. Assuming a plane wave along the partition interface in the natural coordinate system only Ez, Hn, Hl, the corresponding surface current source components on the rough surface interface are surface current Jz =Hl and surface magnetic current Kl= −Ez. After considering the boundary conditions E 1 z = E 2 z , E 2 z n = μ 2 μ 1 , and E z = K l , E z / n = j ω μ H l = j ω μ J z , the total field integral expressions of the internal and external rough surfaces expressed by the incident fields E z i n c and H l i n c about Jz and Kl are obtained as follows:
{ 1 2 K l + 1 4 ( ω μ 1 J z + j K l n ) H 0 ( 2 ) ( k 1 ρ ) d l = E z i n c 1 2 J z + 1 4 ( ω ε 1 K l c o s ( φ n φ n ) j J z n + 1 ω μ 1 K l l l ) H 0 ( 2 ) ( k l ρ ) d l = H l i n c
In the solution process using the MoM, the basis function is impulse basis function. The scattered electric field values of the rough surface are further obtained by solving for the unknown quantities such as induced currents and induced magnetic currents on the rough surface obtained.
In previous studies of electromagnetic scattering from high-voltage transmission lines, the ground is usually set up as an ideal conductor, as PEC ground. In fact, the ground is dielectric and has an absorption effect on electromagnetic waves. The electromagnetic waves on the rough ground will produce scattered waves with uneven energy distribution in all directions. Eventually, after considering the rough ground, the passive interference level of the transmission line decreases significantly, and relevant studies have shown that the passive interference level can be reduced by up to 50% after considering the rough ground.

3. Optimization of Passive Interference Analysis Model for UHV Transmission Lines

3.1. Modeling and Simulation of a Single Base Tower

This section focuses on the influence of two factors, tower structure, and auxiliary angle-steel, on the calculation results of passive interference in the towers of UHV transmission lines. The 1000 kV dry-type tower and the 1000 kV cup-type tower were selected for modeling and electromagnetic analysis.
Transmission line towers are usually classified by structure: tower head, tower body, tower legs, and the components are classified by angle installation location: main material angle, diagonal material angle, and auxiliary material angle [27]. Due to the elevated voltage level conveyed by the UHV transmission line, the corresponding tower increases the call height, cross-arms, and overall size in order to carry the overhead transmission conductors. Among the tower types of UHV pylons, dry-type and cup-type pylons are common and typical single-circuit linear towers in the grid system and have the advantages of low cost, easy structure construction, and strong construction adaptability. Therefore, in this paper, the above two representative towers were selected for tower modeling. Based on the structural dimensions of the Fuzhou-Xiamen 1000 kV UHV dry-type tower JC 321022 in the actual UHV transmission project and the 1000 kV cup-type tower provided in the paper [22], a line model with only the main material and the addition of auxiliary angle was established as shown in Figure 3, and the values in the figure are in mm. The two types of towers differ in structure, in addition to the tower height and cross-stretcher length. The top span of the dry-type tower is small, and the lower support is thin and high; the top span of the cup-type tower is large, and the lower support is short and wide. The two typical and representative tower types can better evaluate the influence of tower type factors in the calculation of passive interference on UHV transmission lines.
Passive interference simulations of the single-base tower model were performed for the four models established in Figure 3. According to the mathematical model constructed in Figure 1, the tower was a single-base pylon line model and located at the origin of the coordinates, and the influence of rough ground was disregarded, that is, the ground was the ideal conductor. The x-axis direction was the direction of the UHV transmission line, which was set in the vertical x-axis and distance from the origin for the protective spacing of 1500 m at the observation point P (0, 1500, 1). Considering the most serious situation caused by the incident plane electromagnetic wave, the vertical polarization mode was chosen and the angle with the x-axis was φ, with a step of 2° from a 0°–360° direction of incident propagation to the single base tower model located at the origin. Multiple frequency points in the 0.5 MHz–30 MHz bands were selected to compare and analyze the effects of different tower models and the presence or absence of auxiliary angle-steel on the calculation results of passive interference.

3.2. Geometric Modeling and Simulation of Rough Ground

There are many rough surfaces in real life, such as mountains, grasslands, sands, and oceans. Combined with the topographic features of UHV transmission lines in China, based on the four-component model proposed by Schmugge and Wang [16], four representative ground surfaces with different soil types were selected. They were sandy-fleshed ground, silty fertile ground, powdery sandy loam ground, and powdery clay ground. In the analysis of passive interference in UHV transmission lines, the effect of electromagnetic scattering from the ground is influenced by the dielectric properties in addition to the geometric parameters characterizing the degree of roughness—relevant length and RMS height. The dielectric properties of rough ground will affect the radiation, scattering, absorption, and transmission characteristics of electromagnetic waves. The parameters of each of the four ground types after fixing soil moisture mv = 0.2 (g/cm3) and soil temperature T = 23 °C are given in Table 2. There is a certain difference in the dielectric constant between different ground types, which all have different effects on the electromagnetic scattering from transmission lines with rough surfaces.
Considering that the exponential spectrum rough surface is closer to the actual ground profile than the Gaussian spectrum rough surface, the exponential power spectrum is used in the modeling to substitute the roughness parameters in Table 1 into the exponentially distributed power spectrum density function. The geometric models of the four different ground surfaces corresponding to the above Table 1 can be generated by using the linear filtering method, as shown in Figure 4.

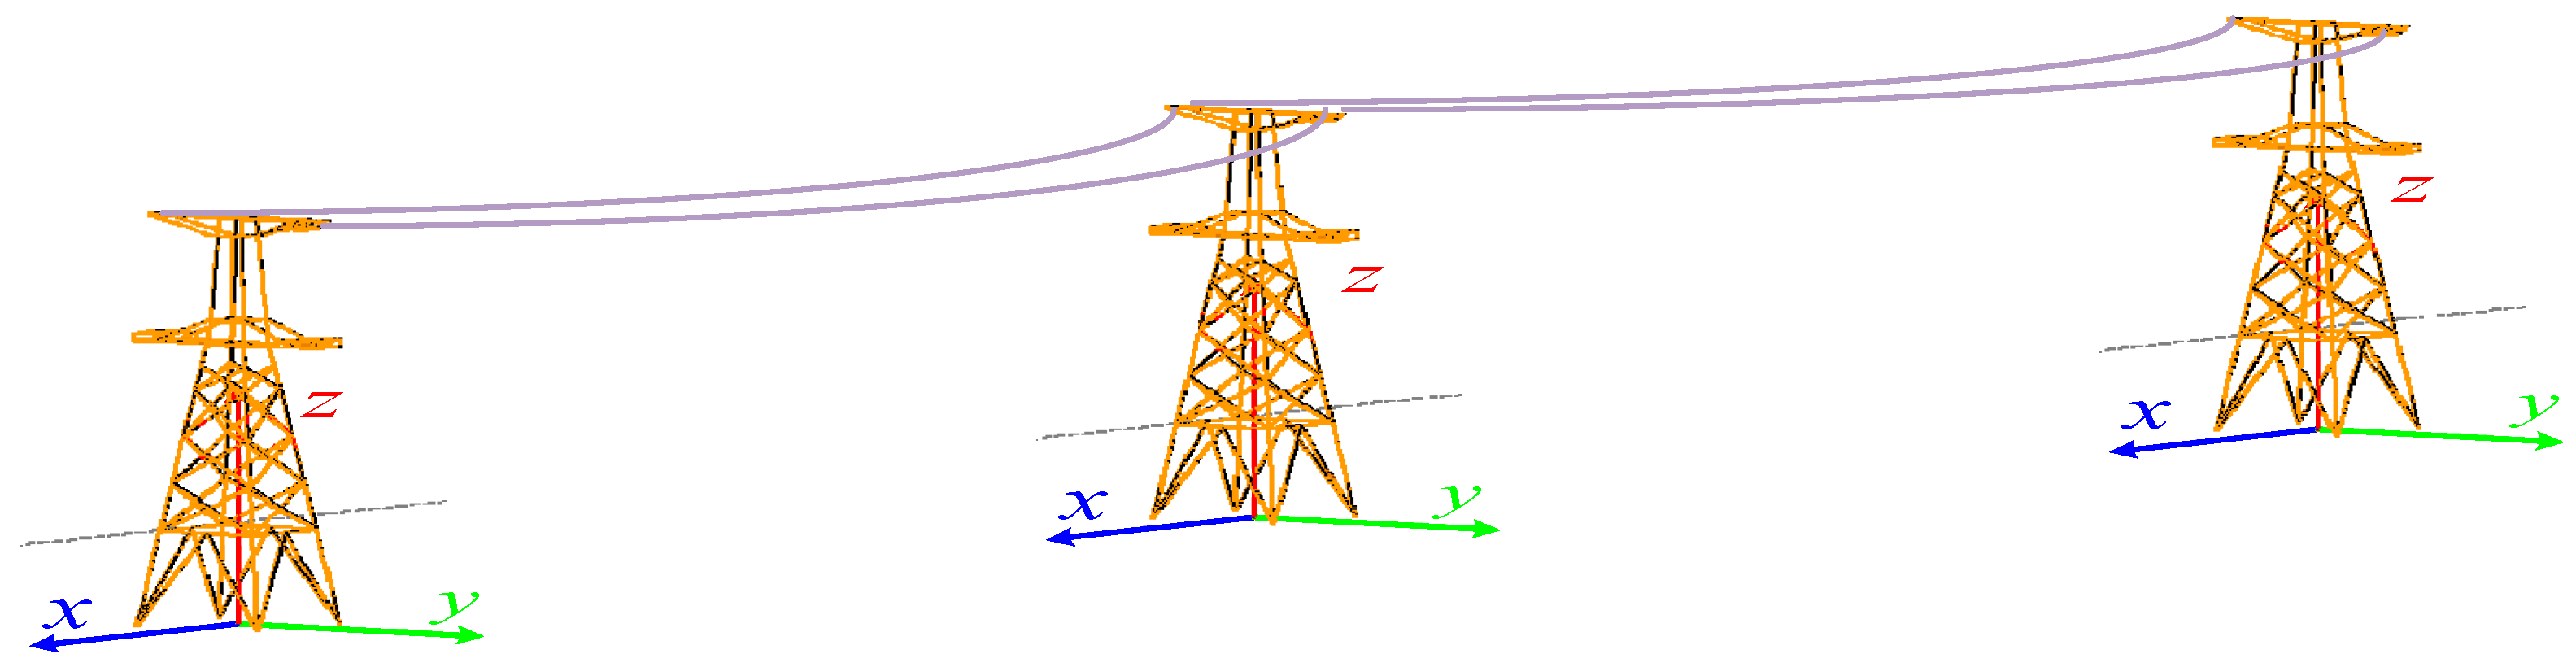
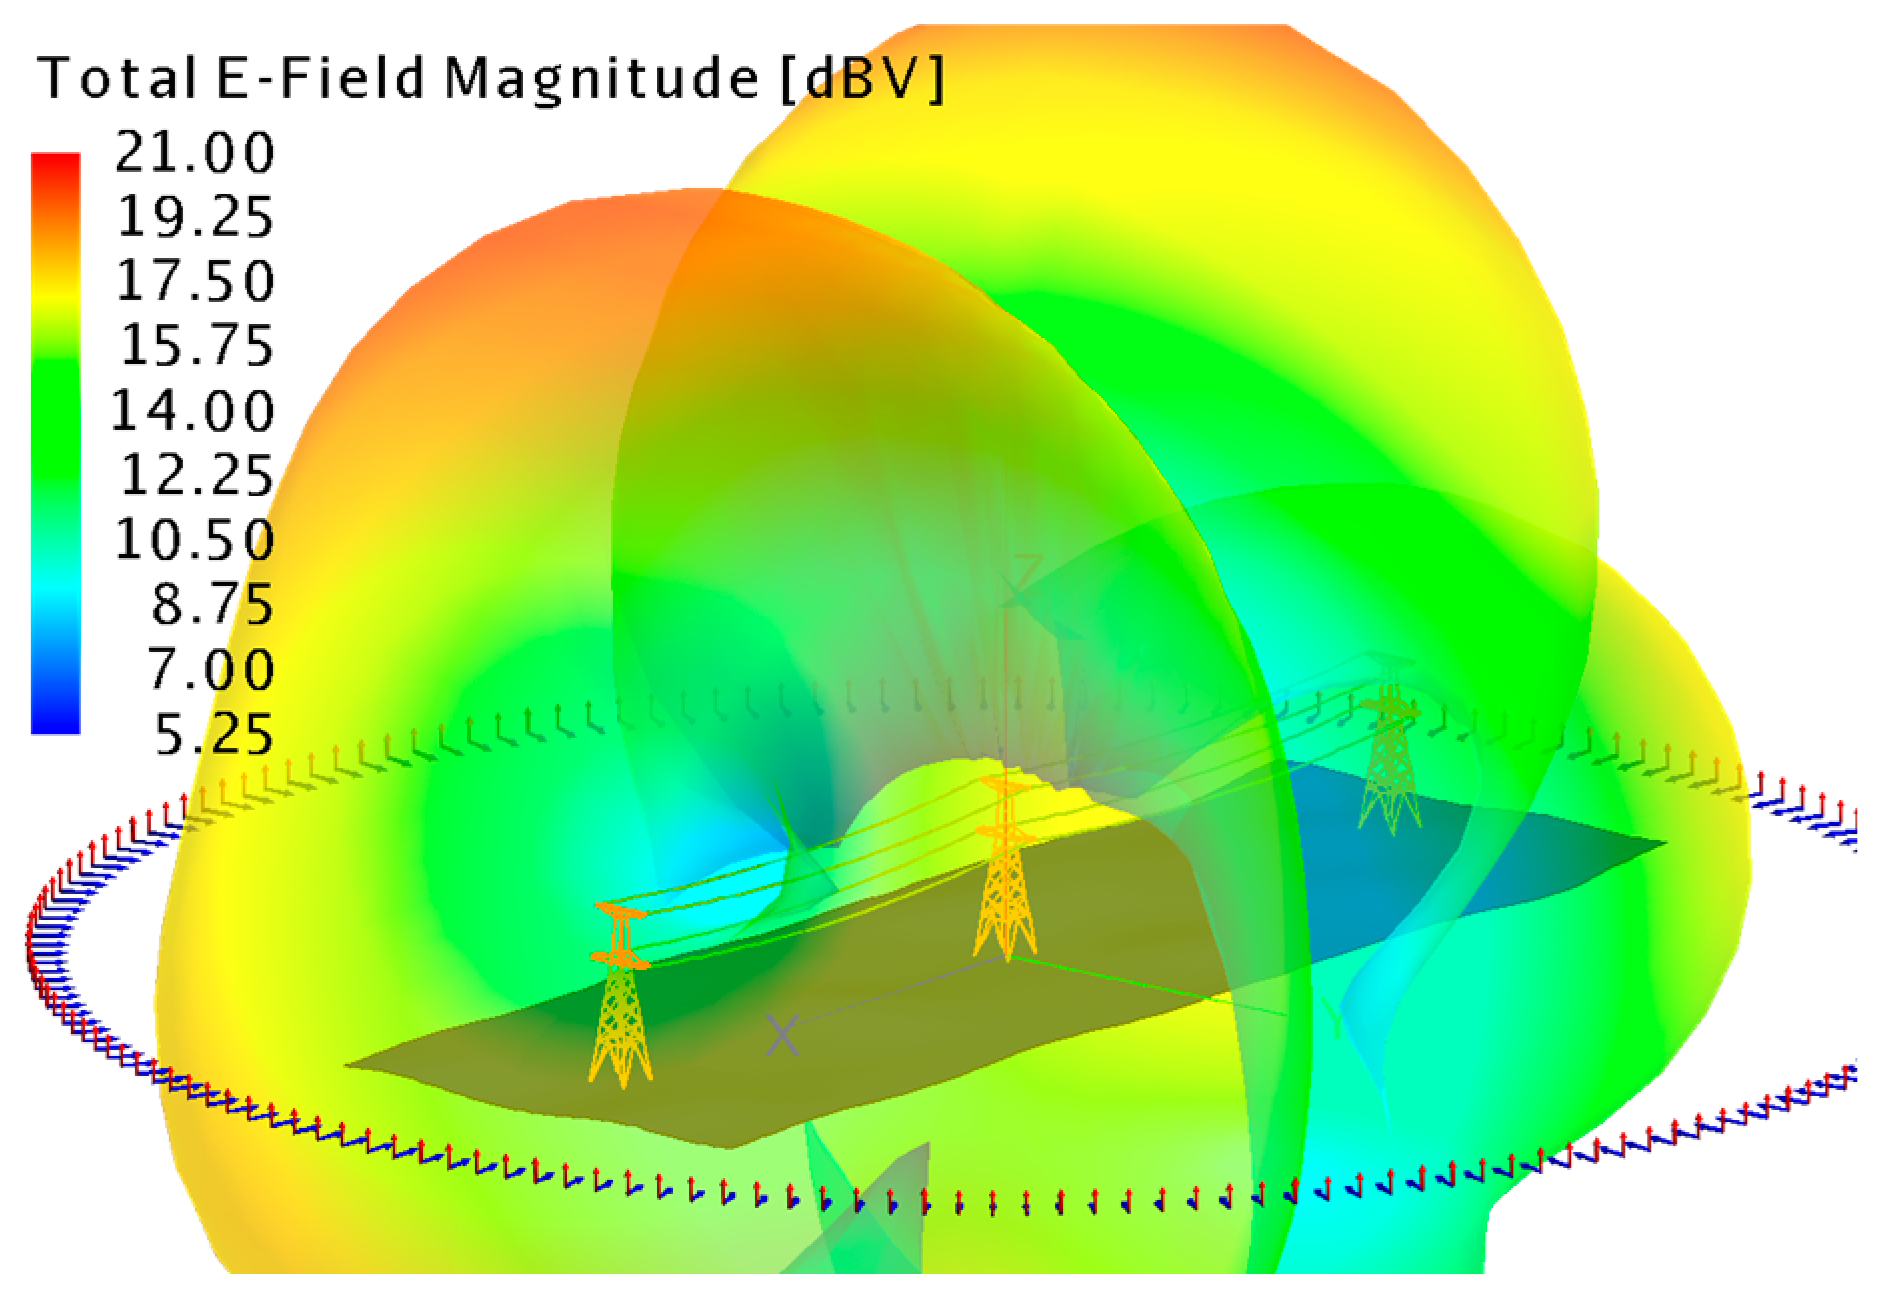
3.3. Modeling and Simulation of Tower Arrays

The actual transmission line is in the form of an array that produces electromagnetic scattering effects on surrounding radio equipment, based on the two tower types selected in Section 3.1. The corresponding three-base tower two-span array model was established, where the span was 500 m, and the overhead ground line considered arc droop, as shown in Figure 5. In the study of radioactive interference in transmission lines, it was found that the electric field intensity at different arc sag locations of overhead lines varies very significantly and the magnetic field of the arc sag has a great impact on the frequency electric field of transmission lines [23,28]. In this paper, when its suspension point is equal in height in the establishment of the array model, its maximum sag length is affected by the line-specific load, the stall distance, and the horizontal stress at the lowest point. Figure 3 demonstrates that the suspension points of transmission lines differ in height from the ground when different tower types are used.
In order to compare the transmission line array when the arc sag factor on the impact of passive interference, two common sag height levels were chosen that varied greatly in the UHV overhead ground line, 8 m and 13 m. At the same time, the height of the suspension point of the overhead ground wire corresponding to different tower types was also different, for example, in this paper, the overhead ground line suspension point of the dry-type tower was 86.8 m, and the overhead ground line suspension point of the cup-type tower was 50.16 m.

4. Results Analysis

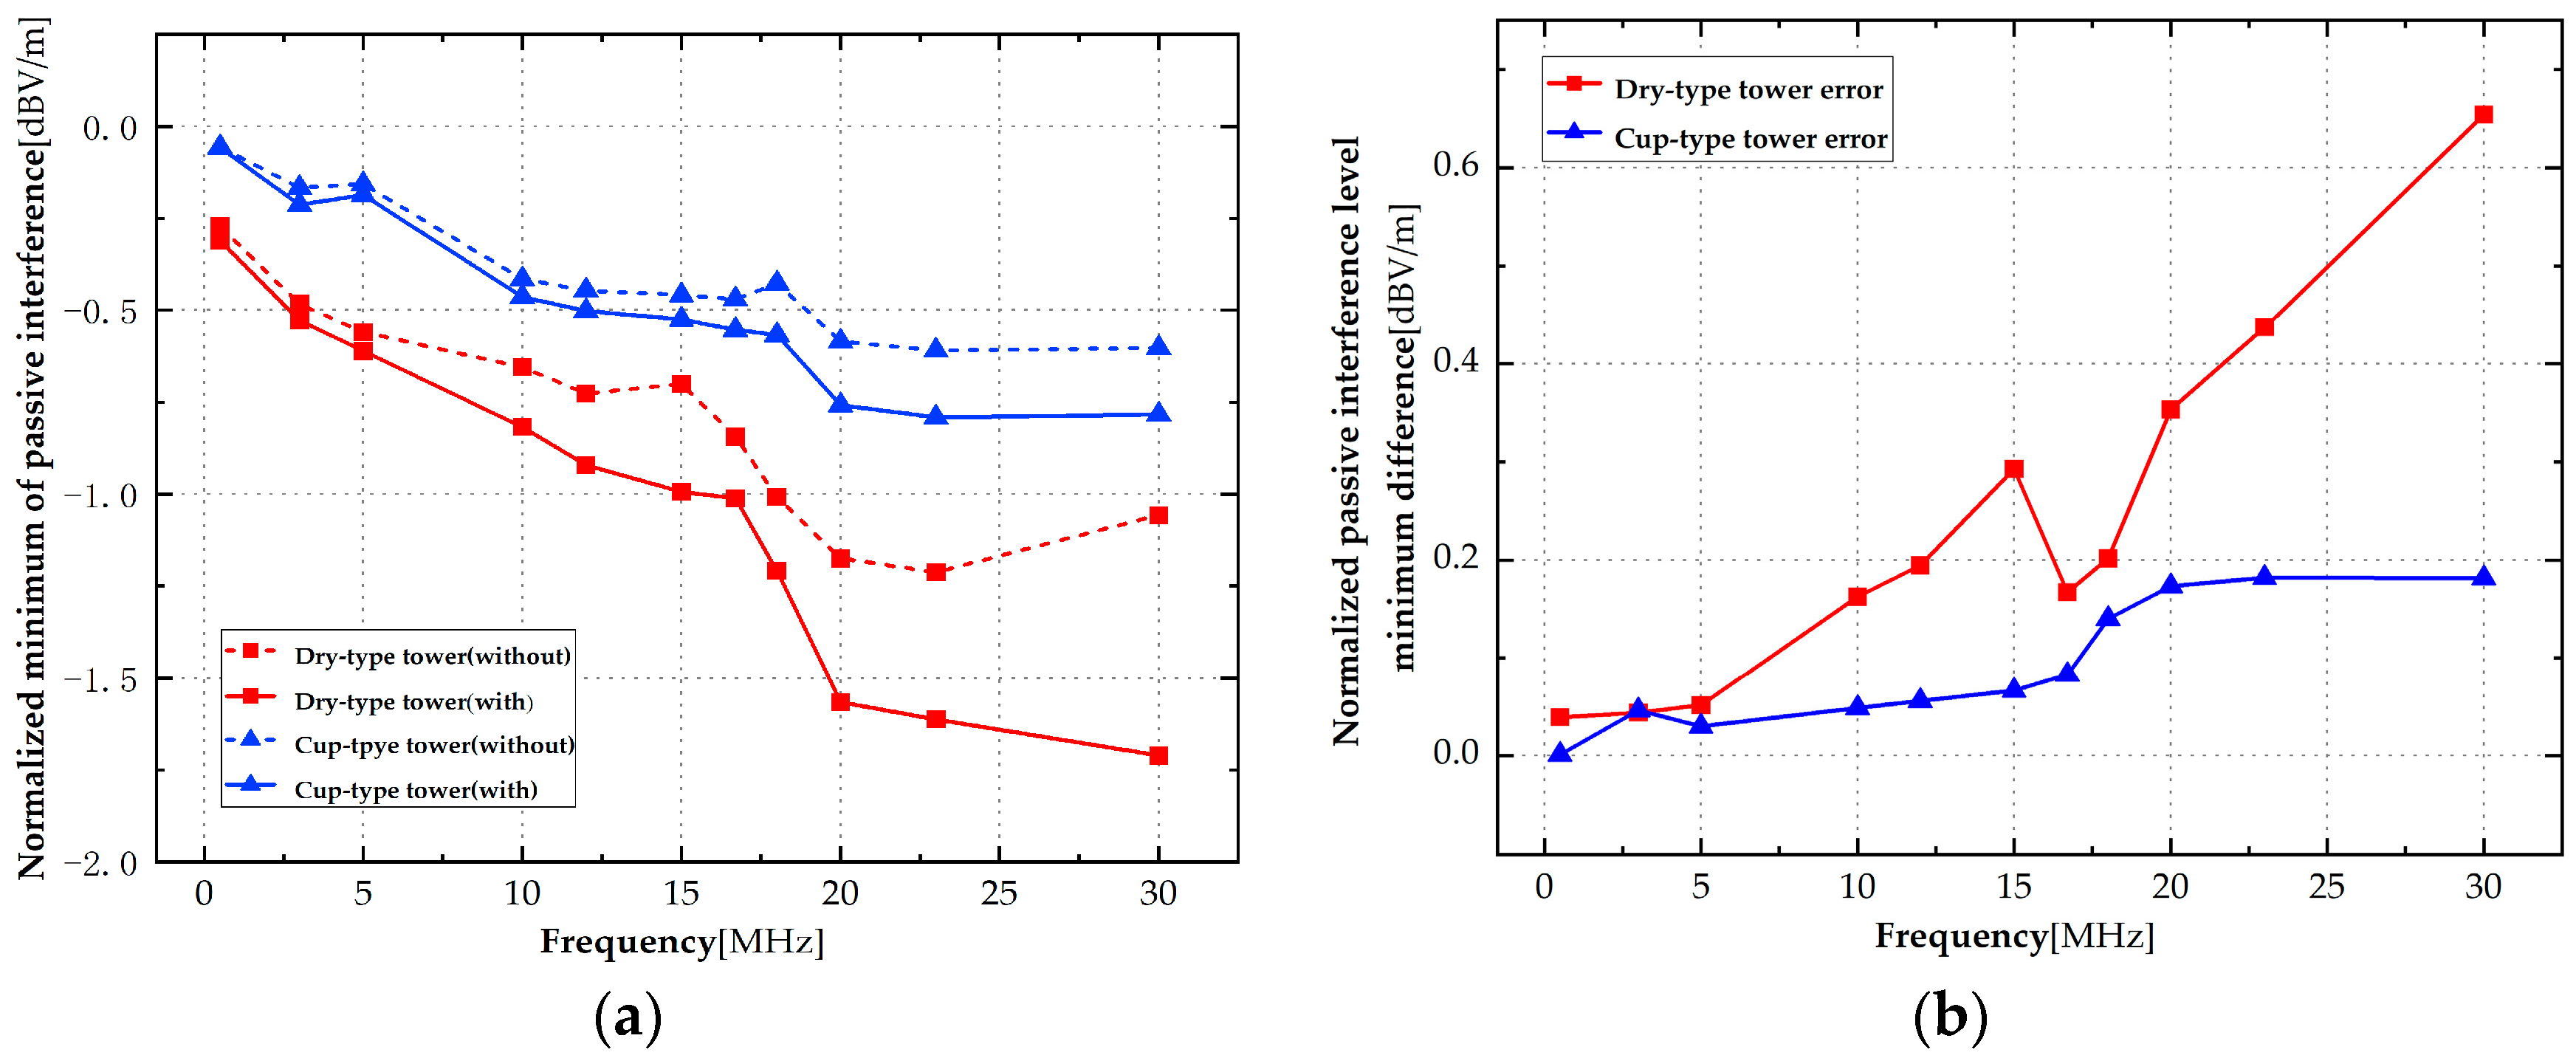
4.1. Discussion of the Results of the Effect of Tower Type and Angle-Steel on Passive Interference Results

Figure 6, below, shows the comparative directional diagrams of passive interference levels for the 1000 kV dry-type tower (shown in Figure 6a) and the 1000 kV cup-type tower (shown in Figure 6b) at a plane wave frequency of 16.7 MHz for the two-tower line models containing only the main material and adding the auxiliary angle-steel. Since the overall trend of the passive interference level direction diagram of the two-tower models at each frequency point was essentially the same, the results of other frequency points are not shown one by one. Where “without” indicates the results of the model containing only the main material, and “with” indicates the results of the model with the addition of auxiliary angle-steel.
As can be seen from Figure 6 above, the horizontal patterns of passive interference in Figure 6a,b are left–right symmetrical, and the minimum value appears at around 270 degrees. Combined with the passive interference model in Figure 1, it is evident that when the plane wave occurred in the vertical transmission line direction, the effect of passive interference from the tower measured at observation point P was the strongest; and because of the irregular structure of the tower itself, many peaks appeared in the horizontal direction diagram of passive interference, reflecting the intuitive effect of electromagnetic scattering from the tower. In addition, the normalized passive interference values of the models after adding the auxiliary material angle steel under the two tower types were smaller than those of the model with only the main material. The former is more consistent with the actual tower structure of the transmission line. Since the electric field measured at observation point P is a superposition of the incident field and the scattered field induced by the metal parts of the tower, the former result should theoretically be smaller when the passive interference results are normalized.
In order to further compare the influence of the two factors of tower structure and auxiliary material angle steel in the calculation results of passive interference of UHV transmission lines, the minimum value of normalized passive interference of the four models at each frequency point was calculated, as shown in Figure 7a. Figure 7b gives a comparison of the difference between the normalized passive interference minimums of the two-tower model, the model containing only the main material and the model adding auxiliary angle-steel, and the change of plane wave frequency.
The normalized passive interference level of the 1000 kV cup-type tower was greater than that of the 1000 kV dry-type tower, regardless of whether the model was with or without auxiliary materials, the effect of passive interference was weaker in the cup-type tower model than in the dry-type tower model at different frequencies of incident waves (Figure 7a). The normalized passive interference minima of all four models, in general, demonstrated a decreasing trend with increasing frequency. However, there was a sudden change in this law at 30 MHz, which was exactly the error in the calculation of the line model using Hallen’s principal equivalent at high frequencies mentioned in Section 2.1. The error problem of the transmission tower line model under high frequency can be solved by using a surface model [13]. The difference between the normalized passive interference minimums of the model containing only the main material and the model with the addition of auxiliary angle-steel increases with frequency (Figure 7b). Among them, when the frequency reached 30 MHz, the dry-type tower with or without the angle normalized passive interference minimum value of the difference exceeded 0.6 dBV/m, the difference of the cup-type tower exceeded 0.1 dBV/m, indicating that the effect of this factor of auxiliary angle-steel in the calculation of passive interference in the UHV transmission line becomes more and more obvious as the frequency increases, and the effect of the dry-type tower is more prominent.

4.2. Discussion of the Effects of Rough Surface Root-Mean-Square Height and Relevant Length on Passive Interference Results

In Section 3.2, four different roughness levels of ground were established using the linear filtering method. Since the RMS height and the relevant length of the statistical parameters are important geometric properties characterizing the roughness undulation level, it is necessary to further explore their impact on the results of passive interference level. According to the model in Figure 1, the target scatterer located at the origin is a 300 × 100 m2 rough ground model, where the excitation source is a 30 MHz vertically polarized electromagnetic wave incident from 0–360° direction, and the RMS height and relevant length at different levels are the variable factors, and the results are shown in Figure 8.
In Figure 8a, the normalized passive interference value reaches −2.25782 dBV/m when the root-mean-square height h = 6.1, which is nearly 300 times higher than the passive interference value of −0.00768395 dBV/m at the root-mean-square height h = 0.2, and with the increasing root-mean-square height, the variation of the normalized passive interference value has exceeded −2 dBV/m. In Figure 8b, with the relevant length as the variable, the normalized passive interference value of −0.31618 dBV/m when l = 1.5 is nearly three times higher than the passive interference value of −0.11036 dBV/m when the relevant length l = 8.2, and with the decreasing relevant length, the normalized passive interference values are all more than −0.5 dBV/m. This shows that the change of the RMS height of the rough surface has a greater impact on the passive interference level, while the change in the relevant length has less effect on the passive interference level.
For four types of rough ground with fixed RMS height and relevant length levels, the scattering ability of each under different frequency vertical polarization plane incident waves was investigated and characterized by radar cross-section (RCS), and the results are shown in Table 3.
As seen in Table 2, the normalized RCS values of various types of rough surfaces generally demonstrated a trend of decreasing with increasing frequency, however, the difference in roughness makes its scattering ability to incident waves also different. In the middle frequency band (0.3–3 MHz), the normalized RCS values of powdery sandy loam and powdery clay ground were larger (negative) and the difference between them and the rough surface of silty fertile and sandy-fleshed ground was larger, which indicates that the scattering ability of these two types of rough surfaces to electromagnetic waves wAs significantly weaker than that of sandy-fleshed and silty fertile ground. When in the high-frequency band (3–30 MHz), the results of the normalized RCS values of the four types of rough surfaces were not much different, and the normalized RCS value of the sandy loam ground was the smallest, which indicates that the electromagnetic scattering ability of this type of rough ground is strong. Further, the passive interference levels of the four types of rough surfaces were derived from the normalized electric field values under each frequency point measured at the observation point P, as shown in Figure 9.
Figure 9 shows that as the frequency increased, the normalized passive interference minimum values of the four types of rough surfaces demonstrated a decreasing trend. This indicates that the stronger the level of passive interference obtained from electromagnetic scattering on the rough surface measured at observation point P and the normalized passive interference minimum values of the powdery sandy loam ground with the strongest scattering ability at each frequency point, are smaller than those of other rough surfaces. Among them, at the frequency of 30 MHz, the minimum value of normalized passive interference of the sandy-fleshed ground was −0.7158 dBV/m, and its interference level was 1.7 times, 2.6 times, and 8.6 times of the silty fertile ground, powdery sandy loam ground, and powdery clay ground, which shows that as the frequency increases, the influence of the sandy-fleshed ground on the passive interference level of the transmission line is greater.

4.3. Designing Orthogonal Experiments and Completing Joint Simulations of Tower Arrays with Rough Surface Passive Interference

In Section 3.1 and Section 3.2, the effects of electromagnetic scattering effects on passive interference results under tower type, auxiliary angle-steel and different roughness of ground were discussed separately. In actuality, the tower system and rough ground in UHV transmission lines jointly affect the electromagnetic scattering effects on electromagnetic waves from radio stations, therefore, it is also necessary to implement cosimulation, and its 3D effect is shown in Figure 10 below. The distance between the three-tower arrays is 500 m, the area of rough ground is 1500 × 500 m2, and the excitation electromagnetic wave is a vertically polarized plane wave.
In the co-simulation model, in order to further explore the degree of influence of the electromagnetic scattering effect of each factor on the passive interference level, the commonly used multiple linear regression function to quantitatively analyze the method requires the independent variable to be a numerical factor. In this model, the rough ground type, tower type, and the presence or absence of angles are all attribute factors, so the analysis of variance method needed to be utilized. In this section, we chose the following four types of factors: tower type, the presence or absence of auxiliary angle-steel, the roughness of the ground, and the height of the sag, and corresponded to two, two, four, and two different levels, as shown in Table 4.
For example, the tower type was divided into the cup-type tower and the dry-type tower. The presence or absence of auxiliary materials included only the model containing the main material and the model with the addition of auxiliary angle-steel. If 5 different frequency points were chosen as the number of repetitive experiments, then each factor of the level combination would need to complete 5 × 4 × 2 × 2 × 2 = 160 experiments, the statistical analysis of so many experimental data is very tedious and complicated. Therefore, a mixed level L8 (41 × 23) type orthogonal table that meets the experimental purpose and requirements of this paper was used to arrange the experiments, as shown in Table 5.
Table 5 gives the normalized passive interference levels xi, in dBV/m, obtained by the joint simulation for an incident wave frequency of 10 MHz, based on the levels of the different factors specified in the eight experiments. To facilitate data processing and statistics, the results are linearized: yi = 10 × (−xi), in dBV/m. Through the results, it can be seen that at f = 10 MHz, when looking only at the extreme difference level Rj, the extreme difference level of factor B and factor C was higher, indicating that the influence of this dependent variable on the fluctuation of the experimental results was greater, that is, the change in the presence or absence of the tower type and auxiliary angle-steel had a greater impact on the experimental results. However, the single-range analysis was not accurate enough, and further analysis of variance (ANOVA) of the experimental results by the orthogonal table was needed, and the corresponding ANOVA table is shown in Table 6.
By comparing the obtained F values with the table values: F1-0.10(3,3) = 5.39, F1-0.10(1,3) = 10.1, the ANOVA obtained a significant effect of factor A on the results. Similarly calculated for f = 3 MHz, the F-values for factors A and B are: 7.704, 0.104. The F-values for factors A and B at f = 16.7 MHz are 8.876 and 0.034; and for factors A and B at f = 30 MHz are 8.882 and 0.039. All of them indicated that the change of the ground roughness had a significant impact on the passive interference level results when the three-base iron tower array and the rough surface were co-simulated.
Finally, we randomly selected the joint model No. 4 in Table 5 of the orthogonal test. Accordingly, the models of limiting factor A (ground is PEC ground), the limiting factor B (using the simplified pyramid model in Zou Jun’s paper [11,12]), and the limiting factor D (overhead conductor is straight, i.e., the arc droop height is 0) were established respectively, and the respective passive interference levels under 10 MHz incident wave were simulated and compared with the results of model No. 4, as shown in Figure 11 below.
As shown in Figure 11, the results of the model for the limiting factor A were the most different from the results of the experimental model 4, which was consistent with the previous conclusion that “rough ground has a significant effect in the passive interference calculation”. The results of factors B and D were also consistent with the previous conclusions.

5. Conclusions

In order to further analyze the passive interference problem of UHV transmission lines to the adjacent radio stations, three perspectives of tower type and truss angle, rough ground type, and tower line system were studied. At the same time, the degree of influence of the above-mentioned different factors on the calculation results of passive interference was investigated by designing orthogonal tests and through the ANOVA method. The following conclusions were obtained:
(1) Under high-frequency excitation, for different tower types, the influence of auxiliary angle-steel on the passive interference results of transmission lines increased, so the influence of tower auxiliary angles on the passive interference results of transmission lines cannot be ignored. In addition, under the same conditions, the passive interference level of the dry-type tower was always greater than that of the cup-type tower.
(2) The variation of the RMS height of the rough surface had a greater effect on the passive interference level of transmission lines, while the variation of the relevant length had a smaller effect on the passive interference level. In addition, among the four rough grounds, the sandy-fleshed ground had the greatest degree of influence on the level of passive interference on transmission lines.
(3) For the four factors of tower type, the presence or absence of auxiliary angles, ground roughness, and arc drape height, through the design of an orthogonal test table and ANOVA, it was concluded that the degree of ground roughness had the greatest influence on the level of passive interference on transmission lines.
There were some limitations in this study, and some problems still need to be further studied such as when the iron tower was modeled by the line model, the error increased with the increase of the excitation frequency, and when calculating with the method of moments, the workload was huge and the efficiency was low. In future research, it is necessary to further explore a more realistic modeling method and a fast calculation method that reduces the number of calculations necessary. The results of the saliency analysis in this paper were based on the established co-simulation model, the electromagnetic calculation model of the three-base iron tower array and the rough ground. The determination of the rough surface size was based on the number of towers in the construction model. However, it is also necessary to determine the appropriate number of towers and the size range of rough ground in the calculation model according to the needs of actual passive interference research. In addition, the coupling law between them needs to be further studied and explored.

Author Contributions

Conceptualization, J.Z. and Z.G.; methodology, J.Z. and Z.G.; software, X.Z. (Xiaoyan Zhou) and P.Y.; validation, X.Z. (Xiaoyan Zhou) and P.Y.; formal analysis, J.Z., Z.G., X.Z. (Xiaoyan Zhou), P.Y. and C.J.; investigation, J.Z. and Z.G.; resources, C.J. and X.Z. (Xiumin Zhang); data curation, X.Z. (Xiaoyan Zhou) and P.Y.; writing—original draft preparation, X.Z. (Xiaoyan Zhou) and P.Y.; writing—review and editing, X.Z. (Xiaoyan Zhou), P.Y. and C.J.; visualization, C.J. and X.Z. (Xiumin Zhang); supervision, C.J. and X.Z. (Xiumin Zhang); project administration, J.Z. and Z.G.; funding acquisition, C.J. and X.Z. (Xiumin Zhang). All authors have read and agreed to the published version of the manuscript.

Funding

This work was Supported by Open Fund of State Key Laboratory of Power Grid Environmental Protection (No. GYM51202101373).

Institutional Review Board Statement

Not applicable.

Informed Consent Statement

Not applicable.

Data Availability Statement

Not applicable.

Conflicts of Interest

The authors declare no conflict of interest.

References

  1. Cao, B.; Jiang, M. Summary of the Research Status of Electromagnetic Environment in Power Transmission and Transformation Engineering. Electr. Saf. Technol. 2020, 22, 46–51. [Google Scholar]
  2. Tang, B.; Xiao, Q.; Liu, X.; Qi, D.; Liang, X. Calculation and Analysis of Passive Interference Level of Shared Tower. High Volt. Eng. 2021, 47, 3724–3732. [Google Scholar]
  3. Kannus, K.; Lehtio, A.; Lakervi, E. Radio and TV interference caused by public 24 kV distribution networks. IEEE Trans. Power Deliv. 1991, 6, 1856–1861. [Google Scholar] [CrossRef]
  4. Morris, R.M.; Morse, A.R.; Griffin, J.P. Corona and radio interference performance of the nelson river hvdc transmission lines. IEEE Trans. Power Appar. Syst. 1979, PAS-98, 1924–1936. [Google Scholar] [CrossRef]
  5. Trueman, C.W.; Kubina, S.J. Numerical computation of the reradiation from power lines at mf frequencies. IEEE Trans. Broadcast. 1981, 27, 39–45. [Google Scholar] [CrossRef]
  6. Trueman, C.W.; Kubina, S.J. Power line tower models above 1000 kHz in the standard broadcast band. IEEE Trans. Broadcast. 1990, 36, 207–218. [Google Scholar] [CrossRef]
  7. IEEE Standard 1260–1996; IEEE Guide on the Prediction, Measurement, and Analysis of AM Broadcast Reradiation by Power Lines. IEEE: Piscataway, NJ, USA, 1996.
  8. Gan, Z.; Zhang, X.; Zhang, G.; Wang, B.; Wu, X.; Zhou, W. Protected Distance of AM Receiving Stations to UHV AC Transmission Lines. High Volt. Eng. 2008, 34, 856–861. [Google Scholar]
  9. Liu, J.; Zhao, Z.; Cui, X.; Wang, Q. Analysis of passive interference on radio station from UHVDC power transmission lines in short-wave frequency. In Proceedings of the 2007 International Symposium on Electromagnetic, Qingdao, China, 23–26 October 2007; pp. 71–74. [Google Scholar]
  10. Tang, B. Main issues in the EMI Protection on Wireless Electronic Facilities from Adjacent UHVDC Power Lines. Ph.D. Thesis, Huazhong University of Science & Technology, Wuhan, China, September 2011. [Google Scholar]
  11. Jiang, T.; Zou, J.; Ma, X.; Cui, D. Passive Interference to Short-Wave Direction-Finding Stations Caused by Transmission Lines. Power Syst. Technol. 2012, 36, 29–35. [Google Scholar]
  12. Zou, J.; Wu, G.; Jiang, T.; Wang, F.; Tan, R. Study on Calculation of Passive Interference of HVDC Transmission Line to Short-wave Radio Direction Station with Spatial Spectral Estimation Direction Finding Algorithm. Power Syst. Technol. 2020, 1582–1589. [Google Scholar]
  13. Tang, B.; Wen, Y.; Zhao, Z.; Zhang, X. Three-dimensional Surface Computation Model of the Reradiation Interference From UHV Angle-steel Tower. Proc. CSEE 2011, 31, 104–111. [Google Scholar]
  14. Gan, Z.; Wang, Y.; Zhang, J.; Zhao, Z.; Li, Y. Suppression of HF Passive Interference in Transmission Lines by Using Magnetic Tube. Gaodianya Jishu High Volt. Eng. 2017, 43, 1722–1728. [Google Scholar]
  15. Tang, B.; Huang, H.; Sun, Z.; Ye, L.; Zou, F.; Wu, W. Calculation of Reradiation Interference in Ultrahigh Frequency from Power Lines Based on the Method of Large Element Physical Optics. J. Xinyang Norm. Univ. (Nat. Sci. Ed.) 2017, 30, 287–292. [Google Scholar]
  16. Wang, J.R.; Schmugge, T.J. An Empirical Model for the Complex Dielectric Permittivity of Soils as a Function of Water Content. IEEE Trans. Geosci. Remote Sens. 1980, 18, 288–295. [Google Scholar] [CrossRef] [Green Version]
  17. Tabatabaeenejad, A.; Moghaddam, M. Bistatic scattering from three-dimensional layered rough surfaces. IEEE Trans. Geosci. Remote Sens. 2006, 44, 2102–2114. [Google Scholar] [CrossRef]
  18. Lam, K.W.; Zheng, L.; Li, Q.; Tsang, L.; Chan, C.H.; Lai, K.L. Statistical distributions of fields in scattering by random rough surfaces based on Monte Carlo simulations of maxwell equations. In Proceedings of the 2003 IEEE International Antennas and Propagation Symposium and USNC/CNC/URSI North American Radio Science Meeting, Columbus, OH, USA, 22–27 June 2003; pp. 573–576. [Google Scholar]
  19. Hu, B.; Chew, W.C. Fast inhomogeneous plane wave algorithm for electromagnetic solutions in layered medium structures: Two-dimensional case. Radio Sci. 2000, 35, 31–43. [Google Scholar] [CrossRef]
  20. Johnson, J.T. A study of the four-path model for scattering from an object above a half space. Microw. Opt. Technol. Lett. 2001, 30, 130–134. [Google Scholar] [CrossRef]
  21. Axline, R.M.; Fung, A.K. Numerical computation of scattering from a perfectly conduction random surface. IEEE Trans. Antennas Propag. 1978, 26, 482–488. [Google Scholar] [CrossRef]
  22. Zeng, Q. Study on Characteristics of Maximum Power Frequency Electric Field Gradient on Ground and Maximum Sag of Bundle Conductor for UHVAC Transmission Line. Power Syst. Technol. 2008, 21, 1. [Google Scholar]
  23. Zhuang, X. Investigation on the Power Frequency Electromagnetic and Transmitted Power of AC 1000kV Transmission Lines and Influencing Factors. Ph.D. Thesis, Chongqing University, Chongqing, China, 2012. [Google Scholar]
  24. Lu, Y.; Zhao, Z.; Gan, Z.; Zhang, J. Research on Conductor Modeling of Passive Interference Analysis of Transmission Line. J. North China Electr. Power Univ. (Nat. Sci. Ed.) 2019, 46, 66–72. [Google Scholar]
  25. Lu, Y.; Zhao, Z.; Ni, C.; Gan, Z.; Zhang, J. Passive Interference of Overhead Conductors to Radar under Different Voltage Levels. Sci. Technol. Eng. 2019, 19, 187–192. [Google Scholar]
  26. Shamsi, M.; Razzaghi, M. Solution of Hallen’s integral equation using multiwavelets. Comput. Phys. Commun. 2005, 168, 187–197. [Google Scholar] [CrossRef]
  27. Zhang, X. Research of Fast 3D Modeling Technology and Method for Transmission Lines. Master’s Thesis, North China Electric Power University, Beijing, China, 2014. [Google Scholar]
  28. Liu, M.; Ye, X.; Wang, Q. The Study on Radio Interference of UHV Transmission Lines Based on the Effect of Transmission Line Sag. J. Jiangxi Norm. Univ. (Nat. Sci. Ed.) 2018, 42, 454–458. [Google Scholar]
Figure 1. Calculation Model of passive interference of UHV transmission line.
Energies 15 04510 g001
Figure 2. One dimensional Gaussian rough surface with different RMS heights and relevant lengths. (a) Different RMS heights; (b) Different relevant lengths.
Energies 15 04510 g002
Figure 3. Line model of 1000 kV dry-type tower and 1000 kV cup-type tower. (a) Dry-cup tower; (b) Cup-type tower.
Energies 15 04510 g003
Figure 4. Outline diagram of four different rough grounds. (a) Sandy-fleshed ground; (b) Silty fertile ground; (c) Powdery sandy loam ground; (d) Powdery clay ground.
Energies 15 04510 g004
Figure 5. Three-base tower two-span array model considering the sag characteristics of overhead ground wire.
Energies 15 04510 g005
Figure 6. Comparison of passive interference results with and without auxiliary angle-steel under 16.7 MHz plane wave incidence. (a) Comparison of the dry-type tower; (b) Comparison of the cup-type tower.
Energies 15 04510 g006
Figure 7. Comparison of influence of the tower type and auxiliary angle-steel on passive interference results under different frequency incident waves. (a) Change of passive interference result; (b) Result of error varying with frequency.
Energies 15 04510 g007
Figure 8. Passive interference values of RMS height and relevant length at different levels. (a) RMS height h as variable; (b) Relevant length l as variable.
Energies 15 04510 g008
Figure 9. Normalized passive interference minimum value of four kinds of rough ground at different frequencies.
Energies 15 04510 g009
Figure 10. The three-dimensional effect of joint simulation of three-base tower array and rough ground.
Energies 15 04510 g010
Figure 11. Comparison of passive interference results of experimental model No. 4 and its limiting factors A, B, and D.
Energies 15 04510 g011
Table 1. Summary of current transmission line passive interference modeling.
Research StatusTowersRough GroundOverhead
Conductor
Disadvantages or Conclusions
Gan, Z.Three tower models with only main materials [8]PEC groundStraight-line model [14]The particularity of the complex spatial structure of tower angle-steel is not reflected
Tang, B.Established ZP30101 tower with or without auxiliary angle-steel [10]; Tower face-model [13]PEC ground/Auxiliary angle-steel has a significant impact at high frequency, but only established one tower type
Jun, Zou [11,12]tower adopts the pyramid modelPEC groundStraight-line modelSimplified tower shape may increase calculation error
Schmugge and Wang [16]/Four types of different rough ground/No electromagnetic analysis for UHV transmission lines
Johnson, J.T. [20]
Axline, R.M. [21]
/Simple rough surface/Composite scattering from rough surfaces and simple targets
Ying, Lu [24,25]//The actual strand structure of the conductorNot considering the arc sag effect of the wire
Table 2. Parameters for each of the four ground types.
Ground TypeSand Content
(S)
Clay Content
(C)
RMS Height
δ
Relevant Length
l
Dielectric Constant
Sandy-fleshed51.5%13.5%1.16.39.667 + j0.601
Silty fertile30.6%13.5%0.43.69.234 + j0.572
Powdery sandy loam17.2%19.0%0.64.88.466 − j0.512
Powdery clay5.0%47.4%0.152.16.345 − j0.336
Table 3. The minimum value of RCS normalization under different rough surfaces.
Ground TypeFrequency
0.5 MHz3 MHz10 MHz16.7 MHz30 MHz
Sandy-fleshed−26.5746−29.5397−30.9926−31.5608−36.542
Silty fertile−27.4936−28.3159−28.3655−30.5195−33.264
Powdery sandy loam−14.0014−21.589−29.2199−30.6614−31.7508
Powdery clay−15.631−26.2619−28.8158−29.4096−32.0343
Unit: dBsm.
Table 4. Factors and levels of co-simulation.
Parameter LevelA
Ground Roughness
B
Tower Structure
C
Auxiliary Angle-Steel
D
Sag Height/(m)
1Silty fertile groundCup-type towerWithout angle-steel8
2Powdery sandy loam groundDry-type towerWith angle-steel13
3Sandy-fleshed ground///
4Powdery clay ground///
Table 5. Experimental results and calculations of the joint model at 10 MHz incident wave.
Experiment No.ABCDExperimental
1234 x i y i = 10 × ( x i )
11(A1)1(B1)11−0.5467555.46755
212(B2)22−0.8416828.41682
32(A2)121−0.5873455.87345
42212−0.6778446.77844
53(A3)122−0.5537315.53731
63211−0.6774816.77481
74(A4)112−0.4687534.68753
84221−0.7565427.56542
K 1 j 13.8843721.5658423.7083925.68129 i = 8 8 y i = 51.10139
i = 8 8 y i 2 = 336.9508085
K 2 j 12.6518929.5355527.39325.4201
K 3 j 12.31218///
K 4 j 12.25295///
R j 1.6314213.469716.184610.23881/
S j 285.166457.93953471.69704390.008528/
Kij = the sum of the results of each experiment with the level number i on the jth column; Rj is called the extreme difference of the jth column or the extreme difference of its factor; Sj is the variance of the jth column.
Table 6. Analysis of variance (ANOVA) of joint simulation results under 10 MHz electromagnetic wave incidence.
Variance SourceQuadratic Sum
S
Degree of Freedom
f
Mean Square
S ¯
F-ValueSignificance
A285.1664544395.05548487.342409613*
B7.93953468617.9395346860.188411874
CΔ1.69704385711.697043857
DΔ0.00852752710.008527527
e42.13924801142.13924801
eΔ51.78435408412.94608852
* means significant impact.
Publisher’s Note: MDPI stays neutral with regard to jurisdictional claims in published maps and institutional affiliations.

