
Experimental Study of Digitizers Used in High-Precision Impedance Measurements


Department of Measurement Science, Electronics and Control, Silesian University of Technology, 44-100 Gliwice, Poland
Energies 2022, 15(11), 4051; https://doi.org/10.3390/en15114051
Submission received: 27 April 2022
/
Revised: 28 May 2022
/
Accepted: 30 May 2022
/
Published: 31 May 2022
(This article belongs to the Special Issue Measurement Applications in Industry 4.0)
Abstract
:In the currently used primary impedance measuring systems, there is a need to compare standards with ratios different from 1:1, e.g., in order to transfer the value to multiples or submultiples of the basic quantity. Unfortunately, the commercial PXI sampling systems used to measure the voltage ratio in the impedance bridge, although they provide adequate resolution, show a considerable non-linearity of the measurement. This leads to significant error of the impedance ratio measurement. Experimental studies of commercial PXI digitizers used in primary impedance metrology are presented in the paper. The scope of the work includes presentation of the sampling measurement system hardware used in electronic synchronous impedance bridges and studies of the parameters that affect the applicability of PXI digitizers in high-precision measuring instruments. Nonlinearity errors of digitizers on boards NI PXI-4461 and NI PXI-4462 were measured and appropriate conclusions regarding possible corrections of the errors were drawn.
1. Introduction
Industrial development, which is currently focused on the automation and implementation of modern measurement technologies, is not possible without the harmonious development of metrology, including the highest accuracy metrology. Therefore, research related to the development of new and improved standards for electrical quantities, as well as standard systems and methods for measuring these quantities, are of fundamental importance for the development of Industry 4.0.
In recent years, fully digital ratio impedance bridges [1,2,3,4,5,6,7,8,9], have emerged as devices suitable for primary impedance metrology. Several National Metrology Institutes (NMIs), including the Polish NMI Central Office of Measures (GUM, Warsaw, Poland), have begun to implement digital bridges in their metrological traceability systems [10,11]. The bridges are characterized by affordable cost, short measuring time, ease of operation, and ability to compare impedances in the whole complex plane. These features make such bridges with digital sources [12,13] of interest for small or less-experienced NMIs and other calibration laboratories. Using the latest digital techniques and adopting techniques for interference-free measurements [14], including: current equalization, very good magnetic and electric screening, designing precise low-noise electronic circuits, phase-sensitive detection, elimination of thermoelectric forces, isolating noisy instruments, eliminating inductive coupling, using precision voltage sampling methods, and complex data-processing algorithms, it is possible to obtain a precision of 10−6 in the digital ratio impedance bridge.
In general, considering the means used to establish the ratio reading, digital impedance bridges can be classified as generating (or sourcing or DAC-based) [4,6] if the reference ratio is determined by the settings of a digital signal generator, or as sampling (or digitizing or ADC-based) [7,8,10] if the reference ratio is determined from digitized samples.
In a sampling bridge, usually consisting of a two-phase digital signal source and a sampling system synchronized with the source, an impedance ratio is compared to a ratio determined from digitized samples. From the impedance bridges used at NMIs we expect accuracy at the level of 10−6, both for 1:1 and 10:1 comparisons. Commercial LCR meters (such as the Keysight E4980A) and impedance analyzers (such as the Keysigth E4990A) cannot provide this accuracy. 10:1 impedance comparisons allow one to transfer the value of a given standard to multiples and submultiples. Since the accuracy of an impedance comparison system is determined (in addition to the stability of the main two-channel source, see Figure 1) primarily by the accurate measurement of the voltage ratio, which is carried out by the digitizer (ADC), it is necessary to ensure high linearity of this digitizer (at the level of 10−6). The parameter that informs us about the linearity of the digitizer is the so-called nonlinearity error. The knowledge of this error is crucial to make appropriate corrections in the control program and thus achieve the required measurement accuracy. The authors’ motivation is therefore to increase the accuracy of the impedance comparison in the 10:1 ratio. For this purpose, it is necessary to measure the nonlinearity errors of the digitizers used. These measurements, due to the specificity of the measurements, require high accuracy and consideration of interference-free measurement techniques [14].
The synchronous sampling bridge (described in detail in [7]) is usually built around different commercial boards mounted in a PXI chassis. The most popular are the National Instruments data acquisition cards (DAQ) PXI-4461, PXI-4462, and PXI-5922. Unfortunately, the specifications of DAQ boards [15,16] provided by their manufacturers do not specify all parameters important for designers of high-precision measuring systems. Therefore, it is difficult to assess them in terms of their suitability in precision impedance metrology. There are a few papers that characterize specific PXI digitizers, e.g., PXI-5922 and PXI-4461 [17,18], but the papers do not cover all variants of digitizers. In particular, they do not address the tests of PXI-4462. Moreover, it is suspected that different items of the same type PXI board may exhibit different metrological characteristics. Hence, it is vital to examine in detail properties of the PXI boards that will be used as main digitizers in the high-precision impedance bridge.
The paper describes a hardware idea of the digitizing impedance bridge using a new high-performance two-channel source of digitally synthesized AC voltage [19,20], and an experimental study of the metrological properties of the PXI NI-4461 and NI-4462 digitizers, which are intended for use in the digitizing impedance bridge. Particular attention in the paper is paid to the investigation of the nonlinearity errors of the aforementioned digitizers that are crucial when used in a high accuracy impedance bridge.
2. PXI System
2.1. Description of the Digitizing Bridge
The Department of Measurement Science, Electronics, and Control of the Silesian University of Technology (SUT, Gliwice, Poland) is currently developing and implementing a synchronous sampling system intended for use in the high-precision digitizing impedance bridge. The implementation of such a system in the Central Office of Measures will increase the calibration and measurement capability (CMC) for impedance comparisons in the Polish NMI. This leads directly to an increase in the accuracy of measurements at all levels of the hierarchical pyramid, ending with instruments used in industry.
The general idea of the digitizing bridge is presented in Figure 1. The value of the unknown standard unit under test (UUT) is determined by the precisely measured ratio of voltages across both impedances and the known value of the reference standard REF. The voltage ratio is measured using the multiplexer MUX and the main digitizer. The balance of the bridge is controlled by the balance digitizer. An advanced sampling system is used to measure the voltage ratio. The sampling system is built around a PXI chassis NI PXI-1036 having the three following NI boards with digitizers:
- two high-performance PXI-4461 I/O dynamic signal acquisition devices with two 24-bit sigma-delta analog-to-digital converters (ADC) and two 24-bit digital-to-analog converters (DAC). Their maximum sampling rate is 204.8 kS/S;
- one high-performance PXI-4462 I/O dynamic signal acquisition device with four 24-bit sigma-delta (ADC). Their maximum sampling rate is 204.8 kS/S.
The MXI-4 controller NI PXI-8336 serves (together with PCI-8336) as the PXI system controller.
Two other NI PXI boards (NI PXI-6653 and PXI-2567) were used to build the fully synchronized bridge system with successive sampling. This sampling technique implies that the two voltages across impedances being compared (UUT and REF) are not measured simultaneously, but successively. The main advantage of successive sampling is that the digitizer gain error is removed if it remains stable during the time taken to measure the two voltages [5]. The timing and synchronization module NI PXI-6653 [21,22] allows replacing the native 10 MHz signal on the chassis backplane by a very stable and accurate frequency source generated by the ovenized crystal oscillator OCXO. The 64-channel relay driver module PXI-2567 allows controlling relays of the bespoke multiplexer MUX.
DSS_2CH (see Figure 1) is a noncommercial two-channel source capable of generating two sinusoidal signals with high short- and mid-term stability of voltage, phase, and frequency [19,20]. The source, developed at SUT, owes its high stability to temperature stabilization of modules with D/A converters, as well as the use of a low-noise reference voltage source and many techniques to reduce electromagnetic interference, such as optical separation, electrical and magnetic shielding, elimination of capacitive and inductive couplings, or isolation of elements that generate noise. A bespoke coaxial digitally-controlled relay multiplexer MUX (see Figure 1) was used to measure the voltage ratio successively. The MUX that has two coaxial input channels and one coaxial output channel was designed and manufactured by the SUT. The multiplexer contains bistable relays controlled by the PXI-2567 module. To avoid current redistribution between the input voltage and output voltage measurement, the unused input channel of the MUX is connected to a shorting admittance yi (see Figure 1) whose value is adjusted to be the same as the input admittance of the digitizer. For NI-4461 and NI-4462, the input impedance of the analog inputs is 1 MΩ in parallel with 217 pF.
The data transfer between the PXI modules and the computer is made through an optical link to ensure good electrical insulation. The whole system is fully computer controlled, and a LabVIEW program manages the data acquisition and voltage ratio calculation. The LabVIEW-based Virtual Instrument is responsible for controlling the PXI system, and acquiring and analyzing results. Setting the parameters necessary for correct operation is possible due to a graphical user interface (GUI) displayed on a PC. A virtual front panel on the device was divided into two sections: one responsible for the configuration of the system and one for the presentation of the results.
2.2. Digitizers
Conceptually, a digitizer contains different key components, such as an input amplifier, analog and digital filters, and the ADC itself. Since only limited information about the precise architecture inside each commercial digitizer is available, they are considered black boxes. The digitizer error is the difference between an input signal and an ADC’s output. Hereinafter, the terms digitizer or ADC are used interchangeably. The main characteristics of the two digitizers evaluated in this article are reported in Table 1. For a more detailed description, the reader should refer to [15].
The noise characterization of the PXI-4461 reported in [17] shows that the voltage level applied to the digitizers has no effect on the white noise level. However, for the NI-4461 boards, the 1/f noise floor clearly increases with voltage level. The 1/f noise floor is reached after a measuring time of 50 to 100 ms for NI-4461. Therefore, no improvement in type-A uncertainty can be expected by increasing the measuring time beyond these limits. As reported in [17] the level of the noise related to the offset and related to the gain of the NI-4461 digitizer, referred to the FSR, is 35 nV/V and 215 nV/V respectively. The noise level is acceptable from the point of view of using this digitizer in the digital impedance bridge that is expected to be accurate to 1 μV/V.
National Instruments and other manufacturers do not specify nonlinearity errors of digitizers. Since the digitizing bridge is based on the measurement of the voltage ratio, the nonlinearity error, not the absolute error, determines the impedance measurement accuracy.
3. Nonlinearity Investigation
3.1. Setup
3.1.1. Hardware
The linearity of the digitizer is expressed by the nonlinearity error ε and can be given by the following formula [23]:
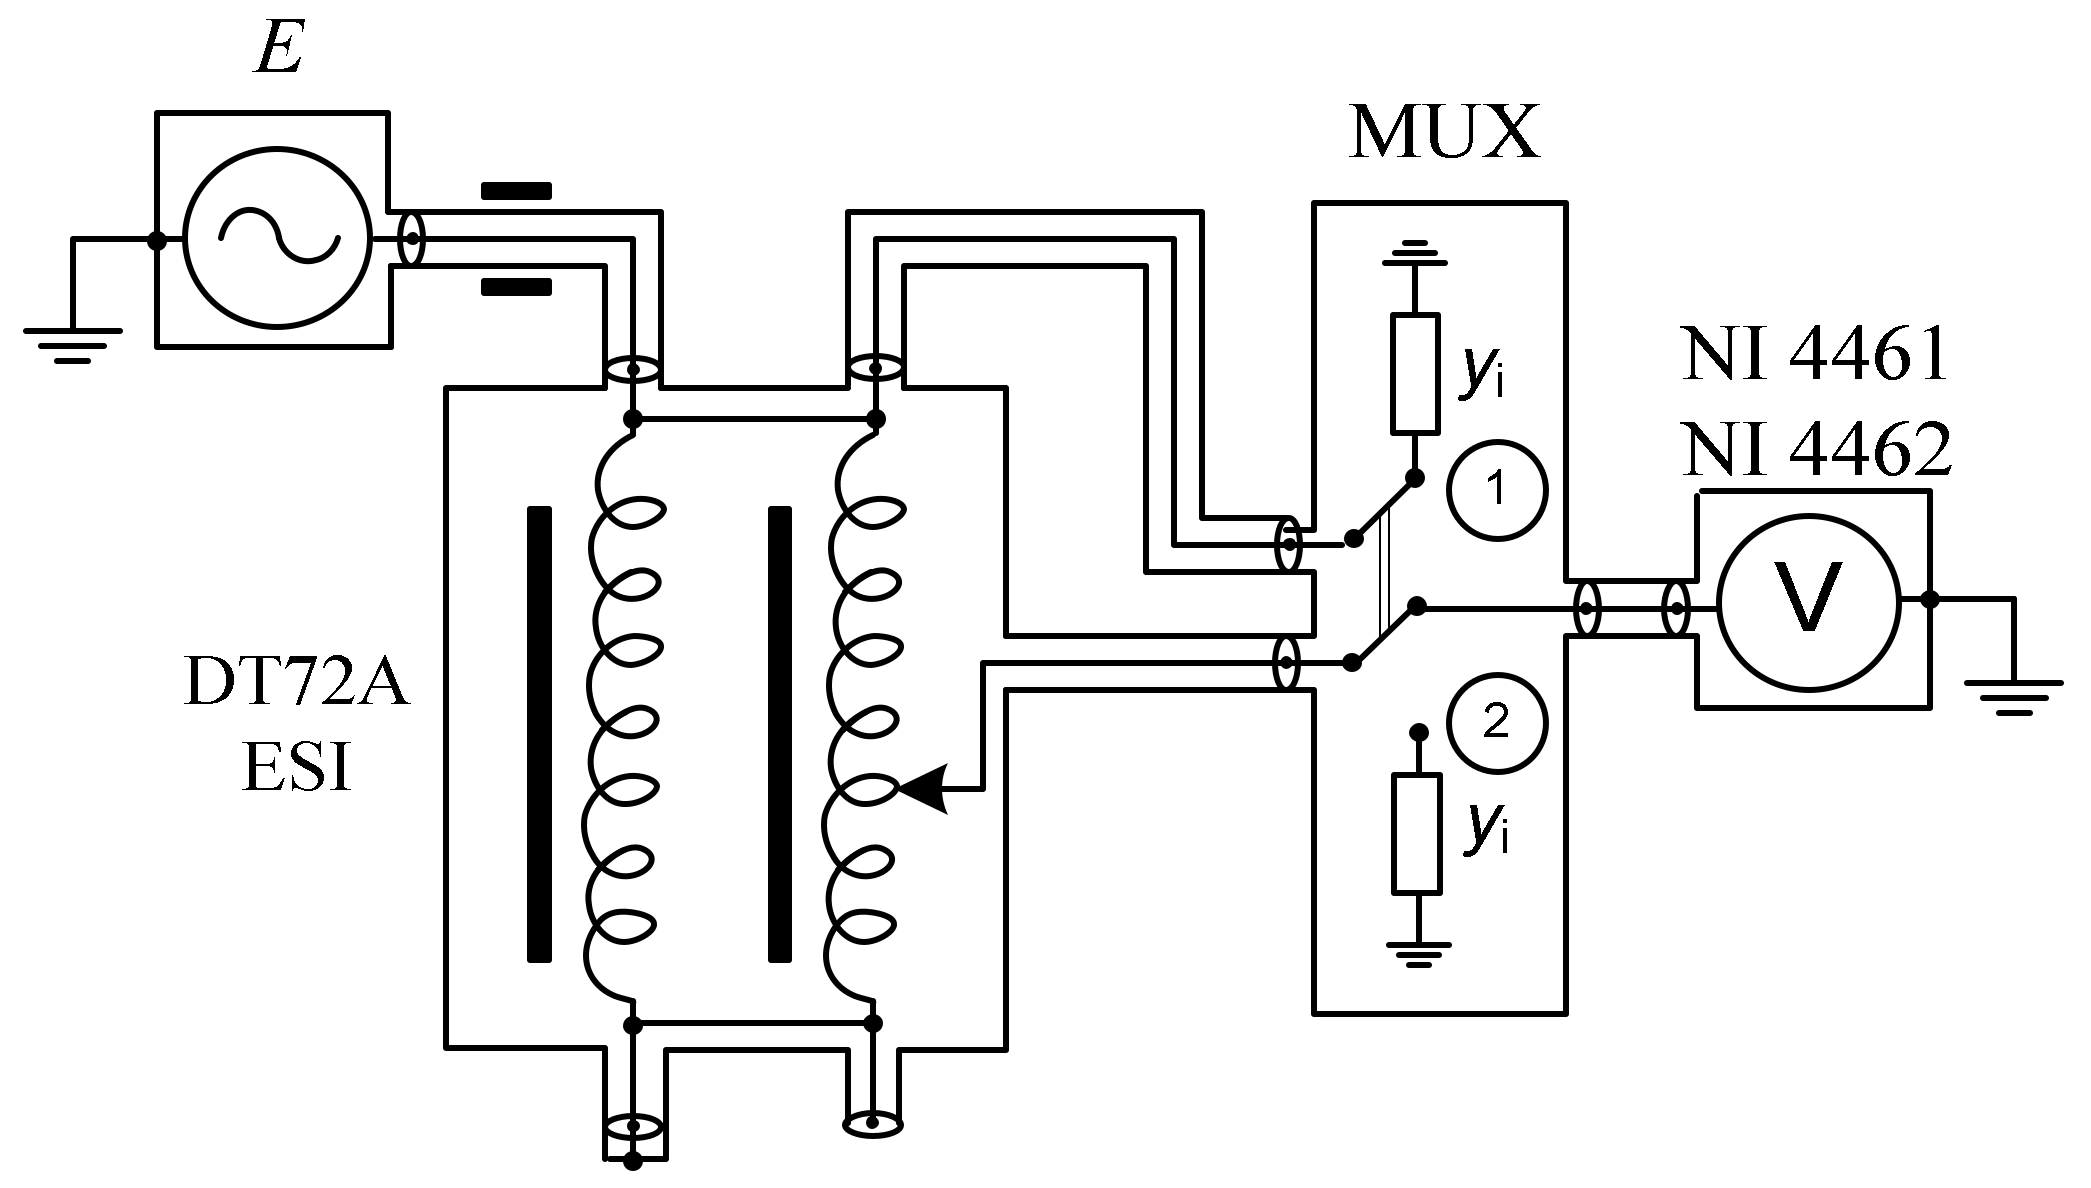
where k is the ratio divider chosen by manually selecting a particular tap of the reference inductive voltage divider, and VOUT and VIN are the readings of the digitizer V when fed with output and input voltages (position 1 and 2 of the MUX in Figure 2, respectively).
Nonlinearity errors of all analog inputs of the both National Instruments PXI-4461 and PXI 4462 boards used at SUT were investigated in the setup presented in Figure 2. Before starting the tests, the NI-4461 and NI-4462 boards were calibrated according to the procedure described in [24]. An image of the measurement system is presented in Figure 3. The ESI Dekatran DT72A 7-decade top-class commercial inductive voltage divider (IVD) was used to provide excellent standard linearity. The deviation of the ratio from the nominal settings for that specific instrument is better than ±0.5 ppm for frequencies up to 1 kHz and better than ±2.5 ppm for 1592 Hz. A two-channel source of digitally-synthesized AC voltage (DSS_2CH) developed at SUT was used to energize the DT72A. A two-channel multiplexer MUX developed at SUT and controlled by National Instruments PXI-2567 was used to measure the ratio VOUT/VIN.
3.1.2. Software
The PC (not visible in Figure 3) with LabVIEW software controls the PXI sampling system. Data transfer between the PXI modules and the PC is done through an optical link. LabVIEW-based Virtual Instrument was developed at SUT to control the DSS_2CH source and the multiplexer, and to enable voltage ratio measurements. A total of 4000 periods of the measured signal were sampled by the PXI A/D converter. During one measuring sequence, 200 periods of the input voltage were sampled, and after switching the sampler to position 2 (Figure 2), the other 200 periods of the output voltage were sampled. To avoid settling problems due to the switching between the two signals, ten periods before and after the switching have been omitted in the analysis. This sequence was repeated ten times. Finally, the fast Fourier transform (FFT) of each data set was computed, and the complex voltage ratio was calculated. The results obtained were statistically analyzed in order to estimate their uncertainty. Finally, the nonlinearity error was calculated according to Formula (1).
3.1.3. Conditions
The measurement setup used for the investigation of nonlinearity worked in a temperature controlled (23.0 ± 0.5) °C and electromagnetically screened room. All connections were made using coaxial cables. The high-permeability nanocrystal toroidal choke (marked by black rectangles in Figure 1) was used for current equalization in the coaxial cable [14,25]. The tests were done for 1 VRMS at the DSS_2CH output and for two typical comparison frequencies: 1 kHz and 1592 Hz. The frequency 1592 Hz is widely used in the National Metrology Institutes since it gives the round value of capacitive and inductive reactance (that is 2∙π∙f = 104). This section is not mandatory but can be added to the manuscript if the discussion is unusually long or complex.
3.2. Discussion of the Results
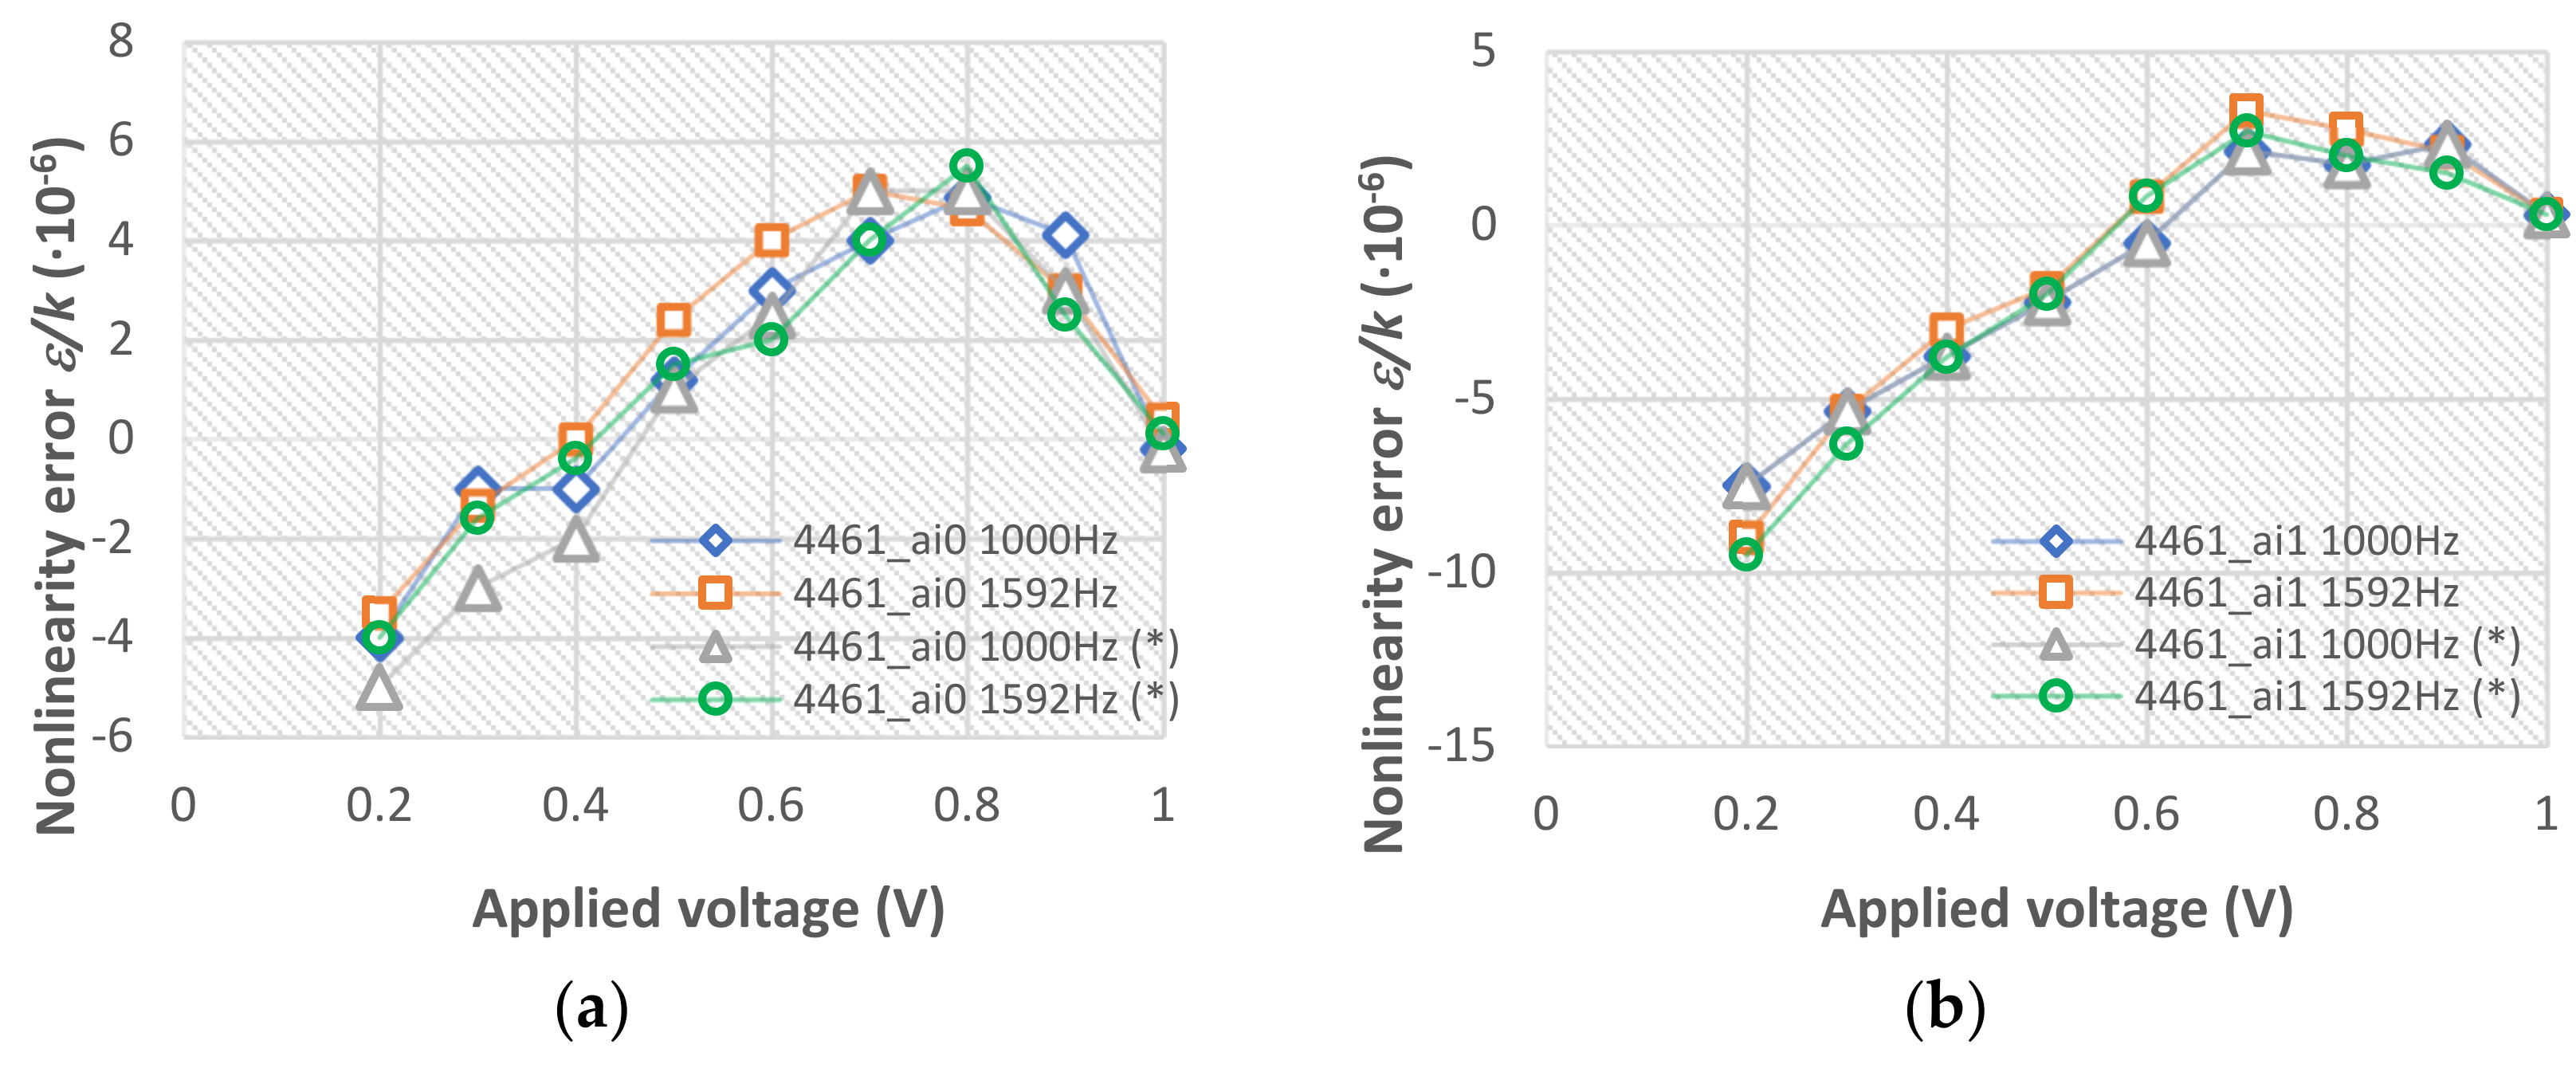
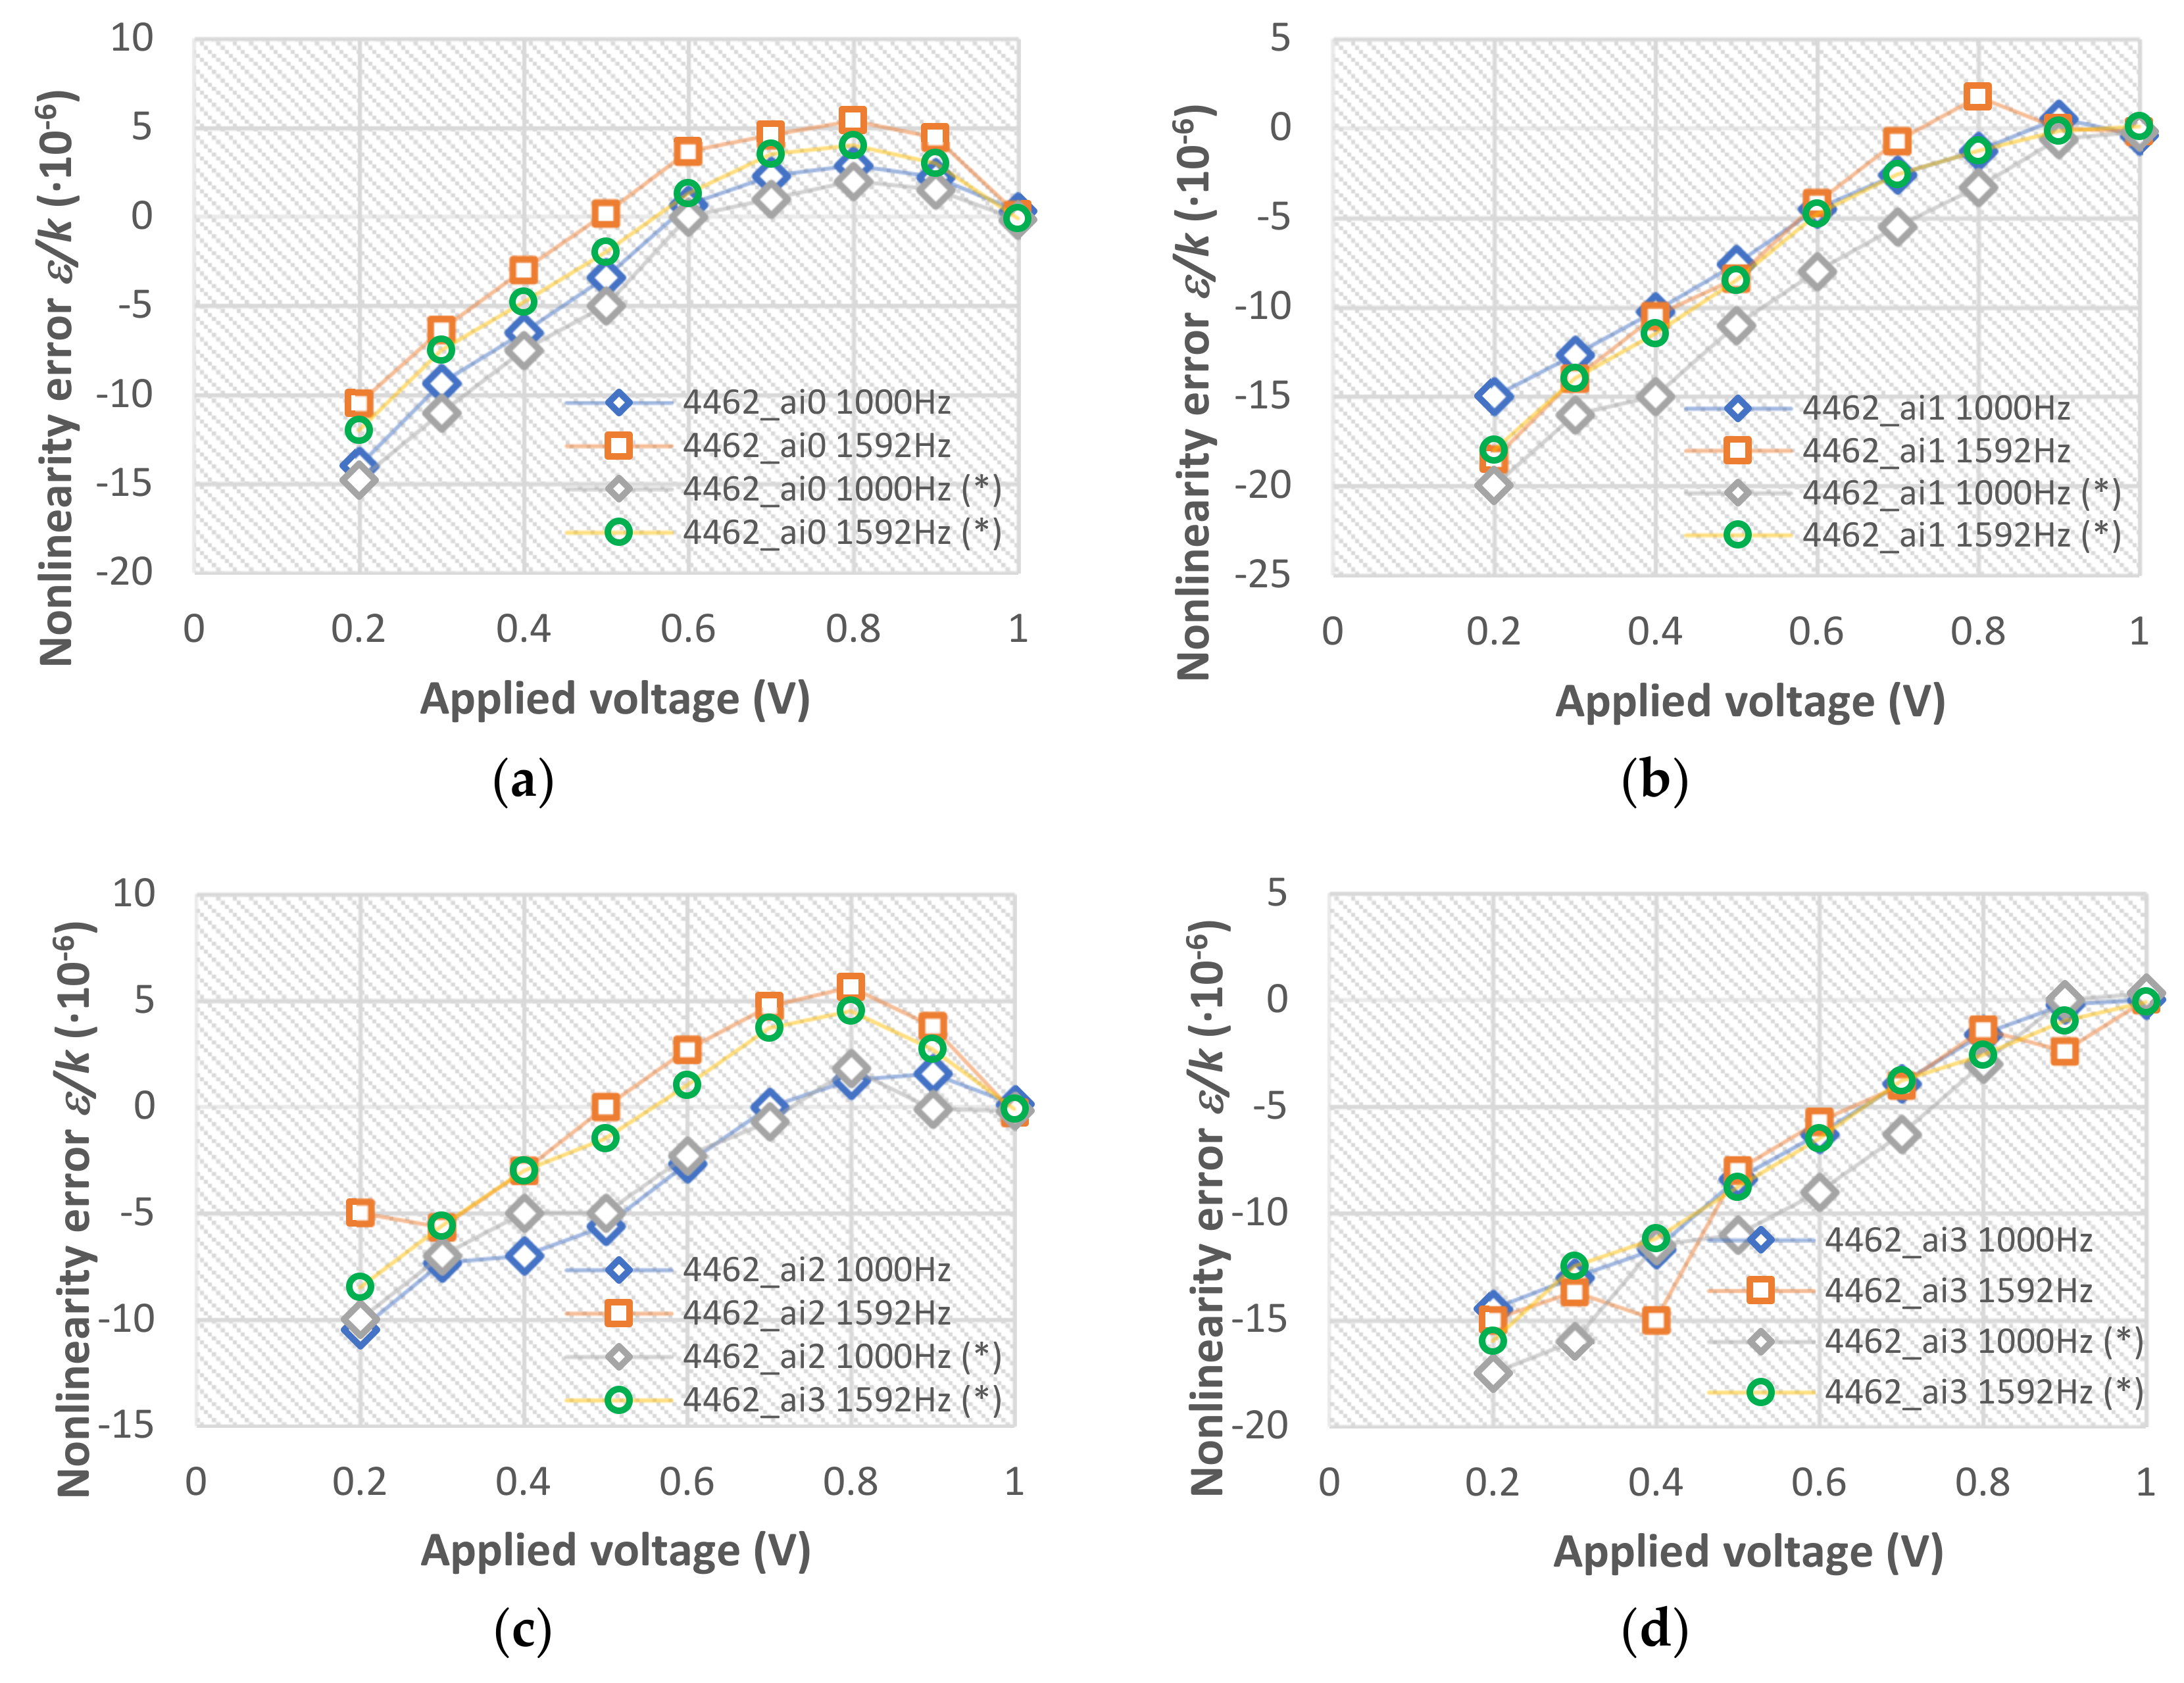
Results of the nonlinearity investigation are presented in Figure 4, Figure 5 and Figure 6. Graphs presented in Figure 4 and Figure 5 refer to the results obtained for the two PXI-4461 boards with (a) errors of the channel ai0 and (b) errors of the channel ai1. Graphs presented in Figure 6 refer to the results obtained for four channels of the PXI-4462 with (a) errors of the channel ai0, (b) errors of the channel ai1, (c) errors of the channel ai2, and (d) errors of the channel ai3. The measurement sequence consisting of ten series of measurements (see Section 3.1.2) was repeated after a month. The results obtained after one month are marked with an asterisk in the graphs. Results are referred to the IVD setting k. The standard deviation of each result is below 0.4 μV (which is smaller than the marker dimension and therefore is not presented in figures).
As expected, for the voltage ratio of 1:1 (IVD setting k = 1), nonlinearity errors of the digitizers are equal to zero (within the measurement uncertainty). This shows that there are no systematic errors in the measuring system. No significant differences were observed between the primary results and the results of the repeated measurements after one month. Moreover, the measurement results obtained show that for all tested digitizers the modulus of the relative nonlinearity error tends to increase along with the decrease in the ratio of the measured voltages. In other words, the greater the difference between the measured voltages, the greater the nonlinearity error. These errors reach a value 2 × 10⁻⁵ for a ratio of 1:5 (Figure 5b). For the PXI-4461 board with ID No. 2AI2A0 (Figure 4) there is the smallest dispersion between the results obtained for both digitizer inputs and both frequencies (compare the graphs “a” and “b”). However, the smallest absolute nonlinearity errors for both frequencies were obtained for the ai0 channel of the PXI-4461 board with ID No. E3A71F (Figure 5a).
Figure 7 presents summary of the nonlinearity measurements. In this figure maximum nonlinearity measurements (correspond to the ratio 0.2) for both frequencies are presented. Moreover, nonlinearity errors for ratio 0.628 at 1592 Hz are presented. It is due to the fact, that at NMIs comparison of two standards at 1592 Hz give impedance ratio equals 0.628 (for example resistor 10 kΩ over inductor 1 H). It is visible in Figure 7 that the lowest nonlinearity errors for the ratio 0.628 have occurred for inputs ai0 and ai1 of 4461 board with ID. No. 2AI2A0 and ai1 of 4461 with ID. No. E3A71F.
Since the best metrological parameters were obtained for PXI-4461 ID No. E3A71F, this ADC was used as the main digitizer in the digital impedance bridge currently used at SUT. In the case of this digitizer, without the software correction of nonlinearity errors it is possible to obtain a comparison accuracy at the level of 5 × 10⁻⁶ in the ratio range from 1:1 to 1:5.
4. Conclusions
The nonlinearity investigation of three high-performance PXI boards intended for use in the digitizing impedance bridge was presented in the paper. Taking the results into consideration, it is clearly visible that in the case of comparison of standards with a ratio other than 1:1, the nonlinearity error of the digitizer determines the accuracy of the system. Moreover, even cards of the same manufacturer and type show slightly different metrological properties. Using the test results, a board PXI-4461 No. E3A71F that shows the smallest nonlinearity errors was selected for the bridge implementation.
In the future, it is planned to continue the digitizers’ nonlinearity studies using a different method—the so-called capacitor permutations method [26,27,28]. This method will allow verification of the results obtained so far before the correction of digitizer nonlinearities in the control program used for measuring the complex voltage ratio of the impedances compared. The digitizer nonlinearity correction will consist in introducing correction factors for each voltage ratio (different from 1:1) separately and for each measurement frequency. To implement this method, a high-precision system of switchable capacitors must be built and thoroughly tested, which will be the subject of research in our department in the second half of 2022.
Funding
This research was partially funded by the Polish National Science Center (NCN) [grant No. 2020/37/B/ST7/00057]. This work was partially supported by the Rector’s pro-quality grant Silesian University of Technology [grant No. 05/020/RGJ21/0053].
Institutional Review Board Statement
Not applicable.
Informed Consent Statement
Not applicable.
Data Availability Statement
Not applicable.
Acknowledgments
I acknowledge the considerable contribution Marian Kampik has made to my understanding of the techniques of electronic precise measurements and the technical help in building the sampling system.
Conflicts of Interest
The author declares no conflict of interest.
References
- Lee, J.; Schurr, J.; Nissilä, J.; Palafox, L.; Behr, R. The Josephson two-terminal-pair impedance bridge. Metrologia 2010, 47, 453–459. [Google Scholar] [CrossRef]
- Overney, F.; Flowers-Jacobs, N.E.; Jeanneret, B.; Rüfenacht, A.; Fox, A.E.; Dresselhaus, P.D.; Benz, S.P. Dual Josephson impedance bridge: Towards a universal bridge for impedance metrology. Metrologia 2020, 57, 065014. [Google Scholar] [CrossRef] [PubMed]
- Overney, F.; Flowers-Jacobs, N.E.; Jeanneret, B.; Rüfenacht, A.; E Fox, A.; Underwood, J.M.; Koffman, A.D.; Benz, S.P. Josephson-based full digital bridge for high-accuracy impedance comparisons. Metrologia 2016, 53, 1045–1053. [Google Scholar] [CrossRef]
- Callegaro, L.; D’Elia, V.; Kampik, M.; Dan Bee Kim, M.; Ortolano, F. Pourdanesh, Ngoc Thanh Mai Tran, Experiences with a two terminal-pair digital impedance bridge. IEEE Trans. Instrum. 2015, 64, 1460–1465. [Google Scholar] [CrossRef] [Green Version]
- Zhang, L.J.; Li, Z.; He, Q.; Zhao, J.; Lu, Z. A digital compensation bridge for R–C comparisons. Metrologia 2012, 49, 266–272. [Google Scholar]
- Ortolano, M.; Marzano, M.; D’Elia, V.; Tran, N.T.M.; Rybski, R.; Kaczmarek, J.; Koziol, M.; Musiol, K.; Christensen, A.E.; Callegaro, L.; et al. A Comprehensive Analysis of Error Sources in Electronic Fully Digital Impedance Bridges. IEEE Trans. Instrum. Meas. 2021, 70, 1–14. [Google Scholar] [CrossRef]
- Overney, F.; Jeanneret, B. RLC Bridge Based on an Automated Synchronous Sampling System. IEEE Trans. Instrum. Meas. 2011, 60, 2393–2398. [Google Scholar] [CrossRef]
- Musioł, K.; Kampik, M.; Koszarny, M. A new sampling-based four-terminal-pair digital impedance bridge. Meas. Sensors 2021, 18, 100307. [Google Scholar] [CrossRef]
- Kučcera, J.; Kováč, J. A reconfigurable four terminal-pair digitally assisted and fully digital impedance ratio bridge. IEEE Trans. Instrum. Meas. 2018, 67, 1199–1206. [Google Scholar] [CrossRef]
- Ortolano, M.; Palafox, L.; Kucera, J.; Callegaro, L.; D’Elia, V.; Marzano, M.; Overney, F.; Gulmez, G. An international com-parison of phase angle standards between the novel impedance bridges of CMI, INRIM and METAS. Metrologia 2018, 55, 499–512. [Google Scholar] [CrossRef] [Green Version]
- Mašláň, S.; Šíra, M.; Skalická, T.; Bergsten, T. Four-Terminal Pair Digital Sampling Impedance Bridge up to 1MHz. IEEE Trans. Instrum. Meas. 2019, 68, 1860–1869. [Google Scholar] [CrossRef]
- Kozioł, M.; Kaczmarek, J.; Rybski, R. Characterization of PXI-based generators for impedance measurement setups. IEEE Trans. Instrum. Meas. 2019, 68, 1806–1813. [Google Scholar]
- Kučera, J.; Kováč, J.; Palafox, L.; Behr, R.; Vojáčková, L. Characterization of a precision modular sinewave generator. Meas. Sci. Technol. 2020, 31, 064002. [Google Scholar] [CrossRef]
- Awan, S.; Kibble, B.; Schurr, J. Coaxial Electrical Circuits for Interference-Free Measurements (Electrical Measurement); IET: Edison, NJ, USA, 2010. [Google Scholar]
- NI PXI-4461/4462 Specifications. 2003. National Instruments. Available online: https://www.ni.com/zh-cn.html (accessed on 7 February 2022).
- NI PXI-5922 Specification. 2018. National Instruments. Available online: https://www.ni.com/zh-cn/shop/pxi.html?cid=Paid_Search-7013q000001UgkRAAS-Consideration-GoogleSearch_106674782612&gclid=Cj0KCQjw-daUBhCIARIsALbkjSbDu_nWl5iy_61qojOxhatiIoBVHydB3K1vjm7W3iQVox_dZhiecFsaAjmhEALw_wcB (accessed on 7 February 2022).
- Overney, F.; Rufenacht, A.; Braun, J.-P.; Jeanneret, B.; Wright, P.S. Characterization of metrological grade ana-log-to-digital converters using a programmable Josephson voltage standard. IEEE Trans. Instrum. Meas. 2011, 60, 2172–2177. [Google Scholar] [CrossRef]
- Rietveld, G.; Zhao, D.; Kramer, C.; Houtzager, E.; Kristensen, O.; de Leffe, C.; Lippert, T. Characterization of a wideband digitizer for power measurements up to 1 MHz. IEEE Trans. Instrum. Meas. 2011, 60, 2195–2201. [Google Scholar] [CrossRef]
- Kampik, M.; Musioł, K. Investigations of the high-performance source of digitally synthesized sinusoidal voltage for primary impedance metrology. Measurement 2020, 168, 108308. [Google Scholar] [CrossRef]
- Musiol, K.; Kampik, M. Metrological triangles in impedance comparisons. Measurement 2019, 148, 106908. [Google Scholar] [CrossRef]
- NI Dynamic Signal Acquisition. National Instruments, November 2010. Available online: https://www.ni.com/docs/zh-CN/bundle/371235h/page/download.html (accessed on 7 February 2022).
- NI PXI-6653 User Manual. Timing and Synchronization Module for PXI. National Instruments, November 2003. Available online: https://www.apexwaves.com/pdf/manuals/PXI-5112/archived--ni-pxi-6653-user-manual.pdf (accessed on 7 February 2022).
- Callegaro, L.; D’Elia, V.; Manta, F. A setup for linearity measurement of precision AC voltmeters in the audio frequency range. In Proceedings of the 16th IMEKO TC4 Symposium, Florence, Italy, 22–24 September 2008. [Google Scholar]
- Musioł, K.; Kampik, M. Calibration of PXI Data Acquisition Cards Used for Primary Impedance Metrology; Measurement Systems in Theory and Practice, Institute of Metrology, Electronics and Computer Science, University of Zielona Gora: Zielona Góra, Poland, 2020; pp. 159–171. [Google Scholar]
- Callegaro, L. Electrical Impedance—Principles, Measurement and Applications, 1st ed.; CRC Press: Boca Raton, FL, USA, 2012. [Google Scholar]
- Cutkosky, R.D.; Shields, J.Q. Precision measurements of transformer ratios. IRE Trans. Instrum. 1960, 1, 243–250. [Google Scholar] [CrossRef]
- Hsu, J.C.; Gong, J.; Huang, C. An Automated Permuting Capacitor Device for Calibration of IVDs. IEEE Trans. Instrum. Meas. 2014, 63, 2271–2278. [Google Scholar] [CrossRef]
- Waltrip, B.; Seifert, F. A Programmable Capacitor for Inductance Measurements. IEEE Trans. Instrum. Meas. 2017, 66, 1572–1578. [Google Scholar] [CrossRef]
Figure 1.
Schematic of the digitizing bridge developed at SUT.

Figure 2.
Schematic representation of the setup for nonlinearity investigation.

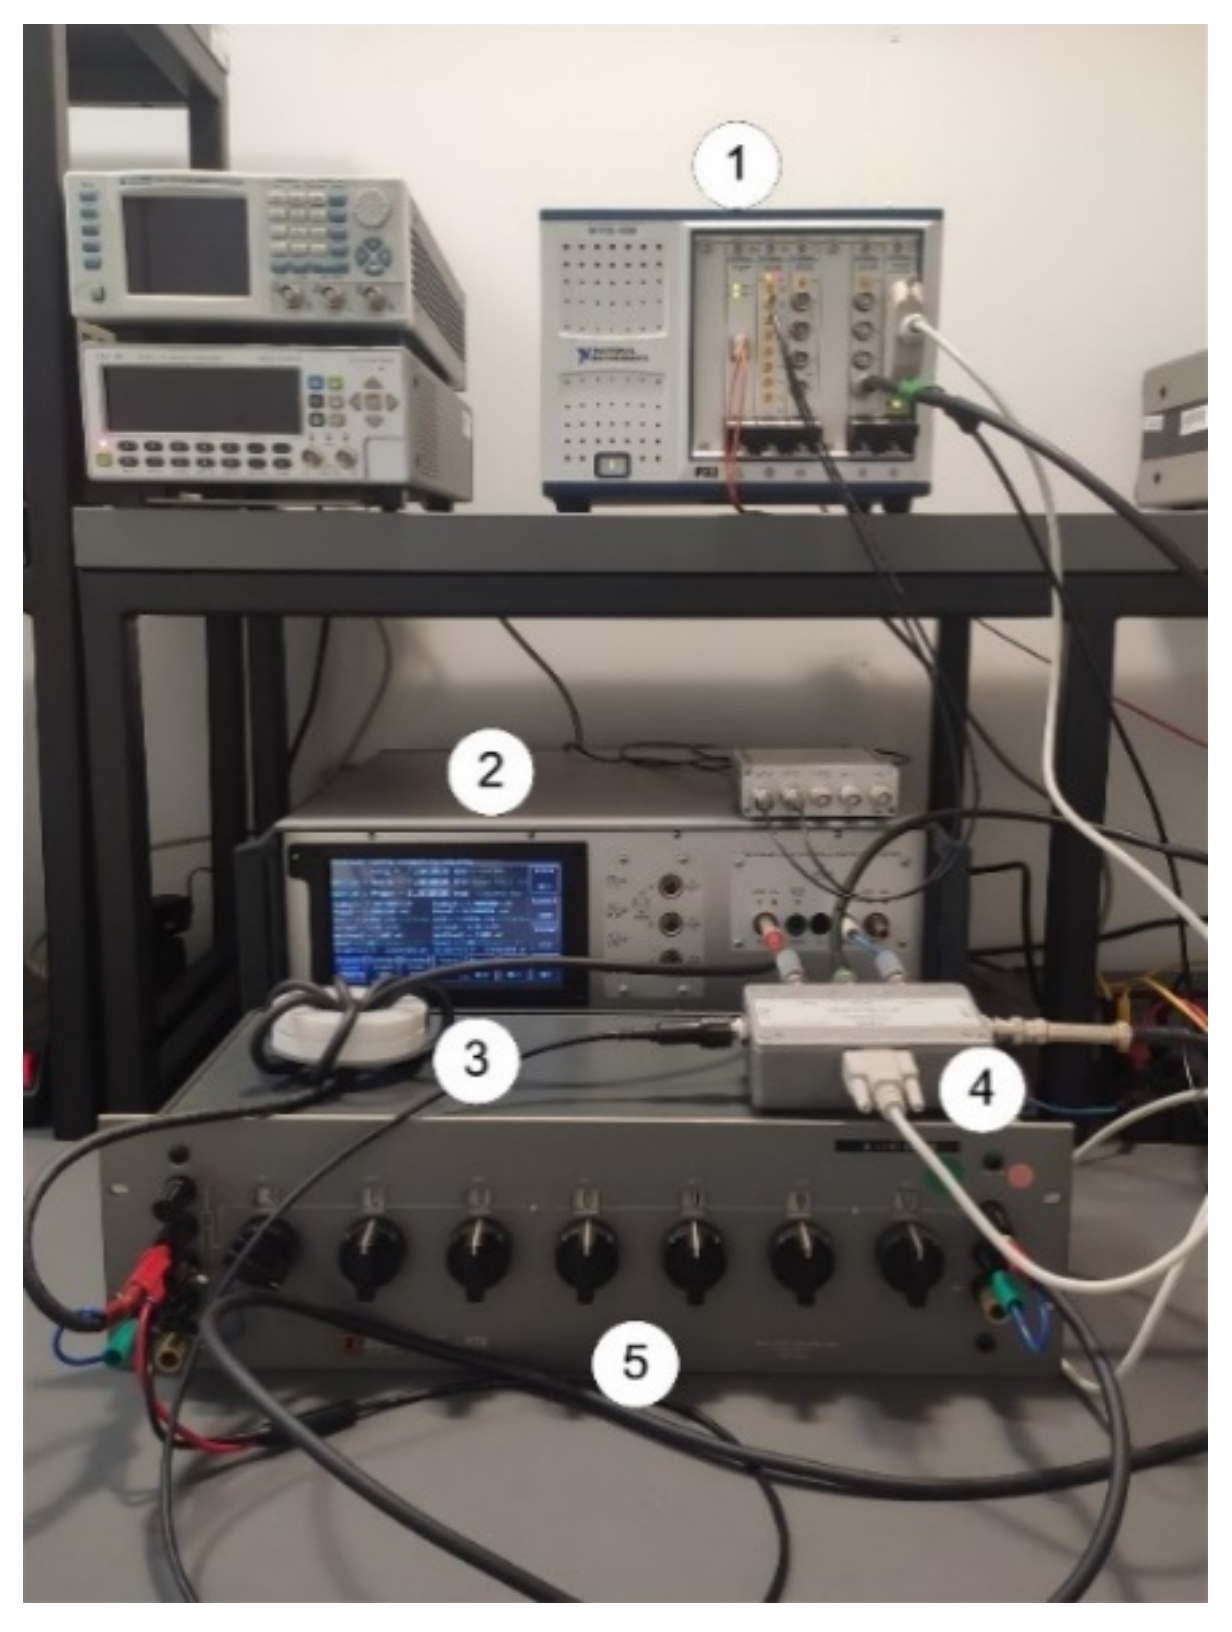
Figure 3.
Photo of the measurement system used for the investigation of nonlinearity: 1—PXI sampling system, 2—DDS_2CH source, 3—coaxial choke, 4—multiplexer, 5—IVD Dekatran DT72A.
Figure 3.
Photo of the measurement system used for the investigation of nonlinearity: 1—PXI sampling system, 2—DDS_2CH source, 3—coaxial choke, 4—multiplexer, 5—IVD Dekatran DT72A.

Figure 4.
Nonlinearity errors of the board PXI-4461 with ID. No. 2AI2A0 made in Hungary. Asterisk symbols correspond to the measurements made one month later. Maximum standard deviation is 0.4 μV. (a) errors of the channel ai0; (b) errors of the channel ai1.
Figure 4.
Nonlinearity errors of the board PXI-4461 with ID. No. 2AI2A0 made in Hungary. Asterisk symbols correspond to the measurements made one month later. Maximum standard deviation is 0.4 μV. (a) errors of the channel ai0; (b) errors of the channel ai1.

Figure 5.
Nonlinearity errors of the board PXI-4461 with ID. No. E3A71F made in USA. Asterisk symbols correspond to the measurements made one month later. Maximum standard deviation is 0.4 μV. (a) errors of the channel ai0; (b) errors of the channel ai1.
Figure 5.
Nonlinearity errors of the board PXI-4461 with ID. No. E3A71F made in USA. Asterisk symbols correspond to the measurements made one month later. Maximum standard deviation is 0.4 μV. (a) errors of the channel ai0; (b) errors of the channel ai1.

Figure 6.
Nonlinearity errors of the board PXI-4462, S/N: E1A5A2 made in USA. Asterisk symbols correspond to the measurements made one month later. Maximum standard deviation is 0.4 μV. (a) errors of the channel ai0; (b) errors of the channel ai1, (c) errors of the channel ai2; (d) errors of the channel ai3.

Figure 7.
Summary of the nonlinearity measurements. 4461 without asterisk correspond to the board with ID. No. 2AI2A0 made in Hungary, an asterisk was used for board with ID. No. E3A71F made in USA.
Figure 7.
Summary of the nonlinearity measurements. 4461 without asterisk correspond to the board with ID. No. 2AI2A0 made in Hungary, an asterisk was used for board with ID. No. E3A71F made in USA.


Table 1.
List of the main specifications of the digitizers evaluated in this paper.
| Name | No. of Input Channels | Sampling Rate kSa/s | ADC Resolution and Type | Full Scale V |
|---|---|---|---|---|
| PXI-4461 | 2 | 204.8 | 24-bit, delta-sigma | 0.316; 1; 3.16; 10, 31.6; 42.4 |
| PXI-4462 | 4 | 204.8 | 24-bit, delta-sigma | 0.316; 1; 3.16; 10, 31.6; 42.4 |
Publisher’s Note: MDPI stays neutral with regard to jurisdictional claims in published maps and institutional affiliations. |
© 2022 by the author. Licensee MDPI, Basel, Switzerland. This article is an open access article distributed under the terms and conditions of the Creative Commons Attribution (CC BY) license (https://creativecommons.org/licenses/by/4.0/).
Share and Cite
MDPI and ACS Style
Musioł, K. Experimental Study of Digitizers Used in High-Precision Impedance Measurements. Energies 2022, 15, 4051. https://doi.org/10.3390/en15114051
AMA Style
Musioł K. Experimental Study of Digitizers Used in High-Precision Impedance Measurements. Energies. 2022; 15(11):4051. https://doi.org/10.3390/en15114051
Chicago/Turabian StyleMusioł, Krzysztof. 2022. "Experimental Study of Digitizers Used in High-Precision Impedance Measurements" Energies 15, no. 11: 4051. https://doi.org/10.3390/en15114051
Note that from the first issue of 2016, this journal uses article numbers instead of page numbers. See further details here.