Article

Hydrological and Environmental Conditions and Implications of the Operation of a Thermal Power Plant with an Open Cooling System—An Example from Poland

by
Tomasz Walczykiewicz
* and
Mateusz Żelazny
Institute of Meteorology and Water Management—National Research Institute, ul. Podleśna 61, 01-673 Warszawa, Poland
*
Author to whom correspondence should be addressed.
Energies 2022, 15(10), 3600; https://doi.org/10.3390/en15103600
Submission received: 13 April 2022 / Revised: 9 May 2022 / Accepted: 13 May 2022 / Published: 14 May 2022
(This article belongs to the Collection Feature Papers in Energy, Environment and Well-Being)

Abstract

:
In Poland, coal-based thermal energy for cooling power plant installations uses a large amount of surface water. Historically, there have been cases of limitations in electricity supply due to low water levels and high temperature of water in rivers. Moreover, environmental requirements limit the possibility of using water resources for cooling purposes, pointing to the necessity to leave inviolable flows in rivers. This raises questions about the future of the operation of thermal power plants with open cooling systems and hence the research undertaken by the authors. The research consisted of a questionnaire survey, hydrological analyses, the impact assessment of climate change on the operation of power plants, and a discussion of technical solutions for water abstraction and power loss analysis in a particular power plant. The results indicate that there are power plants that are more sensitive to hydrological and environmental conditions and the temperature of the water required for cooling. In one case, keeping a power plant in operation requires the maintenance of periodic artificial damming of water. The conclusions from the research indicate that in Poland, regardless of the source of thermal energy, it is necessary to implement only closed cooling circuits.

1. Introduction

The projected increase in the frequency of weather extremes [1] carries risks related to the failure to supply electricity to consumers and increased energy prices. An example is the extremely warm year 2019, when the average annual temperature in Poland was 10.2 °C and was 2.4 °C higher than the long-term 1971–2000 standard [2]. Such high air temperatures undoubtedly increase electricity consumption by turning on air conditioners or fans on a large scale. According to Forum Energii [3], in Poland, the daily difference between the valley and the peak demand for power is systematically growing, especially in the summer period, when the average variability of power demand during the day increased from 5.3 GW in 2007 to 6.9 GW in 2017. The forecasts of peak power demand coverage by 2030 predict that these disproportions will deepen. It should be emphasized that improving energy efficiency depends not only on the supply side but also on the load side. Hence, it is necessary to use and constantly improve algorithms forecasting the planned load on energy systems [4].
Surface waters are one of the most significant elements of the natural environment. Their too intensive exploitation may lead to unfavorable and irreversible changes in the water environment and hydrogenic areas. This dominant factor in shaping the environment and climate also affects the functioning of the energy sector. In Poland, the demand for primary energy is mainly met with fossil fuels (hard coal, crude oil, natural gas, lignite) and renewable sources (18% share in 2020). In Poland, archaic and still 70% coal-based professional thermal energy for cooling power plant installations uses about 7 km3 of water per year, which corresponds to the flow in the river equal to Q = 220 m3 s−1 [5]. Annually, it is 14 times the equivalent of the water capacity in the largest Polish retention reservoir at the Solina Dam on the San River, storing 472.4 million m3 of water [6]. At the same time, it is the largest water consumption among other sectors of the country’s economy, amounting to 60% of the total consumption [7]. This is a serious quantitative and qualitative environmental problem. Quantitative, because the increasingly frequent low water levels and flows as the effects of climate change violate the normal operation of power plants or combined heat and power plants, and sometimes are even dangerous for technological devices. Qualitative, because heating water in open water circuits results in thermal pollution, which affects the biological life in the waters of rivers, lakes, and reservoirs [8]. Moreover, it is necessary to maintain the flows in rivers essential for biological life because of the environmental goals. The issues of the impact of energy facilities on surface waters, both in terms of quantity and quality, were also noted in the strategic document Poland’s Energy Policy until 2040 (PEP2040) [9]. In recent years, there have been cases of limitations in electricity supply due to low water levels in rivers or water temperature. One of them took place on 10 August 2015. As a result of the record energy demand (22 GW), the heatwave, low water level in rivers, overhauls of power units, and failure of the power plant in Bełchatów, for the first time since 1989, the so-called 20th power stage has been introduced. In Poland [10], the 11th stage of power supply is the basis for managing the collection of electricity. The consumer can take power up to the power level specified in the contract, which in practice means no restrictions. Power stages from 12 to 19 mean a uniform reduction in the power consumed by the recipient, in practice not necessarily perceptible. The introduced 20th stage meant that the recipient (excluding the critical infrastructure) could take power up to the minimum level while maintaining the safety of people and preventing damage or destruction of technological facilities. As a result of these restrictions, the sectors of industry (especially heavy) and services suffered the most, with economic losses estimated at PLN 1.5–2 billion [11]. Additionally, other studies concerning, inter alia, Great Britain [12], confirm the risk of water shortage and its impact on cooling systems and the need to look for alternative sources with a simultaneous increase in energy supply prices. In turn, in China [13], which is the largest electricity producer in the world, over 70% of energy comes from coal-fired power plants. However, nearly 10% of these systems face problems related to a water deficit for cooling. Of course, this problem does not only concern fossil fuel power plants. The same is true of nuclear power plants [14], which Poland does not yet have. Power plants with an open cooling circuit, which still operate in Poland, are particularly vulnerable. This shows how important it is to conduct continuous research to deepen knowledge about future threats to the use of water resources for thermal energy in the context of the impact of climate change. In Poland, research in this field was conducted by the authors at the Institute of Meteorology and Water Management—National Research Institute (IMGW-PIB), and their selected results are presented below. In the following sections, the characteristics of the conducted research, the results, and conclusions resulting from them are presented. The Materials and Methods section contains an overview of the sources used in the research, which included a survey addressed to energy companies, the characteristics of the operation of thermal power plants with an open cooling circuit, hydrological data, and methods of analysis of hydrological data and the forecasted impact of climate change on water resources in Poland in the perspective of the functioning of the existing thermal power plants. The Results section includes the results of the survey and hydrological calculations in the locations of water abstraction for cooling purposes and the analysis of the correlation between hydrological and thermal conditions and electricity production, as well as the forecasted changes in water resources as a result of climate change. The Discussion section discusses the obtained results in the context of the further operation of thermal energy with open cooling circuits, and the Conclusions section presents the perspectives and recommendations related to the future use of water resources in Poland for cooling purposes in energy production.

2. Materials and Methods

The materials used in the research are publicly available hydrological data and bulletins that are the resources of IMGW-PIB, information, and characteristics from entities involved in the operation of thermal power plants. The research used survey methods, methods of analysis, and interpretation of hydrological data and forecasts of the change in water resources in Poland. The research methodology assumed that the survey results would indicate which thermal power plant is the most sensitive to hydrological conditions and environmental constraints. As a result, a detailed hydrological analysis was carried out for the indicated power plant, including the correlation between the amount of flow and electricity production as well as the analysis of power losses. The characteristics of the main materials and methods used in the research are presented below.

2.1. Survey

As part of the analysis, a questionnaire survey addressed to energy companies was carried out at the IMGW-PIB, the main purpose of which was to analyze the issue of water abstraction for cooling purposes. The survey entitled “Current and future water needs” was addressed to several dozen power plants and combined heat and power plants. In the survey form, the following information was requested:
  • Acceptable water abstraction according to the water permit;
  • actual water consumption;
  • source or sources of water abstraction;
  • type of water abstraction;
  • amount of water collected and discharged into surface waters;
  • type, location, and amount of discharged sewage;
  • qualitative and quantitative assessment of surface waters;
  • water demand forecasts until 2030 and 2050.
The survey consisted of a total of 23 questions—5 open and 18 closed in which one or more answers could be selected. The questions referred to both the current state and the forecasts in the case of facility extension planning.

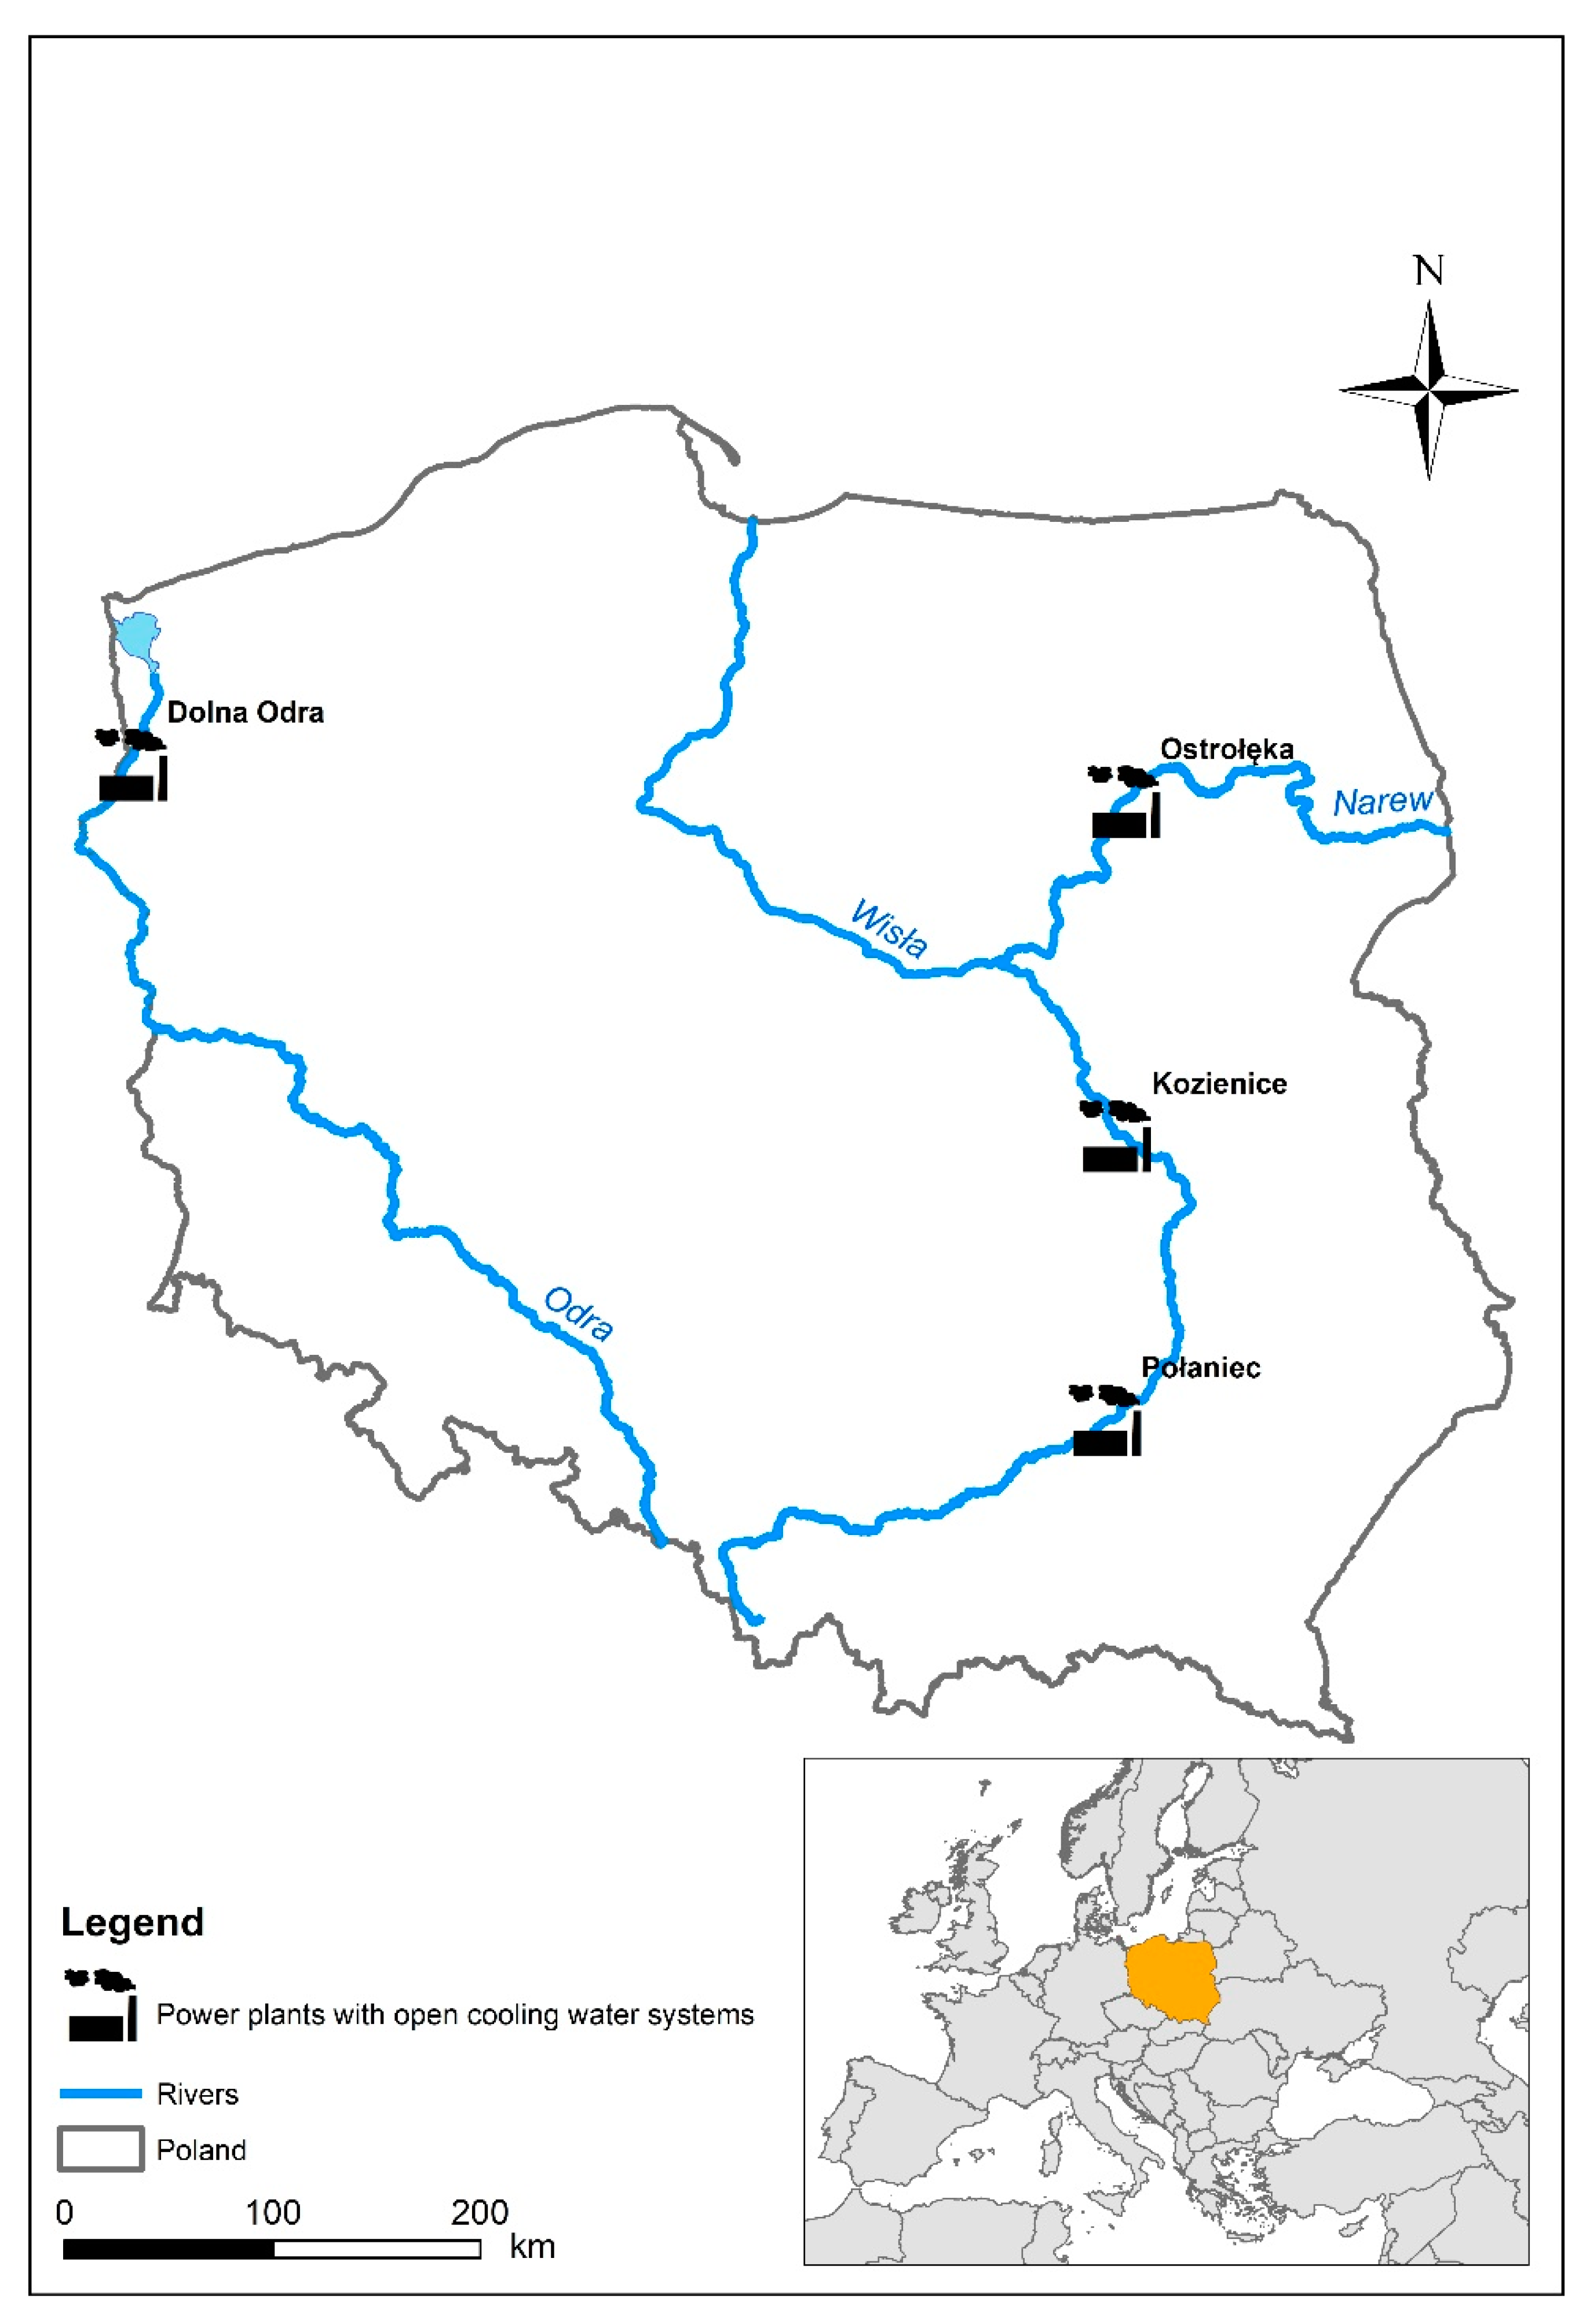
2.2. Characteristics of the Analyzed Power Plants with an Open Cooling Circuit

Power plants using an open cooling circuit require constant uptake of surface water and are also sensitive to the problem of low water levels in rivers. Poland currently has several such facilities (Table 1 and Figure 1). These are the old blocks of the power plant in Kozienice, as well as the Połaniec, Ostrołęka, and Dolna Odra power plants. There are no problems with low water levels in the Dolna Odra power plant, due to its location in the lower reaches of the Odra River. To date, no low levels have been recorded there. It is worth emphasizing, however, that in the case of two thermal power plants, i.e., Połaniec and Kozienice, their operators secured themselves in the event of low water levels by installing water damming weirs. Therefore, an analysis of the functioning water damming was performed.
In the case of Połaniec, it is a periodically activated weir in the form of a shell weir filled with water. The weir in Kozienice was temporarily built, but it is still being maintained just in case. Contrary to Połaniec, the weir has a solid stone structure that cannot be adjusted.
Excluding the Dolna Odra blocks, the total capacity of the units affected by the river level is approx. 3550 MW. For comparison, the total capacity of all conventional power plants in Poland as of 2020 is approximately 34,000 MW [15]. The problem of water shortages for cooling purposes may, therefore, concern slightly more than 10% of the power, but the case mentioned in the Introduction, which occurred in 2015, caused major problems.

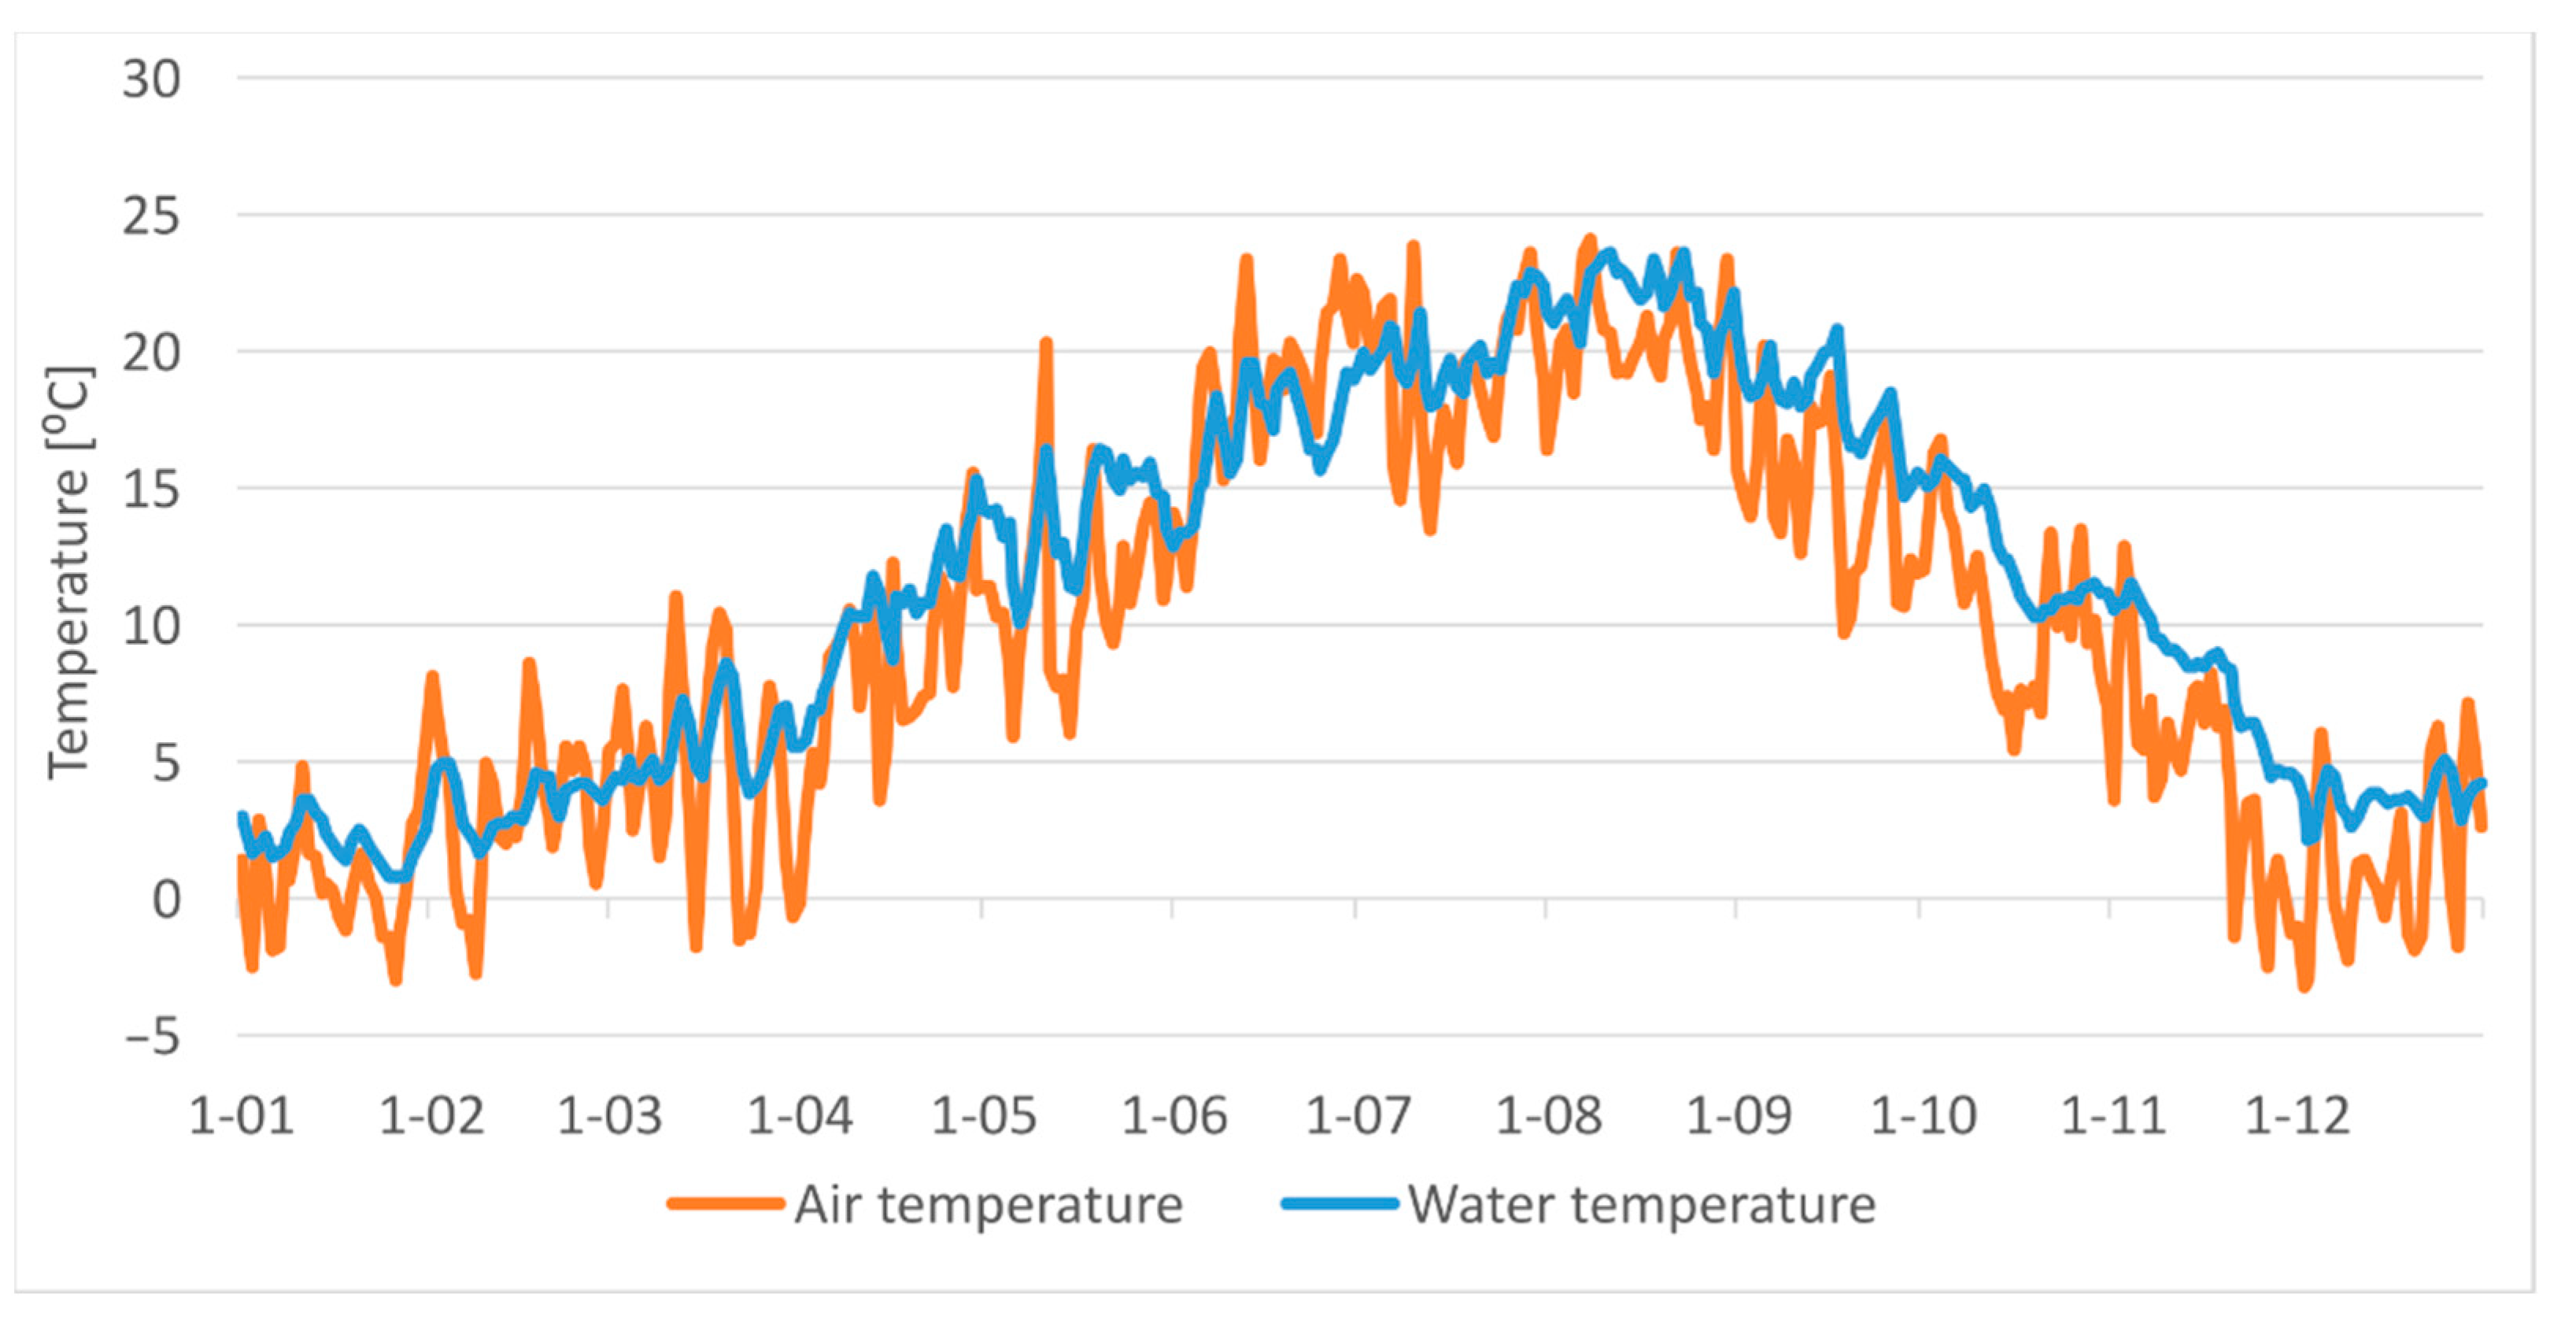
2.3. Hydrological Basics, Measurement Data, Methodology of Their Use

Hydrological analyses enable the assessment of water shortages for cooling purposes in thermal power plants. The conducted research used hydrological measurement data from selected posts of the State Hydrological and Meteorological Service (PSHM), whose tasks in Poland are performed by the IMGW-PIB [16]. The research took into account hydrological data from the years 2010–2020 documented in PSHM bulletins. In Poland, measurements and observations are currently carried out at 864 water gauge stations (at hydrological stations from row I to IV with limnological and hydrometric measurements). They are performed continuously, within the scope and frequency appropriate for a given type of station, defined by World Meteorological Organization [17] standards as well as internal procedures and instructions in force at IMGW-PIB. The characteristics of selected water gauges corresponding to the water intake location for the power plant are presented in Table 2. The table also shows the values of medium-low flows (SNQ) and the available calculation period adopted for them. The SNQ flow is one of the characteristic flows used in hydrological analyses in Poland. Characteristic flows are, in other words, extreme and average values of flow rates observed in the period under consideration at a given water gauge station. In addition to the SNQ, such characteristics include, among others, the WWQ value (the highest value in a multi-year period), SWQ (medium maximum value), NNQ (absolutely the lowest flow), and the SSQ value (medium value in a multi-year period). The SNQ value is necessary information, among others, in the cases of planning and rational management of water resources, including calculating available flows or determining low flows (low flow boundary flow). It is also one of the most significant hydrological characteristics used in Poland in the preparation of hydrological documentation, constituting the basis for planning and designing in the field of water engineering, prevention of the effects of drought, and the management of inland surface water resources, including the issuing of administrative decisions. The knowledge of the SNQ flow value is necessary information, among others, in the case of determining environmental flows, including the inviolable flow. In general, the inviolable flow in a given cross-section of the watercourse and for a given period of the year is defined in Poland as a contractual flow, appropriate for the assumed ecological state of the watercourse, the volume, and quality of which, due to the maintenance of this state, cannot be reduced by human activity, except for periods of extraordinary hazards. This flow occurs in Anglo-Saxon literature under various names (instream flow, instream flow need, instream benefits, environmental water, minimum flow standard, biological minimum flow, minimum flow, instream flow values that sustain ecosystem integrity), which means that differences in the terminology are not only a Polish issue (in German-language sources the term das Mindestwasser appears [18]). The basic legal act in force in the EU, the Water Framework Directive (WFD) [19], does not explicitly include the concept of an inviolable flow. However, for the main purpose of the Directive, which is to achieve good ecological status (potential) of water bodies, and from the description of this state, there is a need to maintain the flow rate in the watercourse, securing this state. The inviolable flow must be distinguished from the environmental flow. Environmental flow in a river is a flow that considers the needs of aquatic and water-dependent ecosystems, estuaries, and the needs related to maintaining the quality and comfort of human life, which depends on these ecosystems [20]. The basic problem related to the use of inviolable flow in water resource management is the determination of its volume in a given cross-section of the watercourse, and then the enforcement of the obligation to maintain an inviolable flow in the watercourse. In addition, the possibility of water intake for cooling purposes in thermal power engineering is directly dependent on the necessity to maintain an intact flow in the watercourse. In Poland, the method developed by Kostrzewa [21] is widely used to determine the inviolable flow due to its ease of use.
According to this method, the determination of the inviolable flow (Qn) can be performed based on a hydrobiological criterion using the SNQ value. The hydrobiological criterion is a medium-low flow function:
Qn = Qbiol = k · SNQ,
where: k—the coefficient is an increasing function of the river type (the highest in mountain rivers) and a decreasing function of the catchment area within a given river type; according to the table accompanying the method, the value of the k coefficient ranges from 0.5 to 1.5.
The assumption for the hydrobiological criterion is as follows: Qbiol ≥ NNQ. When the calculated Qbiol value is less than the NNQ value, Qbiol = NNQ is assumed. Taking into account the functioning of the open cooling cycle and the impact on the cooling efficiency, the analyzed power plants are typical facilities requiring a continuous supply of water from the river. The analyses were related to the calculated values of the river SNQ flows. The SNQ flow values in the water gauge sections above the water abstraction points were analyzed for selected power plants. As was mentioned before, it was assumed that the survey results will indicate for which power plant additional detailed analyses should be carried out based on the determined inviolable flow in the cross-section of water intake, assuming that the hydrobiological criterion is taken into account in the Kostrzewa method.

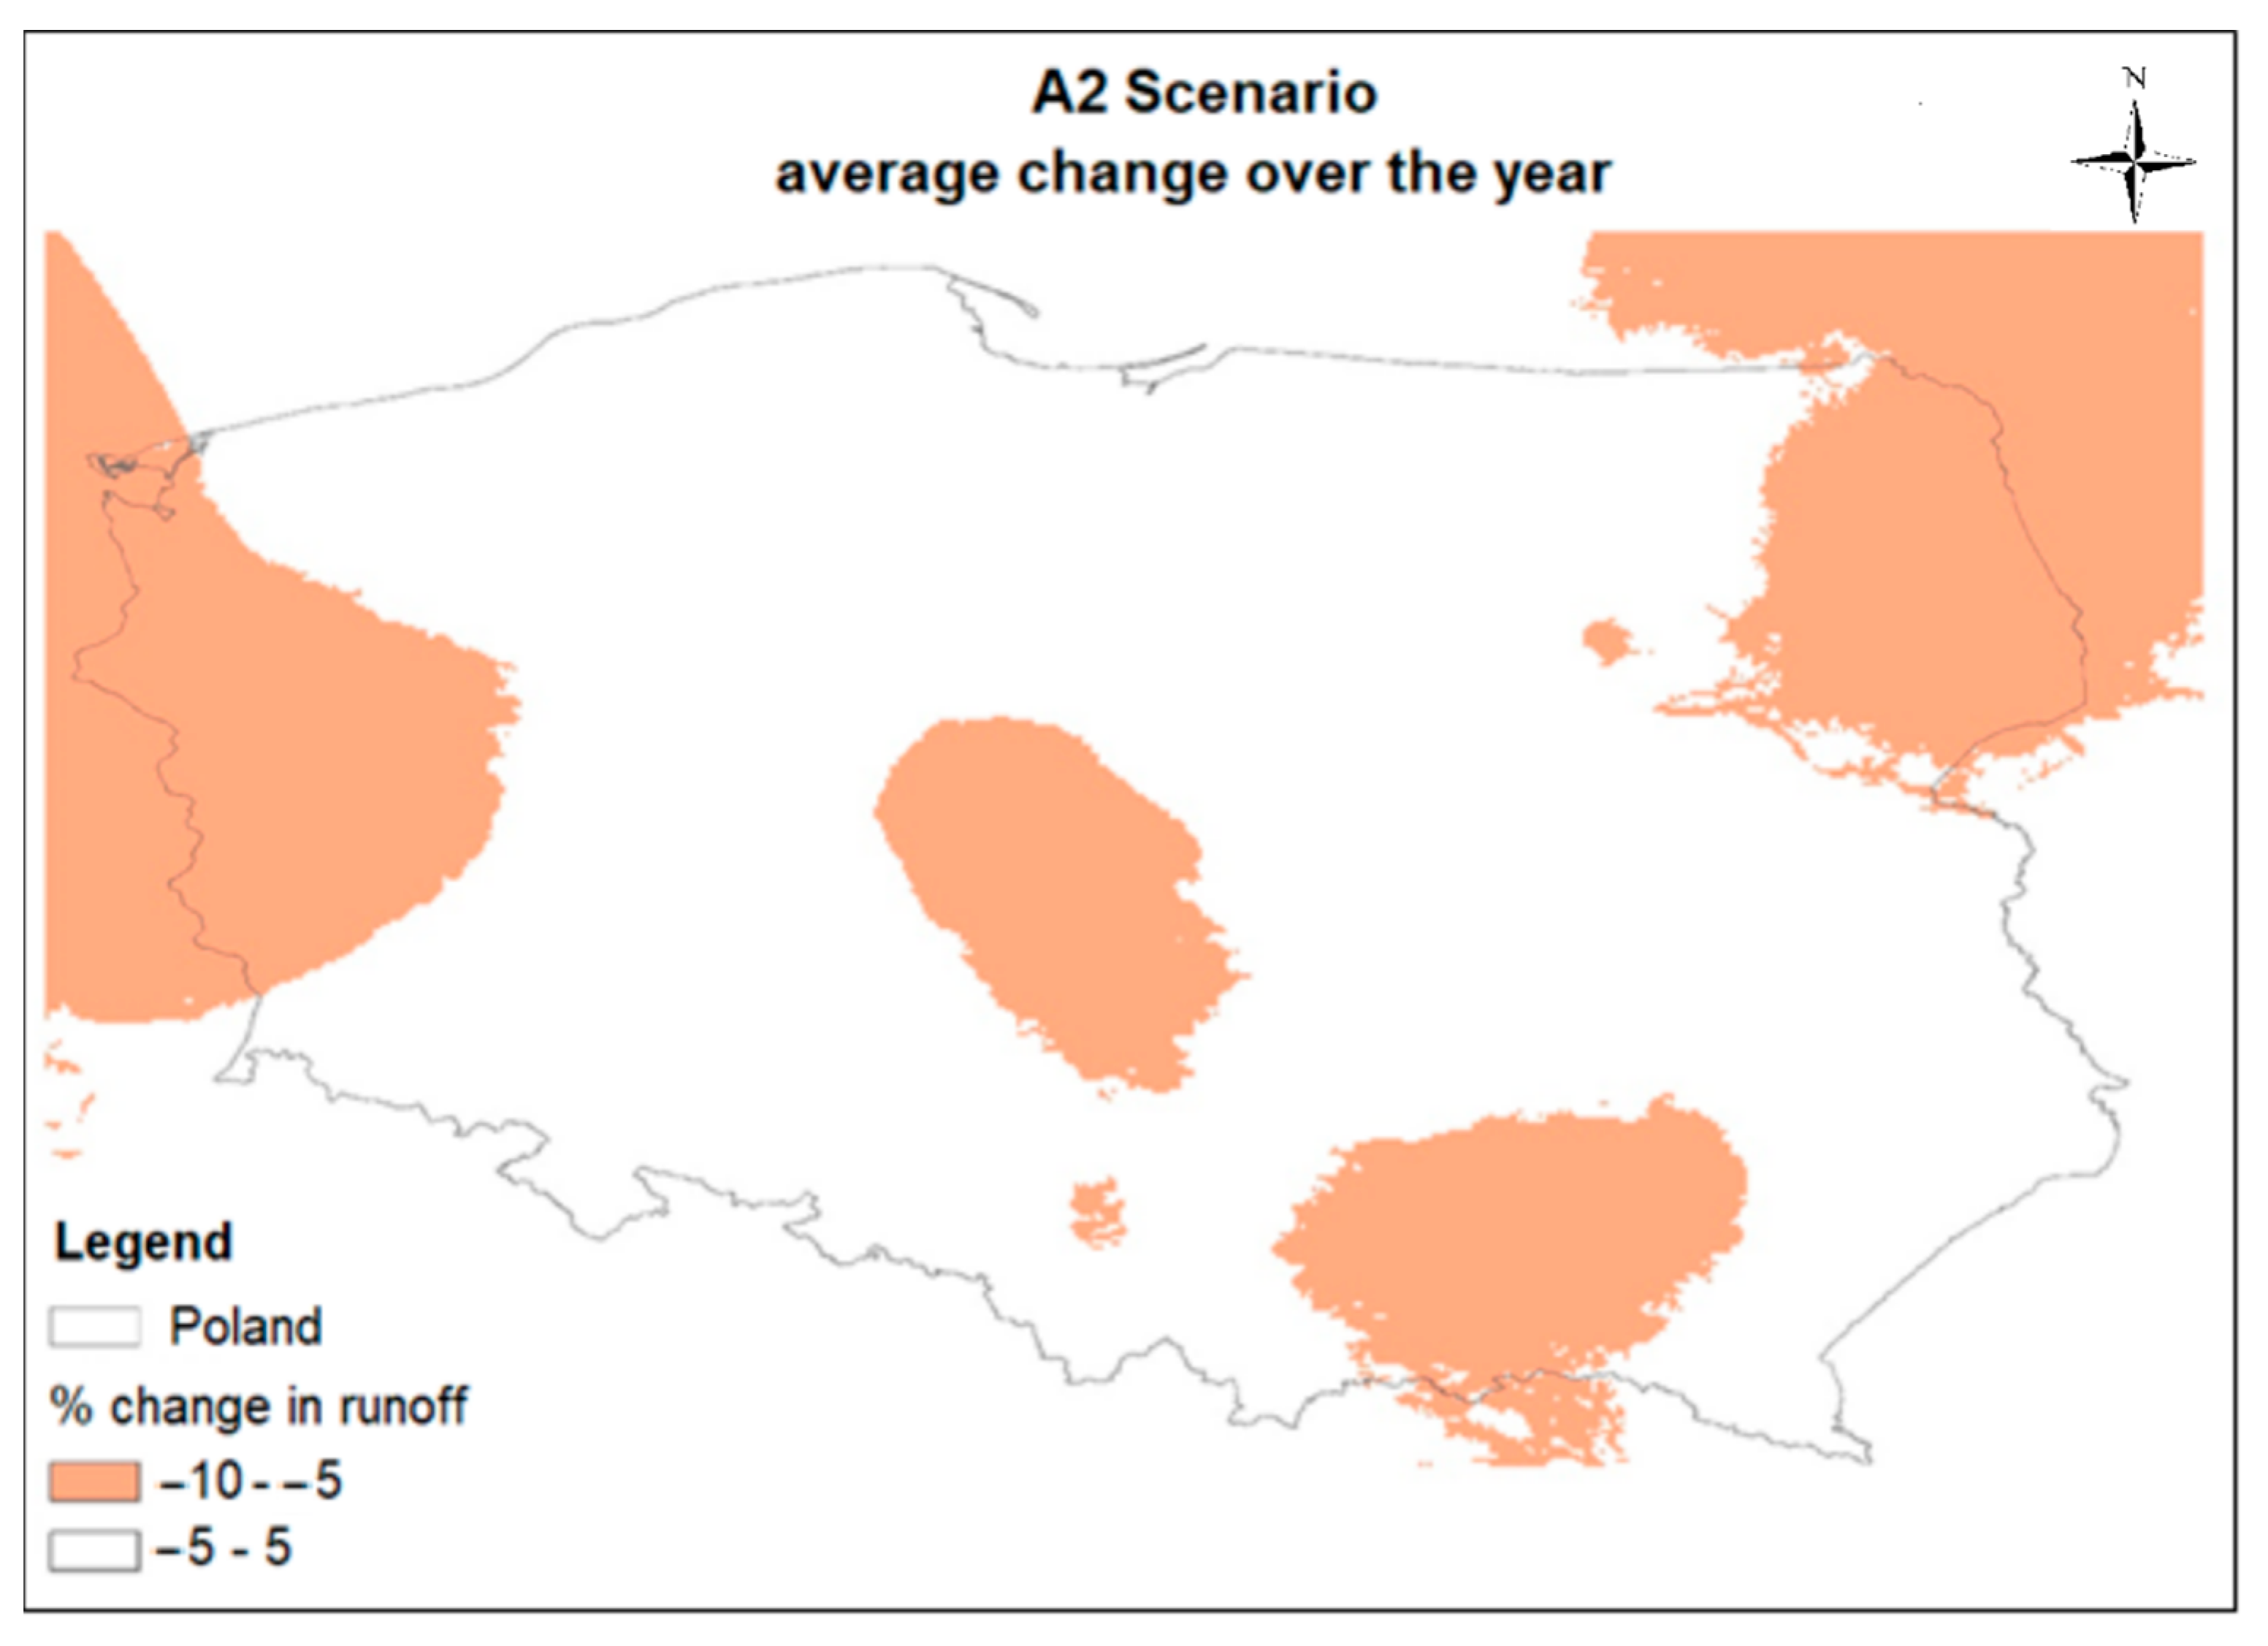
2.4. Climate Change and Its Impact on Hydrological Conditions until 2030

Assuming an optimistic transition in the near term in all power plants to a cooling solution based on a closed circuit, the analyses of the impact of climate change were based on the results of studies carried out as part of the KLIMAT project carried out at the IMGW-PIB [22]. It considers the water management scenario A2 that is most unfavorable from the point of view of environmental impact and climate change and, consequently, hydrological conditions. The A2 scenario assumed a slow economic development related to the slow implementation of new technologies and the lack of progress in the field of alternative energy sources, as well as a low level of environmental awareness and orientation towards a consumer lifestyle. Identifying future changes in surface water resources was an essential part of the work of the KLIMAT project. The basis was the use of the results of climate modeling in the time horizon of 2030 carried out in the project for the adopted reference twenty-year period of 1979–1990. The project selected results based on data from the ECHAM-5 global model. Future percent change in resources was determined using GIS transformations and analyses. The calculations were made based on the grid with the outflow coefficients for the reference period developed for Poland. As a result, a set of results in the form of grids was obtained, representing the percentage changes for the average annual unit outflow for the A2 scenario in the 2030 perspective.

3. Results

3.1. Survey Results

The survey was addressed to 25 selected power plants and combined heat and power plants. Finally, 14 responses were received from 14 respondents, including the power plants Połaniec and Dolna Odra, which use an open cooling cycle. The analysis of the survey results for the two power plants is presented below.
The above-mentioned power plants use surface water for cooling purposes. It is taken continuously from their intakes located on the following rivers, respectively: Wisła and Wschodnia (Połaniec power plant) and Odra Wschodnia (Dolna Odra power plant). For all of these power plants, surface water accounts for almost 100% of the total abstracted water volume. Dolna Odra and Połaniec power plants can collect up to 200,000 m3 h−1 of water according to water permits. It should be noted that this is the maximum value of possible consumption. However, in the case of the Połaniec power plant, there have been incidents in the past where the surface water resources were insufficient to meet the water needs. Such a situation happened cyclically, both in the summer and winter periods. It was caused by low water levels, high water temperature limiting the cooling efficiency, and freezing of water in the river. For the Dolna Odra power plant, the water intake temperature is too high repeatedly. The surface water resources used by the Dolna Odra power plant are sufficient to meet the current and future water demand. Połaniec power plant, on the other hand, emphasizes that in the event of long-term drought, there are limitations in water consumption and the associated limitations in energy production. The Dolna Odra power plant forecasts an increase in demand by 38% by 2030 and the maintenance of this level until 2050. Połaniec power plant does not expect any changes in the next several dozen years.
In line with the adopted assumption, the results of the survey indicated that the Połaniec power plant should be selected for further detailed analyses based on the determined inviolable flow.

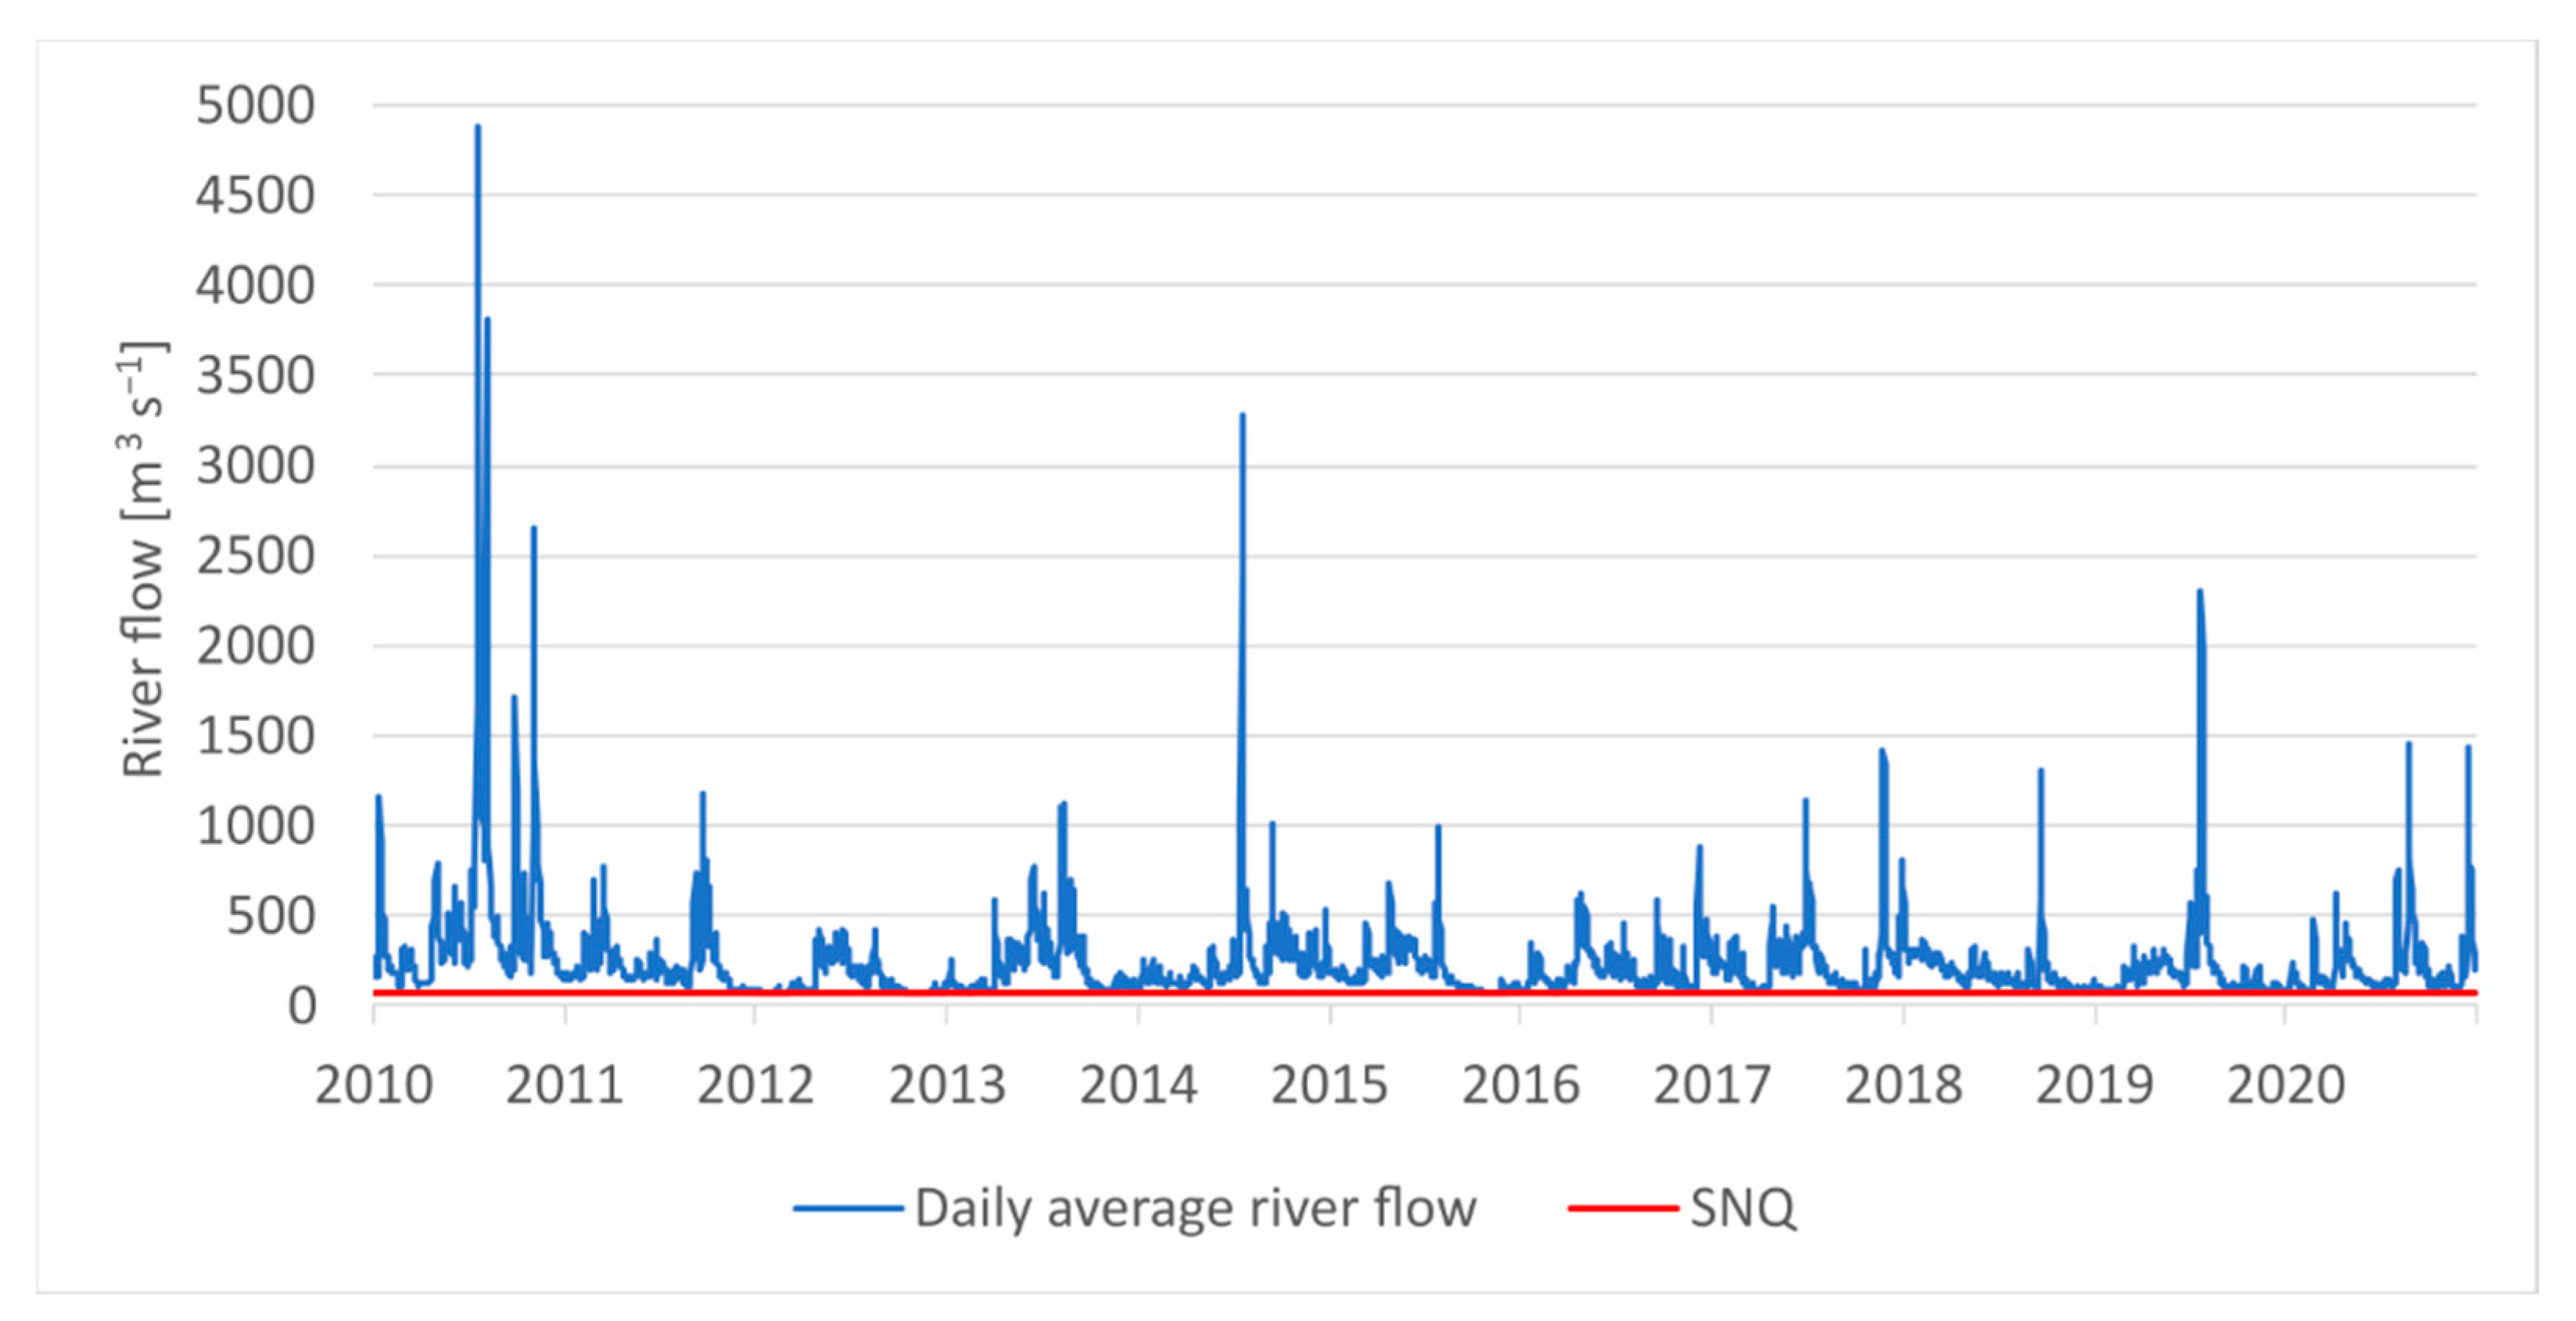
3.2. Hydrological Analyses

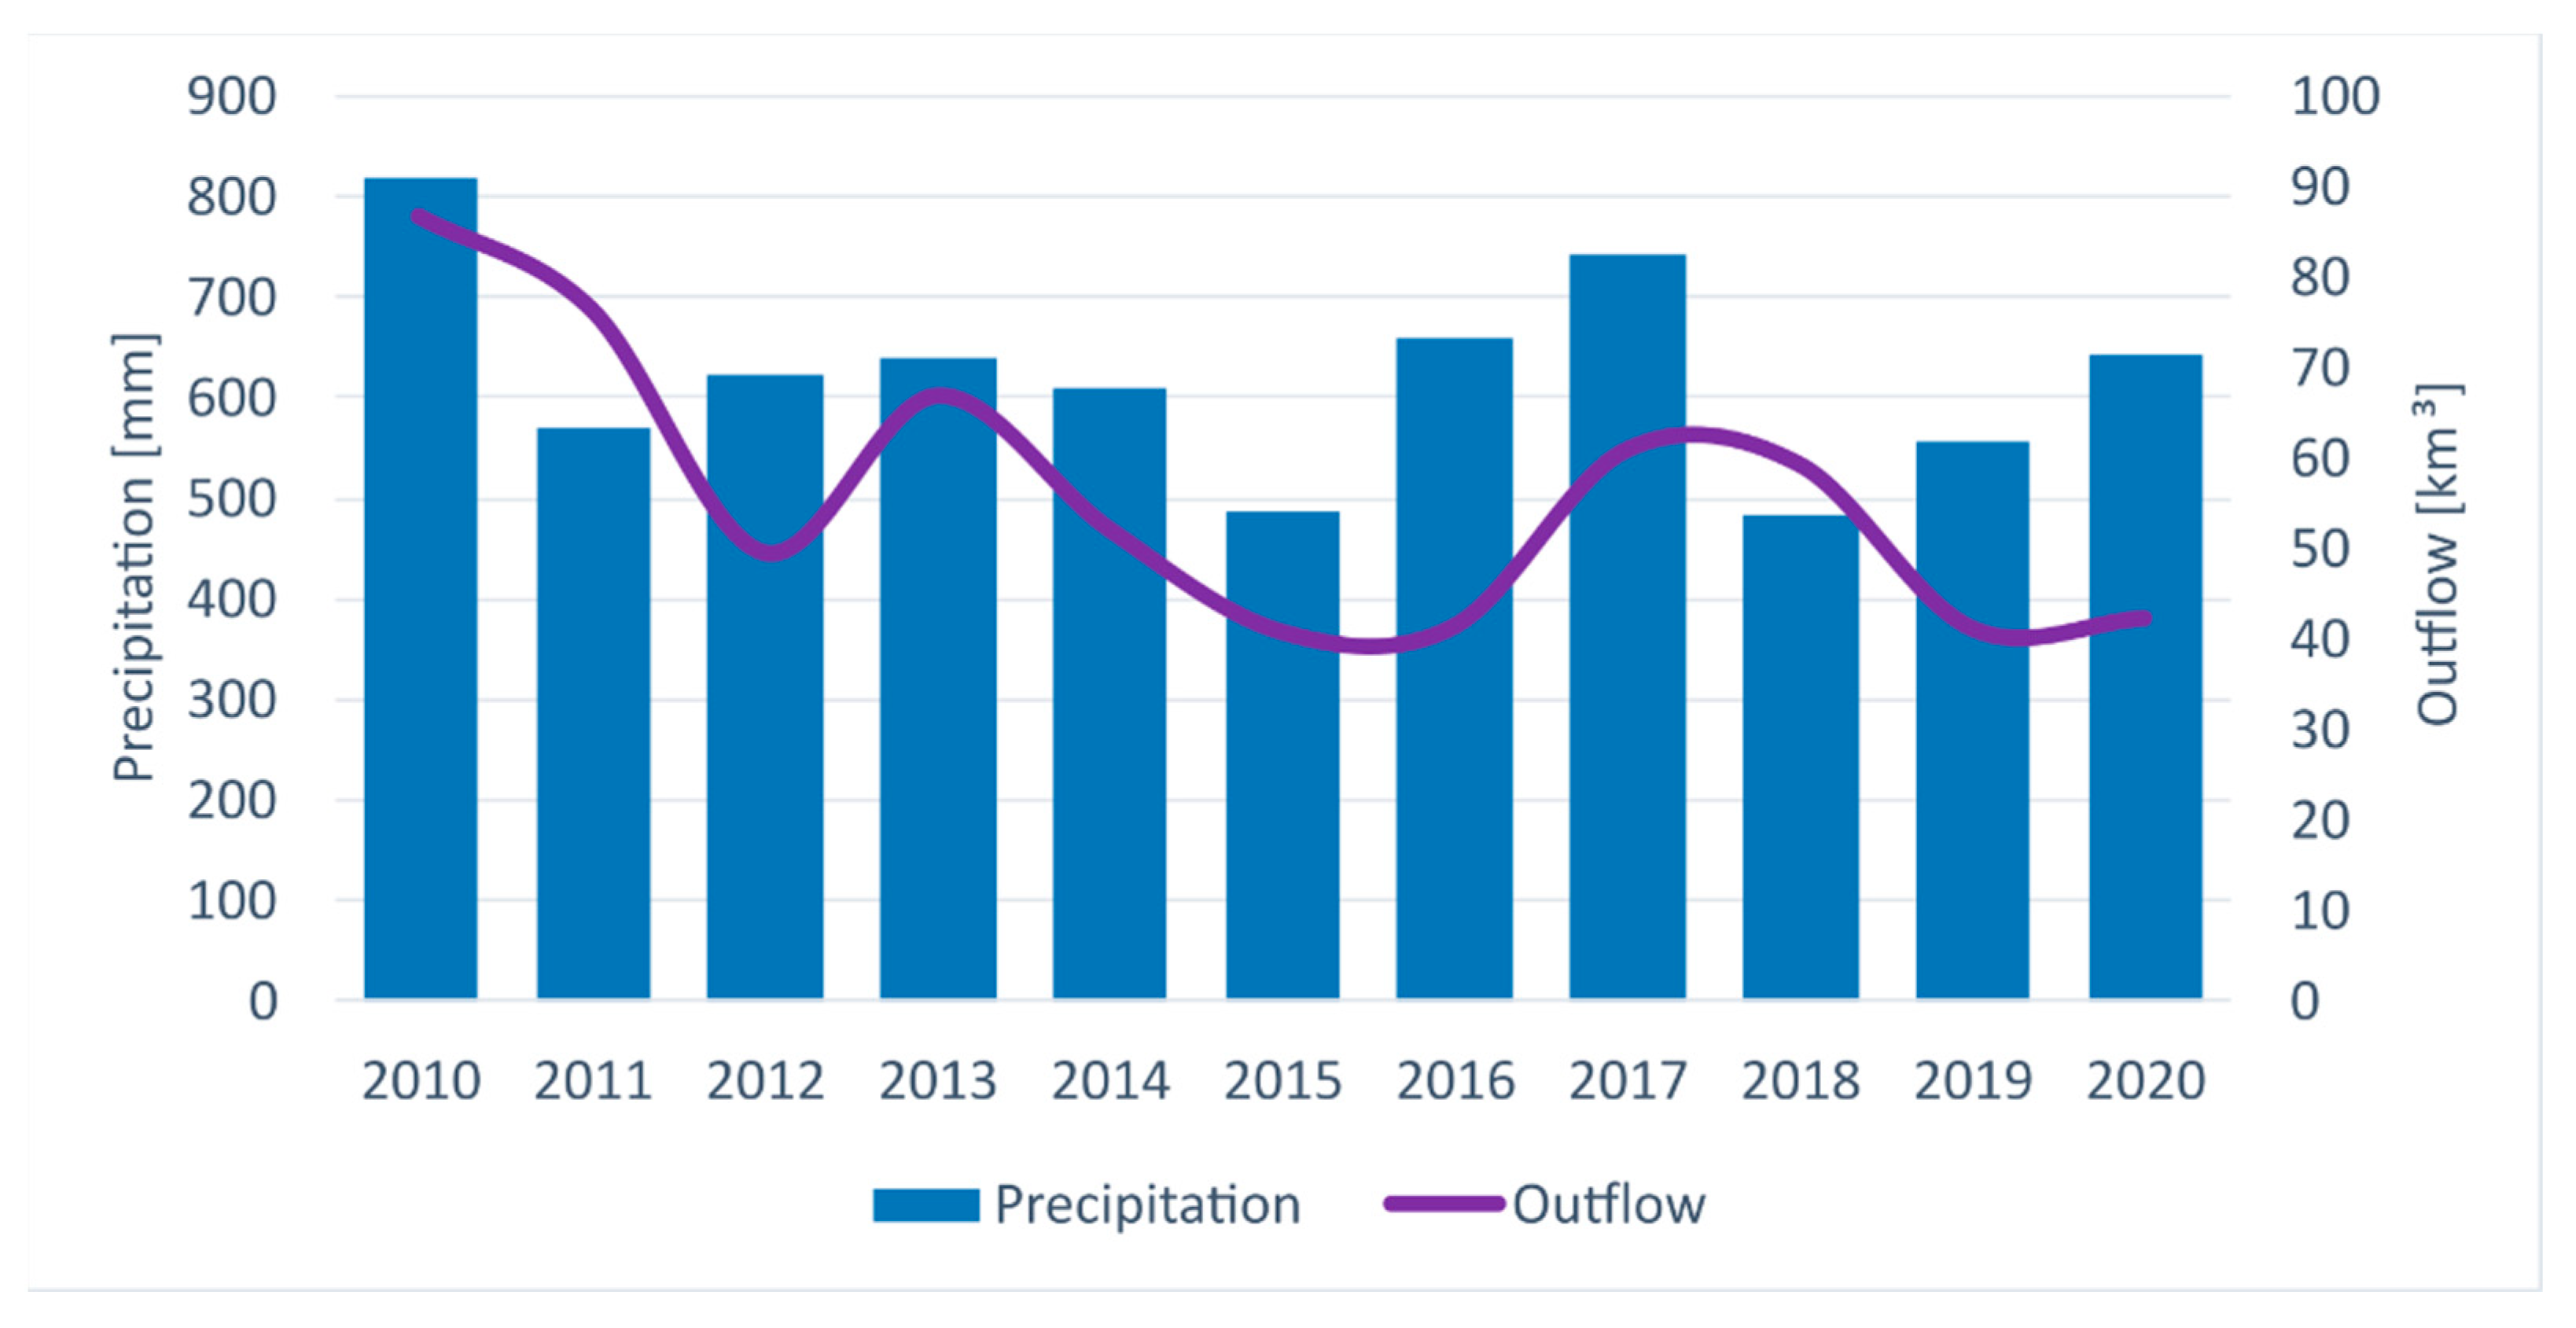
3.2.1. General Characteristics

A characteristic feature of Poland’s water resources is their randomness, which is related to the uncertainty of the precise determination of the size of these resources as well as the time and place of their occurrence. The total rainfall in Poland in the average year is slightly above 600 mm and ranges from 550 mm in the lowland belt to about 1100 mm in mountain and foothill regions. The most deficit area in terms of rainfall supply is central Poland. Apart from spatial variability, there is also a temporal variability of resources. In dry years, large areas with a significant water shortage may arise. The precipitation and outflow from Poland in the analyzed multi-year period 2010–2020 are shown in Figure 2. The analyses presented below refer to hydrological years, not calendar years. A hydrological year is a unit of time used in hydrology for the balancing of water resources. Like a calendar year, it lasts 12 months but begins on 1 November of the previous calendar year and ends on 31 October. This solution enables the balancing of precipitation in the form of snow and ice, alimented during the winter period and released during spring thaws within one natural and closed cycle.
The outflow does not include the transboundary catchments and rivers of the catchment areas directly flowing into the Baltic Sea and concerns only the Odra and Wisła river basins.
The analysis of the hydrological multi-year period 2010–2020 showed the division of the studied period in terms of water abundance. This division is visible in the example of the average monthly flow of the Wisła River in the estuary profiles of the Wisła River and Odra River when drops below the SNQ value occurred only in the years 2015–2020. It is also worth noting that the average monthly flow below the SNQ value was recorded in the Odra River over four times more often, and periods of such low flows lasted up to six months.
In the discussed multi-year period, the four times average monthly flow of the Wisła River, measured in the closing profile in Tczew, was lower than the average value of the lowest annual flows in the multi-year period 1951–2015 (SNQ—419 m3 s−1). Such low flows were recorded in the second half of the decade, in August and September 2015, and 2019 (Table 3).
A much more unfavorable hydrological situation occurred in the Odra basin, wherein in the years 2010–2020 the average monthly flow measured in the estuary profile was lower than the SNQ in the multi-year period 1951–2015 (246 m3 s−1) by as much as 23 times. The average monthly flows below the SNQ took place in the second half of the selected period, in the hydrological years 2015 (June–October), 2016 (October, June, July, September), 2018 (June–October), and 2019 (November, July–October). It is worth pointing out that there were two six-month periods in which the average flows were lower than the SNQ value (Table 4).
In the hydrological years 2010–2020, the total outflow values of Poland’s rivers only twice allowed us to classify a given year as wet, in 2010 and 2011. The given year was classified as dry much more often in this period. This was the case in 2012, 2015, 2016, 2019, and 2020.

3.2.2. Analyses of Cross-Sections of Water Intake Location for Power Plants in the Multi-Year Period 2010–2020

Below are presented the daily values of flows recorded in the analyzed multi-year period 2010–2020 in the water gauge stations corresponding to the abstraction of water.

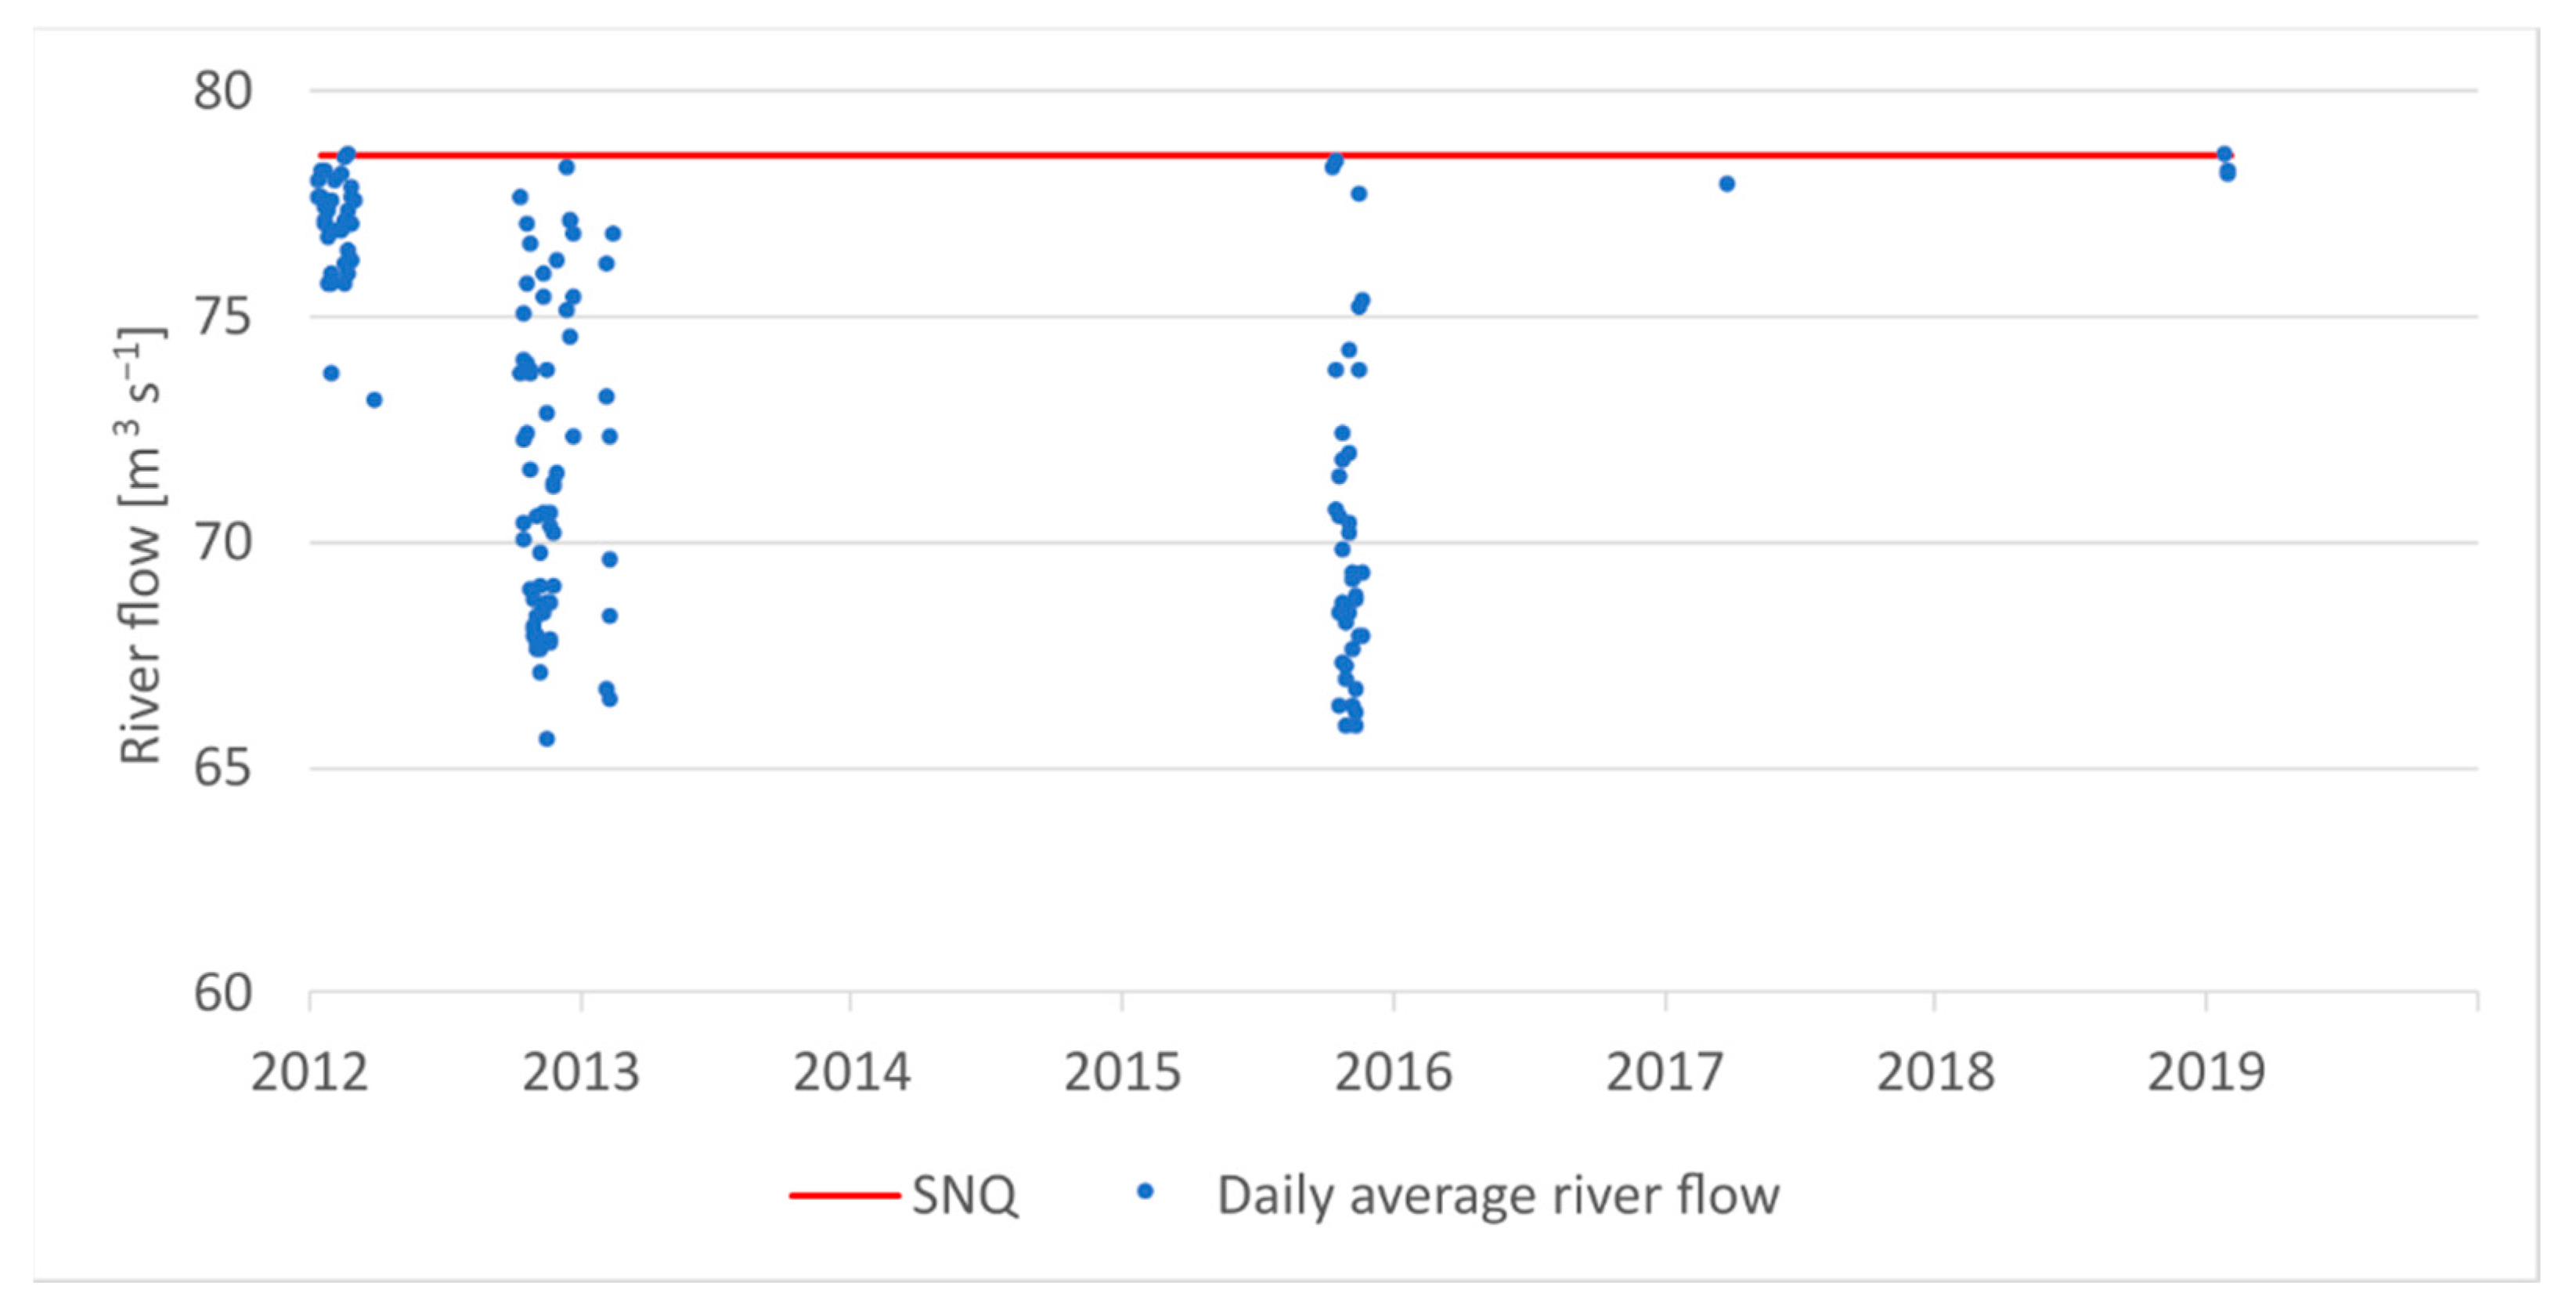
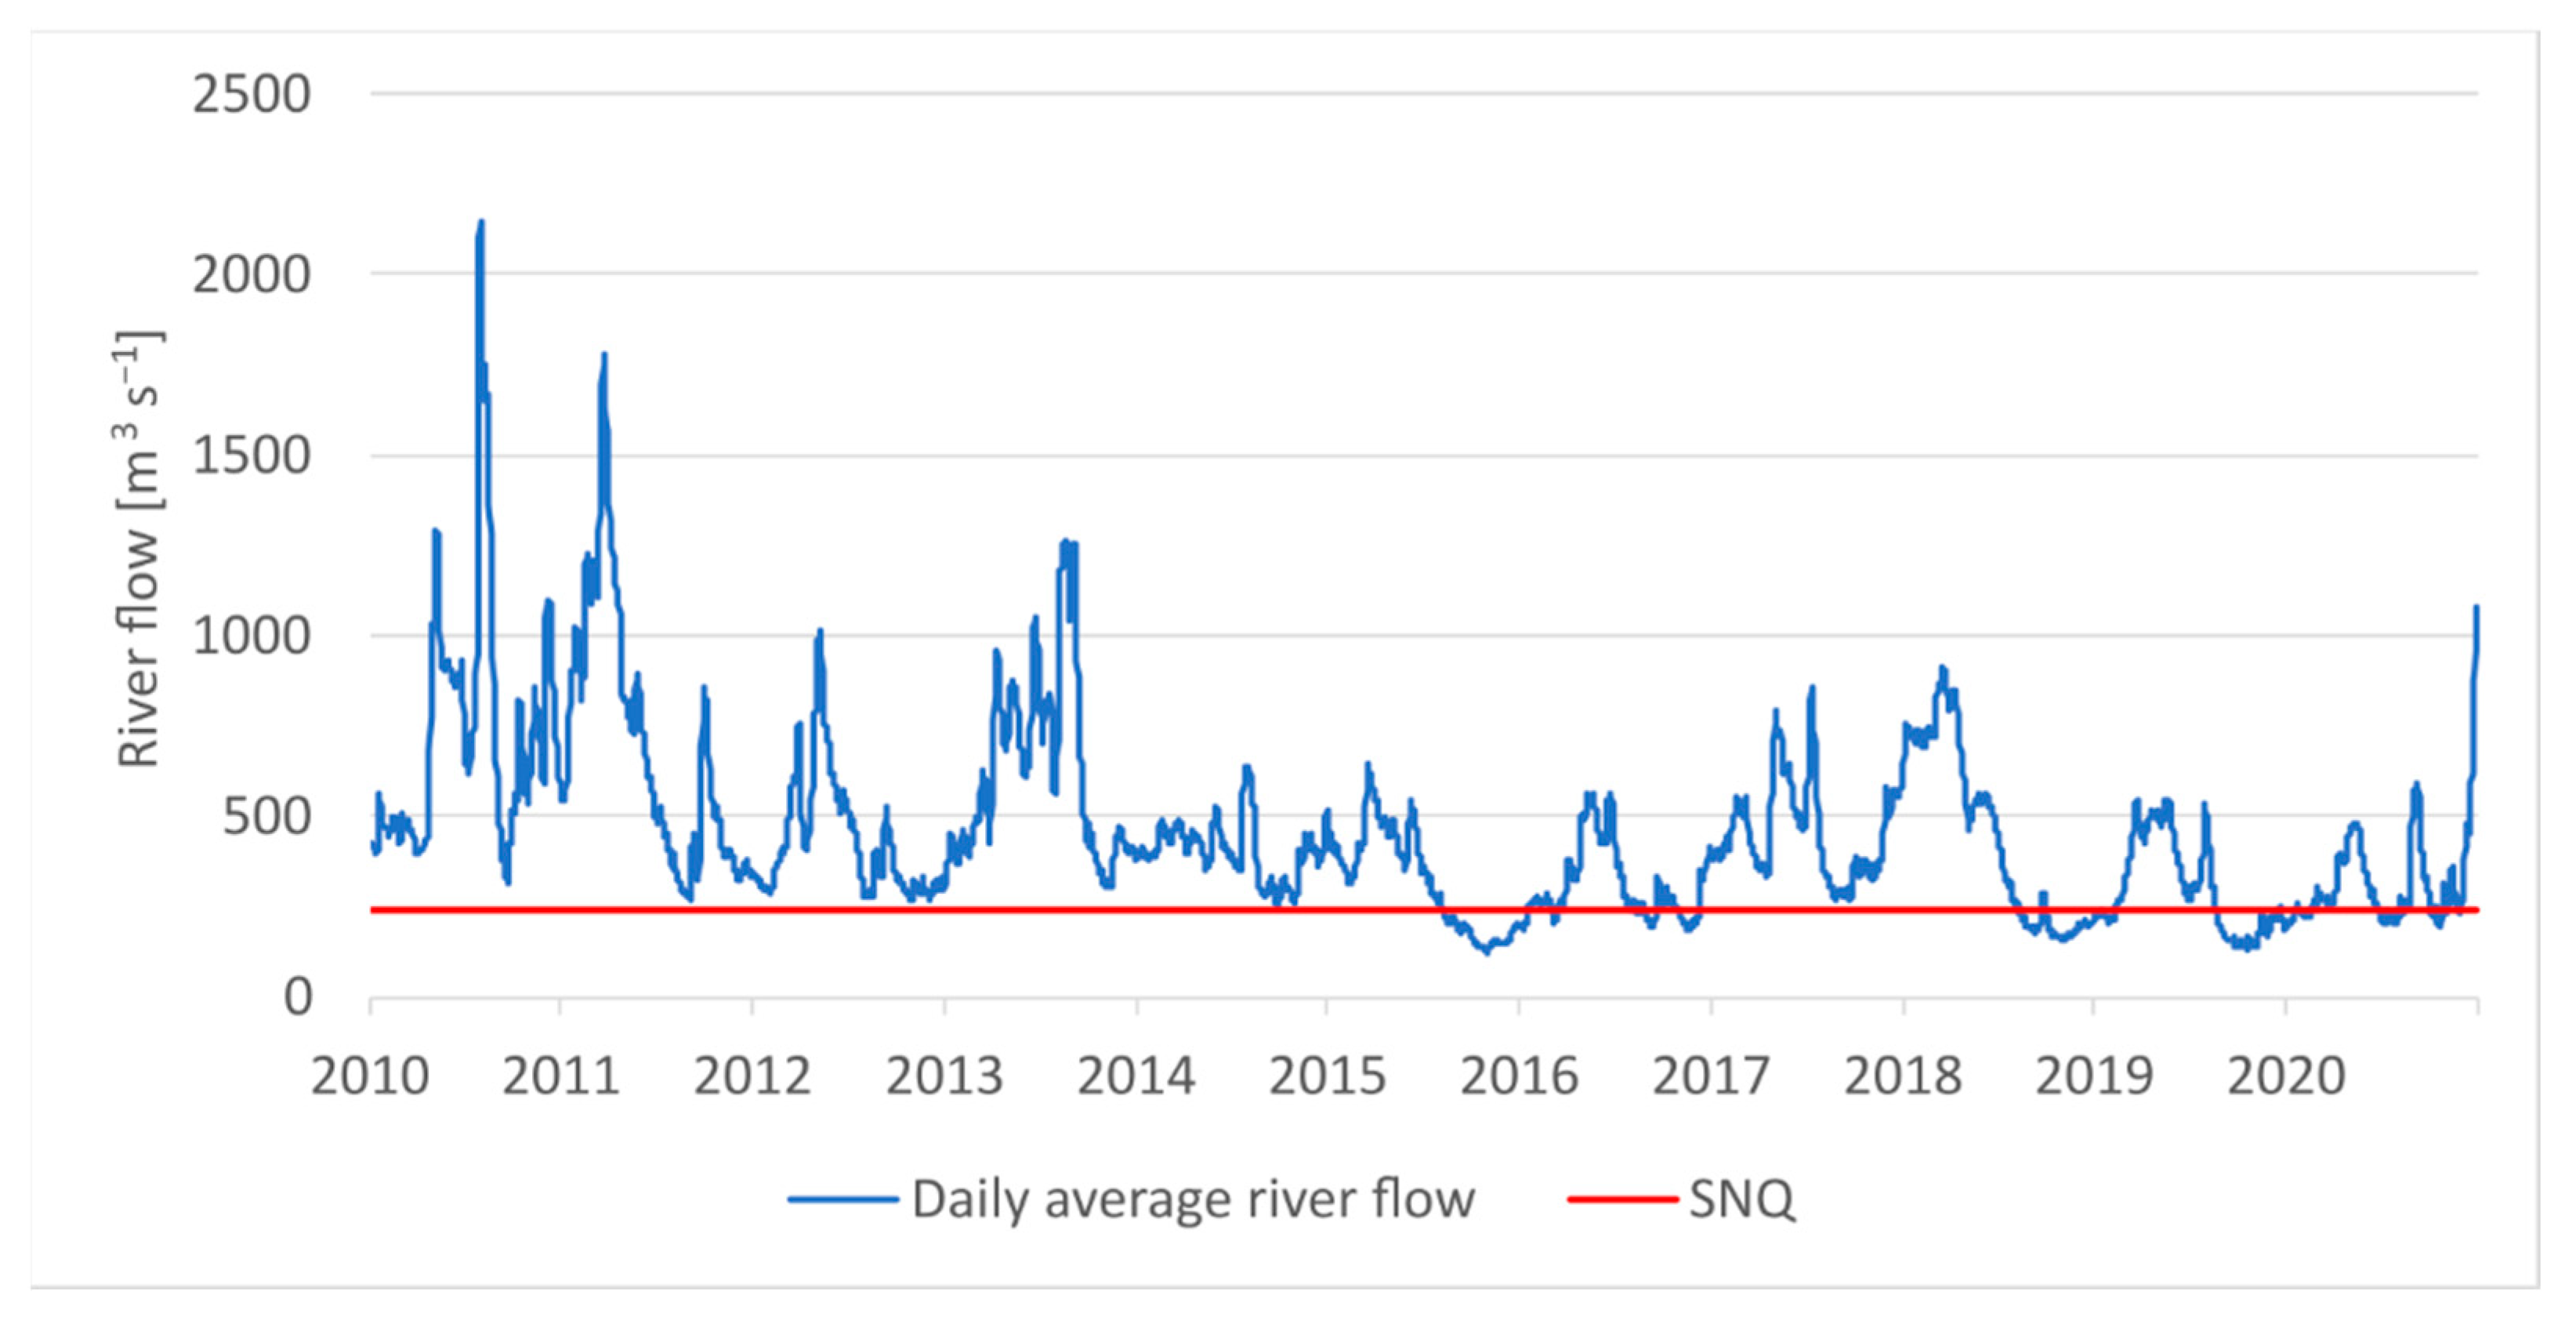
Połaniec Power Plant—Szczucin Water Gauge Station
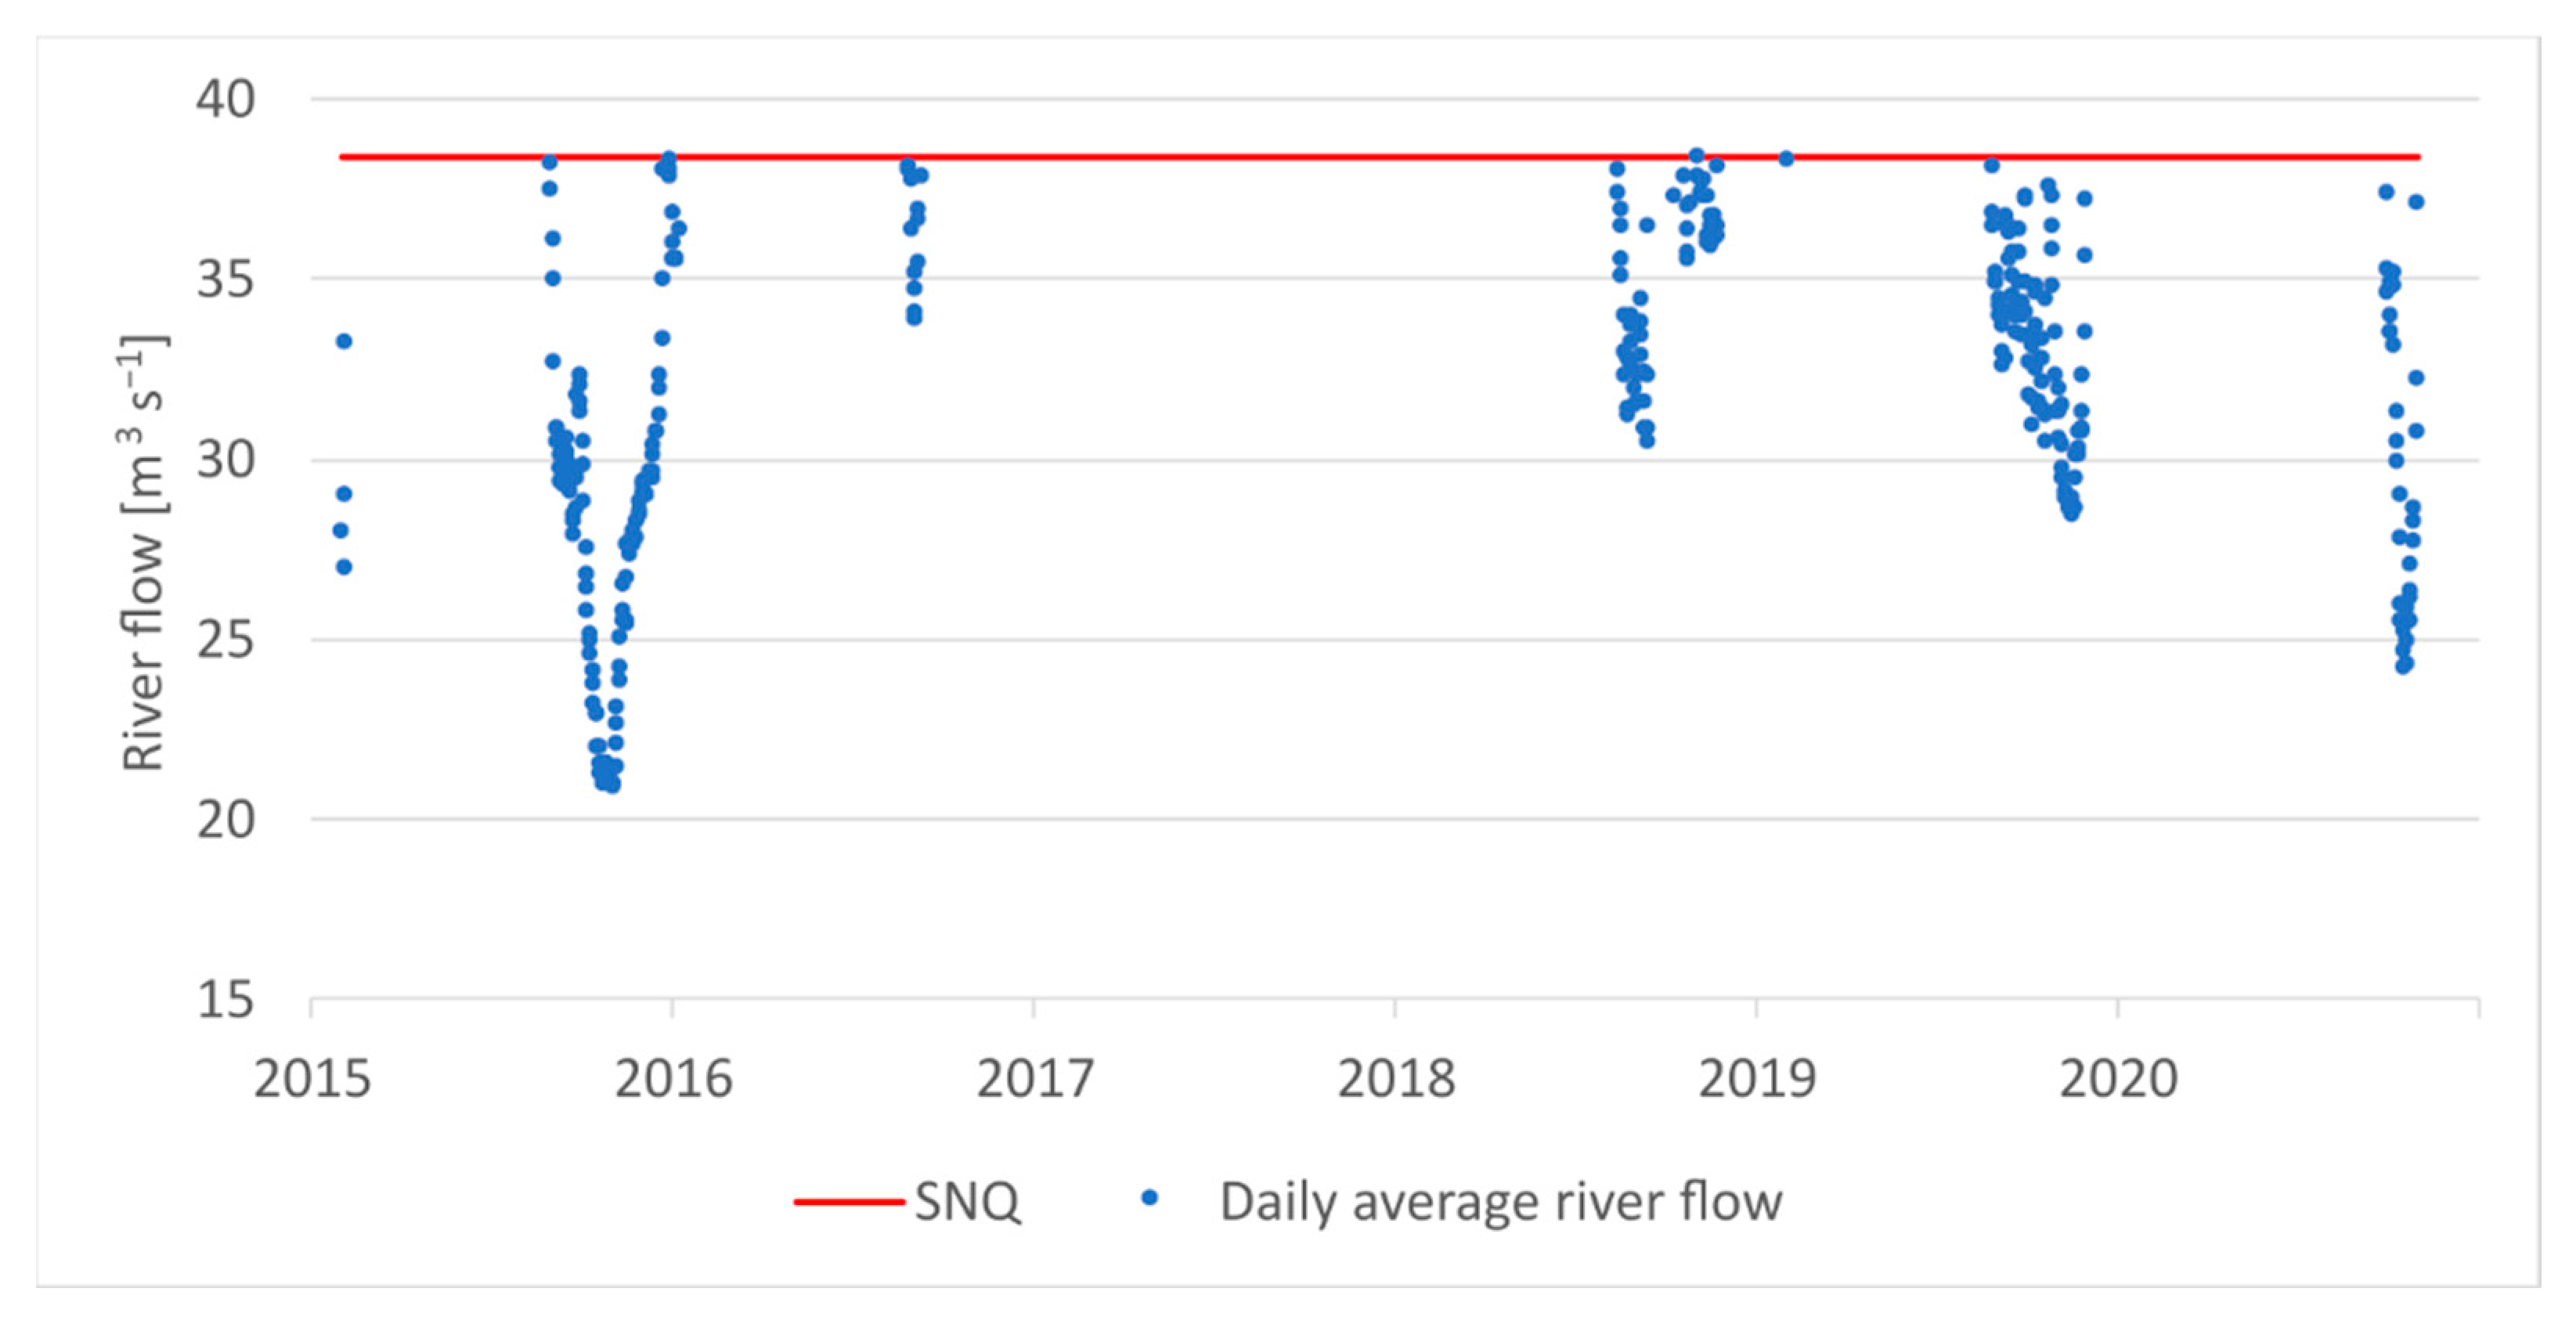
On the Wisła River, at the Szczucin water gauge station, the number of days with the flow below or equal to the SNQ value (78.6 m3 s−1) in the analyzed multi-year period is 143 (Figure 3).
In individual years, the number of days with flow values lower than or equal to the SNQ is as follows (Figure 4):
  • 2012: 93 days;
  • 2013: 8 days;
  • 2015: 38 days;
  • 2017: 1 day;
  • 2019: 3 days.

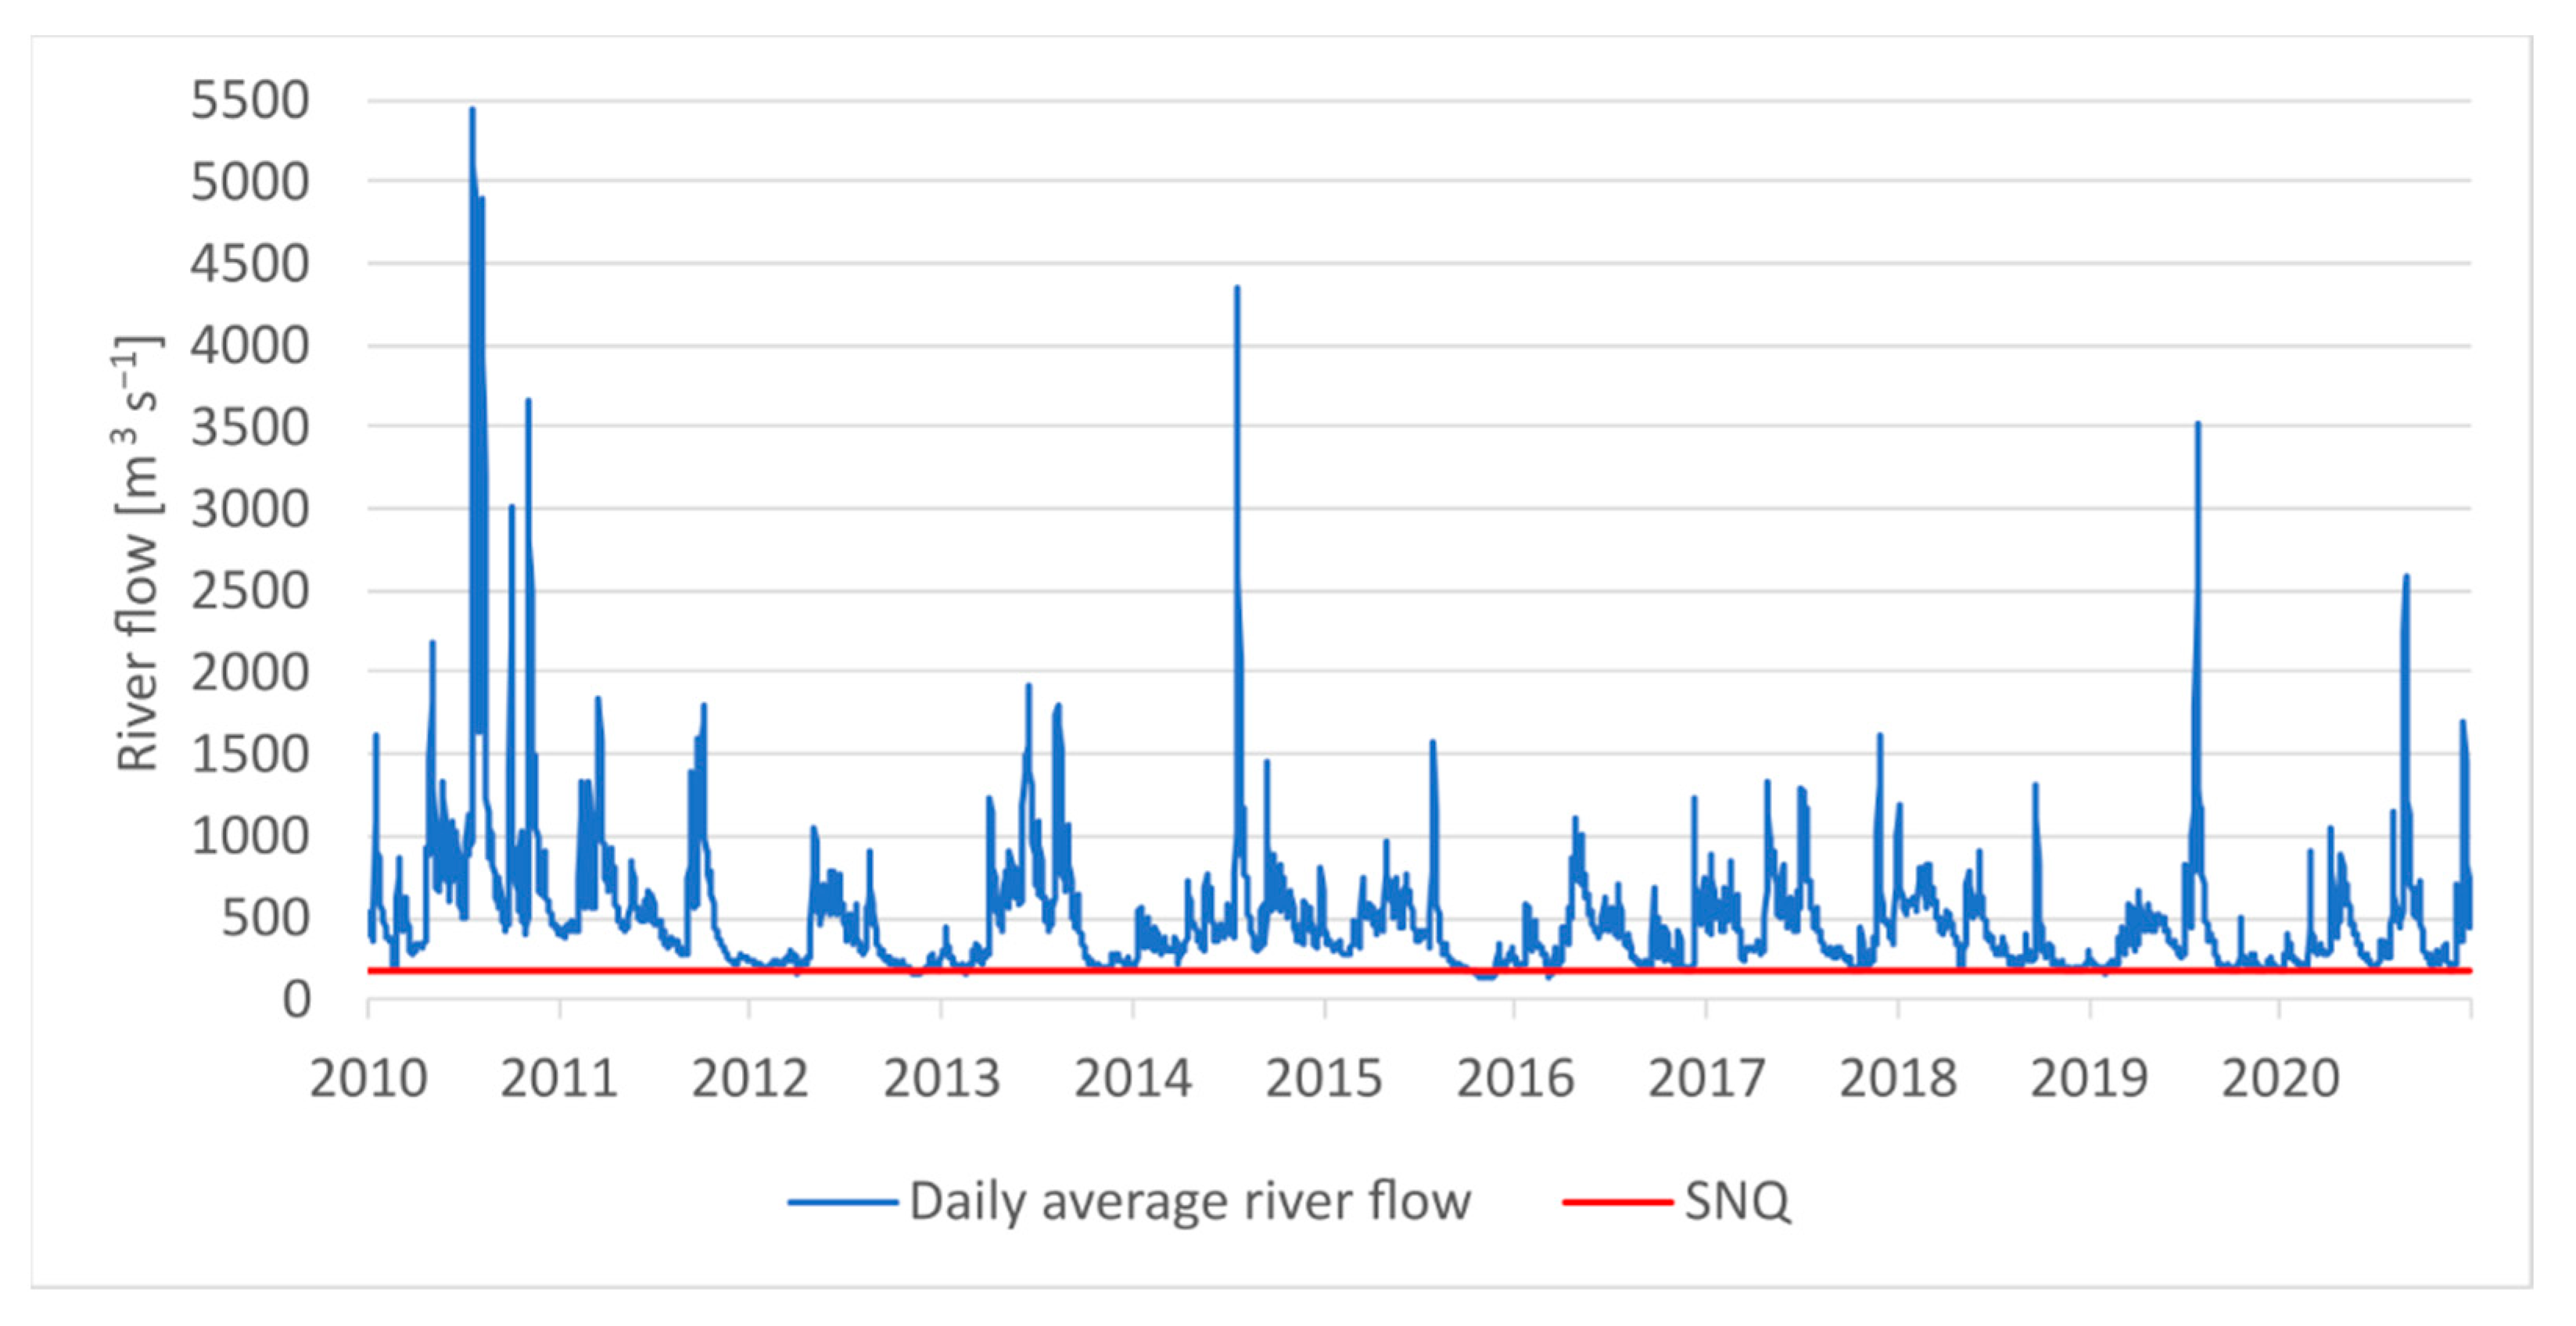
Dolna Odra Power Plant—Gozdowice Water Gauge Station

On the Odra River, at the location of the Gozdowice water gauge station, in the analyzed multi-year period, the number of days with the flow below or equal to the SNQ value (242 m3 s−1) is 676 (Figure 5).
In individual years, the number of days with flow values lower than or equal to the SNQ is as follows (Figure 6):
  • 2015: 144 days;
  • 2016: 106 days;
  • 2018: 138 days;
  • 2019: 172 days;
  • 2020: 116 days.

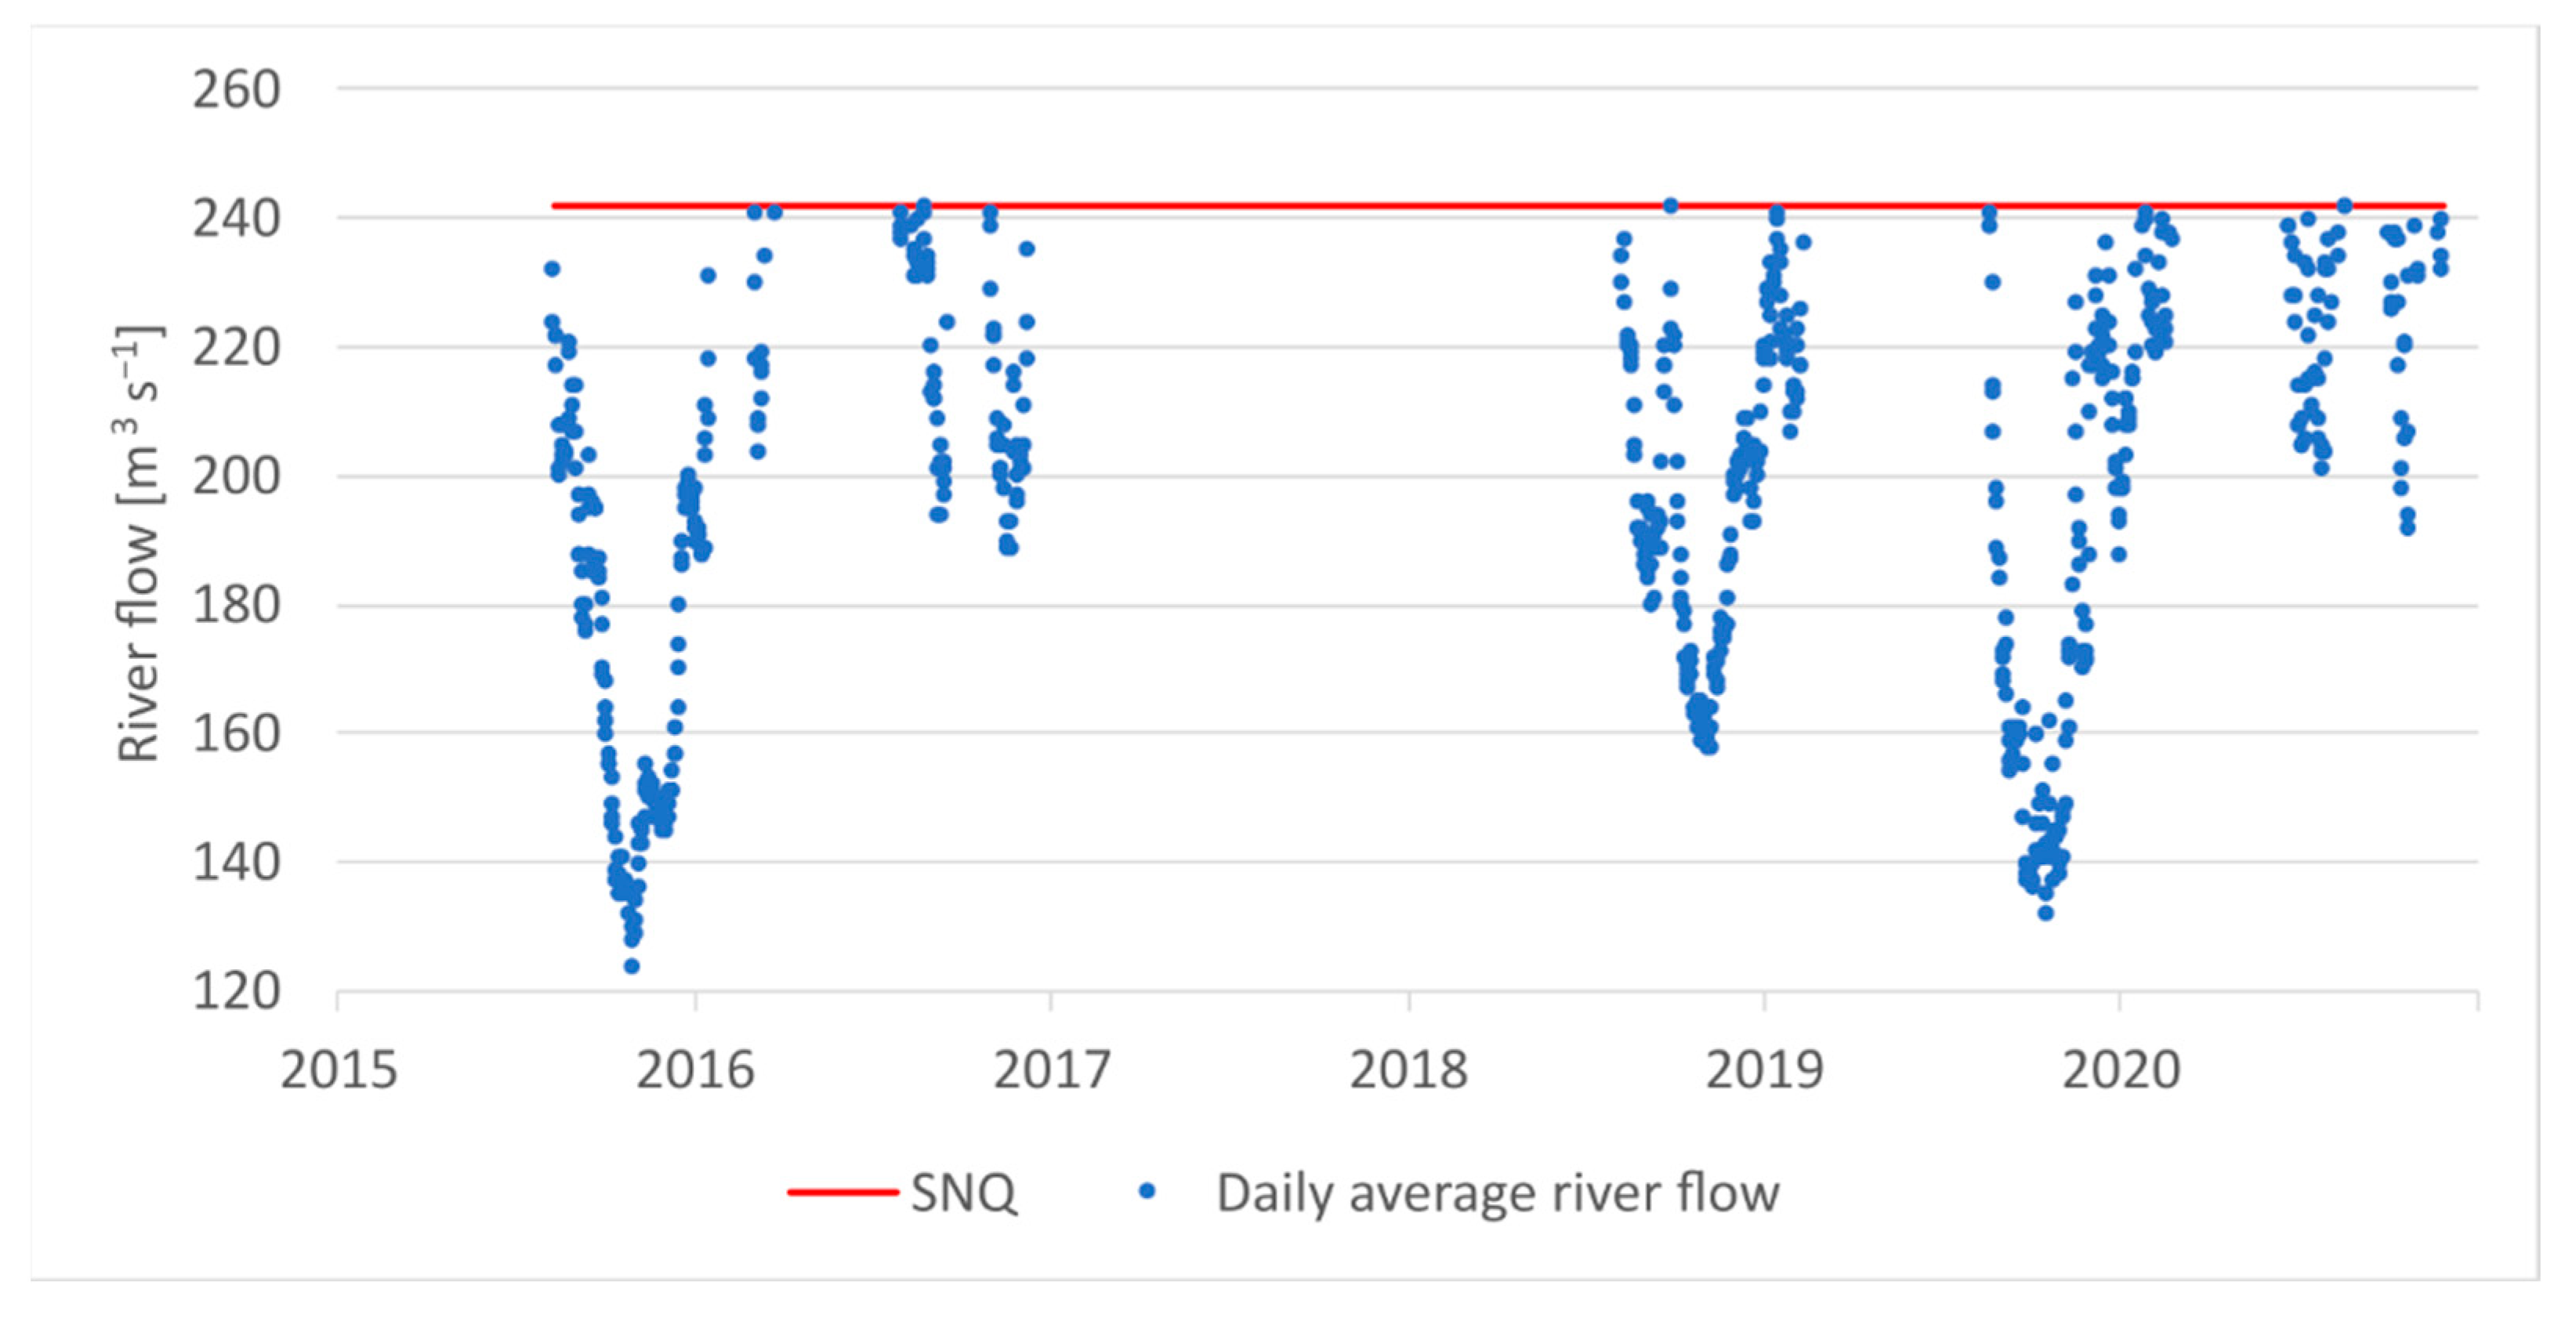
Kozienice Power Plant—Dęblin Water Gauge Station

On the Wisła River, at the Dęblin water gauge station, the number of days with the flow below or equal to the SNQ value (183 m3 s−1) in the analyzed multi-year period is 171 (Figure 7).
In individual years, the number of days with flow values lower than or equal to the SNQ is as follows (Figure 8):
  • 2012: 38 days;
  • 2013: 8 days;
  • 2015: 53 days;
  • 2016: 13 days;
  • 2017: 4 days;
  • 2018: 22 days;
  • 2019: 27 days;
  • 2020: 6 days.

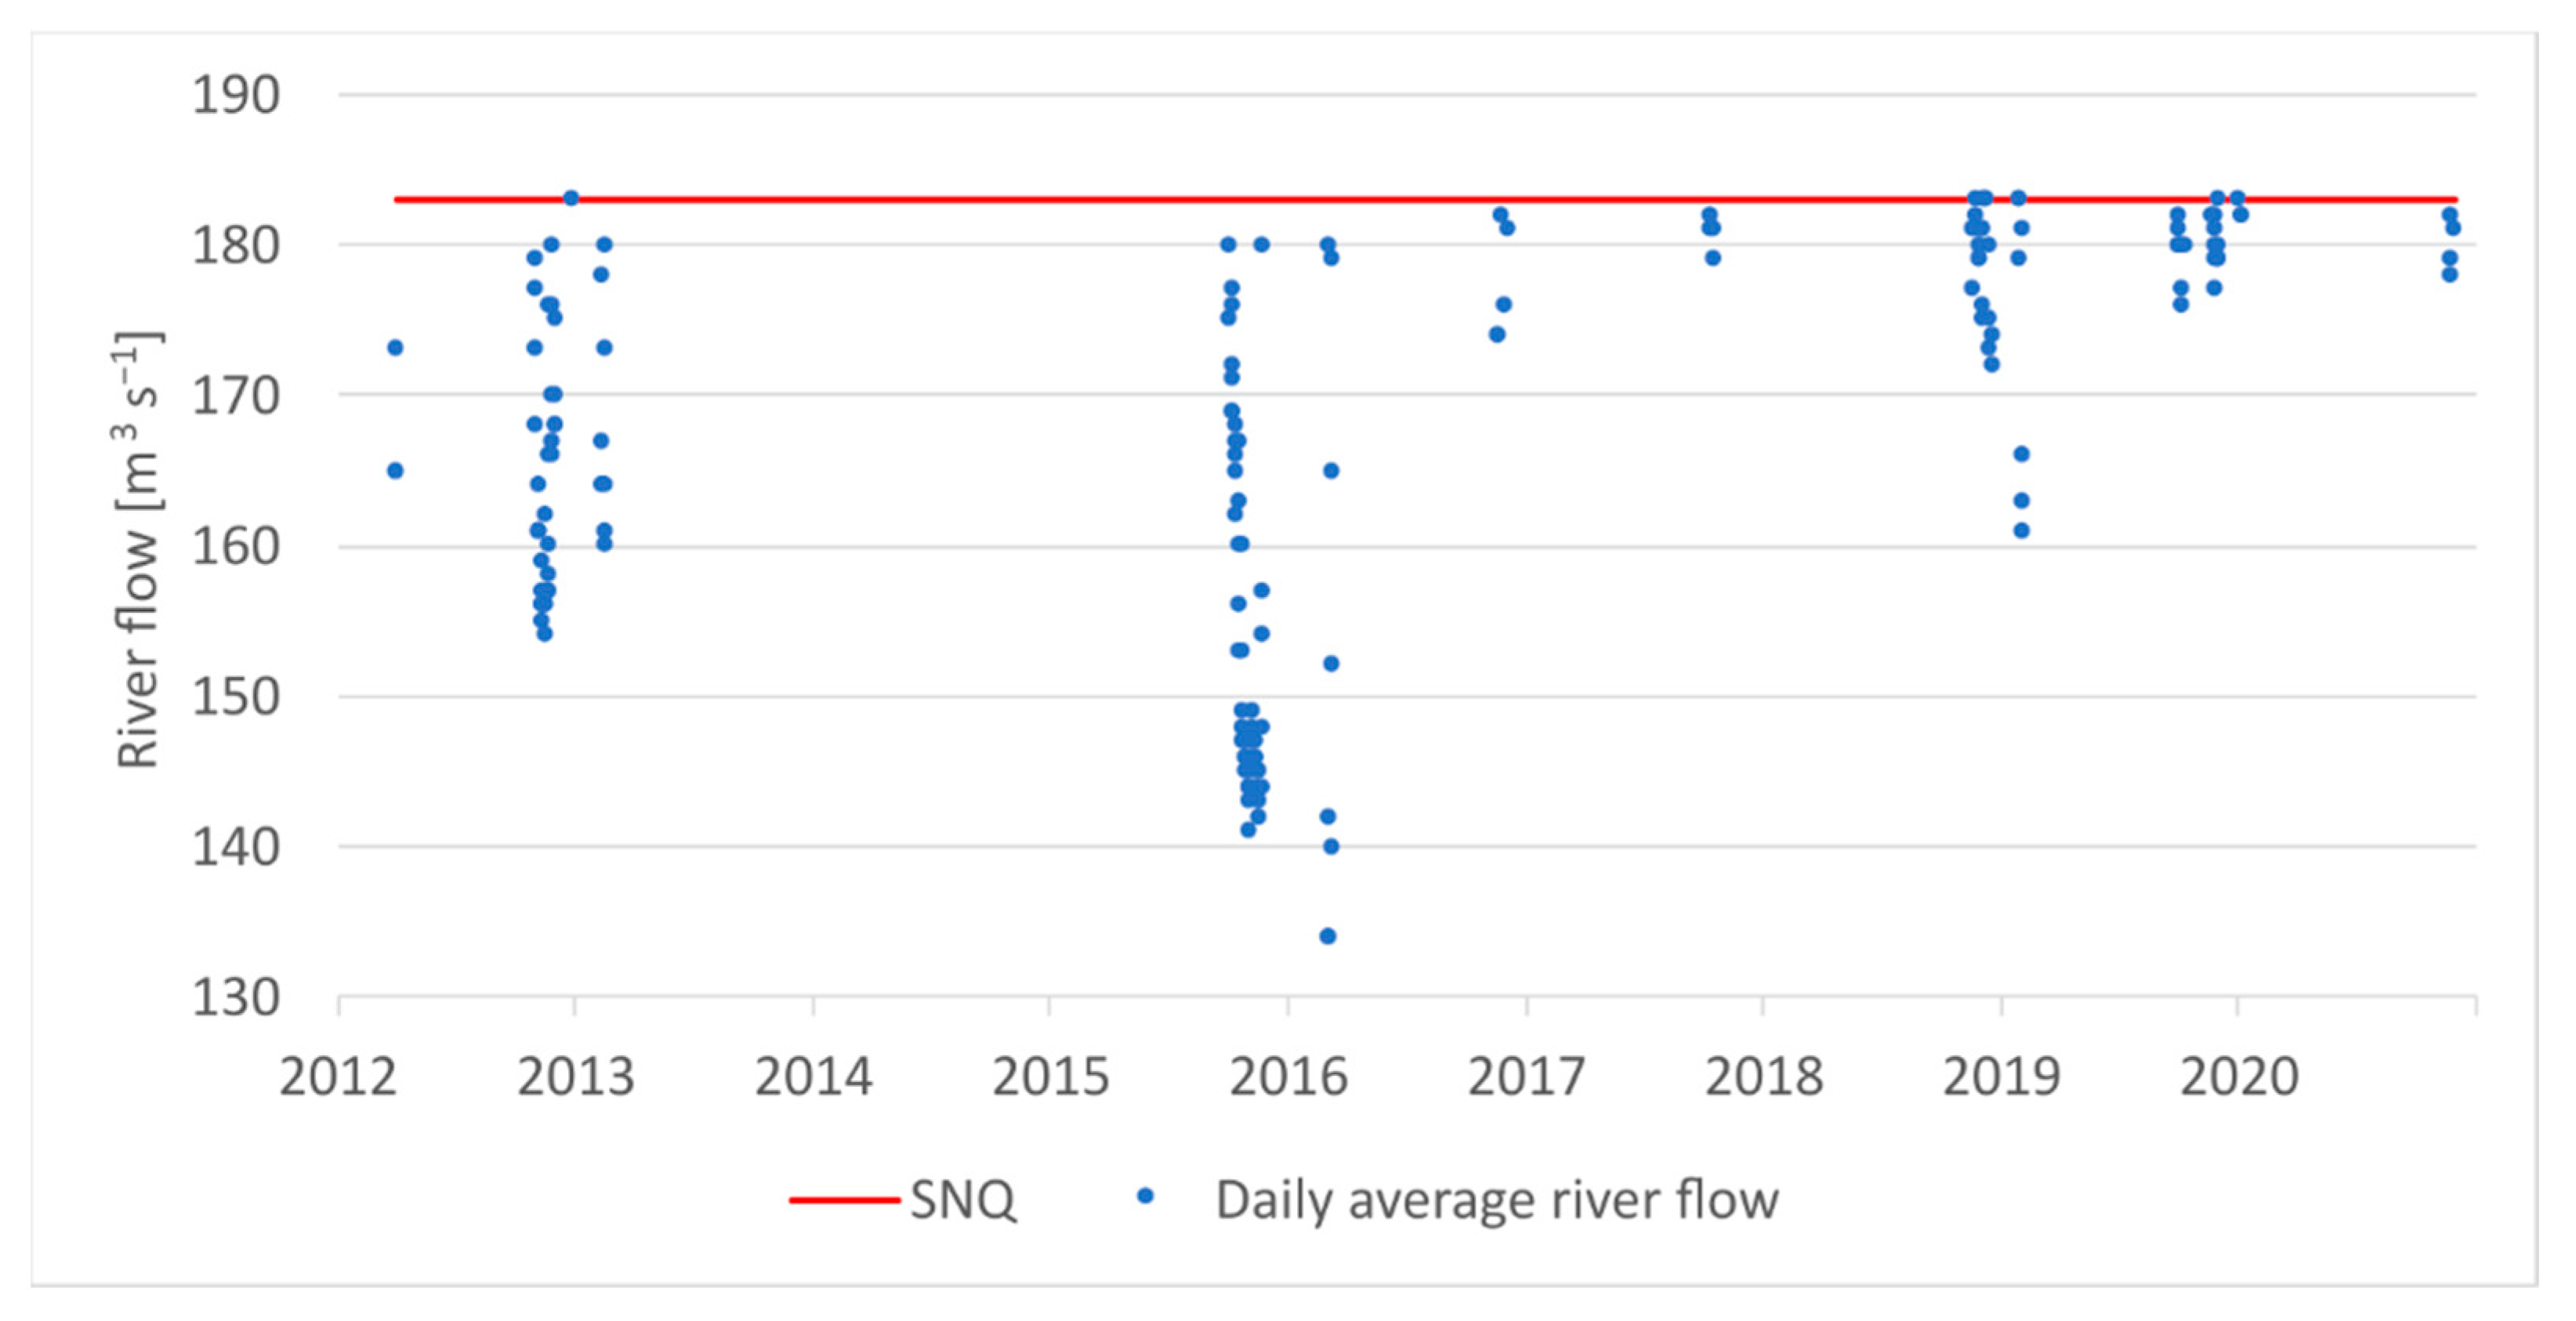
Ostrołęka Power Plant—Nowogród Water Gauge Station

On the Narew River, at the Nowogród water gauge station, the number of days with the flow below or equal to the SNQ value (38.4 m3 s−1) in the analyzed multi-year period was 330 (Figure 9).
In individual years, the number of days with flow values lower than or equal to the SNQ is as follows (Figure 10):
  • 2015: 124 days;
  • 2016: 19 days;
  • 2018: 59 days;
  • 2019: 95 days;
  • 2020: 33 days.

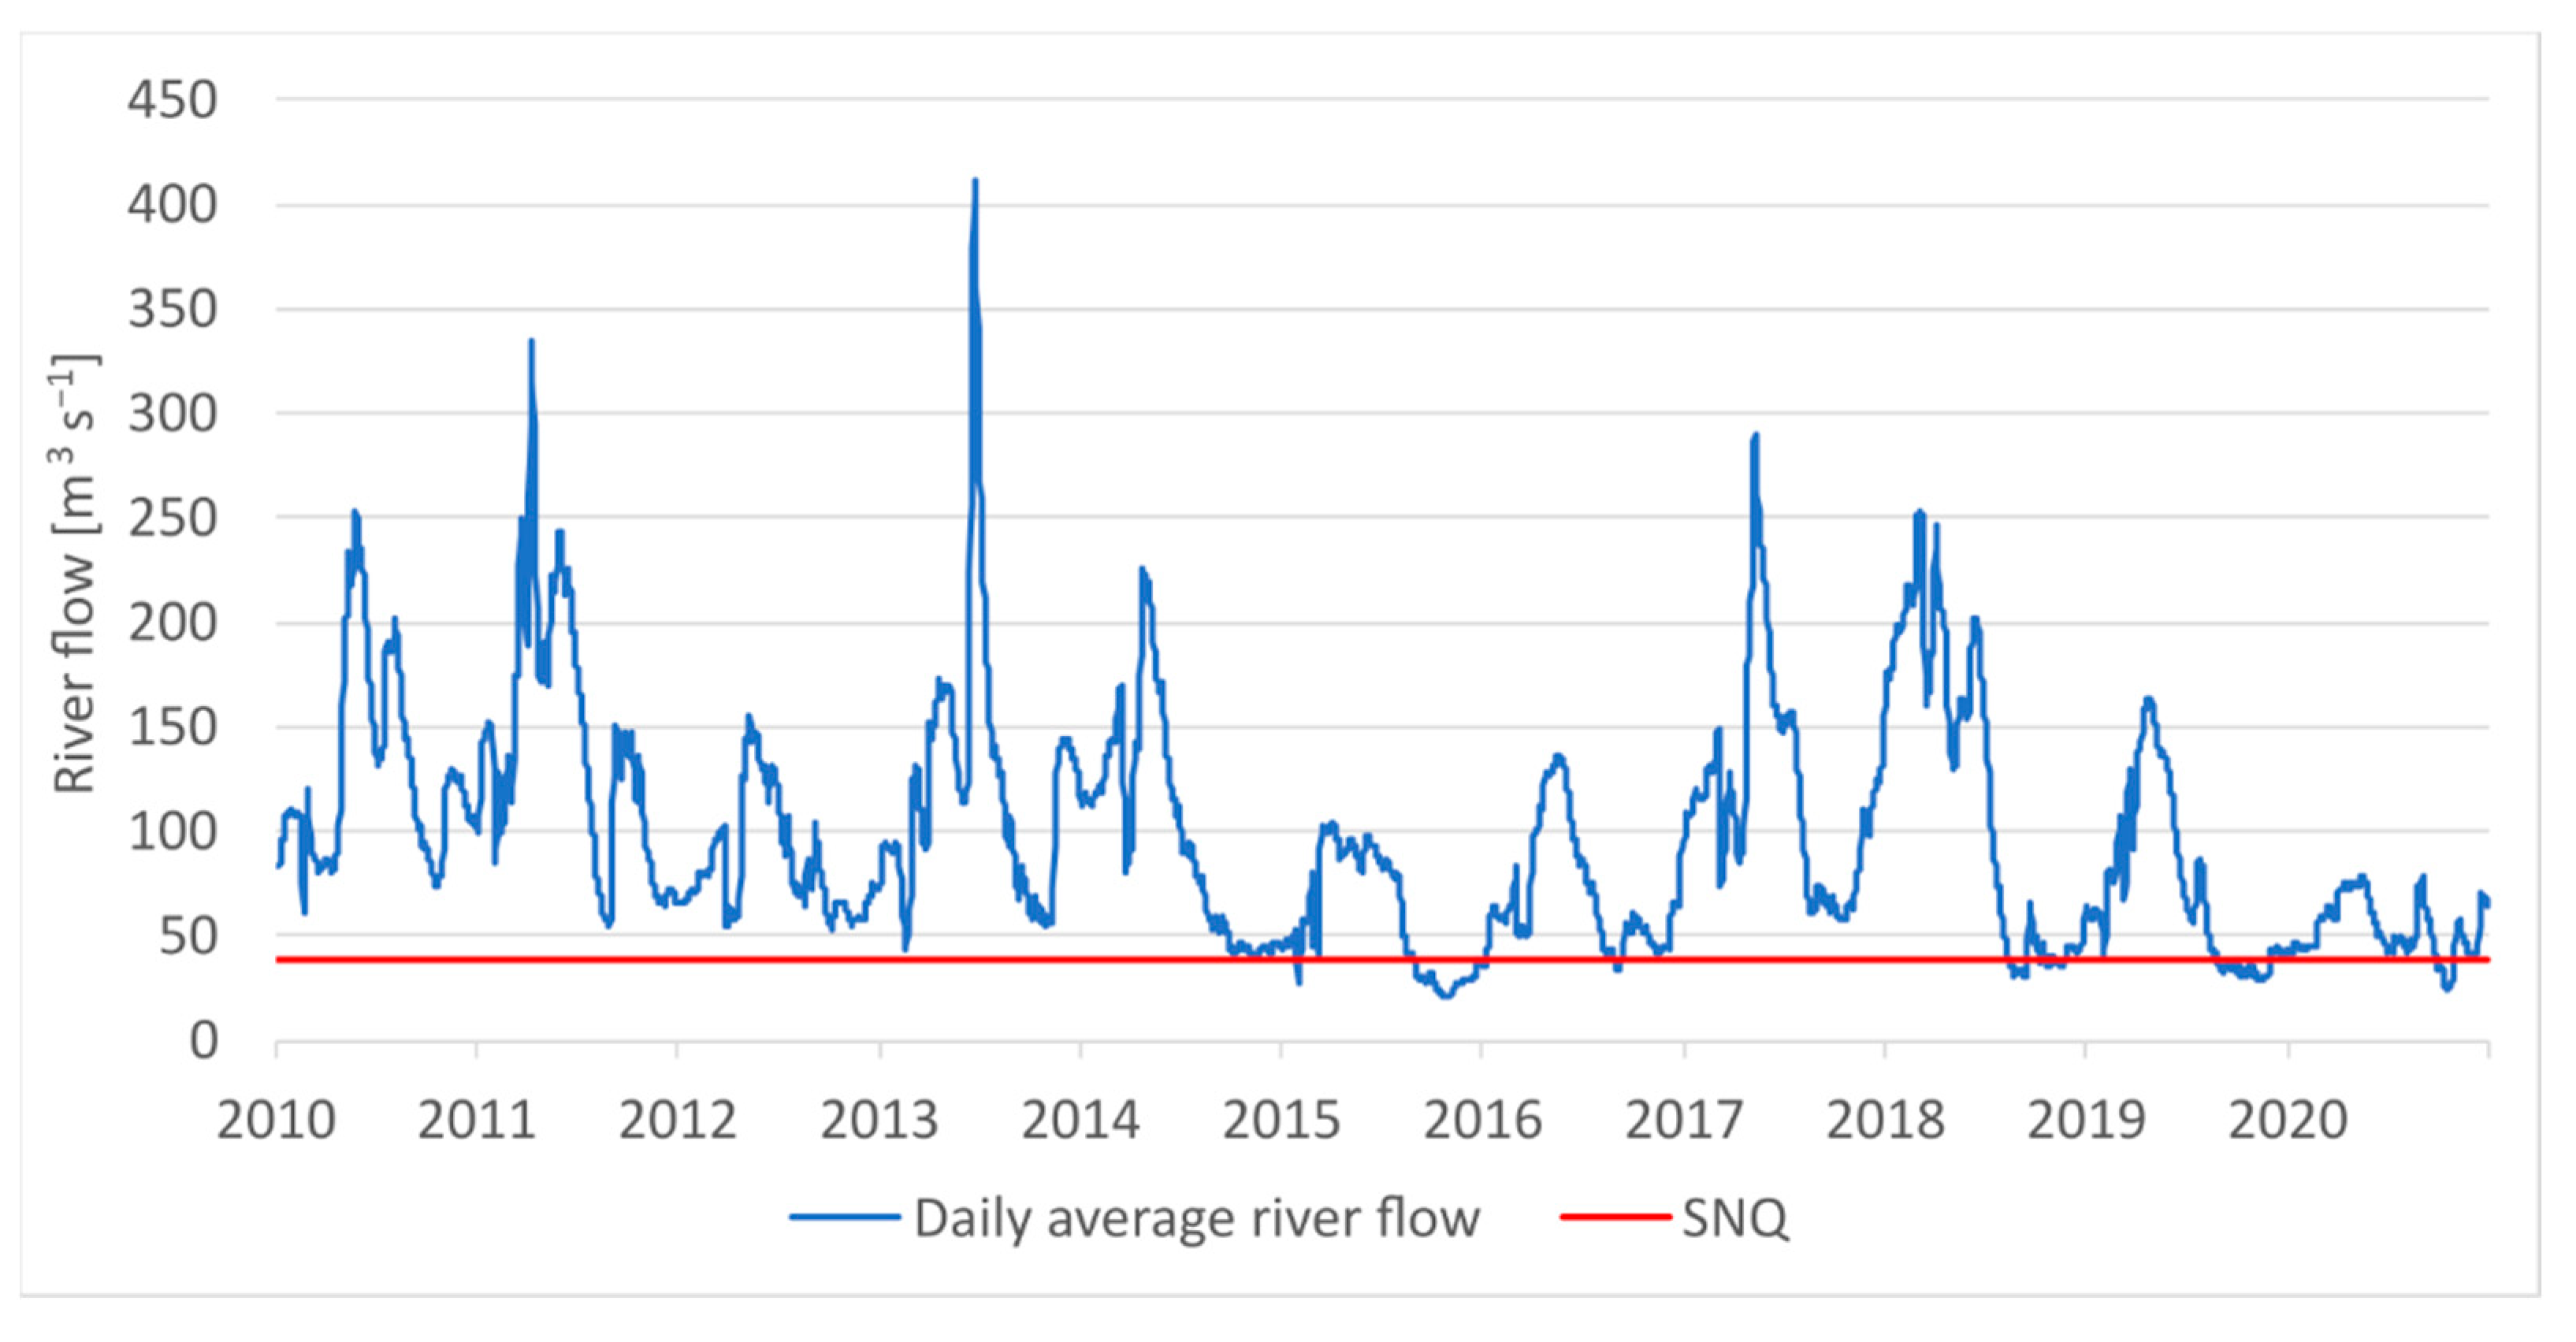
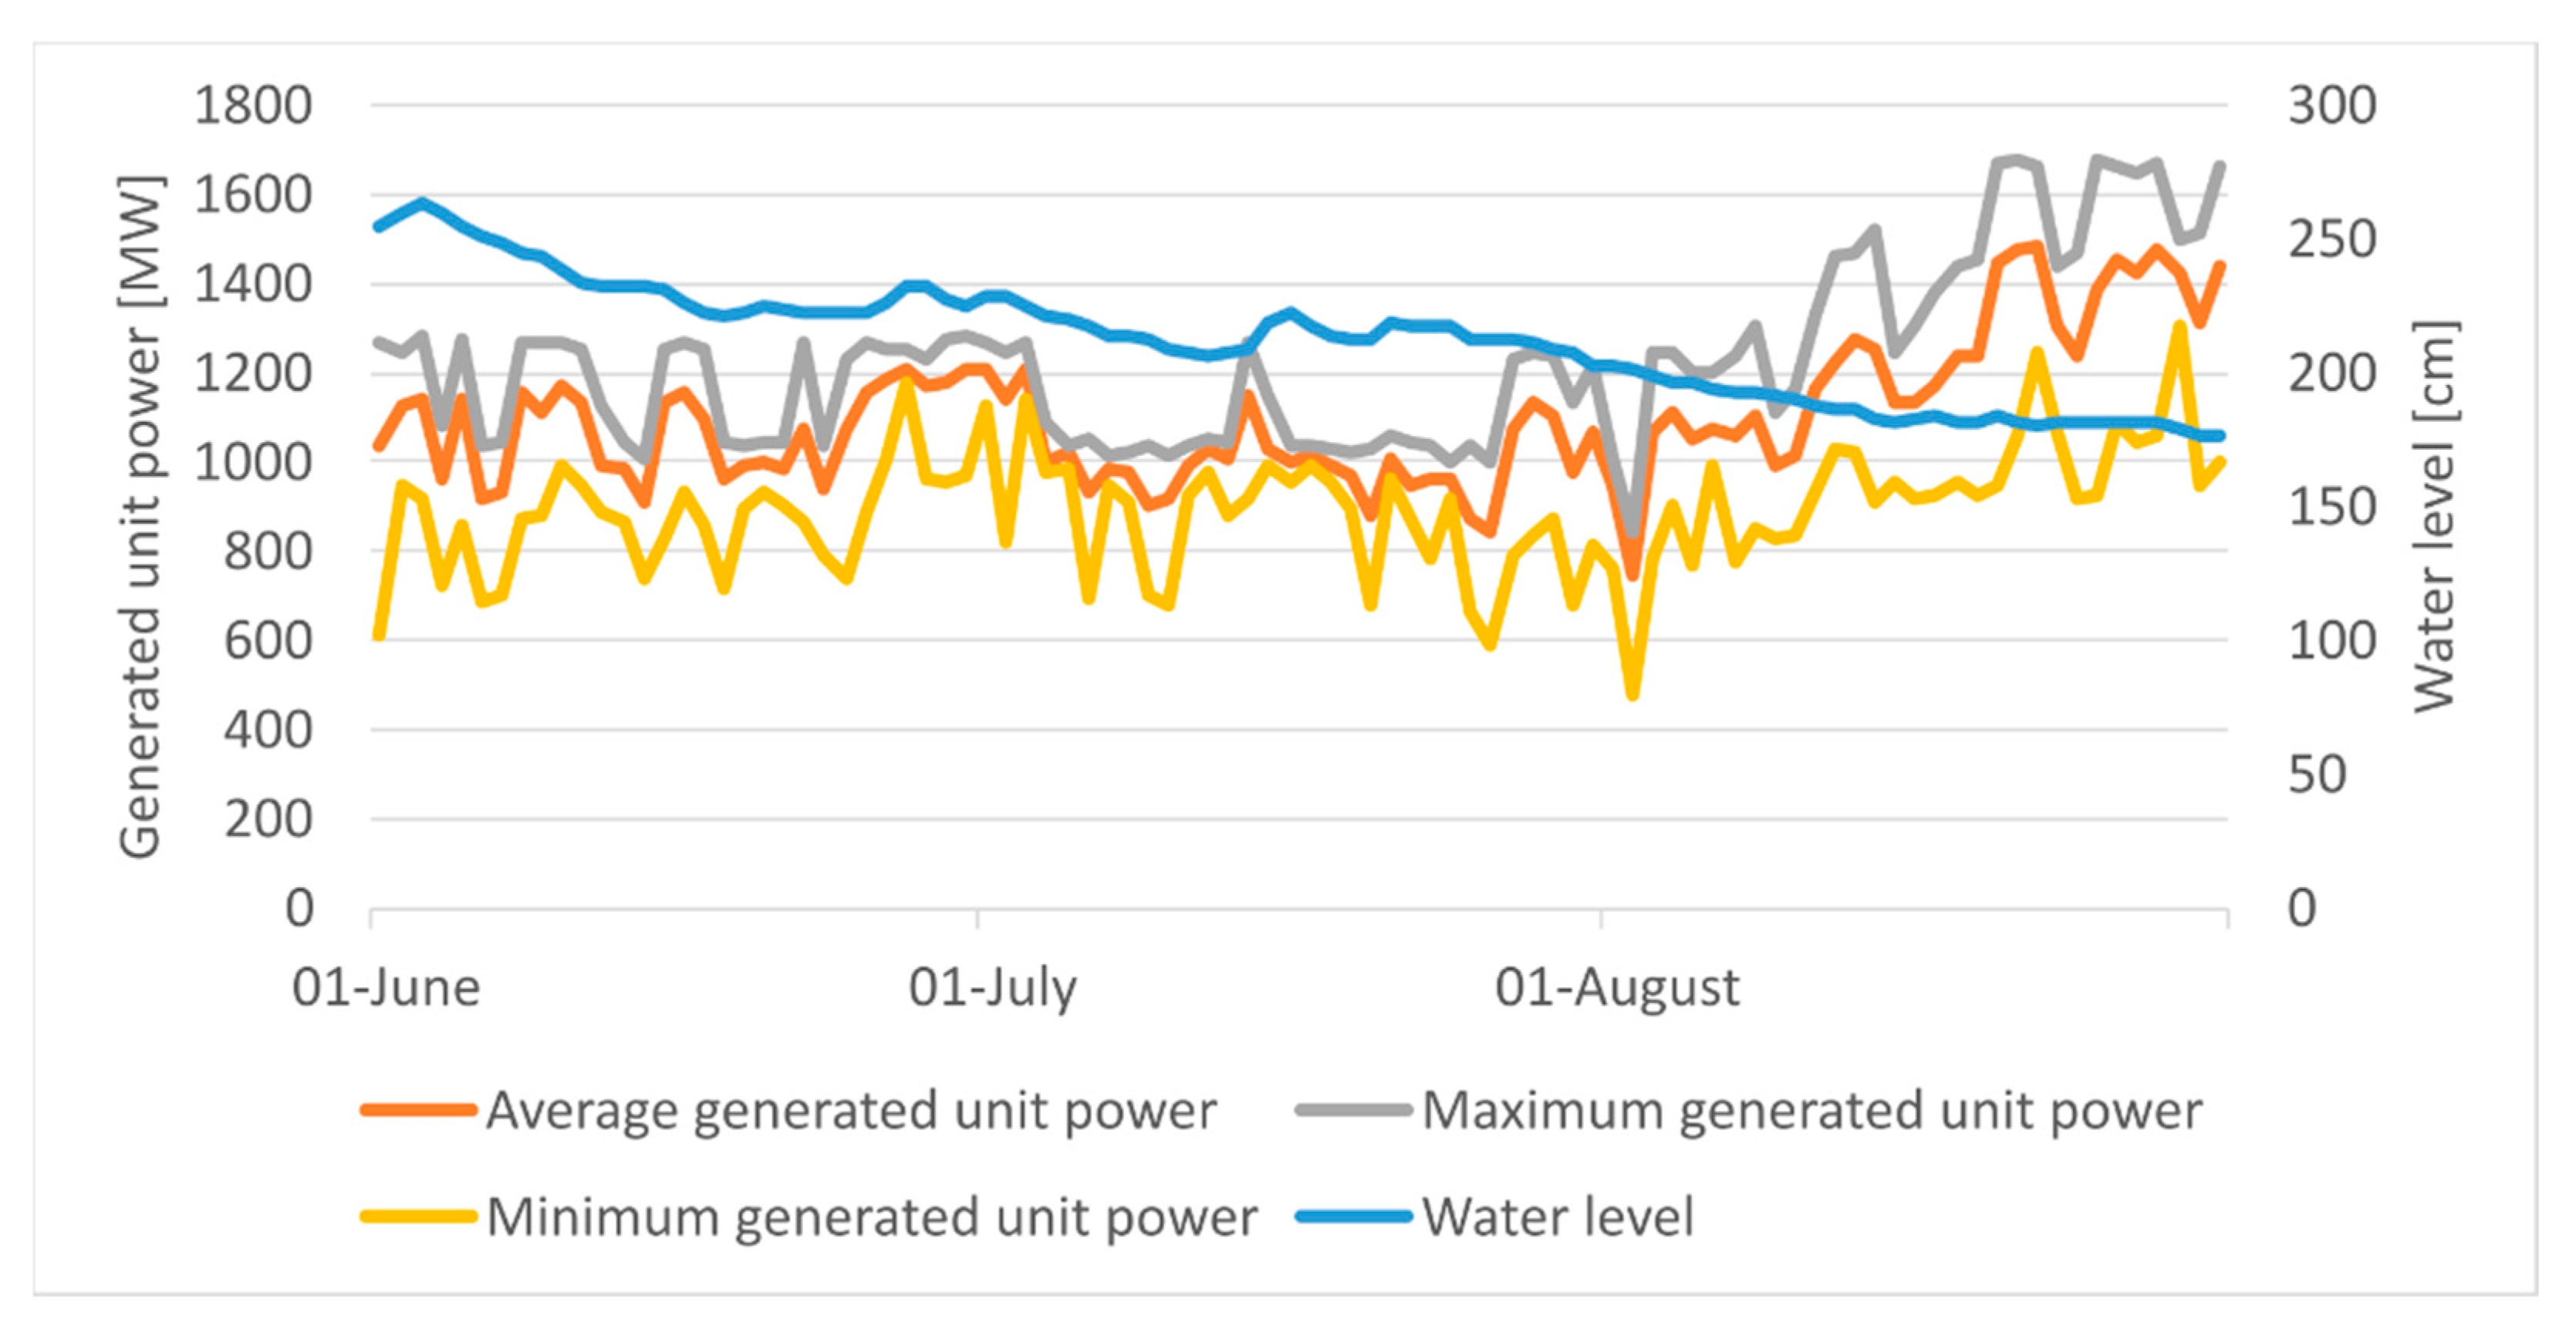
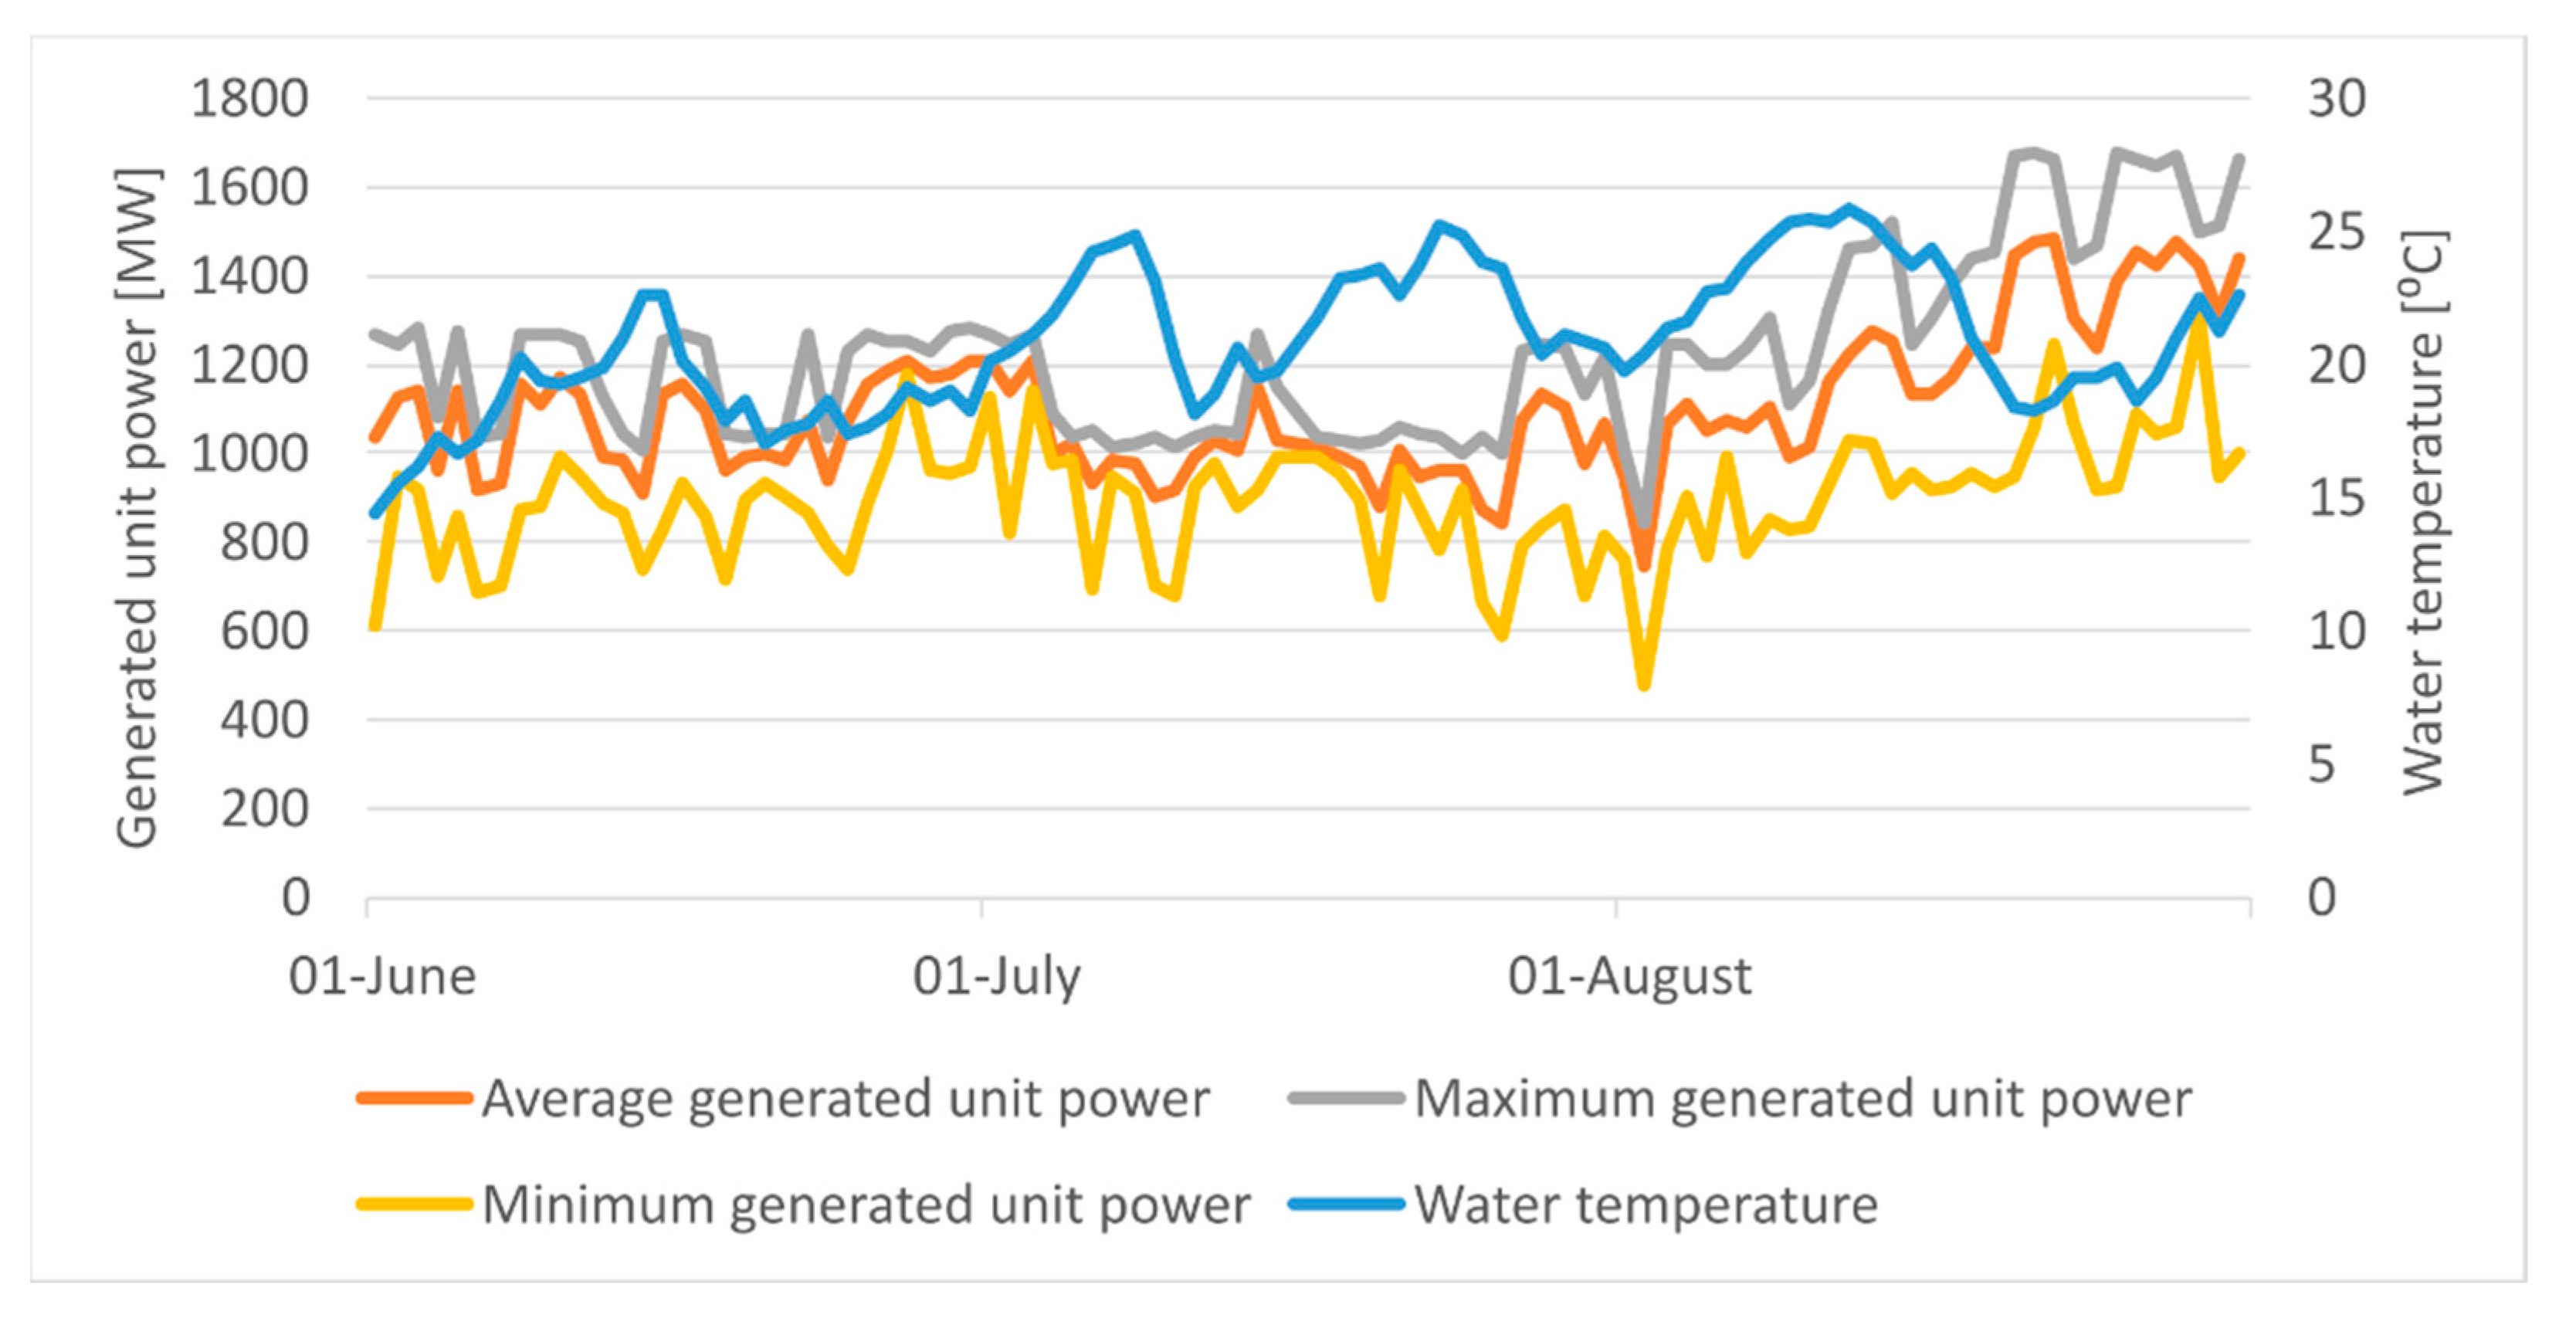
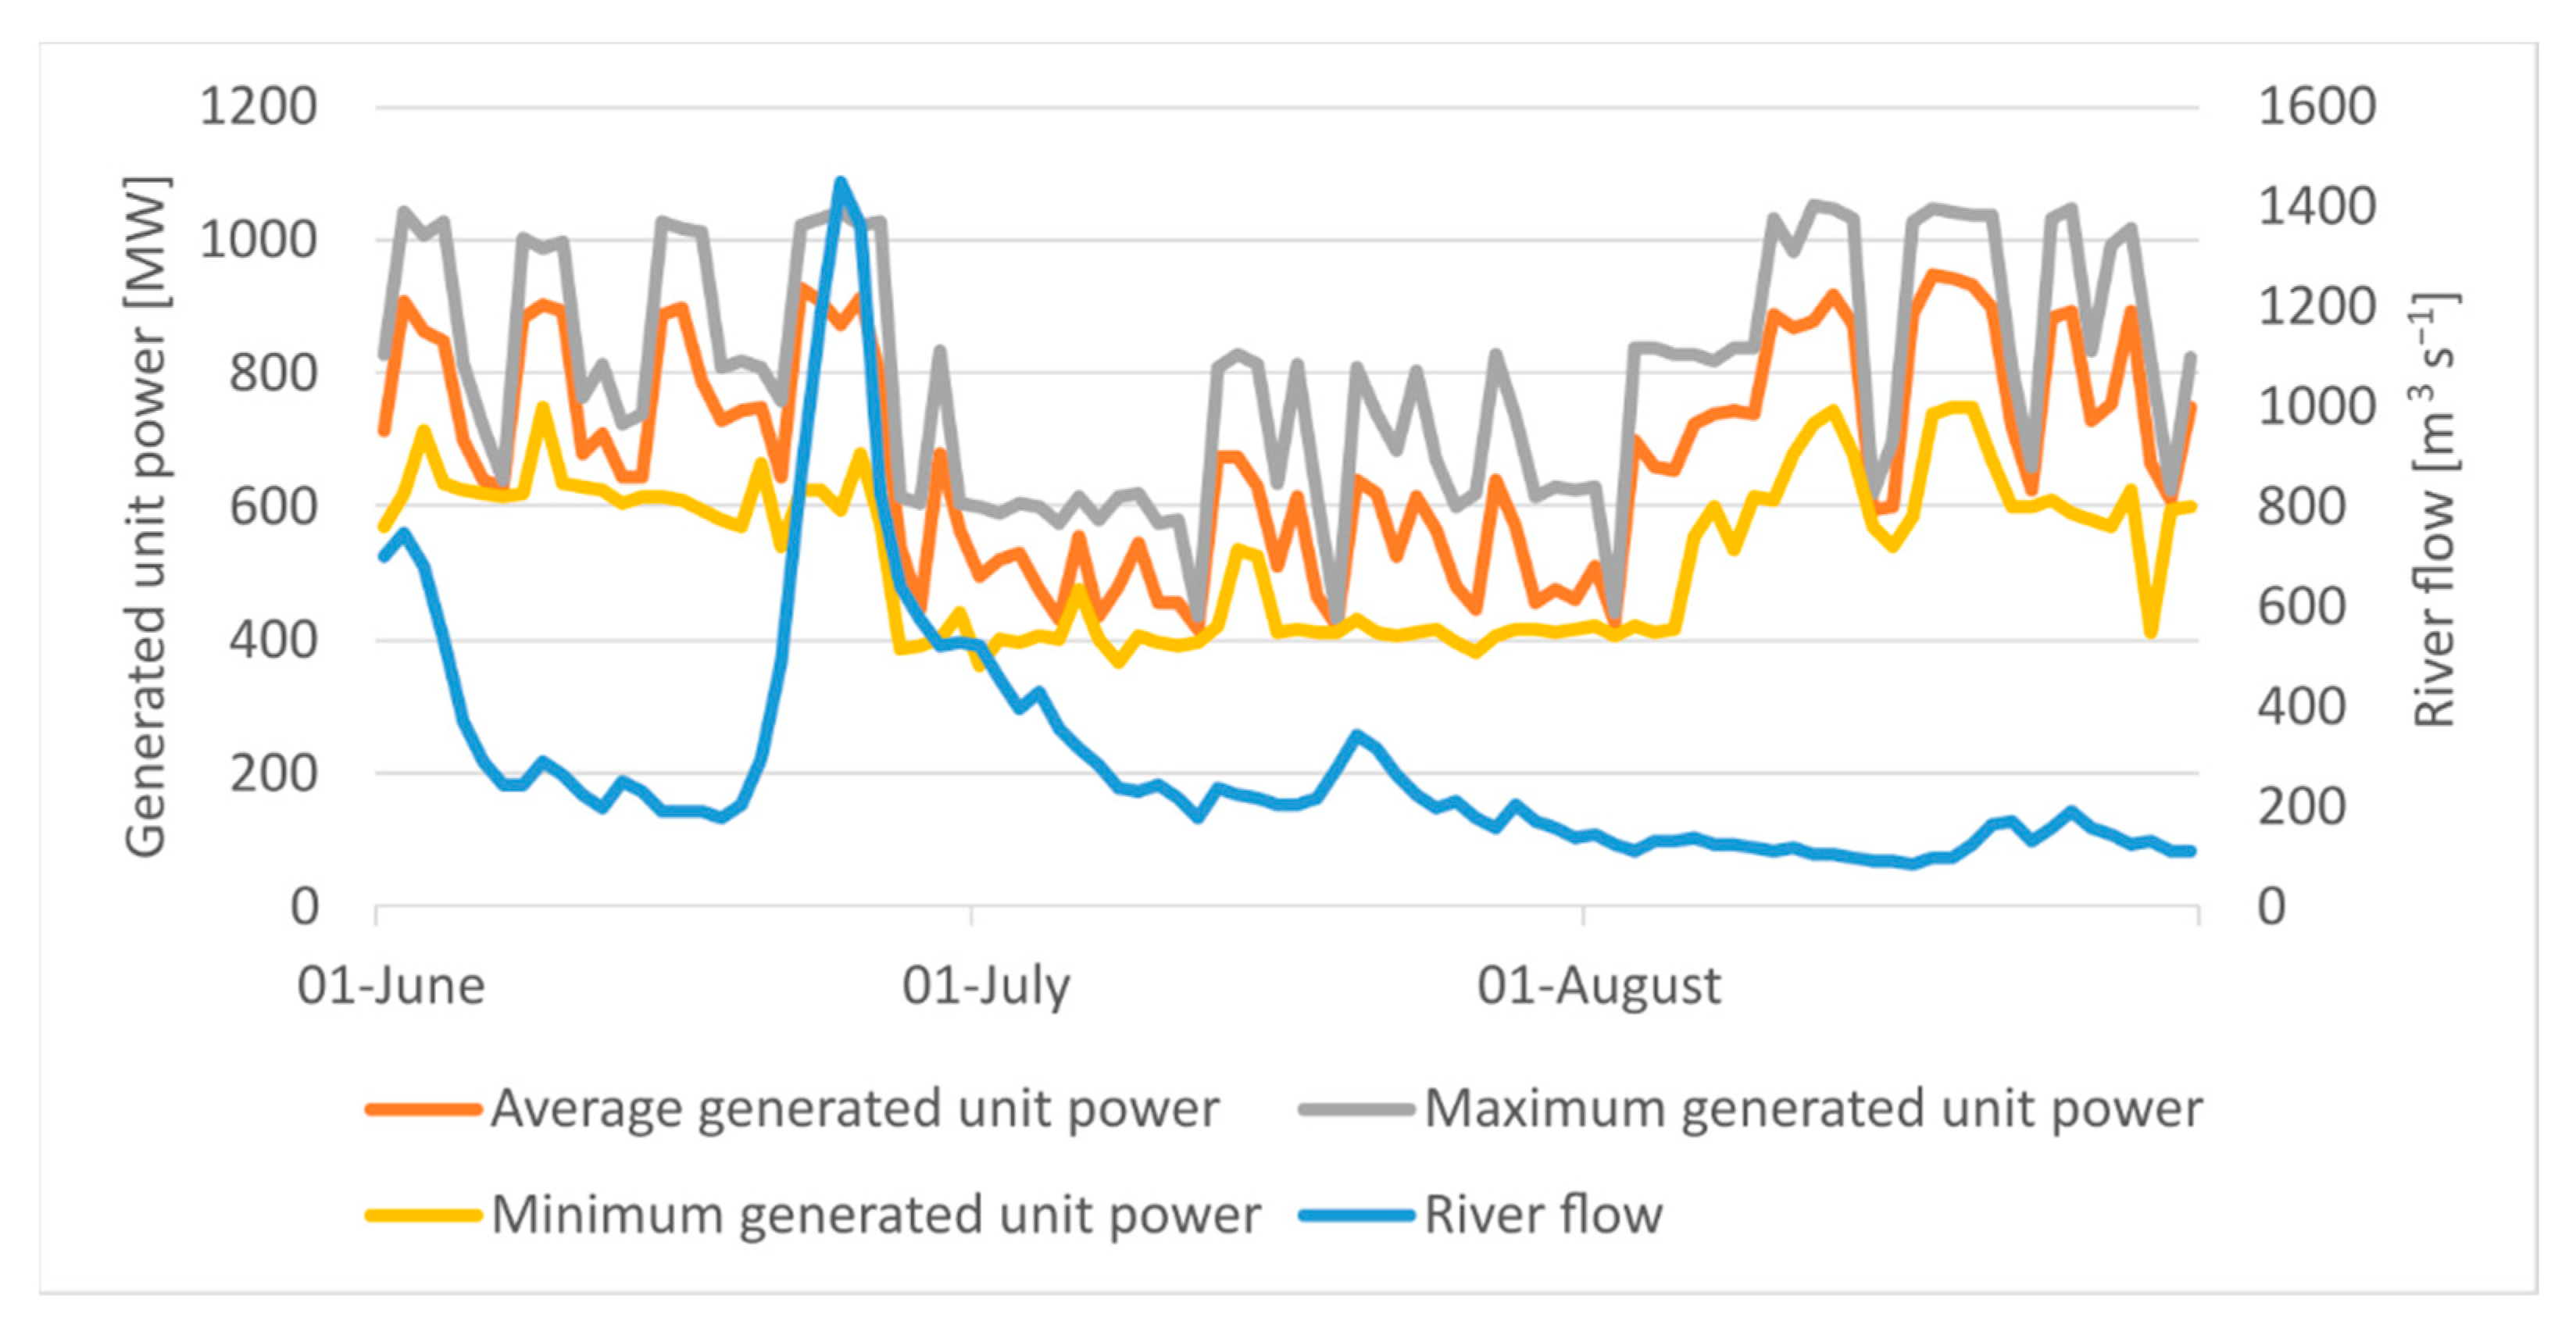
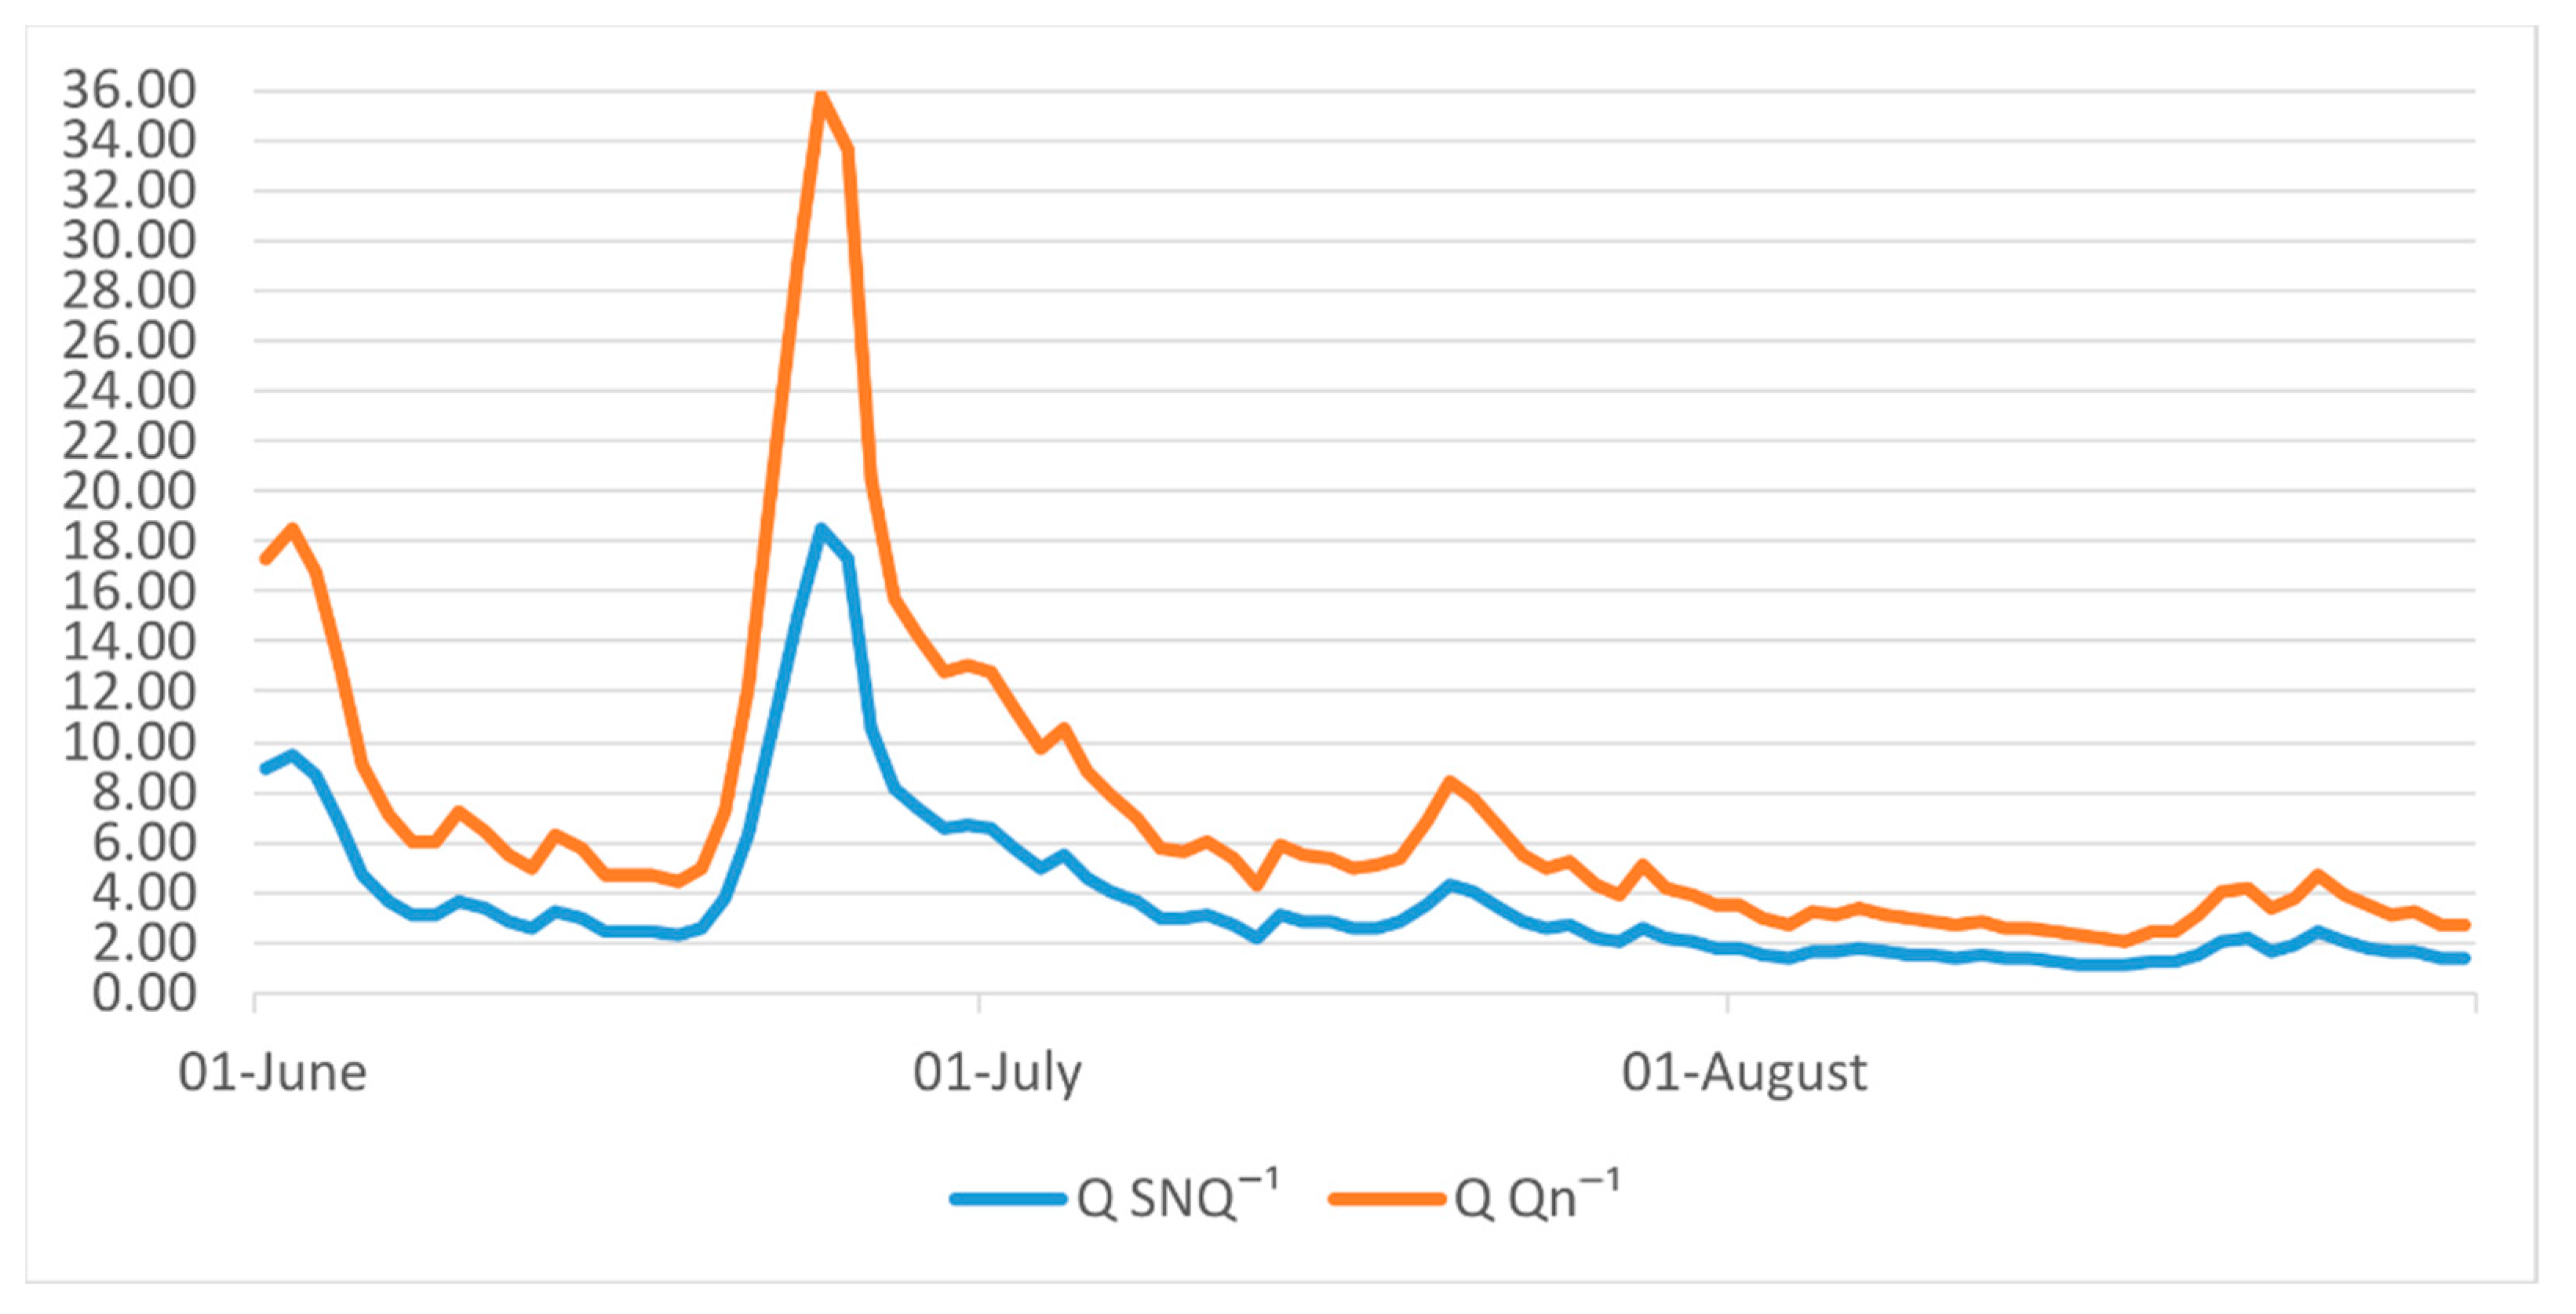
3.2.3. Detailed Analysis of the Połaniec Power Plant

Połaniec power plant produces almost 6% of Poland’s electricity [24]. It is located on the left bank, at km 224, of the Wisła River. The first power unit was put into operation in 1979. Currently, repeated problems related to the low water level and high temperature of the water in the Wisła River cyclically lead to a decrease in the cooling system’s efficiency. The power plant has an open cooling system that uses water directly from the Wisła River. Water for cooling purposes is periodically dammed up in the river by the shell weir. The damming weir is marked with information and warning boards. Within the damming weir, there are also light and acoustic signals activated during the damming of the water.
Water enters the power plant area through a special lock. Later, with an average temperature of 8 degrees Celsius, it is discharged through a canal about a kilometer long.
It is also worth noting that too high a water level may also be dangerous for the power plant. The last such case took place during the flood in 2010. Then, the retaining wall protecting the power plant installations was only a few centimeters away from the overflow. After the flood, the protective wall was raised, and, additionally, a new bulkhead system was built, which shortened the time of preparation of the facility before high water from several dozen to seven hours [25].
The calculation characteristics of the flows characteristic of the Wisła River profile in Szczucin in the years 1951–2020 are as follows:
  • WWQ—the highest high flow—5780 m3 s−1;
  • SWQ—medium-high flow—1872 m3 s−1;
  • SSQ—medium flow from the medium annual flows—233 m3 s−1;
  • SNQ—medium-low flow—78.6 m3 s−1;
  • NNQ—the lowest low flow—40.5 m3 s−1.
For the analysis, the inviolable flow was also calculated for the hydrobiological criterion using the Kostrzewa method. The previously calculated SNQ value is 78.6 m3 s−1. The area of the Vistula catchment area up to the Szczucin water gauge section is 23869.4 km2, and the coefficient depends on the river type and catchment size, k = 0.5.
The following formula (1) was used for the calculations:
Qn = Qbiol = k · SNQ,
Qn = 0.5 · 78.6 m3 s−1,
Qn = 39.3 m3 s−1.
The calculated Qn value is lower than the NNQ value, therefore it should be assumed that Qn = NNQ, that is:
Qn = 40.5 m3 s−1.
The total active power generated in the Połaniec power plant concerning the flow, water level, and water temperature in the Wisła River is presented below. The analyses were performed from 1 June to 31 August 2015, and for the same period in 2020. The year 2015 was the second and 2020 the sixth driest year in the multi-year period 1951–2020. The choice of the summer period was dictated by the increased risk of unplanned limitation of energy production due to increased cooling water temperature and too low water level in the river. In selected periods, the data made available within the REMIT system were also analyzed regarding forced breaks in power plant operation caused by, e.g., breakdowns. REMIT stands for Regulation (EU) No. 1227/1011 of the European Parliament and the Council of 25 October 2011 [26]. The regulation introduces a coherent framework for the entire EU, including in the field of publishing so-called inside information in an appropriate form. Disclosure of inside information is subject to all participants of the energy market as defined in REMIT. REMIT data are available on the website of the European Network of Transmission System Operators for Electricity [27] (ENTSO-E).

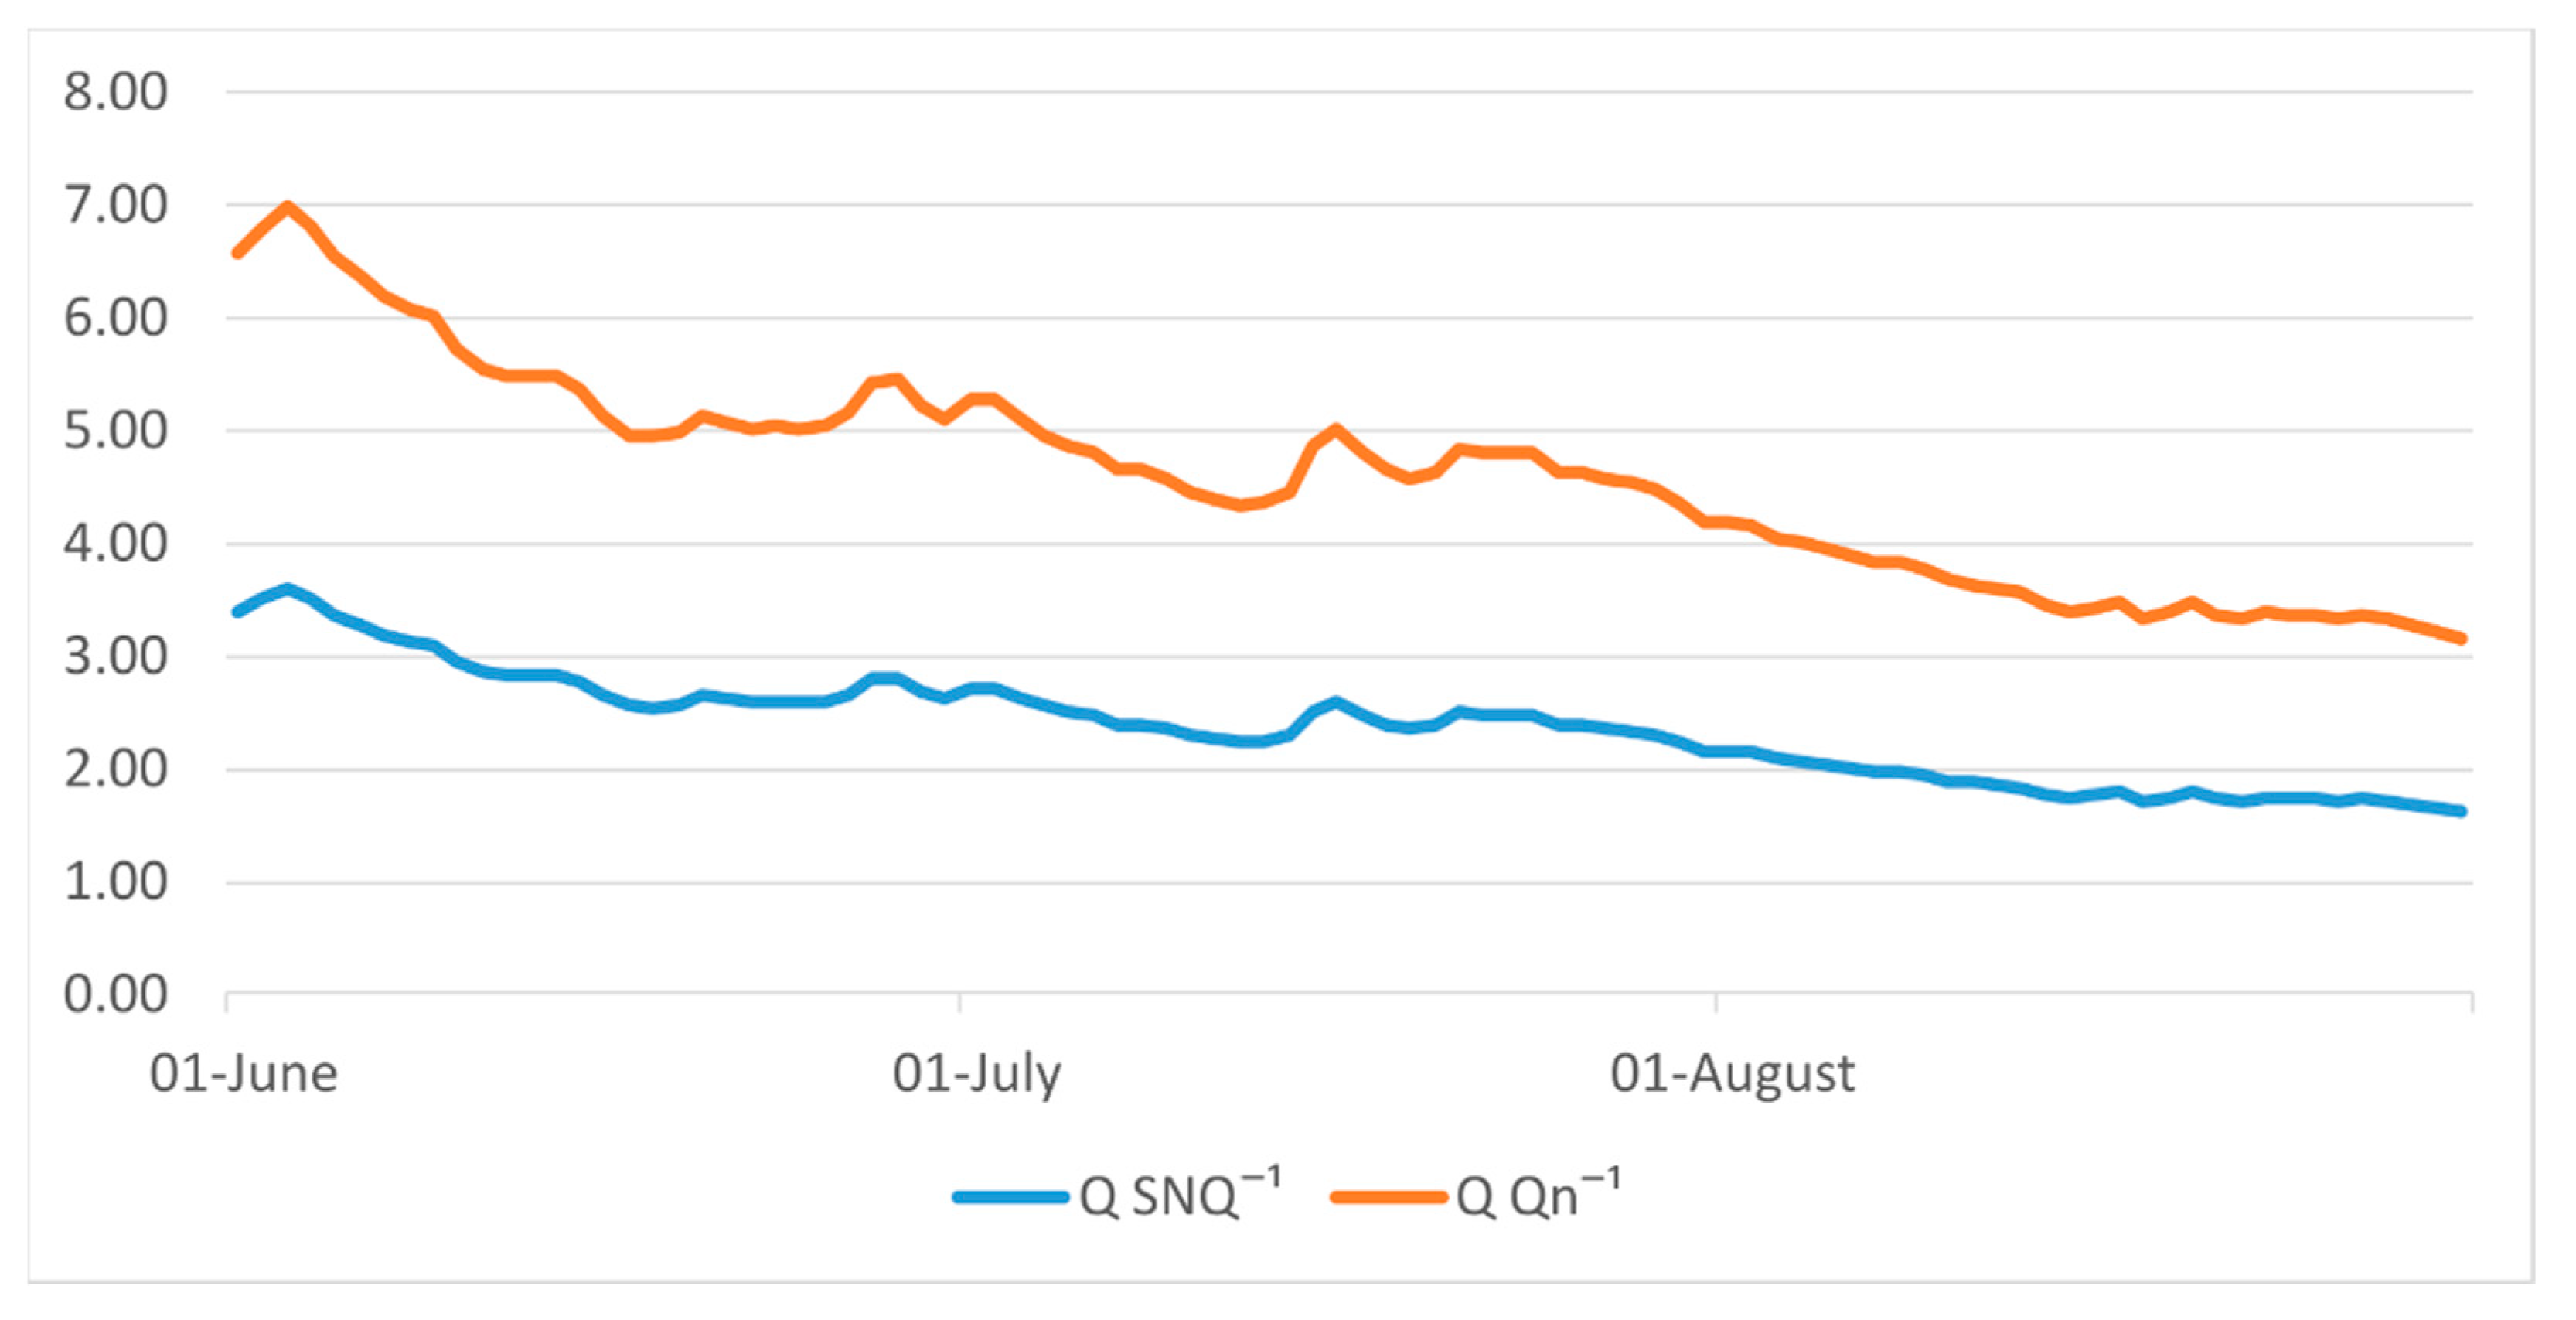
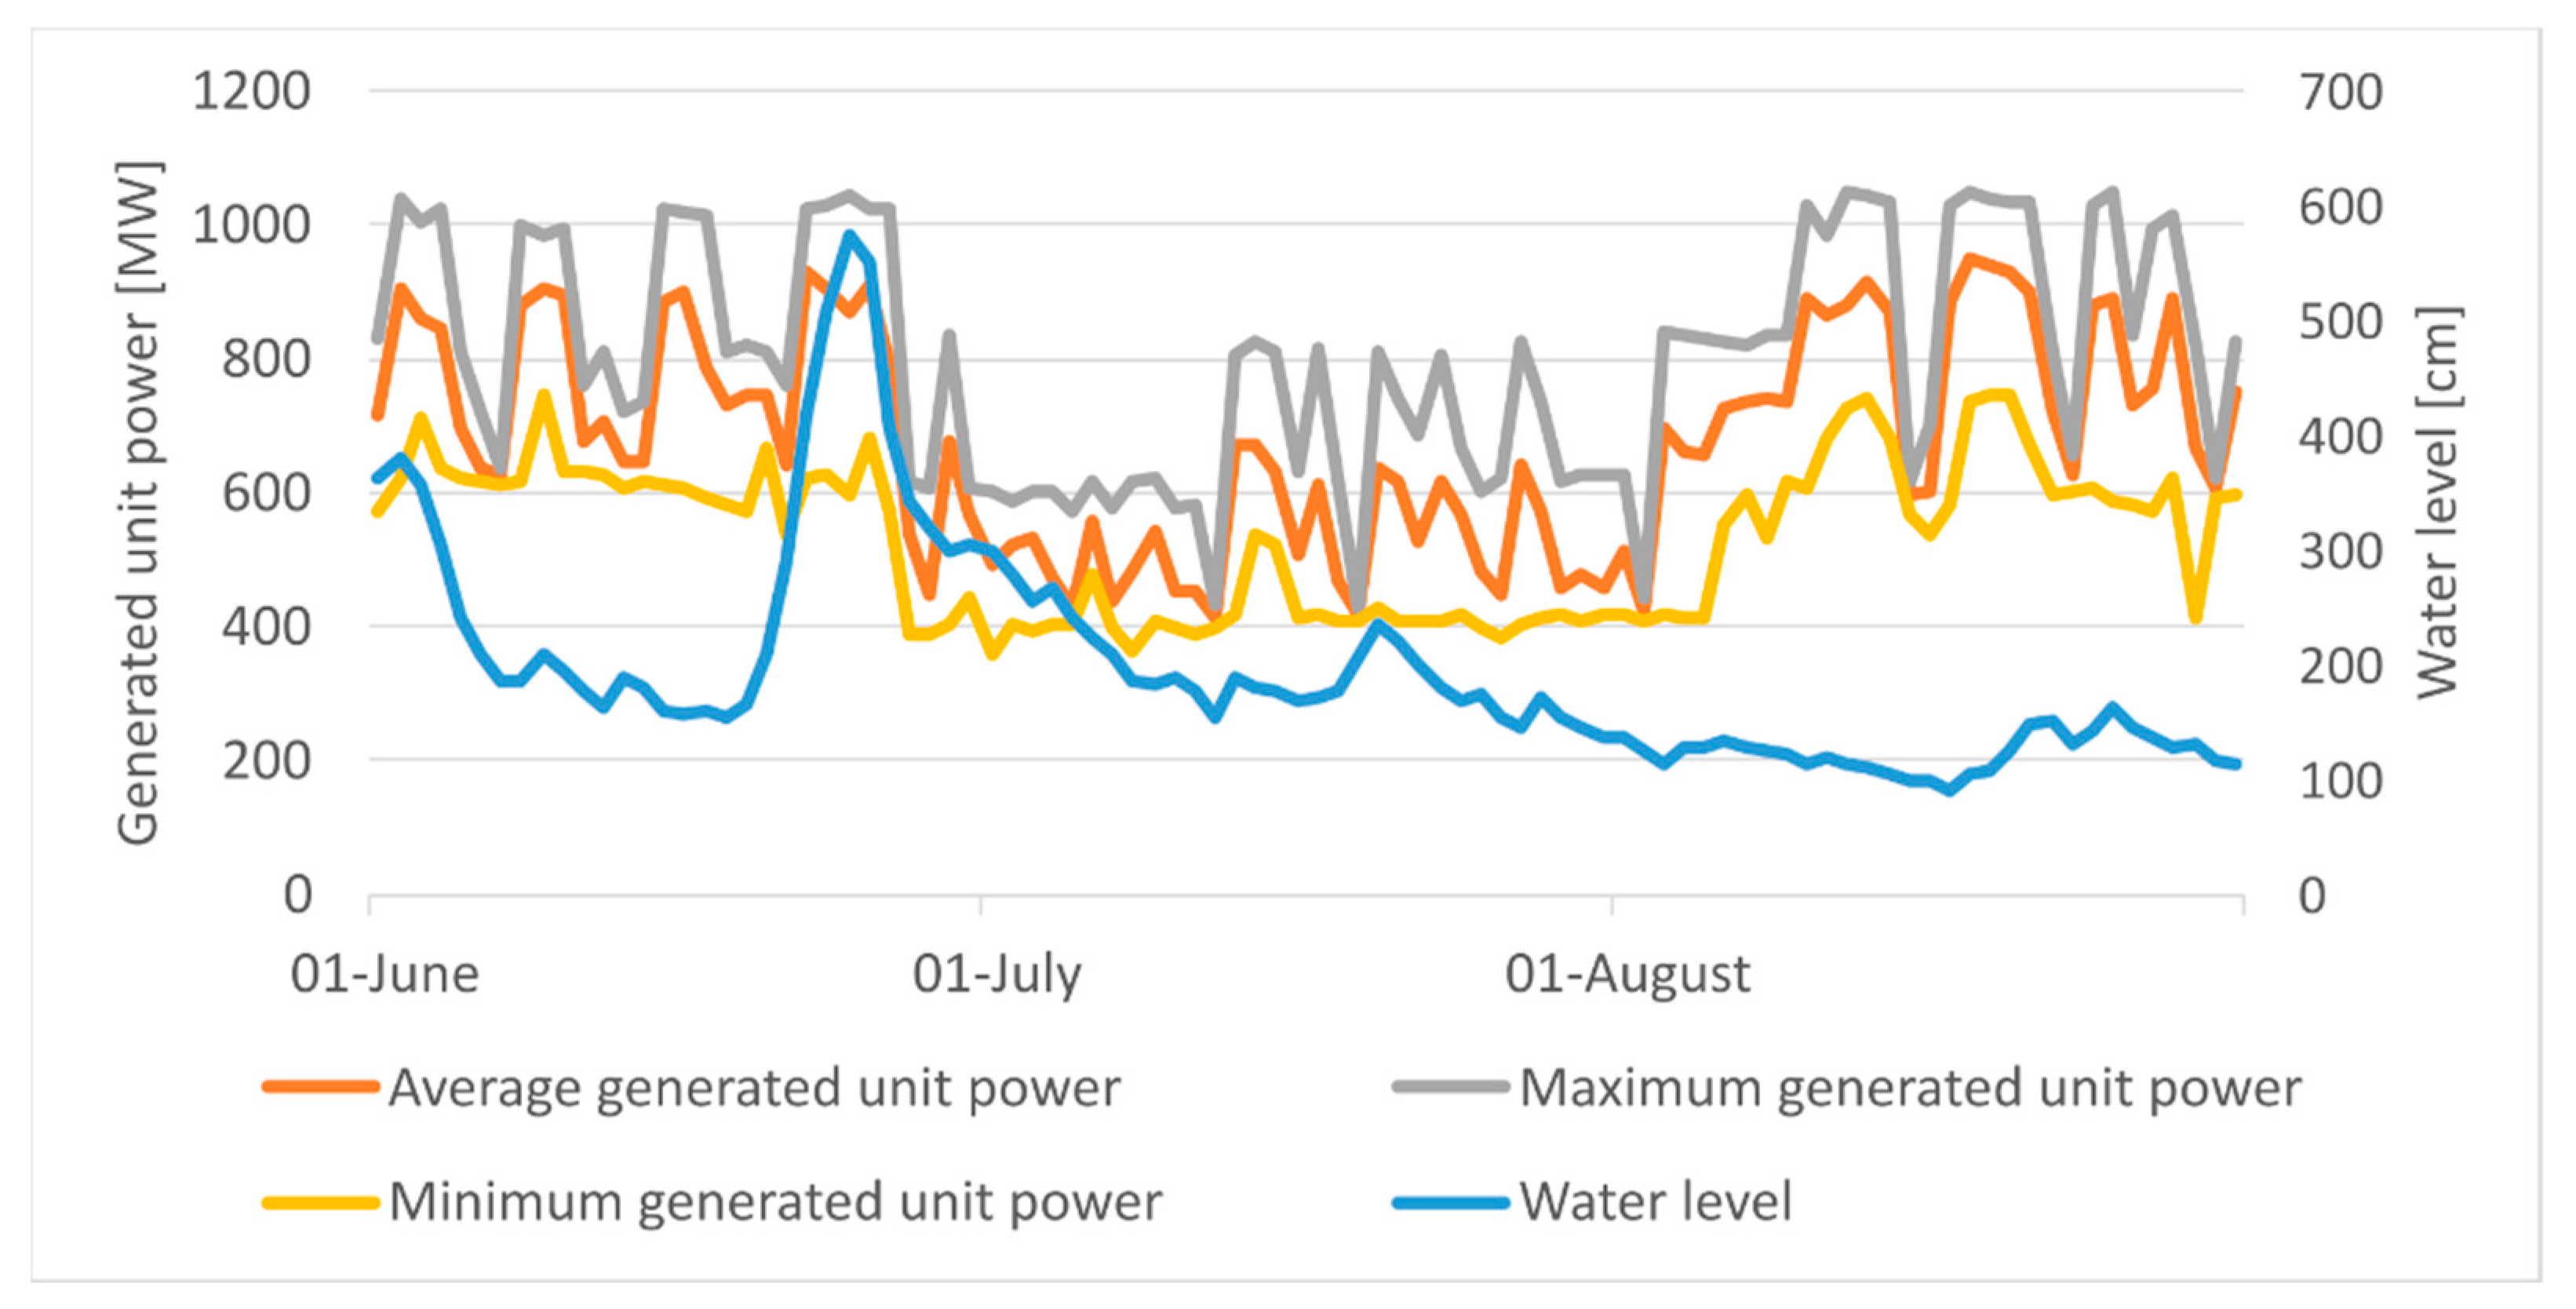
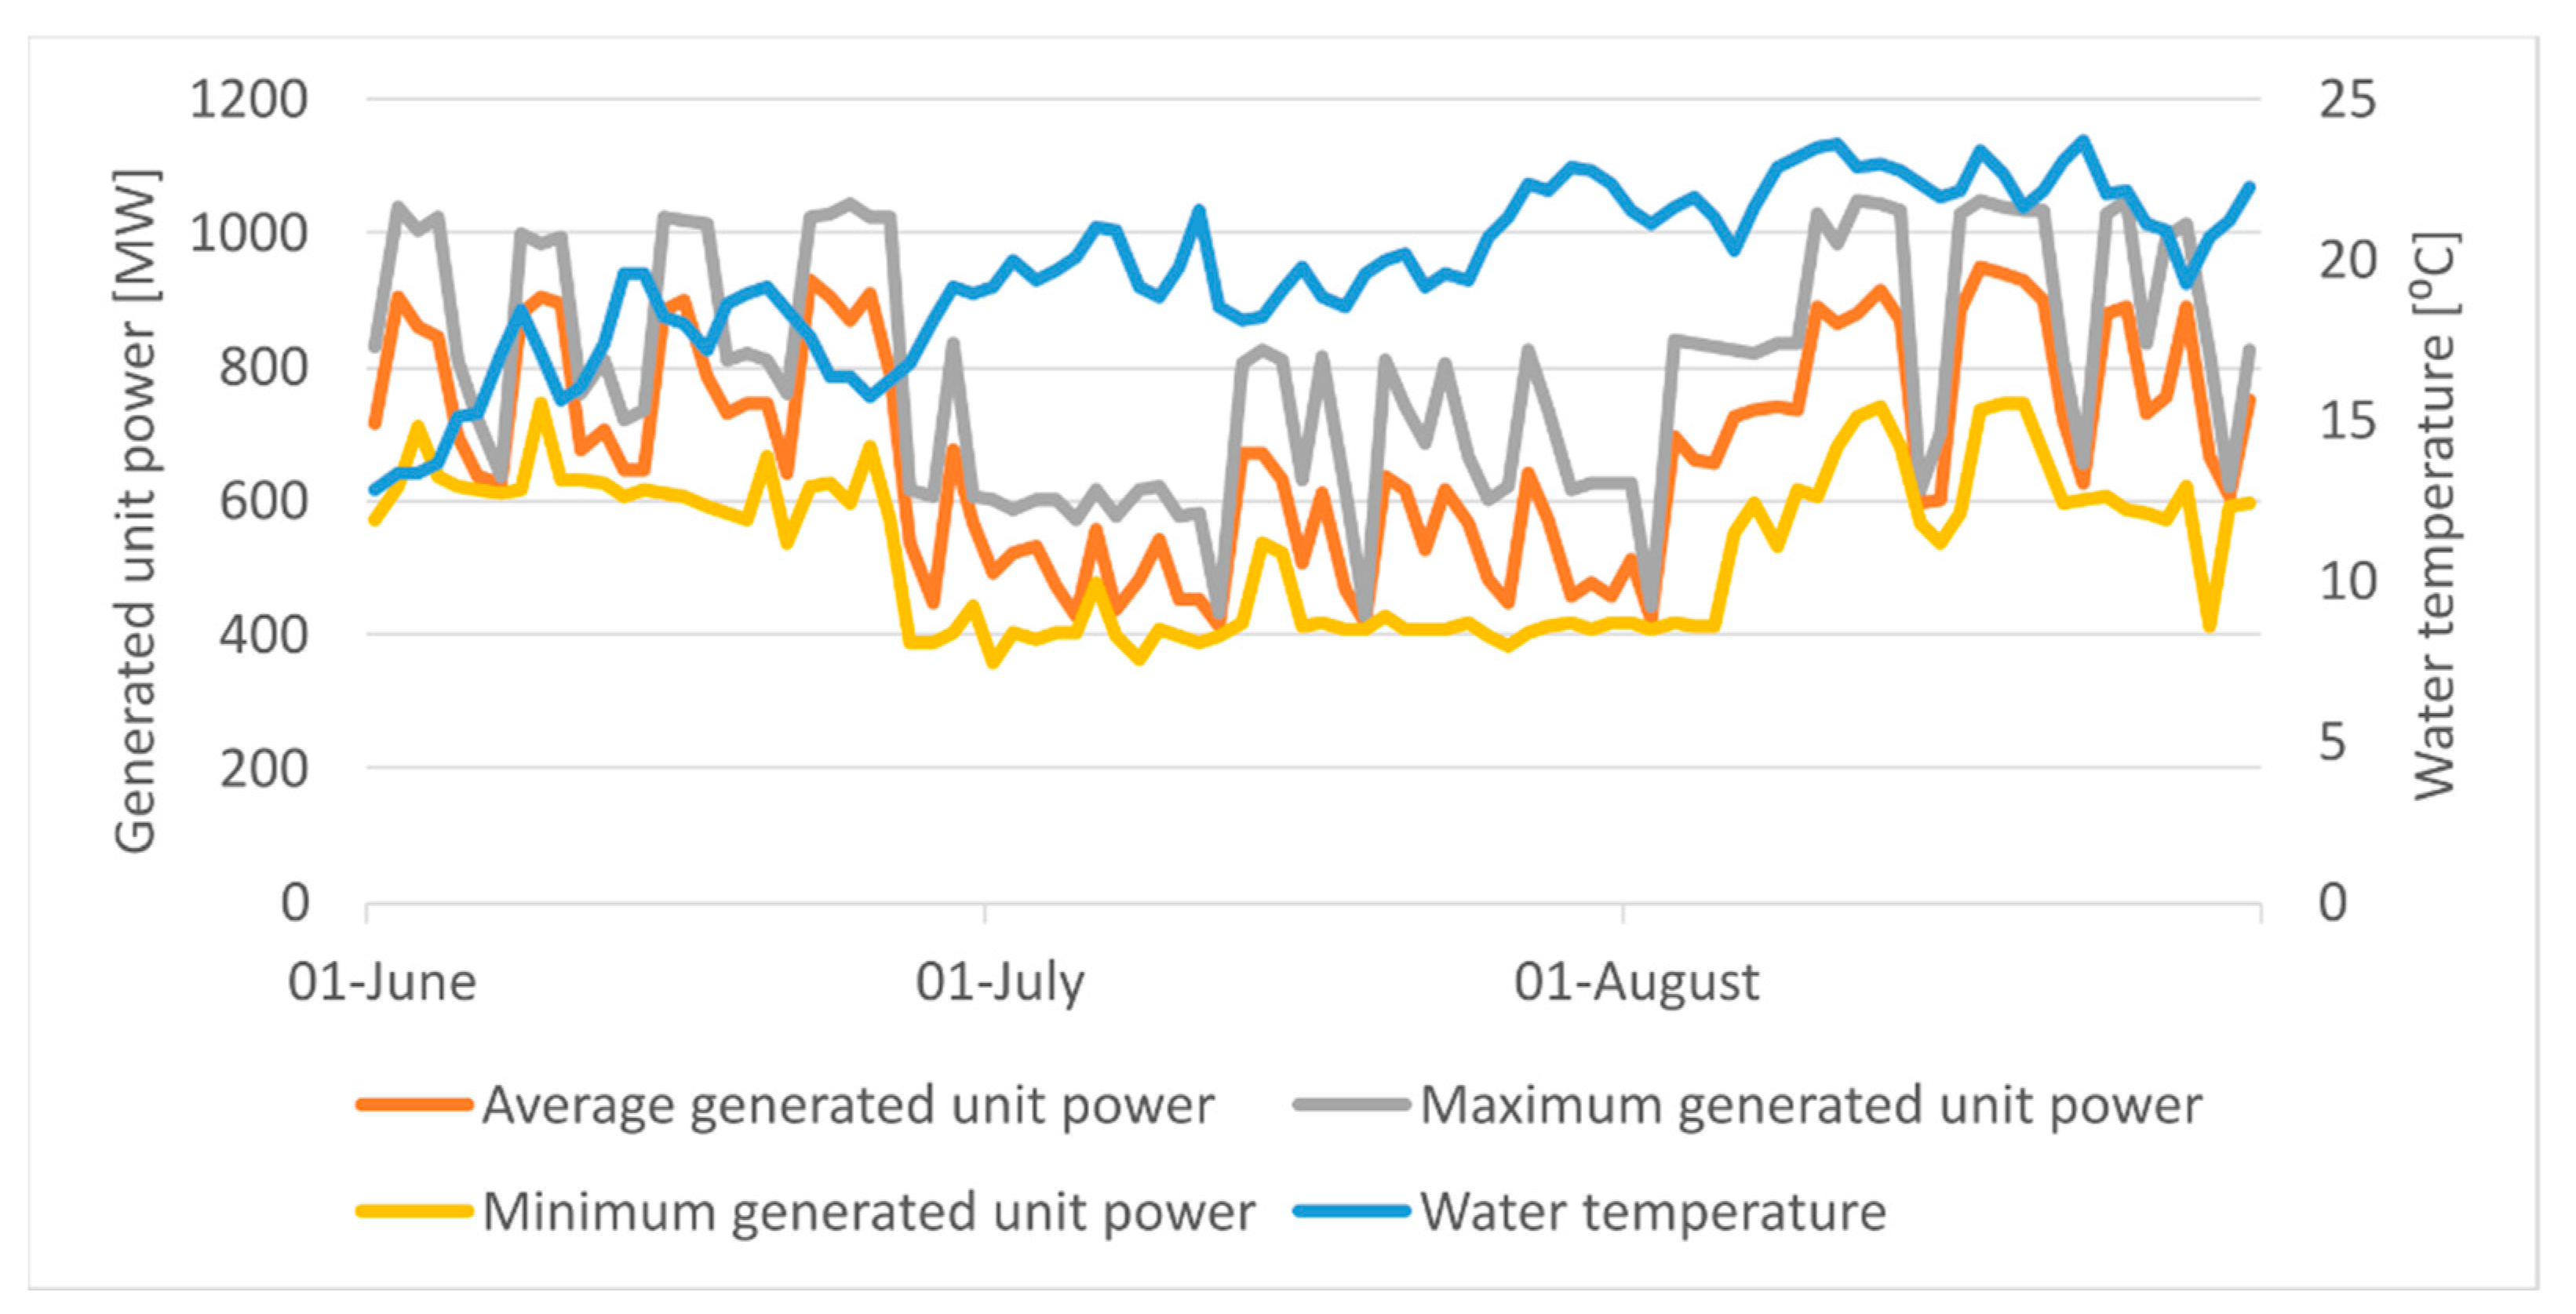
Summer Period of 2015

In the summer of 2015, the average daily capacity generated at Połaniec power plant was from 750 to 1483 MW [28]. On the analyzed days, increases in the generated power up to a maximum of 1677 MW were observed, as well as drops to the minimum value of 480 MW.
The average daily flow in the Wisła River at the location of the Szczucin water gauge station in the analyzed period ranged from 128 to 283 m3 s−1 (Figure 11). The lowest values of the average daily flow were recorded in August. For most of the month, the flow did not exceed 2 times the SNQ value and 4 times the value of the intact flow (Figure 12). The highest flows occurred in June, often exceeding 200 m3 s−1.
The water level in the Wisła River at the Szczucin water gauge station in the period from 1 June to 31 August ranged from 176 to 263 cm (Figure 13). A correlation can be observed between the flow values and the water level, as in the case of the average flow, the highest water levels were recorded in June, while the lowest values took place in August.
In the analyzed summer period of 2015, the water temperature in the Wisła River at the location of the Szczucin water gauge station ranged from 14 to 26 °C (Figure 14). High water temperatures, exceeding 23 °C, were recorded both in July and August. As shown in Figure 15, the temperature of the river water and the air temperature are correlated with each other.
According to data from REMIT, in the three-month understudy in the Połaniec power plant, there were 16 power losses referred to as a forced event (Table 5). These events lasted from several hours to even several days, causing a total or partial loss of power of a given block. A failure is mentioned as the cause of a power loss several times. However, the obtained data lack further, more detailed information describing a given failure.

Summer Period of 2020

In the designated months of 2020, the average daily power generated in the power plant was from 415 to 949 MW [28]. Both increases in generated power above 1000 MW and drops below 400 MW were recorded during the analyzed days.
In the selected period, the average daily flow in the Wisła River ranged from 84 to 1450 m3 s−1 (Szczucin water gauge station) (Figure 16). The lowest values of the average daily flow were recorded in August when in the middle of the month the flows almost equaled the SNQ and were slightly more than twice the value of the inviolable flow (Figure 17). The highest flows took place in June, while during the floods on the river, they exceeded values of 1000 m3 s−1.
The water level in the Wisla River from 1 June to 31 August ranged from 92 to 575 cm (Szczucin water gauge station) (Figure 18). There is a clear correlation between the flow values and the water level. As in the case of the average flow, the highest water levels were recorded in June (when the warning level was exceeded), while the lowest values took place in August.
In the analyzed summer period of 2020, the water temperature in the Wisła River ranged from 13 to 24 °C (Szczucin water gauge station) (Figure 19). The highest water temperature was in August. As shown in Figure 20, the temperature of the water in the river and the air temperature are correlated.
Based on the REMIT data, it can be noticed that during the three-month understudy, the Połaniec power plant experienced a power loss called a forced event eight times (Table 6). These events usually lasted from several hours to even several days (the exception is one of the blocks that did not generate power for the entire analyzed period). They resulted in a total or partial power loss of a given block. Unfortunately, the obtained data lack detailed information on the cause of the power loss, mentioning several times that there is a failure.

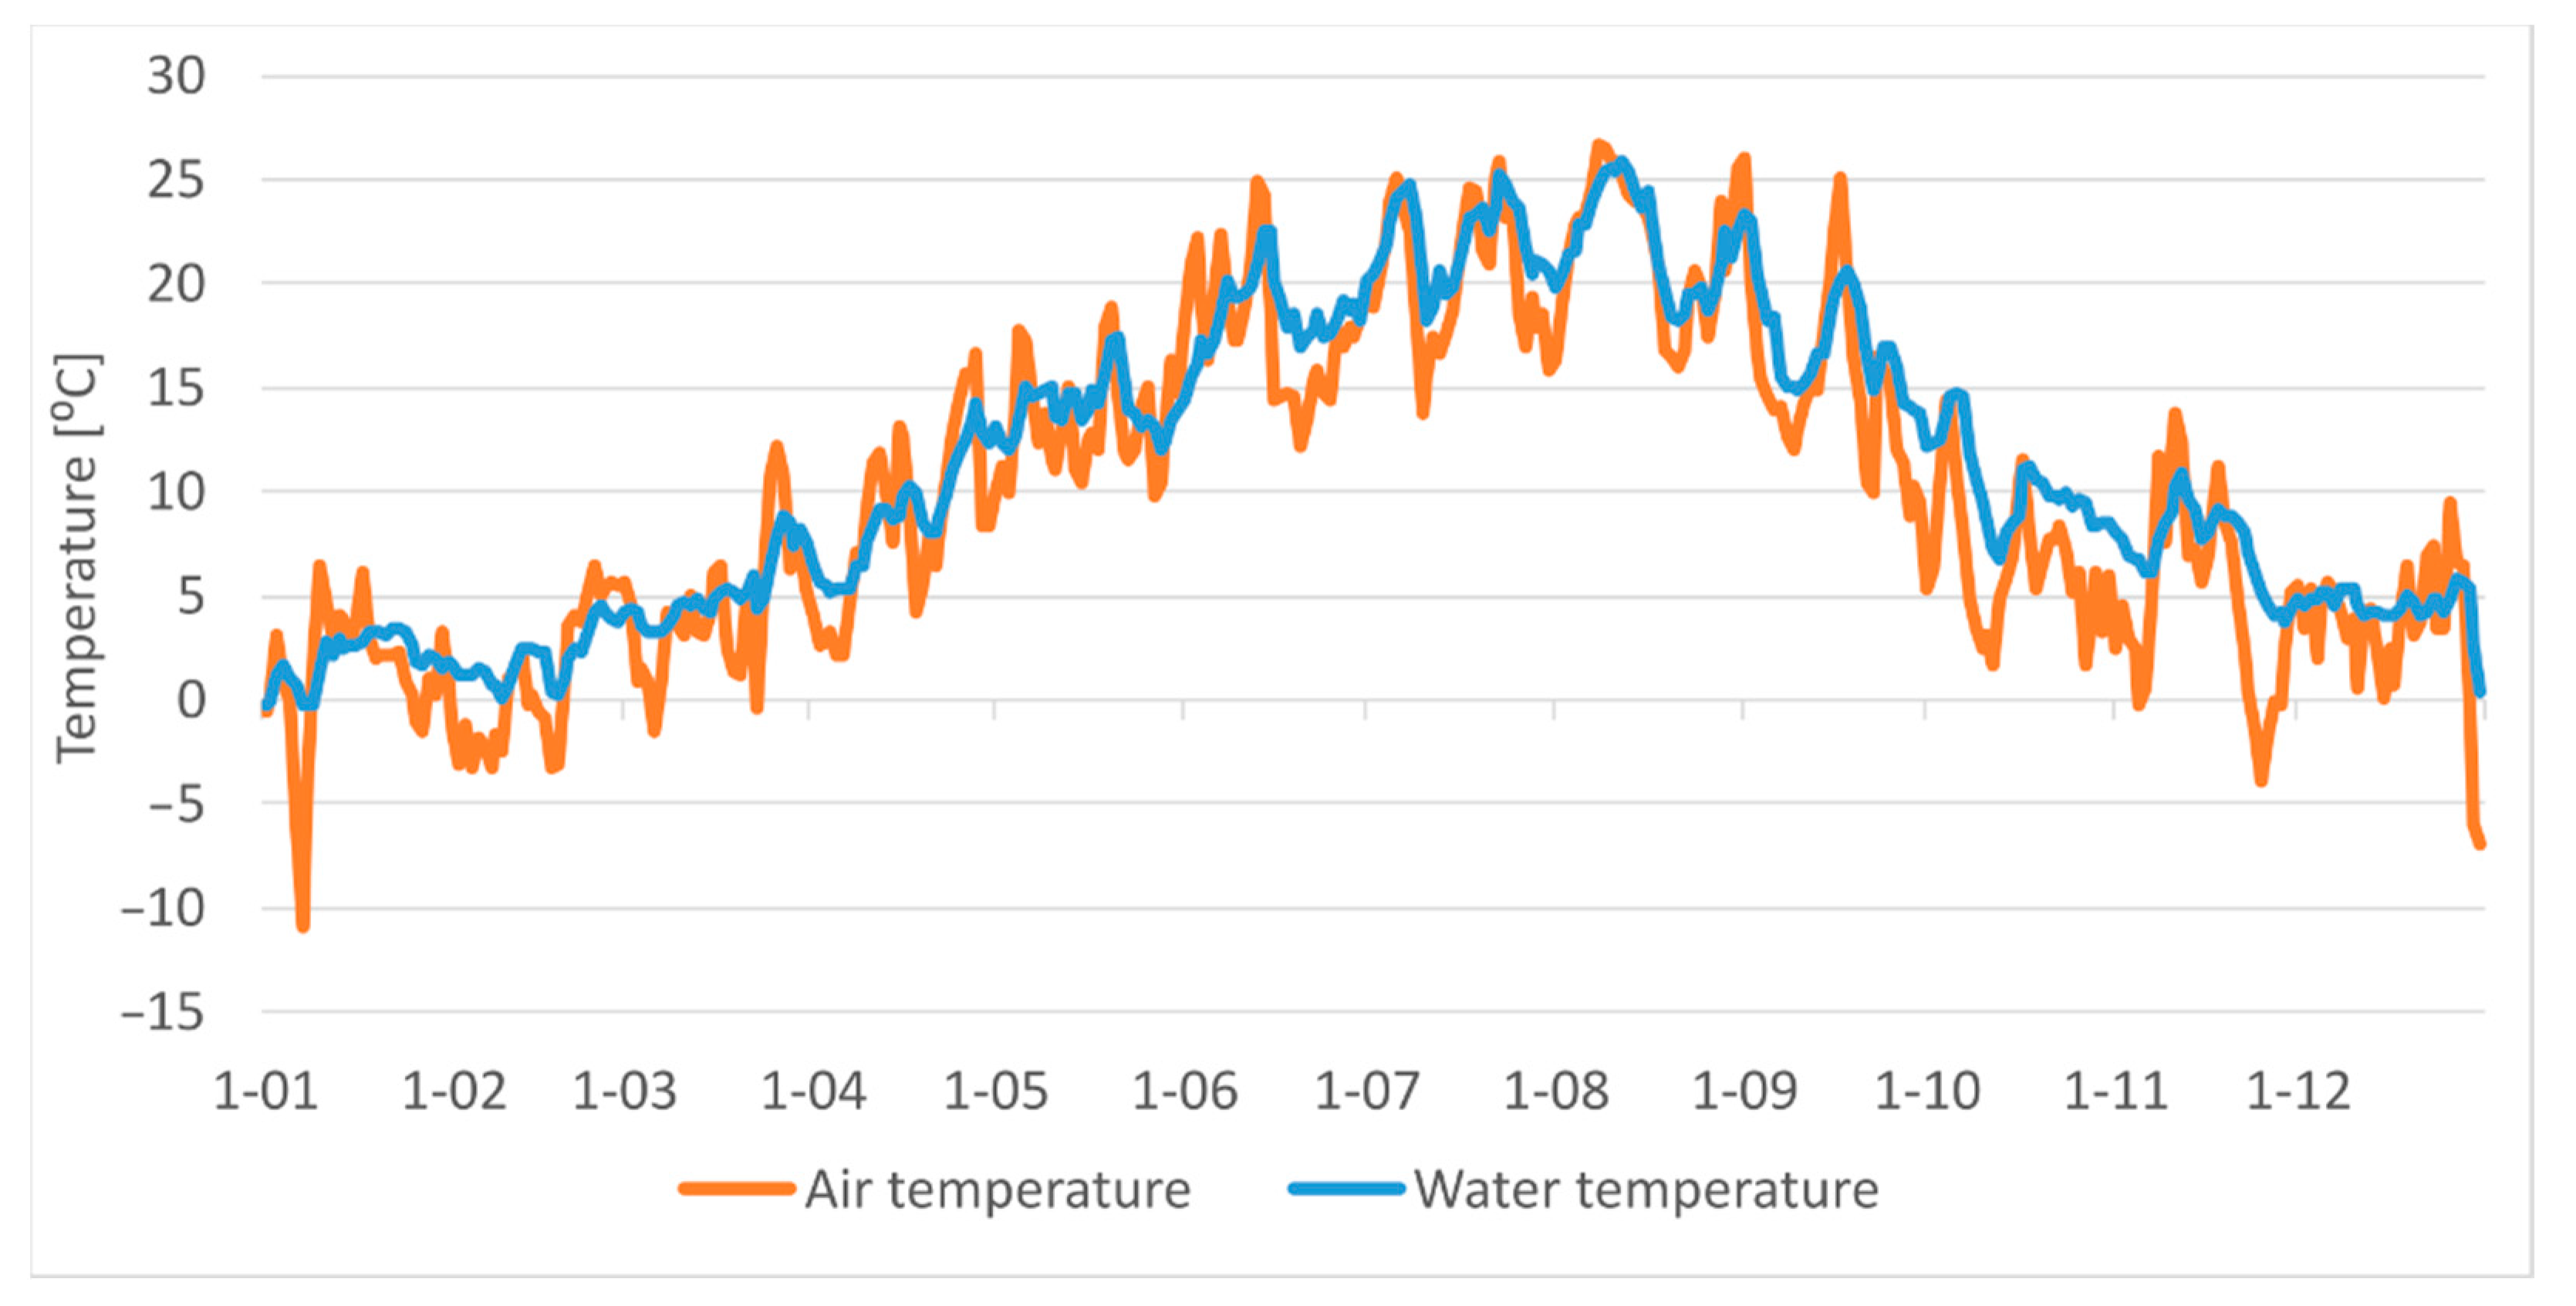
3.3. The Impact of Climate Change

The modeling results [22] of the impact of climate change do not show significant changes in the runoff of surface waters until 2030 (Figure 21). The decrease for the annual mean values in the A2 scenario does not exceed 10%. The analysis of changes for the winter and summer half-years suggests that more significant changes may occur in the time distribution. It is possible to distinguish areas with an increase in resources in the winter to 10% and a decrease in the summer half. It should be emphasized, however, that even a small average reduction in water resources presented in the form of changes per year may, concerning a specific situation and overlapping unfavorable phenomena, result in a risk of water shortage, which has already been confirmed by cases that occurred in the past, including in 2015.

4. Discussion

The results of the survey indicated that two thermal power plants (Dolna Odra and Połaniec) underlined periodic problems with the use of water for cooling purposes, but only one of them (Połaniec) mentions low water levels as the cause. The analysis of the number of days in which the daily flow in the river reaches a value equal to or lower than the SNQ in the water gauge sections corresponding to the water intake locations for four tested power plants shows that the highest number of days with such flow was recorded for the Dolna Odra power plant in the analyzed period. With the SNQ value of 242 m3 s−1, the number of days is 676. The location of the power plant in the lower reaches of the river contributes to the guarantee of its operation even in the case of long-lasting low flows. This is confirmed by the results of the survey. Cooling water for the power plant, the capacity of which is 908 MW, is taken up to 55.44 m3 s−1 from the Odra River using an intake and supplied to two pumping stations through an open channel, while the average monthly flows in the river in the 2010–2020 period range from 146 m3 s−1 to 1592 m3 s−1. At the same time, it should be emphasized that the latter value applies to the period in 2010 when the flood occurred in Poland.
In the case of the Połaniec power plant, the number of days in which the daily flow in the Wisła River reaches a value equal to or lower than the SNQ (78.6 m3 s−1) is 143. The power plant is exposed to water shortages, which was confirmed by the survey results. Modernization of the installation enables the maximum water consumption of 66.288 m3 s−1. However, attention should be paid to the more unfavorable relation of the maximum consumption to the SNQ value than in the case of the Dolna Odra power plant, which illustrates the risks associated with water shortage. It is true that the upper Wisła basin, in which the Połaniec power plant is located, is distinguished among Polish rivers as having considerable water resources, but they are unevenly distributed in space and very variable over time. The variability of the Carpathian, southern tributaries of the upper Wisła is also, in extreme cases, several dozen times greater than in the rest of Poland. An example is the Soła River for which the value of minimum flows reaches 0.80 m3 s−1, average flows 17.7 m3 s−1, and maximum flows 1,450 m3 s−1. On the other hand, the left-bank non-Carpathian tributaries of the upper Wisła River are less variable, but their water resources are local. An example is the Czarna Nida River, the minimum flow of which is 0.50 m3 s−1, the average flow is 5.3 m3 s−1, and the maximum flow is 260 m3 s−1. [29]. In the plans of the last century concerning the implementation of the waterway along the entire section of the upper Wisła, the high variability of flows and, consequently, the depth shortening the navigation period and causing potential interruptions were emphasized.
In perspective, the waterway, through the construction of a dozen or so steps, was also to ensure the supply of coal from the Silesia region to the already existing power plant in Połaniec, at the same time leveling the impact of unfavorable depths on the possibility of water intake due to damming up by steps [30].
Since the withdrawal of the use of fossil fuels is necessary due to climate change and European agreements in this area, and as the recurring ideas for the implementation of the upper Wisła waterway, according to the authors, do not have economic and ecological justification, the Połaniec power plant will face the problems of shortages of water until the end of its operation. Moreover, the implemented river regulation has a negative impact on the aquatic environment and water-dependent ecosystems [31].
During the three-month analyzed summer periods of 2015 and 2020, significant daily fluctuations in the generated power at the Połaniec power plant can be noticed. Changes in the generated power in a power plant have an amplitude often reaching several hundred MW. However, it is not possible to directly indicate the correlation between the flow, water level, water temperature, and the generated power in a power plant based on the obtained data.
The expected answer is also not provided by the data published under the REMIT system, as they lack detailed information on the cause of individual power losses. The lack of correlation can be explained by the installed damming shell weir stabilizing the river level, which ensures the uninterrupted operation of the power plant. Currently, it performs its function practically throughout the summer season. The aforementioned weir, to a limited extent, replaces the planned damming within the upper Wisła waterway. The weir was installed along the entire width of the river bed, and the damming weir is 51 m long and is filled with cooling water. The use of a weir improves the operating conditions of cooling pumps by raising the water level to approximately −0.8 m in the river. In the area of the weir, about 15 m in front of the weir and about 75 m behind the weir, measuring instruments have been installed to assess the level of damming of the river, as well as the water flow behind the weir due to the requirements of the water permit and leaving inviolable flow in the river.
However, it should be emphasized that the introduction of such an emergency solution in the form of a damming weir was possible because the Wisła River in this section is not navigable, as the previous plans for the construction of the upper Wisła waterway were not implemented.
The functioning of the weir in such a form restricts water tourism and small navigation. For safety reasons, especially for small vessels, in front of the damming weir, additional information and warnings about the potential hazard related to the filling of the damming weir are applied. For small navigation (canoe, pontoon), crossing the weir is possible on the right bank of the Wisła River. Within the weir there is a place prepared for safely getting out of the water and bypassing the existing construction. Large vessels are transported by power plant workers. In extreme cases, the weir is deactivated for the largest units. To ensure the migration of fish in the river during certain months at night, the damming of the water at the weir is kept at a maximum height of 40–50 cm [32].
In the case of the analysis of the correlation between the water temperature and the generated power, a problem may occur when the temperature of the water drawn is close to the limit of 25 °C (such cases have been reported). In the cooling system, the water is heated by an average of several degrees, and after discharge, the water in the river cannot be more than 35 °C. Therefore, to ensure that the water in the river does not reach the temperature of 35 °C, a whole system of special sprinklers was installed, which release the heated water to a height of up to 7 m [25].

5. Conclusions

Energy production and consumption account for 75% of the EU’s emissions, so accelerating the transition to a greener energy system that also reduces the energy needs of water is essential. The Renewable Energy Directive, as part of the Fit for 55 package [33], will set an increased target whereby 40% of energy should be produced from renewable sources by 2030.
Regardless of this package, taking into account climate change, it should be noted that the lifetime of new generation units in the energy sector is about 40 years. It means that even today, the energy sector in the area outside renewable sources must be at the planning stage, anticipate future changes in heat energy using water resources for cooling purposes, and plan technological solutions to meet future needs and legal regulations. Therefore, power plants and combined heat and power plants in Poland adopt new units of energy generation capacity for these challenges and implement closed cooling circuits, although they are 40% more expensive than open cooling circuits [34]. This course of action also necessitates conclusions regarding water resources resulting from climate change up to 2030. The values contained in them are hypothetical and included in broad percentage ranges but indicate a dangerous loss of stability in the water resource system in rivers manifested by increased seasonal changes. The results show that the changes in the precipitation regime will mainly concern the temporal distribution of precipitation with slight changes in the annual mean values. However, taking into account that Poland is poor in water, these changes may cause problems in areas where the water resource utilization rate is already high today.
It is worth emphasizing that regardless of the availability of water resources in Poland for cooling purposes, old coal-cooled units should be systematically put out of operation and replaced with modern units. For technological purposes, combined heat and power plants and water cooling towers are most often used as solutions that are the simplest in operation and cheap to operate. Cooling towers draw water from outside. The water is used to replenish some of the water lifted in the air during the cooling process and to make up for losses caused by some of the water evaporating during the cooling process. The advantage of cooling towers is that they can be located anywhere, which reduces the costs of transport or fuel transmission and increases the reliability of operation related to delays or problems with the water legal permit for the use of water.
Single cases of power plants taking water directly from rivers, such as the discussed Połaniec, may have problems related to the temperature of discharged water at low water levels, and this problem may increase in the following years. The discharge of heated cooling water to a reservoir such as a river, lake, or sea results primarily in the disturbance of biological life, especially of fish living in the vicinity of heated water discharged from the combined heat and power plant. It also has an economic impact on the energy sector, which bears fees for the discharge of heated water above the permissible value. The damming weir applied at the level of the Połaniec power plant is folded out for practically the entire summer season. On the one hand, it solves the problem of the low water level in the river at the water intake point. On the other hand, it hinders water movement and fish migration. A similar situation occurs in the case of the Kozienice barrage. Environmentalists and non-governmental organizations demand the elimination of this damming there, pointing to the fact that the open cooling system causes enormous losses in the ichthyofauna.
It is worth emphasizing a noticeable lack of precise, generally available data. The published messages are very general. The data in the messages are ambiguous as to the causes of failures or power losses, and the above-mentioned reasons related to the deficit of water resources are not mentioned among them. It is emphasized that the energy transformation in Poland has no alternative. Fossil fuel-based energy is to be replaced, among others, by nuclear power. The final location of the first installation must take into account the long-term availability of water resources. As part of the work on PEP2040, a strategic environmental impact assessment was carried out, which analyzed the possible impacts of the directions presented in the Policy on selected elements of the environment, including, but not limited to: people, animals, water, air, climate. As a result of the analysis, it was found that the least negative environmental impacts will be associated with the development of nuclear and renewable energy. In turn, the most significant impact will be activities related to the use of coal, assuming no technological breakthrough in the field of clean coal technologies. Unfortunately, PEP2040 lacked detailed analyses of water resources necessary for cooling purposes. It should be assumed that such detailed studies will be carried out shortly. However, it should be stressed that the water resources of the Wisła River, even in the lower reaches, are not sufficient for future nuclear power plants to cool reactors in an open system. Therefore, the possibility of using only closed cooling cycles should be assumed [35].

Author Contributions

Conceptualization, T.W. and M.Ż.; Methodology, T.W. and M.Ż.; Software, M.Ż.; Validation, T.W.; Formal Analysis, T.W. and M.Ż; Investigation, T.W. and M.Ż.; Resources, T.W. and M.Ż.; Data Curation, T.W. and M.Ż.; Writing—Original Draft Preparation, T.W. and M.Ż.; Writing—Review and Editing, T.W. and M.Ż.; Visualization, M.Ż.; Supervision, T.W; Project Administration, T.W.; Funding Acquisition, T.W. All authors have read and agreed to the published version of the manuscript.

Funding

Subsidy from the Minister of Education and Science. Project DS-6 “Adaptive planning and management of water resources in the light of climate change” and the project “Impact of the climate change on the environment, economy and society (changes, impacts, ways of limitation, proposals for science, engineering in practice and economy planning)” were used (grant agreement No. POIG.01.03. 01-14-011/08-00 of 1 December 2008, as part of the Innovative Economy Operational Program, Project 1, Measure 1.3, Sub-measure 1.3.1).

Institutional Review Board Statement

Not applicable.

Informed Consent Statement

Not applicable.

Data Availability Statement

The data that support the findings of this study are available on request from the corresponding author.

Conflicts of Interest

The authors declare no conflict of interest.

References

  1. IPCC. Summary for Policymakers. In Climate Change 2021: The Physical Science Basis—Summary for Policymakers; Contribution of Working Group I to the Sixth Assessment Report of the Intergovernmental Panel on Climate Change; Masson-Delmotte, V., Zhai, P., Pirani, A., Connors, S.L., Péan, C., Berger, S., Caud, N., Chen, Y., Goldfarb, L., Gomis, M.I., et al., Eds.; Cambridge University Press: Cambridge, UK, 2021; Available online: https://www.ipcc.ch/report/ar6/wg1/#SPM (accessed on 10 March 2022).
  2. Wereski, S.; Pawelec, W. (Eds.) Bulletin of the National Hydrological and Meteorological Service Year 2019; Instytut Meteorologii i Gospodarki Wodnej Państwowy Instytut Badawczy: Warszawa, Poland, 2019. [Google Scholar]
  3. Bronk, L.; Czarnecki, B.; Magulski, R. Elastyczność Krajowego Systemu Elektroenergetycznego; Diagnoza, Potencjał, Rozwiązania; Forum Energii: Warszawa, Poland, 2019; Available online: https://www.cire.pl/pliki/1/2019/elastycznosc_kse.pdf (accessed on 10 March 2022).
  4. Li, Z.; Su, S.; Jin, X.; Chen, H.; Li, Y.; Zhang, R. A hierarchical scheduling method of active distribution network considering flexible loads in office buildings. Int. J. Electr. Power Energy Syst. 2021, 131, 106768. [Google Scholar] [CrossRef]
  5. Majewski, W. Woda w Inżynierii Środowiska; Instytut Meteorologii i Gospodarki Wodnej Państwowy Instytut Badawczy: Warszawa, Poland, 2017. [Google Scholar]
  6. Statistics Poland (GUS). Environment 2020; GUS: Warszawa, Poland, 2020. Available online: https://stat.gov.pl/en/topics/environment-energy/environment/environment-2020,1,12.html (accessed on 10 March 2022).
  7. Statistics Poland (GUS). Local Data Bank; GUS: Warszawa, Poland, 2022. Available online: https://bdl.stat.gov.pl/BDL/start (accessed on 10 March 2022).
  8. Wawręty, R.; Cebula, M. Identyfikacja Głównych Problemów Prawnych w Zakresie Odprowadzania wód Pochłodniczych w Polsce; Towarzystwo na Rzecz Ziemi: Oświęcim, Poland, 2020. [Google Scholar]
  9. PEP 2040. Energy Policy of Poland until 2040; Ministry of Climate and Environment: Dubai, United Arab Emirates, 2021. Available online: https://www.gov.pl/web/klimat/polityka-energetyczna-polski-do-2040-r-przyjeta-przez-rade-ministrow (accessed on 10 March 2022).
  10. PGE Dystrybucja S.A. Ograniczenia w Dostarczaniu i Poborze Energii Elektrycznej. Available online: https://pgedystrybucja.pl/o-spolce/aktualnosci/Lodz/Ograniczenia-w-dostarczaniu-i-poborze-energii-elektrycznej (accessed on 10 March 2022).
  11. Węglewski, M. Moc nie Będzie z Nami. 2018. Available online: https://www.newsweek.pl/biznes/rynek-energii-ogarnelo-szalenstwo-beda-wyzsze-rachunki/dwpb4vq (accessed on 10 March 2022).
  12. Byers, E.A.; Coxon, G.; Freer, J.; Hall, J.W. Drought and climate change impacts on cooling water shortages and electricity prices in Great Britain. Nat. Commun. 2020, 11, 2239. [Google Scholar] [CrossRef] [PubMed]
  13. Liao, X.W.; Hall, J.W.; Hanasaki, N.; Lim, W.H.; Paltan, H. Water shortage risks for China’s coal power plants under climate change. Environ. Res. Lett. 2021, 16, 044011. [Google Scholar] [CrossRef]
  14. Whieldon, E.; Taylor, K. Climate Change Poses Big Water Risks for Nuclear, Fossil-Fueled Plants. 2020. Available online: https://www.spglobal.com/marketintelligence/en/news-insights/latest-news-headlines/climate-change-poses-big-water-risks-for-nuclear-fossil-fueled-plants-60669992 (accessed on 10 March 2022).
  15. Baca-Pogrzelska, K. As Poland Faces Another Drought, Its Energy Sector Is Better Prepared to Avoid Outages. 2020. Available online: https://notesfrompoland.com/2020/06/15/as-poland-faces-another-drought-its-energy-sector-is-better-prepared-to-avoid-outages/ (accessed on 10 March 2022).
  16. IMGW-PIB, Public Data. Available online: https://danepubliczne.imgw.pl/data/dane_pomiarowo_obserwacyjne/dane_hydrologiczne/dobowe/ (accessed on 10 March 2022).
  17. World Meteorological Organization (WMO). Manual on Stream Gauging Volume I—Fieldwork WMO-No. 1044; WMO: Geneva, Switzerland, 2010; Available online: https://library.wmo.int/doc_num.php?explnum_id=219 (accessed on 10 March 2022).
  18. Product Data Sheet PDB AO 19. 2020. Available online: https://www.lawa.de/documents/lawa_empfehlung_mindestwasserfuehrung_ausleitungsstrecken_wasserkraftanlagen_2_1610718961.pdf (accessed on 10 March 2022).
  19. Directive 2000/60/EC of the European Parliament and of the Council of 23 October 2000 Establishing a Framework for Community Action in the Field of Water Policy. Available online: https://eur-lex.europa.eu/resource.html?uri=cellar:5c835afb-2ec6-4577-bdf8-756d3d694eeb.0004.02/DOC_1&format=PDF (accessed on 10 March 2022).
  20. Hirji, R.; Davis, R. Environmental Flows in Water Resources Policies, Plans, and Projects: Findings and Recommendations; The World Bank: Washington, DC, USA, 2009. [Google Scholar]
  21. Kostrzewa, H. Weryfikacja Kryteriów i Wielkości Przepływu Nienaruszalnego dla rzek Polski; Instytut Meteorologii i Gospodarki Wodnej Państwowy Instytut Badawczy: Warszawa, Poland, 1977. [Google Scholar]
  22. Majewski, W.; Walczykiewicz, T. (Eds.) Zrównoważone Gospodarowanie Zasobami Wodnymi Oraz Infrastrukturą Hydrotechniczną w Świetle Prognozowanych Zmian Klimatycznych; Instytut Meteorologii i Gospodarki Wodnej Państwowy Instytut Badawczy: Warszawa, Poland, 2012. [Google Scholar]
  23. Bulletins of the National Hydrological and Meteorological Service, Years 2010–2020; Instytut Meteorologii i Gospodarki Wodnej Państwowy Instytut Badawczy: Warszawa, Poland, 2020.
  24. ENEA S.A. Website—Information about Company. Available online: https://www.enea.pl/pl/grupaenea/o-grupie/spolki-grupy-enea/polaniec/informacje-o-spolce/wstep (accessed on 10 March 2022).
  25. Zapała, B. Osiem Turbin Wytwarza Ponad 5 Procent Energii w Polsce. Wisła w Połańcu. 2017. Available online: https://www.radio.kielce.pl/pl/post-60208 (accessed on 10 March 2022).
  26. Regulation (EU) No 1227/2011 of the European Parliament and of the Council of 25 October 2011 on Wholesale Energy Market Integrity and Transparency. Available online: https://eur-lex.europa.eu/legal-content/EN/TXT/PDF/?uri=CELEX:32011R1227&from=PL (accessed on 10 March 2022).
  27. ENTSOE Transparency Platform. Available online: https://transparency.entsoe.eu/ (accessed on 10 March 2022).
  28. PSE S.A. Polish Power System Operation—Production. Available online: https://www.pse.pl/dane-systemowe/funkcjonowanie-kse/raporty-dobowe-z-pracy-kse/generacja-mocy-jednostek-wytworczych (accessed on 10 March 2022).
  29. Dynowska, I.; Maciejewski, M. (Eds.) Dorzecze Górnej Wisły; PWN: Warszawa-Kraków, Poland, 1991. [Google Scholar]
  30. Piskozub, A. Wisła: Monografia Rzeki; WKiŁ: Warszawa, Poland, 1982. [Google Scholar]
  31. Witkowski, K. The Galician Canal—An unrealized project that changed the rivers in the northern part of the Carpathians. River Res. Appl. 2021, 37, 1343–1356. [Google Scholar] [CrossRef]
  32. ENEA, S.A. Information for the Water Tourists. Available online: https://www.enea.pl/pl/grupaenea/o-grupie/spolki-grupy-enea/polaniec/informacja-dla-turystow-wodnych (accessed on 10 March 2022).
  33. Communication from the Commission to the European Parliament, the Council, the European Economic and Social Committee and the Committee of the Regions, ‘Fit for 55’: Delivering the EU’s 2030 Climate Target on the Way to Climate Neutrality. Available online: https://eur-lex.europa.eu/legal-content/EN/TXT/PDF/?uri=CELEX:52021DC0550&from=PL (accessed on 10 March 2022).
  34. World Nuclear Association. Cooling Power Plants. 2020. Available online: https://www.world-nuclear.org/information-library/current-and-future-generation/cooling-power-plants.aspx (accessed on 10 March 2022).
  35. Kiełbasa, W. Lokalizacja Elektrowni Jądrowych w Polsce; Hydroenergo: Wejherowo, Poland, 2009; Available online: http://www.if.pw.edu.pl/~pluta/pl/dyd/mtj/zal2/CD_II_SZKOLA/III.%20MOZLIWOSCI_I_ZADANIA/7_W_Kielbasa_lokalizacja_elektrowni.pdf (accessed on 10 March 2022).
Figure 1. Power plants with an open cooling circuit.
Energies 15 03600 g001
Figure 2. Precipitation and outflow from the area of Poland in the multi-year period 2010–2020 [23].
Energies 15 03600 g002
Figure 3. The flow of the Wisła River at the Szczucin water gauge station in the hydrological years 2010–2020.
Energies 15 03600 g003
Figure 4. Flow values lower than or equal to the SNQ value.
Energies 15 03600 g004
Figure 5. The flow of the Odra River at the location of the Gozdowice water gauge station in the hydrological years 2010–2020.
Energies 15 03600 g005
Figure 6. Flow values lower than or equal to the SNQ value.
Energies 15 03600 g006
Figure 7. The flow of the Wisła River at the location of the Dęblin water gauge station in the hydrological years 2010–2020.
Energies 15 03600 g007
Figure 8. Flow values lower than or equal to the SNQ value.
Energies 15 03600 g008
Figure 9. The flow of the Narew River at the Nowogród water gauge station in the hydrological years 2010–2020.
Energies 15 03600 g009
Figure 10. Flow rates lower than or equal to the SNQ value.
Energies 15 03600 g010
Figure 11. Diagram of the average daily water flow in the Wisła River (Szczucin) along with the minimum, average, and maximum daily power generated in the Połaniec power plant.
Energies 15 03600 g011
Figure 12. Relative water flow in the Wisła River (Szczucin) about the SNQ and Qn index.
Energies 15 03600 g012
Figure 13. Diagram of the average daily water level in the Wisła River (Szczucin) with the minimum, average, and maximum daily power generated in the Połaniec power plant.
Energies 15 03600 g013
Figure 14. Water temperature diagram in the Wisła River (Szczucin) with the minimum, average, and maximum daily power generated in the Połaniec power plant.
Energies 15 03600 g014
Figure 15. Water temperature diagram in the Wisła River (Szczucin) and air temperature.
Energies 15 03600 g015
Figure 16. Diagram of the average daily water flow in the Wisła River (Szczucin) with the minimum, average, and maximum daily power generated in the Połaniec power plant.
Energies 15 03600 g016
Figure 17. Relative water flow in the Wisła River (Szczucin) concerning the SNQ and Qn index.
Energies 15 03600 g017
Figure 18. Diagram of the average daily water level in the Wisła River (Szczucin) with the minimum, average, and maximum daily power generated in the Połaniec power plant.
Energies 15 03600 g018
Figure 19. Water temperature diagram in the Wisła River (Szczucin) with the minimum, average, and maximum daily power generated in the Połaniec power plant.
Energies 15 03600 g019
Figure 20. Diagram of water temperature in the Wisła River (Szczucin) and air temperature.
Energies 15 03600 g020
Figure 21. Results of climate change impact modeling—scenario A2.
Energies 15 03600 g021
Table 1. Power plants with an open cooling circuit.
Power PlantAchievable Power (MW)Source of Surface Water Intake
Połaniec1882Wisła River
Kozienice4016Wisła River
Dolna Odra908Odra River
Ostrołęka690Narew River
Table 2. Characteristics of the IMGW-PIB water gauge stations located above the power plant.
Power PlantName of the Water Gauge StationCode of the Water Gauge StationRiverSNQ (m3 s−1)Calculation Period for Flow Characteristics
PołaniecSzczucin150210020Wisła78.61951–2020
KozieniceDęblin151210120Wisła1831971–2020
Dolna OdraGozdowice152140020Odra2421951–2020
OstrołękaNowogród153210210Narew38.41951–2020
Table 3. Average monthly flows of the Wisła River in the estuary profile in 2010–2020 [23].
Month in the Hydrological YearAverage Monthly Flow in the Hydrological Year (m3 s−1)
20102011201220132014201520162017201820192020
XI1282135458767878770252710401620530491
XII925143162755588767869211601660576472
I1065256377780386910185928651550943699
II9182082866150011851032112085815101130871
III2529152413661490123410891450195011301120983
IV19171371126022201026106096313101410773567
V287710309141680148080185315508171070508
VI3170684837186010648595417025091160928
VII110613206991190932458510608654446928
VIII14791684514630954368 *584530628401 *493
IX2201782459590751328 *433836432338 *505
X127661352272374143976812704234221040
* Flow below the SNQ value in the multi-annual period 1951–2015 (419 m3 s−1).
Table 4. Average monthly flows of the Odra River in the estuary profile in 2010–2020 [23].
Month in the Hydrological YearAverage Monthly Flow in the Hydrological Year (m3 s−1)
20102011201220132014201520162017201820192020
XI458734318390391403222 *397718225 *223 *
XII454947353437439350265490720257237 *
I4581412555551453524303454839440269
II4961134566778454494369401759473361
III1008796813781406421525701551507444
IV881652556809443455482528522346280
V929461424746440311323628347334215 *
VI15923213211070459235 *245 *313227 *327291
VII429440413794286200 *244 *295208 *160 *291
VIII621616301402291152 *265361179 *144 *235 *
IX701397299365384146 *205 *383171 *174 *281
X853346301429409170 *312553202 *218 *581
* Flow below the SNQ value in the multi-annual period 1951–2015 (246 m3 s−1).
Table 5. Power losses in the Połaniec power plant, June–August 2015 [27].
NatureUnavailability PeriodUnit NameCapacity
Start–End (CET/CEST)Installed (MW)Available (MW)
Forced Outage9 June 2015 04:41–9 June 2015 11:01Połaniec B42420
11 June 2015 20:43–12 June 2015 01:30Połaniec B22420
12 June 2015 07:11–14 June 2015 22:30Połaniec B42420
17 June 2015 17:14–20 June 2015 18:31Połaniec B42420
22 June 2015 15:03–23 June 2015 18:16Połaniec B22420
20 June 2015 00:00–26 July 2015 04:31Połaniec B32420
23 June 2015 13:45–23 July 2015 15:00Połaniec B2242120
25 June 2015 03:13–25 July 2015 13:00Połaniec B52250
25 June 2015 14:31–25 June 2015 17:00Połaniec B7239129
25 June 2015 19:00–25 June 2015 21:01Połaniec B62420
25 June 2015 20:55–26 June 2015 08:48Połaniec B62420
8 August 2015 18:54–8 August 2015 22:00Połaniec B72390
9 August 2015 02:26–9 August 2015 04:00Połaniec B3242105
10 August 2015 06:31–11 August 2015 01:31Połaniec B42420
12 August 2015 20:51–12 August 2015 22:15Połaniec B62420
30 August 2015 20:54–31 August 2015 06:28Połaniec B22420
Table 6. Power losses in the Połaniec power plant, June–August 2020 [27].
NatureUnavailability PeriodUnit NameCapacity
Start–End (CET/CEST)Installed (MW)Available (MW)
Forced outage22 February 2020 00:01–17 March 2021 06:00Połaniec B62420
13 June 2020 07:01–13 June 2020 19:45Połaniec B3242130
17 June 2020 14:55–21 June 2020 01:01Połaniec B42420
21 June 2020 17:31–21 June 2020 21:31Połaniec B42420
1 July 2020 00:34–4 July 2020 00:53Połaniec B42420
1 July 2020 09:11–1 July 2020 13:01Połaniec B52250
10 July 2020 07:01–11 July 2020 00:48Połaniec B32420
22 August 2020 09:31–22 August 2020 11:45Połaniec B3225142
Publisher’s Note: MDPI stays neutral with regard to jurisdictional claims in published maps and institutional affiliations.

