Article

Blockchain Technology Applied to Energy Demand Response Service Tracking and Data Sharing

European Commission, Joint Research Centre (JRC), Via E. Fermi 2749, I-21027 Ispra, Italy
*
Author to whom correspondence should be addressed.
Energies 2021, 14(7), 1881; https://doi.org/10.3390/en14071881
Submission received: 24 February 2021 / Revised: 19 March 2021 / Accepted: 23 March 2021 / Published: 29 March 2021

Abstract

:
Demand response (DR) services have the potential to enable large penetration of renewable energy by adjusting load consumption, thus providing balancing support to the grid. The success of such load flexibility provided by industry, communities, or prosumers and its integration in electricity markets, will depend on a redesign and adaptation of the current interactions between participants. New challenges are, however, bound to appear with the large scale contribution of smaller assets to flexibility, including, among others, the dispatch coordination, the validation of delivery of the DR provision, and the corresponding settlement of contracts, while assuring secured data access among interested parties. In this study we applied distributed ledger (DLT)/blockchain technology to securely track DR provision, focusing on the validation aspect, assuring data integrity, origin, fast registry, and sharing within a permissioned system, between all relevant parties (including transmission system operators (TSOs), aggregators, distribution system operators (DSOs), balance responsible parties (BRP), and prosumers). We propose a framework for DR registry and implemented it as a proof of concept on Hyperledger Fabric, using real assets in a laboratory environment, in order to study its feasibility and performance. The lab set up includes a 450 kW energy storage system, scheduled to provide DR services, upon a system operator request and the corresponding validations and verifications are done, followed by the publication on a blockchain. Results show the end to end execution time remained below 1 s, when below 32 requests/sec. The smart contract memory utilization did not surpass 1% for both active and passive nodes and the peer CPU utilization, remained below 5% in all cases simulated (3, 10, and 28 nodes). Smart Contract CPU utilization remained stable, below 1% in all cases. The performance of the implementation showed scalable results, which enables real world adoption of DLT in supporting the development of flexibility markets, with the advantages of blockchain technology.

1. Introduction

Landscape and State of the Art

The Clean energy for all Europeans Package (CEP), published in 2019 [1] by the European Union (EU), and the Green Deal strategy document [2], set the energy and climate ambitions for the 2030 horizon, and the regulatory framework to achieve these ambitions. The digitalization of the energy sector, citizen’s engagement and new technologies such as blockchain are paving the way to new business models and the way energy is perceived and traded.
The prompt growth in the deployment of distributed energy resources and prosumers in the smart grid has led to management problems, which become increasingly challenging to be efficiently addressed using centralized approaches. These distributed resources or assets, dispersed by nature, have led to a growing consensus towards decentralized management and control approaches and architectures [3,4]. Distributed ledger technologies (DLT), have hence gained attention in different applications in the energy sector, as shown in the literature [5,6], but with particular interest in energy trading and markets. In this regard, a wide covered topic is peer to peer trading through micro grid energy markets. Microgrid energy markets provide small-scale prosumers and consumers, with a market platform to trade locally generated energy within their community. Hence, they promote the consumption of energy close to its generation and, therefore, foster sustainability and the efficient use of local resources.
A permissioned blockchain that uses Hyperledger Fabric to provide a peer-to-peer energy transacting network, has been proposed in the literature [7]. The authors use a model, consisting of three entities, which are energy nodes, energy aggregator, and smart energy meters. The energy nodes can be smart buildings or offices. These nodes play a role as either seller or buyer depending on the energy state. The energy aggregator, manages all trading related events, and has computing storage abilities. The smart energy meter in every node records and calculates energy trades in real time. A similar approach was presented in [8], proposing a conceptual framework that enables households to autonomously exchange energy with neighbors, based on blockchain techniques, aimed to locally balance renewable energy production through what the authors call the “mutually surplus” supply-demand matching. Results show that this approach allows for efficiency and promotes local consumption of renewable energy, ensuring safe, reliable, distributed storage of renewable energy transaction data and automatic settlement of transaction results.
Another study [9] presents a laboratory implementation focused on solar energy generation tracking. The authors present an implementation of a blockchain network for exchange of solar electricity among participants using the Hyperledger framework. Participants, assets, and transactions necessary to establish the blockchain-based network for keeping track of solar photovoltaic PV output exchanges are described together with the smart contract, use cases, and their implementation. Even though very focused, the study seems to suggest an electricity generation origin tracking, similar to certificates of origin, which in fact is one of the fields DLTs can potentially be applied to.
Authors in [10] derive seven components/steps for the efficient operation of blockchain-based micro-grid energy markets, which are: microgrid setup, grid connection, information system, market mechanism, pricing mechanism, energy management trading system, and regulation. The legislative barriers are identified in the article, focused on a case study for Brooklyn in the USA. The authors argue that microgrid energy markets could reduce the need for expensive and inefficient energy transportation with substantial losses by satisfying demand from local energy resources. Furthermore, they defend that the latency for managing congestion and distribution faults can be decreased. Security is highlighted as a crucial aspect to be studied. In this regard, DLT has motivated studies related to cyber security of the smart grids. Authors in [11] suggest a security plan by applying Rainbowchain to the smart grid and energy exchange. They argue this approach may lead to superior performance and security functions by using Rainbowchain, which contains seven authentication techniques among existing Blockchain technologies, and propose the ecosystem and architecture necessary for its application. On the same topic, another study [12] introduces a blockchain based energy transaction framework and evaluates the level of security for different energy transactions. This is done by calculating the overall probability of successful attacks to the system, which can lead to the system collapse. The numerical results demonstrate that the blockchain based energy transaction framework is the most reliable system against cyberattacks, compared with traditional centralized and modified decentralized energy transaction frameworks.
The application in energy communities has also been a pertinent topic for DLT. Authors in [13] address self-consumption and local energy communities introducing a blockchain-based solution designed to serve energy communities sharing solar energy. This solution has been defined and developed to manage the energy exchanges according to the rules set by the energy community. It harnesses the available smart metering infrastructure, installed by the distribution system operators (DSO), as the trusted party for energy data, to the energy stakeholders, to stay focused on the governance of the energy community. On the same topic, other authors [14] focus on collective self-consumption, while addressing the concerns of verification, validation of measured data, and energy transactions and security. They argue that besides local energy markets, there is huge potential for demand side management (DSM) or demand response (DR) services, given the secure, verifiable, trustless, and scalable nature of DLT solutions.
Authors in [15] tackle demand response programs validation to activate the appropriate financial settlement for the flexibility providers. The authors use a prototype implemented in an Ethereum platform, using energy consumption and production traces of several buildings. Their results show that the blockchain used can be used for matching energy demand and production, at smart grid level, and that the demand response signal is followed with high accuracy, while the amount of energy flexibility needed for convergence is reduced. Still regarding flexibility asset management, authors in [16] provide a perspective from the renewable generation side, in order to provide services to the grid. The article presents the concept of the Electricity Consumption and Supply Management System (ECSM) with the application of blockchain technology. The ECSM provides functionalities to monitor and continuously record information about inbound and outbound energy to/from the power grid.
Given the importance and impact of demand response services and flexibility as a whole, it is important to demonstrate the application of DR services provision in a way that can be scalable, with data sharing in a trustless environment, and ensure it is tamper proof. In this study we propose a framework that enables such features, in which flexibility is provided to a system operator (SO) through an aggregator, in which the asset data is anonymized and published through a double validation process, and by aggregating the power delivered. This is achieved by using the “AND” policy in Hyperledger Fabric smart contracts. The next sections present a literature review, highlighting recent applications of DLT, and the need for DSO/transmission system operator (TSO) coordination, relying on data sharing. We then present a real laboratory implementation followed by performance analysis and discussion.

2. Stakeholder Coordination and Data Sharing of Flexibility Services

As the CEP states, using system flexibility services will require extensive cooperation and clear boundaries between TSOs and DSOs. This aims to ensure an efficient data exchange on the activated flexibility resources and to avoid a double activation from a DSO and a TSO of the same flexibility source. According to the article 32(1) of the EU Directive EU-944 [17], “distribution system operators shall exchange all necessary information and coordinate with transmission system operators in order to ensure the optimal utilization of resources, ensure the secure and efficient operation of the system and facilitate market development.” In addition, for the access of flexibility resources, article 53(2) of the E-Regulation [18] states that “transmission and distribution system operators shall cooperate in order to achieve coordinated access to resources such as distributed generation, energy storage or demand response that may support particular needs of both the distribution system and the transmission system.” In addition, aggregators and authorized organizations can make use of such information to promote new services, business cases, increase efficiency, and add value to such energy interactions.
The EU-directive is clear when it states that information regarding the flexibility services should be shared between several parties (TSO, DSO, aggregators, consumers, and others). A registry has already been proposed by SOs in a joint report [19], calling it a “flexibility resources register”, which would contain structural information on the location of connection points that can provide flexibility services to SOs and registration of connections, and could be used for settlement of flexibility services. precisely ensure data integrity, scalability, data sharing, settlement, and operation of DR services, blockchains or distributed ledger technologies (DLT) can play an important role by allowing an untampered record of transactions, ownership decentralization, and cost effective solution. Within this context, we present a framing business scenario and a use case implementation in a laboratory environment, using real assets, scheduling, and communication, allowing a replication of real life conditions.
For the sake of the present study, the business case for the use of blockchain-based smart contracts for automated flexibility is driven by some generic business objectives, such as:
  • Increase customer base and adoption rates by providing a secure platform. Security concerns amongst DR end-users are a significant barrier for adoption of such services. Providing a secure way to communicate and deploy control strategies to assets as well as audit transactions should give adoption rates a boost.
  • Decrease the cost of DR delivery for aggregators and end users, by reducing transactional cost and duration for the settlement process. Smart contracts will automatically audit the energy delivered for each event, and will trigger payment from beneficiaries in near real time, reducing the time and cost for providing the service to the system operator or other market participants.
  • Increase the efficiency of the aggregation service by enabling autonomous, computer to computer contracting. As the DR services and market become more dynamic, there is an increased need for automation of decision making for allocation of flexibility services to the best paying markets.

DLT for Demand Response

A wide dissemination of demand response service providers and the promotion of aggregators, especially independent ones, raise different challenges. Among others is how can system operators (SOs) confirm that a DR was actually delivered, especially when dealing with independent aggregators and assure data integrity and confidentiality (making sure data is true and original and without individual data being tampered with).
In this study we propose that the DR service providers (DRSP) send data to the aggregator and then to the SO, to be validated by both. When the data is transferred through the aggregator, the SO verifies the certificate of origin from the DR service provider, and confirms that the added power corresponds to the sum of individual components. The added power and other aggregated data (voltage, time stamp) are the elements being published on the ledger.
In this study the laboratory implementation considers only one asset (a battery storage system), one DR provider and one aggregator. In the use case implemented, the DRSP sends the transaction data directly to the ledger with both verifications (aggregator and SO) with the aggregated data corresponding to the individual data of the asset (the energy storage system in this case). In this way we fulfill the requirements of non-discriminatory and transparent rules and procedures, for the exchange of data between market participants engaged in aggregation, and other electricity undertakings, protecting commercially sensitive information and customers’ personal data. This can be achieved if the data published on the blockchain is aggregated, as is the approach of this study. It is worth mentioning that the flexibility provider may participate directly in a program without going through an aggregator. Moreover an aggregator may also sell its flexibility through another aggregator, which is the case where an aggregator acquires flexibility in order not to incur potential imbalances.

3. Methodology

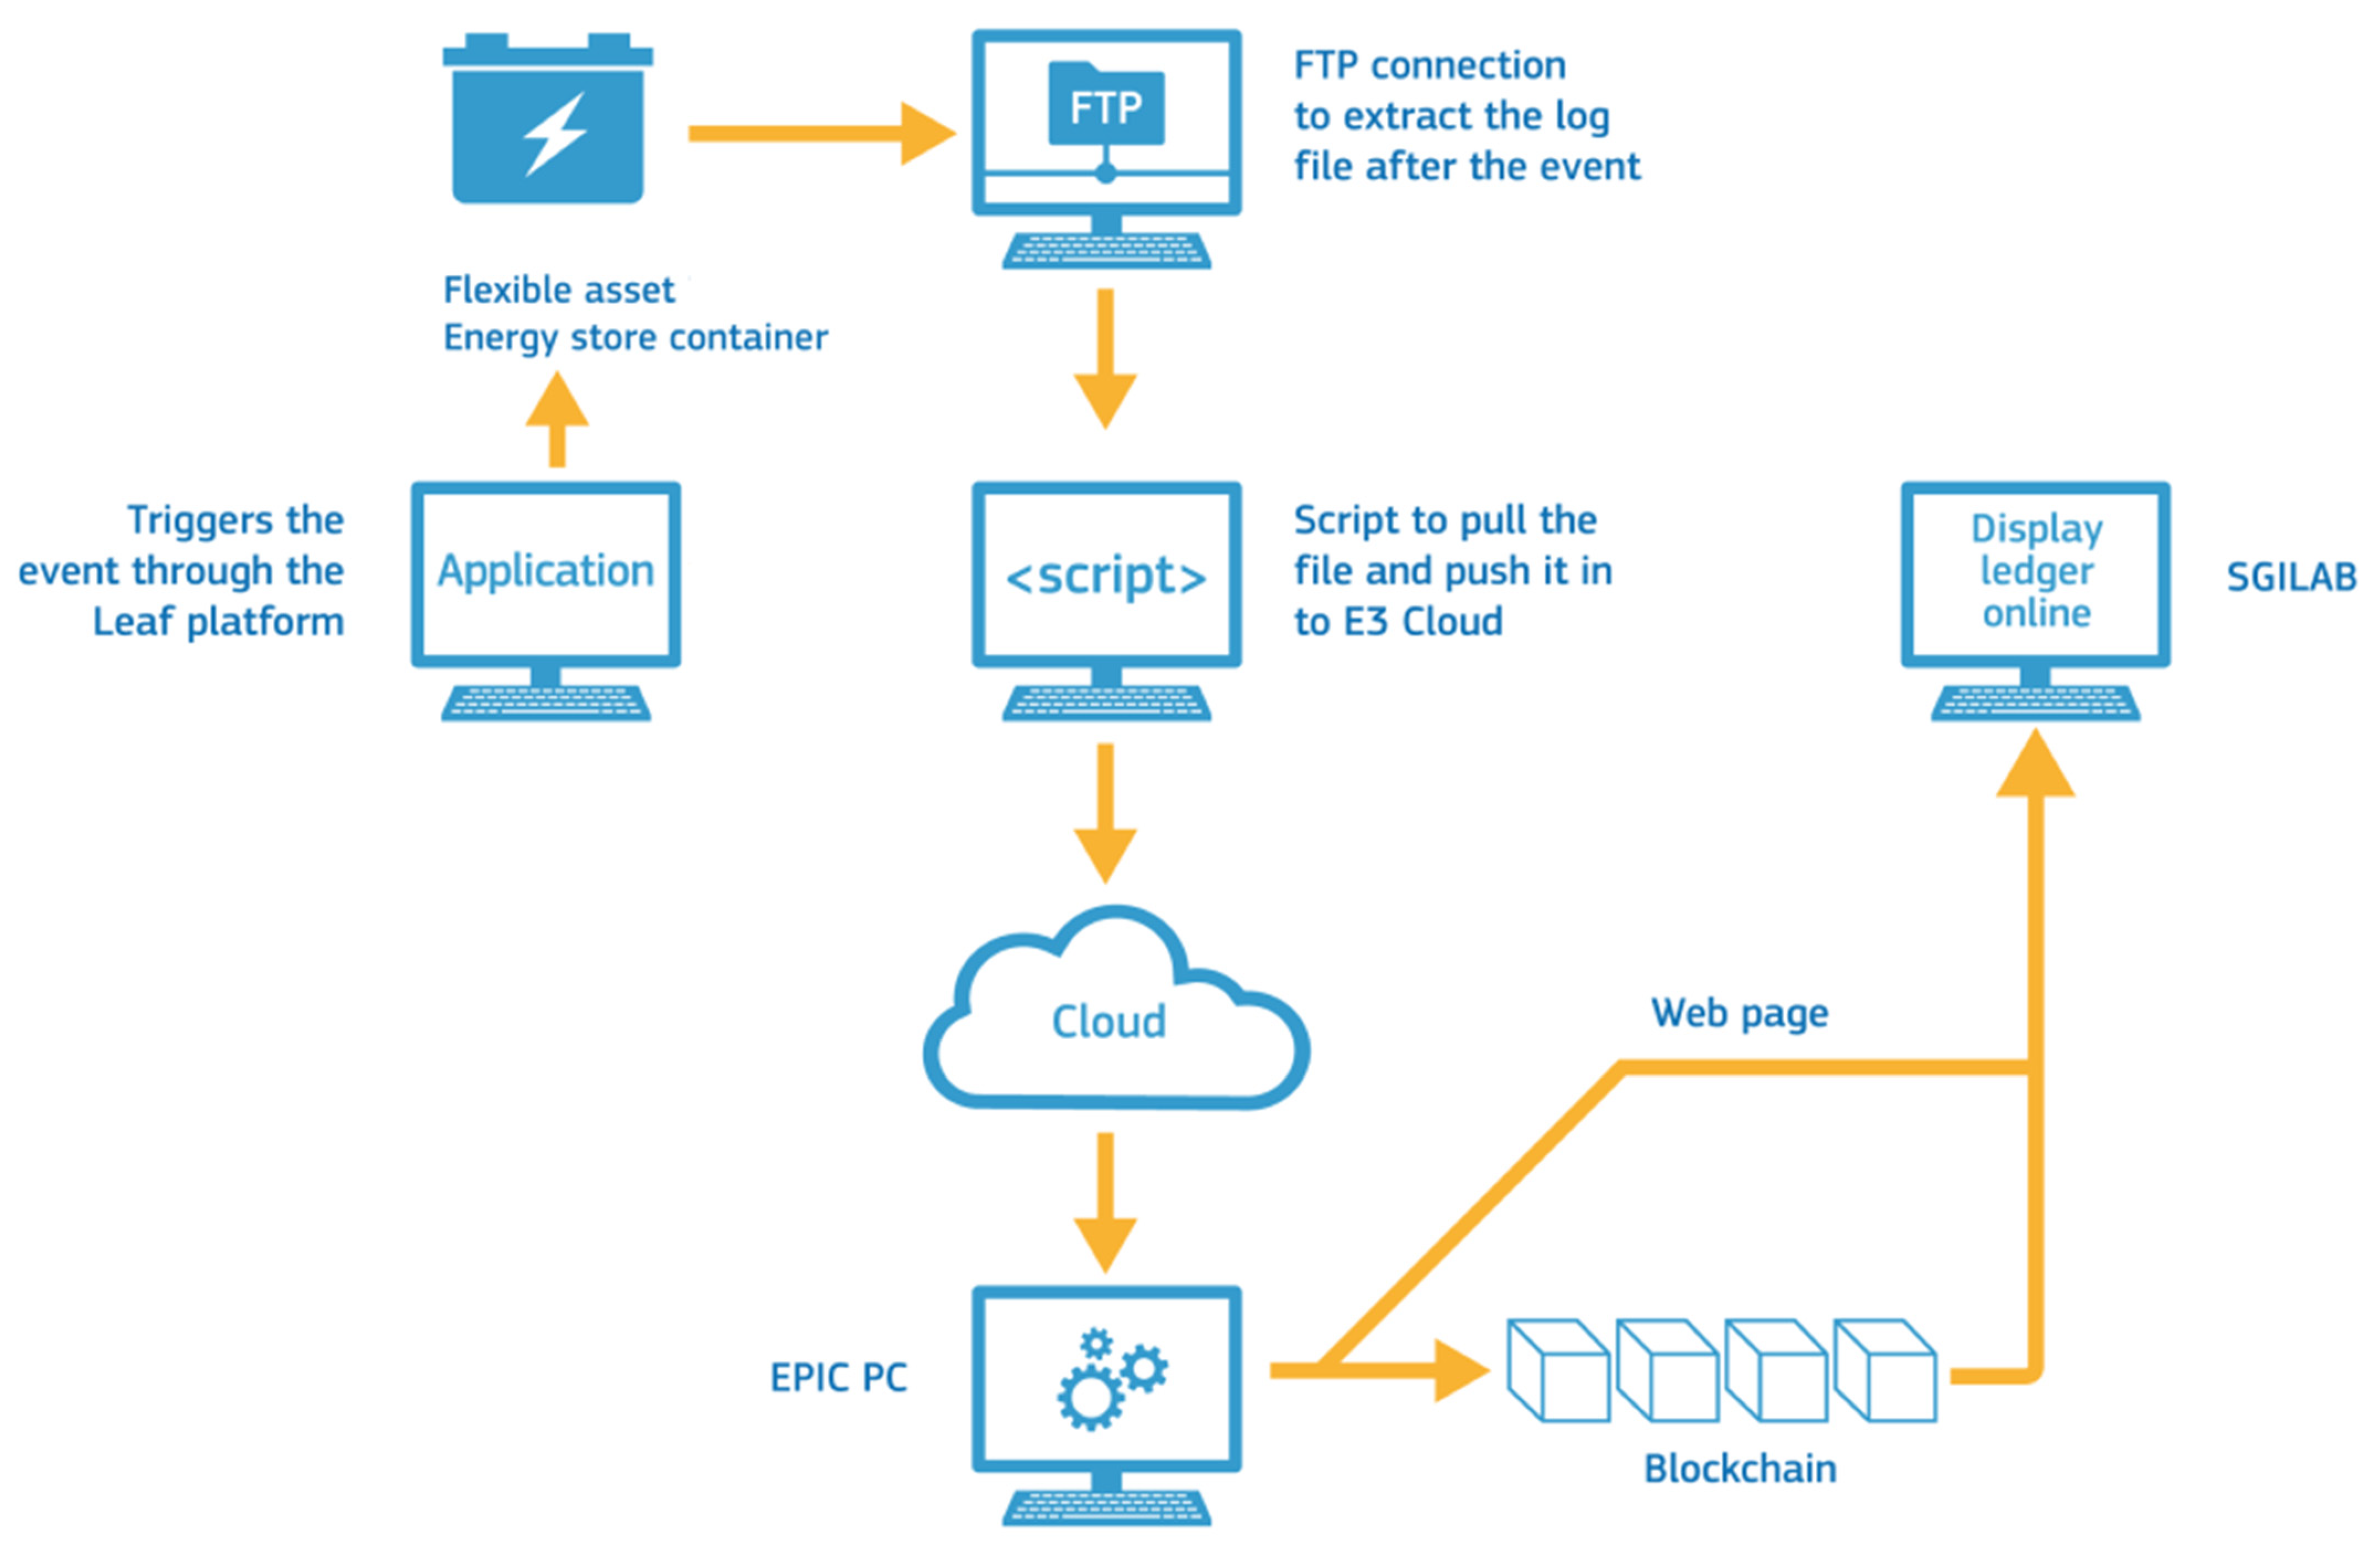
3.1. Use Case Description

The path of communications and steps between actors may change according to market arrangements or coordination schemes, which is not the focus of the study. In this study the interactions are generic, but tend to be closer to an integrated market model where TSO, DSO, and balance responsible parties (BRP) may buy from one common market. The use case was implemented in the Smart Grid and Interoperability Laboratory (SGILAB) of the Joint Research Centre (JRC), and it represents the following events illustrated in Figure 1:
  • Flexibility needs are published by a system operator (SO), with a specific amplitude and duration, in a market platform or bilateral contract;
  • An aggregator rechecks the availability of demand response (DR) flexibility of its assets (from clients) and presents an offer which is accepted by the SO;
  • The service provision occurs by setting the loads/assets to a desired/allowed level;
  • After the event takes place the aggregator/service provider sends a publishing order, which is conditional to the SO verification. This structure is represented in the picture by the TSO, which verifies the origin of the data, and that the sum of power corresponds to the individual contributions of assets. This is done through an AND policy;
  • All SO are able to confirm (by consulting the ledger), that the variation/DR event was actually performed in order to find the corresponding imbalance price/compensation.

3.2. Implementation

The physical set up of the use case is shown in Figure 2 and consists of a storage system with 225 kW and 450 kWh of capacity, connected to the lab busbar, which allows a bi-flow of power from and towards the grid. This means that a battery can charge or discharge from/to the grid.
The triggering of the DR event is done by an online platform (called Leaf), dedicated to the Energy Storage System, which interacts with battery local Supervisory Control and Data Acquisition system SCADA, such as the one from an aggregator, scheduling the battery to charge or discharge at a given time according to the flexibility request. The battery system is equipped with a 4G communication interface, which allows a wireless communication with a computer in the lab control room. The communication with the asset is therefore a bi-flow, exchanging data and signals. Such signals/data are part of the smart contract.
The data from the storage system is registered in a local PC, where a log file is stored when an event takes place. This file is obtained through a FTP connection and transmitted in a log file (CSV format) after the DR event is over. The FTP retrieving script and the application used to trigger the even are further explained in the Supplementary Materials of the article. An interval of readings before and after (±15 min) of the event is also required and will be provided in order to perform a baseline, offering the possibility to confirm that during the request time there was actually the requested change in power. The variables collected from the log file are the very minimum for the simplicity of the experiment, but others, depending on the product specification requirements, such as current, location of connection point, or type of activation, could be used as well. The variables defined to be exchanged are:
To be transmitted from the prosumer to the aggregator:
  • Active Power,
  • Prosumer ID,
  • Time stamp,
The aggregator will share some of the data with the SO, and recorded on the Ledger are:
  • aggregated active power (if more than 1 asset is involved),
  • simple and compound voltage,
  • time stamp,
  • aggregator ID,
The power is stated in kW and the time step of the time stamp in minutes. The ID is a string or an object variable, unique for each aggregator or prosumer. We assume a prosumer can only be a service provider through one aggregator.
Without loss of generality, every service built on top of the Hyperledger Fabric [20] infrastructure relies on a standard transaction flow for recording a transaction in the blockchain, which consists of the following steps visible in Figure 3:
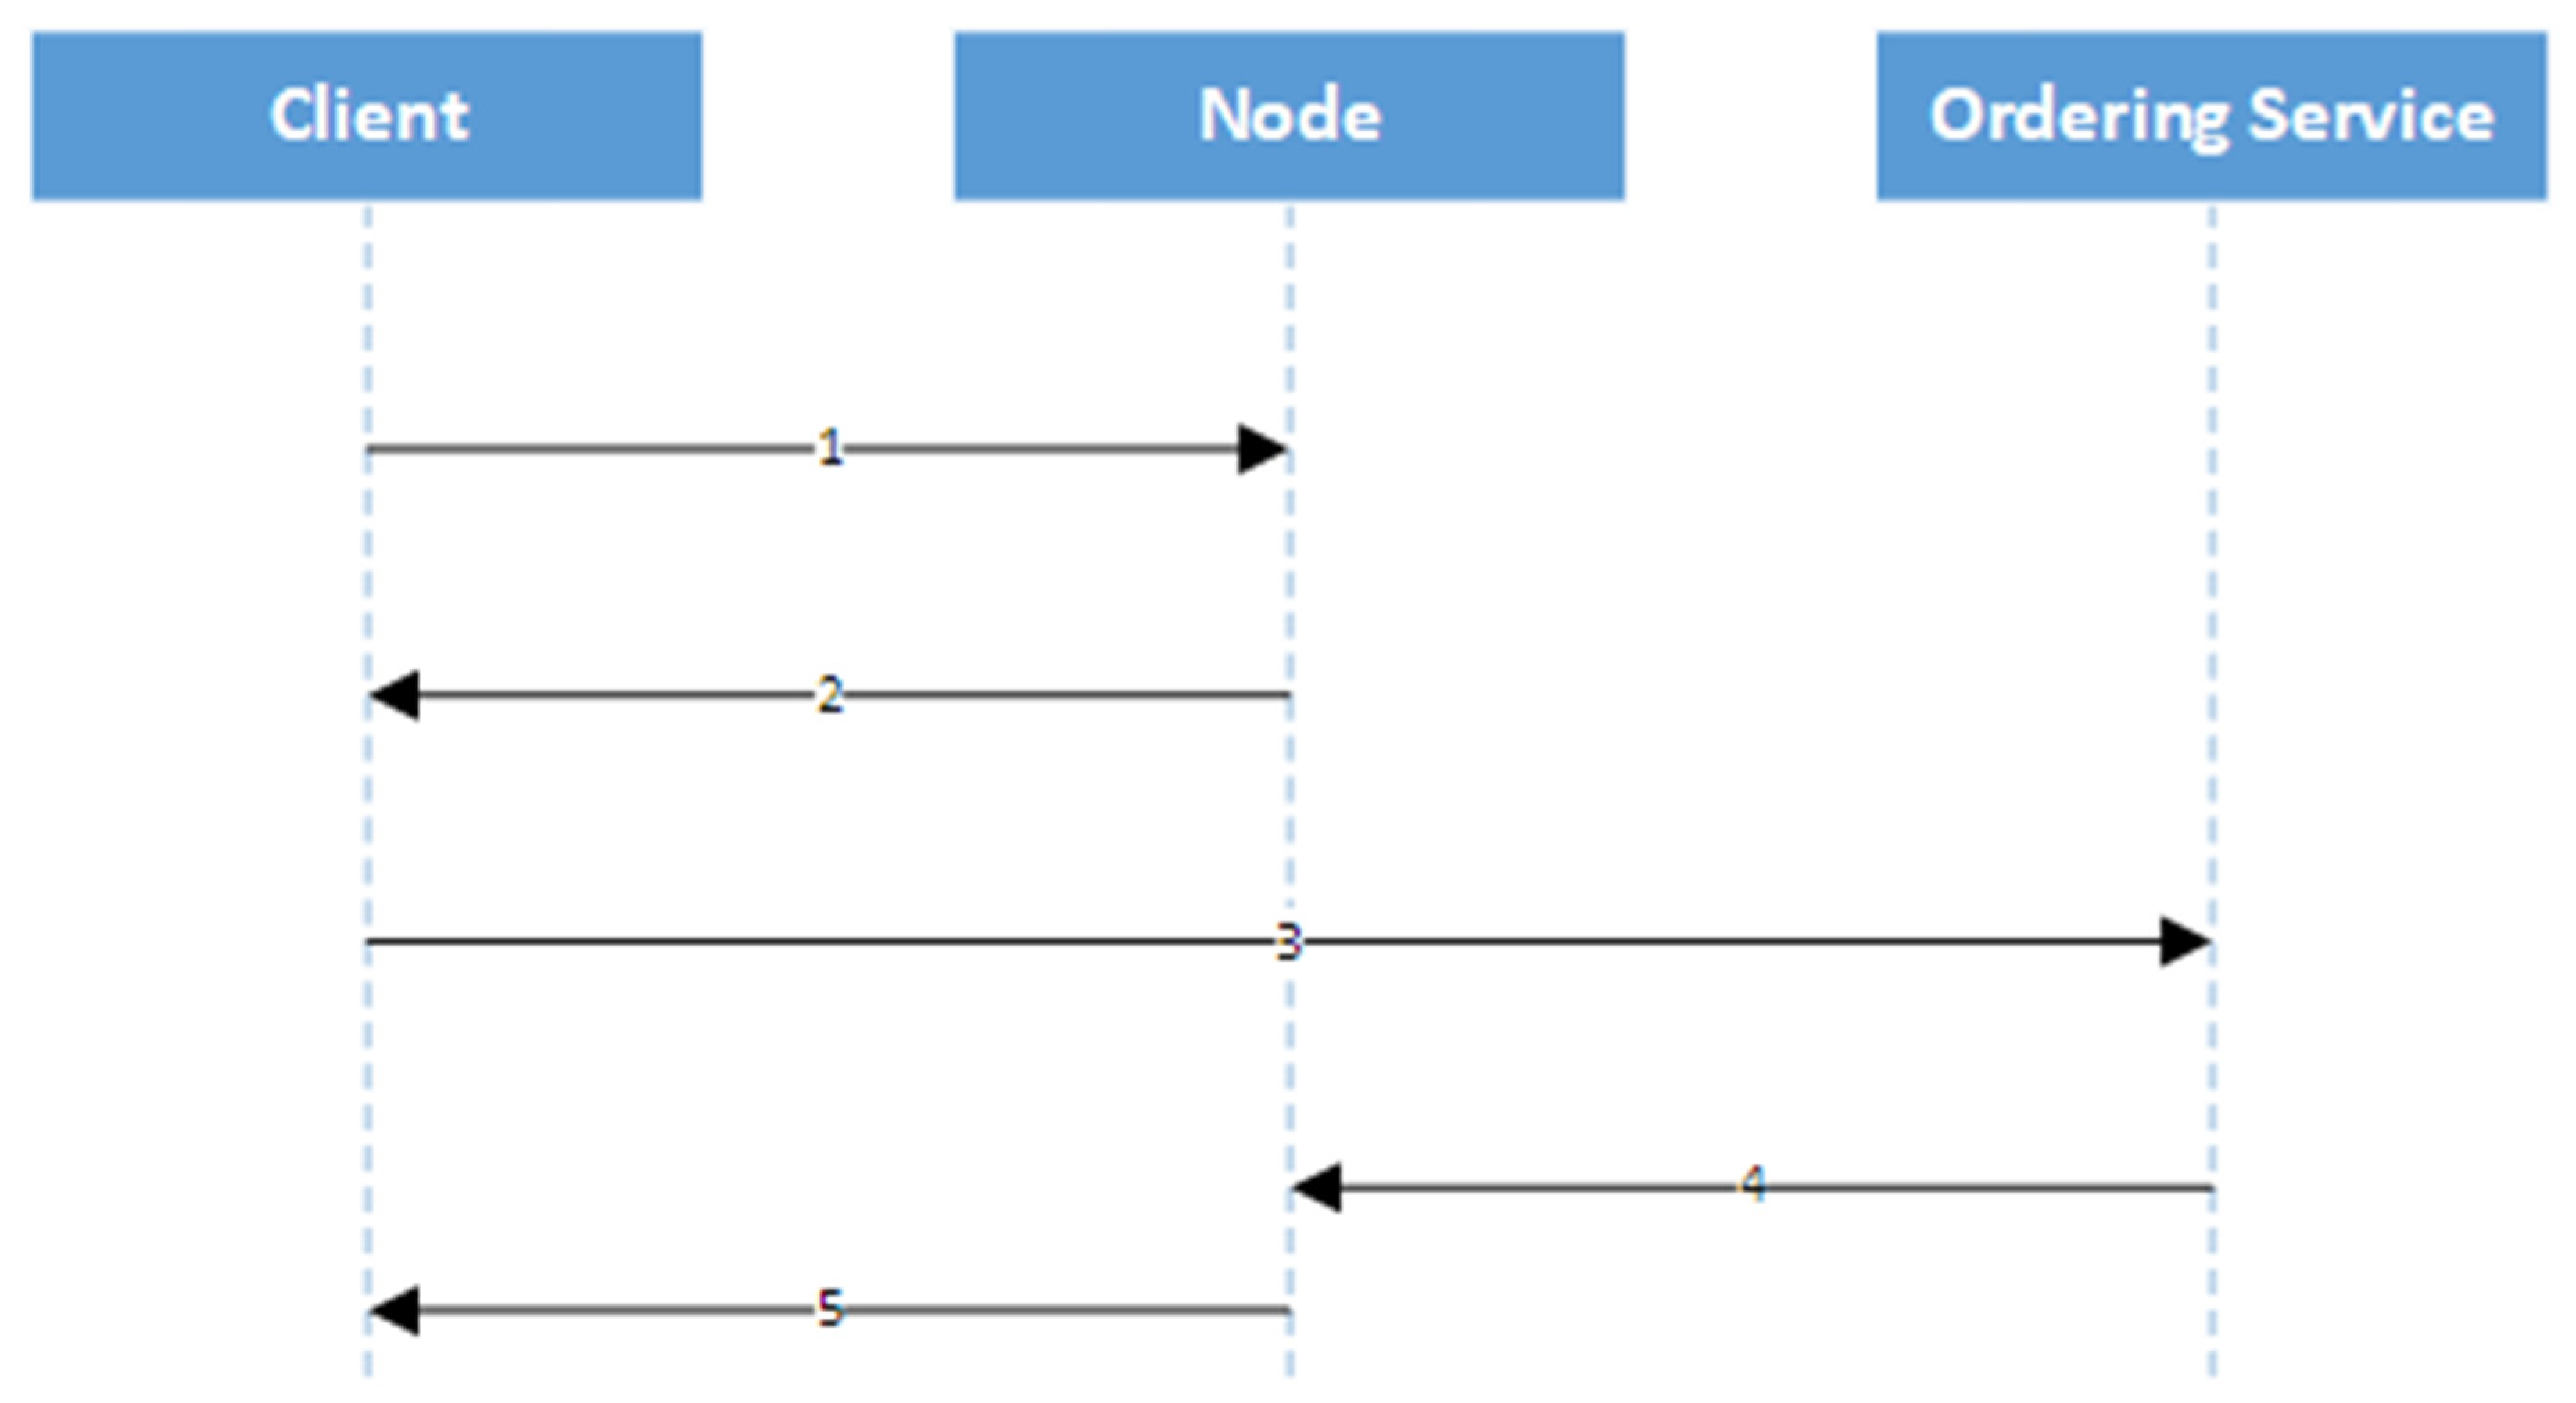
  • A client creates a blockchain transaction proposal and commits it to the corresponding node (such as an aggregator). This proposal is digitally signed by the client so the node is able to validate the client’s identity.
  • The node validates the correctness of the transaction and triggers the execution of the smart contract, and sends back a digital signed response message called as endorsement to the client.
  • Afterwards, the client sends the transaction proposal to the ordering service, as well as the endorsement. The ordering service sorts all of the received transactions, creates the appropriate blocks, and populates them to all the blockchain network participants.
  • As soon as the block is received from the network participants it is verified whether the deployed policy has been fulfilled and the block is written onto the ledger.
  • Finally, the client is informed by the corresponding node that the transaction has been completed.

3.3. Blockchain Architecture

As mentioned before, the flexibility use case is implemented over a Hyperledger Fabric infrastructure, which consists of: (a) the ordering service; and the (b) core blockchain network components. In particular, one side is the:
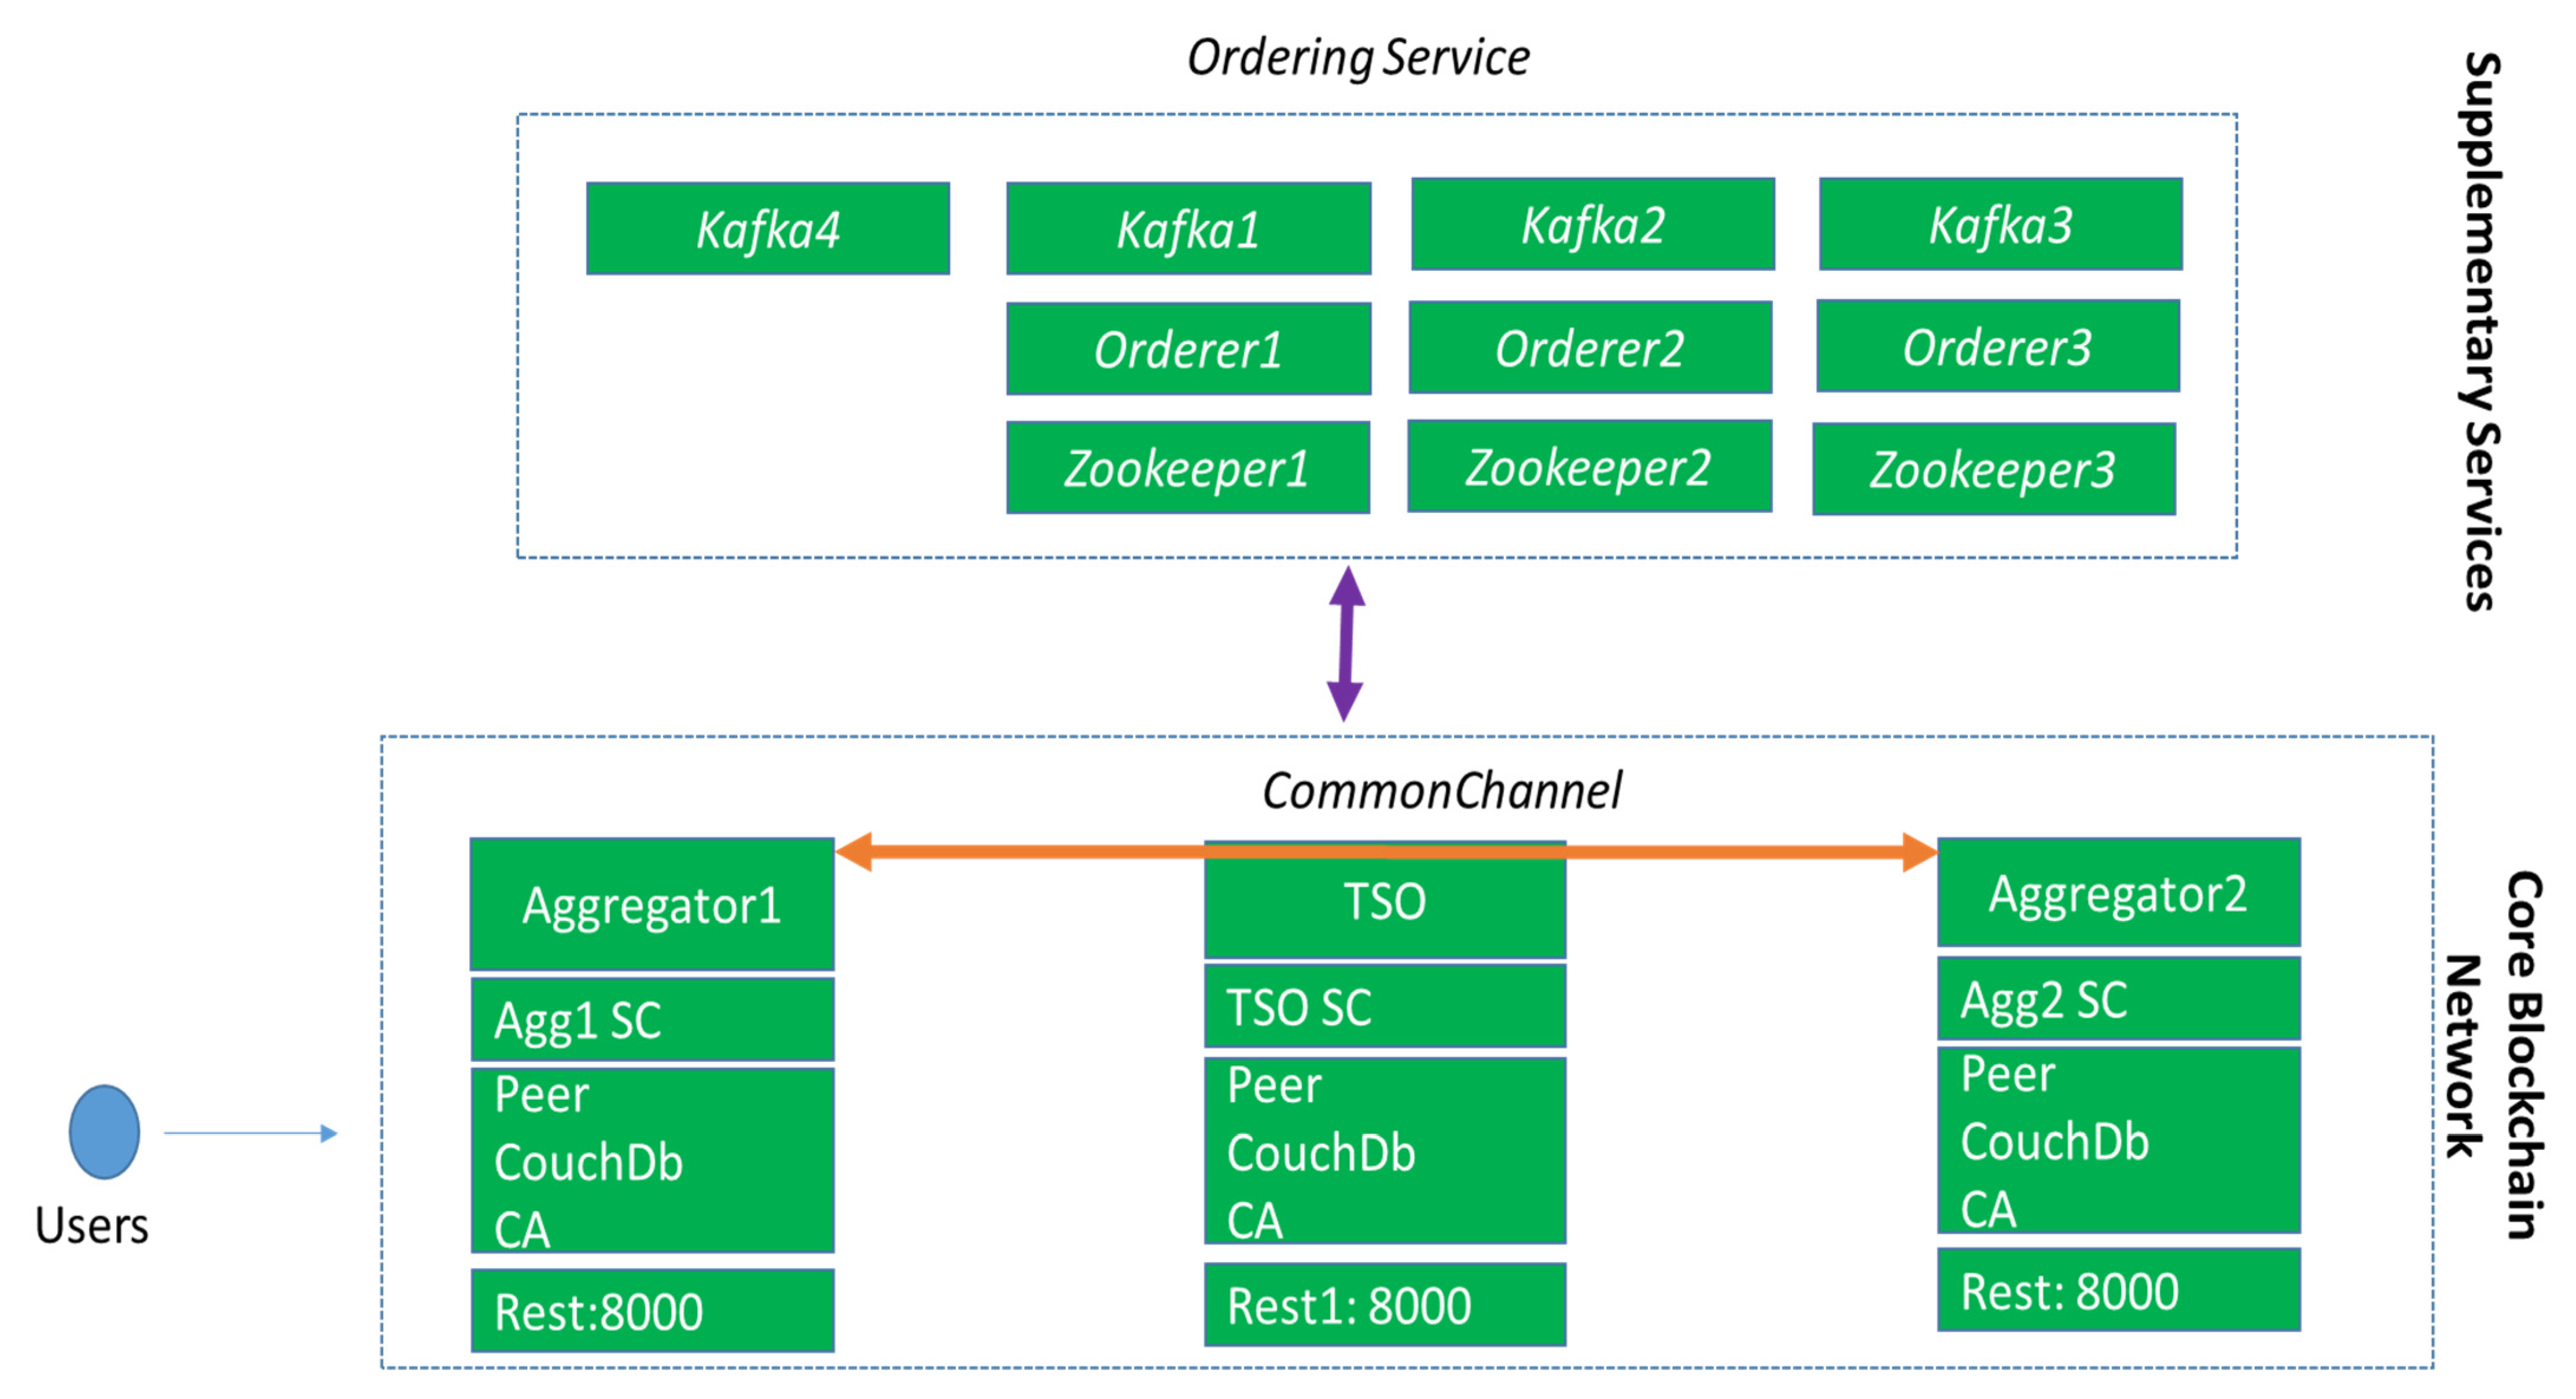
  • Ordering Service which as its name implies is responsible to sort the transaction between the participants that builds upon: (a) Zookeeper (3 instances); (b) Kafka (4 instances); and (c) Orderer (3 instances) services. In fact this is the minimum number of instances to enable a fundamental fail-over at the ordering service side.
On the other side, the core blockchain network components are the nodes that share the ledger. In the context of the Hyperledger Fabric, each node hosts a:
  • database that retains all blockchain’s valid transactions, named as world state;
  • peer service that stores the ledger itself and validates the transactions according to the defined policies;
  • certificate authority (CA) which is in charge of managing digital identities to the participants (i.e., aggregators) on the blockchain network;
  • smart contract that implements the demand response flexibility use case and enables users to submit their transaction to the blockchain network;
  • application interface implemented as a representational state transfer (REST) service that acts on behalf of the user for transaction commitments in the blockchain.
Figure 4 provides an overview of the components used to deploy the DR use case over the Hyperledger Fabric, where the core blockchain network consists of the main actors, i.e., aggregators, DSOs, and TSO or BRP, in order to distribute the corresponding information and sharing common business logic and rules. All aggregators and SO can share ‘public’ information through a common channel. All the underlying communications are protected by transport layer security (TLS).
The Active System Management report [19] provides several options for flexibility in market operation. In this study, however, we present a generic interaction without necessarily choosing one. Figure 5 shows the sequence of actions put in place to provide flexibility through a market to a DSO, TSO, or a BRP through an aggregator. It starts with the system operator publishing its flexibility needs (signalling an event need) in an interface. Upon this information a service provider (aggregator) requests availability to the end user of the asset. In step three, the user either manually confirms the flexibility availability, or sets it to automatic verification and sends the response to the aggregator in step 4. The aggregator then publishes in step 5, the offer of the power flexibility in the SO interface. If the offer is accepted by the SO, it sends an activation signal to the aggregator in step 6, which is forwarded to the end user to act accordingly, or acts directly over the load/asset (steps 7 and 8). The last step is the metering part, which will allow the registry on a blockchain, the focus of this study.

3.4. Smart Contract Deployment

We have deployed the smart contract on Go language [21], as is supported by Hyperledger Fabric, a type-safe language, that generates a compiled code enabling fast execution, in comparison to other interpreted languages. In fact, the smart contract enables the users or the corresponding entities of the system to:
  • Insert new transactions for recording demand response requests, and
  • Validate the correctness of the aggregators’ claims recorded as transactions in the blockchain.
The data required for this use case was modelled in a data structure called EnergyFlex, which consists of the following fields:
  • Energy: models a unique identifier for the transaction that will be submitted to the blockchain
  • Time: defines a timestamp linked to the time in which the energy measurements were taken
  • Voltage1: The RMS value of the line to line voltage (V) in the corresponding time step
  • Voltage2: The RMS value of the line to earth voltage (V) in the corresponding time step
  • Power: The running Power (+ if charging from the grid or—if injecting into the grid) of the asset activated in kW in the corresponding time step.
The EnergyFlex data structure definition is shown in the pseudo-code below:
  • type EnergyFlex struct
  • {Energy string `json:"Energy"`
  • Time int `json:"Time"`
  • Voltage1 int `json:"Voltage1"`
  • Voltage2 int `json:"Voltage2"`
  • Power int `json:"Power"`}
The transactions submitted to the blockchain system are sent by users in the form of a POST request with the following format: http://10.120.50.110:8000/Trasnsaction -H content-type: application/json‘-d’{“Timestamp”: “1”, “Voltage1”: 2, “Voltage2”: 5, “Power”: 2}.
The smart contract parses JavaScript Object (JSON’s) message arguments, and makes the corresponding controls to determine if the message complies with the rules of the system, and whether the values are in the expected ranges. If both controls are successful, the execution of the smart contract continues and writes the data to the blockchain. Otherwise, the transaction is recorded as a failed one in the ledger. This functionality is illustrated in the following pseudo-code example. Note that the blockchain allows transactions to be submitted only by entities that hold the corresponding certificate that has been issued by the corresponding certificate authority.
Create main function to add JSON info
  • func (cc *EnerChaincode) addEnergyJSON(stub shim.ChaincodeStubInterface, args [[]byte) sc.Response {
  • if len(args) == 0
  • {fmt.Println("json string validatiton...")
  • return shim.Error("Empty argument")}
validate against json-schema
  • jsonString: = string(args[:])
  • fmt.Println("jsonstring")
  • fmt.Println(jsonString)
  • if len(jsonString) == 0
  • {return shim.Error("Empty argument")}
extract info
  • energy, time, voltage1, voltage2, power := extractInfo(stub, args)
  • if time > current_time
  • {return shim.Error("timestamp value error")}
  • if voltage1 > threshold1 || voltage1 < threshold2
  • {return shim.Error("voltage values errors")}
  • if voltage2 > threshold1 || voltage2 < threshold2
  • {return shim.Error("voltage values errors") }
  • if power > threshold_p1 || power < threshold_p2
  • { return shim.Error("power values errors") }
write the data on the blockchain
  • err1 := stub.PutState(energy, args)
  • if err1 != nil
  • {fmt.Println("error!!!! Failed to put to world state") }
  • return shim.Success(nil) }
It should be noted that all of the interactions with the blockchain system are accomplished through the restful service, which acts on behalf of the user. As soon as a transaction is accomplished, a corresponding entity (i.e., the SO) is able to check the validity of the transaction(s) and create a new block in the chain, illustrating the validation procedure according to the specifications of the system. The validating entity, through a POST request, sends a message to the smart contract to validate the correctness of the aggregators ‘submissions’. To do so, it is assumed that the end-users also submit their values in the block chain, so that the SO can retrieve them and confirm that the aggregator fulfilled the corresponding demand response request.

4. Results and Discussion

Figure 6 shows the active power of the battery storage system during the demand response event ±15 min. This is the logfile actually recorded in the local PC retrieved through a FTP connection. The event lasted for 255 min (4.25 h). One can observe there was a ramp up and down, which is the time the asset takes to reach the set power. The ramp up/down was foreseen and allowed by the market, but it has limits. This is one of the characteristics that distinguish asset quality in the participation of DR events. The battery was already operational, discharging at a 1 kW rate. The amplitude of the requested demand response was −74 kW, which in this case corresponds to injecting power into/supplying the grid.
Shown in red is the baseline, which continued stable as the asset switched from a steady state of −1 kW to −74 kW. The total energy supplied in the DR event was hence (74 − 1) × 4.25 h = 310.25 kWh. The event was then registered on the explorer of the Hyperledger Fabric, which can be seen with the following format with 54 characters:
Transaction ID:
“f5d0efd26c6361a74db3aa9ffa719ed2212df495795f58b0fc40578a137605a3”
Finally the data format stored in the ledger is the following:
{“Energy”: “energyvalueAsset-1-18”, “Time”: 1581894000, “Voltage1”: 398, “Voltage2”: 229, “Power”: −1}
Each entry in the ledger corresponds to a given second or minute depending on the time step chosen. The format shown above contains the first second of the DR event of the addressed use case. The CSV file retrieved from the asset (storage unit) meter contains more attributes, however only the time, two voltages, and power were chosen for the simplicity of the use case. With such information, it can be confirmed by the SO that the DR was in fact implemented. The block details are provided by the explorer in a simple manner, as shown in an example in Figure 7.
To evaluate the effectiveness of flexibility use, we deployed it in a network that consisted of different number of participants. We studied how such a use case will scale considering different: (a) number of participants; and (b) number of transactions submitted in the system per second (TPS). In the current setup, we assume that all the participants are connected to the network over a network that supports 1 Gbps, with a latency of 3 ms. Table 1 shows the executed scenarios for the evaluation of the flexibility use case.
To assess the system performance, we used the following indicators:
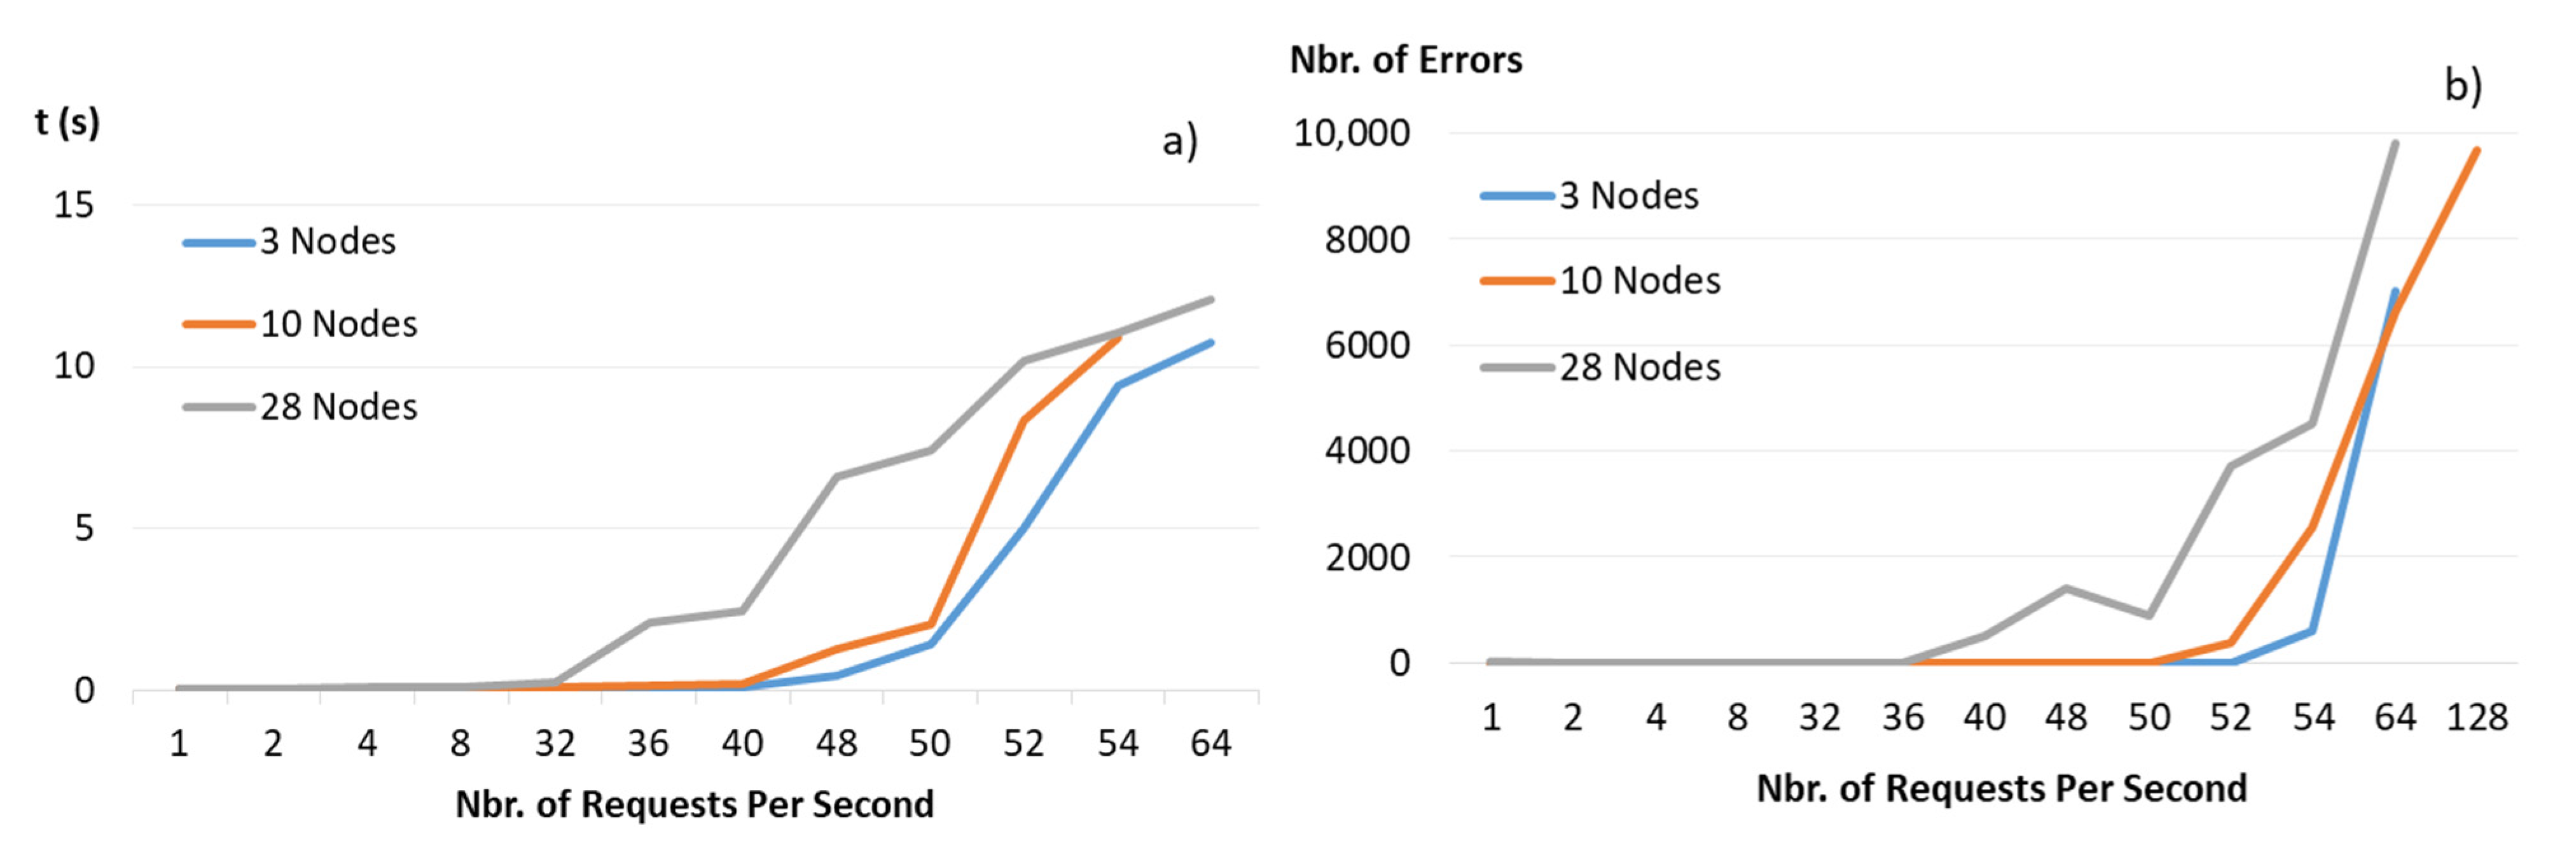
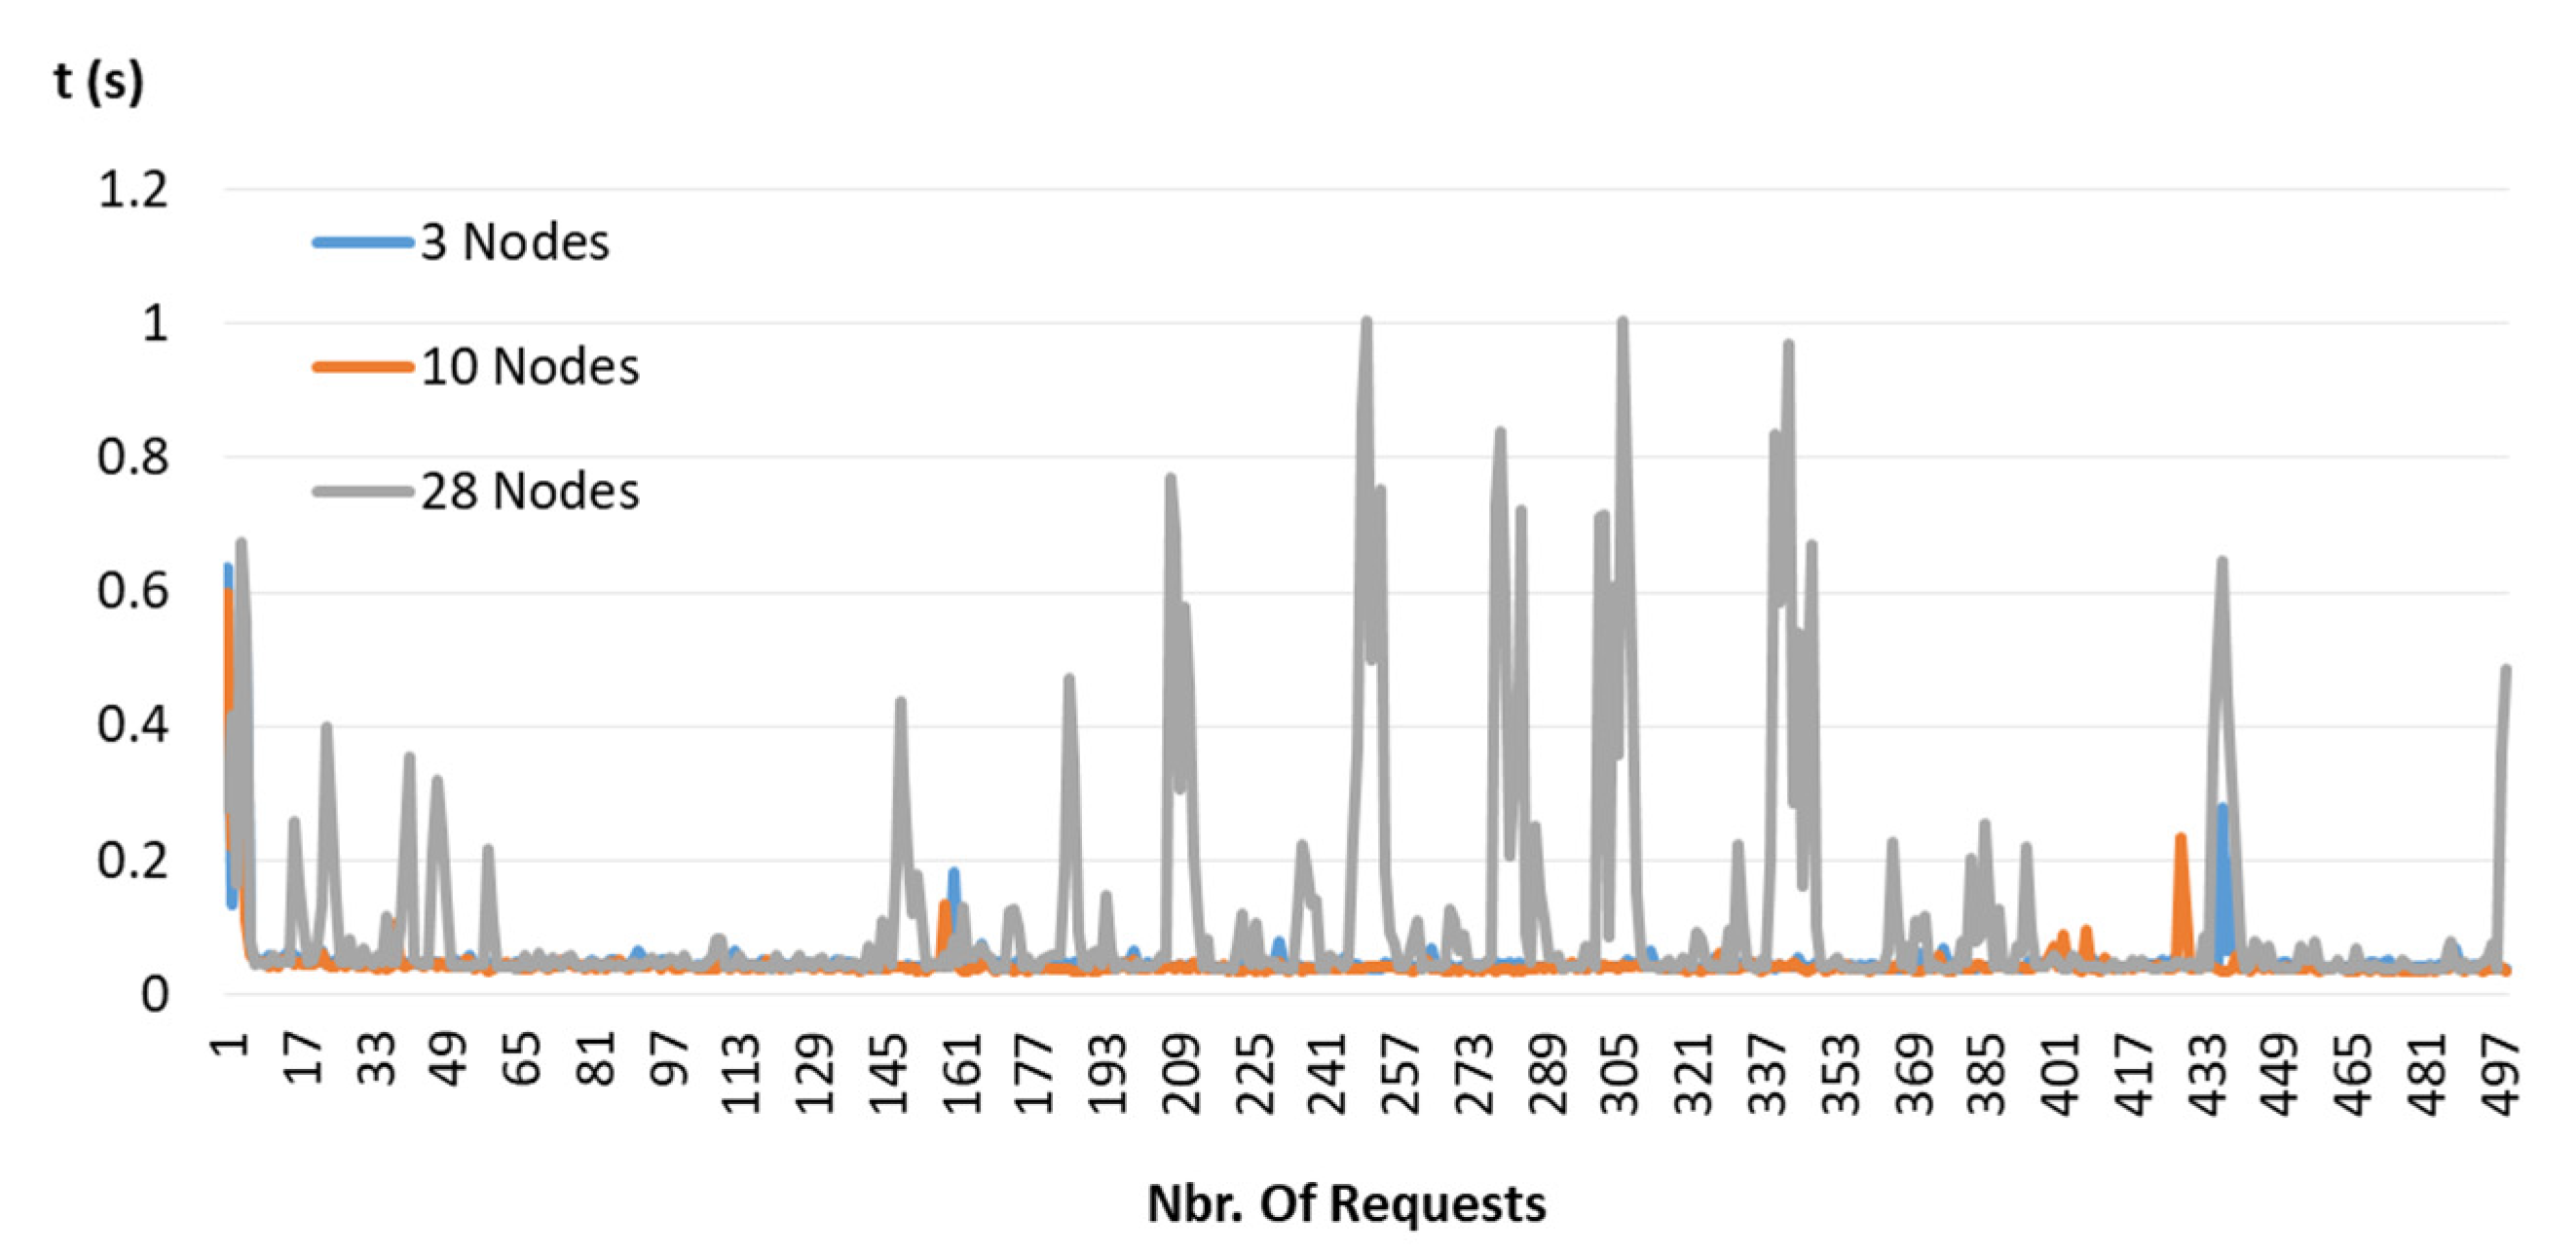
  • Request round-trip time, that is, the time elapsed from the moment in which a user submits an operation request (i.e., write) and the moment in which he/she receives a service response. The monitoring procedure was accomplished by integrating a recording service both in the user and REST service sides.
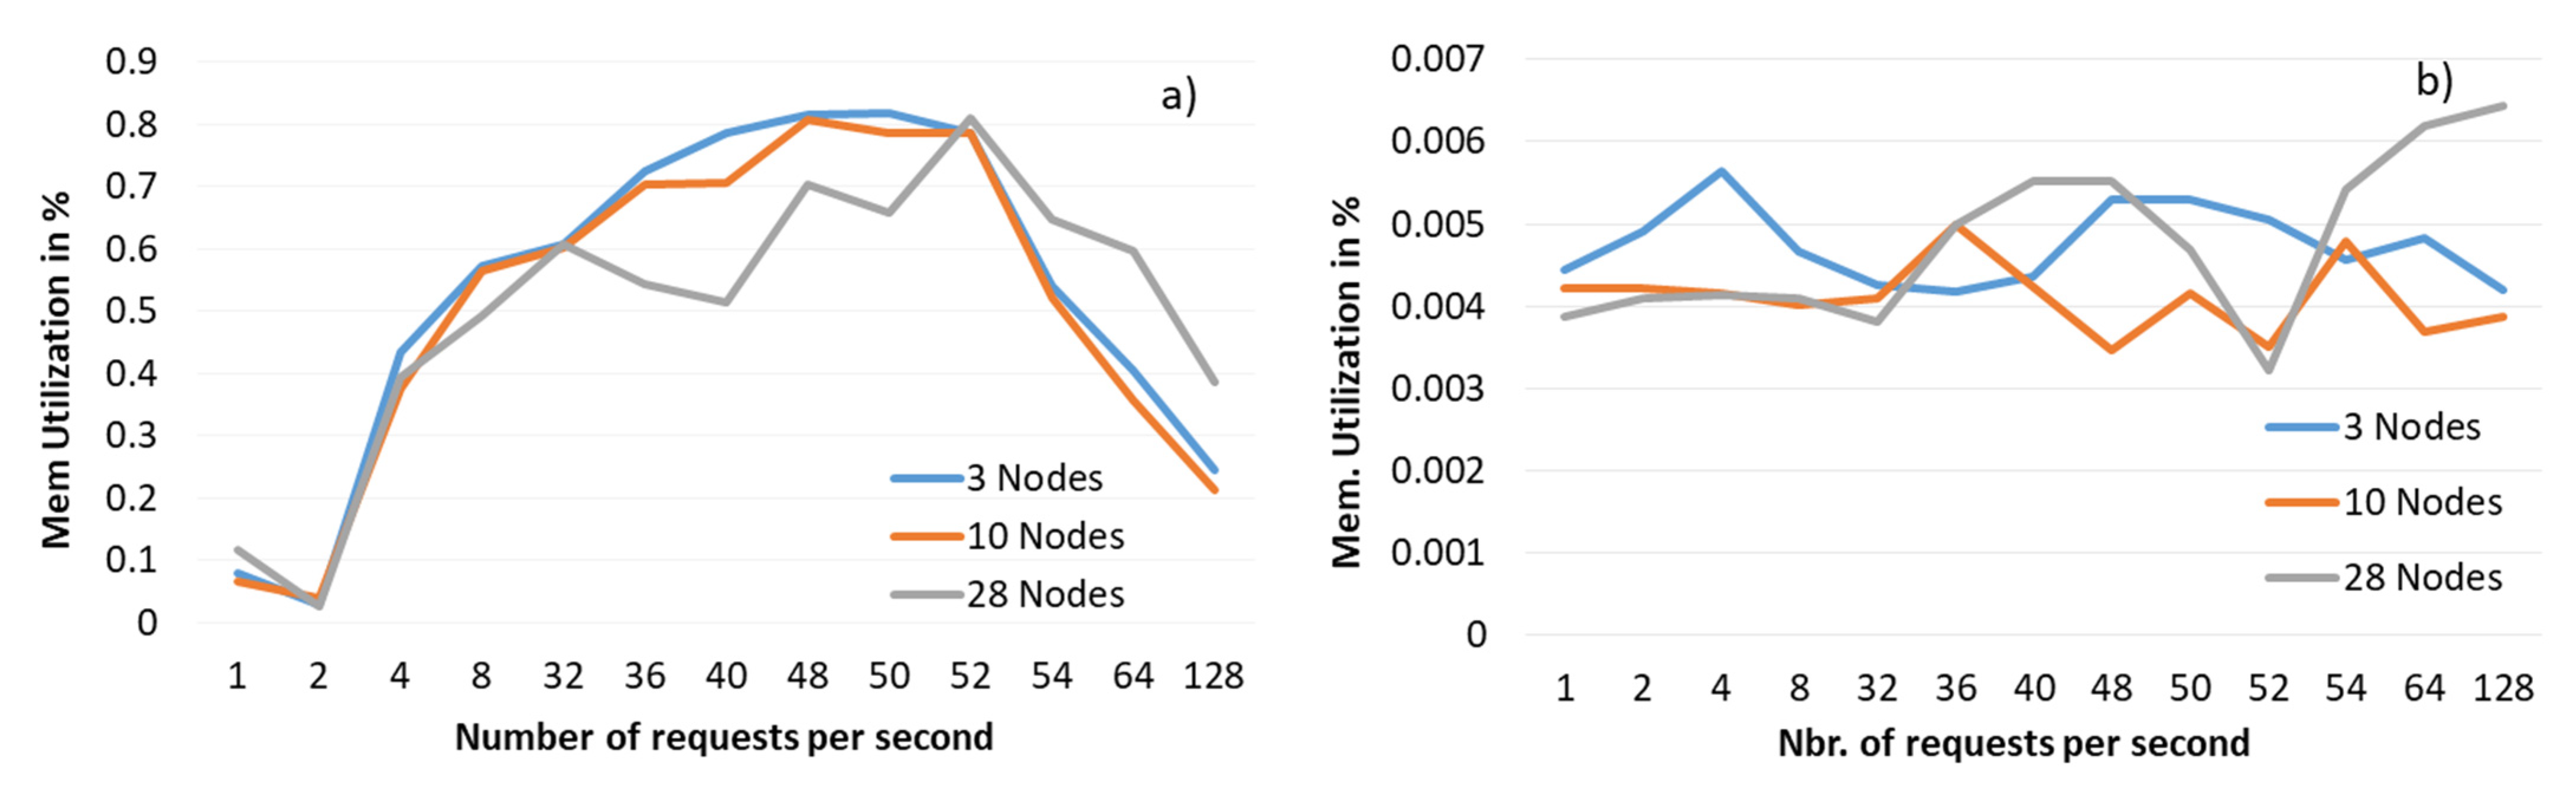
  • System resources utilisation, in which we monitor the utilisation of CPU and memory for all the related services. To keep track of the utilisation of system resources, we relied on the docker’s built-in monitoring services.
In fact, these indicators demonstrate how the system performs in terms of required resources (system resource utilization), and whether the end user’s experience is affected (request round-trip time), considering the different number of nodes in the blockchain network, as well as number of transactions per second.
In the following sections, we overview the results considering different numbers of participants in the network, and transactions per second submitted to the system. The performance metrics used are in line with the ones found in similar studies [22].

4.1. Request Round-Trip Time

The end to end execution time considers different sizes of blockchain network, i.e., 3, 10, and 28 participants, while a different number of requests per second are submitted to the network. Results indicate that below the 32 requests per seconds level, the end to end execution time is less than 1 s (independent of the network size), without having any impact on end user’s experience. However, as the number of transactions increases the total execution time grows exponentially. This is because the system cannot properly handle the increased number of requests. Indeed, the more network participants, the longer the transaction end to end execution takes to complete, especially in rates greater than 32 transactions per second, which can be seen in Figure 8a. This trend is also confirmed by the number of errors that occur during the different scenarios (in Figure 8b). Note that the number of failures for higher than 48, 52, and 54 TPS for 28, 10, and 3 nodes respectively is more than 20% of the total transactions, which indicates that the system cannot handle such traffic and consequently its behavior is unpredicted.
Moreover, for a network size with 3 nodes, up to 51 transactions per second (TPS), the total execution transaction time does not exceed 2 s, which can be considered as an acceptable response time for end users, also taking into account the number of errors. If the system is more reluctant in that sense, in 54 TPS the end to end delay reaches up to 10 s without losing its stability, as the number of errors remain low. Evidently, as we increase the number of nodes, the end to end delay increases faster. For instance, in a network that consists of 28 members, under 32 TPS the end to end delay approximates 2 s, while for 3 nodes it is less than 1 s. Note that we do not illustrate outcomes for TPS greater than 128, as the system becomes completely unstable with the high percentage of submitted transactions failing. Figure 8a shows the end to end execution time and Figure 8b correspond to the number of errors. Figure 9 indicates an example of end to end delay for a specific time window for 8 TPS for all of the cases. It should be noted that it is not expected that all the configurations would have exactly the same behavior, i.e., in a network with 28 nodes, the end to end delay time has high variability, which is an indication that the system is already under stress.

4.2. System Resource Utilization—Memory of Smart Contract

The nodes analyzed can be active or passive. The first correspond to nodes responsible for issuing a transaction, where the second ones are just present in the network as participants. Smart contract for both active and passive nodes have a similar trend with the corresponding clients, as Figure 10a,b illustrate. In fact, the smart contract memory utilization increased as the number of requests grew. However, in no case did it exceed the threshold of 1%.

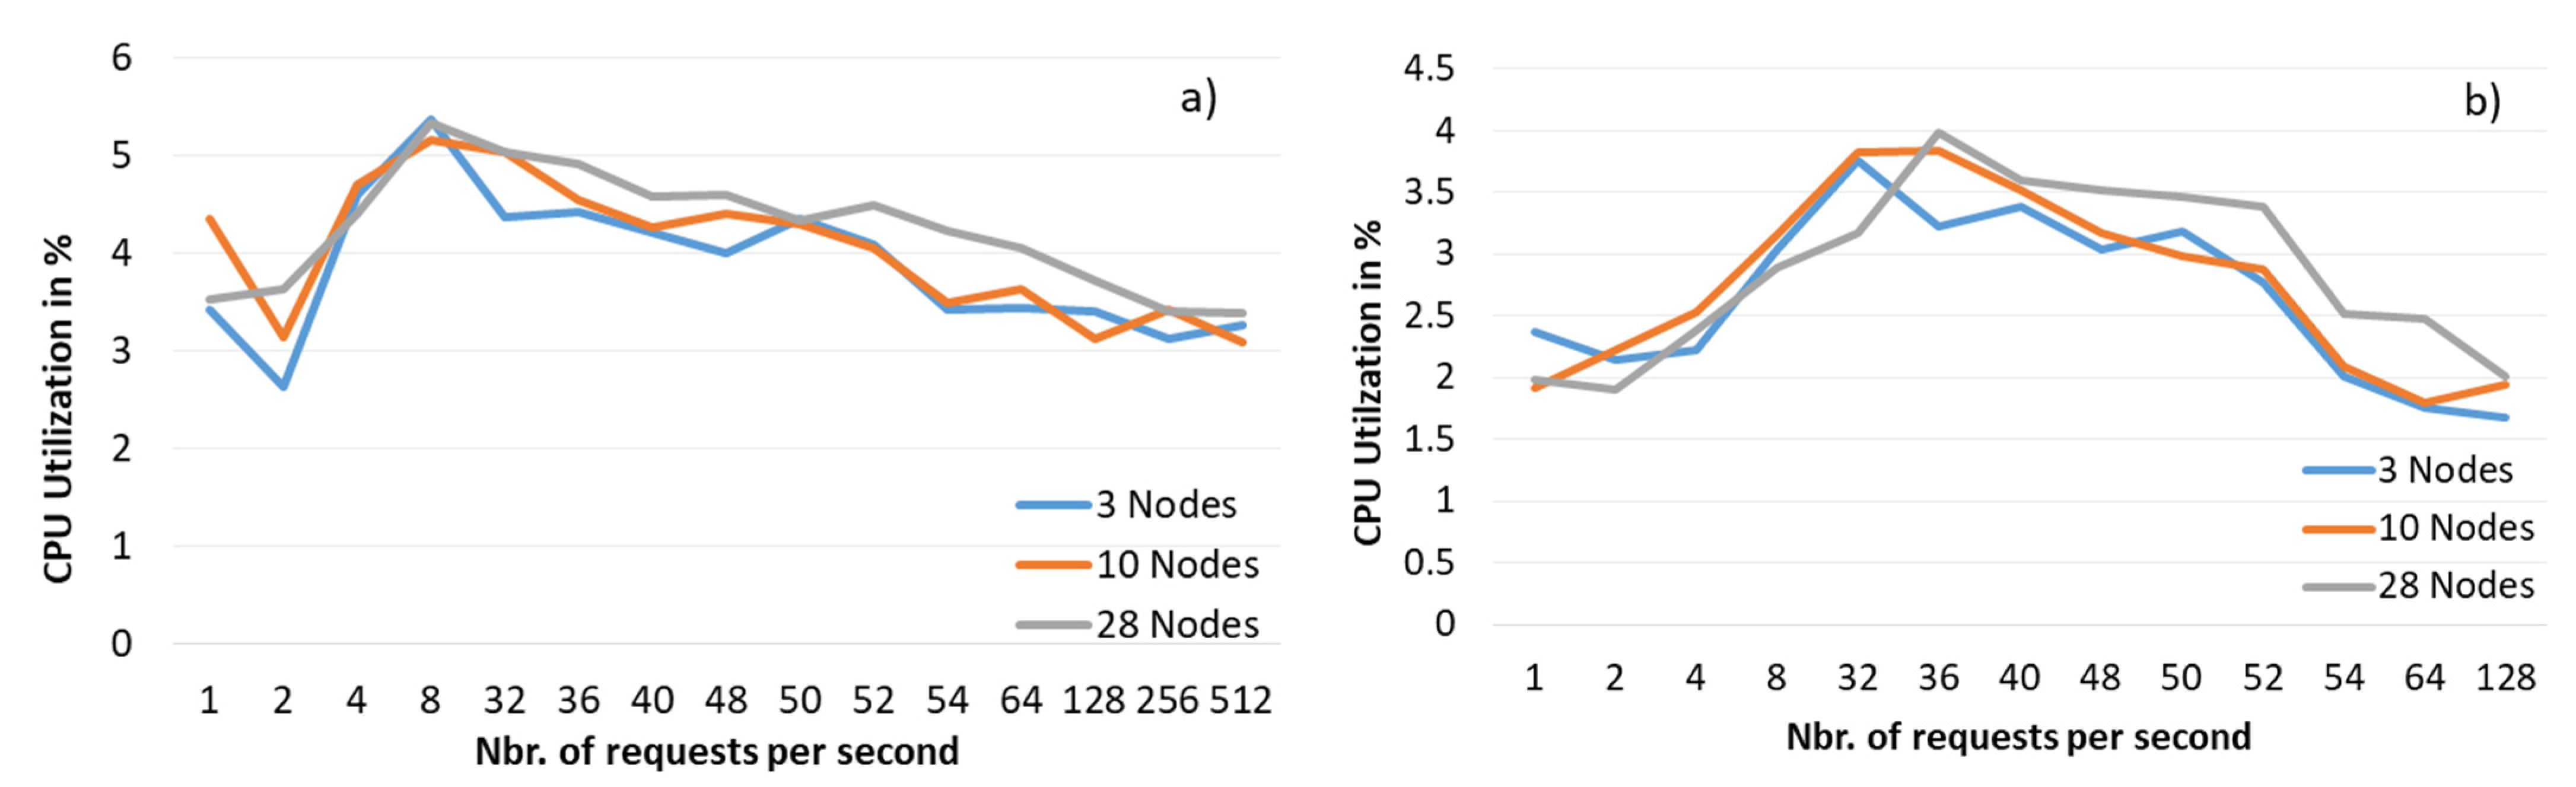
4.3. System Resource Utilization—CPU/Peer

Peer service CPU utilization ranges between 3% to 6% for an active node, as can be observed in Figure 11a, while for a passive node, it varies between 2% and 4.5%, as seen in Figure 11b. For both types of nodes, the CPU utilization does not depend on the number of the participants, however, the CPU utilization grows as the number of requests increases. For instance, CPU utilization for 2 requests per second is approximately 2.5%, whereas for 8 TPS, reached up to 5% in the case of an active node, seen in Figure 11a. The same trend is followed in the case of a passive node (Figure 11b).

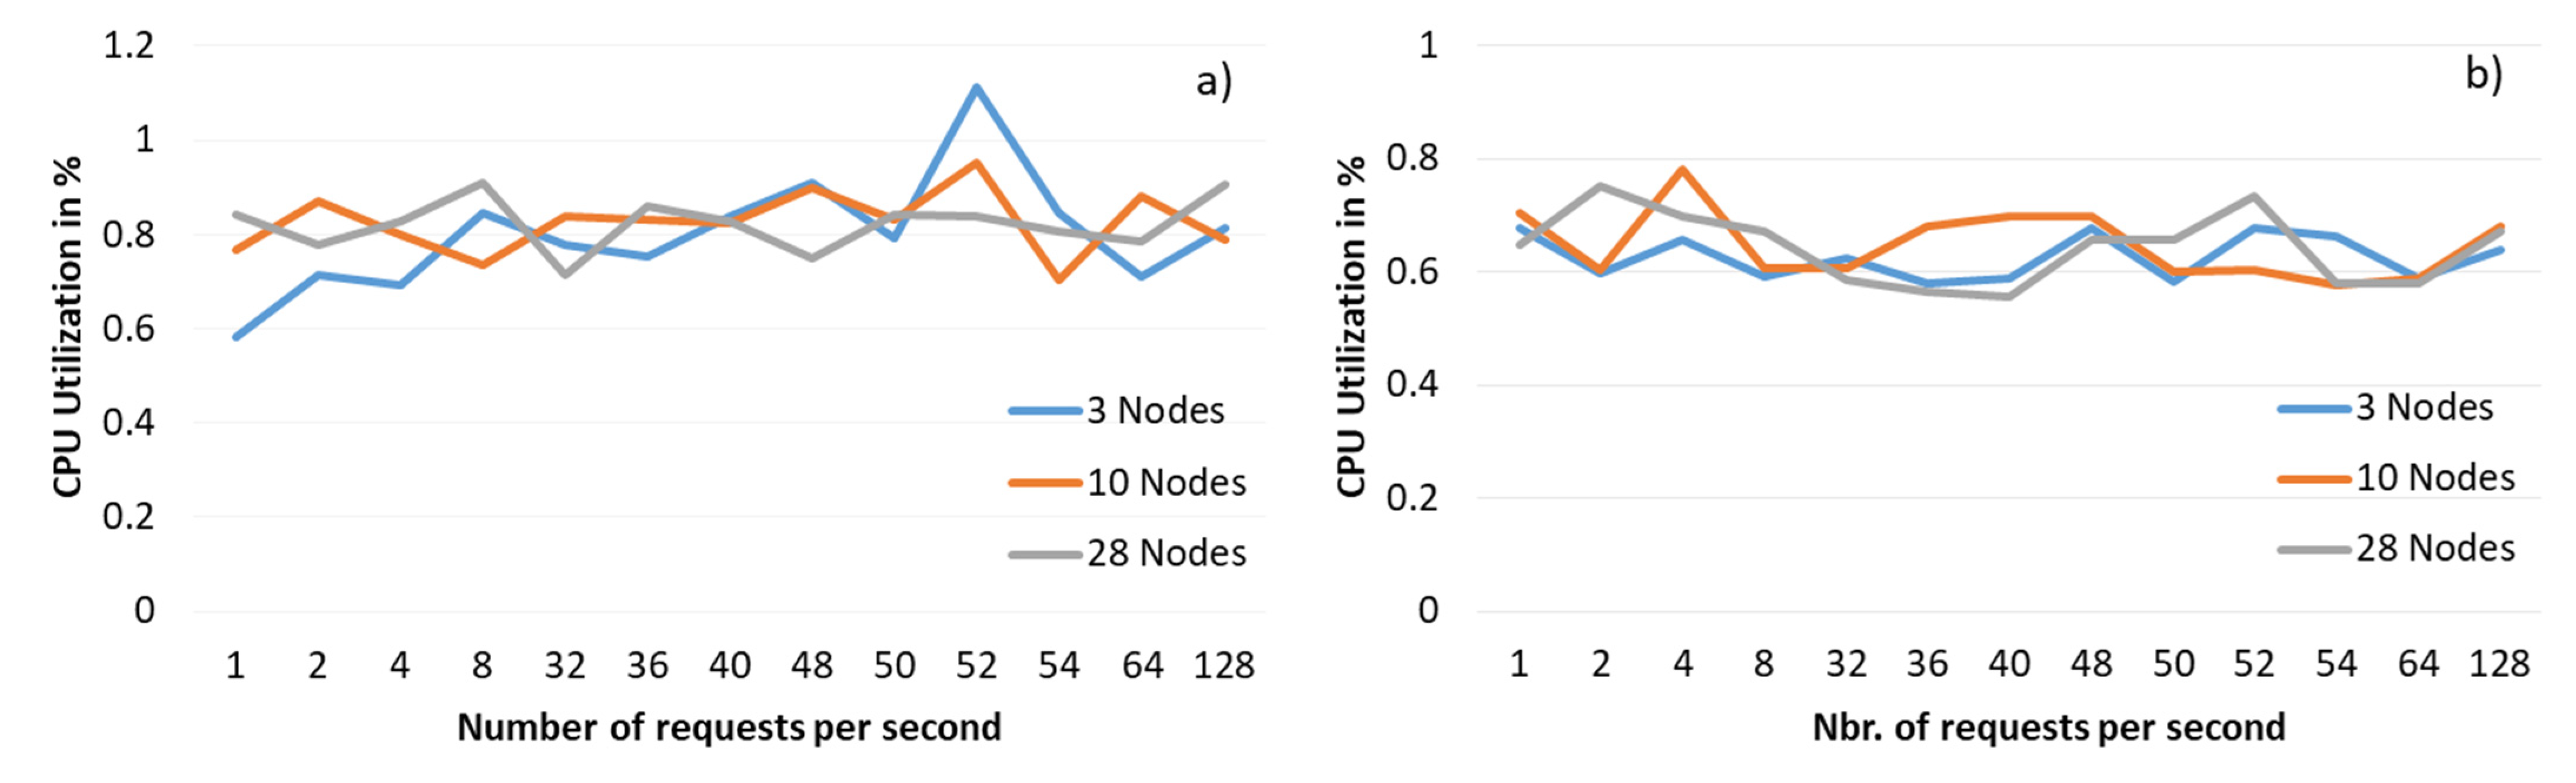
4.4. System Resource Utilization—CPU—Smart Contract

Last but not least, smart contract CPU utilisation is negligible without being affected by either the number of nodes nor by the number of transactions, as Figure 12 illustrates.
This can be seen by the low utilization in both active and passive nodes, not surpassing the 1% level, except for one case at 52 requests per second (with 3 nodes), shortly breaking this level in the active node chart (Figure 12a).
The analysis carried out shows a robust and straightforward implementation of the blockchain solution for DR provision verification. The simulations demonstrate that the solution is scalable to account for numerous assets. This can be assumed, as the simulations were performed on a per second basis, while in practice demand response events would typically take place over several minutes, in fact, with a minimum duration of a settlement period (typically 15 min) until its occurrence is published. This procedure facilitates the financial settlement and reduces its overall time when compared to what is done presently. It will also allow for a communication of data between the TSO and DSO/BRP, which is incentivized in the CEP. The adoption of smart contracts and facilitation of DR event verification will enable the large-scale service provision, including medium and large assets, paving the way to citizen engagement and involvement in the energy market.
Regarding the experimental approach, when compared to other studies, some references can be found, both used in building DR activation and renewable generation tracking [15,16]. In both studies, authors publish data directly from the data source, whereas our study acknowledges the crucial role of aggregators in providing DR and publishing the data through them. In this scenario, where metered data is directly sent for publication, the only step of verification is performed by the SO requesting the service. It thus assumes that the data is reliable, since it comes from the source (trusted party). In our study the SO not only confirmed the data origin (through certificate), but also that the power which the aggregator is claiming to provide (which can be from multiple assets) has actually been delivered for the DR event requested. This is made possible by the use of the AND policy made available by the Hyperledger Fabric, in which the data is published if the aggregator and the SO approve it. The added value of our study is hence the demonstration of the DR provision through an Aggregator, in which other participants, having access to the ledger, do not rely merely on the aggregator’s claim, but also on the SO validation of events.
Regarding the performance levels obtained in the experiment, when compared to the literature, authors in [22] use a similar architecture, however only simulating 28 nodes and varying from 2.5 to 13.3 TPS towards the ordering service. The authors obtained a smart contract memory utilization of below 1%, similar to the results of the current study. As far as memory utilization, for the peer and the REST service, are concerned, it can be as low as 4.5%, when compared to the present study, which varies between 3.5% and 5.0% seen in Figure 11a. In terms of execution time, authors in [23] developed an analysis of performance between Hyperledger Fabric and a private deployment of Ethereum. Their results show that Hyperledger Fabric outperforms Ethereum. This can be explained by the fact that Fabric relies on an ordering service for consensus, whereas Ethereum uses proof of work. In a simulated worst case scenario, the authors submitted 10,000 transactions parallel to both blockchain deployments, and the latency of the Ethereum deployment was found to be around 8 min, in contrast to 35 s for Hyperledger Fabric. In our study we have obtained an end to end execution time of approximately 12 s, with 28 nodes and 64 requests per second, which is in line with the literature.

5. Conclusions

In this work, we studied the efficacy of DR on a permissioned blockchain system. To do so, we deployed a DR scenario on a lab set up using Hyperledger Fabric architecture and considered different traffic conditions and number of participants on the blockchain network. Results indicate that, in general, CPU utilization is not significantly influenced by the number of nodes participating on the network. However, the number of submitted transactions per second can mainly affect the CPU utilization of the peer service, which, when under stress, can reach up to over 4–5%. Moreover, the end to end execution time, considering different sizes of blockchain network, i.e., 3, 10, and 28 participants, remained below 1 s, up to 32 requests per seconds. In particular, for a network size with 3 participants up to 51 TPS, the total execution transaction time did not exceed 2 s. This is an acceptable response time for end users, also taking into account the number of errors. If the system is more reluctant, in the end to end delay, for 54 TPS it reached up to 10 s without losing its stability, as the number of errors remain low. Given that the DR event settlement period is typically 900 s (15 min), and the seldom-expected frequency of requests of such events, the systems would allow numerous transactions and assets to be considered. These conditions suggest that the use of DLT is a promising feature to be integrated into future flexibility markets.

Supplementary Materials

The following are available online at https://www.mdpi.com/article/10.3390/en14071881/s1, Figure S1: Application used to activate the Battery Storage Unit (remote access to the local SCADA).

Author Contributions

Conceptualisation and methodology A.L.; software, D.G., Y.S.; validation, A.L., D.G., I.N.-F., E.K.; investigation, A.L., D.G., Y.S.; writing—original draft preparation A.L.; writing—review and editing, A.L., D.G, E.K., I.N.-F., Y.S.; supervision, E.K., I.N.-F. All authors have read and agreed to the published version of the manuscript.

Funding

This research was developed within the EnergyChain project, which has received funding from the European Commission (DGEnergy), under the administrative arrangement N°ENER/B3/2018-531/SI2.799549.

Institutional Review Board Statement

Not applicable.

Informed Consent Statement

Not applicable.

Data Availability Statement

Data is contained within the article or supplementary material.

Conflicts of Interest

The authors declare no conflict of interest. The work herein accomplished while the authors Y.S. and D.F, were still working at the Joint Research Centre. Y.S. is related to MDPI but has no access to the journal.

Abbreviations

DRDemand Response
DLTDistributed Ledger Technology
TSOTransmission System Operator
DSODistribution System Operator
BRPBalance Responsible Party
CPEClean Energy Package
EUEuropean Union
DSMDemand Side Management
ECSMElectricity Consumption and Supply Management System
SOSystem Operator
DRSPDemand Response service providers
JRCJoint Research Centre
SGILABSmart Grid Interoperability Lab
RESTRepresentational State Transfer
TLSTransport Layer Security
CACertificate Authority
TPSTransactions per second

References

  1. European Commission. Clean Energy for All Europeans Package—European Commission. 20 October 2017. Available online: https://ec.europa.eu/energy/en/topics/energy-strategy/clean-energy-all-europeans (accessed on 28 December 2020).
  2. Communication from the Commission to the European Parliament; The European Council. The European Economic and Social Committee and the Committee of Regions; The European Green Deal COM/2019/640 Final; Office for Official Publications of the European Communities: Brussels, Belgium; Luxembourg, 2019; p. 24. [Google Scholar]
  3. Karavas, C.S.; Kyriakarakos, G.; Arvanitis, K.G.; Papadakis, G. A multi-agent decentralized energy management system based on distributed intelligence for the design and control of autonomous polygeneration microgrids. Energy Convers. Manag. 2015, 103, 166–179. [Google Scholar] [CrossRef]
  4. Christensen, C.; Lee, J.W.; Liu, S.; Bremer, P.T.; Scorzelli, G.; Pascucci, V. Advanced Control Architectures for Intelligent MicroGrids—Part I: Decentralized and Hierarchical Control. IEEE Trans. Ind. Electron. 2012, 60, 1254–1262. [Google Scholar] [CrossRef]
  5. Andoni, M.; Robu, V.; Flynn, D.; Abram, S.; Geach, D.; Jenkins, D.; McCallum, P.; Peacock, A. Blockchain technology in the energy sector: A systematic review of challenges and opportunities. Renew. Sustain. Energy Rev. 2019, 100, 143–174. [Google Scholar] [CrossRef]
  6. BDEW—Bundesverband der Energie und Wasserwirtschaft. Blockchain in the Energy Sector; Technical Report; The Potential for Energy Providers: Berlin, Germany, 2018; p. 80. [Google Scholar]
  7. Liu, C.; Chai, K.K.; Lau, E.T.; Chen, Y. Blockchain Based Energy Trading Model for Electric Vehicle Charging Schemes. In Smart Grid and Innovative Frontiers in Telecommunications; Chong, P., Seet, B.C., Chai, M., Rehman, S., Eds.; SmartGIFT 2018; Springer: Cham, Switzerland, 2018; Volume 245. [Google Scholar] [CrossRef]
  8. Xie, P.; Yan, W.; Xuan, P.; Zhu, J.; Wu, Y.; Li, X.; Zou, J. Conceptual Framework of Blockchain-based Electricity Trading for Neighborhood Renewable Energy. In Proceedings of the 2018 2nd IEEE Conference on Energy Internet and Energy System Integration (EI2), Beijing, China, 20–22 October 2018; pp. 1–5. [Google Scholar] [CrossRef]
  9. Pipattanasomporn, M.; Kuzlu, M.; Rahman, S. A Blockchain-based Platform for Exchange of Solar Energy: Laboratory-scale Implementation. In Proceedings of the 2018 International Conference and Utility Exhibition on Green Energy for Sustainable Development (ICUE), Phuket, Thailand, 24–26 October 2018; pp. 24–26. [Google Scholar]
  10. Mengelkamp, E.; Gärttner, J.; Rock, K.; Kessler, S.; Orsini, L.; Weinhardt, C. Designing microgrid energy markets: A case study: The Brooklyn Microgrid. Appl. Energy 2018, 210, 870–880. [Google Scholar] [CrossRef]
  11. Kim, S.K.; Huh, J.H. A study on the improvement of smart grid security performance and blockchain smart grid perspective. Energies 2018, 11, 1973. [Google Scholar] [CrossRef] [Green Version]
  12. Esfahani, M.M.; Mohammed, O.A. Secure blockchain-based energy transaction framework in smart power systems. In Proceedings of the IECON 2018—44th Annual Conference of the IEEE Industrial Electronics Society, Washington, DC, USA, 21–23 October 2018; Volume 1, pp. 260–264. [Google Scholar] [CrossRef]
  13. Plaza, C.; Gil, J.; de Chezelles, F.; Strang, K.A. Distributed Solar Self-Consumption and Blockchain Solar Energy Exchanges on the Public Grid within an Energy Community. In Proceedings of the 2018 IEEE International Conference on Environment and Electrical Engineering and 2018 IEEE Industrial and Commercial Power Systems Europe (EEEIC/I&CPS Europe), Palermo, Italy, 12–15 June 2018. [Google Scholar] [CrossRef]
  14. Stephant, M.; Hassam-Ouari, K.; Abbes, D.; Labrunie, A.; Robyns, B. A survey on energy management and blockchain for collective self-consumption. In Proceedings of the 2018 7th International Conference on Systems and Control (ICSC), Valencia, Spain, 24–26 October 2018; pp. 237–243. [Google Scholar] [CrossRef]
  15. Pop, C.; Cioara, T.; Antal, M.; Anghel, I.; Salomie, I.; Bertoncini, M. Blockchain based decentralized management of demand response programs in smart energy grids. Sensors 2018, 18, 162. [Google Scholar] [CrossRef] [Green Version]
  16. Gorski, T.; Bednarski, J.; Chaczko, Z. Blockchain-based renewable energy exchange management system. In Proceedings of the 2018 26th International Conference on Systems Engineering (ICSEng), Sydney, Australia, 18–20 December 2018; pp. 1–6. [Google Scholar] [CrossRef]
  17. The European Parliament and the Council of the European Union. Directive (EU) 2019/944 on Common Rules for the Internal Market for Electricity. Off. J. Eur. Union 2019. Available online: https://eur-lex.europa.eu/legal-content/EN/LSU/?uri=CELEX%3A32019L0944 (accessed on 28 December 2020).
  18. The European Parliament and the Council of the European Union. Regulation (EU) 2019/943 of the European Parliament and of the Council of 5th June 2019 on the internal market for electricity. Off. J. Eur. Union 2019. Available online: https://eur-lex.europa.eu/legal-content/EN/LSU/?uri=CELEX%3A32019R0943 (accessed on 28 December 2020).
  19. Brewster, C.J.; Connock, S.L. An integrated approach to irtraning. Ind. Commer. Train. 1979, 11, 69–71. [Google Scholar] [CrossRef]
  20. HyperLedger. Available online: https://www.hyperledger.org/use/fabric (accessed on 12 February 2021).
  21. Go Language. Available online: https://golang.org/ (accessed on 12 February 2021).
  22. Geneiatakis, D.; Soupionis, Y.; Steri, G.; Kounelis, I.; Neisse, R.; Nai-Fovino, I. Blockchain Performance Analysis for Supporting Cross-Border E-Government Services. IEEE Trans. Eng. Manag. 2020, 67, 1310–1322. [Google Scholar] [CrossRef]
  23. Pongnumkul, S.; Siripanpornchana, C.; Thajchayapong, S. Performance analysis of private blockchain platforms in varying workloads. In Proceedings of the 26th International Conference on Computer Communication and Networks, ICCCN 2017, Vancouver, BC, Canada, 31 July–3 August 2017. [Google Scholar] [CrossRef]
Figure 1. High level architecture of flexibility use-case.
Energies 14 01881 g001
Figure 2. Laboratory equipment set up for use case implementation.
Energies 14 01881 g002
Figure 3. Overview of transaction flow on Hyperledger Fabric.
Energies 14 01881 g003
Figure 4. Flexibility blockchain system implementation, on the Hyperledger Fabric framework.
Energies 14 01881 g004
Figure 5. UML sequence diagram for the “Automated demand response (DR) services via block chain enabled smart contracts” use case.
Energies 14 01881 g005
Figure 6. Load profile of the asset during the flexibility provision event.
Energies 14 01881 g006
Figure 7. Explorer block details from the published DR event.
Energies 14 01881 g007
Figure 8. Number of requests per second considering different number of blockchain participants with results by (a) End to end execution time and (b) number of errors.
Energies 14 01881 g008
Figure 9. End to end transaction sample execution time for 3, 10, and 28 peers per request in a scenario of 8 transactions per second (TPS).
Energies 14 01881 g009
Figure 10. Smart-contract memory utilization for an (a) active node and (b) passive node
Energies 14 01881 g010
Figure 11. Peer CPU utilization for an (a) active node and (b) passive node.
Energies 14 01881 g011
Figure 12. Smart contract CPU Utilization for an (a) active node and (b) passive node.
Energies 14 01881 g012
Table 1. Overview of executed tests cases for flexibility use case.
No. of Participants in Blockchain NetworkNumber of Requests
31/2/4/8/16/32/36/40/48/50/52/54/64/128/256/512 transactions per sec. sent to the ordering service
10
28
Publisher’s Note: MDPI stays neutral with regard to jurisdictional claims in published maps and institutional affiliations.

